MULE DEER - Home - IDFG Research & Collaboration Site · Winter range is a critical component of...
215
IDAHO DEPARTMENT OF FISH AND GAME Steven M. Huffaker, Director Project W-170-R-25 Job Progress Report MULE DEER Study I, Job 2 Prepared By: Jim Hayden, David Spicer ..................................................................... Panhandle Region Jay Crenshaw, George Pauley................................................................ Clearwater Region Jon Rachael ............................................................................................. Southwest Region Randall Smith, Bruce Palmer .............................................................Magic Valley Region Carl Anderson, Daryl Meints, Gary Vecellio .......................................... Southeast Region Brad Compton, Justin Naderman, Dave Koehler................................ Upper Snake Region Mike Scott ................................................................................................... Salmon Region Compiled and Edited By: Jim Unsworth, Lou Nelson, and Jon Rachael July 1, 2000 to June 30, 2001 April 2002 Boise, Idaho
Transcript of MULE DEER - Home - IDFG Research & Collaboration Site · Winter range is a critical component of...

IDAHO DEPARTMENT OF FISH AND GAME
Steven M. Huffaker, Director
Project W-170-R-25
Job Progress Report
MULE DEER Study I, Job 2 Prepared By: Jim Hayden, David Spicer ..................................................................... Panhandle Region Jay Crenshaw, George Pauley ................................................................ Clearwater Region Jon Rachael ............................................................................................. Southwest Region Randall Smith, Bruce Palmer ............................................................. Magic Valley Region Carl Anderson, Daryl Meints, Gary Vecellio .......................................... Southeast Region Brad Compton, Justin Naderman, Dave Koehler ................................ Upper Snake Region Mike Scott ................................................................................................... Salmon Region
Compiled and Edited By: Jim Unsworth, Lou Nelson, and Jon Rachael
July 1, 2000 to June 30, 2001
April 2002 Boise, Idaho

Findings in this report are preliminary in nature and not for publication without permission of the Director of the Idaho Department of Fish and Game. The Idaho Department of Fish and Game adheres to all applicable state and federal laws and regulations related to discrimination on the basis of race, color, national origin, age, gender, or handicap. If you feel you have been discriminated against in any program, activity, or facility of the Idaho Department of Fish and Game, or if you desire further information, please write to: Idaho Department of Fish and Game, PO Box 25, Boise, ID 83707; or the Office of Human Resources, U.S. Fish and Wildlife Service, Department of the Interior, Washington, DC 20240. This publication will be made available in alternative formats upon request. Please contact the Idaho Department of Fish and Game for assistance.

TABLE OF CONTENTS
OVERVIEW ....................................................................................................................................1
ANTLERLESS HARVEST .............................................................................................................4
ANALYSIS AREA 1 (UNITS 1, 2, 3, 4, 4A, 5, 6, 7, 9) ..................................................................7
ANALYSIS AREA 2 (UNITS 8, 8A, 10, 10A, 12, 15, 16) ...........................................................10
ANALYSIS AREA 3 (UNITS 11, 11A, 13, 14, 18, 23) ................................................................13
ANALYSIS AREA 4 (UNITS 16A, 17, 19, 19A, 20, 20A, 25, 26, 27) ........................................19
ANALYSIS AREA 5 (UNITS 21, 21A, 28, 36B) .........................................................................23
ANALYSIS AREA 6 (UNITS 22, 24, 31, 32, 32A, 33, 34, 35, 39) ..............................................27
ANALYSIS AREA 7 (UNITS 43, 44, 45, 48, 52) ........................................................................30
ANALYSIS AREA 8 (UNITS 36, 36A, 49, 50) ............................................................................35
ANALYSIS AREA 9 (UNITS 29, 37, 37A, 51, 58W) ..................................................................37
ANALYSIS AREA 10 (UNITS 30, 30A, 58E, 59, 59A) ..............................................................41
ANALYSIS AREA 11 (UNITS 38) ..............................................................................................45
ANALYSIS AREA 12 (UNITS 40, 41, 42, 46, 47) ......................................................................48
ANALYSIS AREA 13 (UNITS 53) ..............................................................................................51
ANALYSIS AREA 14 (UNITS 54, 55, 57) ..................................................................................54
ANALYSIS AREA 15 (UNITS 52A, 63, 63A, 68, 68A) ..............................................................58
ANALYSIS AREA 16 (UNITS 60, 60A, 61, 62A) .......................................................................61
ANALYSIS AREA 16 (UNITS 60, 60A, 61, 62A) .......................................................................61
ANALYSIS AREA 17 (UNITS 62, 65) ........................................................................................64
ANALYSIS AREA 18 (UNITS 64, 67) ........................................................................................67
ANALYSIS AREA 19 (UNITS 66, 66A, 69)................................................................................70
ANALYSIS AREA 20 (UNITS 56, 70, 73, 73A)..........................................................................73
ANALYSIS AREA 21 (UNITS 71, 74) ........................................................................................78
ANALYSIS AREA 22 (UNITS 72, 75, 76, 77, 78) ......................................................................82
APPENDICES ...............................................................................................................................86
Mule Deer PR01.doc i

PROGRESS REPORT SURVEYS AND INVENTORY
STATE: Idaho JOB TITLE: Mule Deer Surveys and Inventories PROJECT: W-170-R-25 SUBPROJECT: 1-7 STUDY NAME: Big Game Population Status, Trends STUDY: I Utilization, and Associated Habitat JOB: 2 Studies PERIOD COVERED: July 1, 2000 to June 30, 2001
MULE DEER
OVERVIEW
Mule deer are Idaho's most abundant and widely-distributed big game animal. They provide more recreational opportunity than any other big game species. Mule deer densities are highest in Idaho south of the Salmon River. North of the Salmon River, white-tailed deer are the dominant deer species, but mule deer populations are found scattered throughout northern Idaho where there is suitable habitat. Mule deer are primarily browsers, so most of their diet is composed of the leaves and twigs of shrubs and trees, particularly during winter. Grasses and forbs can be important dietary components at certain times of the year, such as spring and early summer. Winter range is a critical component of mule deer habitat. Mule deer are susceptible to high mortality during periods of prolonged deep snow and low temperatures. Winter range has long been recognized as an important habitat component, but our ideas about it have changed as we have learned more about how deer use it. In the 1950s and 1960s, most of our emphasis was on the food resources on winter range. This was reflected in plantings of bitterbrush and measurements of utilization of browse plants. It was obvious that the food resources of winter range were important, but it could not account for all the variation observed in winter range use. Even under the best conditions, deer lose weight all winter long. The best "winter range" a mule deer has is the fat stored in the body during the spring, summer, and fall. Therefore, the condition of a deer at the start of winter depends on the quality of the habitat it occupies during the rest of the year. The main strategy of a mule deer in winter is to survive by minimizing energy loss and by eating enough to prolong fat reserves. Deer commonly seek winter ranges where there is good thermal cover to minimize energy loss. Deer often become very sedentary during winter, moving and feeding as little as possible to conserve energy.
1
Our view of winter range has changed, but not its importance. Cover, aspect, and elevation are recognized as crucial components, and during certain times are more important than food. Human disturbance of deer on winter ranges cause them to move from favored sites and waste precious energy. The size of winter range is important to allow for different snow conditions and fluctuations in deer populations. Mule Deer PR01.doc

Much of Idaho's historic mule deer winter range has been developed for other uses and is now occupied by man. Ranches, farms, subdivisions, and industry located in the foothills and at lower elevations have eliminated winter range. In many parts of Idaho, deer winter range is adequate for the "average" winter, but when severe winters occur, deer are forced to low elevations where they come into conflict with man. Deer can damage standing and stored crops; most commonly hay, ornamental shrubs, trees, and orchards. Depredations by mule deer can be severe and, in many cases, is an important factor in determining the optimum size of a deer population. Early spring is an important time of year for mule deer and spring range is a key component of year-round habitat. Most winter-related mortality actually occurs in the early spring. Fawns and old bucks are most likely to die of winter stress. Mortality of does is usually light but their condition is particularly critical because they are entering the third trimester of pregnancy and development of the fetus taxes their resources. The quality and quantity of nutritious forage in the spring (March, April, May) has a major effect on the production and survival of fawns. The timing of spring green-up is also important. A winter-stressed deer needs good forage as soon as possible. Cold, late spring weather with late green-up can increase mortality and reduce production. Summer-fall ranges are obviously important because this is where deer produce fat reserves that will allow survival through the winter. The quality of summer-fall forage directly influences pregnancy and ovulation rates and, therefore, fawn production. Late fall is the last opportunity for deer to forage and store fat before moving to winter range. High quality fall range is important for bucks because their body reserves are reduced by rutting. Many of Idaho's mule deer are migratory. They commonly travel long distances (20 to 100 miles) from summer range to winter range. Mule deer are fairly traditional and return to the same summer and winter ranges each year. Tagging and radio telemetry studies indicate that deer summering in the same area may go to different winter ranges, often in different game management units or different states. We have also found that deer wintering together can move to entirely different summer ranges. The migratory behavior of deer and the differential distribution of bucks and does complicates the measurement and interpretation of population parameters. Given mule deer's fidelity for winter ranges; many of man's activities can disrupt or even eliminate migrations, forcing deer to winter on suboptimal ranges that may increase their mortality rates. Interstate highways, deer proof fences, and urbanization represents examples of activities that can disrupt migration patterns. Survival through winter is a tenuous balance between energy conservation and energy expenditure. Activities that increase energy expense likely increase overwinter mortality. The structure of mule deer populations varies with the habitat and populations size. Populations at low density (below carrying capacity) tend to have high reproductive and turnover rates and are dominated by younger animals. Populations with these characteristics are capable of rapid growth. Some populations stabilize at low density because they are susceptible to high mortality during unfavorable conditions. This is typical of populations in marginal habitat.
Mule Deer PR01.doc 2

Populations at high density (near carrying capacity) tend to have low reproductive and turnover rates, and a stable age distribution. Population growth is slow, if it occurs at all. The annual production replaces the annual mortality. This type of population is commonly found in stable, well established habitat types, particularly climax forests. A wide spectrum of population structures is found between these 2 extremes. Overall, mule deer populations statewide have declined since the 1950s and 1960s. It is unlikely that populations will ever increase to those levels again. Mule deer are best adapted to seral, transitional habitat types. Habitat succession is a continual and dynamic process and those habitats best suited for mule deer cannot be expected to remain indefinitely or even be managed for on a large enough scale to have significant population effects. Recent population declines in parts of southern Idaho that were marked by the 1992-1993 winters are a natural process in mule deer dynamics. Populations are expected to increase given favorable environmental conditions. However, the long-term outlook for mule deer statewide is that of slowly diminishing habitat quantity and quality over time. Maintaining healthy populations with harvestable surplus is expected and will continue; however, populations reminiscent of the “good-old-days” are unrealistic.
3
-dation,
The effect of harvest mortality is highly variable in mule deer. Generally, the majority of the annual mortality is not hunterharvest related. Factors such as premalnourishment overwinter, accidents, and disease are responsible for the majority of deaths in mule deer populations. Therefore, population response tends to be independent of harvest. Exceptions to this rule include antlerless opportunity designed to stabilize or reduce populations and effects of hunter harvest on buck survival and age structure. Hunting seasons designed to offer greatly more opportunity for antlered deer than antlerless deer or during periods when bucks are vulnerable (rut, winter range) can reduce the proportion of bucks and particularly older bucks in the population. Buck-only seasons will not limit population growth; however, they can affect the number of older bucks. The Idaho Fish and Game Commission established a statewide minimum of 15 bucks per 100 does post-season, primarily as the minimum ratio that hunters would accept. It is unknown what the lower threshold value for buck:doe ratio is where negative impacts on production parameters can occur. However, we believe that the statewide minimum is above that necessary for adequate reproduction.
0
10000
20000
30000
40000
50000
60000
70000
80000
1975 1979 1983 1987 1991 1995 1999
Statewide Mule Deer Harvest
Proper harvest management for mule deer, given their relative independence to harvest effects, is to adequately monitor populations annually and be responsive to population changes. Liberal seasons can be applied during periods when populations are expanding rapidly and conservative seasons applied when environmental factors are limiting population growth.
Mule Deer PR01.doc

This plan represents a statewide change in how we monitor mule deer populations. Historically, harvest parameters and periodic unit-wide surveys were conducted to assess population status. Beginning with this plan, we have established a statewide, uniform approach to monitor mule deer populations on an annual basis, thus, being more responsive to population changes. The state has been divided into 22 analysis areas (groupings of game management units) that represent similar habitats, discrete mule deer populations, and/or similar management objectives. With little exception, each analysis area will have at least one trend area (winter range) that will be monitored annually. Trend areas have been chosen to be representative of the analysis area as a whole, and should reflect population parameters throughout the grouping of units. Information that will be collected for each trend area includes buck:doe:fawn ratios and abundance. Additionally, radio-collared fawns in several of the trend areas across the state will be monitored to determine overwinter survival and recruitment to spring. Antlerless harvest thresholds have been established for each of the trend areas (with few exceptions). These thresholds represent trend area population "goals." We recognize that mule deer populations are primarily a function of the environment rather than any direct Department action. These threshold values have been established to define optimum populations taking into account habitat potential, winter range conditions, harvest opportunity, and depredation concerns. As mule deer populations rise and fall, we will recommend harvest opportunity consistent with these population thresholds. In addition to monitoring trend area populations, the Department will monitor harvest and %4+ points in the harvest relative to minimum criterion established by the Commission. Currently, the telephone harvest survey provides information for harvest. Beginning in 1998, a statewide mandatory report card system was implemented. If compliance is adequate, more precise data on harvest and antler point class will be available.
ANTLERLESS HARVEST
General season antlerless harvest is an option that may allow managers to influence deer numbers and provide added hunting opportunity when population levels allow. Determining whether to have antlerless seasons or the length of a season often results in controversy among hunters and between hunters and wildlife managers. To help reduce disagreement and guide decisions about antlerless harvest, the following decision model was developed. This model was developed with the intent of an adaptive learning process; as new data become available and knowledge increases regarding deer population response to harvest, refinements will occur. Three variables are considered in this decision model; population level relative to antlerless threshold values listed for each analysis area, animal physical condition, and winter severity. Population level is determined by annual aerial surveys of trend areas; animal condition is determined at Department check stations and/or through hunter interviews; and winter severity is determined by a severity index or fawn mortality if radio-collared animals are available. Each variable is given a relative score and then these scores are summed and the maximum season framework can then be determined.
4
This decision model is not designed to dictate when the Department will offer general antlerless opportunity, rather it is intended to guide discussion amongst all of Idaho's mule deer Mule Deer PR01.doc
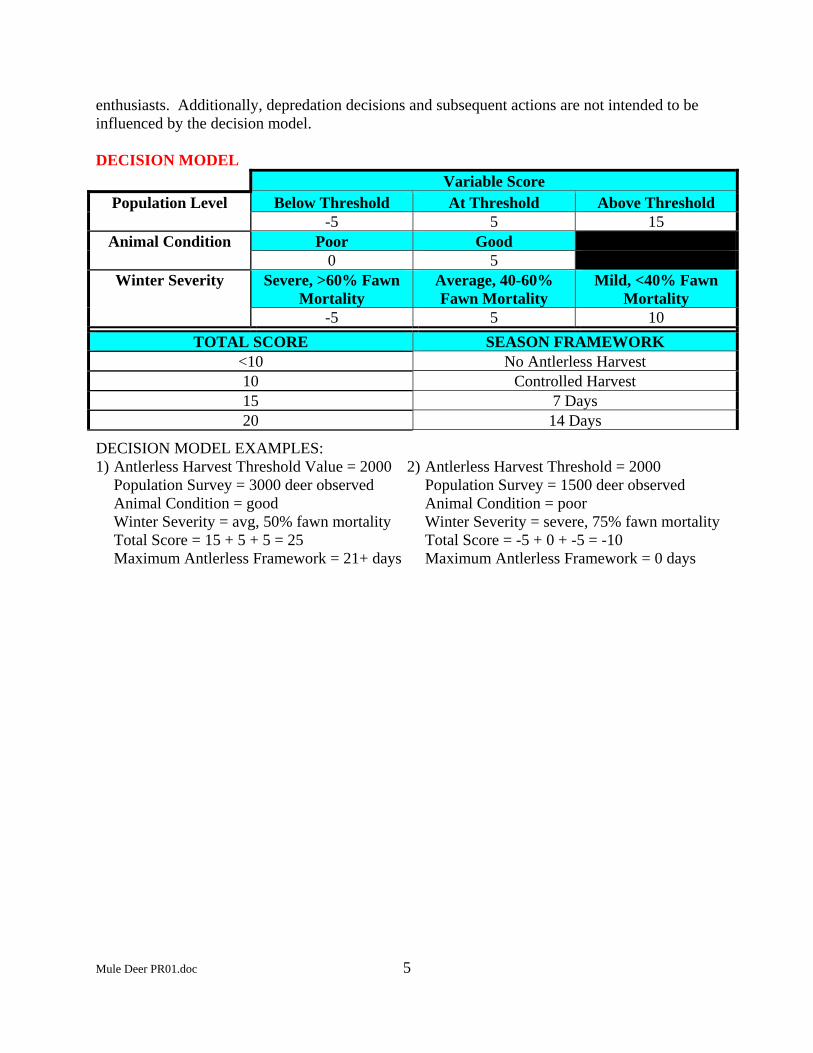
enthusiasts. Additionally, depredation decisions and subsequent actions are not intended to be influenced by the decision model. DECISION MODEL
Variable Score Population Level Below Threshold At Threshold Above Threshold
-5 5 15 Animal Condition Poor Good
0 5 Winter Severity Severe, >60% Fawn
Mortality Average, 40-60% Fawn Mortality
Mild, <40% Fawn Mortality
-5 5 10 TOTAL SCORE SEASON FRAMEWORK
<10 No Antlerless Harvest 10 Controlled Harvest 15 7 Days 20 14 Days
DECISION MODEL EXAMPLES: 1) Antlerless Harvest Threshold Value = 2000 2) Antlerless Harvest Threshold = 2000 Population Survey = 3000 deer observed Population Survey = 1500 deer observed Animal Condition = good Animal Condition = poor Winter Severity = avg, 50% fawn mortality Winter Severity = severe, 75% fawn mortality Total Score = 15 + 5 + 5 = 25 Total Score = -5 + 0 + -5 = -10 Maximum Antlerless Framework = 21+ days Maximum Antlerless Framework = 0 days
Mule Deer PR01.doc 5

Mule Deer Status, Threshold, & Criterion Statewide
Note: Estimates within parentheses are based on information other than sightability surveys.
Trend Area Surveys
1993 1994 1995 1996 1997 1998 1999 2000NC NC NC NC NC NC NC NC
NC NC NC NC NC NC NC NCNote: NC = all surveys not comparable statewide.
1992 1993 1994 1995 1996 1997 1998 1999
6
14725 8884 5833 4713 5028 343726679 15863 18599 16478 19318 17737
44 44 44 43 48 38109770 128000 133063 134722 124795 147244
2393 469519656 19955
38 33116771 121364
Note: Telephone survey harvest data prior to 1998 does not include general primitive weapons season data. Hunter numbers include all deer hunters.
* Note: Harvest prior to 1998 does not includegeneral primitive weapons season data.
ComparableSurveys Total
Statewide
Deer Numbers
Buck Status & Minimum Criterion
Trend Area (Unit)
MinimumCriterion
Buck:Doe Ratio%4+ Pts in the Harvest
1993-991997-99
1936
1515
SurveyYear(s)
CurrentStatus
803008554685546
StatewideTotal
1992-00
ThresholdSurveyYear Total Deer Total Deer
Trend Area Status & Antlerless Harvest Threshold
80300
Hunter Numbers
Antlered Harvest
Analysis Area Harvest Statistics
% 4+ Points
Antlerless Harvest
Trend Area (Unit)
Current Status Antlerless Harvest
00.10.20.30.40.50.60.70.80.9
1
1993 1994 1995 1996 1997 1998 1999 2000
Population ChangeBetween Comparable Surveys
0
5000
10000
15000
20000
25000
30000
1992 1993 1994 1995 1996 1997 1998 1999
Harvest* with TrendAntlerless Antlered
0
20000
40000
60000
80000
100000
120000
140000
160000
1992 1993 1994 1995 1996 1997 1998 1999
Hunter Numbers with Trend
0
10
20
30
40
50
60
1992 1993 1994 1995 1996 1997 1998 1999
% 4+ Points with Trend
Mule Deer PR01.doc

ANALYSIS AREA 1 (UNITS 1, 2, 3, 4, 4A, 5, 6, 7, 9)
Management Objectives The objective for this analysis area is to maintain at least 30% ≥4-point bucks in the harvest on a three-year, unweighted running average. Historical Perspective Forest Service records and the memories of long-term residents both indicate big game, including mule deer, were relatively scarce in the early 1900s. Large-scale fires between 1910 and 1931 created large brushfields favored by mule deer. This newly-created habitat, in combination with a major predator reduction program beginning in the early 1920s, allowed sustained growth of the mule deer, as well as white-tailed deer and elk populations. Despite a series of severe winters, mule deer populations continued to increase, and by the mid-1950s mule deer were estimated by the Forest Service and Fish and Game biologists, alike, to outnumber white-tailed deer in the central part of the analysis area. Concern about overbrowsed winter ranges, and an overabundance of deer, in general, throughout the state, led to aggressive management to reduce the deer population. By the early 1970s this goal was accomplished, and shorter seasons were authorized. Deer seasons in this Analysis Area have traditionally allowed hunters to take either mule deer or white-tailed deer under the same tag. With the exception of Unit 1, beginning in 1998 all seasons have been for either-sex deer, season-long. The Unit 1 mule deer season is antlered-only, November 1 through December 1. Habitat Issues Much of the land in these units is administered by the Forest Service, with private lands mostly restricted to the valley bottoms. Recreation and timber management are the dominant human uses of the landscape in these units. This is in a generally moist region with nearly continuous canopy coverage. Mule deer mix with white-tailed deer during winter, although there is a tendency for mule deer to winter at slightly higher elevations. Mule deer depredations are nonexistent. Much of mule deer habitat in this area is the result of large fires during the early 1900s, with some habitat created when large areas were block clearcut during the 1960s. Both influences currently have little effect on the landscape, and mule deer habitat can be expected to decline in quantity and quality as succession progresses, turning brushfields back into timber. Biological Issues There is very little known about the ecology of mule deer in the heavily forested environments typical of this Analysis Area. The timbered nature of the landscape, combined with the relative scarcity of mule deer concentrations, does not allow aerial surveys to be used to monitor mule deer populations in this Area. The influence of hunting on mule deer population dynamics is believed to be minor, based on the minor influence of hunting measured on white-tailed deer
Mule Deer PR01.doc 7

populations in the same areas. The relatively high proportion of ≥4-point bucks within the antlered harvest is consistent with this hypothesis. Interspecific Issues White-tailed deer, mule deer, and elk have sympatric ranges throughout the year in the Analysis Area. Mountain goat and moose distribution overlaps that of mule deer in some areas. The effects of interspecific competition are unknown, but are felt to be of minor consequence at existing population levels. Predation Issues Mountain lion, black bear, bobcat, and coyote exist throughout the Area. Recently, a major increase in the mountain lion population has been detected, leading to increased public concern over the impacts of predation of future mule deer populations. Predation is likely an important factor in the population dynamics of mule deer in this Analysis Area. Radio-telemetry studies conducted in the Priest River Basin during the late 1980s and early 1990s indicated this was the case with white-tailed deer. Winter Feeding Issues Winter feeding of mule deer has not occurred in these units in the past few years. Information Requirements With the exception of check station information, the Department did not collect information specific to mule deer harvest in this Analysis Area from 1979 to 1995. Hunter effort has only been documented since 1996. Good harvest data is of utmost importance here, because aerial surveys are impractical to conduct due to heavy tree cover and only small, scattered pockets of wintering mule deer. Basic ecological information is lacking on mule deer ecology in heavily timbered environments.
Mule Deer PR01.doc 8

Analysis Area 1 (Units 1, 2, 3, 4, 4A, 5, 6, 7, 9)
Note : ND = no survey data available, NA = not applicable.
Note: ND = no survey data available, NA = not applicable.
1993 1994 1995 1996 1997 1998 1999 2000ND ND ND ND ND ND ND ND
ND ND ND ND ND ND NDNote: ND = no survey data available.
1992 1993 1994 1995 1996 1997 1998 1999
9
372 535 500 894 339 128 118 100701 1033 927 1904 338 389 644 45340 32 47 46 42 39 29 32
12638 24481 32782 36514 29548 36893 30002 30805Note: Telephone survey harvest data prior to 1998 does not include general
primitive weapons season data. Hunter numbers include all deer hunters. 1992 hunter estimate low due to omission of lifetime license anddeer-bear-elk package buyers.
* Note: Harvest prior to 1998 does not include general primitive weapons season data.
NATotal Deer
Trend Area Status & Antlerless Harvest Threshold
NA
Hunter Numbers
Antlered Harvest% 4+ Points
Antlerless Harvest
Trend Area (Unit)
Current Status Antlerless Harvest
NDND
TotalND ND
ThresholdSurveyYear Total Deer
NA30
SurveyYear(s)
CurrentStatus
Buck Status & Minimum Criterion
Trend Area (Unit)
MinimumCriterion
Buck:Doe Ratio%4+ Pts in the Harvest
ND1997-99
NDND
Trend Area Surveys
Analysis Area Harvest Statistics
ComparableSurveys Total
ND
Deer Numbers
00.10.20.30.40.50.60.70.80.9
1
1993 1994 1995 1996 1997 1998 1999 2000
Population ChangeBetween Comparable Surveys
0200400600800
100012001400160018002000
1992 1993 1994 1995 1996 1997 1998 1999
Harvest* with TrendAntlerless Antlered
0
5000
10000
15000
20000
25000
30000
35000
40000
1992 1993 1994 1995 1996 1997 1998 1999
Hunter Numbers with Trend
05
101520253035404550
1992 1993 1994 1995 1996 1997 1998 1999
% 4+ Points with Trend
Mule Deer PR01.doc
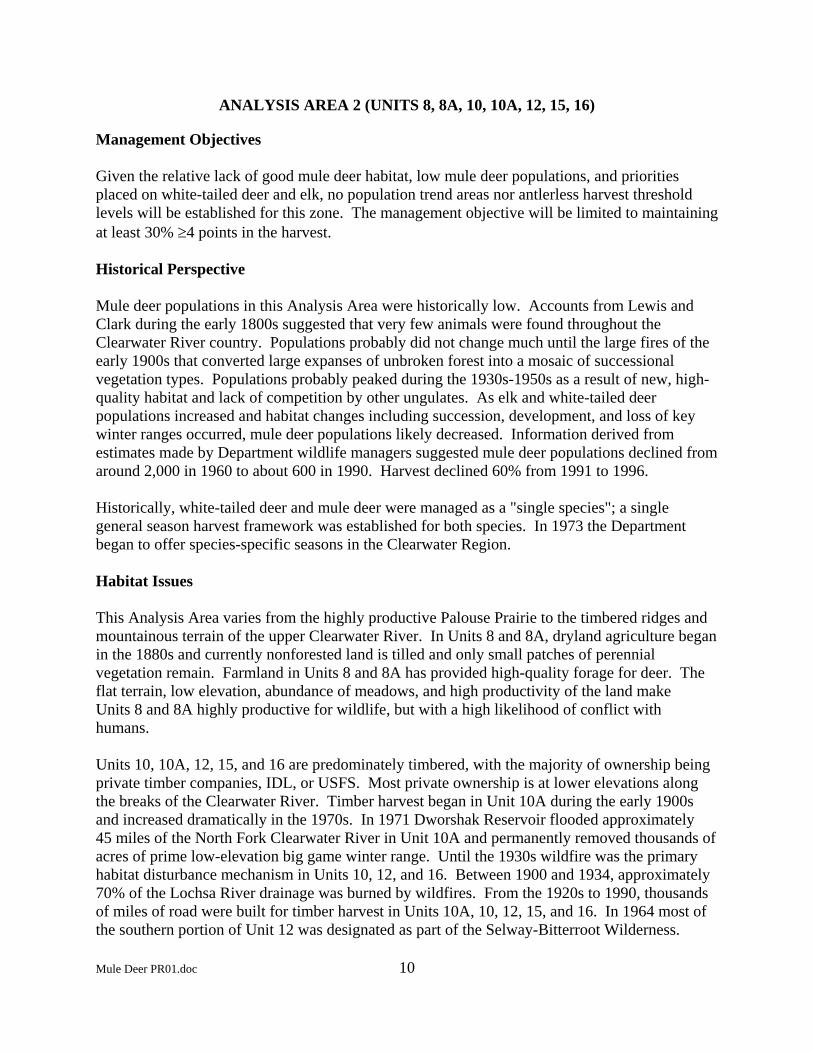
ANALYSIS AREA 2 (UNITS 8, 8A, 10, 10A, 12, 15, 16)
Management Objectives Given the relative lack of good mule deer habitat, low mule deer populations, and priorities placed on white-tailed deer and elk, no population trend areas nor antlerless harvest threshold levels will be established for this zone. The management objective will be limited to maintaining at least 30% ≥4 points in the harvest. Historical Perspective Mule deer populations in this Analysis Area were historically low. Accounts from Lewis and Clark during the early 1800s suggested that very few animals were found throughout the Clearwater River country. Populations probably did not change much until the large fires of the early 1900s that converted large expanses of unbroken forest into a mosaic of successional vegetation types. Populations probably peaked during the 1930s-1950s as a result of new, high-quality habitat and lack of competition by other ungulates. As elk and white-tailed deer populations increased and habitat changes including succession, development, and loss of key winter ranges occurred, mule deer populations likely decreased. Information derived from estimates made by Department wildlife managers suggested mule deer populations declined from around 2,000 in 1960 to about 600 in 1990. Harvest declined 60% from 1991 to 1996. Historically, white-tailed deer and mule deer were managed as a "single species"; a single general season harvest framework was established for both species. In 1973 the Department began to offer species-specific seasons in the Clearwater Region. Habitat Issues This Analysis Area varies from the highly productive Palouse Prairie to the timbered ridges and mountainous terrain of the upper Clearwater River. In Units 8 and 8A, dryland agriculture began in the 1880s and currently nonforested land is tilled and only small patches of perennial vegetation remain. Farmland in Units 8 and 8A has provided high-quality forage for deer. The flat terrain, low elevation, abundance of meadows, and high productivity of the land make Units 8 and 8A highly productive for wildlife, but with a high likelihood of conflict with humans. Units 10, 10A, 12, 15, and 16 are predominately timbered, with the majority of ownership being private timber companies, IDL, or USFS. Most private ownership is at lower elevations along the breaks of the Clearwater River. Timber harvest began in Unit 10A during the early 1900s and increased dramatically in the 1970s. In 1971 Dworshak Reservoir flooded approximately 45 miles of the North Fork Clearwater River in Unit 10A and permanently removed thousands of acres of prime low-elevation big game winter range. Until the 1930s wildfire was the primary habitat disturbance mechanism in Units 10, 12, and 16. Between 1900 and 1934, approximately 70% of the Lochsa River drainage was burned by wildfires. From the 1920s to 1990, thousands of miles of road were built for timber harvest in Units 10A, 10, 12, 15, and 16. In 1964 most of the southern portion of Unit 12 was designated as part of the Selway-Bitterroot Wilderness. Mule Deer PR01.doc 10

Construction of new home sites has decreased available mule deer winter range. This Analysis Area is characterized by high road densities in the western portion and backcountry and limited access except for trails in the eastern portions. Noxious weeds such as yellowstar thistle and spotted knapweed are out-competing native vegetation on mule deer spring and winter ranges. Mule deer depredations have been low in this area due to low populations and limited mule deer habitat. Mule deer densities within agricultural areas of Analysis Area 2 have rarely exceeded landowner tolerance levels. Currently, there are no depredation concerns involving mule deer. Biological Issues Although mule deer have never been numerous in this area, small populations do still exist where good mule deer habitat is available. These units are managed mainly for elk and white-tailed deer populations. Given habitats within this Analysis Area have low potential for supporting substantial numbers of mule deer; management emphasis will be placed on maintaining mule deer populations. Interspecific Issues A decline in cattle grazing and successive years of drought during the late 1980s and early 1990s may have contributed to rangeland changes. Intensive logging has created extensive brushy areas on winter ranges. These shifts in vegetation have resulted in increases in white-tailed deer and elk populations, creating possible competition with mule deer. Current research in Starkey suggests that elk may displace mule deer. Predation Issues Mountain lion numbers increased in this Analysis Area during the early and mid-1990s, but more recently have declined and or leveled off in most of these units. A likely reason for the initial increase was probably due to a dramatic increase in white-tailed deer numbers. Black bear numbers have remained static throughout most of this area for the past decade. Coyote numbers remain high and may contribute to some fawn mortality. Increases in road densities during the past several decades have contributed to increased predator hunting opportunities. Wolves have established themselves in Units 10, 10A, 12, and 15 due to reintroduction efforts by the USFWS and likely contribute substantially to deer mortality. Winter Feeding Issues Emergency winter feeding of mule deer has not occurred in the past few years. Information Requirements Harvest and aerial survey information for this Analysis Area are limited. Low mule deer numbers make it difficult to assess population levels with aerial surveys. Incidental mule deer observations will be recorded during aerial surveys for elk. Improved harvest information may be the best way to assess population trends in this area. Prior to 1994 all harvest data was for
Mule Deer PR01.doc 11

mule deer and white-tailed deer combined. Future data collection efforts should continue to be separated for both deer species. Harvest Total harvest in Analysis Area 2 units during 2000 was estimated at 229 mule deer according to the 2000 mandatory harvest reports. This represents an 18% decrease in harvest from 1999. Hunter numbers in Analysis Area 2 units were estimated at 3,949 with an average success rate of 8% in 1999 (no data for 2000). Harvest statistics for Analysis Area 2 units tend to fluctuate, probably due to low sample sizes for mule deer harvest. Hunter numbers in 1999 increased 7% compared to 1998, while success rates increased 3%. Overall, recent years’ harvest trends indicate a slightly decreasing mule deer population in Analysis Area 2 units. Aerial Surveys Sightability is performed on mule deer observed during elk sightability surveys in Analysis Area 2 units. Harvest surveys remain the best way to assess mule deer populations in these units. Estimates using sightability on mule deer in Analysis Area 2 units are extremely variable due to low sample sizes. Classification is not possible because the deer are observed after antler drop. Thus, there are no meaningful composition data for mule deer in the analysis area. However, we did derive mule deer sightability estimates for total population in Unit 12 in February 1997 while conducting elk surveys. The survey revealed an observed count of 46, with a corrected total of 63 ∀ 20 (90% CI). Observed mule deer for January 1997 elk surveys in Units 8 and 8A were 19 and 0, respectively. A 1996 survey in Unit 10A revealed an observed total count of 14, with a corrected total of 40 ∀ 30 (90% CI). No mule deer were observed in Unit 16 during elk surveys in January 2000. Climatic Conditions During the 2000 hunting season, snowfall was light with warmer than average temperatures throughout the fall until late November. Clearwater Region snowpack was 50% of average for 2000-2001. Low and dry snow conditions resulted in 52% of average snow water equivalent. Winter conditions for big game were favorable throughout the region. Green-up was initiated early, but was delayed in the higher elevations as the spring weather remained cooler and wet until July.
Mule Deer PR01.doc 12

Mule DeerAnalysis Area 2 (Units 8, 8A, 10, 10A, 12, 15, 16)
Note: ND = no survey data available, NA = not applicable.
Note: ND = no survey data available. NA = not applicable.
Trend Area Surveys
1993 1994 1995 1996 1997 1998 1999 2000ND ND ND ND ND ND ND ND
ND ND ND ND ND ND ND NDNote: ND = no survey data available.
1992 1993 1994 1995 1996 1997 1998 1999
13
167 104 114 0 20 73 47 52564 342 328 34 199 258 225 226ND ND ND ND 40 21 27 22
10786 16968 22063 18615 18007 5521 3674 3949Note: Telephone survey harvest data prior to 1998 does not include
general primitive weapons season data. Hunter numbers prior to 1997 include all deer hunters.ND = no data available.
* Note: Harvest prior to 1998 does not include general primitive weapons season data.
ComparableSurveys Total
ND
Deer Numbers
Buck Status & Minimum Criterion
Trend Area (Unit)
MinimumCriterion
Buck:Doe Ratio%4+ Pts in the Harvest
ND1997-99
ND23
NDND
TotalND
NA30
SurveyYear(s)
CurrentStatus
NAND
ThresholdSurveyYear Total Deer Total Deer
Trend Area Status & Antlerless Harvest Threshold
NA
Hunter Numbers
Antlered Harvest
Analysis Area Harvest Statistics
% 4+ Points
Antlerless Harvest
Trend Area (Unit)
Current Status Antlerless Harvest
00.10.20.30.40.50.60.70.80.9
1
1993 1994 1995 1996 1997 1998 1999 2000
Population ChangeBetween Comparable Surveys
0
100
200
300
400
600
1992 1993 1994 1995 1996 1997 1998 1999
Harvest* with TrendAntlerless Antlered
500
0
5000
10000
15000
20000
25000
1992 1993 1994 1995 1996 1997 1998 1999
Hunter Numbers with Trend
-5
0
5
10
15
20
25
30
35
40
45
1992 1993 1994 1995 1996 1997 1998 1999
% 4+ Points with Trend
Mule Deer PR01.doc

ANALYSIS AREA 3 (UNITS 11, 11A, 13, 14, 18, 23)
Management Objectives Given the limited amount of aerial survey population information available for this Analysis Area, an antlerless harvest threshold has not been established. However, the Department will make efforts to annually monitor the newly established trend area and develop a threshold value. The current emphasis is to increase mule deer numbers and buck quality; therefore, the Department will recommend restrictive antlerless opportunity until improved population information is available and a threshold is established. Antlered controlled hunts were established in 1998 in order to improve buck numbers and quality. An additional objective is to maintain at least 30% ≥4 points in the harvest. Historical Perspective Mule deer populations in this Analysis Area were historically low. Accounts from Lewis and Clark during the 1800s suggested that very few animals were found throughout the Clearwater River country. Populations probably did not change much until the large fires of the early 1900s that converted large expanses of unbroken forest into a mosaic of successional vegetation types and large numbers of domestic livestock altered grass-dominated habitats into greater amounts of shrub cover. Populations probably peaked during the 1930s-1960s as a result of new, high-quality habitat and lack of competition by other ungulates. As elk and white-tailed deer populations increased and habitat changes including succession, development, and loss of key winter ranges occurred, mule deer populations likely decreased. Information derived from estimates made by Department wildlife managers suggests mule deer numbers in this area declined from around 23,000 in 1960 to about 15,000 in 1990. Historically, white-tailed deer and mule deer were managed as a "single species"; a single general season harvest framework was established for both species. In 1973 the Department began to offer species-specific seasons in the Clearwater Region. Habitat Issues Habitat productivity varies widely throughout the zone with steep, dry, river canyon grasslands having low annual precipitation, to higher elevation forests having good habitat productivity and greater precipitation. Late successional forest cover types have become fragmented within the area. Various weeds have disturbed many grassland cover types and nonnative grasses such as cheat grass and yellowstar thistle. Road density is moderate, and access is restricted in many areas. This results in medium to low vulnerability of big game to hunters, especially within the Snake River and the Salmon River canyons below White Bird. Historically, sheep and cattle ranchers homesteaded the canyon lands in this Analysis Area, while farmers settled prairie land. Around the turn of the century, northern Unit 11 and the prairie land in Unit 11A was under intensive use for dryland agriculture and numerous orchards were planted in the Lewiston area. As settlement increased the forested portions of the area were intensively logged, especially on private land. The forests were frequently high-graded, and the
Mule Deer PR01.doc 14

existing forests still show the scars. In addition, intensive-grazing practices degraded many meadow areas and canyons, allowing invasion of noxious weed species in drier areas. This analysis area contains large tracts of both privately- and publicly-owned lands. Unit 11 and 11A are mostly private land except for the Craig Mountain Wildlife Management Area along the Snake and Salmon Rivers. Unit 13 has been mostly under private ownership since settlement, and is managed for agriculture and livestock. Historically, sheepherders ran their flocks in the canyons of Units 14, 18, and 23, and logging occurred in the forested areas of these units. Units 14 and 18 are two-thirds public lands with the remaining private land located at lower elevations along the Salmon River. The majority of the Hells Canyon Wilderness Area, designated in 1975, is in Unit 18. Unit 23 is mostly public land with some private land located at lower elevations along the Little Salmon River. Grazing by cattle is gradually decreasing in the zone due to reductions in USFS and BLM allotments, along with land ownership shifting from private to public. Several large ranches remain in private ownership with limited access. Available mule deer winter range is being encroached upon by construction of summer homes and resorts along the Snake and Salmon Rivers. Landowners registered enough complaints of mule deer causing damage to small grain, legume, and hay crops during the 1980s that a special mule deer season was developed in the Waha and Maloney Creek areas of Unit 11. This season helped reduce damage complaints and the Maloney Creek portion of the hunt was eliminated in 1997 due to the decline of mule deer in southern Unit 11. This decline was also experienced in agricultural areas of Units 11A, 13, 14, 18, and 23. Landowner complaints in Unit 11A relate to damage caused to rapeseed, bluegrass, and winter wheat. Complaints in Units 13, 14, 18, and 23 involve damage to irrigated alfalfa, orchards, standing hay, and stored hay on agricultural land along the Salmon River breaks. Currently, there are only a few depredation concerns involving mule deer in Analysis Area 3. Since 1998 antlerless mule deer have increased in areas surrounding agricultural fields. During 2000 fire burned a large portion of Unit 11 along the Salmon and Snake Rivers from Maloney Creek down to Dough Creek and all the way to the ridgeline in most places. This fire alteration on the landscape is just now being analyzed for impacts. Grasses and native vegetation are being replanted and many of the bulldozer lines recovered. Still, it will be years before the shrub component fully recovers and decades before conifer regeneration provides thermal and hiding cover. Biological Issues Poor productivity and declining mature buck numbers as reflected in decreasing fawn:doe:buck ratios, a decrease in total numbers, and a 50% decrease in harvest since the late 1980s have contributed to concerns for the mule deer herds in these units. In 1992 aerial surveys in Units 14 and 18 indicated buck:doe ratios at 7:100 and 13:100, respectively. A December 1999 sightability survey in Unit 14 indicated a buck:doe ratio of 18:100. White Bird Trend Area surveys conducted in December 1999 indicated a total population of 1,725 mule deer. This represents a 26% decrease in total numbers from the same subunits flown during the early 1990s.
Mule Deer PR01.doc 15

In 1990 controlled hunt permit numbers in Unit 11 were reduced significantly. Since then fawn:doe:buck ratios have improved along with percent 4-point bucks and total buck numbers. Due to declines in mule deer populations, Units 11A, 13, 14, and 18 went from general hunts to controlled hunts in 1998. The deer population in Unit 23 increased dramatically in the late 1980s, but subsequently declined in the severe winter of 1992-1993 but appear to be increasing since then. General hunting opportunities have been maintained in Unit 23. Interspecific Issues A decline in cattle grazing and successive years of drought during the late 1980s and early 1990s may have contributed to rangeland shifting from forbs to grasses. Intensive logging has created extensive brushy areas on winter ranges. These shifts in vegetation have resulted in increases in white-tailed deer and elk populations, creating competition with mule deer on both winter and summer ranges. Predation Issues Mountain lion harvest has increased slightly in this area during the past several decades and most likely reflects an increase in mountain lion numbers, which may be contributing to lower deer densities. Bear populations remain stable, with harvest fluctuating about 10-20% per year. The semi-arid climate and sparse timber limit the extent of highly productive bear foods in Units 11, 11A, 13, 14, and 18 and does not allow for bears to reach the densities they do in more timbered habitats such as Unit 23. However, due to the extensive old homestead sites in these units, numerous fruit trees and shrubs were planted and remain in the areas today providing excellent bear foods in the autumn. Some of the largest bears in the state annually come from Unit 11. Bears are not thought to have an effect on deer recruitment in this analysis area. Wolves have not yet established themselves in this zone; however, they are frequent visitors to some units. Winter Feeding Issues Emergency winter feeding of mule deer has not occurred in the past few years. Information Requirements Harvest and aerial survey information for this Analysis Area are limited. Improved estimates are needed for yearly harvest data. Previous to 1994 all harvest data was for mule deer and white-tailed deer combined. Data should continue to be separated for both deer species. Initiation of controlled hunts in Units 11A, 13, 14, and 18 in 1998 should improve harvest information. Units 11 and 14 are the only units within this Analysis Area that have been flown for unit-wide winter range surveys since 1994. Aerial surveys have never been conducted in Unit 11A. Due to declining sex and age ratios and declines in harvest in most units, increased aerial surveys are needed throughout this Analysis Area to set harvest quotas and accurately track populations. The White Bird Trend Area was first flown in December 1999. The intent is to fly the White Bird Trend Area once per year in order to obtain annual population estimates and more accurately establish trends in deer numbers for this area.
Mule Deer PR01.doc 16

Harvest Total harvest in Analysis Area 3 during 2000 was estimated at 1,348 mule deer according to the 2000 mandatory harvest reports. This represents a 75% increase in harvest from 1999. Total hunter numbers in the analysis area were not estimated. Harvest increased in Units 11A and 23 resulting from increased doe harvest. Unit 13 buck harvest continues to increase. The minimum criterion for buck:doe ratios in Analysis Area 3 units is 15:100. Using the 1999 aerial survey, Analysis Area 3 as a whole exceeds this level at 20 bucks per 100 does. Using the 1998-2000 telephone harvest information and mandatory harvest report, Analysis Area 3 as a whole exceeds the minimum criterion for bucks (30%) at 31% 4-points and above. The Clearwater Region units are at 49% 4-points and above. According to telephone harvest survey information, buck quality in Analysis Area 3 units has declined since the late 1980s. Aerial Surveys According to 1999 White Bird Trend Area Survey information, the total mule deer population in Analysis Area 3 has declined by 26% since 1994. This survey also indicated Unit 13 may have a significantly lower fawn:doe:buck ratio than the other units in Analysis Area 3. Sightability surveys conducted on the Craig Mountain Wildlife Management Area in Unit 11 in December 1999 revealed an estimated fawn:doe:buck ratio of 53:100:24, and a corrected total of 1,398. This indicates a slight increase in productivity and buck composition with a decrease in total numbers since the mid-1990s. Aerial surveys have not been conducted in Unit 13 since 1994. The December 1994 survey indicated a fawn:doe:buck ratio of 37:100:20 with a corrected total of 3,753. A sightability survey conducted in Unit 14 during December 1999 revealed a fawn:doe:buck ratio of 50:100:18. These results indicated increases in both productivity and buck composition, with a 14% decrease in total population since 1992. Unit 18 was last surveyed in December 2000. The total estimate from the 2000 survey in Unit 18 was 2,523, a 23% increase from 1990, suggesting an increasing population. The observed fawn:doe:buck ratio in 2000 was 59:100:29, which indicated similar productivity and an improved sex ratio relative to the previous 5-year survey average of 62:100:18. The Unit 18 buck:doe ratio of 29:100 is well above the minimum criteria of 15:100, likely a result of implementing a change from a general hunt to a controlled hunt in 1999. Overall, aerial surveys in Analysis Area 3 units indicate a slight recovery in productivity and sex ratios during recent years, with variability among units in total numbers when compared to the late 1980s and early 1990s. Climatic Conditions During the 2000 hunting season, snowfall was light with warmer than average temperatures throughout the fall until late November. Clearwater Region winter snowpack was considered “50% of normal” for 2000-2001. Snowpack was 50% of average, while dry snow conditions resulted in 52% of average snow water equivalent. Winter conditions for big game were favorable throughout the region. A cooler than normal spring delayed green-up at higher elevations until July.
Mule Deer PR01.doc 17

Mule DeerAnalysis Area 3 (Units 11, 11A, 13, 14, 18, 23)
Note: NA = not applicable.
Trend Area Surveys
1993 1994 1995 1996 1997 1998 1999 2000ND 2317 ND ND ND ND 1725
ND 2317 ND ND ND ND 1725Note: ND = no survey data available.
1994 survey is 1992-1994 data
1992 1993 1994 1995 1996 1997 1998 1999
18
277 289 57 0 140 57 33 331077 946 1035 497 1189 782 724 739
ND ND ND ND 60 32 51 524889 7121 7343 6655 7612 4123 2234 2119
Note: Telephone survey harvest data prior to 1998 does not include general primitive weapons season data. Hunter numbers prior to 1997 include all deer hunters.ND = no data available.
* Note: Harvest prior to 1998 does not include generalprimitive weapons season data. Hunter numbersprior to 1997 include all deer hunters.
Trend Area Status & Antlerless Harvest Threshold
NA
Hunter Numbers
Antlered Harvest
Analysis Area Harvest Statistics
% 4+ Points
Antlerless Harvest
Trend Area (Unit)
Current Status Antlerless HarvestThresholdSurvey
Year Total Deer Total DeerNA1725
1725White Bird (13, 14, 18)
Total1999
1530
SurveyYear(s)
CurrentStatus
19991997-99
2044
ComparableSurveys Total
Deer Numbers
Buck Status & Minimum Criterion
Trend Area (Unit)White Bird (13, 14, 18)
MinimumCriterion
Buck:Doe Ratio%4+ Pts in the Harvest
0
500
1000
1500
2000
2500
1993 1994 1995 1996 1997 1998 1999 2000
Population ChangeBetween Comparable Surveys
-200
0
200
400
600
800
1000
1200
1400
1992 1993 1994 1995 1996 1997 1998 1999
Harvest* with TrendAntlerless Antlered
0
1000
2000
3000
4000
5000
6000
7000
8000
1992 1993 1994 1995 1996 1997 1998 1999
Hunter Numbers with Trend
-20
-10
0
10
20
30
40
50
60
70
1992 1993 1994 1995 1996 1997 1998 1999
% 4+ Points with Trend
Mule Deer PR01.doc

ANALYSIS AREA 4 (UNITS 16A, 17, 19, 19A, 20, 20A, 25, 26, 27)
Management Objectives The objectives for these units are to maintain a minimum of 25 bucks per 100 does in post-season surveys and to maintain 50% >4-point bucks in the harvest. When estimated deer numbers exceed 2,700 in the Unit 27 trend area, antlerless seasons will be considered. Historical Perspective These units represent the core of Idaho's backcountry; much of the area is designated Wilderness. With the rugged, remote terrain and difficult access, management control of deer herds has been difficult at best. The forces of weather, fire, and plant succession have ultimately played a much larger role in deer populations than efforts of wildlife managers. In the late 1800s human populations reached their peak as gold seekers poured into the area and established mining boom towns. With the miners came year-round big game hunting for meat, followed shortly by intensive livestock grazing. Depleted game herds plus heavy grazing of grass ranges set the stage for a shrub explosion in the early 1900s. At the same time, the mining boom collapsed and deer management emphasized protection from harvest; large "game preserves" were created. By the 1930s managers were recognizing that deer herds had grown to levels that were damaging winter ranges. Management emphasis shifted from protection to trying to achieve enough harvest to maintain winter range condition. Seasons were extended from mid-September through November to mid-December. Second and third deer tags were offered in some areas from the 1940s through the 1960s. A mid-September to late November season has been standard in the backcountry units since the 1950s. Even today, much of the deer harvest is localized around access points such as roads and airstrips. Ultimately, the shrub winter ranges could not be sustained. More controlled livestock grazing and fire suppression allowed grasses and conifers to out compete shrub seedlings; shrub ranges began to revert to grasslands and forests. As the habitat went, so went the deer; long-term trend counts in Unit 27 show a steady decline in deer numbers from the 1920s to the mid-1960s. Since that time the trend in deer numbers and harvest has been relatively flat. For example, 2,900 deer were counted during a 1968 helicopter deer survey of Unit 27. During a 1995 helicopter elk survey of the same area, 2,100 deer were observed incidental to elk counts. Habitat Issues
19
Habitat ultimately determines deer densities and productivity. In these units where hunter harvest has historically been light, particularly for females, deer herds could be expected to exist much of the time at densities approaching carrying capacity (unless suppressed by predators or temporarily set back by severe winters). Deer herds at or near carrying capacity can be expected to be relatively unproductive, recruiting few fawns, thus few bucks, into the population, and these herds can be expected to produce bucks with small antlers. Unit 27 does produce relatively small-antlered bucks for their age, but this has not been definitively tied to deer densities or habitat. Continued shrubland deterioration, conifer encroachment, and booming elk populations, will probably continue to further erode habitat capacity for deer. Fire may enhance summer Mule Deer PR01.doc

ranges and winter ranges in the more moist northern units; but fire is not likely to benefit the more arid southern winter ranges. Already established in some areas, the spread of noxious weeds such as knapweed, rush skeletonweed, and leafy spurge could ultimately have significant impacts on winter range productivity. Biological Issues Very little mule deer aerial survey data has been collected in these units since the 1960s. What data has been collected suggests a fairly stable number of deer since that time. For example, a 1965 helicopter trend count in Unit 27 resulted in a tally of 1,963 deer. The same area flown in 1968 resulted in 2,929 deer observed, while 2,133 deer were counted incidental to elk surveys in 1995. Buck harvests since the mid-1970s in Unit 27 are variable, but indicate no definite upward or downward trend. Similarly, there is no evident trend in % 4-point bucks in the harvest, which varies annually, but averages approximately 55%. However, in recent years backcountry outfitters have suggested that total deer numbers and mature buck numbers may have declined. Interspecific Issues Current high elk densities may be having some impact on the area's capacity to produce deer. White-tailed deer, a potentially strong competitor, are rare south of the Salmon River but occur at greater densities in the more northern units. In some limited areas, mountain goats and mule deer may be competing for the same mountain mahogany winter ranges. Bighorn sheep also share some ranges, but generally overlap little with deer. Livestock rangeland grazing, another potential source of competition, is generally a very minor activity in most of these units. Predation Issues Black bear densities appear to be low to moderate in the southern units and increasing towards the north. Mountain lion densities are at least moderate, perhaps high, and appear to have increased in recent years, probably at least in part due to increased elk densities. Coyotes are common and have an unknown impact on deer populations. Bobcats and golden eagles are present, but are not thought to cause significant predation on deer. Wolves reintroduced by the U.S. Fish and Wildlife Service appears to have become well established in these units. The addition of wolves will likely have an impact on black bear, mountain lion, and coyote populations. At some level, predation could benefit deer herds to the extent that it reduces elk competition and keeps deer herds below carrying capacity, where they can be more productive. However, excessive levels of predation can also suppress prey populations to undesirably low levels. At this point it is unclear what the net impact of predation will be with the new mix of large predators. Winter Feeding Issues Winter feeding has not occurred in these remote big game units.
Mule Deer PR01.doc 20
Information Requirements Survey data on mule deer herd sex and age composition and trends in deer numbers are inadequate. Impacts of elk on mule deer production and survival are suspected but unknown. The most productive deer herds are those maintained at a level well below carrying capacity (at which point recruitment equals mortality and there is no harvestable surplus). Better information is needed to identify appropriate deer densities that will maintain optimum productivity and harvest. The potential impact of the new mix of large predators is unknown. Migratory patterns are largely unknown.
Mule Deer PR01.doc 21

Mule DeerAnalysis Area 4 (Units 16A, 17, 19, 19A, 20, 20A, 25, 26, 27)
Note: ND = no survey data available.
Trend Area Surveys
1993 1994 1995 1996 1997 1998 1999 2000ND ND (1495) ND ND ND 2519 2225
ND ND (1495) ND ND ND 2519 2225Note: ND = no survey data available, estimates within parenthesis
are based on information other than sightability surveys.
1992 1993 1994 1995 1996 1997 1998 1999
22
127 152 270 425 179 551035 1472 1509 1772 1658 803
61 47 61 53 62 473892 5007 7769 12001 7228 4287
72 14782 40264 55
5661 3424Note: Telephone survey harvest data prior to 1998 does not include
general primitive weapons season data. Hunter numbers include all deer hunters.
* Note: Harvest prior to 1998 does not include general primitive weapons season data.
% 4+ PointsHunter Numbers
Middle Fork (27)Comparable
Surveys Total
Analysis Area Harvest Statistics
Antlerless HarvestAntlered Harvest
%4+ Pts in the Harvest 1997-99 55 50
Deer NumbersTrend Area (Unit)
Year(s) Status CriterionBuck:Doe Ratio 2000 23 25
Total 2225 2700
Buck Status & Minimum CriterionSurvey Current Minimum
Trend Area (Unit) Year Total Deer Total DeerMiddle Fork (27) 2000 2225 2700
Trend Area Status & Antlerless Harvest ThresholdCurrent Status Antlerless Harvest
Survey Threshold
0
500
1000
1500
2000
2500
3000
1993 1994 1995 1996 1997 1998 1999 2000
Population ChangeBetween Comparable Surveys
0200400600800
100012001400160018002000
1992 1993 1994 1995 1996 1997 1998 1999
Harvest* with TrendAntlerless Antlered
0
2000
4000
6000
8000
10000
12000
14000
1992 1993 1994 1995 1996 1997 1998 1999
Hunter Numbers with Trend
0
10
20
30
40
50
60
70
1992 1993 1994 1995 1996 1997 1998 1999
% 4+ Points with Trend
Mule Deer PR01.doc

ANALYSIS AREA 5 (UNITS 21, 21A, 28, 36B)
Management Objectives The objectives for this zone are to maintain a minimum of 15 bucks per 100 does in post-season surveys and to maintain 30% >4-point bucks in the harvest. When estimated deer numbers exceed 1,800 in the North Fork trend area and 2,500 in the Challis trend area, antlerless seasons will be considered. Historical Perspective Mule deer were scarce and harvest low for much of the early part of the 20th century. From 1917 until the 1940s, parts of Units 28 and 36B were designated as no hunting "game preserves." By the early 1940s deer herds had expanded to the point that long either-sex seasons were being offered (early October to mid-November). This pattern continued into the 1970s, when the antlerless portion of the season began to be shortened and the total season length was shortened to include mid-October to mid-November. In 1991 concerns for mature buck escapement led to shifting the deer season earlier so that it ended in October before the rut began. Since 1991 the deer season framework has been the most conservative these units have seen in at least 50 years. Approximately 4,000-5,000 people have participated in rifle hunts in Analysis Area 5 in recent years, harvesting 550-1,600 bucks annually. Antlerless deer harvest was eliminated in 1998 and buck harvest declined in subsequent years. This decline may be attributable to increased competition between does and bucks for limited forage resources. Habitat Issues Cattle ranching, livestock grazing, mining, timber harvest, and recreation are the dominant human uses of the landscape in Analysis Area 5. Deer depredations on agricultural crops are minor. The intrusion of human development into winter ranges is accelerating. Habitat ultimately determines deer densities and productivity. However, specific limiting factors within the habitat are poorly understood. Deer herds at or near carrying capacity can be expected to be relatively unproductive, recruiting few fawns, thus few bucks into the population; antlers will be relatively small for the age of the buck; and antler drop will occur relatively early in winter. Deer herds in this group of units exhibit all these traits to some degree, but this has not been definitively tied to deer densities or habitat. In some areas deer winter in mature stands of mountain mahogany that are relatively stagnant and unproductive. Elk may have removed much of the mahogany canopy within reach of deer. Forests are slowly encroaching into shrub and grassland communities. The spread of noxious weeds such as knapweed and leafy spurge could ultimately have significant impacts on winter range productivity. Biological Issues
23
A trend area in Unit 21 near North Fork has been flown annually since December 1990 and a similar trend area has been flown in Unit 36B south of Challis since December 1994. However, the value of these surveys as indicators of total deer numbers is questionable; strong variations, Mule Deer PR01.doc

including biological impossibilities, occur from one year to the next. These flights do provide insights into herd productivity and sex/age structure. Fawn production is typically moderate, averaging 64 fawns per 100 does in early winter. Buck:doe ratios in Unit 21 made modest gains after the 1991 season change, but they have since stabilized at 15-18 bucks per 100 does. Buck:doe ratios are slightly higher in Unit 36B; generally closer to 20 bucks per 100 does. Interspecific Issues Area 5 contains the majority of the most productive deer units in the Salmon Region; parts of Units 21, 21A, and 36B contain high densities of wintering deer. Current high elk densities may be having some impact on the area's capacity to produce deer. This impact may be particularly pronounced during severe winters when deep snow moves elk down onto deer winter ranges. White-tailed deer, a potentially strong competitor, are mostly restricted to private lands along major riparian areas between Salmon and Gibbonsville. Pronghorn antelope, bighorn sheep, and mountain goat share some ranges, but generally overlap little with mule deer. Livestock rangeland grazing, another potential source of competition, has generally been reduced in recent years. Predation Issues Black bear densities appear to be moderate in Analysis Area 5. Mountain lion densities are at least moderate, perhaps high in some areas, and appear to have increased in recent years, probably at least in part due to increased elk densities. Coyotes are common and have an unknown impact on deer populations. Bobcats, red fox, and golden eagles also occur in the area but are not thought to account for significant predation on deer. Two packs of wolves reintroduced by the U.S. Fish and Wildlife Service have become established in Unit 28. Wolves also occasionally frequent the other units in Analysis Area 5, but 1 pack may be established in Unit 21. The addition of wolves will likely have an impact on black bear, mountain lion, and coyote populations. At some level predation could benefit deer herds to the extent that it reduces elk competition and keeps deer herds below habitat carrying capacity, where they can be more productive. However, excessive levels of predation can also suppress prey populations to undesirably low levels. At this point it is unclear what the net impact of predation will be with the new mix of large predators. Winter Feeding Issues Limited amounts of deer feeding occurred about once per decade in the North Fork area. Minor private feeding activities also occur from time to time. Information Requirements Although surveys have been conducted since 1990 in Unit 21 and 1994 in Unit 36B, long-term survey data on mule deer herd sex and age composition and trends in deer numbers are inadequate. Impacts of elk on mule deer production and survival are suspected but unknown. The most productive deer herds are those maintained at a level well below carrying capacity (at which point recruitment equals mortality and there is no harvestable surplus). Better information
Mule Deer PR01.doc 24

is needed to identify appropriate deer densities that will maintain optimum productivity and harvest. Migratory patterns are largely unknown. Potential impact of the new mix of large predators is unknown.
Mule Deer PR01.doc 25

Mule DeerAnalysis Area 5 (Units 21, 21A, 28, 36B)
Trend Area Surveys
1993 1994 1995 1996 1997 1998 1999 20001907 1835 1693 1129 2027 1226 ND 1104
ND 2357 3094 1796 2926 1840 2163 1963
ND 4192 4787 2925 4953 3066 ND 3067Note: ND = no survey data available.
Analysis Area Harvest Statistics1992 1993 1994 1995 1996 1997 1998 1999
26
232 140 528 238 319 1761376 792 1761 981 1660 730
45 31 43 38 41 353060 3050 4942 4788 4684 3907
0 0952 55327 28
4082 2660Note: Telephone survey harvest data prior to 1998 does not include
general primitive weapons season data.
* Note: Harvest prior to 1998 does not include general primitive weapons season data.
Hunter Numbers
Antlered Harvest% 4+ Points
Antlerless Harvest
Trend Area (Unit)
Current StatusSurveyYear Total Deer
Trend Area Status & Antlerless Harvest Threshold
4300
Antlerless HarvestThreshold
30
Buck Status & Minimum Criterion
Total Deer
250019633067
North Fork (21) 2000 1104 1800
Year(s)CurrentStatus
Challis (36B)Total
2000
MinimumCriterion
Buck:Doe Ratio%4+ Pts in the Harvest
20001997-99
13 1530
Survey
ComparableSurveys Total
Challis (36B)
Deer NumbersTrend Area (Unit)
North Fork (21)
0
1000
2000
3000
4000
5000
6000
1993 1994 1995 1996 1997 1998 1999 2000
Population ChangeBetween Comparable Surveys
0200400600800
100012001400160018002000
1992 1993 1994 1995 1996 1997 1998 1999
Harvest* with TrendAntlerless Antlered
0
1000
2000
3000
4000
5000
6000
1992 1993 1994 1995 1996 1997 1998 1999
Hunter Numbers with Trend
05
101520253035404550
1992 1993 1994 1995 1996 1997 1998 1999
% 4+ Points with Trend
Mule Deer PR01.doc

ANALYSIS AREA 6 (UNITS 22, 24, 31, 32, 32A, 33, 34, 35, 39)
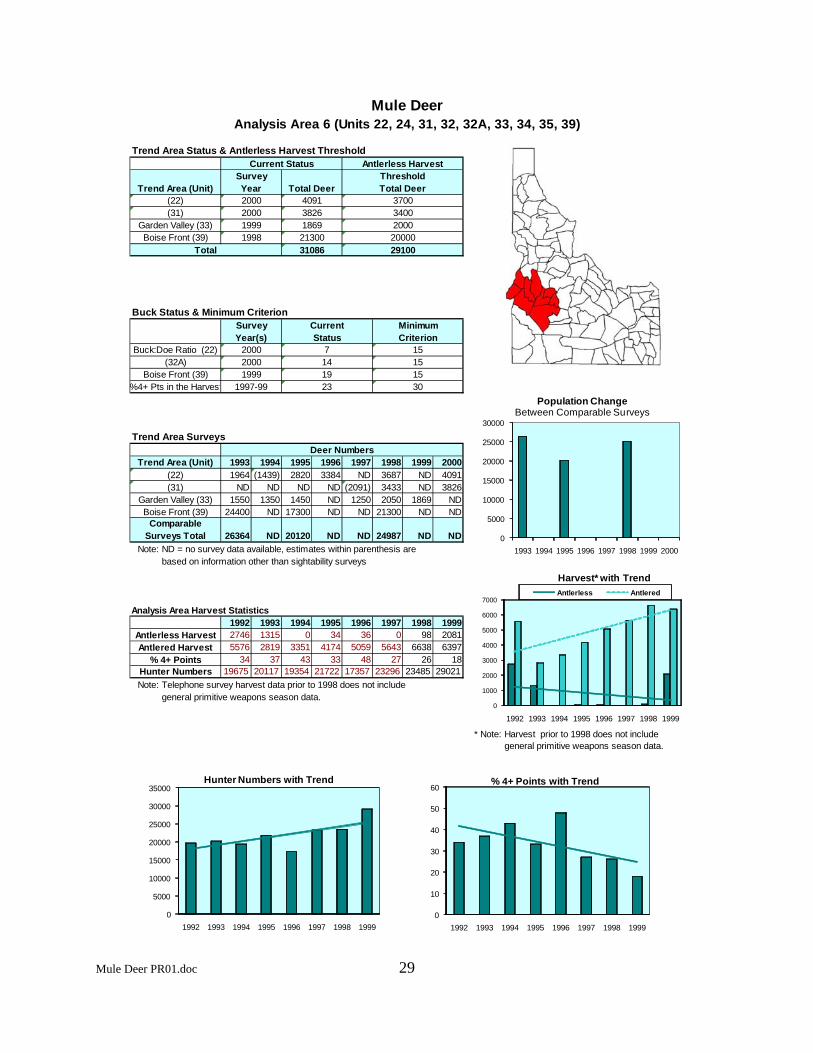
Management Objectives The objectives for this area are to maintain buck harvest above 30% 4+ points and maintain buck:doe ratios from herd composition surveys above the statewide minimum of 15 bucks per 100 does. Antlerless harvest will be restricted when trend area deer populations are below threshold levels of 3700 deer in Unit 22, 3400 in Unit 31, 2000 in Unit 33, and 20000 in Unit 39. Conversely, liberal antlerless harvest will be encouraged when deer numbers exceed these threshold values. These values represent intermediate populations between current status and numbers observed during the late 1980s when deer populations were considered higher than could be supported during a normal winter and presented depredation concerns for agri-businesses. Historical Perspective These units represent the major deer units in the Southwest Region. In late 1800s deer herds were reduced by extensive meat hunting throughout the area. Hunting was restricted in the early 1900s. The subsequent increase in the deer herds led to large winterkills in some areas, extensive winter feeding programs, and concern for the status of vegetation on deer winter range. Over one-third of Idaho's population lives near these big game units. These units provide deer hunting opportunity, but that opportunity has to be closely regulated to prevent over harvest. This is particularly true for does throughout the area, and for bucks in the open sagebrush habitats where they are more vulnerable. Habitat Issues The habitats range from the Snake River breaks, to the sagebrush ranges in the Payette and Weiser River drainage to the Sawtooth Mountain Range. The majority of mule deer summer on land administered by the U.S. Forest Service. The mule deer typically spend the summers in the forest habitats and move to lower sagebrush/grass winter ranges. Low elevation winter ranges consist of more private land than the summer ranges. Logging, grazing, and fires have substantially affected the condition of these ranges. The logging activity has increased shrub fields and provided increased forage for mule deer. The effect of fire on summer ranges has been positive, improving forage conditions for deer. The effects of fire on the low elevation winter ranges have been more negative. In many cases the fires have reduced the shrubs that deer are dependent on during the winter. An exception has been some winter ranges burned with cooler spring fires to maintain important shrubs species such as bitterbrush and sagebrush. The proliferation of noxious weeds poses a threat to mule deer winter range. In the Boise area, the expansion of home developments onto mule deer winter range has been a significant problem. This urban development is impacting the wintering areas of one-third of Unit 39's mule deer herd.
Mule Deer PR01.doc 27
Biological Issues Population performance in this area is closely associated with winter severity and body condition of deer when entering the winter period. Buck harvest parameters are at 30% 4+ Points. Aerial survey information indicates buck: doe ratios are near 15:100 or above in most places. Interspecific Issues Elk densities are currently high throughout most of the area. These high elk densities may be limiting the ability of the area to support mule deer. There are some white-tailed deer in Units 22, 24, 32, 32A, and 33. The white-tailed deer populations do not seem to be expanding their distribution. Intensive cattle and sheep grazing are present on much of the range. Competition among species is largely unknown. Predation Issues Bobcats, coyotes, mountain lions, and black bears are the large predators throughout the area. Wolves occur in Units 24, 33, 34, and 35. The impact of these large predators on mule deer is largely unknown. Winter Feeding Issues Winter feeding has been fairly common in these units. In the Garden Valley area, winter feeding occurs about two out of five years. In other areas, extensive winter feeding occurs less often the most recent being the winter of 1992-93. Winter feeding operations have been widespread and controversial throughout these units. Early attempts to use hay to feed deer in the winter were not very successful. The current pelletized ration can effectively support deer through tough winter conditions. During the last ten years, winter feeding operations have centered around the Boise Front, Garden Valley, and the Weiser/Brownlee Reservoir areas. Information Requirements The large area in these units necessitates several trend areas. These trend areas need to be surveyed on an annual basis to determine the status of the herd. There is little information on herd composition in many of these units. This data collection effort needs to be increased. Information on interspecific competition is also needed.
Mule Deer PR01.doc 28
Mule DeerAnalysis Area 6 (Units 22, 24, 31, 32, 32A, 33, 34, 35, 39)
Trend Area Surveys
1993 1994 1995 1996 1997 1998 1999 20001964 (1439) 2820 3384 ND 3687 ND 4091
ND ND ND ND (2091) 3433 ND 38261550 1350 1450 ND 1250 2050 1869 ND
24400 ND 17300 ND ND 21300 ND ND
26364 ND 20120 ND ND 24987 ND NDNote: ND = no survey data available, estimates within parenthesis are
based on information other than sightability surveys
Analysis Area Harvest Statistics1992 1993 1994 1995 1996 1997 1998 1999
29
2746 1315 0 34 36 05576 2819 3351 4174 5059 5643
34 37 43 33 48 2719675 20117 19354 21722 17357 23296
98 20816638 6397
26 1823485 29021
Note: Telephone survey harvest data prior to 1998 does not include general primitive weapons season data.
* Note: Harvest prior to 1998 does not include general primitive weapons season data.
(32A) 2000 14 15
ComparableSurveys Total
Boise Front (39)
Deer Numbers
(31)
Boise Front (39) 1999 19 15
15
30
Buck Status & Minimum Criterion
Trend Area (Unit)(22)
Garden Valley (33)
MinimumCriterion
Buck:Doe Ratio (22)
%4+ Pts in the Harvest
SurveyYear(s)
CurrentStatus
7
23
2000
1997-99
31086
(22)
Garden Valley (33)Boise Front (39)
Total
2000
19991998
(31) 2000200020000
34004091
186921300
3826
SurveyYear Total Deer Total Deer
3700
Trend Area Status & Antlerless Harvest Threshold
29100
Hunter Numbers
Antlered Harvest% 4+ Points
Antlerless Harvest
Trend Area (Unit)
Current Status Antlerless HarvestThreshold
0
5000
10000
15000
20000
25000
30000
1993 1994 1995 1996 1997 1998 1999 2000
Population ChangeBetween Comparable Surveys
0
1000
2000
3000
4000
5000
6000
7000
1992 1993 1994 1995 1996 1997 1998 1999
Harvest* with TrendAntlerless Antlered
0
5000
10000
15000
20000
25000
30000
35000
1992 1993 1994 1995 1996 1997 1998 1999
Hunter Numbers with Trend
0
10
20
30
40
50
60
1992 1993 1994 1995 1996 1997 1998 1999
% 4+ Points with Trend
Mule Deer PR01.doc

ANALYSIS AREA 7 (UNITS 43, 44, 45, 48, 52)
Management Objectives An objective for Analysis Area 7 is to restrict antlerless harvest when trend area populations are less than 5,000 deer; conversely, antlerless harvest will be considered when deer numbers exceed this threshold value. Additionally, deer populations will be managed to maintain or exceed 20 bucks per 100 does in the prewinter population and >45% bucks with 4-point or larger antlers in the general harvest. Historical Perspective During the late 1800s and early 1900s, mule deer populations in Analysis Area 7 were reduced to very low levels by unregulated harvest. Miners, market hunters, and other inhabitants of the area relied heavily on deer and elk meat. Mule deer habitat was also greatly altered during this period by excessive livestock use. Dense shrubs fields, dominated by sagebrush and bitterbrush, replaced plant communities dominated by grasses. This pronounced change in habitat combined with restrictions on deer hunting prompted increases in deer numbers. Hunting seasons were closed or very conservative through 1940. At that time winter ranges were considered to be overbrowsed and in a downward trend, and hunting seasons were designed to reduce deer numbers. Deer numbers remained strong through the 1950s and 1960s. Following a significant decline in numbers during the mid-1970s, deer populations increased again during the late 1980s, a period of prolonged drought conditions and mild winters. During the winter of 1992-1993, deer populations declined by approximately 50%. Deer had entered the winter in poor physiological condition and high overwinter mortality of fawns and bucks occurred. Since 1993 deer numbers have increased in this area but remain below the population levels of the late 1980s and early 1990s. Harvest management includes both general (Units 43 and 48) and controlled (Units 44, 45, and 52) hunting seasons. The controlled hunts are very popular with sportsmen desiring quality, high hunter success, low hunter density, and the opportunity to observe many deer. The Bennett Hills (Unit 45) has had controlled hunting seasons since 1972 and has the most highly sought after mule deer permits in Idaho. Drawing odds for the November buck hunt have been about 1 in 25. Since the 1993 decline, liberal antlerless hunts have been maintained in Units 43, 44, and 45 to slow the recovery of deer on deteriorated winter ranges in Unit 45. Units 45 and 52 provide most of the winter habitat for deer in this Analysis Area. Important winter ranges include: Black Butte Hills (Unit 52), Picabo Hills (Unit 52), and King Hill (Unit 45). Habitat Issues This Analysis Area encompasses about 5,487 mi2 of which 24% is managed by the U. S. Forest Service, 49% is managed by the Bureau of Land Management, 5% is administered by the Idaho Department of Lands, and 22% is private land.
Mule Deer PR01.doc 30

Most of Unit 52 and the southern portion of Unit 45 is primarily arid semi-desert dominated by sagebrush-grass. The Mount Bennett Hills in the northern portion of Unit 45 is a low range of mountains or high plateaus consisting of sagebrush-grass and mixed mountain shrub communities with small pockets of aspen and Douglas fir on northern exposures and more mesic sites. Units 43, 44, and 48 include the Soldier, Boulder, and Smoky Mountains. Mountain shrub and mountain big sagebrush communities are common on south-facing exposures while northern exposures are timbered. Grazing by cattle and domestic sheep is the primary land use on public and private lands. Conflicts tend to be localized rather than widespread and include excessive use of forage on winter ranges and riparian area degradation. Overall habitat security for deer during the hunting season is good in Units 43 and 48. Seasonal road closures implemented primarily for elk security also benefit mule deer. Cover is relatively open and road densities are higher in Units 44, 45, and 52, necessitating controlled hunts to maintain the desired buck age structure. Important habitat issues include: 1. Succession, and in some cases heavy livestock use, has caused a general decline in the health of aspen communities. Many stands have become decadent and/or are being replaced by conifers. 2. Winter ranges, primarily in Units 45 and 52, are considered to be limiting to mule deer in this Analysis Area. Winter ranges are predominately sagebrush-grass and generally do not have a strong bitterbrush component. Much of the winter habitat has been used heavily by deer and livestock for many years and is considered in poor condition in many areas. Medussahead rye has invaded winter ranges following fires and is considered a serious concern to the long-term health of the habitat. The prevalence of cheatgrass has also increased in deer winter habitats following fire and/or prolonged heavy grazing pressures that have depleted other understory species. Rehabilitation and protection of these very critical winter ranges will require careful long-term planning that will maintain adequate browse for wintering deer and improve understory vegetation. Conservation easements and/or acquisition of private lands in strategic locations would also help increase or maintain the winter carrying capacity for deer. 3. Timber harvesting and consequent road building activities continue in portions of Unit 43. Access management will continue to be an important issue for deer and elk management. Increased access frequently leads to more conservative and restricted hunting season frameworks. 4. Private interests own or control access to important summer and fall habitats in Units 44 and 45. This has been a subject of much concern by hunters unable to gain access to areas they wish to hunt. 5. Depredation problems can become acute during severe winters in the King Hill/Bliss areas of Unit 45. Private land used for growing crops and pasturing livestock occurs along the lower perimeter of the deer winter range. On the Camas Prairie (Units 44 and 45) summer depredation problems on growing alfalfa are common during drought years. Biological Issues Data from the King Hill trend area in Unit 45 suggest mule deer populations in the Analysis Area have increased substantially since 1994. Prior to the decline in deer in 1993, deer populations exceeded winter range carrying capacity and damage to private property was extreme in some
Mule Deer PR01.doc 31
years. The short-term management goal has been to maintain the population at lower levels through liberal antlerless harvest. Despite the liberal antlerless harvest strategy, the estimated population in the trend area increased by 58% from 1994 to 2001. Herd composition survey data suggest a decline in reproductive performance measured in December from 85 fawns:100 does (1973-1992) to 65 fawns:100 does (1993-1999). However, observed recruitment rates since 1991 have ranged from 21% in 1993 to 42% in 1996 and have averaged 33%, sufficient to allow modest population increases. Buck to doe ratios are currently at 32 bucks per 100 does, well above the objective of 20 bucks per 100 does. Interspecific Issues The analysis area supports a substantial population of elk; a few moose; antelope; and, at higher elevations, mountain goats. The relationship between deer and elk is presently unclear but is not believed to be a significant issue because there is little or no known overlap in winter use areas between deer and elk. On the Bennett Hills Front deer winter ranges, mule deer will maintain management priority over elk if there are competitive concerns during winter. A small population of antelope also occurs in Units 44 and 45 but there is little overlap of seasonal use areas. Cattle and domestic sheep have imposed the major forage demand in this zone since the 1870s. Excessive use by cattle and domestic sheep severely damaged soil and vegetation in the late 1800s and early 1900s. Today livestock use has been reduced to less than 15% of the historic use and competitive concerns remain but tend to be more localized. Predation Issues Mountain lions, coyotes, black bears, and bobcats are potential predators on mule deer in the Analysis Area. In recent years mountain lion populations have increased in these units, presumably in response to the high deer populations in the late 1980s and early 1990s. Coyote numbers are believed to have increased in the past 30 years; however, they are subject to unregulated hunting and periodic control activities by USDA Wildlife Services. Black bear numbers have increased slightly in recent years but densities are considered relatively low. Because the management objective has been to slow the rate increase in this deer herd, any effects that predators may have had on deer population dynamics is considered inconsequential. Winter Feeding Issues Supplemental winter feeding of deer has not occurred in the past few years and is not considered an important issue in this analysis area. Information Requirements The King Hill winter trend area will continue to be surveyed annually to monitor population status in relation to management objectives. Pre- and post-winter herd composition surveys will be conducted to monitor overwinter fawn mortality, recruitment rate, and the buck to doe ratio.
Mule Deer PR01.doc 32

The Bennett Hills Front has some of the highest wintering deer densities in Idaho and winters a high proportion of the mule deer in the Magic Valley Region. There is a need for improved monitoring of winter range condition and trend.
Mule Deer PR01.doc 33

Mule DeerAnalysis Area 7 (Units 43, 44, 45, 48, 52)
Trend Area Surveys
1993 1994 1995 1996 1997 1998 1999 2000ND 5096 ND 5341 6375 5720 9165 8198
ND 5096 ND 5341 6375 5720 9165 8198Note: ND = no survey data available.
1992 1993 1994 1995 1996 1997 1998 1999
34
4346 1824 898 1157 1165 1203 1150 12472088 1016 993 1445 1564 1248 1496 1815
54 69 64 51 53 42 37 488729 6903 4397 4782 5030 5966 6573 7006
Note: Telephone survey harvest data prior to 1998 does not includegeneral primitive weapons season data.
* Note: Harvest prior to 1998 does not include general primitive weapons season data.
Trend Area Status & Antlerless Harvest Threshold
5000
Hunter Numbers
Antlered Harvest
Analysis Area Harvest Statistics
% 4+ Points
Antlerless Harvest
Trend Area (Unit)
Current Status Antlerless HarvestThresholdSurvey
Year Total Deer Total Deer50008198
8198King Hill (45)
Total2000
2045
SurveyYear(s)
CurrentStatus
19991997-99
3042
ComparableSurveys Total
Deer Numbers
Buck Status & Minimum Criterion
Trend Area (Unit)King Hill (45)
MinimumCriterion
Buck:Doe Ratio%4+ Pts in the Harvest
0100020003000400050006000700080009000
10000
1993 1994 1995 1996 1997 1998 1999 2000
Population ChangeBetween Comparable Surveys
0500
100015002000250030003500400045005000
1992 1993 1994 1995 1996 1997 1998 1999
Harvest* with TrendAntlerless Antlered
0
1000
2000
3000
4000
5000
6000
7000
8000
9000
10000
1992 1993 1994 1995 1996 1997 1998 1999
Hunter Numbers with Trend
0
10
20
30
40
50
60
70
80
1992 1993 1994 1995 1996 1997 1998 1999
% 4+ Points with Trend
Mule Deer PR01.doc

ANALYSIS AREA 8 (UNITS 36, 36A, 49, 50)
Management Objectives The objectives for these units are to maintain a minimum of 15 bucks per 100 does in post-season surveys and to maintain 30% >4-point bucks in the harvest. When estimated deer numbers exceed 4,100 in the Unit 50 trend area, antlerless seasons will be considered. Historical Perspective Mule deer were scarce and harvests low for much of the early part of the 20th century. By mid-century, mule deer had become the predominant big game animal. Once known for strong mule deer populations, particularly in Unit 36A, these units produced very high mule deer harvests in the 1950s and 1960s. By the 1970s harvests had dropped by two-thirds as more conservative management strategies were implemented. Despite 2 decades of very conservative antlerless harvests and increasingly conservative buck seasons, mule deer populations have failed to return to their previous high densities and may yet be declining. Although deer herds declined well before any significant increase in elk numbers, current high elk densities may well be helping to suppress deer populations. Habitat Issues Cattle ranching, livestock grazing, and recreation are dominant human uses of the landscape in these units. This is in a generally arid region where forage production and deer harvest can be strongly influenced by growing season precipitation. Deer depredations on agricultural crops are common and are especially pronounced in dry years. Habitat ultimately determines deer densities and productivity. However, specific limiting factors within the habitat are poorly understood. In some areas deer winter in mature stands of mountain mahogany that appear relatively stagnant and unproductive. Elk may have removed much of the mahogany canopy within reach of deer. Forests are slowly encroaching into shrub and grassland communities. Spread of noxious weeds such as knapweed and leafy spurge could ultimately have significant impacts on winter range productivity. Biological Issues Very little aerial survey data have been collected in these units in recent years. In these units buck harvest in the late 1980s reached the highest levels since at least 1970. In the 1990s the harvest dropped to near average levels, except in Unit 49, which remained well above the long-term average. Since seasons were shifted earlier in 1991, comparatively more of the Unit 36/ 36A buck harvest has come from Unit 36. Interspecific Issues Current high elk densities may be having some impact on the area's capacity to produce deer. Pronghorn antelope, mountain goat, and bighorn sheep also share the range but generally overlap
Mule Deer PR01.doc 35

little with mule deer. Livestock rangeland grazing, another potential source of competition, has generally been reduced in recent years. Predation Issues Black bear densities appear to be low to moderate and stable. Mountain lion densities are low to moderate and appear to have increased in recent years, probably at least in part due to increased elk densities. Coyotes are common and have an unknown impact on deer populations. Bobcats, red fox, and golden eagles also occur in the area but are not thought to account for significant predation on deer. Wolves recently reintroduced by the U.S. Fish and Wildlife Service in central Idaho may become established in Area 8, which may have some effect on other predators and on deer. Winter Feeding Issues Emergency winter feeding of deer occurs infrequently, only during critical winter conditions. In Unit 50 adequate winter range combined with low snow accumulations precludes the need for supplemental feeding. Small-scale private feeding operations may occur throughout the Analysis Area. Information Requirements Survey data on mule deer herd sex and age composition and trends in deer numbers are inadequate. Impacts of elk on mule deer production and survival are suspected but unknown. The most productive deer herds are those maintained at a level well below carrying capacity (at which point recruitment equals mortality and there is no harvestable surplus). Better information is needed to identify appropriate deer densities that will maintain optimum productivity and harvest. Migratory patterns are largely unknown.
Mule Deer PR01.doc 36
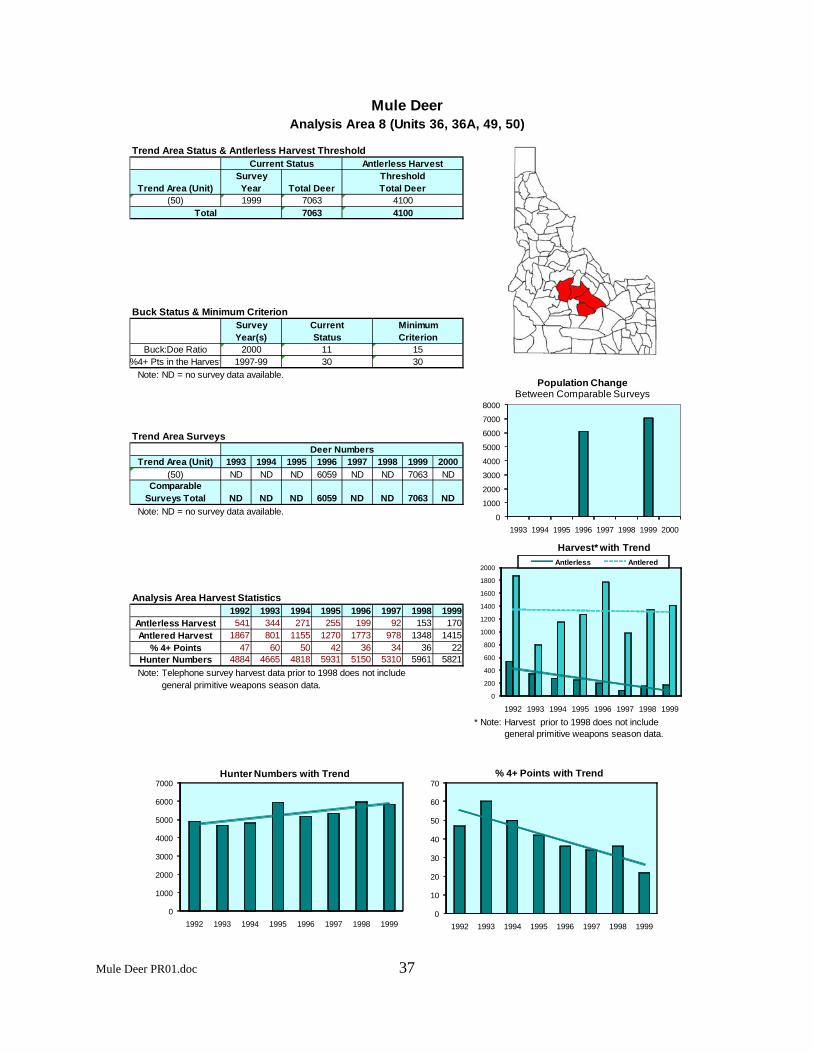
Mule DeerAnalysis Area 8 (Units 36, 36A, 49, 50)
Note: ND = no survey data available.
Trend Area Surveys
1993 1994 1995 1996 1997 1998 1999 2000ND ND ND 6059 ND ND 7063 ND
ND ND ND 6059 ND ND 7063 NDNote: ND = no survey data available.
1992 1993 1994 1995 1996 1997 1998 1999
37
541 344 271 255 199 921867 801 1155 1270 1773 978
47 60 50 42 36 344884 4665 4818 5931 5150 5310
153 1701348 1415
36 225961 5821
Note: Telephone survey harvest data prior to 1998 does not include general primitive weapons season data.
* Note: Harvest prior to 1998 does not include general primitive weapons season data.
Buck Status & Minimum Criterion
Trend Area (Unit)(50)
MinimumCriterion
Buck:Doe Ratio%4+ Pts in the Harvest
20001997-99
1130
ComparableSurveys Total
Deer Numbers
7063(50)
Total1999
1530
SurveyYear(s)
CurrentStatus
41007063
ThresholdSurveyYear Total Deer Total Deer
Trend Area Status & Antlerless Harvest Threshold
4100
Hunter Numbers
Antlered Harvest
Analysis Area Harvest Statistics
% 4+ Points
Antlerless Harvest
Trend Area (Unit)
Current Status Antlerless Harvest
0
1000
2000
3000
4000
5000
6000
7000
8000
1993 1994 1995 1996 1997 1998 1999 2000
Population ChangeBetween Comparable Surveys
0
200
400
600
800
1000
1200
1400
1600
1800
2000
1992 1993 1994 1995 1996 1997 1998 1999
Harvest* with TrendAntlerless Antlered
0
10
20
30
40
50
60
70
1992 1993 1994 1995 1996 1997 1998 1999
% 4+ Points with Trend
0
1000
2000
3000
4000
5000
6000
7000
1992 1993 1994 1995 1996 1997 1998 1999
Hunter Numbers with Trend
Mule Deer PR01.doc

ANALYSIS AREA 9 (UNITS 29, 37, 37A, 51, 58W)
Management Objectives The objectives for these units are to maintain a minimum of 15 bucks per 100 does in post-season surveys and to maintain 30% >4-point bucks in the harvest. When estimated deer numbers exceed 1,300 in the Unit 51/58W trend area and 1,000 in the Unit 29 trend area, antlerless seasons will be considered. Historical Perspective Mule deer were scarce and harvests low for much of the early part of the 20th century. By midcentury mule deer had become the predominant big game animal. Once known for productive mule deer populations, particularly in the Pahsimeroi and Little Lost valleys, these units yielded very large mule deer harvests in the 1950s and 1960s. By the 1970s harvests had dropped by two-thirds as more conservative management strategies were implemented. Despite 2 decades of very conservative antlerless harvests and increasingly conservative buck seasons, mule deer populations have failed to return to their previous high densities and are stable to declining. Although deer herds declined well before any significant increase in elk numbers, current high elk densities may be contributing to suppressed deer populations. Habitat Issues Much of the land in these units is administered by BLM or USFS, with private lands mostly restricted to valley bottoms. Cattle ranching, livestock grazing, and recreation are dominant human uses of the landscape. The Analysis Area is generally arid; forage production and deer harvest can be strongly influenced by growing season precipitation. Deer depredations on agricultural crops are common in Units 29, 37, and 37A and are especially pronounced in dry years. Depredations in Units 51 and 58 are limited. Habitat ultimately determines deer densities and productivity. However, specific limiting factors within the habitat are poorly understood. In some areas deer winter in mature stands of mountain mahogany that appear relatively stagnant and unproductive. Winter range shrub stands in parts of the Little Lost Valley have been lost or degraded. Elk and livestock may have removed much of the mahogany canopy within reach of deer. Forests are slowly encroaching into shrub and grassland communities. Spread of noxious weeds such as knapweed and leafy spurge could ultimately have significant impacts on winter range productivity. Biological Issues
38
Very little aerial survey data has been collected in these units in recent years. There is a contrast in harvest trends within this group of units. Buck harvest in the southern unit (51) averaged 184 from 1981-1985; then increased 80% to average 331 during 1986-1990; then dropped back to 211 during 1991-1995 and 178 during 1996-2000. In contrast, buck harvest in the northern units (29, 37, 37A) averaged 618 during 1981-1985; then increased only 6% to 653 during 1986-1990; and then declined to an average 412 bucks during 1991-1995 and 309 bucks during 1996-2000. Mule Deer PR01.doc
Interspecific Issues Current high elk densities may be having some impact on the area's capacity to produce deer. White-tailed deer, a potentially strong competitor, are mostly restricted to private agricultural lands along major riparian areas. In some limited areas, mountain goats and mule deer may be competing for the same mountain mahogany winter ranges. Pronghorn antelope and bighorn sheep also share the range, but generally overlap little with mule deer. Livestock rangeland grazing, another potential source of competition, has generally been reduced in recent years, but some competition probably still exists, particularly in the moister summer range habitats. Predation Issues Black bear densities appear to be low and stable. Mountain lion densities are low to moderate and appear to have increased in Units 29, 37, and 37A in recent years, probably at least in part due to increased elk densities. Coyotes are common and have an unknown impact on deer populations. Bobcats, red fox, and golden eagles also occur in the area but are not thought to account for significant predation on deer. Wolves were observed in parts of the analysis area, but appeared to be primarily transient. Winter Feeding Issues Because this is an arid area with relatively little snowfall, winter feeding has not occurred in these units in recent years. Information Requirements Survey data on mule deer herd sex and age composition and trends in deer numbers have not been consistently collected in the past and are inadequate. Impacts of elk on mule deer production and survival are suspected but unknown. The most productive deer herds are those maintained at a level well below carrying capacity (at which point recruitment equals mortality and there is no harvestable surplus). Better information is needed to identify appropriate deer densities that will maintain optimum productivity and harvest. Migratory patterns are largely unknown.
Mule Deer PR01.doc 39

Mule DeerAnalysis Area 9 (Units 29, 37, 37A, 51)
Trend Area Surveys
1993 1994 1995 1996 1997 1998 1999 2000ND (470) ND ND ND (592) 521 676
ND (470) ND ND ND (592) 521 676Note: ND = no survey data available, estimates within parenthesis
are based on information other than sightability surveys.
1992 1993 1994 1995 1996 1997 1998 1999
40
200 189 327 238 184 98703 549 804 384 545 41034 37 30 17 42 46
1882 2417 2391 2058 2451 2156
37 20445 59538 29
2299 2567Note: Telephone survey harvest data prior to 1998 does not include
general primitive weapons season data.
* Note: Harvest prior to 1998 does not includegeneral primitive weapons season data.
Trend Area Status & Antlerless Harvest Threshold
1000
Hunter Numbers
Antlered Harvest
Analysis Area Harvest Statistics
% 4+ Points
Antlerless Harvest
Trend Area (Unit)
Current Status Antlerless HarvestThresholdSurvey
Year Total Deer Total Deer1000676
676Tendoy (29)
Total2000
1530
SurveyYear(s)
CurrentStatus
20001997-99
1737
ComparableSurveys Total
Deer Numbers
Buck Status & Minimum Criterion
Trend Area (Unit)Tendoy (29)
MinimumCriterion
Buck:Doe Ratio%4+ Pts in the Harvest
0
100
200
300
400
500
600
700
800
1993 1994 1995 1996 1997 1998 1999 2000
Population ChangeBetween Comparable Surveys
0
100
200
300
400
500
600
700
800
900
1992 1993 1994 1995 1996 1997 1998 1999
Harvest* with TrendAntlerless Antlered
0
500
1000
1500
2000
2500
3000
1992 1993 1994 1995 1996 1997 1998 1999
Hunter Numbers with Trend
05
101520253035404550
1992 1993 1994 1995 1996 1997 1998 1999
% 4+ Points with Trend
Mule Deer PR01.doc

ANALYSIS AREA 10 (UNITS 30, 30A, 58E, 59, 59A)
Management Objectives The objectives for these units are to maintain a minimum of 15 bucks per 100 does in post-season surveys and to maintain at least 30% four-point bucks in the harvest. When estimated deer numbers exceed 1,400 in the Unit 58/59A trend area and 1,200 in the Unit 30/30A trend area, general antlerless seasons will be considered. Historical Perspective Mule deer were scarce and harvests low for much of the early part of this century. Parts of some units were designated as no hunting "game preserves." By mid-century, mule deer had become the predominant big game animal. These units produced high mule deer harvests in the 1950s and 1960s. By the 1970s harvests had dropped by one-half as more conservative management strategies were implemented. Despite two decades of very conservative antlerless harvests and increasingly conservative buck seasons, mule deer harvests have remained relatively stable since the early 1970s in Units 30 and 30A and since the early 1980s in Units 58, 59, and 59A. Although deer herds declined well before any significant increase in elk numbers, current high elk densities may well be helping to suppress deer populations in Units 30 and 30A. Further south in Units 58, 59, and 59A where elk densities have also increased substantially, trend counts suggest that deer populations are now at or slightly above late 1960s levels. Many of these deer, particularly in the Lemhi Valley, migrate to higher quality summer ranges in Montana, returning to Idaho winter ranges in November. Habitat Issues The BLM or Forest Service administers much of the land in these units, with private lands mostly restricted to the valley bottoms. Cattle ranching, livestock grazing, and recreation are the dominant human uses of the landscape in these units. This is in a generally arid region where forage production and deer harvest can be strongly influenced by growing season precipitation. Deer depredations on agricultural crops are common and are especially pronounced in dry years in Units 30 and 30A, but have not been a problem in Units 58, 59, and 59A. Habitat ultimately determines deer densities and productivity. However, specific limiting factors within the habitat are poorly understood. In some areas deer winter in mature stands of mountain mahogany which appear to have become relatively stagnant and unproductive. Elk and livestock may have removed much of the mahogany canopy within reach of deer. Forests are slowly encroaching into shrub and grassland communities. The spread of noxious weeds such as knapweed and leafy spurge could ultimately have significant impacts on winter range productivity.
41
Traditionally, deer in Units 58, 59, and 59A concentrate on winter ranges at the south end of the Beaverhead Range. Heavy snows in the late 1960s placed tremendous pressure on very narrow portions of these units, killing many browse plants. Winter range habitat condition is still poor to fair for may of the bitterbrush and mountain mahogany stands important to wintering deer. Mule Deer PR01.doc

Mountain mahogany, the primary winter browse species, is still heavily hedged with little regeneration. Winter domestic sheep grazing is contributing to this overuse. Biological Issues This analysis area contains two trend areas: Leadore (Units 30/30A) in the Salmon Region and Reno Point (Units 58/59A) in the Upper Snake Region. Total deer estimated in 2001 for both areas combined (3,237) exceeded the antlerless harvest threshold of 2,600. However, neither of the two management objectives (minimum of 15 bucks per 100 does post-season and at least 30% of the buck harvest being >4 point) was met. Composition counts resulted in an estimate of 11 bucks per 100 does and the percent >4 points in the buck harvest for 1998-2000 was 26. Consequently, the Salmon Region units will maintain an October 5-22 general season open for antlered deer only in 2001. The general season for Units 58, 59, and 59A in the Upper Snake Region will run from October 5-31 for antlered deer only and the controlled either sex hunt was eliminated for 2001. Interspecific Issues Current high elk densities in Units 30 and 30A may be having some impact on the area's capacity to produce deer. However, this is not believed to be a problem in Units 58, 59, and 59A because deer and elk appear to use different winter and summer ranges. It should be noted, however, that deer-elk interactions are not well understood. White-tailed deer, a potentially strong competitor, are mostly restricted to private agricultural lands along the major riparian areas. In some limited areas, mountain goats and mule deer may be competing for the same mountain mahogany winter ranges. Antelope and bighorn sheep also share the range but generally overlap little with mule deer. Livestock rangeland grazing, another potential source of competition, has generally been reduced in recent years, but is still a concern on the southern winter ranges. Predation Issues Black bear densities appear to be low and stable. Mountain lion densities are low to moderate and appear to have increased in recent years in Units 30 and 30A, probably at least in part due to increased elk densities. Coyotes are common and have an unknown impact on deer populations. Bobcats, red fox, and golden eagles also occur in the area but are not thought to cause significant predation on deer. Winter Feeding Issues Winter feeding has not occurred in these units in the past few years.
Mule Deer PR01.doc 42

Information Requirements Survey data on mule deer herd sex and age composition and trends in deer numbers have been inadequate in this analysis area but are improving. Impacts of elk on mule deer production and survival are suspected but unknown. The most productive deer herds are those maintained at a level well below carrying capacity (at which point recruitment equals mortality and there is no harvestable surplus). Better information is needed to identify the appropriate deer densities to maintain optimum productivity and harvest. Although strong interstate movements have been suspected, very little information exists on migration patterns. The Reno Point trend area was included in the Upper Snake Region’s fawn mortality work starting in 2000-2001. Telemetry results will provide information on movement patterns of deer from this winter range.
Mule Deer PR01.doc 43

Mule DeerAnalysis Area 10 (Units 30, 30A, 58, 59, 59A)
Trend Area Surveys
1993 1994 1995 1996 1997 1998 1999 2000ND ND 1422 ND ND ND ND 1016ND (892) ND 1080 ND ND ND 1264
(663) ND ND ND (910) ND 1411 1587
(663) ND ND ND (910) ND 1411 1587Note: ND = no survey data available, estimates within parenthesis
are based on information other than sightability surveys.
1992 1993 1994 1995 1996 1997 1998 1999
44
202 231 286 119 470 134485 502 941 585 712 52444 39 34 43 35 23
1632 2387 2821 2284 2719 2928
85 86446 57125 18
2328 2423Note: Telephone survey harvest data prior to 1998 does not include
general primitive weapons season data.
* Note: Harvest prior to 1998 does not include general primitive weapons season data.
ComparableSurveys Total
Leadore (30/30A)
Deer Numbers
1530
Buck Status & Minimum Criterion
Trend Area (Unit)(58)
(59/59A)
MinimumCriterion
Buck:Doe Ratio%4+ Pts in the Harvest
SurveyYear(s)
CurrentStatus
1022
20001997-99
3867
(58)(59/59A)
Leadore (30/30A)Total
200020002000
110010001200
101612641587
ThresholdSurveyYear Total Deer Total Deer
Trend Area Status & Antlerless Harvest Threshold
3300
Hunter Numbers
Antlered Harvest
Analysis Area Harvest Statistics
% 4+ Points
Antlerless Harvest
Trend Area (Unit)
Current Status Antlerless Harvest
0200400600800
10001200140016001800
1993 1994 1995 1996 1997 1998 1999 2000
Population ChangeBetween Comparable Surveys
0
100
200
300
400
500
600
700
800
900
1000
1992 1993 1994 1995 1996 1997 1998 1999
Harvest* with TrendAntlerless Antlered
0
500
1000
1500
2000
2500
3000
3500
1992 1993 1994 1995 1996 1997 1998 1999
Hunter Numbers with Trend
05
101520253035404550
1992 1993 1994 1995 1996 1997 1998 1999
% 4+ Points with Trend
Mule Deer PR01.doc
ANALYSIS AREA 11 (UNITS 38)
Management Objectives The objective is to maintain the deer population at, or below, its current level. The area is not likely to become a major deer hunting destination. With limited sportsman's desire for hunting in this unit, minimizing agricultural depredation is the major goal. Historical Perspective This unit contains the irrigated farmland and orchards in the Treasure Valley. There is some high desert habitat in the Snake River Birds of Prey Area. The majority of the deer are associated with the Boise, Snake, and Payette River corridors and nearby orchards and vineyards. With the density of residences and developed agricultural properties in the area big game hunters have been restricted to short range weapons. The portion of Unit 32 in the Emmett Valley has similar characteristics to Unit 38 and is managed under the same management goals. Relatively few hunters specifically plan their deer hunts for Unit 38. Most deer are harvested incidentally to upland bird or waterfowl hunting. The current season is either-sex, short-range weapons only, for 50 days. The harvest has remained about 200 deer. Habitat Issues The majority of land is in private ownership. High value crops produced by agriculture make deer depredations a major factor. Deer depredation complaints are common. Depredation hunts and kill permits are used on a regular basis in this area. Biological Issues The agricultural nature of this unit provides excellent habitat for good deer production. Good deer production is not desired in this unit due to the high incident of deer depredation. Deer populations in this unit are managed with liberal seasons to maintain low densities. Interspecific Issues Mule deer are the primary species in the unit. White-tailed deer were reintroduced onto the C.J. Strike and Fort Boise WMA's in the 1980s. The white-tailed deer are well established and contributing to some depredation problems. Predation Issues Coyotes, bobcats, domestic dogs, and some mountain lions are the significant large predators in this area. There are no wolves or black bears in the area. The impact of predators on the deer is largely unknown, but does not present a major management issue.
Mule Deer PR01.doc 45

Winter Feeding Issues Winter feeding has not been required in this area because of the mild climate in the Treasure Valley. Information Requirements This area will not be managed to provide a significant amount of deer hunting opportunity. The primary need for deer management in this area is techniques to limit damage to agricultural crops in an economically realistic way.
Mule Deer PR01.doc 46

Mule DeerAnalysis Area 11 (Unit 38)
Note: ND = no survey data available, NA = not applicable.
Note: ND = no survey data available, estimates within parenthesis are based on information other than sightability surveys.
Trend Area Surveys
1993 1994 1995 1996 1997 1998 1999 2000ND ND ND ND ND ND ND ND
ND ND ND ND ND ND ND NDNote: ND = no survey data available.
1992 1993 1994 1995 1996 1997 1998 1999
47
34 32 86 34 20 8360 32 100 118 20 11114 0 0 43 0 55
140 312 299 458 258 535
72 21372 13436 14
427 860Note: Telephone survey harvest data prior to 1998 does not include
general primitive weapons season data.
* Note: Harvest prior to 1998 does not include general primitive weapons season data.
Trend Area Status & Antlerless Harvest Threshold
NA
Hunter Numbers
Antlered Harvest
Analysis Area Harvest Statistics
% 4+ Points
Antlerless Harvest
Trend Area (Unit)
Current Status Antlerless HarvestThresholdSurvey
Year Total Deer Total DeerNAND
NDND
TotalND
NA25
SurveyYear(s)
CurrentStatus
ND1997-99
ND
ComparableSurveys Total
Deer Numbers
Buck Status & Minimum Criterion
Trend Area (Unit)ND
MinimumCriterion
Buck:Doe Ratio%4+ Pts in the Harvest
00.10.20.30.40.50.60.70.80.9
1
1993 1994 1995 1996 1997 1998 1999 2000
Population ChangeBetween Comparable Surveys
0
50
100
150
200
250
1992 1993 1994 1995 1996 1997 1998 1999
Harvest* with TrendAntlerless Antlered
0100200300400500600700800900
1000
1992 1993 1994 1995 1996 1997 1998 1999
Hunter Numbers with Trend
0
10
20
30
40
50
60
1992 1993 1994 1995 1996 1997 1998 1999
% 4+ Points with Trend
Mule Deer PR01.doc
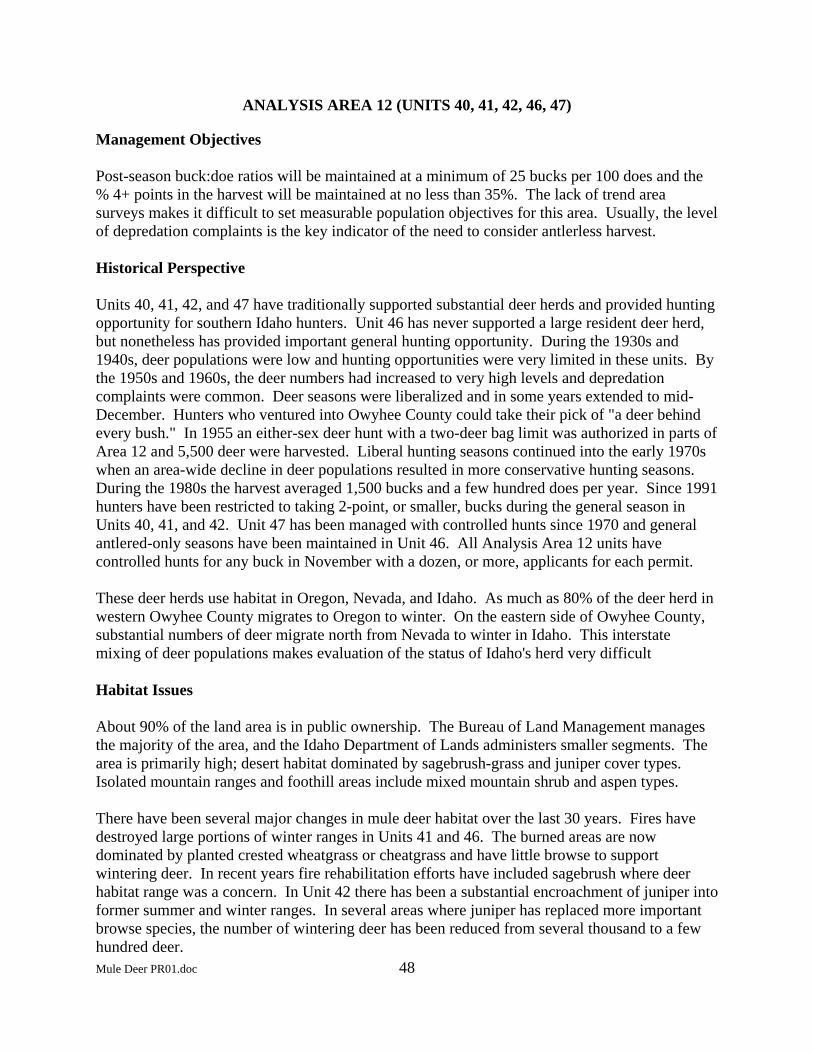
ANALYSIS AREA 12 (UNITS 40, 41, 42, 46, 47)
Management Objectives Post-season buck:doe ratios will be maintained at a minimum of 25 bucks per 100 does and the % 4+ points in the harvest will be maintained at no less than 35%. The lack of trend area surveys makes it difficult to set measurable population objectives for this area. Usually, the level of depredation complaints is the key indicator of the need to consider antlerless harvest. Historical Perspective Units 40, 41, 42, and 47 have traditionally supported substantial deer herds and provided hunting opportunity for southern Idaho hunters. Unit 46 has never supported a large resident deer herd, but nonetheless has provided important general hunting opportunity. During the 1930s and 1940s, deer populations were low and hunting opportunities were very limited in these units. By the 1950s and 1960s, the deer numbers had increased to very high levels and depredation complaints were common. Deer seasons were liberalized and in some years extended to mid-December. Hunters who ventured into Owyhee County could take their pick of "a deer behind every bush." In 1955 an either-sex deer hunt with a two-deer bag limit was authorized in parts of Area 12 and 5,500 deer were harvested. Liberal hunting seasons continued into the early 1970s when an area-wide decline in deer populations resulted in more conservative hunting seasons. During the 1980s the harvest averaged 1,500 bucks and a few hundred does per year. Since 1991 hunters have been restricted to taking 2-point, or smaller, bucks during the general season in Units 40, 41, and 42. Unit 47 has been managed with controlled hunts since 1970 and general antlered-only seasons have been maintained in Unit 46. All Analysis Area 12 units have controlled hunts for any buck in November with a dozen, or more, applicants for each permit. These deer herds use habitat in Oregon, Nevada, and Idaho. As much as 80% of the deer herd in western Owyhee County migrates to Oregon to winter. On the eastern side of Owyhee County, substantial numbers of deer migrate north from Nevada to winter in Idaho. This interstate mixing of deer populations makes evaluation of the status of Idaho's herd very difficult Habitat Issues About 90% of the land area is in public ownership. The Bureau of Land Management manages the majority of the area, and the Idaho Department of Lands administers smaller segments. The area is primarily high; desert habitat dominated by sagebrush-grass and juniper cover types. Isolated mountain ranges and foothill areas include mixed mountain shrub and aspen types.
48
There have been several major changes in mule deer habitat over the last 30 years. Fires have destroyed large portions of winter ranges in Units 41 and 46. The burned areas are now dominated by planted crested wheatgrass or cheatgrass and have little browse to support wintering deer. In recent years fire rehabilitation efforts have included sagebrush where deer habitat range was a concern. In Unit 42 there has been a substantial encroachment of juniper into former summer and winter ranges. In several areas where juniper has replaced more important browse species, the number of wintering deer has been reduced from several thousand to a few hundred deer. Mule Deer PR01.doc

Biological Issues Very little mule deer aerial survey data exists for this zone. Interspecific Issues Currently, elk populations are relatively small in this area. There are fewer than a hundred elk east of Highway 51 and about 600 elk on the west side of Owyhee County. This elk herd will be managed to maintain the current population level and it is not anticipated that elk populations will constitute a significant management concern for mule deer. Livestock grazing is and has been the predominant land use in the area. In the early part of the century, excessive grazing by livestock combined with fire suppression severely altered plant communities to favor shrubs and mule deer benefited. Extensive areas have burned during the past several decades and much of the sagebrush steppe was reseeded to crested wheatgrass to benefit livestock grazing or was invaded by cheatgrass. The reestablishment of sagebrush in many areas will likely conflict with livestock grazing interests. Livestock numbers are currently significantly less than during the early part of the century. Serious conflicts are localized on winter ranges and critical riparian areas rather than widespread. Predation Issues Coyotes, bobcats, and mountain lions are the large predators in this area. The mountain lion population increased during the late 1980s and early 1990s when deer numbers were high and remain healthy. In local areas, mountain lion and coyote predation could have some impact on the deer population but the relationship is poorly understood. There are no wolves or black bears in the area. Winter Feeding Issues The remoteness of winter deer herds has limited the demand for and the ability to conduct supplemental winter feeding. No winter feeding has occurred for many years in these units. The Department will work with the Regional Winter Feeding Advisory Committee to discourage unsanctioned winter feeding and to identify any situations where feeding may be appropriate. Information Requirements The primary data need for these units is population information. The winter ranges contain some mixture of deer from Oregon/Idaho or Nevada/Idaho. The herds can be surveyed in the winter, but status of these wintering animals needs to be allocated to the appropriate hunting season herds. This lack of population information on these important deer herds is a concern to managers.
Mule Deer PR01.doc 49

Mule DeerAnalysis Area 12 (Units 40, 41, 42, 46, 47)
Note: ND = no survey data available, NA = not applicable.
Note: ND = no survey data available.
Trend Area Surveys
1993 1994 1995 1996 1997 1998 1999 2000ND ND ND ND ND ND ND ND
ND ND ND ND ND ND ND NDNote: ND = no survey data available.
1992 1993 1994 1995 1996 1997 1998 1999
50
452 326 33 29 70 139663 782 1253 1018 812 148254 57 60 64 57 48
2859 3310 3313 3050 2841 4450
45 261152 140536.8 283862 3937
Note: Telephone survey harvest data prior to 1998 does not include general primitive weapons season data. %4+ points does not include 2-point only hunts.
* Note: Harvest prior to 1998 does not include general primitive weapons season data.
Buck Status & Minimum Criterion
Trend Area (Unit)ND
MinimumCriterion
Buck:Doe Ratio%4+ Pts in the Harvest
ND1997-99
ND
ComparableSurveys Total
Deer Numbers
NDND
TotalND
2535
SurveyYear(s)
CurrentStatus
NAND
ThresholdSurveyYear Total Deer Total Deer
Trend Area Status & Antlerless Harvest Threshold
NA
Hunter Numbers
Antlered Harvest
Analysis Area Harvest Statistics
% 4+ Points
Antlerless Harvest
Trend Area (Unit)
Current Status Antlerless Harvest
00.10.20.30.40.50.60.70.80.9
1
1993 1994 1995 1996 1997 1998 1999 2000
Population ChangeBetween Comparable Surveys
-200
0
200
400
600
800
1000
1200
1400
1600
1992 1993 1994 1995 1996 1997 1998 1999
Harvest* with TrendAntlerless Antlered
0500
100015002000250030003500400045005000
1992 1993 1994 1995 1996 1997 1998 1999
Hunter Numbers with Trend
0
10
20
30
40
50
60
70
1992 1993 1994 1995 1996 1997 1998 1999
% 4+ Points with Trend
Mule Deer PR01.doc

ANALYSIS AREA 13 (UNITS 53)
Management Objectives The objective for Analysis Area 13 is to maintain a small resident population of mule deer compatible with the area's agriculture. Current hunting season frameworks appear to be accomplishing this objective. Given the limited priority placed on managing for mule deer, no trend area will be established. Historical Perspective It has been reported that mule deer were relatively abundant in Unit 53 around 1900. However, deer habitat was substantially altered with human settlement, which brought an increase in range fires and the development of large-scale irrigation projects. Today more than half of Unit 53 is irrigated farmland. The northern portion of the unit contains an extensive tract of land managed by the Bureau of Land Management (BLM) primarily for livestock grazing. Much of the BLM lands have been reseeded to crested wheatgrass reducing their value for mule deer. Unit 53 currently has a small resident deer population and cannot support many deer without unacceptable conflicts with agriculture. Depredation complaints from orchards in the Snake River canyon are common. Unit 53 has some importance as winter range for mule deer from units to the north. Movement of deer into Unit 53 during winter was first noted in the early 1980s following extensive fires and loss of sagebrush habitat in Unit 52A. The number of wintering deer varies considerably depending on winter severity and snow depths. During the 1985-1986 winters, more than 3,000 mule deer moved into Unit 53 and resulted in 54 depredation complaints. Harvest management is currently designed to keep resident deer numbers low. Short-range weapon hunting on the west side of the unit has been successful in minimizing complaints from orchard owners. On the east side of the unit, a liberal 4-month archery season allows a substantial amount of hunting opportunity close to the region's population centers. Habitat Issues Lands administered by the BLM provide important winter habitat, especially during severe winters when large numbers of deer are present. Because of the potential for considerable depredation problems on private lands, BLM lands have added value for wintering deer. Sagebrush removal projects to maintain crested wheatgrass seeding for livestock grazing may become an issue on some grazing allotments. As sagebrush reestablishes on burned areas in Unit 52A, the need for maintaining winter habitat in Unit 53 may lessen. Biological Issues No population monitoring is conducted in this unit.
Mule Deer PR01.doc 51

Interspecific Issues There are no competitive concerns with the few elk and antelope that occur in Unit 53. Heavy livestock use in some areas has the potential to be a problem in those winters when large numbers of mule deer move into Unit 53. Predation Issues Coyotes are the only important predators of deer present in substantial numbers; a few mountain lions inhabit the unit primarily in the Snake River Canyon. Predation is not a major issue because the objective is to maintain only a small resident deer population and large numbers of wintering deer occur in the unit infrequently. Winter Feeding Issues Winter feeding was conducted during the 1985-1986 winter in an attempt to help reduce winter losses and keep deer away from roads where collisions with vehicles were common. The Department will work closely with the Regional Winter Feeding Advisory Committee to evaluate any future supplemental feeding issues. Information Requirements None.
Mule Deer PR01.doc 52

Mule DeerAnalysis Area 13 (Unit 53)
Note: ND = no survey data available, NA = not applicable.
Note: ND = no survey data available, NA = not applicable.
Trend Area Surveys
1993 1994 1995 1996 1997 1998 1999 2000ND ND ND ND ND ND ND ND
ND ND ND ND ND ND ND NDNote: ND = no survey data available.
1992 1993 1994 1995 1996 1997 1998 1999
53
105 10 0 17 20 9 32 3370 65 43 17 20 111 66 6713 67 0 0 0 33 39 40
481 172 128 85 318 599 827 706Note: Telephone survey harvest data prior to 1998 does not include
general primitive weapons season data.
* Note: Harvest prior to 1998 does not include general primitive weapons season data.
Trend Area Status & Antlerless Harvest Threshold
NA
Hunter Numbers
Antlered Harvest
Analysis Area Harvest Statistics
% 4+ Points
Antlerless Harvest
Trend Area (Unit)
Current Status Antlerless HarvestThresholdSurvey
Year Total Deer Total DeerNAND
NDND
TotalND
NA15
SurveyYear(s)
CurrentStatus
ND1997-99
ND
ComparableSurveys Total
Deer Numbers
Buck Status & Minimum Criterion
Trend Area (Unit)ND
MinimumCriterion
Buck:Doe Ratio%4+ Pts in the Harvest
00.10.20.30.40.50.60.70.80.9
1
1993 1994 1995 1996 1997 1998 1999 2000
Population ChangeBetween Comparable Surveys
0
20
40
60
80
100
120
1992 1993 1994 1995 1996 1997 1998 1999
Harvest* with TrendAntlerless Antlered
0
100
200
300
400
500
600
700
800
900
1992 1993 1994 1995 1996 1997 1998 1999
Hunter Numbers with Trend
0
10
20
30
40
50
60
70
80
1992 1993 1994 1995 1996 1997 1998 1999
% 4+ Points with Trend
Mule Deer PR01.doc

ANALYSIS AREA 14 (UNITS 54, 55, 57)
Management Objectives The objective for Analysis Area 14 is to restrict antlerless harvest when trend area populations are less than 3,200 deer; conversely, antlerless harvest will be considered when deer numbers exceed this threshold value. This value represents an intermediate population size between current status and numbers observed during the late 1980s and early 1990s when deer populations were considered higher than could be sustained with existing habitat conditions and depredation levels. Deer populations will be managed to maintain or exceed 25 bucks per 100 does in the prewinter population and >35% bucks with 4-point or larger antlers in the October harvest. Historical Perspective During the early 1900s mule deer populations in Analysis Area 14 were very low, due in part to unregulated harvest. During the late 1800s and early 1900s, heavy use by domestic livestock greatly altered the habitat. Dense shrubs fields, dominated by sagebrush and bitterbrush, replaced plant communities dominated by grasses. This change in habitat set the stage for dramatic increases in deer numbers. Closed hunting seasons from 1909-1935 and very conservative seasons through 1940 helped allow deer populations to increase. By 1950 deer numbers had reached an estimated 20,000 head in Unit 54 and winter ranges were considered severely over browsed. Efforts were made to reduce deer populations with both general and controlled season frameworks. Following a significant decline in numbers during the mid-1970s, deer populations increased again during the late 1980s, a period of prolonged drought conditions and mild winters. During the winter of 1992-1993, deer populations declined by an estimated 35-40%. Deer had entered the winter in poor physiological condition and high overwinter fawn mortality occurred. Since 1993 deer numbers have remained at relatively low levels despite favorable climatic conditions and conservative hunting seasons. Since 1970 this area has been managed exclusively with controlled firearms seasons. These units are very popular with sportsmen desiring quality; high hunter success, low hunter density, and the opportunity to observe many deer. Since the 1993 population decline, antlerless hunts have been eliminated and antlered permits reduced. Segments of the deer populations exhibit interstate movements. In Units 54 and 55, there are migrations south to winter ranges in Nevada and Utah, respectively. Harvest management in Utah and Nevada has been compatible with the Department's management objectives. Important winter ranges in this Analysis Area are: Eightmile (Unit 57), Jim Sage (Unit 55), Willow Creek (Unit 55), Dry Creek (Unit 54) and Sugarloaf (Unit 54). Habitat Issues
54
This Analysis Area is characterized by isolated mountain ranges surrounded by farmland and sagebrush-grass semi-desert. At low to mid elevations, juniper woodlands are common with mixed mountain shrub and aspen communities occurring along riparian areas and on some north- and east-facing slopes. At higher elevations, pockets of conifers (lodgepole pine, Douglas fir, Mule Deer PR01.doc

and subalpine fir) and aspen occur on north- and east-facing aspects and more mesic sites. Primarily the U.S. Forest Service and Bureau of Land Management manage important summer and winter habitats. When deer populations are high, depredation complaints on growing alfalfa are common in Unit 55. Important habitat issues include: 1. Succession, and in some cases heavy livestock use, has caused a general decline in the health of aspen communities. Many stands have become decadent and/or are being replaced by conifers. Where the vigor and size of aspen communities can be improved, prescribed fire should be considered. 2. The quality and quantity of winter habitat is considered to be limiting to mule deer in this Analysis Area. During the past 30 years, fire has altered much of the critical habitat in Unit 54. The loss of extensive bitterbrush stands on the Dry Creek, Sugarloaf, and Buckbrush Flat winter ranges is expected to have long-term negative effects on deer populations. While sagebrush is beginning to reestablish on some of these winter ranges, bitterbrush recovery has been slow or nonexistent. In Unit 55 the distribution and density of juniper has increased on some winter ranges replacing important browse for wintering deer. Management should favor the reestablishment and long-term maintenance of shrubs on winter ranges. Bitterbrush plantings should be undertaken in areas where natural recovery is not evident. In some areas, carefully designed projects to remove junipers by burning or chaining may have long-term benefits for mule deer. 3. Because of the open nature of the habitat and high road densities in some areas, habitat security for deer during the hunting season is considered moderate, although some high security areas exist in all units. Road densities are considered high in Unit 54 and moderate in Units 55 and 57. Several motorized vehicle area closures have been implemented in Unit 54 to provide additional security habitat and nonmotorized hunting opportunity. Additional motorized vehicle restrictions may be recommended to maintain quality hunting opportunity and desired buck age structures in Unit 54. Biological Issues Despite conservative harvest management, deer populations in this Analysis Area have continued to decline since the 1993 winter die-off. Estimated recruitment rates in Unit 54 have averaged only 27% since 1993. Causes for the lowered reproductive performance are unknown. Winter fawn mortality has been average, however, the ratio of fawns entering the winter has been low. From 1974-92, a pre-winter ratio averaged 83 fawns per 100 does compared to 65 fawns per 100 does from 1993-2001. Buck to doe ratios in the Analysis Area are at the objective of 25 bucks per 100 does. Interspecific Issues Elk, black bears, and bighorn sheep were eliminated from these units during the late 1800s and early 1900s. Today, small numbers of elk occur, generally near the Nevada and Utah borders. There are currently no competitive concerns with deer and elk. Deer will maintain management priority over elk in these units, especially if winter distribution between the 2 species overlaps. A small population of California bighorn sheep inhabits the northeast portion of the Sawtooth National Forest in Unit 54 but poses no concern with mule deer management.
Mule Deer PR01.doc 55

Livestock have imposed the major forage demand throughout these units for over a century. Currently, on public lands livestock management is generally compatible with deer habitat management, although heavy livestock use in some localized areas has negative effects. In the past conversion of large areas from native sagebrush/grass communities to crested wheatgrass seeding have had negative effects on deer habitat. Predation Issues Mountain lions, coyotes, and bobcats are potential predators on mule deer in the Analysis Area. Mountain lion populations increased markedly in these units, presumably in response to the high deer populations, in the late 1980s and early 1990s. Mountain lion harvest doubled, depredations on domestic sheep increased, and the frequency of reported mountain lion observations increased substantially. While the relationship between deer and mountain lions is unclear, mountain lions may have played a role in slowing the recovery in the deer herds. There are recent indications from mountain lion hunters and researchers that mountain lion populations have declined, probably in response to the reduced mule deer prey base. Coyote numbers are believed to have increased in the past 30 years; however, they are subject to unregulated hunting and periodic control activities by U.S.D.A. Wildlife Services. The effect, if any, of coyote predation on mule deer population dynamics is unknown. Winter Feeding Issues Supplemental winter feeding of deer has not occurred in the past few years and is not considered an important issue in this Analysis Area. Information Requirements Annual aerial surveys of trend areas are needed to monitor population status in relation to management objectives. Periodic sightability surveys are needed to monitor changes in winter distribution. A better understanding of the relationship between road densities and buck survival during the hunting season would improve our ability to make sound decisions about access and harvest management.
Mule Deer PR01.doc 56

Mule DeerAnalysis Area 14 (Units 54, 55, 57)
Trend Area Surveys
1993 1994 1995 1996 1997 1998 1999 2000ND 1507 1487 1602 1193 972 1031 737ND 928 1167 843 921 773 647 480ND ND 870 ND 773 675 796 1022
ND ND 3524 ND 2887 2420 2474 2239Note: ND = no survey data available.
1992 1993 1994 1995 1996 1997 1998 1999
57
989 1169 786 654 649 310 0 571235 765 810 663 624 680 662 730
38 47 47 40 33 52 33 304315 4066 2536 2534 2270 1865 1727 1718
Note: Telephone survey harvest data prior to 1998 does not include general primitive weapons season data.
* Note: Harvest prior to 1998 does not include general primitive weapons season data.
Trend Area Status & Antlerless Harvest Threshold
3200
Hunter Numbers
Antlered Harvest
Analysis Area Harvest Statistics
% 4+ Points
Antlerless Harvest
Trend Area (Unit)
Current Status Antlerless HarvestThresholdSurvey
Year Total Deer Total Deer14001000800
73748010222239
Sugarloaf (54)Dry Creek (54)Jim Sage (55)
Total
200020002000
2535
SurveyYear(s)
CurrentStatus
Buck:Doe Ratio%4+ Pts in the Harvest
19991997-99
2238
ComparableSurveys Total
Jim Sage (55)
Deer Numbers
Buck Status & Minimum Criterion
Trend Area (Unit)Sugarloaf (54)Dry Creek (54)
MinimumCriterion
0
500
1000
1500
2000
2500
3000
3500
4000
1993 1994 1995 1996 1997 1998 1999 2000
Population ChangeBetween Comparable Surveys
0
200
400
600
800
1000
1200
1400
1992 1993 1994 1995 1996 1997 1998 1999
Harvest* with TrendAntlerless Antlered
0500
100015002000250030003500400045005000
1992 1993 1994 1995 1996 1997 1998 1999
Hunter Numbers with Trend
0
10
20
30
40
50
60
1992 1993 1994 1995 1996 1997 1998 1999
% 4+ Points with Trend
Mule Deer PR01.doc

ANALYSIS AREA 15 (UNITS 52A, 63, 63A, 68, 68A)
Management Objectives Given the low habitat potential for Analysis Area 15 to support high densities of deer and the limited ability to collect reliable population information, the management objective will be to maintain deer and not fall below 30% 4+ points antlered deer in the harvest. No trend area will be established in this Analysis Area. Historical Perspective The deer population probably has changed very little since historic times in this Analysis Area. Accounts of trappers through this area in the mid-1800s indicated that buffalo, elk, antelope, and bighorn sheep were far more common than mule deer. Given the low densities of deer and low priority for deer in this Analysis Area, little data is available to indicate what population trends have occurred through time. Harvest management has been a general hunt format, except for Units 63A and 68A where human safety issues have warranted either archery or short-range weapon hunts. Habitat Issues This Analysis Area primarily is comprised of dry desert shrub types, thus representing a low productivity site. Potential to support high numbers of mule deer is extremely limited. However, agriculture combined with riparian habitats along the Snake River in Units 63A and 68A can provide for high density populations. The BLM administers the majority of the public ground (54% of total area) in Analysis Area 15. Private ground makes up 33% and the Idaho National Environmental and Engineering Laboratory, Fort Hall Indian Reservation, and Craters of the Moon National Park combine for the remaining 12%. Most of the private ground is used for production of row crops and is situated along the Snake River floodplain. Both mule deer and white-tailed deer periodically create depredation concerns within the agricultural zones. Wildfires continue to play a big role with habitat throughout the Analysis Area. In many cases fire has replaced climax sagebrush stands with perennial grasses. Biological Issues The majority of this Analysis Area lacks potential to support good numbers of mule deer. No reliable population information is available to determine changes and/or trends in populations. Mule deer probably increase somewhat during favorable environmental conditions, but can be drastically reduced during significant winter events. White-tailed deer comprise a small percentage of the total deer in this area, and are primarily restricted to the riparian/agriculture habitats of the Snake River floodplain. No information exists as to the trends in composition of mule deer versus white-tailed deer. Mule Deer PR01.doc 58

Interspecific Issues Mule deer share the habitat with livestock, elk, antelope, and white-tailed deer. It is unknown what impacts an increasing elk population or sympatric whitetails may have on mule deer. It is doubtful that antelope have any impact on mule deer population parameters. Much of the Snake River floodplain is used to winter livestock, and in many cases the riparian shrub communities have been significantly degraded. Additionally, a social intolerance for livestock may make much of the riparian habitats unavailable to mule deer during winter months. Predation Issues Coyotes and bobcats are the predominate potential predators of mule deer in this Analysis Area. Trends in bobcat numbers are unknown; it is believed that coyotes have increased over the last 30 years. It is unknown whether coyotes are significantly impacting mule deer population dynamics. Winter Feeding Issues Emergency supplemental feeding has not been conducted in the past few years. However, private feeding operations probably occur periodically. Information Requirements Given the low potential for supporting high numbers of mule deer throughout this Analysis Area, little population information would be warranted. However, some information for Unit 68A, which has high archery participation, would be valuable.
Mule Deer PR01.doc 59

Mule DeerAnalysis Area 15 (Units 52A, 63, 63A, 68, 68A)
Note: ND = no survey data available, NA = not applicable.
Note: ND = no survey data available, NA = not applicable.
Trend Area Surveys
1993 1994 1995 1996 1997 1998 1999 2000ND ND ND ND ND ND ND ND
ND ND ND ND ND ND ND NDNote: ND = no survey data available.
1992 1993 1994 1995 1996 1997 1998 1999
60
199 129 58 51 20 26295 340 203 154 99 19837 60 25 50 60 37
1188 848 901 490 863 1732
34 92251 36348 23
1460 2566Note: Telephone survey harvest data prior to 1998 does not include
general primitive weapons season data.
* Note: Harvest prior to 1998 does not include general primitive weapons season data.
Buck Status & Minimum Criterion
Trend Area (Unit)ND
MinimumCriterion
Buck:Doe Ratio%4+ Pts in the Harvest
ND1997-99
ND
ComparableSurveys Total
Deer Numbers
NDND
TotalND
NA30
SurveyYear(s)
CurrentStatus
NAND
ThresholdSurveyYear Total Deer Total Deer
Trend Area Status & Antlerless Harvest Threshold
NA
Hunter Numbers
Antlered Harvest
Analysis Area Harvest Statistics
% 4+ Points
Antlerless Harvest
Trend Area (Unit)
Current Status Antlerless Harvest
00.10.20.30.40.50.60.70.80.9
1
1993 1994 1995 1996 1997 1998 1999 2000
Population ChangeBetween Comparable Surveys
0
50
100
150
200
250
300
350
400
1992 1993 1994 1995 1996 1997 1998 1999
Harvest* with TrendAntlerless Antlered
0
500
1000
1500
2000
2500
3000
1992 1993 1994 1995 1996 1997 1998 1999
Hunter Numbers with Trend
0
10
20
30
40
50
60
70
1992 1993 1994 1995 1996 1997 1998 1999
% 4+ Points with Trend
Mule Deer PR01.doc

ANALYSIS AREA 16 (UNITS 60, 60A, 61, 62A)
Management Objectives The management objectives for these units are to maintain a minimum of 15 bucks per 100 does in post-season surveys and to maintain at least 30% ≥4 points or larger bucks in the general season harvest. Additionally, general antlerless harvest opportunity will be encouraged when trend area populations exceed 1,500 deer. Attempts to reduce populations to a level more in balance with available winter range have met with very limited success to date. Conservative antlerless hunting opportunity in surrounding regions has limited management options. Controlled hunts have thus far reduced this population only slightly. Historical Perspective Since the early to mid-1980s, raw counts on the Sand Creek winter range (Unit 60A) indicate that deer populations have at least doubled, steadily increasing from just over 1,300 deer in 1984 to 3,000 or more in 1996, 1997, and 2000. This population has historically been very susceptible to hard winters. Populations have been built rapidly during periods without severe winter conditions only to crash with the next hard winter. Historically, these population reductions have occurred about every 4-6 years. However, the most recent winter that resulted in any significant mortality was 1988-1989. This has undoubtedly contributed to the current high population level. Deer that winter on the Sand Creek winter range summer throughout Units 60, 61, and 62A, resulting in a low deer density. Consequently, hunting pressure in these units is low and dispersed. The only time that hunting pressure is significant on this population is when early snow forces deer down onto their high desert winter range during the general hunt. Habitat Issues The gentle topography lodgepole pine communities of the Island Park caldera and the moderate to steeply-sloped Centennial Mountain Range with lodgepole pine and Douglas-fir communities dominate most of the deer summer range for this group of units. Most of this summer range occurs on lands administered by the U.S. Forest Service. The Sand Creek winter range supports a vegetative complex typical of high desert shrub steppe dominated by sagebrush. Bitterbrush and chokecherry are prominent on areas of stabilized sand. Rocky Mountain juniper is locally abundant. Land ownership consists of a checkerboard of State, BLM, and private property. Cooperative use trade agreements have benefited big game populations on this winter range. Biological Issues Winter deer populations have been very high in this group of units. The current population of about 3,000 deer is the highest level documented for this herd and is double the antlerless harvest threshold of 1,500 total deer. The absence of a severe winter over the last decade has undoubtedly contributed to this increase. Mule Deer PR01.doc 61

The Sand Creek trend area was flown in late March 2001. This green-up timed survey was a departure from historical counts that were conducted while deer were on winter range. The 2001 trend count resulted in an estimate of 1,332 deer, down from the 2,866 estimated the previous winter. It is believed that the 2001 estimate is not an accurate reflection of the status of this population, but is an artifact of the timing of this survey. Deer were already widely dispersed and a significant component of the population was undoubtedly not accounted for on this survey. Future surveys will be conducted earlier, when deer are still on winter range. Both of the management objectives for this analysis area (minimum of 15 bucks per 100 does and at least 30% of the buck harvest being >4 points) were met for this reporting period. Composition counts resulted in an estimate of 20 bucks per 100 does and the percent >4 points in the buck harvest for 1998-2000 was 37. Recruitment data for this trend area indicates the productive nature of this herd with fawn:doe ratios typically in the 80-90 ranges. The fawn:doe ratios for the 2001 survey resulted in an estimate of 81 fawn per 100 does. Interspecific Issues Although deer-elk interactions are not well understood, little evidence exists to support the notion of a negative relationship between mule deer, elk, and moose, as all 3 presently occur at historical high population levels in this group of units. White-tailed deer are found throughout most of the zone but are relatively uncommon. Sheep and cattle grazing occurs throughout this group of units, which could pose some competitive concerns, especially on winter range during drought years. Predation Issues Black bear densities appear to be low and stable in this group of units. Mountain lions are extremely rare. Coyotes are common, especially on the Sand Creek Desert winter range. Wolves recently introduced in Yellowstone National Park may become established in this group of units, which could affect other predators and ungulates. Winter Feeding Issues No Department-sponsored feeding activities occur in this group of units except under emergency situations. However, social pressure to feed deer arises during any winter of average or greater severity. Information Requirements Survey protocol was revised beginning in 2000-2001. Future plans include the continuation of annual composition and trend surveys, utilizing sightability methodology, as specified by the current Mule Deer Management Plan.
Mule Deer PR01.doc 62

Mule DeerAnalysis Area 16 (Units 60, 60A, 61, 62A)
Trend Area Surveys
1993 1994 1995 1996 1997 1998 1999 2000ND 2479 2732 3397 ND 4484 ND 2866
ND 2479 2732 3397 ND 4484 ND 2866Note: ND = no survey data available.
1992 1993 1994 1995 1996 1997 1998 1999
63
225 119 467 153 428 700404 311 636 337 357 30139 49 40 58 56 35
1988 1869 2785 2000 2278 4267
347 317463 40138 43
4559 4748Note: Telephone survey harvest data prior to 1998 does not include
general primitive weapons season data.
* Note: Harvest prior to 1998 does not include general primitive weapons season data.
Trend Area Status & Antlerless Harvest Threshold
1500
Hunter Numbers
Antlered Harvest
Analysis Area Harvest Statistics
% 4+ Points
Antlerless Harvest
Trend Area (Unit)
Current Status Antlerless HarvestThresholdSurvey
Year Total Deer Total Deer15002866
2866Sand Creek (60A)
Total2000
1530
SurveyYear(s)
CurrentStatus
20001997-99
2039
ComparableSurveys Total
Deer Numbers
Buck Status & Minimum Criterion
Trend Area (Unit)Sand Creek (60A)
MinimumCriterion
Buck:Doe Ratio%4+ Pts in the Harvest
0
500
1000
1500
2000
2500
3000
3500
4000
4500
5000
1993 1994 1995 1996 1997 1998 1999 2000
Population ChangeBetween Comparable Surveys
0
100
200
300
400
500
600
700
800
1992 1993 1994 1995 1996 1997 1998 1999
Harvest* with TrendAntlerless Antlered
0500
100015002000250030003500400045005000
1992 1993 1994 1995 1996 1997 1998 1999
Hunter Numbers with Trend
0
10
20
30
40
50
60
70
1992 1993 1994 1995 1996 1997 1998 1999
% 4+ Points with Trend
Mule Deer PR01.doc

ANALYSIS AREA 17 (UNITS 62, 65)
Management Objectives The management objectives for these units are to maintain a minimum of 15 bucks per 100 does in post-season surveys, and to maintain a minimum of 30% 4 point or larger deer in the buck harvest. Additionally, general antlerless harvest will be encouraged when trend area sightability estimates exceed 400 deer. Maintaining this population at a level where it does not cause chronic depredations and subsequent spontaneous deer feeding by private citizens, in Unit 65 particularly is an ongoing priority. Historical Perspective Old records of mule deer in this analysis area are sketchy and inconclusive; however, it is probable that they have always been present in unknown density. Early homesteaders reported that deer were scarce. Mule deer populations throughout the region increased in the l940s and l950s and remained high through the l980s. Severe winters in l988-1989 and l992-1993 probably took much of the recruitment for those years. The population has since remained low, with the exception of the segment, which winters in the Teton River Canyon. The Teton River Canyon deer are primarily winter migrants from Wyoming and their population level is highly subject to the vagaries of winter severity, periodically suffering significant winter kill. Habitat Issues Summer habitat for Analysis Area 17 mule deer is relatively secure and capable of supporting far more animals than is the available winter range. In Unit 65 elevation and associated snow depths have always limited winter range. Additionally, what little winter range existed on private land is currently being developed into home sites. The best winter range in Unit 62 was first inundated by the Teton Dam and then destroyed further by its failure. Some of the area has shown some slow recovery. Biological Issues Regional personnel believe that approximately half of the mule deer that winter in this analysis area spends spring, summer, and fall in Wyoming. This confounds management because the deer often do not enter Idaho until after normal hunting seasons. Keeping this population below a level where they cause depredations to ornamental shrubs in the winter or where they encourage people to provide them food requires cooperative management with Wyoming. Mule deer in this analysis area are currently meeting all management objectives, including those required to allow general antlerless hunting. Management objectives for this analysis area are to maintain a minimum of 15 bucks per 100 does post-season and 30 percent >4 points in the buck harvest. A December composition survey resulted in an estimate of 38 bucks per 100 does and the percent >4 points in the buck harvest for 1998-2000 was 38 for this reporting period.
64
A trend count was conducted in late March and early April 2001. This survey resulted in an estimate of 614 total deer relative to the 400 total deer antlerless harvest threshold. However, Mule Deer PR01.doc

this estimate was down significantly from the 1,626 deer estimated the previous winter (2000). It is believed that the 2001 estimate is not an accurate reflection of the status of this population. It is likely that mild winter/early spring conditions resulted in either deer not coming all the way to the Teton River Canyon winter range or leaving early, prior to the trend survey. Interspecific Issues Mule deer share habitat in this analysis area with elk, moose, white-tailed deer, and high numbers of domestic livestock. Interspecific relationships are not monitored and are poorly understood. White-tailed deer have increased dramatically in Teton Basin over the past 10-15 years and have undoubtedly replaced mule deer in riverine habitats. Elk have also increased over the same time period that mule deer have declined; however, there is no information to demonstrate this represents a cause and effect relationship. Predation Issues There are no known unique or unusual predator issues affecting mule deer populations in this analysis area. Winter Feeding Issues Authentic winter range is limited in this analysis area, particularly in Unit 65. The lowest spot in the unit is above 6,000 feet in elevation. The area has few steep south and west facing slopes. Consequently, winters can be harsh on mule deer and, since home sites and ranches also occupy the winter range, calls to feed the deer are common and private efforts occur frequently. Feeding, either intentionally or incidentally to livestock operations, has produced a rapid growth in the area's white-tailed deer population. Discouraging the start of winter feeding operations in this area requires constant efforts. Information Requirements Survey protocol was revised beginning in 2000-2001. Future plans include the continuation of annual composition and trend surveys, utilizing sightability methodology, as specified by the current Mule Deer Management Plan.
Mule Deer PR01.doc 65

Mule DeerAnalysis Area 17 (Units 62, 65)
Note: ND = no survey data available.
Trend Area Surveys
1993 1994 1995 1996 1997 1998 1999 2000ND ND ND ND ND ND ND 1626
ND ND ND ND ND ND ND 1626Note: ND = no survey data available.
1992 1993 1994 1995 1996 1997 1998 1999
66
93 42 113 34 40 47 15194 72 115 136 20 11163 73 25 25 50 32
707 594 912 695 536 2302
1195 7270 35
1071 1013Note: Telephone survey harvest data prior to 1998 does not include
general primitive weapons season data.
* Note: Harvest prior to 1998 does not include general primitive weapons season data.
Buck Status & Minimum Criterion
Trend Area (Unit)(62)
MinimumCriterion
Buck:Doe Ratio%4+ Pts in the Harvest
20001997-99
3846
ComparableSurveys Total
Deer Numbers
1626Teton River (62)
Total2000
1530
SurveyYear(s)
CurrentStatus
4001626
ThresholdSurveyYear Total Deer Total Deer
Trend Area Status & Antlerless Harvest Threshold
400
Hunter Numbers
Antlered Harvest
Analysis Area Harvest Statistics
% 4+ Points
Antlerless Harvest
Trend Area (Unit)
Current Status Antlerless Harvest
0
200
400
600
800
1000
1200
1400
1600
1800
1993 1994 1995 1996 1997 1998 1999 2000
Population ChangeBetween Comparable Surveys
0
50
100
150
200
250
1992 1993 1994 1995 1996 1997 1998 1999
Harvest* with TrendAntlerless Antlered
0
500
1000
1500
2000
2500
1992 1993 1994 1995 1996 1997 1998 1999
Hunter Numbers with Trend
0
10
20
30
40
50
60
70
80
1992 1993 1994 1995 1996 1997 1998 1999
% 4+ Points with Trend
Mule Deer PR01.doc

ANALYSIS AREA 18 (UNITS 64, 67)
Management Objectives The management objectives for these units are to maintain a minimum of 15 bucks per 100 does in post-season surveys, and to maintain a minimum of 30% 4 point and larger bucks in the general season harvest. Additionally, antlerless harvest will be encouraged when trend area sightability estimates exceed 1,500 deer. Maintaining this population at a level where it does not cause chronic depredations and require winter feeding, particularly in Swan Valley, is an ongoing priority. Historical Perspective Old records of mule deer in this analysis area are sketchy and inconclusive; however, it is probable that they have always been present in unknown density. Early homesteaders reported that deer were scarce. Mule deer populations throughout the region increased in the l940s and l950s and remained high through the l980s. Severe winters in l988-1989 and l992-1993 probably took much of the recruitment for those years. The population has rebounded to levels at or above the long-term average. Liberal general seasons extending tens days into November were offered in these units until l990. The recent philosophy has been to move seasons into October to reduce vulnerability of adult males during the rut. This has been successful in reducing deer harvest and hunter satisfaction. This analysis area offers most of what little backcountry hunting opportunity remains in southeast Idaho Habitat Issues Abundant spring, summer, and fall habitat exists in this zone. Winter range is limited and is more characteristic of mule deer habitat than elk habitat. Winter range has been lost to agriculture, and is currently threatened by proposed homesites. Efforts are underway to inventory both occupied and potential winter range in the zone as part of a strategy to reduce the need for winter feeding. Opportunities to preserve or enhance winter range will be pursued. Winter range on slopes in the vicinity of the mouth of Rainey Creek appears to have suffered from years of overgrazing by elk and mule deer. The west slope of the Palisades Bench and the area between Table Rock Canyon and Kelly Canyon currently winter high concentrations of mule deer. Mature mountain mahogany stands throughout the zone may be providing only limited forage in addition to precluding all but a sparse understory of other species. Some bench areas in the Black Canyon to Wolverine Canyon stretch appear to be converting from a shrub dominated to a grass dominated community. Biological Issues
67
Mule deer in this analysis area are currently meeting management objectives including those required to allow general antlerless harvest. Populations were at or near all time highs prior to the severe l988-1989 and l992-1993 winters. Following a decline of unmeasured magnitude, they have recently recovered to at or above long-term average levels. Distribution has changed particularly at Rainey Creek where it was common to feed up to 500 deer through the l987-1988 winter. Recently there have been fewer than 200 fed at this location. Strategies designed to Mule Deer PR01.doc
increase wintering elk in some parts of the area to offset elimination of the Rainey Creek feed site will need to be carefully monitored to protect existing mule deer populations. Snowmobile activity may be precluding the use of traditional winter range in Canyon Creek. Management objectives for this analysis area are to maintain a minimum of 15 buck per 100 does post-season and 30 percent >4 points in the buck harvest. A December composition survey resulted in an estimate of 25 bucks per 100 does and the percent >4 points in the buck harvest for 1998-2000 was 36 for this reporting period. A late March trend count resulted in an estimate of 1,542 total deer, which exceeds the antlerless harvest threshold of 1,500. Interspecific Issues In addition to mule deer, this analysis area supports a large elk population and numerous moose. Domestic livestock extensively grazes portions of it. Interspecific relationships are not monitored and are poorly understood. If the elk population is not carefully managed, conflicts with deer on winter range could develop. Predation Issues There are no known unique or unusual predator issues affecting mule deer populations in this analysis area. Winter Feeding Issues Mule deer have been fed during severe winters on an emergency basis below the Palisades Bench, near Heise, and in Canyon Creek. They have been fed on a regular basis at the mouth of Rainey Creek along with elk. Plans to eliminate feeding of elk at that site will remove the site's strong attraction to deer and should result in the end of deer feeding as well. With the new and planned homesite developments occurring in Swan Valley, will come new residents tempted to bait or feed deer and elk. All such efforts will be discouraged. Information Requirements Survey protocol was revised beginning in 2000-2001. Future plans include the continuation of annual composition and trend surveys, utilizing sightability methodology, as specified by the current Mule Deer Management Plan.
Mule Deer PR01.doc 68

Mule DeerAnalysis Area 18 (Units 64, 67)
Trend Area Surveys
1993 1994 1995 1996 1997 1998 1999 2000ND ND ND ND ND 4014 ND ND
ND ND ND ND ND 4014 ND NDNote: ND = no survey data available.
1992 1993 1994 1995 1996 1997 1998 1999
69
87 53 58 34 94 33246 171 180 98 139 13157 70 75 47 56 19
1040 1287 1051 856 1354 1666
26 34105 12128 42
1377 1165Note: Telephone survey harvest data prior to 1998 does not include
general primitive weapons season data.
* Note: Harvest prior to 1998 does not include general primitive weapons season data.
Trend Area Status & Antlerless Harvest Threshold
3800
Hunter Numbers
Antlered Harvest
Analysis Area Harvest Statistics
% 4+ Points
Antlerless Harvest
Trend Area (Unit)
Current Status Antlerless HarvestThresholdSurvey
Year Total Deer Total Deer38004014
4014Heise (67)
Total1998
1530
SurveyYear(s)
CurrentStatus
20001997-99
2529
ComparableSurveys Total
Deer Numbers
Buck Status & Minimum Criterion
Trend Area (Unit)Heise (67)
MinimumCriterion
Buck:Doe Ratio%4+ Pts in the Harvest
0
500
1000
1500
2000
2500
3000
3500
4000
4500
1993 1994 1995 1996 1997 1998 1999 2000
Population ChangeBetween Comparable Surveys
0
50
100
150
200
250
300
1992 1993 1994 1995 1996 1997 1998 1999
Harvest* with TrendAntlerless Antlered
0200400600800
10001200140016001800
1992 1993 1994 1995 1996 1997 1998 1999
Hunter Numbers with Trend
0
10
20
30
40
50
60
70
80
1992 1993 1994 1995 1996 1997 1998 1999
% 4+ Points with Trend
Mule Deer PR01.doc

ANALYSIS AREA 19 (UNITS 66, 66A, 69)
Management Objectives The management objectives for these units are to maintain a minimum of 15 bucks per 100 does in post-season surveys, and to maintain a minimum of 30% 4 point and larger bucks in the general season harvest. Additionally, general antlerless harvest will be encouraged when trend area sightability estimates exceed 3,000 deer. Historical Perspective Osbourne Russell did not mention mule deer in this area in the l840s. Since he liked to hunt deer, and noted the presence of other big game in the general area, it is likely deer were not common. Early homesteaders reported that deer were scarce. Mule deer apparently increased during the l940s and l950s, perhaps in response to overgrazing by domestic livestock, which encourages shrubs over grasses. Deer numbers peaked during the late l960s and then declined dramatically. They peaked again during the late l980s and early l990s; then declined again following a severe winter in l992-1993. Recently the population has recovered to the level of the long-term average. Hunting seasons over the years have been adjusted in an attempt to respond to obvious fluctuations in the population. Units 66 and 69 have supported one of the longest running late-season controlled buck hunts in the state. Permits for this hunt have extremely high appeal. Habitat Issues Habitat throughout Analysis Area 19 is or has the potential to be highly productive. The fertile, mineral rich soils of the area produce diverse plant communities including sagebrush-grasslands, extensive aspen patches, and cool moist conifer stands primarily on north and east facing slopes. Terrain is generally mild and much of the private land of the area is dry farmed with cereal grains. Over half of the zone is private land with the balance of public lands administered by the United States Forest Service, Bureau of Land Management, Idaho Department of Lands, and the Idaho Department of Fish and Game. Approximately 250 square miles of the southwest corner of the area is Fort Hall Indian Reservation land. A significant portion of the private land is CRP enrolled and is contributing substantially to the area's carrying capacity during all seasons. The Tex Creek Wildlife Management Area, partially owned and totally managed by the Idaho Department of Fish and Game, provides 30,000 acres of prime winter habitat for mule deer, elk, and moose in the zone. This land was purchased to mitigate for habitat inundated or destroyed by Ririe, Palisades and Teton Dams. Biological Issues Both of the management objectives for this analysis area (minimum of 15 bucks per 100 does post-season and at least 30% of the buck harvest being >4 points) were met for this reporting period. Composition counts resulted in an estimate of 21 bucks per 100 does and the percent >4 points in the buck harvest for 1998-2000 was 41.
Mule Deer PR01.doc 70
A trend count was flown in late March 2001. This survey resulted in an estimate of 2,331 total deer, which is below the 3,508 estimated on the previous survey (1999) and the antlerless harvest threshold of 3,000. It is believed that the 2001 estimate is not an accurate reflection of the status of this population. It is likely that the mild winter/early spring conditions resulted in either deer not coming all the way to the surveyed winter range or leaving early, prior to the trend survey in late March. Mule deer populations were at a historical high in this analysis area when surveyed in February l991. The winter of l992-1993 was severe and significant mortality occurred, especially to fawns. The population rebounded rapidly to long-term average levels, but has not approached the extreme highs of the late l980s and early l990s. If the current series of mild winters continues, this highly productive population will respond positively. Interspecific Issues In addition to mule deer, this analysis area supports a large elk population and numerous moose. Domestic livestock extensively grazes portions of it. Interspecific relationships are not monitored and are poorly understood. If the elk population is not kept in check, conflicts with deer on winter range could develop. Currently, agricultural practices, particularly management of CRP lands, are of greater concern than are potential interspecific conflicts. Predation Issues There are no known unique or unusual predator issues affecting mule deer populations in this analysis area. Winter Feeding Issues Mule deer have not been fed in this analysis area. Feeding should be discouraged in all but extreme emergency conditions. Information Requirements Sightability surveys and harvest reports are needed to monitor status of the population relative to objectives. A comprehensive inventory of winter range quality and quantity including the status and terms of enrollment of CRP lands would be valuable for long-range planning and management. CRP is particularly important because such a large percentage of the analysis area is privately owned. A large-scale conversion from CRP back to cultivated crops could result in significant depredation problems by both mule deer and elk under current population objectives for both species.
Mule Deer PR01.doc 71

Mule DeerAnalysis Area 19 (Units 66, 66A, 69)
Trend Area Surveys
1993 1994 1995 1996 1997 1998 1999 2000ND (3087) ND ND 5914 ND 3508 ND
ND (3537) ND ND 5914 ND 3508 NDNote: ND = no survey data available, estimates within parenthesis
are based on information other than sightability surveys.
1992 1993 1994 1995 1996 1997 1998 1999
72
743 366 270 68 139 93869 465 501 355 411 38965 63 70 56 63 56
4384 4361 3134 2585 2992 4351
29 49353 43048 52
3038 3340Note: Telephone survey harvest data prior to 1998 does not include
general primitive weapons season data.
* Note: Harvest prior to 1998 does not include general primitive weapons season data.
Buck Status & Minimum Criterion
Trend Area (Unit)Tex Creek (69)
MinimumCriterion
Buck:Doe Ratio%4+ Pts in the Harvest
19971997-99
2152
ComparableSurveys Total
Deer Numbers
3508Tex Creek (69)
Total1999
1530
SurveyYear(s)
CurrentStatus
45003508
ThresholdSurveyYear Total Deer Total Deer
Trend Area Status & Antlerless Harvest Threshold
4500
Hunter Numbers
Antlered Harvest
Analysis Area Harvest Statistics
% 4+ Points
Antlerless Harvest
Trend Area (Unit)
Current Status Antlerless Harvest
0
1000
2000
3000
4000
5000
6000
7000
1993 1994 1995 1996 1997 1998 1999 2000
Population ChangeBetween Comparable Surveys
-200
0
200
400
600
800
1000
1992 1993 1994 1995 1996 1997 1998 1999
Harvest* with TrendAntlerless Antlered
0500
100015002000250030003500400045005000
1992 1993 1994 1995 1996 1997 1998 1999
Hunter Numbers with Trend
0
10
20
30
40
50
60
70
80
1992 1993 1994 1995 1996 1997 1998 1999
% 4+ Points with Trend
Mule Deer PR01.doc

ANALYSIS AREA 20 (UNITS 56, 70, 73, 73A)
Management Objectives One objective for Analysis Area 20 is to restrict antlerless harvest when trend area populations are less than 5,700 deer; conversely, liberal antlerless harvest will be encouraged when deer numbers exceed this threshold value. This value represents an intermediate population size between current status and numbers observed during the late 1980s and early 1990s when deer populations were considered higher than could be supported during a normal winter and presented depredation concerns for agricultural producers. Additional objectives include not falling below 15 bucks:100 does post-season and not falling below 30% 4+ points in the harvest. Historical Perspective The mule deer population in Analysis Area 20 (Units 56, 70, 73, and 73A) has fluctuated widely since the mid-1800s. Deer numbers probably declined through the early 1900s, possibly due to unregulated harvest. By 1920 observations of deer were quite rare. Between 1920 and the early 1970s deer numbers increased dramatically, interrupted briefly by significant winter mortality. Following a significant decline in numbers beginning in 1972, numbers again increased until the late 1980s. The population level attained during this second peak probably did not reach that attained during the 1950s-early 1970s. Overall, mule deer numbers in these units appear to be highly volatile, with wide fluctuations over relatively short time periods. Harvest management during the 1950s and 1960s was designed to maintain or reduce deer numbers in response to what was considered overbrowsed winter ranges. Season frameworks in these units have varied considerably more than elsewhere in southeastern Idaho. General seasons have been the rule except in Unit 56, which had controlled hunts from 1970 through 1981. Season lengths have varied from 3 days to 5 weeks. Additionally, either-sex opportunity has ranged from none to extra antlerless-only tags available in 1989 and 1990 for Units 70, 73, and 73A. Following the winter of 1992-1993, when significant winter mortality occurred, harvest management has been conservative. Unit 56 has had a 2-point only general season since 1991 to increase the proportion of mature males in the population. Research in the mid-1980s found very low survival of bucks in Unit 73. A 2-point only regulation was enacted there in 1997 after the buck:doe ratio fell below 10:100. Despite very conservative hunting seasons and low harvest since 1993, wintering populations of deer in Units 70, 73, and 73A have either remained stable at low levels or declined. Major wintering areas in this Analysis Area are: Pauline (Unit 70), Lead Draw to Walker Creek (Unit 70), Elkhorn Mountain (Unit 73), Malad Face (Unit 73), Samaria Mountain (Unit 73), Hansel Mountains (Unit 73), Rockland Valley (Unit 73A), Knox Canyon (Unit 73A), Juniper (Unit 56), the Hagler Canyon complex (Unit 56), and Sweetzer Pass (Unity 56). Habitat Issues
73
This Analysis Area represents the least productive habitats in southeastern Idaho. Low productive habitats combined with variable winter conditions undoubtedly cause mule deer numbers to vary considerably over time. Three main vegetation types predominate: Mule Deer PR01.doc

1) sagebrush-grassland, 2) aspen, and 3) conifer. Other variations of these 3 main types that are important to deer include: mixed shrub communities, Utah juniper, and curlleaf mahogany. The current mix of vegetation cover types is a result of fire suppression efforts and intensive grazing by livestock during the early 1900s. These factors converted what was predominately perennial grass stands into shrublands with depleted or sparse understories. Given that current livestock grazing practices are much more conservative and designed to promote grass and that the current shrublands are aging, it is logical that quality mule deer habitat probably peaked earlier in the century. Additionally, the current conversion of aspen to conifer and replacement of mixed shrub and sagebrush communities by juniper probably will reduce habitat suitability for mule deer. Approximately 41% of the land in this Analysis Area is publicly owned. The BLM and the U.S. Forest Service administer the majority of public land. The Fort Hall Indian Reservation makes up approximately 7%, while the remaining 52% is private ground. The private ground is predominately used for rangeland pasture, small grains, and hay production. A substantial amount of private land has been enrolled in the Conservation Reserve Program. Depredation complaints are generally limited to periods of high deer populations. Predominant land uses of the publicly owned ground include livestock grazing, timber management, and recreation. Of particular concern is the encroachment of human activity, either intense recreational efforts and/or structural developments, in mule deer winter range. Developments from the west side of Pocatello south to Walker Creek in Unit 70 have reduced the potential wintering area for deer. Open habitat types combined with moderate to high road densities, and in some areas unrestricted ATV travel, result in a greater vulnerability standard for mule deer in this Analysis Area. Motorized travel on the Caribou National Forest within this Analysis Area is restricted to designate routes during the snow-free period of the year with the specific purpose of reducing impacts to wildlife habitat and reduced wildlife disturbance. Biological Issues Recruitment rates as evidenced by December/January fawn:doe ratios have ranged from 50-75 over the past few winters. It is believed that 70 fawns:100 does is adequate to maintain populations with normal winter mortality, while increased recruitment is necessary for population growth. Conversely, recruitment rates less than 70:100 are generally consistent with stable to declining populations. Interspecific Issues Although livestock grazes much of the mule deer range in this analysis area, interactions of concern are relatively few and tend to be limited to localized areas. Of primary concern are livestock winter feed lot operations that concentrate deer during winter. Of minor concern are a few localized areas (riparian and winter range) of intense livestock pressure. The current trend of elk occupying mule deer winter ranges is an area of major concern. Some winter ranges in this Analysis Area do not lend themselves to niche separation by the 2 species and therefore either direct resource competition and/or social intolerance will likely impact mule
Mule Deer PR01.doc 74

deer numbers. The Department will seek opportunities to minimize the occupancy by elk in key mule deer winter ranges. Residential, recreational, and associated development has impacted available deer winter ranges, particularly in Unit 70. These impacts have likely had direct effects on numbers of deer, and will be impossible to mitigate. Continued growth of human populations will necessitate the acknowledgment of impacts to wildlife habitat and populations. Predation Issues Potentially major predators of mule deer in this Analysis Area include mountain lions, coyotes, and bobcats. Mountain lion and coyote populations probably have increased during the last 30 years. It is unknown specifically what impact these changing predator systems are having on mule deer population dynamics. Winter Feeding Issues Emergency supplemental feeding of deer occurs periodically; however, these units generally have milder winter conditions then elsewhere in southeastern Idaho. In many cases emergency feeding is initiated after deer have been attracted to cattle feedlot operations or private citizens began feeding deer early in winter. Both of these circumstances probably short-stop deer from reaching more suitable winter range and generally result in high overwinter mortality rates. The Department, working in conjunction with the Winter Feeding Advisory Committee, will discourage livestock operators and other private citizens from encouraging deer use of non-traditional food sources. Mule deer were provided supplemental winter feed at a Department-sanctioned, Commission-approved feed site east of Stone (Unit 56) during 12 of 15 winters between 1974 and 1988. An estimated 500-1,400 deer were fed annually. The feeding was initiated following the construction of Interstate 84 that blocked the traditional migration of deer from Unit 56 to winter ranges on the south end of Black Pine Mountain (Unit 57) and the east end of the Raft River range in Utah. In the early 1950s it was estimated that more than 4,000 deer from Unit 56 made the migration. During the open winters associated with the prolonged drought of the late 1980s, deer did not concentrate near the state line for several consecutive years and the feeding operation was permanently closed down. Unit 56 will be managed for the number of deer that can be supported on winter ranges without an annual winter feeding effort. Information Requirements The Department will explore various means of better quantifying overwinter mortality so that harvest recommendations are more responsive to changing populations. Recent observed recruitment rates are consistent with either stable or slightly declining populations. A better understanding of factors affecting recruitment rates is needed.
Mule Deer PR01.doc 75

Although habitat succession and change are occurring, it is unknown what specific impacts will occur to deer populations. Furthermore, it is unknown whether the aging of current mule deer habitat leads to ultimately less productive and nutritious vegetation. Given that predator and elk populations and habitat have changed over time, a better understanding of the interrelationships and ecological processes governing mule deer population dynamics would greatly aid in management recommendation decisions.
Mule Deer PR01.doc 76

Mule DeerAnalysis Area 20 (Units 56, 70, 73, 73A)
Note: Unit 56 has a minimum buck:doe ratio criterion of 25, %4+ point criteria does not apply to 2-point only hunts.
Trend Area Surveys
1993 1994 1995 1996 1997 1998 1999 2000ND 1854 ND ND 1324 1325 1113 1318
2228 731 761 908 929 787 958 9803463 761 760 962 701 947 942 8852330 1823 1913 1324 1033 1121 1578 1533
8021 3315 3434 3194 2663 2885 3478 3398Note: ND = no survey data available.
1992 1993 1994 1995 1996 1997 1998 1999
77
846 483 199 17 0 02097 709 812 638 754 883
45 47 55 70 67 506738 5138 3065 2273 3157 4504
0 7847 137945 35
3172 4465Note: Telephone survey harvest data prior to 1998 does not include
general primitive weapons season data. %4+ points does not include 2-point only hunts.
* Note: Harvest prior to 1998 does not includegeneral primitive weapons season data.
Trend Area Status & Antlerless Harvest Threshold
5700
Hunter Numbers
Antlered Harvest
Analysis Area Harvest Statistics
% 4+ Points
Antlerless Harvest
Trend Area (Unit)
Current Status Antlerless Harvest
980 1200
ThresholdSurveyYear Total Deer Total Deer
20002000
Elkhorn (73) 20001800
12001500
1318
8851533
SurveyYear(s)
CurrentStatus
4716
Heglar (56)
Malad Face (73)Rockland (73A)
Total
2000
CriterionBuck:Doe Ratio
%4+ Pts in the Harvest2000
1997-9918 15
30
ComparableSurveys Total
Rockland (73A)
Deer Numbers
Elkhorn (73)
Buck Status & Minimum Criterion
Trend Area (Unit)Heglar (56)
Malad Face (73)
Minimum
0
1000
2000
3000
4000
5000
6000
7000
8000
9000
1993 1994 1995 1996 1997 1998 1999 2000
Population ChangeBetween Comparable Surveys
-500
0
500
1000
1500
2000
2500
1992 1993 1994 1995 1996 1997 1998 1999
Harvest* with TrendAntlerless Antlered
0
1000
2000
3000
4000
5000
6000
7000
8000
1992 1993 1994 1995 1996 1997 1998 1999
Hunter Numbers with Trend
0
10
20
30
40
50
60
70
80
1992 1993 1994 1995 1996 1997 1998 1999
% 4+ Points with Trend
Mule Deer PR01.doc

ANALYSIS AREA 21 (UNITS 71, 74)
Management Objectives One objective for Analysis Area 21 is to restrict antlerless harvest when trend area populations are less than 2000 deer, conversely, liberal antlerless harvest will be encouraged when deer numbers exceed this threshold value. This value represents an intermediate population size between current status and numbers observed during the late 1980s and early 1990s when deer populations were considered higher than could be supported during a normal winter and presented depredation concerns for agricultural producers. Additional objectives include not falling below 15 bucks:100 does post-season and not falling below 30% 4+ points in the harvest. Historical Perspective The mule deer population in Analysis Area 21 (Units 71, 74) has fluctuated widely since the mid-1800s. Early accounts by trappers through the area suggested that deer were seen, but were less numerous than buffalo, bighorn sheep, and elk. Deer numbers probably declined through the early 1900s, possibly due to unregulated harvest. By 1920, observations of deer were quite rare. Between 1920 and the early 1970s deer numbers increased dramatically; interrupted briefly by significant winter mortality. Following a significant decline in numbers beginning in 1972, numbers again increased until the late 1980s. The population level attained during this second peak probably did not reach that attained during the 1950s - early 1970s. Harvest management during the 1950s and 1960s was designed to maintain or reduce deer numbers in response to what was considered overbrowsed winter ranges. Long general either-sex seasons (3 - 5 weeks) predominated. Following the decline in the early 1970s, harvest management became more conservative with 2-4 week general seasons with varying amounts of either-sex opportunity offered. By the late 1980s, the deer population had increased to a point that a population reduction was desired. The years 1989 and 1990 were marked by 4-week general either-sex seasons with extra-deer tags available. Following the winter of 1992/93, when significant winter mortality occurred, harvest management has been conservative. Major wintering areas in this Analysis Area are: Blackrock Canyon (Unit 71), Portneuf Winter Range, (Unit 71), the west facing slopes east of Downey (Unit 74), Hadley Canyon complex (Unit 74), Densmore Creek (Unit 74), and Treasureton (Unit 74). Habitat Issues
78
This Analysis Area represents habitats that are intermediate in productivity between the highly productive units to the east and the less productive habitats to the west. Three main vegetation types predominate: 1)sagebrush-grassland, 2) aspen, and 3) conifer. Other variations of these 3 main types that are important to deer include: mixed brush communities, juniper, and mahogany. The current mix of vegetation cover types is a result of fire suppression efforts and intensive grazing by livestock during the early 1900s. These factors converted what was predominately perennial grass stands into shrublands. Given that current livestock grazing practices are much more conservative and designed to promote grass and that the current shrublands are aging, it is logical that quality mule deer habitat probably peaked earlier in the century. Additionally, the Mule Deer PR01.doc

current conversion of aspen to conifer and replacement of mixed shrub and sagebrush communities by juniper probably will reduce habitat suitability for mule deer. Approximately 28% of the land in this Analysis Area is publicly owned. The U.S. Forest Service, Bureau of Land Management, and Idaho Department of Lands administer nearly equal amounts of the public ground. The Fort Hall Indian Reservation makes up approximately 15%, while the remaining 57% is private ground. The private ground is predominately used for rangeland pasture, small grains, and hay production. Depredation complaints are generally limited to periods of high deer populations. Predominant land uses of the publicly owned ground include livestock grazing, timber management, and recreation. Of particular concern is the encroachment of human activity, either intense recreational efforts and/or structural developments, in mule deer winter range. Development along the Portneuf, Hadley Canyon complex, and Treasureton winter ranges, in particular, will undoubtedly reduce the potential for wintering greater numbers of deer. Open habitat types combined with moderate road densities, and in some cases unrestricted ATV travel, probably result in a greater vulnerability standard for mule deer in this Analysis Area. Additionally, these 2 units receive high amounts of hunting pressure partly because of their close association to Pocatello. Biological Issues Recruitment rates in this analysis area, as evidenced by December/January fawn:doe ratios, have only been measured once: 74 fawns:100 does was observed in 1996. It is believed that 70 fawns:100 does is adequate to maintain populations with normal winter mortality, while increased recruitment is necessary for population growth. Conversely, recruitment rates less than 70:100 are generally consistent with stable to declining populations. Interspecific Issues Although livestock grazes much of the mule deer range in this analysis area, interactions of concern are relatively few and tend to be limited to localized areas. Of primary concern are livestock winter feed lot operations that over-concentrate deer during winter. Of a minor concern are a few localized areas (riparian and winter range) of intense livestock pressure. Of greater concern than livestock interactions is the current trend of elk occupying mule deer winter ranges. Some winter areas in this Analysis Area do not lend themselves to niche separation by the 2 species and therefore either direct resource competition and/or social intolerance will likely impact mule deer numbers. Recent encroachment of elk into mule deer winter ranges will require immediate action. The Department will aggressively seek opportunities to minimize the occupancy by elk in key mule deer winter ranges.
Mule Deer PR01.doc 79

Predation Issues Potentially major predators of mule deer in this Analysis Area include black bears, mountain lions, coyotes, and bobcats. The black bear population is extremely low and probably has remained unchanged for many years. Mountain lion and coyote populations are believed to have increased during the last 30 years. It is unknown specifically what impact these changing predator systems are having on mule deer population dynamics. Winter Feeding Issues Emergency supplemental feeding of deer occurs approximately every 3 years. Primary areas include between Inkom and McCammon, and the west facing hills between McCammon and Downey. In many cases, emergency feeding is initiated after deer have been attracted to cattle feed lot operations or private citizens began feeding deer early in winter. Both of these circumstances probably short-stop deer from reaching more suitable winter range and generally result in high over-winter mortality rates. The Department working in conjunction with the Winter Feeding Advisory Committee will discourage livestock operators and other private citizens from encouraging deer use of non-traditional food sources. Information Requirements The Department will explore various means of better quantifying over-winter mortality so that harvest recommendations are more responsive to changing populations. The 1996 recruitment rate is consistent with a stable population. Annual monitoring of recruitment is needed along with a better understanding of factors affecting recruitment rates. Although habitat succession and change are occurring, it is unknown specifically what quantitative impacts will occur with deer populations. Furthermore, it is unknown whether the aging of current mule deer habitat leads to ultimately less productive and nutritious vegetation. Given that predator populations are significantly different than 30 years ago, it is unknown what impacts to deer may be occurring. Given that predator and elk populations and habitat have changed over time, a better understanding of the interrelationships and ecological processes governing mule deer population dynamics would greatly aid in management recommendation decisions.
Mule Deer PR01.doc 80

Mule DeerAnalysis Area 21 (Units 71, 74)
Trend Area Surveys
1993 1994 1995 1996 1997 1998 1999 20002491 976 ND 1003 978 978 1097 1118
2491 976 ND 1003 978 978 1097 1118Note: ND = no survey data available.
1992 1993 1994 1995 1996 1997 1998 1999
81
421 354 199 68 139 01236 580 200 236 496 480
47 52 50 50 46 253422 3299 1582 1303 2085 2535
0 13459 52725 27
2185 2239Note: Telephone survey harvest data prior to 1998 does not include
general primitive weapons season data.
* Note: Harvest prior to 1998 does not include general primitive weapons season data.
Buck Status & Minimum Criterion
Trend Area (Unit)Portneuf (71)
MinimumCriterion
Buck:Doe Ratio%4+ Pts in the Harvest
20001997-99
12
ComparableSurveys Total
Deer Numbers
1118Portneuf (71)
Total2000
1530
SurveyYear(s)
CurrentStatus
17001118
ThresholdSurveyYear Total Deer Total Deer
Trend Area Status & Antlerless Harvest Threshold
1700
Hunter Numbers
Antlered Harvest
Analysis Area Harvest Statistics
% 4+ Points
Antlerless Harvest
Trend Area (Unit)
Current Status Antlerless Harvest
0
500
1000
1500
2000
2500
3000
1993 1994 1995 1996 1997 1998 1999 2000
Population ChangeBetween Comparable Surveys
-200
0
200
400
600
800
1000
1200
1400
1992 1993 1994 1995 1996 1997 1998 1999
Harvest* with TrendAntlerless Antlered
0
500
1000
1500
2000
2500
3000
3500
4000
1992 1993 1994 1995 1996 1997 1998 1999
Hunter Numbers with Trend
0
10
20
30
40
50
60
1992 1993 1994 1995 1996 1997 1998 1999
% 4+ Points with Trend
Mule Deer PR01.doc

ANALYSIS AREA 22 (UNITS 72, 75, 76, 77, 78)
Management Objectives One objective for Analysis Area 22 is to restrict antlerless harvest when trend area populations are less than 10,000 deer, conversely, liberal antlerless harvest will be encouraged when deer numbers exceed this threshold value. This value represents an intermediate population size between current status and numbers observed during the late 1980s and early 1990s when deer populations were considered higher than could be supported during a normal winter and presented depredation concerns for agricultural producers. Additional objectives include not falling below 15 bucks:100 does post-season and not falling below 30% 4+ points in the harvest. Historical Perspective The mule deer population in Analysis Area 22 (Units 72, 75, 76, 77, 78) has fluctuated widely since the mid-1800s. Early accounts by trappers through the area suggested that deer were seen, but were less numerous than buffalo, bighorn sheep, and elk. Deer numbers probably declined through the early 1900s, possibly due to unregulated harvest. By 1920, observations of deer were quite rare. Between 1920 and the early 1970s deer numbers increased dramatically; interrupted briefly by significant winter mortality. Following a significant decline in numbers beginning in 1972, numbers again increased until the late 1980s. The population level attained during this second peak probably did not reach that attained during the 1950s - early 1970s. Harvest management during the 1950s and 1960s was designed to reduce deer numbers in response to what was considered overbrowsed winter ranges. Long general seasons with opportunity for extra-deer tags predominated. Following the decline in the early 1970s, harvest management became more conservative with 2-4 week general seasons with varying amounts of either-sex opportunity offered. By the late 1980s, the deer population had increased to a point that a population reduction was desired. The years 1989 and 1990 were marked by 4-week general either-sex seasons with extra-deer tags available. Following the winter of 1992/93, when significant winter mortality occurred, harvest management has been conservative. Apparently a change in the winter distribution of mule deer has occurred, primarily in Unit 76. During the 1950s and 1960s deer use of the Soda Front (Wood Canyon south to Montpelier) was extensive; while use of the Bear Lake Plateau and the Soda Hills (Unit 72) was minimal. Currently, the Bear Lake Plateau and the Soda Hills represent the 2 most significant winter ranges for mule deer in Unit 76. Major wintering areas in this Analysis Area are: Soda Hills (Unit 72), Bear Lake Plateau (Unit 76), West Bear Lake (Unit 78), Grace Front (Unit 75), and the Oneida Narrows Complex (Unit 77). An unknown number of deer migrate to and winter in Wyoming and Utah. Habitat Issues
82
This Analysis Area represents the most productive habitats for mule deer in southeastern Idaho. Three main vegetation types predominate: 1)sagebrush-grassland, 2) aspen, and 3) conifer. Other variations of these 3 main types that are important to deer include: mixed brush Mule Deer PR01.doc

communities, juniper, and mahogany. The current mix of vegetation cover types is a result of fire suppression efforts and intensive grazing by livestock during the early 1900s. These factors converted what was predominately perennial grass stands into shrublands. Given that current livestock grazing practices are much more conservative and designed to promote grass and that the current shrublands are aging, it is logical that quality mule deer habitat probably peaked earlier in the century. Additionally, the current conversion of aspen to conifer and replacement of mixed shrub and sagebrush communities by juniper probably will reduce habitat suitability for mule deer. Primarily the U.S. Forest Service publicly owns approximately 54% of the land in this Analysis Area. The remaining 46% of private ground is predominately used for rangeland pasture, small grains, and hay production. Depredation complaints are generally limited to periods of high deer populations. Predominant land uses of the publicly owned ground include livestock grazing, timber management, recreation, and phosphate mining. Of particular concern is the encroachment of human activity, either intense recreational efforts (i.e. over-snow machine travel) and/or structural developments, in mule deer winter range. Development in the Bear River Valley of Unit 77 and along the West Bear Lake winter range in Unit 78 will undoubtedly reduce the potential for wintering greater numbers of deer. Open habitat types combined with moderate road densities, and in some cases unrestricted ATV travel, probably result in a greater vulnerability standard for mule deer in this Analysis Area. Biological Issues Recruitment rates as evidenced by December/January fawn:doe ratios have ranged from 60 - 85 over the past few years. It is believed that 70 fawns:100 does is adequate to maintain populations with normal winter mortality, while increased recruitment is necessary for population growth. Conversely, recruitment rates less than 70:100 are generally consistent with stable to declining populations. Interspecific Issues Although livestock grazes much of the mule deer range in this analysis area, interactions of concern are relatively few and tend to be limited to localized areas. Of primary concern are livestock winter feed lot operations that over-concentrate deer during winter. Of a minor concern are a few localized areas (riparian and winter range) of intense livestock pressure. Of greater concern than livestock interactions is the current trend of elk occupying mule deer winter ranges. Some winter areas in this Analysis Area do not lend themselves to niche separation by the 2 species and therefore either direct resource competition and/or social intolerance will likely impact mule deer numbers. Recent encroachment of elk into the Soda Hills will require immediate action in order to maintain this area as a significant mule deer winter range. The Department will aggressively seek opportunities to minimize the occupancy by elk in key mule deer winter ranges.
Mule Deer PR01.doc 83

Predation Issues Potentially major predators of mule deer in this Analysis Area include black bears, mountain lions, coyotes, and bobcats. The black bear population is extremely low and probably has remained unchanged for many years. Mountain lion and coyote populations are believed to have increased during the last 30 years. It is unknown specifically what impact these changing predator systems are having on mule deer population dynamics. Winter Feeding Issues Emergency supplemental feeding of deer occurs approximately every 3 years. Primary areas include around Soda Springs, Georgetown Canyon, Montpelier Canyon, and St. Charles Canyon. In many cases, emergency feeding is initiated after deer have been attracted to cattle feed lot operations or private citizens began feeding deer early in winter. Both of these circumstances probably short-stop deer from reaching more suitable winter range and generally result in high over-winter mortality rates. The Department working in conjunction with the Winter Feeding Advisory Committee will discourage livestock operators and other private citizens from encouraging deer use of non-traditional food sources. Information Requirements The Department will add another winter census trend area and explore various means of better quantifying over-winter mortality so that harvest recommendations are more responsive to changing populations. Recent observed recruitment rates are consistent with either stable or slightly increasing populations. A better understanding of factors affecting recruitment rates is needed. Although habitat succession and change are occurring, it is unknown specifically what quantitative impacts will occur with deer populations. Furthermore, it is unknown whether the aging of current mule deer habitat leads to ultimately less productive and nutritious vegetation. Given that predator populations are significantly different than 30 years ago, it is unknown what impacts to deer may be occurring. Given that predator and elk populations and habitat have changed over time, a better understanding of the interrelationships and ecological processes governing mule deer population dynamics would greatly aid in management recommendation decisions.
Mule Deer PR01.doc 84

Mule DeerAnalysis Area 22 (Units 72, 75, 76, 77, 78)
Trend Area Surveys
1993 1994 1995 1996 1997 1998 1999 2000ND 2450 1884 3441 2760 2548 1790 1707
7423 3156 2754 4010 4145 3428 1826 2378ND 2428 ND ND ND ND 3427 3467
5606 4638 7451 6905 5976 3616 4085Note: ND = no survey data available.
1992 1993 1994 1995 1996 1997 1998 1999
Mule Deer PR01.doc 85
1362 721 342 194 258 03904 1342 1042 698 1668 1143
48 49 36 28 47 4310472 9714 4888 3154 6155 6588 6
0 401431 1160
40 30767 4812
Note: Telephone survey harvest data prior to 1998 does not include general primitive weapons season data.
* Note: Harvest prior to 1998 does not includegeneral primitive weapons season data.
Trend Area Status & Antlerless Harvest Threshold
10000
Hunter Numbers
Antlered Harvest
Analysis Area Harvest Statistics
% 4+ Points
Antlerless Harvest
Trend Area (Unit)
Current Status Antlerless HarvestThresholdSurvey
Year Total Deer Total Deer300040003000
1707237834677552
West Bear Lake (78)Soda Hills (72)
Bear Lake Plateau (76)Total
200020002000
1530
SurveyYear(s)
CurrentStatus
Buck:Doe Ratio%4+ Pts in the Harvest
20001997-99
16
ComparableSurveys Total
Bear Lake Plateau (76)
Deer Numbers
Buck Status & Minimum Criterion
Trend Area (Unit)West Bear Lake (78)
Soda Hills (72)
MinimumCriterion
0
1000
2000
3000
4000
5000
6000
7000
8000
1993 1994 1995 1996 1997 1998 1999 2000
Population ChangeBetween Comparable Surveys
-5000
50010001500
200025003000
350040004500
1992 1993 1994 1995 1996 1997 1998 1999
Harvest* with TrendAntlerless Antlered
0
2000
4000
6000
8000
10000
12000
1992 1993 1994 1995 1996 1997 1998 1999
Hunter Numbers with Trend
0
10
20
30
40
50
60
1992 1993 1994 1995 1996 1997 1998 1999
% 4+ Points with Trend

86
APPENDICES


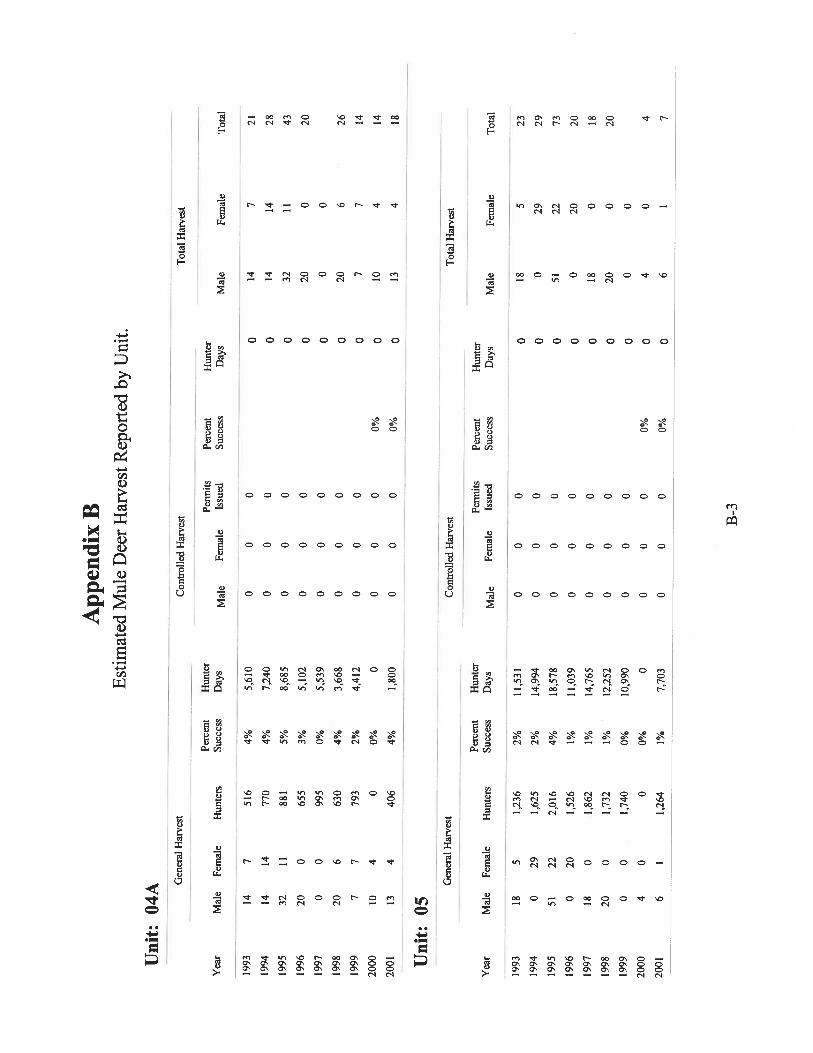


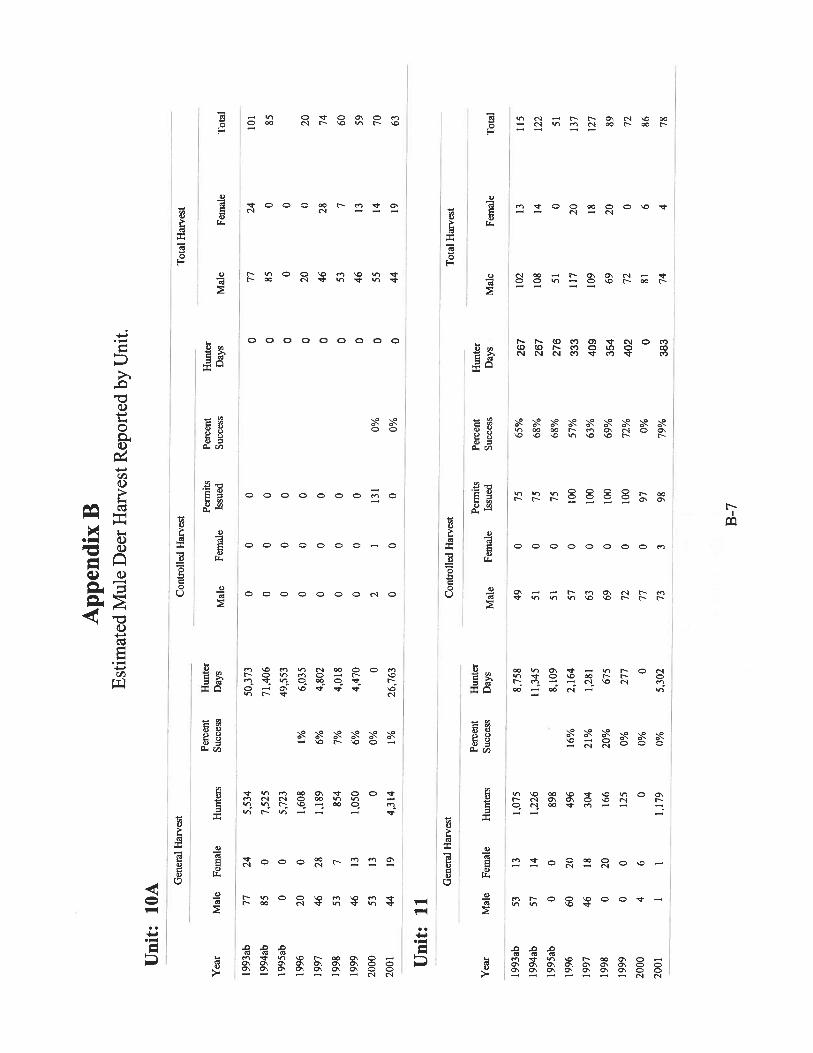


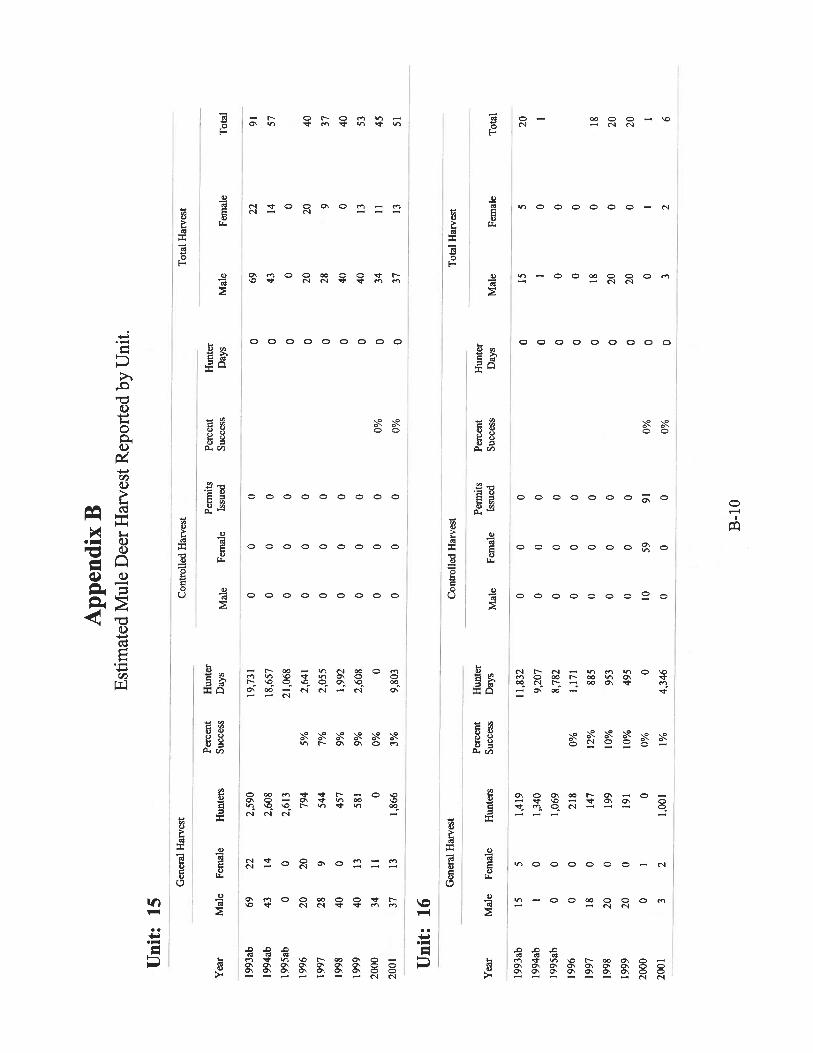


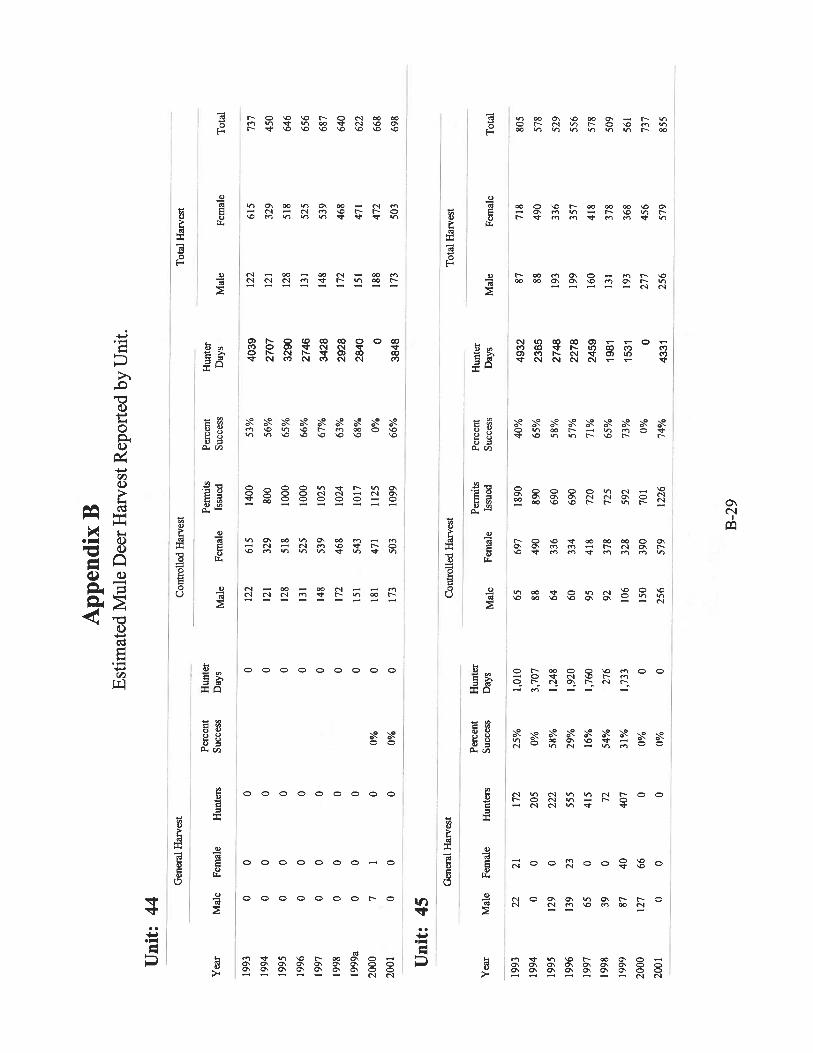


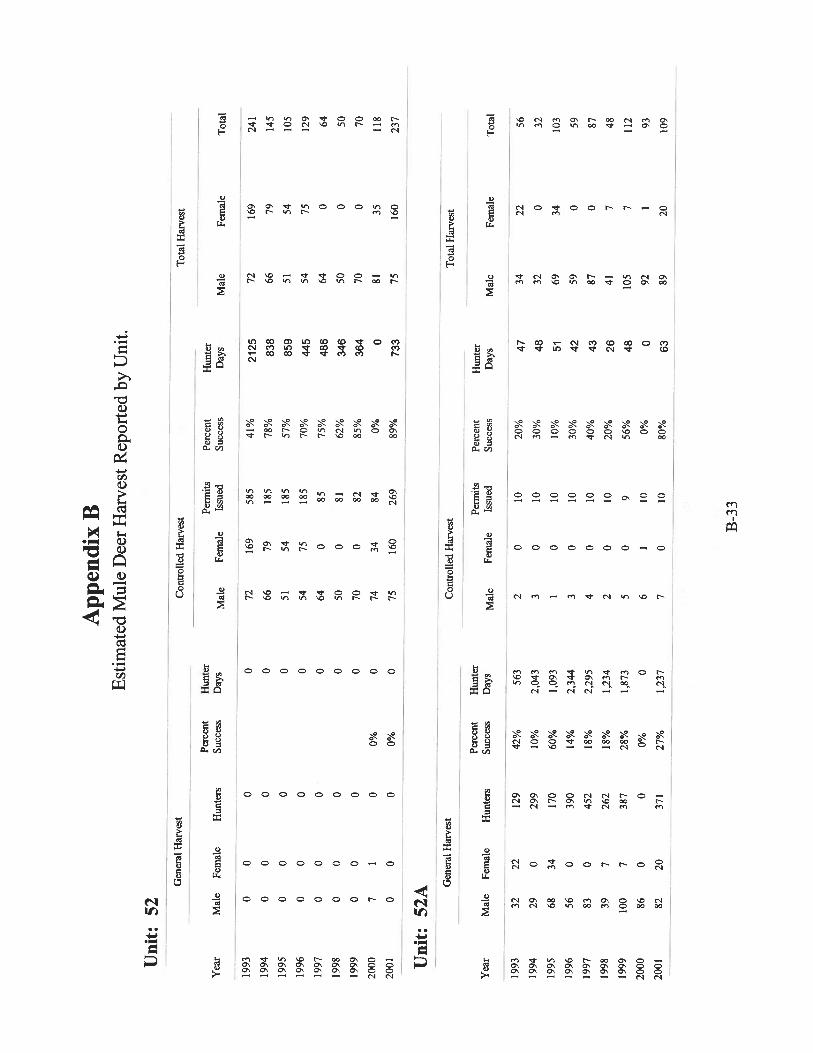


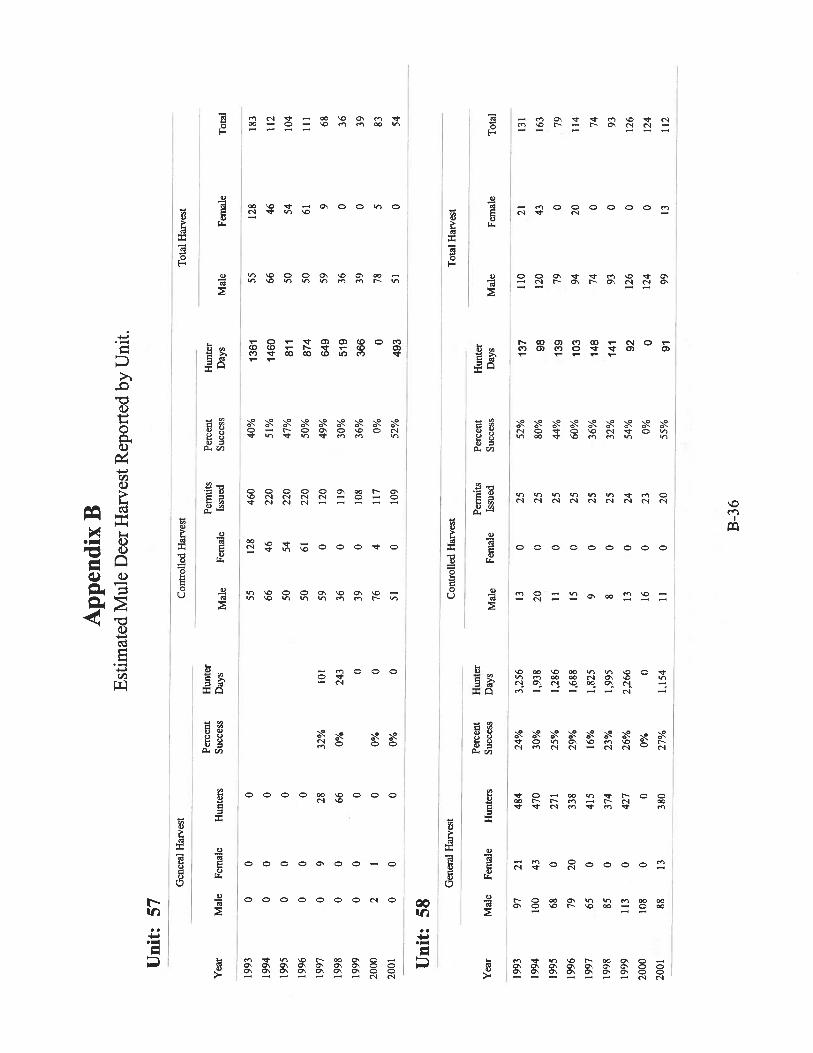


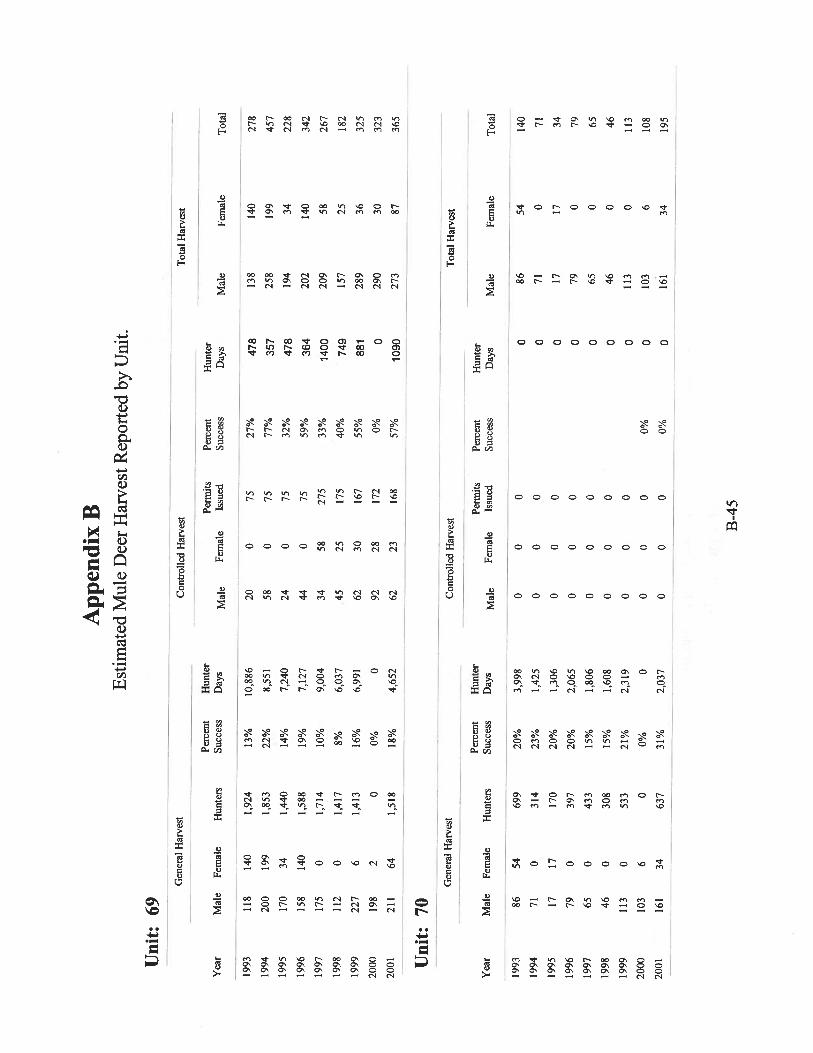


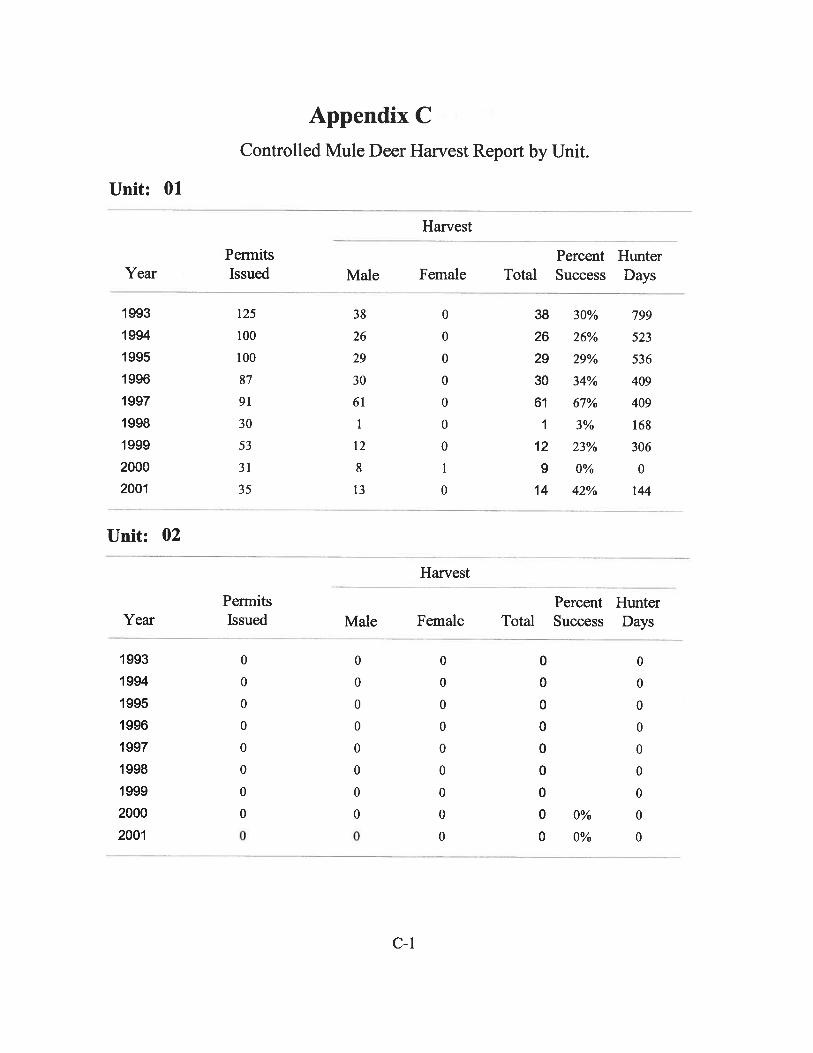


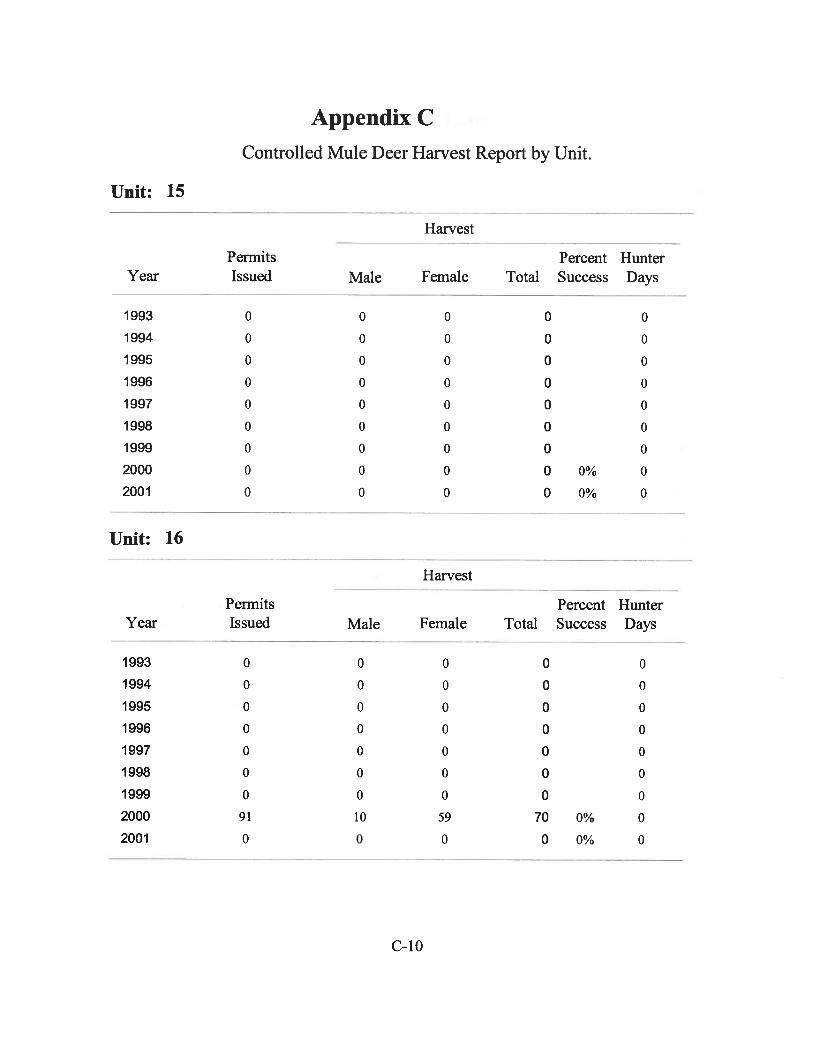


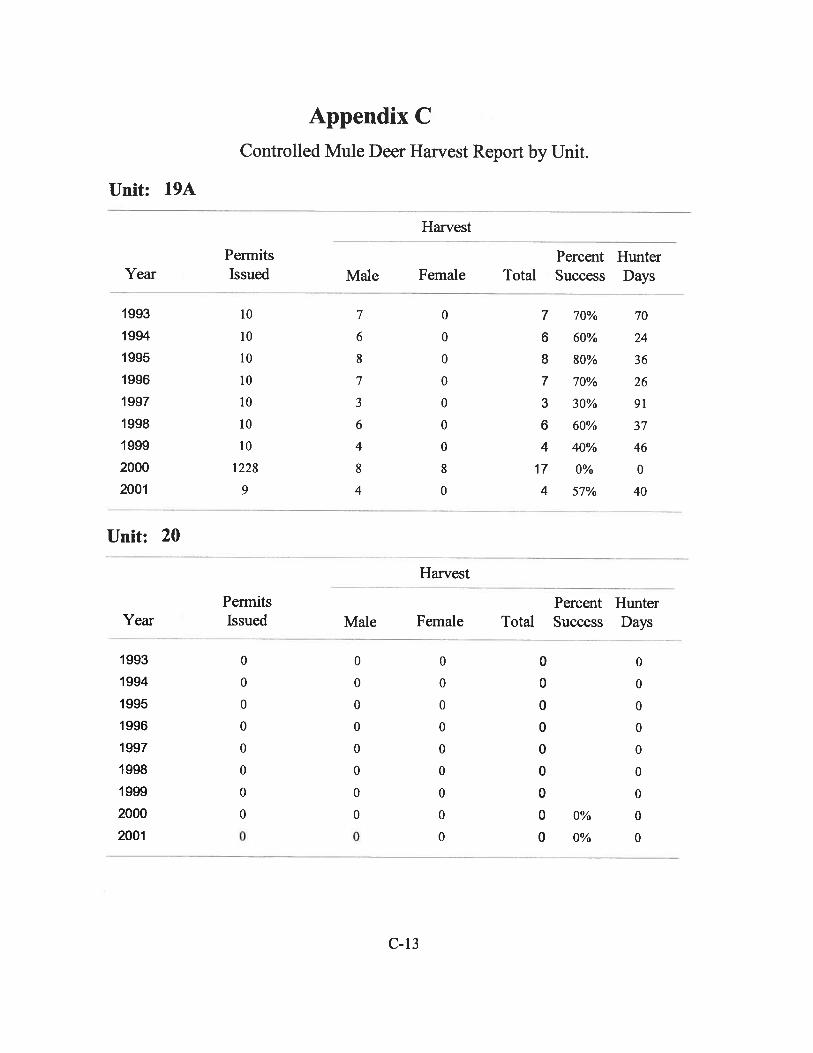


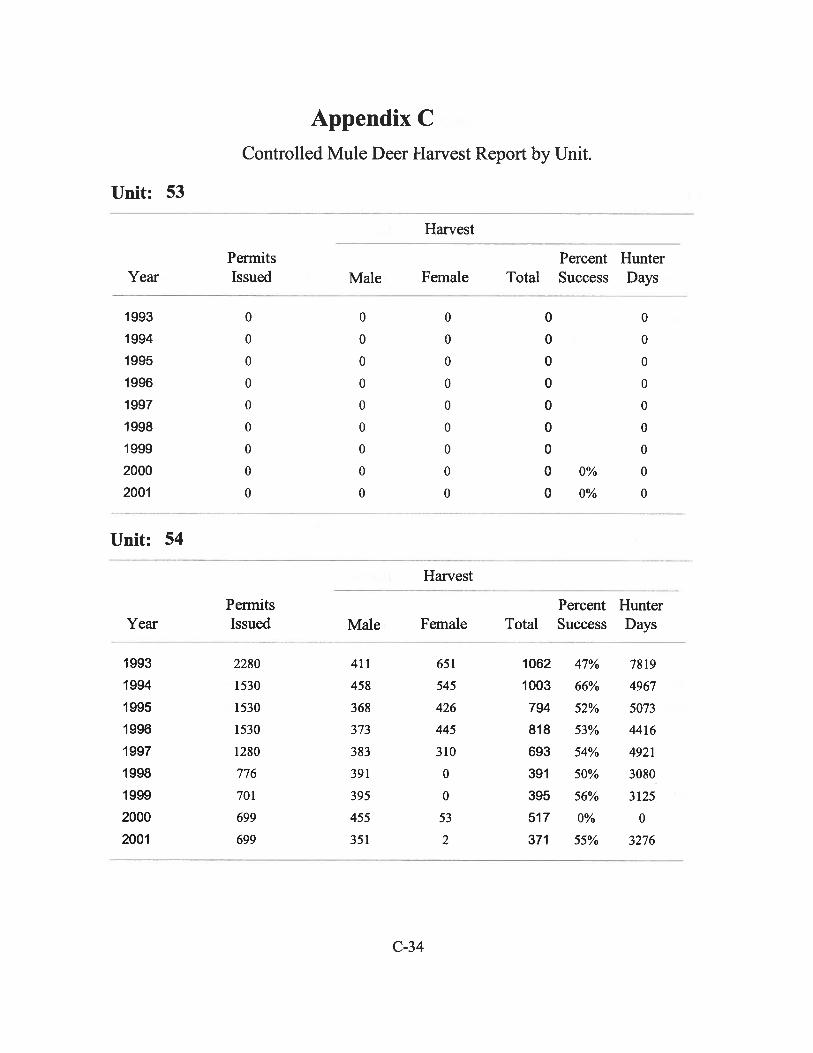


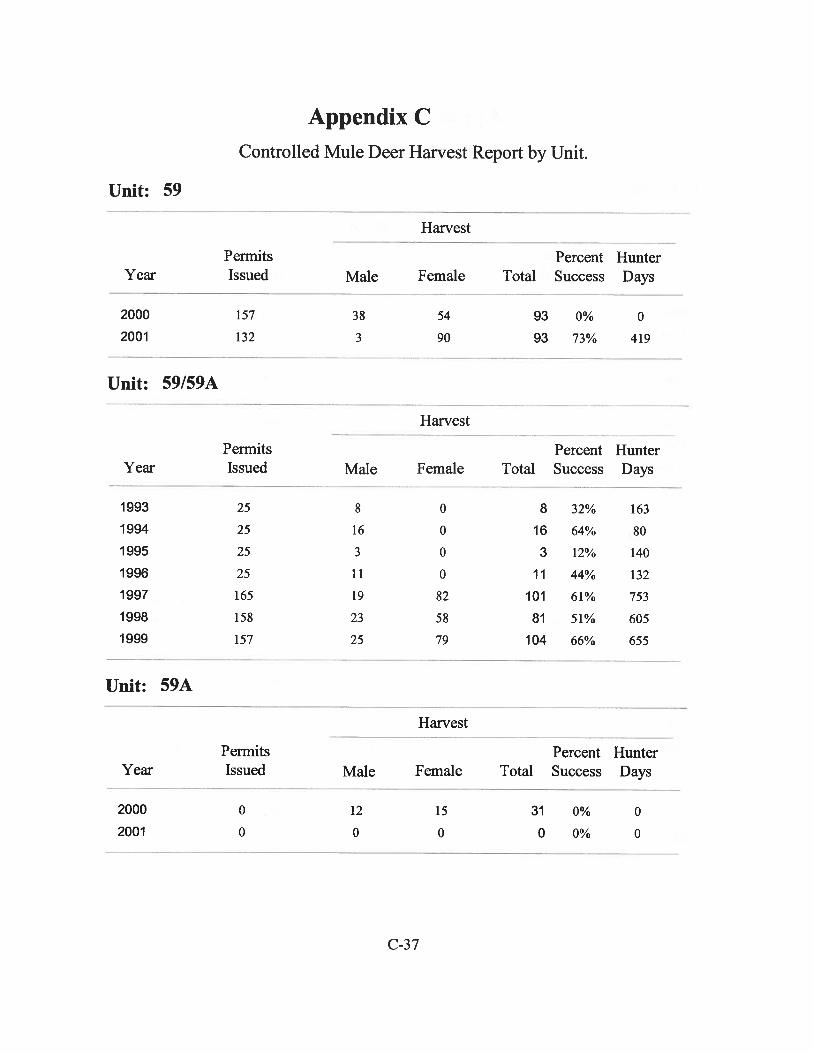


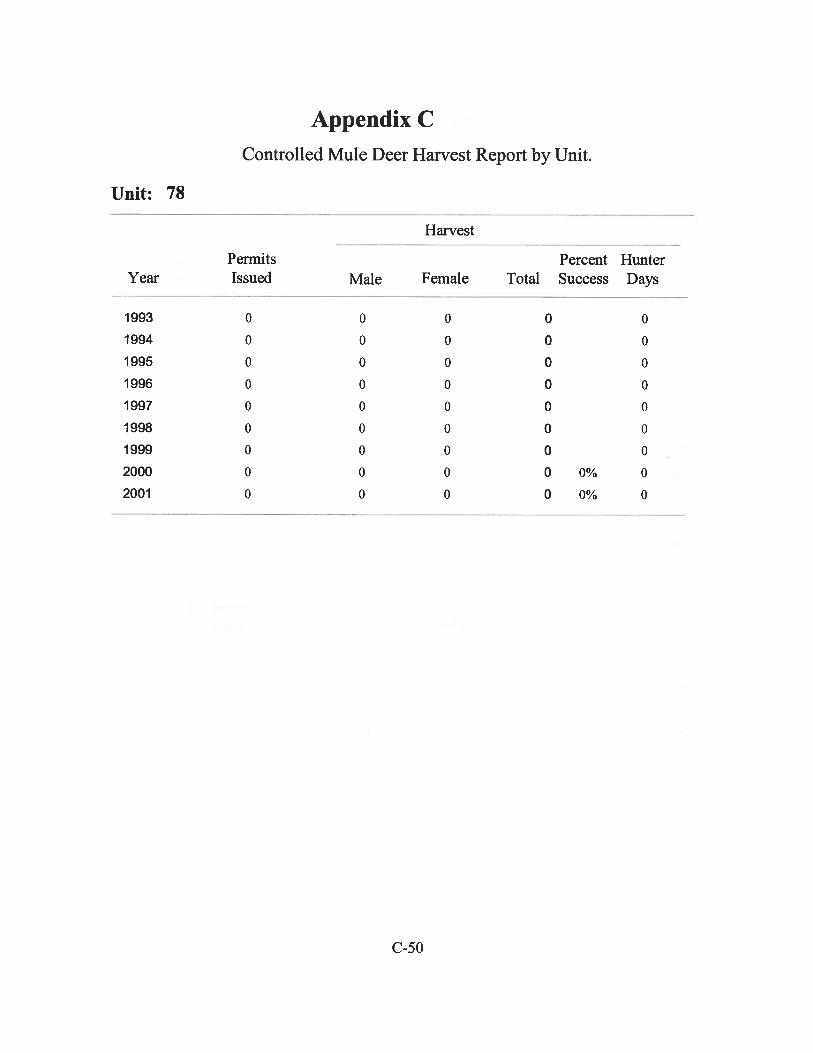


Appendix E Age Structure for mule deer.
E-1
Table 1. Right side antler points of mule deer checked in Group 1, Units 1, 2, 3, 4, 4A, 5, 6, 7, and 9.
Year Antlered Right Side Antler Points Percent
4+ points Percent
5+ points1 2 3 4 5 6 7 81992 101 9 24 28 30 8 0 0 2 40% 10%1993 50 11 17 6 10 4 1 0 1 32% 12%1994 43 4 13 6 9 10 0 1 0 47% 26%1995a 120 12 31 22 34 17 3 1 0 46% 18%1996 102 14 21 25 17 12 13 0 0 41% 25%1997 22 3 5 6 3 4 0 1 0 0% 0%1997b 378 9 166 46 129 28 0 0 0 41% 7%1998 586 53 224 152 136 7 7 7 0 27% 4%1999 454 34 186 80 100 34 13 0 7 33% 12%
a Voluntary check for mule deer conducted 1995 and 1996. b Telephone survey for mule deer. Table 2. Age structure of antlered deer harvest in the Clearwater Region.
Year n % 4 Points ∀ 90% CI (Projection with CI)
1992 904 53 (50-56) 1993 752 40 (37-43) 1994 a 912 61 (58-64) 1994 b 192 62 (56-68) 1995 a 541 60 (56-64) 1996 a 356 60 (56-64) 1997 b 184 51 (45-57) 1998 b 259 53 (48-58) 1999 b 254 47 (41-52)
a Estimates for mule and white-tailed deer combined. bEstimates for mule deer only.

Appendix E Age Structure for mule deer.
E-2
Table 3. Age structure of antlered deer harvest in Clearwater Region management units.
Units n
1991-1995 % 4 Points + 90% CI (Projection with CI) n
1996-1999 % 4 Points ∀ 90% CI (Projection with CI)
8 169 53 (±7) 26 40 (±18) 8A 247 46 (±5) 17 17 (±18) 10 125 55 (±8) 7 13 (±28)
10A 367 53 (± 4) 22 51 (±20) 11 70 57 (±10) 10 58 (±31)
11A 170 51 (±7) 13 17 (±21) 12 60 41 (±11) 6 25 (±37) 13 110 48 (±8) 21 25 (±18) 14 223 43 (±6) 36 39 (±15) 15 220 39 (±6) 16 50 (±24) 16 94 51 (±9) 8 21 (±30)
16A 29 27 (±15) 4 13 (±40) 17 133 70 (±7) 50 58 (±12) 18 99 44 (±9) 23 21 (±16) 19 75 42 (±10) 28 49 (±17) 20 44 55 (±13) 13 36 (±26)
Table 4. Age structure of antlered deer harvest in the Southwest Region (McCall) units 1991-1999.
Units 1991-1995 (Projection plus 90% CI) 1996-1999 (Projection plus 90% CI)
n % 4 Points n % 4 Points 19A 25 60 (42-78) 39 36 (23-49) 20A 39 54 (39-69) 29 48 (33-63) 22 193 33 (27-39) 317 26 (22-30) 23 130 37 (30-44) 160 33 (27-39) 24 152 37 (30-44) 178 31 (25-37) 25 75 47 (36-58) 45 31 (20-42) 26 71 55 (44-66) 39 46 (33-59) 31 62 29 (19-39) 272 22 (18-26) 32A 145 32 (25-39) 344 21 (17-25)

Appendix E Age Structure for mule deer.
E-3
Table 5. Age structure of general season antlered deer harvest in SW region. (Excluding general 2-pt harvest in Units 40, 41, and 42).
1996-1999 (Projection plus 90% CI) Units n % 4 Points 32 138 20 (9-31) 33 77 21 (10-32) 34 25 40 (29-51) 35 32 16 (5-26) 38 54 22 (11-33) 39 839 27 (16-38)
Table 6. Age structure of antlered deer harvest in the Magic Valley Region units, October hunts.
1991-1995 1996-1999 Units n % 4 Points (90% CI) n % 4 Points (90% CI) 43 291 47 (42-52) 308 34 (30-38) 44 211 63 (57-69) 184 55 (49-61) 45 196 78 (72-84) 142 68 (62-74) 46 47 32 (22-42) 66 30 (21-39) 47 119 22 (15-29) 96 26 (19-33) 48 209 42 (36-48) 206 27 (22-32) 49 239 37 (32-42) 235 25 (20-30) 52 163 56 (49-63) 137 59 (52-66) 52A 29 48 (33-63) 32 34 (20-48) 53 23 30 (15-45) 25 24 (10-38 54 367 38 (33-43) 249 30 (30-40) 55 243 44 (38-50) 178 31 (25-37) 57 138 40 (32-48) 83 45 (36-54) All 2,275 46 (44-48) 1,941 38 (36-40)

Appendix E Age Structure for mule deer.
E-4
Table 7. Age structure of antlered deer harvest, Magic Valley Region, October hunts 1992-1999.
Year n % 4 Points (90% CI) 1992 617 47 (44-50) 1993 346 54 (50-58) 1994 396 52 (48-56) 1995 350 45 (41-49) 1996 263 44 (39-49) 1997 464 45 (41-49) 1998 565 35 (32-38) 1999 649 34 (31-37)
Table 8. Age structure of antlered deer harvest the Magic Valley Region units, November hunts.
1991-1995 1996-1999 Units n % 4 Points (90% CI) n % 4 Points (90% CI) 43 41 66 (54-78) 4 100 44 0 34 85 (75-85) 45 56 84 (76-92) 89 88 (82-94) 47 33 61 (47-75) 18 72 (53-90) 48 61 61 (51-71) 14 71 (50-92) 49 61 46 (35-57) 12 75 (53-97) 52 27 81 (68-94) 25 84 (72-96) 52A 15 67 (46-88) 11 73 (50-96) 54 83 67 (58-76) 67 79 (71-87) 55 67 66 (56-76) 46 46 (34-58) 56 156 88 (83-94) 156 85 (80-90) 57 20 55 (36-74) 20 90 (79-100) All 563 69 (66-72) 496 80 (77-83)

Appendix E Age Structure for mule deer.
E-5
Table 9. Age structure of antlered deer harvest, Magic Valley Region, November hunts, 1992-1999.
Year n % 4 Points (90% CI) 1992 95 64 (56-72) 1993 86 69 (61-77) 1994 122 81 (75-87) 1995 133 69 (62-76) 1996 103 80 (73-87) 1997 128 80 (74-86) 1998 135 81 (75-87) 1999 130 79 (73-85)
Table 10. Age structure of antlered deer harvest in the Southeast Region units.
Units n 1991-1997
% 4 Points (∀90% CI) 1998-1999
Mean % 4 Points 66A 61 69 (58-78) 63 68 19 47 (27-68) 56 70 68 35 (26-46) 17 71 144 36 (29-44) 31 72 125 30 (24-38) 41 73 404 34 (31-38) 32 73A 179 43 (37-49) 27 74 283 47 (42-52) 31 75 171 40 (33-46) 25 76 947 46 (43-49) 33 77 98 48 (39-57) 35 78 88 48 (38-57) 35

Appendix E Age Structure for mule deer.
E-6
Table 11. Age structure of antlered deer harvest from the Southeast Region.
Year n % 4 Points ∀90% CI (Projection plus CI)
1992 1092 47 (46-51) 1993 258 50 (44-55) 1994 140 36 (29-43) 1995 79 44 (29-58) 1996 149 48 (41-55) 1997 241 38 (33-43) 1998 867 41 (30-52) 1999 1118 35 (28-42) Table 12. Age structure of antlered deer harvest from the Upper Snake Region.
Year n % 4 Points ∀90% CI 1992 501 50 (45-54) 1993 231 58 (51-64) 1994 308 55 (49-60) 1995 188 53 (46-61) 1996 194 55 (48-62) 1997 270 48 (42-54) 1998 418 41 (37-46) 1999 520 37 (32-41)
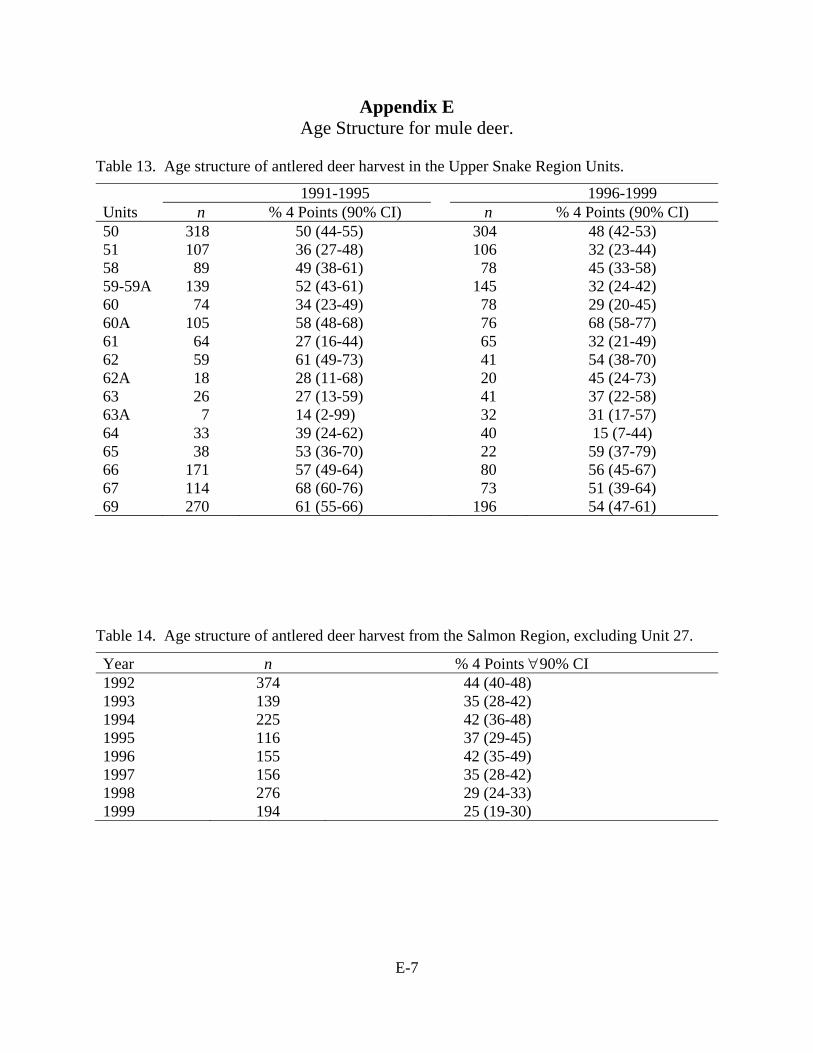
Appendix E Age Structure for mule deer.
E-7
Table 13. Age structure of antlered deer harvest in the Upper Snake Region Units.
1991-1995 1996-1999 Units n % 4 Points (90% CI) n % 4 Points (90% CI) 50 318 50 (44-55) 304 48 (42-53) 51 107 36 (27-48) 106 32 (23-44) 58 89 49 (38-61) 78 45 (33-58) 59-59A 139 52 (43-61) 145 32 (24-42) 60 74 34 (23-49) 78 29 (20-45) 60A 105 58 (48-68) 76 68 (58-77) 61 64 27 (16-44) 65 32 (21-49) 62 59 61 (49-73) 41 54 (38-70) 62A 18 28 (11-68) 20 45 (24-73) 63 26 27 (13-59) 41 37 (22-58) 63A 7 14 (2-99) 32 31 (17-57) 64 33 39 (24-62) 40 15 (7-44) 65 38 53 (36-70) 22 59 (37-79) 66 171 57 (49-64) 80 56 (45-67) 67 114 68 (60-76) 73 51 (39-64) 69 270 61 (55-66) 196 54 (47-61)
Table 14. Age structure of antlered deer harvest from the Salmon Region, excluding Unit 27.
Year n % 4 Points ∀90% CI 1992 374 44 (40-48) 1993 139 35 (28-42) 1994 225 42 (36-48) 1995 116 37 (29-45) 1996 155 42 (35-49) 1997 156 35 (28-42) 1998 276 29 (24-33) 1999 194 25 (19-30)

Appendix E Age Structure for mule deer.
E-8
Table 15. Age structure of antlered deer harvest from Unit 27.
Year n % 4 Points ∀90% CI 1992 154 63 (56-70) 1993 70 41 (31-51) 1994 25 64 (46-82) 1995 40 50 (36-64) 1996 32 59 (43-75) 1997 26 54 (36-72) 1998 48 85 (76-95) 1999 40 68 (54-81) Table 16. Age structure of antlered deer harvest from the Salmon Region units.
1991-1995 1996-1999 Units n % 4 Points (90% CI) n % 4 Points (90% CI) 21 95 48 (39-57) 80 30 (21-39) 21A 100 41 (32-50) 88 31 (22-39) 27 324 57 (52-62) 146 69 (62-76) 28 196 35 (29-31) 128 27 (20-34) 29 103 26 (18-34) 73 30 (21-40) 30 115 31 (23-39) 85 27 (18-36) 30A 21 57 (37-77) 23 22 (5-38) 36 155 45 (38-52) 119 29 (22-37) 36A 59 54 (42-66) 41 49 (35-63) 36B 142 42 (35-49) 86 34 (25-43) 37 57 28 (17-39) 33 39 (24-55) 37A 25 40 (22-58) 25 52 (34-70)

Submitted by: Jim Hayden Jay Crenshaw Lou Nelson Regional Wildlife Manager Regional Wildlife Manager Regional Wildlife Manager Jeff Rohlman Randy Smith Carl Anderson Regional Wildlife Manager Regional Wildlife Manager Regional Wildlife Manager Brad Compton Tom Keegan Regional Wildlife Manager Regional Wildlife Manager Approved by: IDAHO DEPARTMENT OF FISH AND GAME Wayne Melquist Tom Parker Wayne Melquist Tom Parker, Acting Chief State Nongame Wildlife Manager Bureau of Wildlife Federal Aid Coordinator

IDAHO
GAME MANAGEMENT UNITS

FEDERAL AID IN WILDLIFE RESTORATION
The Federal Aid in Wildlife Restoration Program consists of funds from a
10% to 11% manufacturer’s excise tax collected from the sale of
handguns, sporting rifles, shotguns, ammunition, and archery equipment.
The Federal Aid program then allots the funds back to states through a
formula based on each state’s
geographic area and the number of
paid hunting license holders in the
state. The Idaho Department of
Fish and Game uses the funds to
help restore, conserve, manage,
and enhance wild birds and
mammals for the public benefit.
These funds are also used to
educate hunters to develop the skills, knowledge, and attitudes necessary
to be responsible, ethical hunters. Seventy-five percent of the funds for
this project are from Federal Aid. The other 25% comes from license-
generated funds.