Prince William County, Virginia - pwcgov.org Saf… · Prince William County, Virginia . Public...
295
Prince William County, Virginia Public Safety Retention & Recruitment Study January 16, 2018 PFM Group Consulting, LLC 1735 Market St 43 rd Floor Philadelphia, PA 19103
-
Upload
vuongthuan -
Category
Documents
-
view
222 -
download
0
Transcript of Prince William County, Virginia - pwcgov.org Saf… · Prince William County, Virginia . Public...
Prince William County, Virginia Public Safety Retention & Recruitment Study January 16, 2018
PFM Group Consulting, LLC 1735 Market St 43rd Floor Philadelphia, PA 19103
2 | P a g e
I. Contents I. Executive Summary ................................................................................................................. 4
II. Organization of Report and Methodology .............................................................................. 8
III. Recommended Options ........................................................................................................ 13
General Recommended Options .............................................................................................. 14
Police Recommended Options .................................................................................................. 17
Fire & Rescue Recommended Options ..................................................................................... 26
Sheriff’s Office Recommended Options ................................................................................... 35
Adult Detention Center Recommended Options ..................................................................... 42
IV. Pay Plan Analysis and Comparison of Public Safety Pay Plans ............................................. 50
V. Retirement and Health Benefits ........................................................................................... 57
VI. Police ..................................................................................................................................... 64
Summary of Findings................................................................................................................. 64
Prince William County Police Compensation............................................................................ 66
Northern Virginia Police Compensation ................................................................................... 72
Retention of Police Personnel .................................................................................................. 92
Police Recruitment .................................................................................................................. 127
VII. Fire & Rescue Compensation, Retention, and Recruitment ............................................ 141
Prince William County Fire and Rescue Compensation .......................................................... 143
Northern Virginia Fire and Rescue Compensation ................................................................. 146
Retention of Fire and Rescue Personnel ................................................................................. 163
Fire and Rescue Recruitment .................................................................................................. 191
VIII. Sheriff’s Office Compensation, Retention, and Recruitment .......................................... 203
Summary of Findings............................................................................................................... 203
Prince William County Sheriff’s Office Compensation ........................................................... 205
Northern Virginia Sheriff’s Office Compensation ................................................................... 209
Retention of Deputy Sheriffs .................................................................................................. 218
Sheriff’s Office Recruitment.................................................................................................... 232
IX. Adult Detention Center Compensation, Retention, and Recruitment ............................... 239
Summary of Findings............................................................................................................... 239
Prince William County ADC Compensation ............................................................................ 241

3 | P a g e
Northern Virginia Jail Officer Compensation .......................................................................... 244
Retention of ADC Personnel ................................................................................................... 254
Recruitment ............................................................................................................................ 276
X. Appendix I. Discussion of Retention Best Practices ............................................................ 289
XI. Appendix II. Public Safety Pay Scales .................................................................................. 292
4 | P a g e
I. Executive Summary This report examines the retention experience of each of Prince William County’s four public safety employee groups – Police, Fire and Rescue, Sheriff’s Office, and the Adult Detention Center (ADC). While the retention experience of each public safety employee group is different – and driven by distinct factors – all County public safety agencies face challenges involving compensation competitiveness and employee satisfaction.
To evaluate compensation competitiveness, the County’s compensation package and pay structures are benchmarked against a comparison group of regional Northern Virginia employers. Additionally, Prince William County public safety quit rates and turnover rates are compared with equivalent turnover data reported by other regional public safety agencies to provide context for interpreting the County’s retention experience.
To evaluate major external and internal factors that influence why public safety employees choose to remain or leave County employment, insights were derived from a series of focus groups and online surveys. Recruitment processes, as well as attitudes/perspectives of new recruits, were evaluated as well.
Based on the sum of these analyses, the project team developed a series of recommended options for consideration that are designed to help preserve a competitive recruitment package, improve employee satisfaction, and stabilize the County’s public safety retention experience. While fiscal and operational concerns may require the County to prioritize among and/or modify these recommended options, it is the sincere hope of the project team that this analysis helps to inform a positive path forward.
Summary of Findings
For any organization, recruitment and retention experience is driven by a mix of internal and external factors outlined in the figure on the following page. Such organizational dynamics are complex, and for Prince William County, the interplay of these dynamics is different in each public safety agency.

5 | P a g e
Internal and External Factors Affecting Recruitment and Retention
As noted in the upper right-hand quadrant of the figure above, job satisfaction, compensation competitiveness, and retention are interconnected.
Insights from focus groups and employee surveys indicate that compensation represents the principal factor driving Prince William County public safety employee attrition. While the particulars vary – sometimes considerably – across each public safety employee group, three general conditions contribute to Prince William County public safety employee dissatisfaction around compensation:
• Pay compression, where employees with more tenure or a higher rank earn less base compensation (or insufficient differentials) relative to less tenured employees.
• Lower pay levels for mid-career employees relative to other regional employers.
• An inability to project future earnings, where employees cannot clearly estimate earnings
five, ten, or fifteen years into the future. Generally, Prince William County offers competitive entry rates for each of the public safety classifications analyzed – police officer, fire and rescue technician, jail officer, and sheriff’s deputy. The County’s strong starting rate, supported by recruitment processes that are perceived

6 | P a g e
favorably by recruits and a positive reputation for the County’s public safety agencies, generates a consistent pipeline of recruits.
Prince William County public safety employees move through pay ranges over the course of a career through a combination of pay-for-performance increases and market pay adjustments. While the County’s pay ranges are competitive to other regional employers, pay-for-performance increases may vary from year-to-year. In contrast, most public safety employers in the region have a well-defined pay progression (e.g., a pay scale) that allows employees to more easily estimate future earnings.
Since the end of the Great Recession wage growth in Prince William County has trailed other regional employers. As a result, the actual pay levels for many Prince William County public safety employees – particularly those in the middle of a career – often lag their counterparts with the same tenure in comparison jurisdictions.
The comparatively slow wage growth experienced by Prince William County public safety personnel, coupled with the lack of a pay scale or similar pay progression, has led many early and mid-career employees to question whether they will reach the top of their respective pay ranges during their careers. This inability to project future earnings, in combination with pay compression and comparatively lower compensation levels, serve as motivation for many public safety employees to consider other employment opportunities.
Consequently, within the first few years of service, Prince William County experiences increased rates of voluntary resignations among public safety employees. Other drivers of these quit rates vary by employee group, in part, according to internal and external factors specific to each profession. These factors are explored in greater depth in the subsequent chapters on each public employee group.
To address the conditions that contribute to employee dissatisfaction and turnover, this report outlines a set of options for the County to consider in the context of a revised long-term compensation plan. The recommended options presented in this report address retention concerns on an issue-by-issue basis. However, any approach to address retention challenges faced by County public safety employees should do so in a comprehensive, holistic fashion. Alleviating pay compression among current employees, for example, without addressing the underlying structural conditions that caused pay compression, will lead to its re-emergence in the future.

7 | P a g e
Some of the highlights of the recommended options include:
• Implement targeted pay adjustments tailored to each public safety employee group. These adjustments would be added to base pay and targeted towards employees who experience the most severe pay compression. These adjustments could be implemented in two phases, as outlined in the scenario below:
o FY 2019: Phase I targeted pay adjustment + 3% pay-for-performance (pending consideration by Board of County Supervisors)
o FY 2020: Phase II targeted pay adjustment + 3% pay-for-performance (pending consideration by Board of County Supervisors)
• Develop pay scales for each public safety employee group to alleviate pay compression pressures, help to align mid-career compensation more closely with regional comparison employers, and to provide a framework for employees to better project future earnings.
o In the scenario listed above, all public safety employees would be migrated to a
pay scale by FY 2020 with the implementation of the Phase II targeted pay adjustment.
• Streamline recruitment incentives and use slotting practices to align base compensation of new hires with prior experience, education, and/or certifications with more tenured employees, thereby alleviating pay compression for future hires.
These recommended options have been designed to respond to concerns raised in the employee surveys and focus group interviews. The employee survey data suggest that a large proportion of active employees favor a more structured, predictable pay plan where more tenured officers receive higher pay levels.
A total of 28 recommended options are presented in this report. They address both economic issues for each employee group (e.g., hiring practices at entry, pay premiums) as well as working conditions (e.g., shift schedules). Taken as a whole, these options are anticipated to address many of the most pressing retention issues facing Prince William County’s public safety agencies, improve employee satisfaction, and mitigate employee turnover while maintaining a strong pipeline of future recruits.
8 | P a g e
II. Organization of Report and Methodology The central purpose of this study is to evaluate public safety employee retention in Prince William County, and provide a series of recommended options designed to improve the County’s employee retention rates and job satisfaction. The following chapter (Chapter III) provides a detailed set of recommended options or initiatives designed to improve public safety retention and job satisfaction. These recommended options are categorized by public safety employee group. Chapter IV compares the structure of pay plans among Northern Virginia jurisdictions to provide insight into how public pay plans – and public safety functions – are organized in the region. Chapter V presents Prince William County’s benefits package, and provides comparisons with the Northern Virginia comparison group. The subsequent chapters (Chapters VI, VII, VIII, and IX) provide an overview of compensation for each Prince William County public safety employee group, compensation comparisons with regional employers, insights from employee surveys, as well as an analysis of the Departments’ recruitment efforts and perspectives from newly hired employees. Study Methodology
Over the course of the study, the project team used a variety of tools to evaluate Prince William County’s retention experience. This evaluation included a variety of analytical and research techniques aimed at matching available data with current experience to arrive at the underlying issues impacting the police and fire departments, as well as the Sheriff’s Office and the Adult Detention Center. These tools focused on Prince William County as well as outside agencies. The tools used in this study included:
• Interviews with Prince William County staff;
• Review of payroll data for each employee group provided by Prince William County Department of Human Resources as of 12/31/2016;1
• On-site interviews with uniformed personnel from each county public safety agency. This included multiple interviews and focus groups with public safety employees from recruits through third-line supervisors, as well as, multiple meetings with command staff;
• Compensation and retention surveys of large Northern Virginia jurisdictions;
• Surveys of recruits, current employees, and separated employees (administered through an online survey platform); and
1 Payroll runs for each employee group exclude employees with more than one year of completed service and worked fewer than 2,080 annual hours in the Police Department, Sheriff’s Office, and Adult Detention Center and employees who worked fewer than 2,184 annual hours in the Department of Fire and Rescue.
9 | P a g e
• Employee exit surveys collected by the Police Department and Department of Fire and
Rescue.
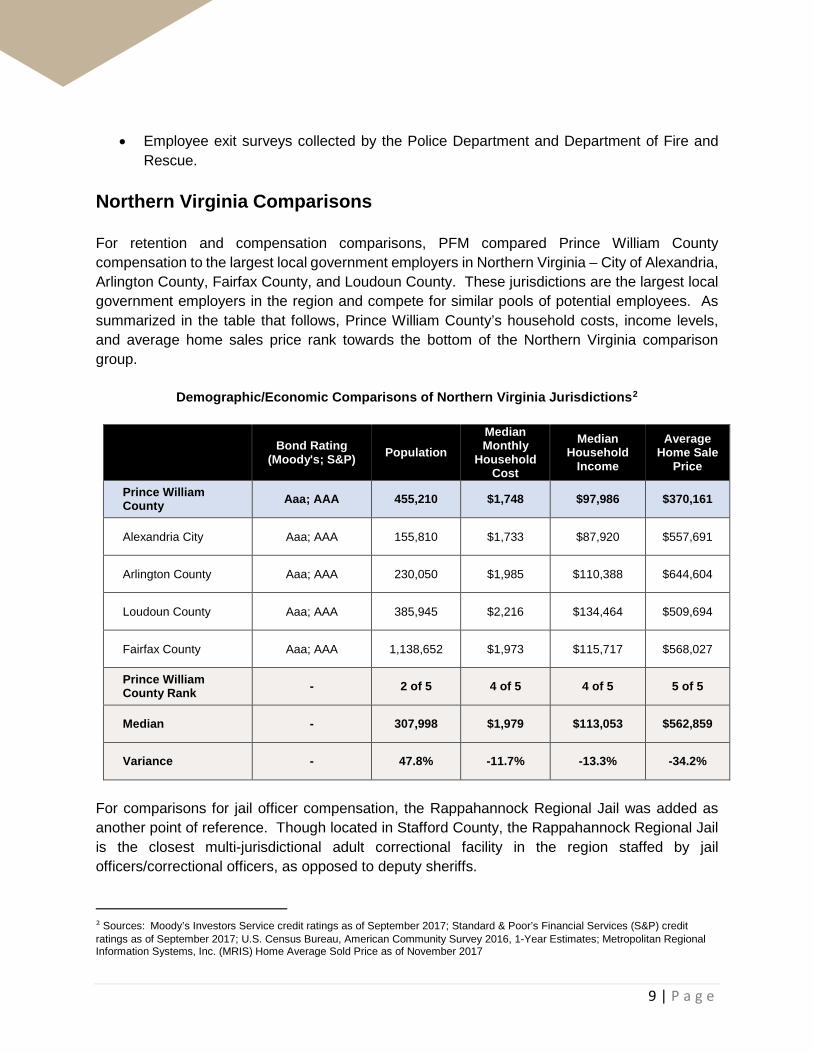
Northern Virginia Comparisons For retention and compensation comparisons, PFM compared Prince William County compensation to the largest local government employers in Northern Virginia – City of Alexandria, Arlington County, Fairfax County, and Loudoun County. These jurisdictions are the largest local government employers in the region and compete for similar pools of potential employees. As summarized in the table that follows, Prince William County’s household costs, income levels, and average home sales price rank towards the bottom of the Northern Virginia comparison group.
Demographic/Economic Comparisons of Northern Virginia Jurisdictions2
Bond Rating (Moody's; S&P) Population
Median Monthly
Household Cost
Median Household
Income
Average Home Sale
Price
Prince William County Aaa; AAA 455,210 $1,748 $97,986 $370,161
Alexandria City Aaa; AAA 155,810 $1,733 $87,920 $557,691
Arlington County Aaa; AAA 230,050 $1,985 $110,388 $644,604
Loudoun County Aaa; AAA 385,945 $2,216 $134,464 $509,694
Fairfax County Aaa; AAA 1,138,652 $1,973 $115,717 $568,027
Prince William County Rank - 2 of 5 4 of 5 4 of 5 5 of 5
Median - 307,998 $1,979 $113,053 $562,859
Variance - 47.8% -11.7% -13.3% -34.2%
For comparisons for jail officer compensation, the Rappahannock Regional Jail was added as another point of reference. Though located in Stafford County, the Rappahannock Regional Jail is the closest multi-jurisdictional adult correctional facility in the region staffed by jail officers/correctional officers, as opposed to deputy sheriffs. 2 Sources: Moody’s Investors Service credit ratings as of September 2017; Standard & Poor’s Financial Services (S&P) credit ratings as of September 2017; U.S. Census Bureau, American Community Survey 2016, 1-Year Estimates; Metropolitan Regional Information Systems, Inc. (MRIS) Home Average Sold Price as of November 2017
10 | P a g e
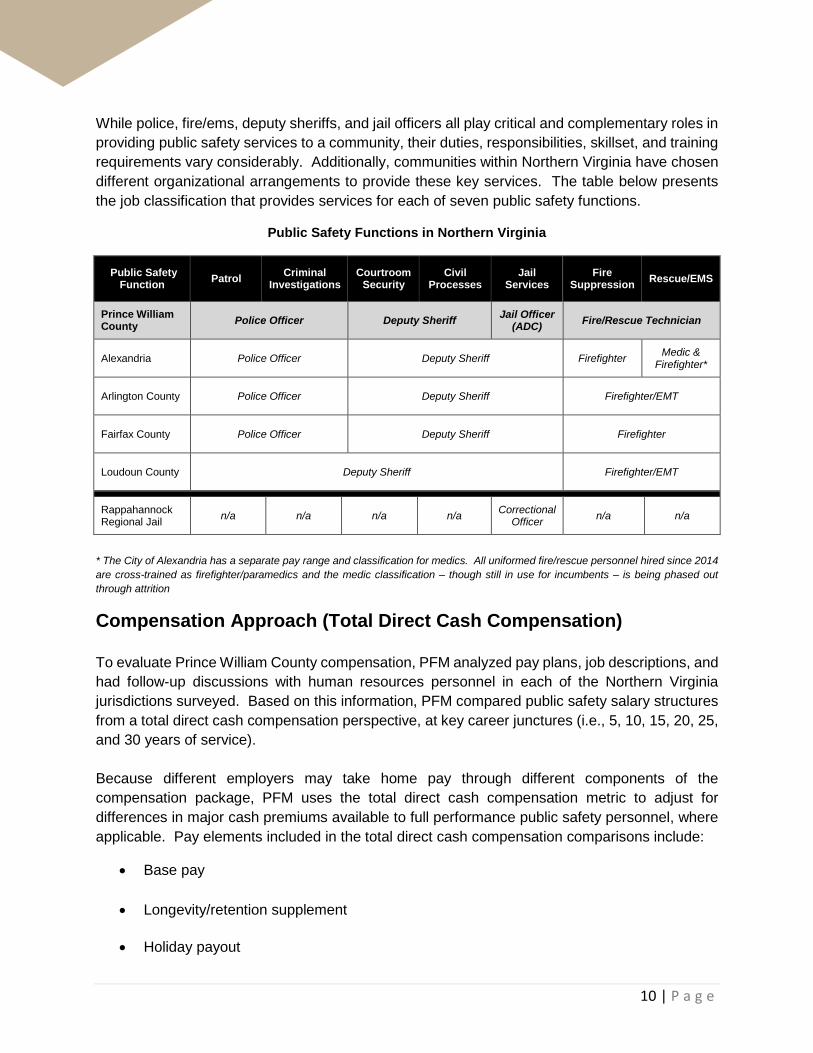
While police, fire/ems, deputy sheriffs, and jail officers all play critical and complementary roles in providing public safety services to a community, their duties, responsibilities, skillset, and training requirements vary considerably. Additionally, communities within Northern Virginia have chosen different organizational arrangements to provide these key services. The table below presents the job classification that provides services for each of seven public safety functions.
Public Safety Functions in Northern Virginia
Public Safety Function Patrol Criminal
Investigations Courtroom
Security Civil
Processes Jail
Services Fire
Suppression Rescue/EMS
Prince William County Police Officer Deputy Sheriff Jail Officer
(ADC) Fire/Rescue Technician
Alexandria Police Officer Deputy Sheriff Firefighter Medic & Firefighter*
Arlington County Police Officer Deputy Sheriff Firefighter/EMT
Fairfax County Police Officer Deputy Sheriff Firefighter
Loudoun County Deputy Sheriff Firefighter/EMT
Rappahannock Regional Jail n/a n/a n/a n/a Correctional
Officer n/a n/a
* The City of Alexandria has a separate pay range and classification for medics. All uniformed fire/rescue personnel hired since 2014 are cross-trained as firefighter/paramedics and the medic classification – though still in use for incumbents – is being phased out through attrition
Compensation Approach (Total Direct Cash Compensation) To evaluate Prince William County compensation, PFM analyzed pay plans, job descriptions, and had follow-up discussions with human resources personnel in each of the Northern Virginia jurisdictions surveyed. Based on this information, PFM compared public safety salary structures from a total direct cash compensation perspective, at key career junctures (i.e., 5, 10, 15, 20, 25, and 30 years of service). Because different employers may take home pay through different components of the compensation package, PFM uses the total direct cash compensation metric to adjust for differences in major cash premiums available to full performance public safety personnel, where applicable. Pay elements included in the total direct cash compensation comparisons include:
• Base pay
• Longevity/retention supplement
• Holiday payout

11 | P a g e
• Scheduled overtime, uniform allowance, and shift differential
Given that annual hours worked for fire and rescue personnel vary across Departments in the region, PFM also evaluated standard schedule hours and major forms of paid leave (vacation, holiday leave, personal leave). Such allowances are subtracted from regularly scheduled annual hours to yield net hours worked. Total direct cash compensation is then divided by net annual hours to yield an hourly rate for total direct cash compensation per net hour worked.
Career cash compensation analyses for Prince William County were based on payroll runs effective December 31, 2016. This approach captured the effects of historical freezes in pay-for-performance. To approximate actual pay levels by year of service in the comparison jurisdictions – which may not be reflected in fixed pay schedules or pay ranges – PFM applied historical freezes in step increments or merit increments in the comparison jurisdictions, where and when they occurred, in all career compensation comparisons. The compensation data presented are a snapshot based on 12/31/2016 payroll provided by the Department of Human Resources. A jurisdiction’s relative position in the comparison group may change over time, and require regular evaluation. Some additional studies are underway around the region that could have an impact on the County’s relative standing, but the details of such changes, if any, have yet to be determined.
At the same time, this analytical framework does not include unscheduled overtime or other variable premiums such as pay based on special assignments, or pay for special skills or credential, nor does it include non-cash benefits. For total direct cash compensation tables, comparisons are shown on a 20-year, 25-year, and 30-year career average basis, which averages the pay received for each year of service on the current schedule.
It is important to note that this methodology for determining pay yields an approximation of earnings for a typical employee. Actual experience may vary based on shift distribution, historical step increases/pay-for-performance increases, recruitment incentives included in base pay, as well as other factors such as specialty assignments.
Survey Data
To provide insight on retention challenges, PFM developed separate surveys for benchmarked jurisdictions, as well as Prince William County employee groups.
For the Northern Virginia jurisdictions, PFM asked uniformed agencies to report public safety headcounts, separations for all causes, and resignations over the past five fiscal years. Some jurisdictions did report data for all employee groups for all years. From these data, PFM calculated the separation rates and quit rates presented in this study.
Additionally, PFM developed a series of employee surveys for circulation to recruits, active employees, and separated employees. The goal of the surveys was to solicit input, insight and

12 | P a g e
perspectives on recruitment and retention issues facing each public safety agency. Themes in the surveys were gleaned from issues raised by command staff, as well as topics surfaced in focus groups with various employee groups. The total number of surveys administered and the responses received by category are provided in the table below.
Survey Response Rates
Survey Group Number Surveyed
Responses Received
Response Rate (%)
Police Recruits 47 46 98%
Police Current Employees 588* 364 62%
Police Separated Employees (includes retirees) 207 60 29%
Fire/Rescue Recruits 30* 27 90%
Fire/Rescue Current Employees 550* 423 77%
Fire/Rescue Separated Employees 7 4 57%
ADC Pre-Academy Employees 28 22 79%
ADC Current Employees 272 234 86%
ADC Separated Employees 56 4 7%
Deputy Sheriff Current Employees 101 63 62%
Deputy Sheriff Separated Employees 18 9 50%
* denotes an estimate provided by the department
13 | P a g e
III. Recommended Options This chapter outlines a series of recommended strategic options that Prince William County may consider to address its public safety employee retention challenges. The PFM project team focused on drivers of attrition that surfaced in employee focus groups and surveys, and meetings with Departmental command staff. Where appropriate, PFM benchmarked Prince William County practices against the Northern Virginia comparison group – the City of Alexandria, Arlington County, Fairfax County, and Loudoun County. For Adult Detention Center (ADC) comparisons, the Rappahannock Regional Jail was included in the comparison group as it is the nearest multi-jurisdictional detention facility staffed by correctional officers/jail officers (as opposed to deputy sheriffs).
The most salient issues articulated to the project team revolved around compensation – pay compression, pay levels, and the inability to project future earnings. Accordingly, many of the recommended options listed in the following pages – if enacted – will entail an increase in costs to the County.
The recommended options are designed to align with a series of compensation related guiding principles articulated to the project team by County leadership:
• Create a clear compensation path for public safety employees throughout the duration of a career.
• Strive to provide equal pay-for-performance increases across all public safety employee groups.
• Create or maintain competitive entry rates to retain a strong pipeline of recruits for each public safety career path.
• Attempt to close pay gaps with key regional competitors.
• Preserve budgetary flexibility in future years.
Recommended options and findings listed below are presented as a “menu of options” and represent a series of ideas designed to improve the County’s retention experience while retaining a strong recruitment package. These recommended options must be considered within the context of the County’s overall budget resources, constraints, and priorities. This consideration may, appropriately, lead to some recommended approaches being prioritized over others, and/or tailored to fit within available resources, and/or implemented over time as resources allow. Additionally, many of these recommended options require changes to Departmental practices and/or approval by the Board of County Supervisors.
Where possible, general cost estimates are provided for recommended options. These cost estimates reflect base pay only, are based on the payroll data run effective December 31, 2016 with simplifying assumptions, and are shown to represent the potential order of magnitude for

14 | P a g e
each recommended option. Additional analysis will be required to perform updated and refined cost estimates of each recommended option.
The first section of this chapter presents a series of recommended options that touch all public safety employee groups. The subsequent sections provide additional detail on specific recommended options for each public safety employee group. The final section presents additional options for the County to consider that target employee satisfaction, and may have indirect effects on improving retention rates.
General Recommended Options
Recommended Option #1: Implement targeted pay adjustments for each public safety employee group to address pay compression and improve market competitiveness
Targeted pay adjustments are designed to address pay compression, align tenure with years of service at the Department, and improve the County’s relative position with regional public safety agencies. In focus groups and employee surveys, pay compression and lagging pay levels relative to other regional departments are common themes for voluntary resignations and employee dissatisfaction. The targeted pay adjustments address each of these concerns. All public safety employee groups show evidence of pay compression within their compensation plans. Pay compression occurs when there are inadequate pay differentials between employees within the same rank or between employees in subordinate and supervisory ranks. In some instances, employees with longer tenure earn lower base pay than employees with less tenure. To address pay compression, targeted pay adjustments are designed to align base compensation with tenure, target pay increases towards employees whom have experienced the slowest wage growth since the Great Recession, and alleviate pay compression across ranks. Additionally, the pay adjustment will improve the County’s relative position with public safety employers in the region. While the County’s pay ranges are competitive relative to the Northern Virginia comparison group; as a whole, Prince William County public safety employees have moved more slowly through their pay ranges relative to public safety employees in the region since the Great Recession. As a result, the actual pay levels for many Prince William County public safety employees – particularly those in the middle of a career – often their counterparts with the same tenure in comparison jurisdictions. Accordingly, the targeted pay adjustments, in concert with regular pay-for-performance increases (presuming Board of County Supervisors approval), are designed to accelerate employees through existing pay ranges. The dollar amount of the targeted pay adjustment received by each employee will depend on the following factors:
• Public safety employee group;
• Tenure;

15 | P a g e
• Base pay (inclusive of applicable recruitment incentives and supplemental pays rolled
into base pay); and
• Rank. The recommended pay adjustments listed in the pages that follow are broken into two phases:
• Implement targeted pay adjustments that are designed to primarily address pay compression and direct resources to employees who experienced the slowest wage growth since the Great Recession, as well as improve market competitiveness.
• Move all employees to a pay scale with 3% step increments over a multi-year time period, in concert with addressing Department-specific compensation and related operational issues.
The targeted pay adjustments may be phased-in over a multi-year period in concert with 3% annual pay-for-performance increases, if authorized by the Board of County Supervisors. Such approach would yield meaningful year-over-year wage increases for the vast majority of employees, while simultaneously addressing issues with pay compression and regional competitiveness. For example, one scenario would entail delivering the targeted pay adjustments and pay-for-performance increases over two fiscal years:
• FY 2019: Phase I targeted pay adjustment + 3% pay-for-performance (pending consideration by Board of County Supervisors)
• FY 2020: Phase II targeted pay adjustment + 3% pay-for-performance (pending consideration by Board of County Supervisors)
In the scenario listed above, all public safety employees would be migrated to a pay scale by FY 2020 with the implementation of the Phase II targeted pay adjustment. Additionally, for agencies that provide recruitment incentives that are rolled into base pay (i.e., Police, Sheriff’s Office, and ADC), the streamlining of these incentives is recommended as well. Streamlining recruitment incentives will alleviate pay compression among new hires. The specifics of these recommended options are detailed in the sections that follow.
Estimated Cost: Estimated increases in base pay costs only (excluding “roll ups” associated with pay premiums, benefits, and related costs) are presented in the sections that follow.
16 | P a g e
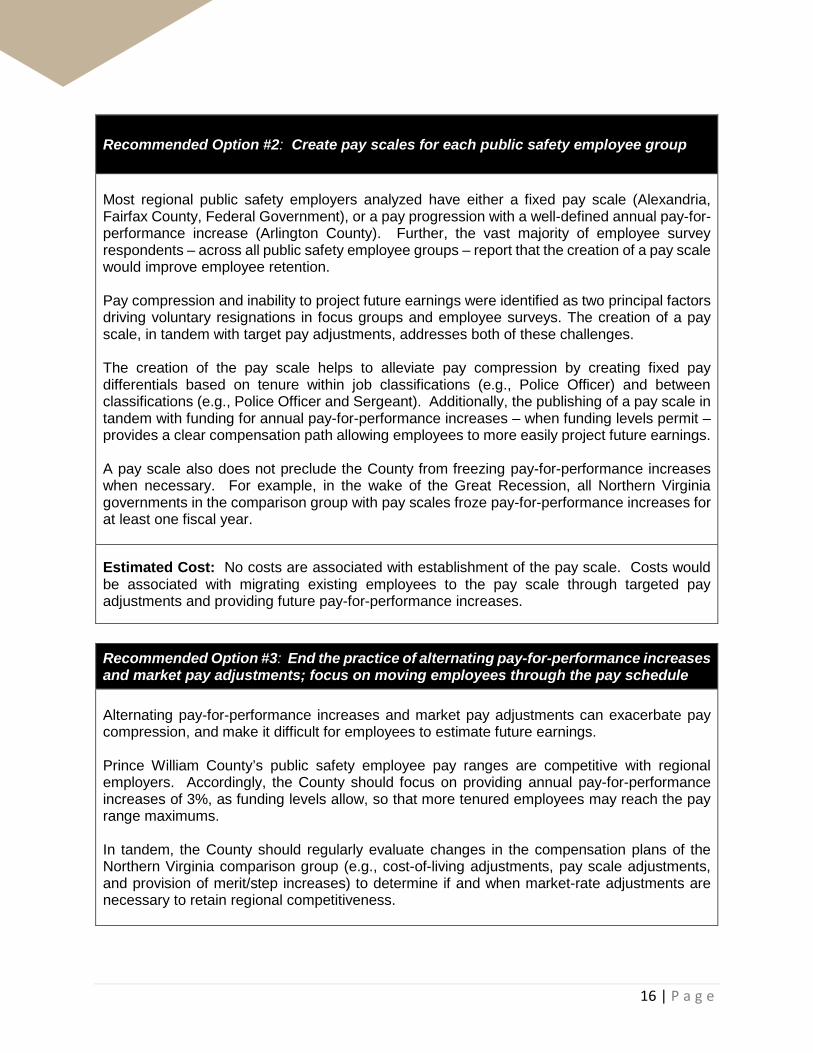
Recommended Option #2: Create pay scales for each public safety employee group
Most regional public safety employers analyzed have either a fixed pay scale (Alexandria, Fairfax County, Federal Government), or a pay progression with a well-defined annual pay-for-performance increase (Arlington County). Further, the vast majority of employee survey respondents – across all public safety employee groups – report that the creation of a pay scale would improve employee retention. Pay compression and inability to project future earnings were identified as two principal factors driving voluntary resignations in focus groups and employee surveys. The creation of a pay scale, in tandem with target pay adjustments, addresses both of these challenges. The creation of the pay scale helps to alleviate pay compression by creating fixed pay differentials based on tenure within job classifications (e.g., Police Officer) and between classifications (e.g., Police Officer and Sergeant). Additionally, the publishing of a pay scale in tandem with funding for annual pay-for-performance increases – when funding levels permit – provides a clear compensation path allowing employees to more easily project future earnings. A pay scale also does not preclude the County from freezing pay-for-performance increases when necessary. For example, in the wake of the Great Recession, all Northern Virginia governments in the comparison group with pay scales froze pay-for-performance increases for at least one fiscal year.
Estimated Cost: No costs are associated with establishment of the pay scale. Costs would be associated with migrating existing employees to the pay scale through targeted pay adjustments and providing future pay-for-performance increases.
Recommended Option #3: End the practice of alternating pay-for-performance increases and market pay adjustments; focus on moving employees through the pay schedule Alternating pay-for-performance increases and market pay adjustments can exacerbate pay compression, and make it difficult for employees to estimate future earnings. Prince William County’s public safety employee pay ranges are competitive with regional employers. Accordingly, the County should focus on providing annual pay-for-performance increases of 3%, as funding levels allow, so that more tenured employees may reach the pay range maximums. In tandem, the County should regularly evaluate changes in the compensation plans of the Northern Virginia comparison group (e.g., cost-of-living adjustments, pay scale adjustments, and provision of merit/step increases) to determine if and when market-rate adjustments are necessary to retain regional competitiveness.

17 | P a g e
Estimated Cost: To be determined. Funding for pay-for-performance increases may be limited in future years, especially during economic downturns.
Recommended Option #4: Eliminate performance plus pay; re-direct savings into other areas of compensation plan
Prince William County public safety employees are eligible for performance plus pay, a one-time payment based on employee evaluations. Employees who receive an “exceeds” rating earn an additional 1% lump-sum payment; employees with a “greatly exceeds” rating receive an additional lump-sum payment of 2%. The projected cost of performance plus pay in FY 2019 is approximately $800,000. In focus groups, however, public safety employees generally reported that performance plus pay was not viewed as a meaningful component of compensation because the payment is not added to base pay, and employees are not guaranteed to earn the payment each year. Additionally, no employer in the region provides a similar payment for public safety employees. Accordingly, the County should consider re-directing resources from performance plus pay towards strategic options that are more highly valued by employees. For example, using proceeds to partially fund targeted pay adjustments (Recommended Option #1) or annual pay-for-performance increases (Recommended Option #3) may help to improve the County’s retention experience.
Estimated Cost: Elimination of performance plus pay will result in cost savings of approximately $800,000 in FY 2019.
Police Recommended Options
Recommended Option #5: Enact Phase I targeted pay adjustment
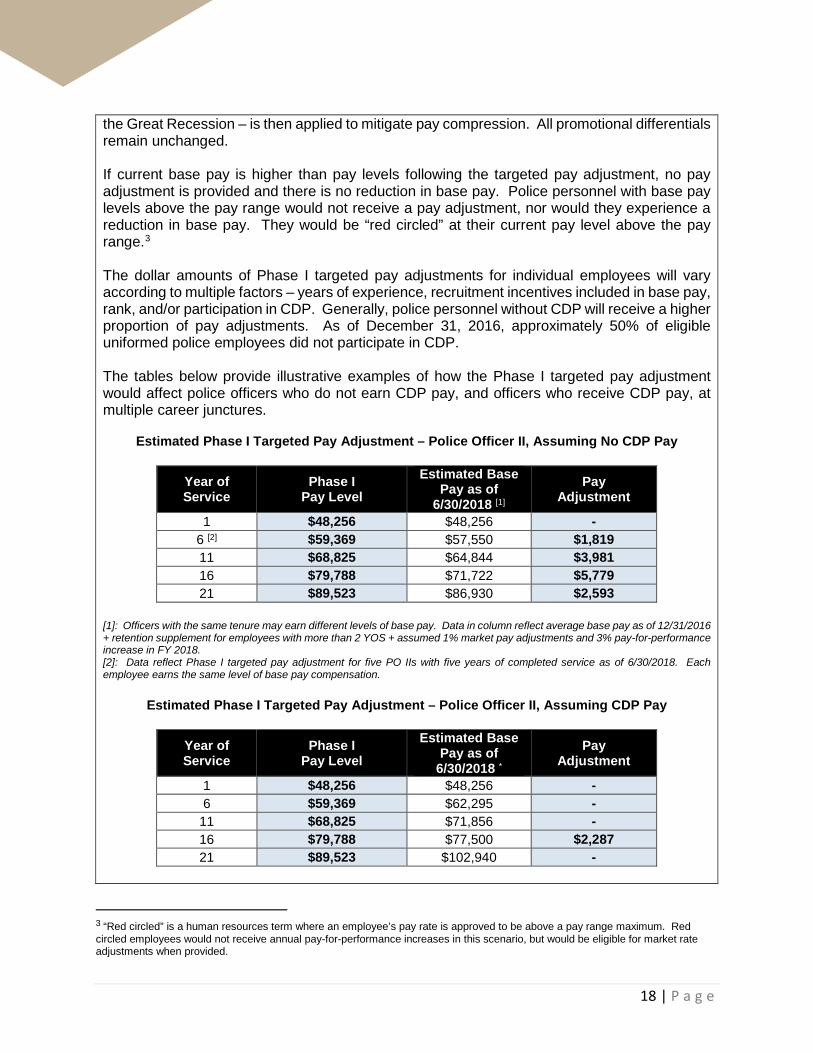
The Phase I targeted pay adjustment is designed to address pay compression and direct resources to employees who have experienced the slowest wage growth since the Great Recession. Currently, police officers with the same tenure may earn different levels of base pay. Additionally, some officers with longer tenure earn lower base pay levels than officers with shorter tenure, negatively affecting job satisfaction. The targeted pay adjustments level the pay progression – i.e., officers with the same tenure will earn similar levels of base pay regardless of prior experience, education, and certifications. The targeted pay adjustments are broken into two phases. For Phase I of the targeted pay adjustment, retention supplement and Career Development Pay (CDP) are rolled into base pay. A pay adjustment – which directs resources to employees with the slowest wage growth since
18 | P a g e
the Great Recession – is then applied to mitigate pay compression. All promotional differentials remain unchanged. If current base pay is higher than pay levels following the targeted pay adjustment, no pay adjustment is provided and there is no reduction in base pay. Police personnel with base pay levels above the pay range would not receive a pay adjustment, nor would they experience a reduction in base pay. They would be “red circled” at their current pay level above the pay range.3
The dollar amounts of Phase I targeted pay adjustments for individual employees will vary according to multiple factors – years of experience, recruitment incentives included in base pay, rank, and/or participation in CDP. Generally, police personnel without CDP will receive a higher proportion of pay adjustments. As of December 31, 2016, approximately 50% of eligible uniformed police employees did not participate in CDP. The tables below provide illustrative examples of how the Phase I targeted pay adjustment would affect police officers who do not earn CDP pay, and officers who receive CDP pay, at multiple career junctures.
Estimated Phase I Targeted Pay Adjustment – Police Officer II, Assuming No CDP Pay
Year of Service
Phase I Pay Level
Estimated Base Pay as of
6/30/2018 [1] Pay
Adjustment
1 $48,256 $48,256 - 6 [2] $59,369 $57,550 $1,819 11 $68,825 $64,844 $3,981 16 $79,788 $71,722 $5,779 21 $89,523 $86,930 $2,593
[1]: Officers with the same tenure may earn different levels of base pay. Data in column reflect average base pay as of 12/31/2016 + retention supplement for employees with more than 2 YOS + assumed 1% market pay adjustments and 3% pay-for-performance increase in FY 2018. [2]: Data reflect Phase I targeted pay adjustment for five PO IIs with five years of completed service as of 6/30/2018. Each employee earns the same level of base pay compensation.
Estimated Phase I Targeted Pay Adjustment – Police Officer II, Assuming CDP Pay
Year of Service
Phase I Pay Level
Estimated Base Pay as of
6/30/2018 * Pay
Adjustment
1 $48,256 $48,256 - 6 $59,369 $62,295 -
11 $68,825 $71,856 - 16 $79,788 $77,500 $2,287 21 $89,523 $102,940 -
3 “Red circled” is a human resources term where an employee’s pay rate is approved to be above a pay range maximum. Red circled employees would not receive annual pay-for-performance increases in this scenario, but would be eligible for market rate adjustments when provided.

19 | P a g e
* Officers with the same tenure may earn different levels of base pay. Data in column reflects average base pay as of 12/31/2016 + retention supplement for employees with more than 2 YOS + average Career Development Pay + assumed 1% market pay adjustments and 3% pay-for-performance increase in FY 2018. There were 373 Police Officers II’s captured in the December 31, 2016 payroll run. Assuming no promotions and no attrition, and assuming each employee receives a 1% market pay adjustment and 3% pay-for-performance increase in FY 2018, approximately 57% of PO II’s (214) would receive a Phase I targeted pay adjustment averaging approximately $3,865. As previously noted, pay adjustments for individual officers will vary according to multiple factors – years of experience, recruitment incentives currently in base pay, and/or participation in CDP. To avoid pay compression between the ranks, similar targeted pay adjustments will be required for supervisory ranks. The table that follows provides a summary of the estimated Phase I targeted pay adjustment based on the December 31, 2016 payroll run for police employees by rank.
Estimates of Phase I Targeted Pay Adjustment – Police Employees, by Rank
# of Employees
# of Employees
w/ Pay Adjustment
% of Employees Receiving Pay
Adjustment Total $ Amount
Avg. $ Amount per Employee Receiving
Adjustment
PO I 80 26 32.5% $18,913 $727 PO II 373 214 57.4% $827,170 $3,865 Sergeant 61 39 63.9% $235,487 $6,038 First Sergeant 29 18 62.1% $73,433 $4,080 Lieutenant 29 8 27.6% $31,327 $3,916 Captain 7 1 14.3% $1,819 $1,819 Total 579 306 52.8% $1,188,148 $3,649
Estimated Costs: Approximately $1.2 million, based on a December 31, 2016 payroll run (assuming no promotions, hiring, or attrition); excluding fiscal impacts on benefits costs (e.g., employer pension payments, FICA) and pay premiums (e.g., overtime, holiday pay). Rolling pay supplements into base pay can increase other premiums. Retention supplement and CDP are already included in calculations of overtime and holiday pay, and are considered pensionable compensation.
Recommended Option #6: Create new pay scale for police personnel
Prince William County’s rate of voluntary resignations for police personnel – i.e., “quits” or quit rate – is among the highest within the Northern Virginia comparison group (5.5% for all ranks in Prince William County in FY 2017 vs. 0.8% in Fairfax County and 2.8% in Alexandria, respectively). Insights from the police employee survey suggest the lack of well-defined pay progression contributes to the Department’s comparatively high quit rate:
• Nearly 96% of survey respondents reported that the creation of a pay scale would improve police officer retention.
20 | P a g e
• More than 95% of respondents agreed with the statement that “employees with a
longer tenure should earn higher base pay than employees who joined the Department more recently.”
• More than 85% of police employee survey respondents reported that they were unable
to reasonably estimate their future earnings in the next five, 10, or 15 years. Most regional governments surveyed have a pay scale, or a pay progression with a well-defined annual pay-for-performance increase, for uniformed police positions. The recommended pay scale, coupled with the targeted pay adjustments (Recommended Options #5 and #7) will provide greater clarity for future earnings potential, help mitigate pay compression, and improve the County’s compensation levels relative to other Northern Virginia Police Departments. The career progression and pay scale for police officers would be as follows:
• Start at minimum of grade PS 14 ($52,749) and combine Police Officer I and Police Officer II classifications The recommended pay scale moves police officers from grade PS 13 to grade PS 14 at entry. This action is taken to improve competitiveness of police officer pay during the early years of a career – when voluntary resignations are most likely – as well as align Prince William County law enforcement pay practices with other public employers in Northern Virginia. In Northern Virginia, as well as many jurisdictions throughout the Country, pay for police officers with primary patrol responsibility is most commonly set above deputy sheriff and jail officer pay. This is a function, in part, of the distinct duties, responsibilities, working conditions, training requirements, and labor market demand for each profession. This differential may also be a reflection of the fact that, generally, officers in agencies with patrol and investigative duties confront a greater complexity of calls for service, as well as a higher frequency and volume of such calls for service. With the movement upwards of one pay grade at entry, movement to an additional pay grade (PS 15) at 18 months is unnecessary to retain regional competitiveness. All management rights regarding probationary officers should be preserved.
• Roll retention supplement and career development program pay into base pay
Rolling these two pay premiums into base pay creates greater visibility and consistency for total cash earnings, and is consistent with pay practices in the region. Among the governments surveyed, no employer has the equivalent of a “retention supplement” that is not considered part of base pay. The Prince William County retention supplement is pensionable pay, and is already viewed as base pay by the workforce. No department surveyed has an equivalent Career Development Program (CDP). In the active employee survey, approximately 83% of respondents reported that CDP is
21 | P a g e
not achieving its strategic objectives, or that they did not know the strategic objectives of the program. Further, CDP contributes to pay compression and serves as a disincentive for promotion because of current promotional differentials between ranks. However, CDP – as with the retention supplement – is also pensionable compensation and already viewed as base pay by the employees who participate in the program. For incumbents already receiving CDP, CDP payments should be added to base pay; there should be no diminishment in pay (i.e., pay cut) when the program is eliminated.
• Apply 3% annual increases for each year of service to create a pay scale
For each year of service, assuming satisfactory performance evaluation and available funding, public safety employees would be eligible for a 3% pay-for-performance pay increase up to the pay scale maximum.
• Adjust supervisory pay levels to prevent pay compression between ranks
All supervisory ranks would be placed on one grade higher to create sufficient promotional differentials between ranks, and prevent potential pay compression between ranks. This action would create a 10% promotional differential between full performance police officers (grade PS 14) and police sergeants (grade PS 16). All other promotional differentials would remain unchanged.
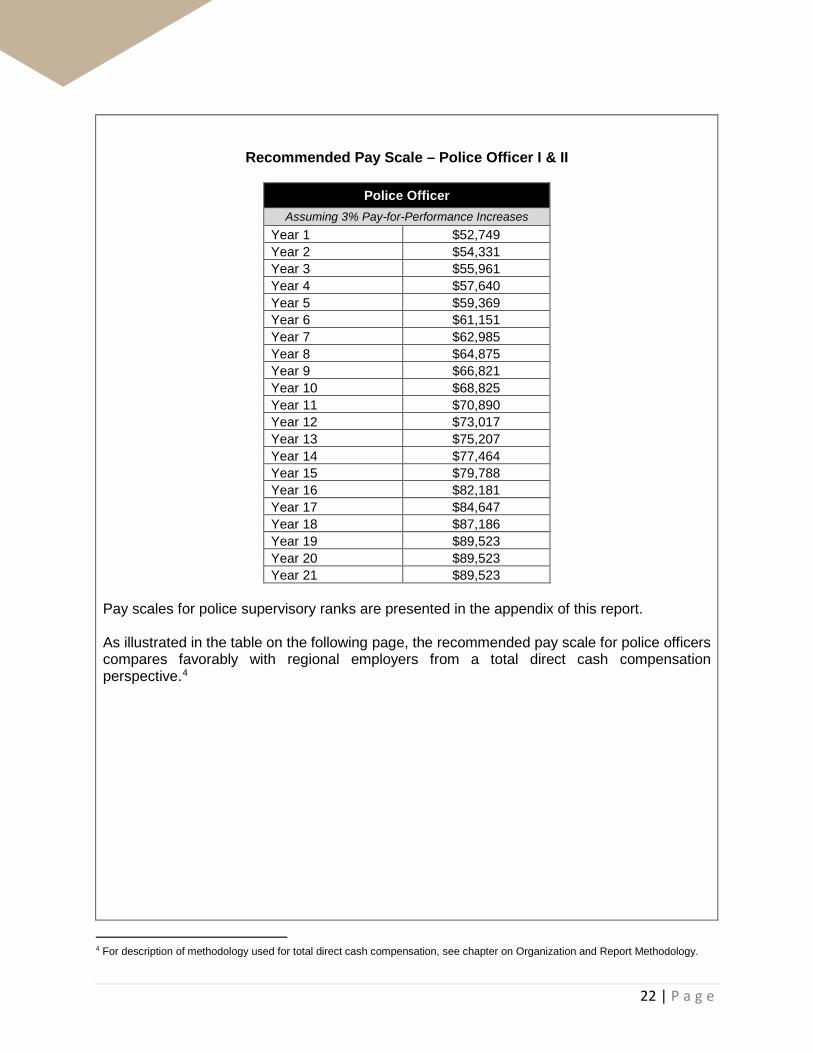
As shown in the table on the following page, the recommended pay scale provides a clear compensation path for rank-and-file police officers, with a maximum of $89,523 reached in Year 19 after 18 years of completed service (assuming annual 3% pay-for-performance increases).
22 | P a g e
Recommended Pay Scale – Police Officer I & II
Police Officer Assuming 3% Pay-for-Performance Increases
Year 1 $52,749 Year 2 $54,331 Year 3 $55,961 Year 4 $57,640 Year 5 $59,369 Year 6 $61,151 Year 7 $62,985 Year 8 $64,875 Year 9 $66,821 Year 10 $68,825 Year 11 $70,890 Year 12 $73,017 Year 13 $75,207 Year 14 $77,464 Year 15 $79,788 Year 16 $82,181 Year 17 $84,647 Year 18 $87,186 Year 19 $89,523 Year 20 $89,523 Year 21 $89,523
Pay scales for police supervisory ranks are presented in the appendix of this report. As illustrated in the table on the following page, the recommended pay scale for police officers compares favorably with regional employers from a total direct cash compensation perspective.4
4 For description of methodology used for total direct cash compensation, see chapter on Organization and Report Methodology.

23 | P a g e
Police Officer Comparisons – Prince William County vs. NOVA Departments Total Direct Cash Compensation
(Effective 6/30/2018; assumes Recommended Pay Scale)
Estimated Cost: No costs associated with the establishment of a pay scale, though the future costs associated with providing annual 3% pay-for-performance increases are to be determined.
Recommended Option #7: Enact Phase II targeted pay adjustment
Phase II of the targeted pay adjustment is designed to further mitigate pay compression, improve market competitiveness, and differentiate police officer compensation with Sheriff’s Office compensation to be consistent with employers in the regional comparison group. For Phase II of the targeted pay adjustment, the mechanics for calculating the adjustment for employees are as follows:
• Migrate employees to the recommended scale (Recommended Option #6) based on years of service with the Department.
• The difference between base pay and the pay scale represents the dollar amount of the targeted pay adjustment. If current base pay is higher than pay levels on the recommended pay scale, no pay adjustment is provided and there is no reduction in base pay.
• Police personnel with base pay levels above the pay scale would not receive a pay adjustment, nor would they experience a reduction in base pay. They would be “red circled” at their current pay level above the pay range.
Prince William County
Alexandria City
Arlington County
Fairfax County
Loudoun County
PWC Rank
NOVA Median
PWC Variance
5 YOS $66,098 $69,246 $64,285 $71,656 $60,368 3 of 5 $66,765 -1.0%
10 YOS $76,525 $82,281 $73,569 $78,789 $62,146 3 of 5 $76,179 0.5%
15 YOS $88,622 $92,078 $87,153 $90,560 $71,935 3 of 5 $88,856 -0.3%
20 YOS $96,494 $98,521 $92,896 $94,708 $83,290 2 of 5 $93,802 2.9%
25 YOS $96,494 $98,521 $92,896 $94,708 $92,203 2 of 5 $93,802 2.9%
30 YOS $96,494 $98,521 $92,896 $94,708 $92,203 2 of 5 $93,802 2.9%
20-Year Avg $76,332 $78,413 $73,984 $78,350 $64,146 3 of 5 $75,362 1.3%
25-Year Avg $80,364 $82,435 $77,767 $81,622 $68,938 3 of 5 $79,647 0.9%
30-Year Avg $83,053 $85,116 $80,288 $83,803 $72,816 3 of 5 $82,006 1.3%

24 | P a g e
As with Phase I, the dollar amounts of Phase II targeted pay adjustments for individual employees will vary according to multiple factors – years of experience, recruitment incentives included in base pay, and rank. CDP and retention supplement will have been already rolled into base pay. The following table provides an illustrative example of how the Phase II targeted pay adjustment would affect police officers at multiple career junctures.
Estimated Phase II Targeted Pay Adjustment – Police Officer I and II
Year of Service
Phase II Recommended Pay
Scale Phase I
Pay Level Pay
Adjustment*
1 $52,749 $48,256 $4,493 6 $61,151 $59,369 $1,781
11 $70,890 $68,825 $2,065 16 $82,181 $79,788 $2,394 21 $89,523 $89,523 $0
* Employees earning more than the Phase I Pay level (i.e., did not receive a Phase I targeted pay adjustment) would receive a lower Phase II targeted pay adjustment. There were 373 Police Officer II’s captured in the December 31, 2016 payroll run. Assuming no promotions and no attrition, and assuming each employee receives a 1% market pay adjustment and 3% pay-for-performance increase in FY 2018, approximately 77% of PO II’s (286) would receive a targeted pay adjustment in Phase I or Phase II. The average Phase II targeted pay adjustment, to be received in addition to the Phase I targeted pay adjustment, would total $1,781. As previously noted, targeted pay adjustments for individual officers will vary according to multiple factors – years of experience, recruitment incentives currently in base pay, and/or participation in CDP. To avoid pay compression between the ranks, similar targeted pay adjustments would be required for supervisory ranks as they are placed on new pay scales. The table that follows provides a summary of the estimated targeted pay adjustment based on the December 31, 2016 payroll run for police employees by rank. Relative to Phase I, a greater proportion of resources in the Phase II targeted pay adjustment are directed towards supervisory ranks to alleviate pay compression between ranks.

25 | P a g e
Estimates of Phase II Targeted Pay Adjustment – Police Employees, by Rank
# of Employees
# of Employees
w/ Pay Adjustment
% of Employees Receiving Pay Adjustment [1]
Total $ Amount [2]
Avg. $ Amount per Employee Receiving
Adjustment [2]
PO I [3] 80 58 72.5% $74,150 $1,278 PO II 373 286 76.7% $509,242 $1,781 Sergeant 61 55 90.2% $329,014 $5,982 First Sergeant 29 25 86.2% $164,218 $6,569 Lieutenant 29 23 79.3% $142,133 $6,180 Captain 7 5 71.4% $26,404 $5,281 Total 579 452 78.1% $1,245,161 $2,656
[1] Column reflects pay adjustment received in Phase I or Phase II [2] Costs shown net of costs associated with Phase I targeted pay adjustment [3] Costs do not include increase in minimum starting rate from $48,256 to $52,749 for first year police officers
Estimated Costs: Approximately $1.2 million, based on a December 31, 2016 payroll run (assuming no promotions, hiring, or attrition); excluding fiscal impacts on benefits costs (e.g., employer pension payments, FICA) and pay premiums (e.g., overtime, holiday pay).
Recommended Option #8: Streamline recruitment incentives
The current pay range minimum for a Police Officer I (PO I) is $48,256. An officer’s actual base pay at entry, however, may be materially higher depending on prior law enforcement experience, military experience, education, language, and certifications. The variances in base pay at entry contribute to pay compression. A central and recurring theme raised in the employee survey was frustration around employees with the same tenure earning disparate amounts of base pay. To address this issue at entry, the Department may consider developing two separate categories for recruitment incentives. In the first category, cash incentives for prior law enforcement experience, military experience, and education may be awarded on a lump sum basis – half upon completion of the academy (approximately 6 months) and half upon completion of probationary status (approximately 18 months). Providing these cash incentives, coupled with a competitive entry rate, will allow the Department to retain a strong recruitment package for police officer recruits. This approach will assist in the leveling of the pay progression for new employees, and help mitigate a factor contributing to pay compression. Larger one-time cash incentives may be made for lateral hires who are Virginia-certified law enforcement officers, and do not go through the full police academy. Their skillset and experience is more advanced relative to a recruit new to the profession, and generates one-time cost savings to the County by not having to go through a six-month academy training. The second category of incentives is not solely for recruitment. Rather, these incentives provide a payment for a critical skill or certification that need to be maintained on a regular basis. Language pay, for example, would be a skill that falls in this category. Rather than

26 | P a g e
include language pay in base pay – as is the current practice and contributes to pay compression – language pay should be offered as a separate stand-alone stipend that is not included in base pay. If implemented in tandem with a pay scale (Recommended Option #6), this recommended option will provide the Department with the flexibility to attract qualified lateral hires, while concomitantly creating a more clearly defined pay progression where all police officers – regardless of prior law enforcement experience – will reach the pay range maximum after 18 years of service (assuming funding is available for pay-for-performance increases).
Estimated Cost: To be determined. Providing one-time payments instead of increases in base pay will generate savings on premium pays (e.g., overtime), some benefits costs (e.g., pensions), and roll-up costs (e.g., FICA). These savings, however, may be offset by the certification/skill stipends such as language pay.
Recommended Option #9: Create a new Master Police Officer (MPO) classification
Multiple regional Departments have a non-supervisory, lead worker career pathway for police officers. Such a pathway provides additional professional development opportunities for officers who do not want to assume supervisory responsibilities, as well as, provides additional professional development for officers who are considering careers in the supervisory ranks. Additionally, the MPO classification may improve some aspects of the Career Development Program, in part, by linking additional compensation with additional training, experience, qualifications, and/or an increase in job responsibility. Generally, the new MPO classification would serve as a lead non-supervisory worker, capable of operating independently with minimal direction and filling in for a first-line supervisor on an acting basis. MPO’s would receive an additional 5% increase in base pay, and be placed on PS grade 15 between Police Officer (PS 14) and Police Sergeant (PS 16). Additional consideration should be given to defining a distinct set of qualifications, duties, and tenure requirements for an MPO classification, and whether the classification should be competitive or non-competitive. Estimated Cost: To be determined.
Fire & Rescue Recommended Options
Recommended Option #10: Enact Phase I targeted pay adjustment
The Phase I targeted pay adjustment is designed to address pay compression, and direct resources to employees who have experienced the slowest wage growth since the Great Recession. Currently, Department of Fire and Rescue (DFR) employees with the same tenure may earn different levels of base pay, and pay differentials between years of service can be
27 | P a g e
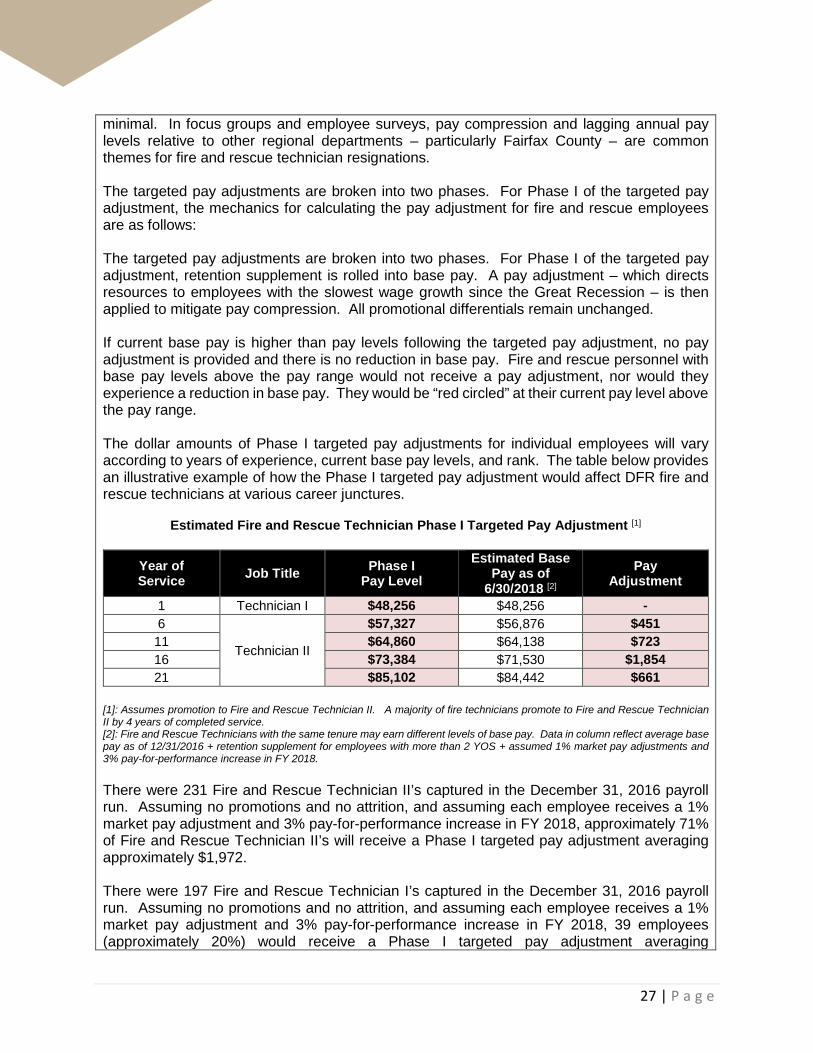
minimal. In focus groups and employee surveys, pay compression and lagging annual pay levels relative to other regional departments – particularly Fairfax County – are common themes for fire and rescue technician resignations. The targeted pay adjustments are broken into two phases. For Phase I of the targeted pay adjustment, the mechanics for calculating the pay adjustment for fire and rescue employees are as follows: The targeted pay adjustments are broken into two phases. For Phase I of the targeted pay adjustment, retention supplement is rolled into base pay. A pay adjustment – which directs resources to employees with the slowest wage growth since the Great Recession – is then applied to mitigate pay compression. All promotional differentials remain unchanged. If current base pay is higher than pay levels following the targeted pay adjustment, no pay adjustment is provided and there is no reduction in base pay. Fire and rescue personnel with base pay levels above the pay range would not receive a pay adjustment, nor would they experience a reduction in base pay. They would be “red circled” at their current pay level above the pay range. The dollar amounts of Phase I targeted pay adjustments for individual employees will vary according to years of experience, current base pay levels, and rank. The table below provides an illustrative example of how the Phase I targeted pay adjustment would affect DFR fire and rescue technicians at various career junctures.
Estimated Fire and Rescue Technician Phase I Targeted Pay Adjustment [1]
Year of Service Job Title Phase I
Pay Level Estimated Base
Pay as of 6/30/2018 [2]
Pay Adjustment
1 Technician I $48,256 $48,256 - 6
Technician II
$57,327 $56,876 $451 11 $64,860 $64,138 $723 16 $73,384 $71,530 $1,854 21 $85,102 $84,442 $661
[1]: Assumes promotion to Fire and Rescue Technician II. A majority of fire technicians promote to Fire and Rescue Technician II by 4 years of completed service. [2]: Fire and Rescue Technicians with the same tenure may earn different levels of base pay. Data in column reflect average base pay as of 12/31/2016 + retention supplement for employees with more than 2 YOS + assumed 1% market pay adjustments and 3% pay-for-performance increase in FY 2018. There were 231 Fire and Rescue Technician II’s captured in the December 31, 2016 payroll run. Assuming no promotions and no attrition, and assuming each employee receives a 1% market pay adjustment and 3% pay-for-performance increase in FY 2018, approximately 71% of Fire and Rescue Technician II’s will receive a Phase I targeted pay adjustment averaging approximately $1,972. There were 197 Fire and Rescue Technician I’s captured in the December 31, 2016 payroll run. Assuming no promotions and no attrition, and assuming each employee receives a 1% market pay adjustment and 3% pay-for-performance increase in FY 2018, 39 employees (approximately 20%) would receive a Phase I targeted pay adjustment averaging

28 | P a g e
approximately $1,364. As previously noted, pay adjustments for individual employees will vary according to years of experience and rank. The table that follows provides a summary of the Phase I estimated targeted pay adjustment based on the December 31, 2016 payroll run for DFR employees by rank.
Estimates of Phase I Targeted Pay Adjustment – Fire and Rescue Employees, by Rank
# of Employees
# of Employees w/ Pay
Adjustment
% of Employees
Receiving Pay Adjustment
Total $ Amount
Avg. $ Amount per Employee Receiving
Adjustment
Tech I 197 39 19.8% $53,177 $1,364 Tech II 231 164 71.0% $323,353 $1,972 Lieutenant 99 47 47.5% $84,636 $1,801 Captain 34 7 20.6% $16,623 $2,375 Battalion Chief 8 0 0.0% $0 $0 Total 569 257 45.2% $477,790 $1,728
Estimated Cost: Approximately $480,000, based on a December 31, 2016 payroll run (assuming no promotions, hiring, or attrition); excluding fiscal impacts on benefits costs (e.g., employer pension payments, FICA) and pay premiums (e.g., overtime, holiday pay). Rolling pay supplements into base pay can increase other premiums. Though the retention supplement is already included in calculations of overtime and holiday pay, and is considered pensionable compensation.
Recommended Option #11: Consider changing operational schedule from 2,496 to 2,912 annual hours and create pay scale for DFR personnel DFR reports that most employees who voluntarily resign leave the Department for Fairfax County. Available data support this assertion – according to exit survey data collected by DFR, 20 of 35 employees (57%) who voluntarily resigned since July of 2015 left DFR for Fairfax County. Many of these employees, as well as many current DFR employees cited higher annual pay levels in Fairfax County – as well as the guarantee for working on a 24-hour shift – as principal reasons for leaving DFR. The Department contends that raising annual pay levels to more closely approximate Fairfax County is critical to improve fire and rescue technician retention. Currently, the shift schedule for DFR personnel assigned to operations totals 2,496 annual hours worked. The most common shift schedule among regional Departments, including Fairfax County, is 2,912 annual hours worked. Thus, while annual base pay levels may be higher at certain career junctures in Fairfax County, DFR pay levels are more competitive when viewed on an hourly basis – accounting for the 416 fewer hours that Prince William County DFR employees are scheduled to work.
29 | P a g e
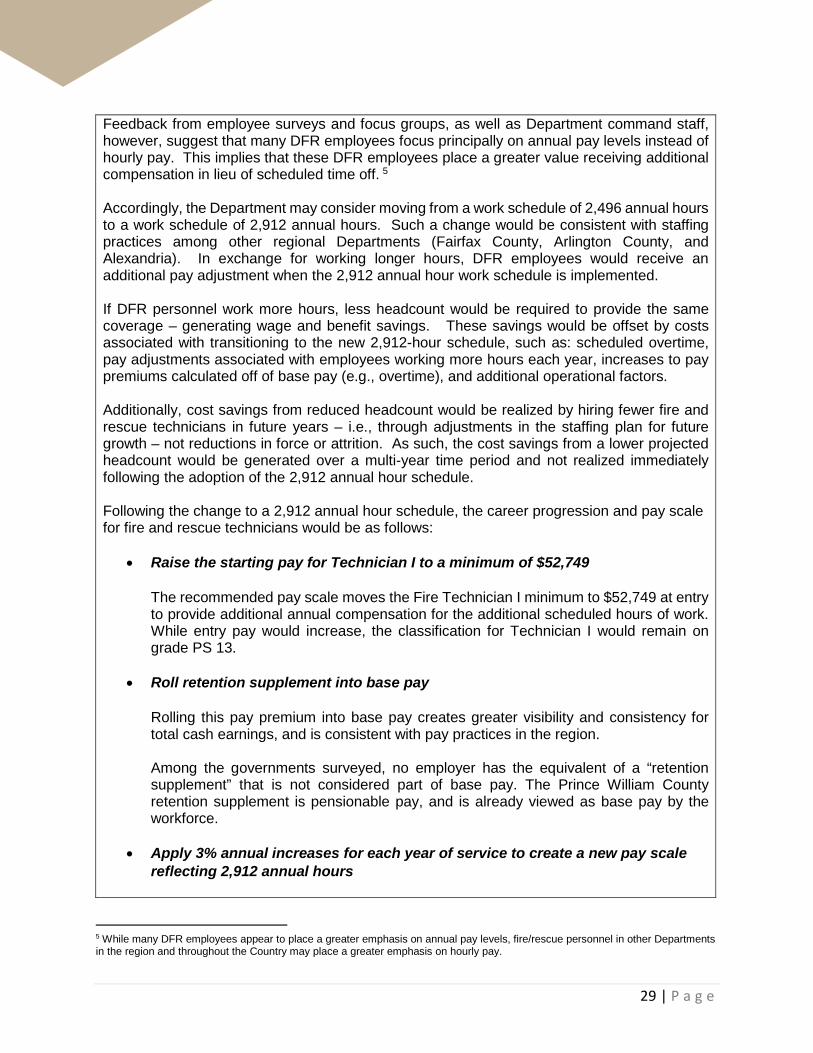
Feedback from employee surveys and focus groups, as well as Department command staff, however, suggest that many DFR employees focus principally on annual pay levels instead of hourly pay. This implies that these DFR employees place a greater value receiving additional compensation in lieu of scheduled time off. 5 Accordingly, the Department may consider moving from a work schedule of 2,496 annual hours to a work schedule of 2,912 annual hours. Such a change would be consistent with staffing practices among other regional Departments (Fairfax County, Arlington County, and Alexandria). In exchange for working longer hours, DFR employees would receive an additional pay adjustment when the 2,912 annual hour work schedule is implemented. If DFR personnel work more hours, less headcount would be required to provide the same coverage – generating wage and benefit savings. These savings would be offset by costs associated with transitioning to the new 2,912-hour schedule, such as: scheduled overtime, pay adjustments associated with employees working more hours each year, increases to pay premiums calculated off of base pay (e.g., overtime), and additional operational factors. Additionally, cost savings from reduced headcount would be realized by hiring fewer fire and rescue technicians in future years – i.e., through adjustments in the staffing plan for future growth – not reductions in force or attrition. As such, the cost savings from a lower projected headcount would be generated over a multi-year time period and not realized immediately following the adoption of the 2,912 annual hour schedule. Following the change to a 2,912 annual hour schedule, the career progression and pay scale for fire and rescue technicians would be as follows:
• Raise the starting pay for Technician I to a minimum of $52,749 The recommended pay scale moves the Fire Technician I minimum to $52,749 at entry to provide additional annual compensation for the additional scheduled hours of work. While entry pay would increase, the classification for Technician I would remain on grade PS 13.
• Roll retention supplement into base pay Rolling this pay premium into base pay creates greater visibility and consistency for total cash earnings, and is consistent with pay practices in the region. Among the governments surveyed, no employer has the equivalent of a “retention supplement” that is not considered part of base pay. The Prince William County retention supplement is pensionable pay, and is already viewed as base pay by the workforce.
• Apply 3% annual increases for each year of service to create a new pay scale reflecting 2,912 annual hours
5 While many DFR employees appear to place a greater emphasis on annual pay levels, fire/rescue personnel in other Departments in the region and throughout the Country may place a greater emphasis on hourly pay.

30 | P a g e
The new pay scale will reflect 3% step increments, consistent with other public safety employee groups following the Phase II targeted pay adjustment.
• Raise promotional differential between Technician I and Technician II to 10% The DFR Fire and Rescue Technician II classification acts as an “officer in charge” in the absence of a supervisory officer. Among the comparison jurisdictions, equivalent Technician II job matches also serve as “officers in charge.” However, the frequency with which a DFR Technician II serves in an officer-in-charge capacity appears to be higher than in other regional Departments. Additionally, the Department reports challenges in recruiting employees for the Technician II position. During the most recent exam process, 20 of 80 eligible Technician I’s applied for promotion to Technician II. Under the 2,912-hour pay scale, the promotional differential between Technician I and Technician II is increased from 5% to 10% when moving to grade PS 14. This increase would be consistent with differentials seen in the region, and create an additional incentive for eligible Technician I’s to promote to Technician II. Additional consideration should be given to determine which technical certification requirements – if any – may be required as part of the Technician II job classification (see Recommended Option #28).
• Adjust supervisory pay levels to prevent pay compression between ranks
All supervisory ranks would be placed on one grade higher to prevent potential pay compression between ranks. Aside from the increase in promotional differential between Technician I and II, all other promotional differentials would remain unchanged.
As shown in the table on the following page, the recommended pay scale provides a clear compensation path for fire and rescue technicians, with a maximum of $89,523 for Fire and Rescue Technicians II reached in Year 16 and 15 years of completed service (assuming annual 3% step increments).

31 | P a g e
Recommended Pay Scale – Fire & Rescue Technician (2,912 Annual Hours)
F&R Technician
I F&R Technician
II Assuming 3% Annual Pay-for-Performance Increases Year 1 $52,749 - Year 2 $54,331 - Year 3 $55,961 $61,558 Year 4 $57,640 $63,404 Year 5 $59,369 $65,306 Year 6 $61,151 $67,266 Year 7 $62,985 $69,284 Year 8 $64,875 $71,362 Year 9 $66,821 $73,503 Year 10 $68,825 $75,708 Year 11 $70,890 $77,979 Year 12 $73,017 $80,319 Year 13 $75,207 $82,728 Year 14 $77,464 $85,210 Year 15 $81,910 $87,766 Year 16 $81,910 $89,523 Year 17 $81,910 $89,523 Year 18 $81,910 $89,523 Year 19 $81,910 $89,523 Year 20 $81,910 $89,523 Year 21 $81,910 $89,523
Pay scales for fire and rescue supervisory ranks are presented in the appendix of this report.

32 | P a g e
As illustrated in the table below, the recommended pay scale reflecting 2,912 annual hours worked compares favorably with Fairfax County when comparing annual and hourly pay levels.6
Fire and Rescue Technician Comparisons – Prince William County vs. Fairfax County (Effective 6/30/2018; assumes Recommended 2,912 Annual Hour Schedule for DFR)*
* Assumes promotion to Technician II after 4 YOS in Prince William County; promotion to Firefighter Technician after 4 YOS (mirroring Prince William County) and Master Firefighter Technician after 5 YOS in Fairfax County Estimated Cost: See Recommended Option #12 for estimates of costs associated with migrating employees to pay scale with 2,912 annual hours.
Recommended Option #12: Enact Phase II targeted pay adjustment
Phase II of the targeted pay adjustment migrates fire and rescue employees to the 2,912 annual hour pay scale outlined in Recommended Option #11. Additionally, the Phase II targeted pay adjustment further mitigates pay compression and brings DFR’s annual compensation levels closer to Fairfax County. The mechanics for calculating the Phase II pay adjustment for DFR employees are as follows:
6 For description of methodology used for total direct cash compensation and total direct cash compensation per net hour worked, see chapter on Organization and Report Methodology.
Prince William County
Fairfax County
PWC Lead/(Lag)
Prince William County
Fairfax County
PWC Lead/(Lag)
Year 1 $60,031 $59,506 0.9% $21.54 $21.51 0.1%
Year 6 $76,552 $79,279 -3.4% $27.78 $29.43 -5.6%
Year 11 $88,744 $87,327 1.6% $32.95 $32.42 1.6%
Year 16 $102,879 $100,950 1.9% $38.64 $38.52 0.3%
Year 21 $106,976 $105,954 1.0% $40.18 $40.80 -1.5%
Year 26 $106,976 $105,954 1.0% $40.18 $40.80 -1.5%
Year 30 $106,976 $105,960 1.0% $40.18 $40.43 -0.6%
20-Year Avg $86,641 $85,809 1.0% $32.09 $32.03 0.2%
25-Year Avg $90,708 $89,839 1.0% $33.70 $33.72 0.0%
30-Year Avg $93,419 $92,526 1.0% $34.78 $34.85 -0.2%
Total Direct Cash Compensation (Annual) Total Direct Cash Compensation per Net Hour Worked

33 | P a g e
• Migrate employees to the 2,912 annual hour pay scale (Recommended Option #11)
• The difference between base pay and the pay scale represents the dollar amount of the
Phase II targeted pay adjustment.
• Fire and rescue personnel with base pay levels above the pay range would not receive a pay adjustment, nor would they experience a reduction in base pay.7
As with Phase I, the dollar amounts of Phase II targeted pay adjustments for individual employees will vary according to multiple factors – years of experience, base pay levels, and rank. Retention supplement will have been already rolled into base pay. The table below provides an example of how the Phase II targeted pay adjustment (i.e., movement to a pay scale with 2,912 annual hours) would affect DFR fire and rescue technicians at various career junctures.
Estimated Fire and Rescue Technician Phase II Targeted Pay Adjustment[1]
Year of Service Job Title
Phase II Pay Scale (2,912 Annual
Hours) Phase I
Pay Level Pay
Adjustment [2]
1 Technician I $52,749 $48,256 $4,493 6
Technician II
$67,266 $57,327 $9,939 11 $77,979 $64,860 $13,119 16 $89,523 $73,384 $16,139 21 $89,523 $83,027 $6,496
[1]: Assumes promotion to Fire and Rescue Technician II. A majority of fire technicians promote to Fire and Rescue Technician II by 4 years of completed. [2]: Employees earning more than the Phase I Pay level (i.e., did not receive a Phase I targeted pay adjustment) would receive a lower Phase II targeted pay adjustment. There were 231 Fire and Rescue Technician II’s captured in the December 31, 2016 payroll run. Assuming no promotions and attrition, and assuming each employee receive a 1% market pay adjustment and 3% pay-for-performance increase in FY 2018, 229 Fire and Rescue Technician II’s (99.1%) would receive a Phase II targeted pay adjustment averaging approximately $12,098. This amount would be in addition to any pay adjustments received in Phase I. There were 197 Fire and Rescue Technician I’s captured in the December 31, 2016 payroll run. Assuming no promotions and attrition, and assuming each employee receive a 1% market pay adjustment and 3% pay-for-performance increase in FY 2018, all employees would receive a targeted pay adjustment averaging approximately $4,975. This amount would be in addition to any pay adjustments received in Phase I.
7 While it is anticipated that the vast majority of fire and rescue employees would receive an increase in base pay as part of the Phase II targeted pay adjustment, there may be a small proportion of employees – particularly in supervisory ranks – who do not experience an increase in base compensation. As part of the implementation process for the 2,912 annual hour work schedule, additional analysis should be performed to identify which employees may not experience an increase base pay, and develop an appropriate compensation strategy (e.g., one-time addition to base pay, then red circled) for the additional hours worked.

34 | P a g e
To avoid pay compression between the ranks, similar targeted pay adjustments would be required for supervisory ranks as they are placed on new pay scales. The table below provides a summary of the estimated targeted pay adjustment based on the December 31, 2016 payroll run for DFR employees by rank. The following figures show base pay only, and do not reflect cost savings associated with a lower headcount required to provide the same level of fire and rescue coverage, or cost offsets associated with moving to a 2,912 annual hour work schedule (e.g., scheduled overtime).
Estimates of Phase II Targeted Pay Adjustment – Fire and Rescue Employees, by Rank
# of Employees
# of Employees w/ Pay
Adjustment
% of Employees
Receiving Pay Adjustment [1]
Total $ Amount [2]
Avg. $ Amount per Employee Receiving
Adjustment[2]
Tech I [3] 197 197 100.0% $980,149 $4,975 Tech II 231 229 99.1% $2,770,341 $12,098 Lieutenant 99 88 88.9% $1,376,409 $15,641 Captain 34 26 76.5% $345,173 $13,276 Battalion Chief 8 4 50.0% $32,368 $8,092 Total 569 544 95.6% $5,504,440 $10,262
[1] Column reflects pay adjustment received in Phase I or Phase II [2] Costs shown net of costs associated with Phase I Targeted Pay Adjustment [3: Costs do not include increase in minimum starting rate from $48,256 to $52,749 for first year fire and rescue technicians Estimated Cost: The costs of implementation will depend on multiple operational and fiscal factors. A high-level “ball park” cost estimate is $5.5 million, based on December 31, 2016 payroll run (assuming no promotions, hiring, or attrition); excluding fiscal impacts on benefits costs (e.g., employer pension payments, FICA) and pay premiums (e.g., overtime, holiday pay). Additionally, cost savings from a potentially smaller workforce, as well as cost offsets from migration to a 2,912 annual hour work schedule are excluded as well. Further analysis is required to provide a more accurate estimate of costs associated with transition to a 2,912 annual hour work schedule.
Recommended Option #13: Address employee concerns regarding day shift
The day shift represents a key component to the County’s current approach in providing service coverage. However, working the day shift – or the prospect of being transferred to the day shift – represented the most commonly cited source of employee dissatisfaction in the employee survey:
• Nearly 80% of fire technicians (I & II) reported that the possibility of transfer to the day shift is a “significant impediment” (39.1%) or “a reason why I think about leaving the Department” (40.5%).
35 | P a g e
• Nearly two-thirds of fire technicians (65.5%) reported that they will consider other employment options as long as they might be transferred to the day shift.
For many employees, a transfer to the day shift disrupts family schedules (e.g., childcare arrangements), and results in a decrease in cash compensation because of the Department’s holiday pay policy. Among the Northern Virginia departments surveyed, only Loudoun County has a similar day shift schedule for fire suppression/rescue operations. As DFR explores modifications to work schedules and staffing configurations, the Department should evaluate options to minimize or eliminate the use of the day shift in providing fire and rescue services. In the meantime, the Department may consider implementing a stipend for personnel who work on the day shift. The day shift stipend would be a fixed dollar amount that is payable only while an employee is scheduled to work on the day shift. In the employee survey, nearly half (49.1%) of fire/rescue technicians (I & II) responded that they would be more inclined to volunteer for or accept a transfer to a day shift assignment if the Department offered a stipend. Estimated Cost: To be determined.
Sheriff’s Office Recommended Options
Recommended Option #14: Enact Phase I Targeted Pay Adjustment
The Phase I targeted pay adjustment is designed to address pay compression and direct resources to employees who have experienced the slowest wage growth since the Great Recession. Currently, Sheriff’s Office employees with the same tenure may earn different levels of base pay. Additionally, some sheriff’s deputies with longer tenure earn lower base pay levels than deputies with shorter tenure, negatively affecting job satisfaction. The targeted pay adjustments levels the pay progression – i.e., sheriff’s deputies with the same tenure will earn similar levels of base pay regardless of prior experience, education, and certifications. The targeted pay adjustments are broken into two phases. If current base pay is higher than pay levels following the Phase I targeted pay adjustment, no pay adjustment is provided and there is no reduction in base pay. Sheriff’s Office personnel with base pay levels above the pay range would not receive a pay adjustment, nor would they experience a reduction in base pay. They would be “red circled” at their current pay level above the pay range. The dollar amounts of Phase I targeted pay adjustments for individual employees will vary according to multiple factors – years of experience, recruitment incentives included in base pay, and rank. The table on the following page provides an illustrative example of how the Phase I targeted pay adjustment would affect sheriff’s deputies at multiple career junctures.
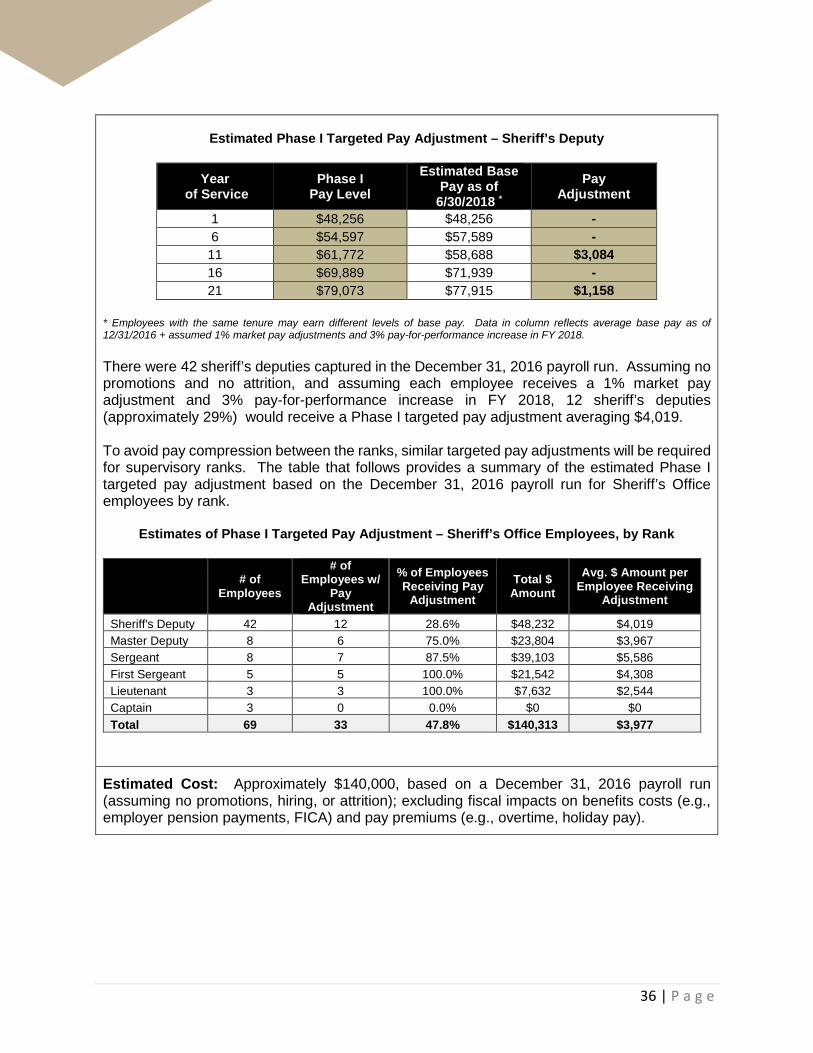
36 | P a g e
Estimated Phase I Targeted Pay Adjustment – Sheriff’s Deputy
Year
of Service Phase I
Pay Level Estimated Base
Pay as of 6/30/2018 *
Pay Adjustment
1 $48,256 $48,256 - 6 $54,597 $57,589 - 11 $61,772 $58,688 $3,084 16 $69,889 $71,939 - 21 $79,073 $77,915 $1,158
* Employees with the same tenure may earn different levels of base pay. Data in column reflects average base pay as of 12/31/2016 + assumed 1% market pay adjustments and 3% pay-for-performance increase in FY 2018. There were 42 sheriff’s deputies captured in the December 31, 2016 payroll run. Assuming no promotions and no attrition, and assuming each employee receives a 1% market pay adjustment and 3% pay-for-performance increase in FY 2018, 12 sheriff’s deputies (approximately 29%) would receive a Phase I targeted pay adjustment averaging $4,019. To avoid pay compression between the ranks, similar targeted pay adjustments will be required for supervisory ranks. The table that follows provides a summary of the estimated Phase I targeted pay adjustment based on the December 31, 2016 payroll run for Sheriff’s Office employees by rank.
Estimates of Phase I Targeted Pay Adjustment – Sheriff’s Office Employees, by Rank
# of Employees
# of Employees w/
Pay Adjustment
% of Employees Receiving Pay
Adjustment Total $ Amount
Avg. $ Amount per Employee Receiving
Adjustment
Sheriff's Deputy 42 12 28.6% $48,232 $4,019 Master Deputy 8 6 75.0% $23,804 $3,967 Sergeant 8 7 87.5% $39,103 $5,586 First Sergeant 5 5 100.0% $21,542 $4,308 Lieutenant 3 3 100.0% $7,632 $2,544 Captain 3 0 0.0% $0 $0 Total 69 33 47.8% $140,313 $3,977
Estimated Cost: Approximately $140,000, based on a December 31, 2016 payroll run (assuming no promotions, hiring, or attrition); excluding fiscal impacts on benefits costs (e.g., employer pension payments, FICA) and pay premiums (e.g., overtime, holiday pay).

37 | P a g e
Recommended Option #15: Create new pay scale for Sheriff’s Office personnel
Most regional governments surveyed have a pay scale, or a pay progression with a well-defined annual pay-for-performance increase, for uniformed Sheriff’s Office personnel. The recommended pay scale, coupled with the targeted pay adjustments, will provide greater clarity for future earnings potential and help to further mitigate pay compression. The career progression and pay scale for sheriff’s deputies would be as follows:
• Maintain the starting rate for sheriff’s deputy at the minimum of grade PS 13 ($48,256).
• Apply 3% annual increases for each year of service to create a pay scale, consistent with other public safety employee groups following the Phase II targeted pay adjustment.
• Adjust supervisory pay levels, with current promotional pay differentials, to prevent pay compression between ranks.
As shown in the table that follows, the recommended pay scale provides a clear compensation path for sheriff’s deputies, with a maximum of $81,910 reached in Year 19 after 18 years of completed service (assuming annual 3% pay-for-performance increases).

38 | P a g e
Recommended Pay Scale – Sheriff’s Deputy
Sheriff’s Deputy
Assuming 3% Annual Pay-for-Performance Increases Year 1 $48,256 Year 2 $49,704 Year 3 $51,195 Year 4 $52,731 Year 5 $54,313 Year 6 $55,942 Year 7 $57,620 Year 8 $59,349 Year 9 $61,129 Year 10 $62,963 Year 11 $64,852 Year 12 $66,798 Year 13 $68,802 Year 14 $70,866 Year 15 $72,992 Year 16 $75,181 Year 17 $77,437 Year 18 $79,760 Year 19 $81,910 Year 20 $81,910 Year 21 $81,910
Pay scales for Sheriff’s Office supervisory ranks are presented in the appendix of this report. Estimated Cost: No costs associated with the establishment of a pay scale, though the future costs associated with providing annual 3% pay-for-performance increases are to be determined.
Recommended Option #16: Enact Phase II targeted pay adjustment
Phase II of the targeted pay adjustment migrates Sheriff’s Office employees to the recommended pay scale (Recommended Option # 15) and is designed to further mitigate pay compression. For Phase II of the targeted pay adjustment, the mechanics for calculating the adjustment for employees are as follows:
• Migrate employees to the recommended scale (Recommended Option #15) based on years of service with the Sheriff’s Office.

39 | P a g e
• The difference between base pay and the pay scale represents the dollar amount of the targeted pay adjustment. If current base pay is higher than pay levels on the recommended pay scale, no pay adjustment is provided and there is no reduction in base pay.
• Sheriff’s Office personnel with base pay levels above the pay scale would not receive a pay adjustment, nor would they experience a reduction in base pay. They would be “red circled” at their current pay level above the pay range.
As with Phase I, the dollar amounts of Phase II targeted pay adjustments for individual employees will vary according to multiple factors – years of experience, recruitment incentives included in base pay, and rank. The table below provides an illustrative example of how the Phase II targeted pay adjustment would affect sheriff’s deputies at multiple career junctures.
Estimated Phase II Targeted Pay Adjustment – Sheriff’s Deputy
Year
of Service Phase II
Recommended Pay Scale
Phase I Pay Level
Pay Adjustment*
1 $48,256 $48,256 - 6 $55,942 $54,597 $1,345 11 $64,852 $61,772 $3,080 16 $75,181 $69,889 $5,292 21 $81,910 $79,073 $2,837
* Employees earning more than the Phase I Pay level (i.e., did not receive a Phase I targeted pay adjustment) would receive a lower Phase II targeted pay adjustment. There were 42 sheriff’s deputies captured in the December 31, 2016 payroll run. Assuming no promotions and attrition, and assuming each employee receives a 1% market pay adjustment and 3% pay-for-performance increase in FY 2018, approximately 45% of sheriff’s deputies (19) would receive a targeted pay adjustment in Phase I or Phase II. The average Phase II targeted pay adjustment, to be received in addition to the Phase I targeted pay adjustment, would total $3,423. As previously noted, pay adjustments for individual employees will vary according to multiple factors – years of experience, recruitment incentives currently in base pay, and rank. To avoid pay compression between the ranks, similar targeted pay adjustments would be required for supervisory ranks as they are placed on new pay scales. The table on the following page provides a summary of the estimated targeted pay adjustment based on the December 31, 2016 payroll run for Sheriff’s Office employees by rank.

40 | P a g e
Estimates of Phase II Targeted Pay Adjustment – Sheriff’s Office Employees, by Rank
# of Employees
# of Employees
w/ Pay Adjustment
% of Employees Receiving Pay Adjustment [1]
Total $ Amount [2]
Avg. $ Amount per Employee Receiving
Adjustment [2]
Sheriff's Deputy 42 19 45.2% $65,034 $3,423 Master Deputy 8 8 100.0% $23,380 $2,922 Sergeant 8 8 100.0% $34,804 $4,350 First Sergeant 5 5 100.0% $35,202 $7,040 Lieutenant 3 3 100.0% $24,606 $8,202 Captain 3 0 0.0% $0 $0 Total 69 43 62.3% $183,026 $3,794
[1] Column reflects pay adjustment received in Phase I or Phase II [2] Costs shown net of costs associated with Phase I Targeted Pay Adjustment Estimated Cost: Approximately $180,000, based on a December 31, 2016 payroll run (assuming no promotions, hiring, or attrition); excluding fiscal impacts on benefits costs (e.g., employer pension payments, FICA) and pay premiums (e.g., overtime, holiday pay).
Recommended Option #17: Implement a “slotting” practice for new hires with Virginia Law Enforcement experience
The Sheriff’s Office principally hires sheriff’s deputies with prior Virginia law enforcement experience. Of the 21 sheriff’s deputies hired since 2015, only one required training at the Prince William County Criminal Justice Academy. The standard practice is to hire sheriff’s deputies at a rate that matches or exceeds pay levels at the employee’s current employer. While this approach results in the successful recruitment of candidates, it also creates pay compression; new hires often receive higher base levels than sheriff’s deputies with comparable tenure with the agency. To address pay inversion caused by current hiring practices, the Sheriff’s Office should adopt a practice of “slotting” new hires by years of service. For example, using the recommended pay scale (see Recommended Option #15), a newly hired sheriff’s deputy with five years of completed service (i.e., Year 6) at another Virginia agency would earn base pay of $55,942. This pay level would match the base pay of a sheriff’s deputy who started his/her career with the Prince William County Sheriff’s Office and completed five years of service. If combined with the targeted pay adjustments (see Recommended Options #14 and #16), slotting new hires at entry would equalize pay levels among lateral hires and the current workforce. Technically, pay compression would still persist, as sheriff’s deputies with different tenures with the Sheriff’s Office would earn different pay levels. The Sheriff’s Office, however, is increasingly comprised of lateral hires from other agencies – instead of comprised primarily of recruits who progress through a career together. Accordingly, enacting a transparent and comprehensible lateral hire policy, in concert with a pay scale and a targeted pay adjustment, is not anticipated to further exacerbate employee dissatisfaction.

41 | P a g e
In addition to slotting lateral hires with prior Virginia law enforcement experience, the Sheriff’s Office should consider developing two separate categories for recruitment incentives. The first category would be intended for qualified applicants from other Virginia law enforcement agencies who earn pay levels above the slotted amount. For these applicants, the Sheriff’s Office may consider a one-time lump sum payment, payable upon the completion of the sheriff’s deputy probationary period. The second category of incentives is not solely for recruitment. Rather, these incentives provide a payment for critical skill or certification that need to be maintained on a regular basis. Language pay, for example, would be a skill that falls in this category. Rather than be included in base pay, language pay should be offered as a separate stand-alone stipend. Providing these cash incentives, coupled with slotting within the recommended pay progression, will allow the Sheriff’s Office to retain a strong recruitment package for sheriff’s deputies. Further, this approach will equalize the base pay of new and existing employees, and help mitigate a major factor contributing to pay compression and employee dissatisfaction.
Estimated Cost: No expected cost; cost savings may be generated.
Recommended Option #18: Perform actuarial study for including Sheriff’s Office and ADC staff in County Supplemental Retirement Plan
Prince William County provides a supplement retirement plan, in addition to Virginia Retirement System benefits, to police and fire and rescue personnel. Sheriff’s Office and ADC personnel, however, are not eligible for the County’s supplemental retirement plan. Not having the opportunity to participate in the supplemental retirement plan is stated as a source of employee dissatisfaction in focus groups, as well as the comment sections of the employee survey, and discussions with command staff. The County should consider conducting an actuarial study to determine the costs associated with including Sheriff’s Office and ADC personnel in the County’s supplemental retirement plan. The study may look at the costs associated with providing coverage for existing employees, as well as adding coverage from a date certain in the future.
Estimated Cost: To be determined.

42 | P a g e
Adult Detention Center Recommended Options
Recommended Option #19: Enact Phase I Targeted Pay Adjustment
The Phase I targeted pay adjustment is designed to address pay compression and direct resources to employees who have experienced the slowest wage growth since the Great Recession. Currently, ADC employees with the same tenure may earn different levels of base pay. Additionally, some jail officers with longer tenure earn lower base pay levels than jail officers with shorter tenure, which negatively affects job satisfaction. The targeted pay adjustments level the pay progression – i.e., jail officers with the same tenure will earn similar levels of base pay regardless of prior experience, education, and certifications. The targeted pay adjustments are broken into two phases. If current base pay is higher than pay levels following the Phase I targeted pay adjustment, no pay adjustment is provided and there is no reduction in base pay. ADC personnel with base pay levels above the pay range would not receive a pay adjustment, nor would they experience a reduction in base pay. They would be “red circled” at their current pay level above the pay range. The dollar amounts of Phase I targeted pay adjustments for individual employees will vary according to multiple factors – years of experience, recruitment incentives included in base pay, and rank.
Estimated Phase I Targeted Pay Adjustment – Jail Officer
Year of Service
Phase I Pay Level
Estimated Base Pay as of
6/30/2018 * Pay
Adjustment
1 $48,256 $48,256 - 6 $54,597 $52,361 $2,236 11 $61,772 $59,297 $2,474 16 $69,889 $68,168 $1,721 21 $79,073 $71,097 $7,976
* Employees with the same tenure may earn different levels of base pay. Data in column reflects average base pay as of 12/31/2016 + assumed 1% market pay adjustments and 3% pay-for-performance increase in FY 2018. There were 142 jail officers captured in the December 31, 2016 payroll run. Assuming no promotions and no attrition, and assuming each employee receives a 1% market pay adjustment and 3% pay-for-performance increase in FY 2018, 96 jail officers (approximately 68%) would receive a Phase I targeted pay adjustment averaging approximately $2,640. To avoid pay compression between the ranks, similar targeted pay adjustments will be required for supervisory ranks as they are placed on new pay scales. The following table provides a summary of the estimated Phase I targeted pay adjustment based on the December 31, 2016 payroll run by rank.

43 | P a g e
Estimates of Phase I Targeted Pay Adjustment – ADC Employees, by Rank
# of Employees
# of Employees
w/ Pay Adjustment
% of Employees Receiving Pay
Adjustment Total $ Amount
Avg. $ Amount per Employee Receiving
Adjustment
Jail Officer 142 96 67.6% $253,423 $2,640 Master Jail Officer 48 44 91.7% $217,928 $4,953 Sergeant 32 24 75.0% $111,399 $4,642 First Sergeant 15 12 80.0% $43,514 $3,626 Lieutenant 11 4 36.4% $19,636 $4,909 Captain 4 0 0.0% $0 $0 Total 252 180 71.4% $645,898 $3,450
Estimated Cost: Approximately $645,000, based on a December 31, 2016 payroll run (assuming no promotions, hiring, or attrition); excluding fiscal impacts on benefits costs (e.g., employer pension payments, FICA) and pay premiums (e.g., overtime, holiday pay).
Recommended Option #20: Create New Pay Scale for ADC Personnel
Most regional governments surveyed have a pay scale, or a pay progression with a well-defined annual pay-for-performance increase, for jail officers. The recommended pay scale, coupled with the targeted pay adjustments, will provide greater clarity for future earnings potential and help to further mitigate pay compression. The career progression and pay scale for jail officers would be as follows:
• Maintain the starting rate for jail officer at the minimum of grade PS 13 ($48,256).
• Apply 3% annual increases for each year of service to create a pay scale, consistent with other public safety employee groups, following the Phase II targeted pay adjustment.
• Adjust supervisory pay levels, with current promotional pay differentials, to prevent pay compression between ranks.
As shown in the table on the following page, the recommended pay scale provides a clear compensation path for jail officers, with a maximum of $81,910 reached in Year 19 after 18 years of completed service (assuming annual 3% pay-for-performance increases).

44 | P a g e
Recommended Pay Scale – Jail Officers
Jail Officers
Assuming 3% Annual Pay-for-Performance Increases Year 1 $48,256 Year 2 $49,704 Year 3 $51,195 Year 4 $52,731 Year 5 $54,313 Year 6 $55,942 Year 7 $57,620 Year 8 $59,349 Year 9 $61,129 Year 10 $62,963 Year 11 $64,852 Year 12 $66,798 Year 13 $68,802 Year 14 $70,866 Year 15 $72,992 Year 16 $75,181 Year 17 $77,437 Year 18 $79,760 Year 19 $81,910 Year 20 $81,910 Year 21 $81,910
Pay scales for ADC supervisory ranks are presented in the appendix of this report Estimated Cost: No costs associated with the establishment of a pay scale, though the future costs associated with providing annual 3% pay-for-performance increases are to be determined.
Recommended Option #21: Enact Phase II Targeted Pay Adjustment
Phase II of the targeted pay adjustment migrates ADC employees to the recommended pay scale (Recommended Option # 20) and is designed to further mitigate pay compression. For Phase II of the targeted pay adjustment, the mechanics for calculating the adjustment for employees are as follows:
• Migrate employees to the recommended scale (Recommended Option #20) based on years of service with the ADC.
• The difference between base pay and the pay scale represents the dollar amount of the targeted pay adjustment. If current base pay is higher than pay levels on the

45 | P a g e
recommended pay scale, no pay adjustment is provided and there is no reduction in base pay.
• ADC personnel with base pay levels above the pay scale would not receive a pay adjustment, nor would they experience a reduction in base pay. They would be “red circled” at their current pay level above the pay range.
As with Phase I, the dollar amounts of Phase II targeted pay adjustments for individual employees will vary according to multiple factors – years of experience, recruitment incentives included in base pay, and rank. The table below provides an illustrative example of how the Phase II targeted pay adjustment would affect jail officers at multiple career junctures.
Estimated Phase II Targeted Pay Adjustment – Jail Officer
Year of Service
Phase II Recommended
Pay Scale Phase I
Pay Level* Pay
Adjustment
1 $48,256 $48,256 - 6 $55,942 $54,597 $1,345 11 $64,852 $61,772 $3,080 16 $75,181 $69,889 $5,292 21 $81,910 $79,073 $2,837
* Employees earning more than the Phase I Pay level (i.e., did not receive a Phase I targeted pay adjustment) would receive a lower Phase II targeted pay adjustment. There were 142 jail officers captured in the December 31, 2016 payroll run. Assuming no promotions and attrition, and assuming each employee receives a 1% market pay adjustment and 3% pay-for-performance increase in FY 2018, approximately 78% of jail officers (110) would receive a targeted pay adjustment in Phase I or Phase II. The average Phase II targeted pay adjustment, to be received in addition to the Phase I targeted pay adjustment, would total $1,712. As previously noted, pay adjustments for individual employees will vary according to multiple factors – years of experience, recruitment incentives currently in base pay, and rank. To avoid pay compression between the ranks, similar targeted pay adjustments would be required for supervisory ranks as they are placed on new pay scales. The table on the following page provides a summary of the estimated targeted pay adjustment based on the December 31, 2016 payroll run for ADC employees by rank.
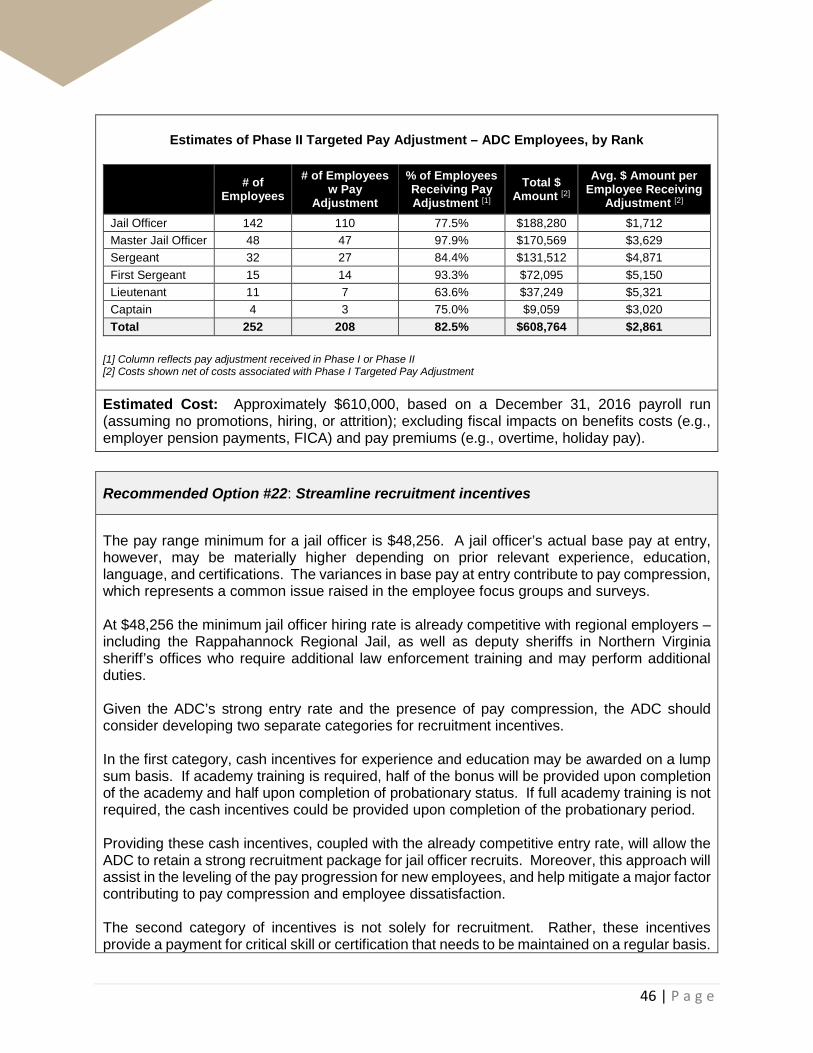
46 | P a g e
Estimates of Phase II Targeted Pay Adjustment – ADC Employees, by Rank
# of Employees
# of Employees w Pay
Adjustment
% of Employees Receiving Pay Adjustment [1]
Total $ Amount [2]
Avg. $ Amount per Employee Receiving
Adjustment [2] Jail Officer 142 110 77.5% $188,280 $1,712 Master Jail Officer 48 47 97.9% $170,569 $3,629 Sergeant 32 27 84.4% $131,512 $4,871 First Sergeant 15 14 93.3% $72,095 $5,150 Lieutenant 11 7 63.6% $37,249 $5,321 Captain 4 3 75.0% $9,059 $3,020 Total 252 208 82.5% $608,764 $2,861
[1] Column reflects pay adjustment received in Phase I or Phase II [2] Costs shown net of costs associated with Phase I Targeted Pay Adjustment
Estimated Cost: Approximately $610,000, based on a December 31, 2016 payroll run (assuming no promotions, hiring, or attrition); excluding fiscal impacts on benefits costs (e.g., employer pension payments, FICA) and pay premiums (e.g., overtime, holiday pay).
Recommended Option #22: Streamline recruitment incentives
The pay range minimum for a jail officer is $48,256. A jail officer’s actual base pay at entry, however, may be materially higher depending on prior relevant experience, education, language, and certifications. The variances in base pay at entry contribute to pay compression, which represents a common issue raised in the employee focus groups and surveys. At $48,256 the minimum jail officer hiring rate is already competitive with regional employers – including the Rappahannock Regional Jail, as well as deputy sheriffs in Northern Virginia sheriff’s offices who require additional law enforcement training and may perform additional duties. Given the ADC’s strong entry rate and the presence of pay compression, the ADC should consider developing two separate categories for recruitment incentives. In the first category, cash incentives for experience and education may be awarded on a lump sum basis. If academy training is required, half of the bonus will be provided upon completion of the academy and half upon completion of probationary status. If full academy training is not required, the cash incentives could be provided upon completion of the probationary period. Providing these cash incentives, coupled with the already competitive entry rate, will allow the ADC to retain a strong recruitment package for jail officer recruits. Moreover, this approach will assist in the leveling of the pay progression for new employees, and help mitigate a major factor contributing to pay compression and employee dissatisfaction. The second category of incentives is not solely for recruitment. Rather, these incentives provide a payment for critical skill or certification that needs to be maintained on a regular basis.

47 | P a g e
Language pay, for example, would be a skill that falls in this category. Rather than include language pay in base pay – as is the current practice and contributes to pay compression – language pay should be offered as a separate stand-alone stipend that is not included in base pay. Estimated Cost: To be determined. Providing one-time payments instead of increases in base pay will generate savings on premium pays (e.g., overtime), some benefits costs (e.g., pensions), and roll-up costs (e.g., FICA). These savings, however, may be offset by the certification/skill stipends such as language pay.
Recommended Option #23: Explore modifications to security shift schedule
ADC jail officers and supervisory personnel assigned to security operations work rotating 12-hour shifts. Employees alternate between day and night shifts monthly. In focus groups and the employee survey, employees report that the monthly rotation from days to nights (and vice versa) contributes to high levels of stress, fatigue, and exhaustion. In a review of shift rotation practices among the Northern Virginia jurisdictions and the Rappahannock Regional Jail, only one jurisdiction – Fairfax County – incorporates monthly shift rotations into security shift schedules. The Department should consider extending the amount of time that security shift employees are on day or evening rotation. Employees report that having the rotation occur every two or three months would reduce stress and allow them to better adjust to their current shift schedule. Such a change in shift scheduling would also be consistent with regional practices.
Estimated Cost: No expected cost.
Recommended Option #24: Perform actuarial study for including Sheriff’s Office and ADC staff in County Supplemental Retirement Plan
See Recommended Option #18 for details.
Estimated Cost: To be determined.
48 | P a g e
Additional Recommended Options
Recommended Option #25: Explore providing on-call pay to public safety employees
Public safety employees are often required to be “on-call” outside of regularly scheduled hours. Examples include police officers in the Criminal Investigations Division and sheriff’s deputies who may be required to assist other law enforcement agencies on an as needed basis. While public safety employees frequently are not called out to duty while on-call, there are certain limitations on their activities when not scheduled to work (e.g., must be available and ready to work on short notice). Most Police Departments and Sheriff’s Offices in Northern Virginia provide some form of on-call compensation to employees to compensate for the inconvenience of having limitations placed on their time when on-call. A premium pay structure seen among multiple regional departments is to provide on-call pay of one-hour pay on days scheduled to work, and two-hours of pay on scheduled days off. Estimated Cost: To be determined – depends on the number of instances in which public safety employees are required to be on-call.
Recommended Option #26: Explore expanding police shift differential to cover the beginning of the evening shift
While not identified as a major factor in recruitment and retention, the Police Department may consider expanding the hours eligible for shift differential to be more consistent with other employers in the region. In focus group sessions, multiple officers and supervisors expressed dissatisfaction with the Department’s shift differential, asserting that the pay premium levels were too low. While the Department’s shift differential premium of $0.70 per hour is in-line with the Northern Virginia Departments analyzed, a comparatively smaller number of shift hours are eligible for shift differential in Prince William County. The Department may consider expanding the shift differential to cover the full evening shift, which begins at 4:00 PM to be more consistent with shift differential structures among regional law enforcement agencies.
Estimated Cost: To be determined – depends on staffing configuration of evening shifts.

49 | P a g e
Recommended Option #27: Improve visibility of Police Officer Field Training Officer (FTO) Pay Field Training Officers (FTOs) represent important points of contact with post-academy employees – they introduce new officers to the challenges and rigors of working in the field. Accordingly, they play a critical role in not only training new police officers, but providing guidance and mentorship. They can be an asset in retaining newly hired officers during the first years of service when officers are most likely to resign. Currently, the Department provides one hour of overtime for each day an officer serves as an FTO (48 days total). This formula compares favorably with FTO premiums in other regional Departments. Many Prince William County FTOs in focus groups, however, reported that they do not receive FTO pay. This may be the result of how FTO is paid – as FTO pay is combined with other forms of overtime compensation received in a police officer’s pay check. The Department should consider evaluating its messaging around FTO pay. This may include providing a supplemental breakdown to FTOs that clearly lays out how much FTO pay they receive, and how it was calculated, in order to provide greater transparency in earnings.
Estimated Cost: None
Recommended Option #28: Evaluate Compensation for Technical Certifications for DFR employees
Justification: All Fire and Rescue Departments in the comparison group provide additional compensation for obtaining select specialty certifications – additional cash premiums or a separate rank – providing an incentive for employees to gain additional skills and training. The amounts vary according to departmental needs and specialty – e.g., HazMat, Water Rescue, and Training Rescue Operator. As the Department evaluates compensation changes related to a potential 2,912 annual hour work schedule, it should consider how to best compensate fire technicians for technical certifications. Practices within the region vary. For example, Fairfax County requires technical certifications as part of fire technician/master technician promotional process, while Loudoun County provides flat dollar amounts for specified certifications.
Estimated Cost: To be determined – depending on the number of employees who possess or plan to obtain these certifications and the compensation method chosen.

50 | P a g e
IV. Pay Plan Analysis and Comparison of Public Safety Pay
Plans Over the course of the project engagement, a number of factors were identified as contributing to retention challenges for police, fire/rescue, deputy sheriff, and jail officer employees. While some of these issues were departmental specific, three compensation-related issues: the lack of a well-defined pay progression (e.g., a pay scale), pay compression, and slow wage growth relative to other regional public safety employers, emerged as three general, overarching themes with all the public safety employee groups.
In the absence of a well-defined pay progression – for example, a pay scale or annual pay-for-performance increases – many employees reported that they could not adequately project future earnings. The uncertainty around wage growth, many employees reported, serves as a catalyst to consider other employment opportunities.
Pay compression occurs when there are insufficient pay differentials between employees within the same classification and tenure, or insufficient pay differentials between supervisory and subordinate employees. Further, pay inversion occurs when more tenured employees earn less base pay than more tenured employees or when employees in subordinate ranks earn higher levels of base pay. These pay plan distortions can contribute to employee dissatisfaction – particularly in occupations, such as public safety, characterized by hierarchical organization structures and a paramilitary culture.
The sections that follow provide a discussion of pay compression in Prince William County, contrast Prince William County’s public safety pay plan with those of the Northern Virginia comparison group, provide a discussion of recent trends, and summarize structural public safety pay practices in the region.
Pay Compression
A common theme expressed in all employee surveys is concern around pay compression. Pay compression occurs when there are insufficient pay differentials between years of service within the same rank, or insufficient pay differentials across ranks. In some instances, employees with less tenure may earn higher levels of base pay than employees with longer tenure. These pay range distortions can negatively affect job satisfaction and morale, and contribute to retention challenges.
A review of payroll data validates the concerns raised in the employee surveys. An example of pay compression within rank can be seen in the table below. There are nine career junctures where the difference in base pay by year of service is less than 2%, as denoted by the yellow shading. Additionally, there are five career junctures where police officers with more tenure, on average, earn less base pay than officers with less tenure (as denoted by the red shading).
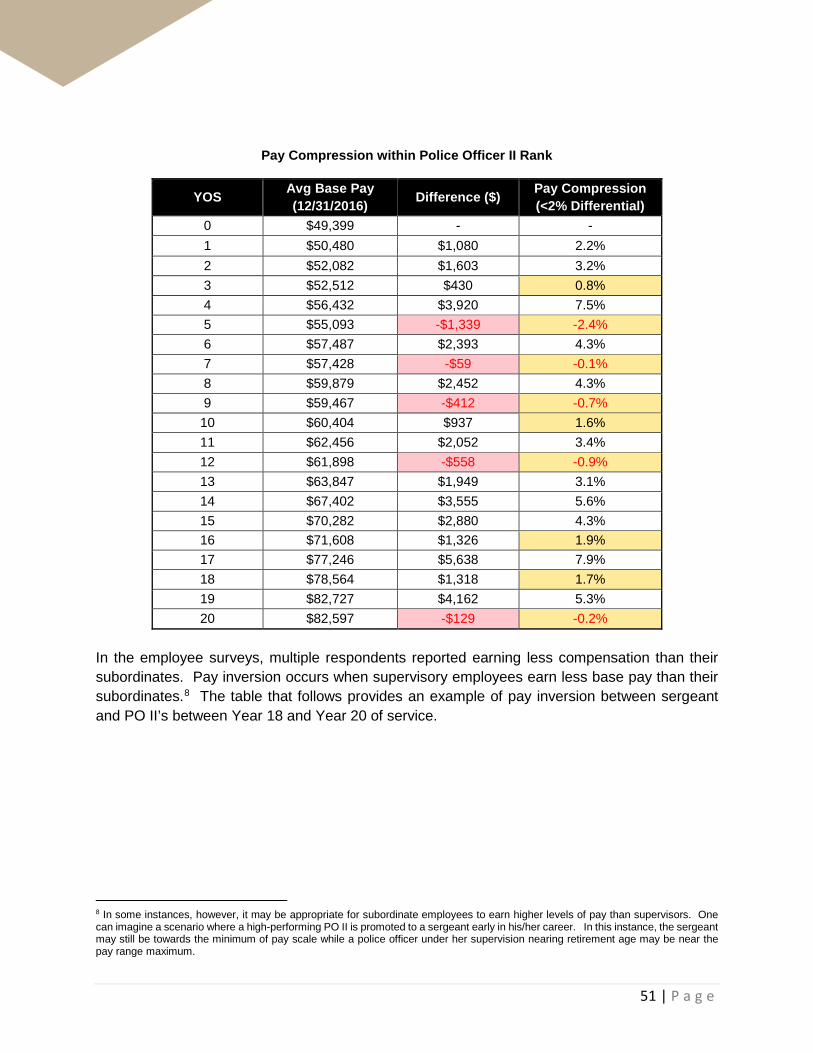
51 | P a g e
Pay Compression within Police Officer II Rank
YOS Avg Base Pay (12/31/2016) Difference ($) Pay Compression
(<2% Differential) 0 $49,399 - - 1 $50,480 $1,080 2.2% 2 $52,082 $1,603 3.2% 3 $52,512 $430 0.8% 4 $56,432 $3,920 7.5% 5 $55,093 -$1,339 -2.4% 6 $57,487 $2,393 4.3% 7 $57,428 -$59 -0.1% 8 $59,879 $2,452 4.3% 9 $59,467 -$412 -0.7% 10 $60,404 $937 1.6% 11 $62,456 $2,052 3.4% 12 $61,898 -$558 -0.9% 13 $63,847 $1,949 3.1% 14 $67,402 $3,555 5.6% 15 $70,282 $2,880 4.3% 16 $71,608 $1,326 1.9% 17 $77,246 $5,638 7.9% 18 $78,564 $1,318 1.7% 19 $82,727 $4,162 5.3% 20 $82,597 -$129 -0.2%
In the employee surveys, multiple respondents reported earning less compensation than their subordinates. Pay inversion occurs when supervisory employees earn less base pay than their subordinates.8 The table that follows provides an example of pay inversion between sergeant and PO II’s between Year 18 and Year 20 of service.
8 In some instances, however, it may be appropriate for subordinate employees to earn higher levels of pay than supervisors. One can imagine a scenario where a high-performing PO II is promoted to a sergeant early in his/her career. In this instance, the sergeant may still be towards the minimum of pay scale while a police officer under her supervision nearing retirement age may be near the pay range maximum.
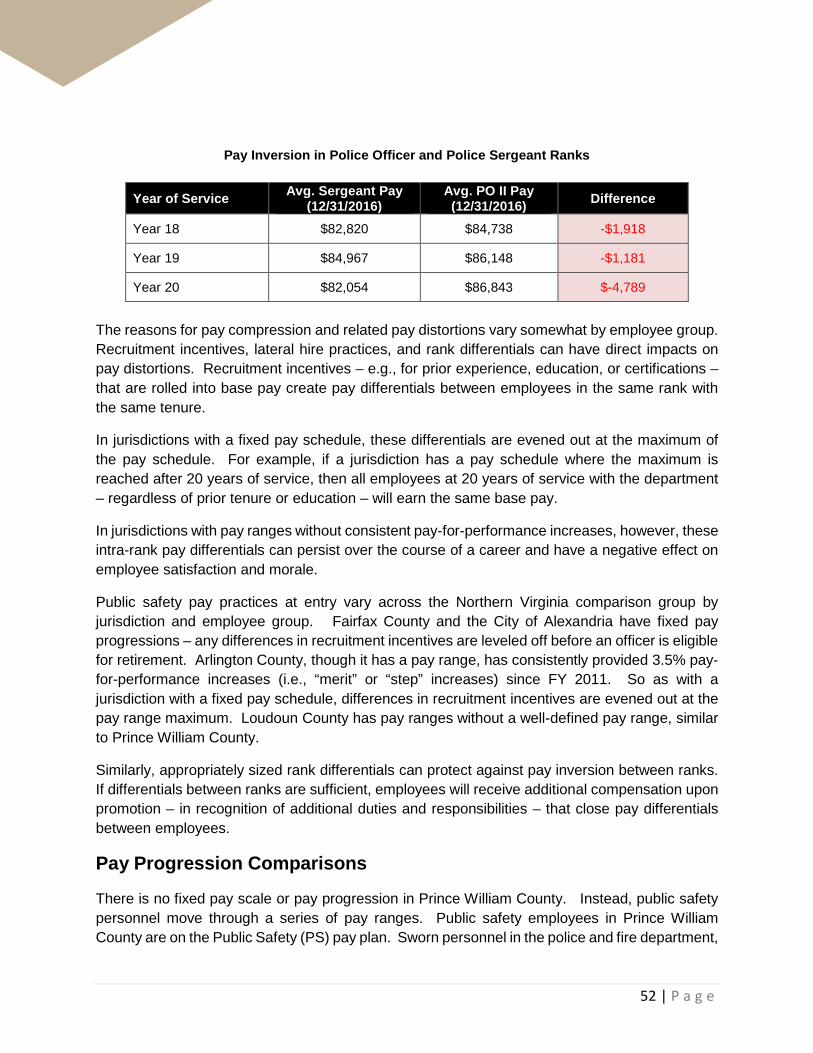
52 | P a g e
Pay Inversion in Police Officer and Police Sergeant Ranks
Year of Service Avg. Sergeant Pay (12/31/2016)
Avg. PO II Pay (12/31/2016) Difference
Year 18 $82,820 $84,738 -$1,918
Year 19 $84,967 $86,148 -$1,181
Year 20 $82,054 $86,843 $-4,789
The reasons for pay compression and related pay distortions vary somewhat by employee group. Recruitment incentives, lateral hire practices, and rank differentials can have direct impacts on pay distortions. Recruitment incentives – e.g., for prior experience, education, or certifications – that are rolled into base pay create pay differentials between employees in the same rank with the same tenure.
In jurisdictions with a fixed pay schedule, these differentials are evened out at the maximum of the pay schedule. For example, if a jurisdiction has a pay schedule where the maximum is reached after 20 years of service, then all employees at 20 years of service with the department – regardless of prior tenure or education – will earn the same base pay.
In jurisdictions with pay ranges without consistent pay-for-performance increases, however, these intra-rank pay differentials can persist over the course of a career and have a negative effect on employee satisfaction and morale.
Public safety pay practices at entry vary across the Northern Virginia comparison group by jurisdiction and employee group. Fairfax County and the City of Alexandria have fixed pay progressions – any differences in recruitment incentives are leveled off before an officer is eligible for retirement. Arlington County, though it has a pay range, has consistently provided 3.5% pay-for-performance increases (i.e., “merit” or “step” increases) since FY 2011. So as with a jurisdiction with a fixed pay schedule, differences in recruitment incentives are evened out at the pay range maximum. Loudoun County has pay ranges without a well-defined pay range, similar to Prince William County.
Similarly, appropriately sized rank differentials can protect against pay inversion between ranks. If differentials between ranks are sufficient, employees will receive additional compensation upon promotion – in recognition of additional duties and responsibilities – that close pay differentials between employees.
Pay Progression Comparisons
There is no fixed pay scale or pay progression in Prince William County. Instead, public safety personnel move through a series of pay ranges. Public safety employees in Prince William County are on the Public Safety (PS) pay plan. Sworn personnel in the police and fire department,

53 | P a g e
as well as the ADC and Sheriff’s Office move through the pay range through a combination of pay-for-performance increases and/or a market pay adjustment, as authorized by the Board of County Supervisors.
The table on the following page presents the County’s Public Safety pay ranges effective for FY 2018. The entry level for police officers, firefighters/paramedics, deputy sheriffs, and jail officers is PS 13.
Prince William County FY 2018 Public Safety Pay Plan
Grade Minimum Midpoint Maximum PS5 $27,477 $37,045 $46,613 PS6 $29,203 $39,416 $49,608 PS7 $30,992 $41,808 $52,603 PS8 $32,968 $44,470 $55,973 PS9 $35,194 $47,466 $59,738 PS10 $37,794 $50,981 $64,168 PS11 $40,810 $55,037 $69,264 PS12 $44,242 $59,675 $75,088 PS13 $48,256 $65,083 $81,910 PS14 $52,749 $71,136 $89,523 PS15 $57,845 $78,042 $98,238 PS16 $63,856 $86,133 $108,410 PS17 $70,741 $95,430 $120,120 PS18 $78,790 $106,267 $133,744 PS19 $81,432 $109,845 $138,258 PS20 $85,509 $115,357 $145,184 PS21 $89,794 $121,139 $152,464 PS22 $94,266 $127,171 $160,056 PS23 $99,008 $133,536 $168,064 PS24 $103,938 $152,006 $200,054
In addition to market pay adjustments and pay-for-performance pay, Prince William County public safety personnel are also eligible for “Performance Plus Pay,” a one-time payment based on employee evaluations. Employees who receive an “exceeds” rating earn an additional 1% lump-sum payment; employees with a “greatly exceeds” rating receive additional lump-sum payment of 2%. No other jurisdiction in the region reported a similar pay structure for public safety personnel.
The table on the following page summarizes the pay-for-performance and market pay adjustments received by Prince William County public safety personnel since FY 2010. In FY 2010 and FY 2011, no wage increases were granted as the County faced severe fiscal constraints from the Great Recession. Between FY 2012 and FY 2017, Prince William County public safety personnel received alternating pay-for-performance and market pay adjustments. In FY 2018, for the first time since the Great Recession, Prince William County public safety employees received a pay-for-performance increase and a market pay adjustment in the same fiscal year.
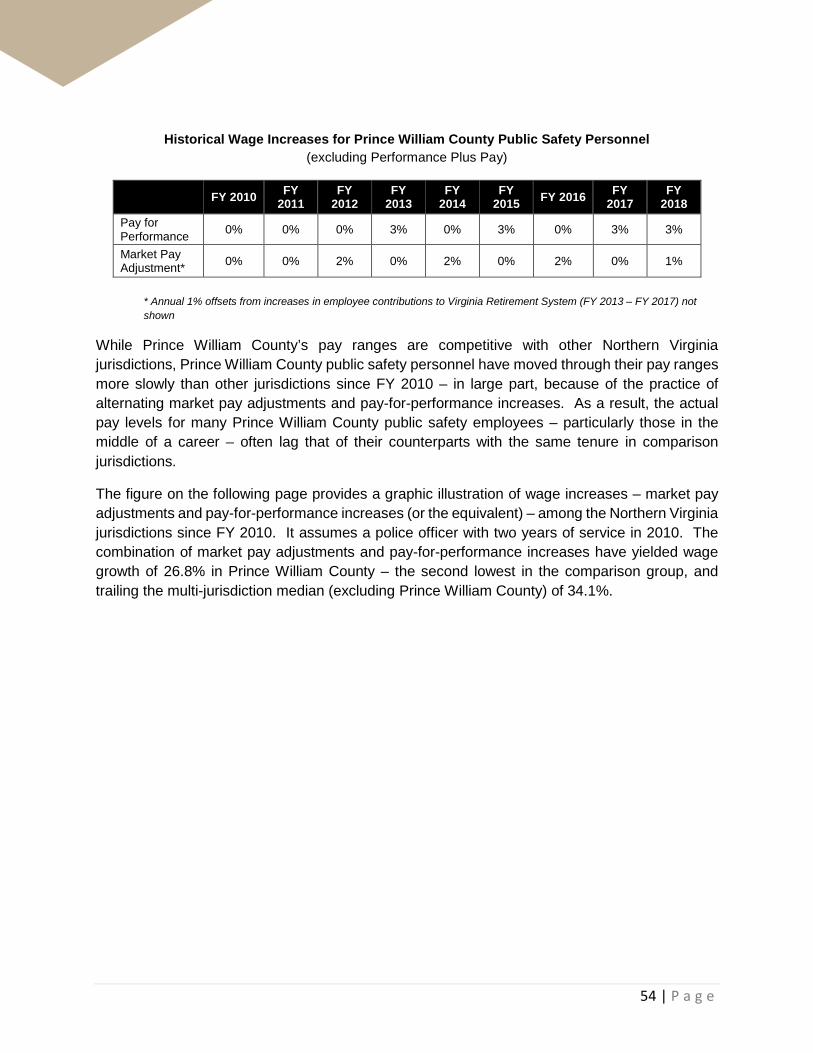
54 | P a g e
Historical Wage Increases for Prince William County Public Safety Personnel
(excluding Performance Plus Pay)
FY 2010 FY 2011
FY 2012
FY 2013
FY 2014
FY 2015 FY 2016 FY
2017 FY
2018 Pay for Performance 0% 0% 0% 3% 0% 3% 0% 3% 3%
Market Pay Adjustment* 0% 0% 2% 0% 2% 0% 2% 0% 1%
* Annual 1% offsets from increases in employee contributions to Virginia Retirement System (FY 2013 – FY 2017) not shown
While Prince William County’s pay ranges are competitive with other Northern Virginia jurisdictions, Prince William County public safety personnel have moved through their pay ranges more slowly than other jurisdictions since FY 2010 – in large part, because of the practice of alternating market pay adjustments and pay-for-performance increases. As a result, the actual pay levels for many Prince William County public safety employees – particularly those in the middle of a career – often lag that of their counterparts with the same tenure in comparison jurisdictions.
The figure on the following page provides a graphic illustration of wage increases – market pay adjustments and pay-for-performance increases (or the equivalent) – among the Northern Virginia jurisdictions since FY 2010. It assumes a police officer with two years of service in 2010. The combination of market pay adjustments and pay-for-performance increases have yielded wage growth of 26.8% in Prince William County – the second lowest in the comparison group, and trailing the multi-jurisdiction median (excluding Prince William County) of 34.1%.

55 | P a g e
Regional Market Pay Adjustments and Pay-for-Performance Increases since FY 2010 Assuming Police Officer with Two YOS in FY 2010*
* Figure excludes structural adjustment to pay schedule (e.g., changes to deputy sheriff pay progression in Loudoun County, movement of one pay grade in Alexandria, and changes to retention supplement in Prince William County). Figure includes offsets for employee contributions to VRS
Among the Northern Virginia jurisdictions surveyed, two jurisdictions have fixed pay schedules (Alexandria and Fairfax County) and two jurisdictions have pay ranges (Arlington and Loudoun Counties). Though Arlington County has a pay range, annual pay-for-performance increases have remained at 3.5% since FY 2011. Additional detail on each jurisdiction’s pay progression is provided below:
• In the City of Alexandria, police, fire, and deputy sheriffs (including those providing jail services) are on separate fixed pay scales. The value of step increases is 5.0% annually through the first five steps. At Step 6 public safety personnel receive annual 3.5% step increases. At Step 10, public safety personnel receive annual 2.3% step increases until the pay range maximum is reached at Step 18.
• Arlington County has separate pay ranges for police, fire, and deputy sheriffs (including jail officers). Even though there is no fixed pay scale, employees have received annual 3.5% merit increases until the pay range maximum is reached since FY 2011.
• Fairfax County police, fire, and deputy sheriffs (including those providing jail services) are on separate fixed pay scales. Employees receive 5% annually through Step 9, and 5% at 15 and 20 YOS, which is considered longevity.
36.8%35.2%33.0%
26.8%
23.6%
0.0%
5.0%
10.0%
15.0%
20.0%
25.0%
30.0%
35.0%
40.0%
FY2009
FY2010
FY2011
FY2012
FY2013
FY2014
FY2015
FY2016
FY2017
FY2018
Fairfax County
Alexandria
Arlington County
Prince WilliamCountyLoudoun County
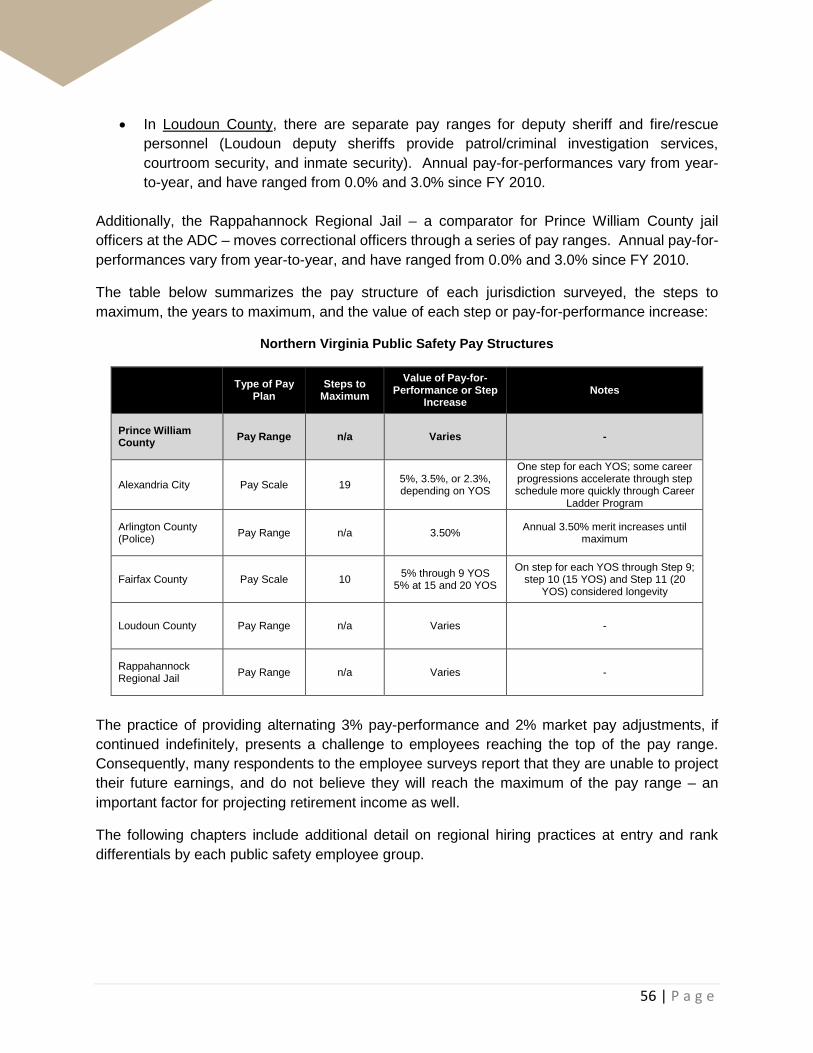
56 | P a g e
• In Loudoun County, there are separate pay ranges for deputy sheriff and fire/rescue personnel (Loudoun deputy sheriffs provide patrol/criminal investigation services, courtroom security, and inmate security). Annual pay-for-performances vary from year-to-year, and have ranged from 0.0% and 3.0% since FY 2010.
Additionally, the Rappahannock Regional Jail – a comparator for Prince William County jail officers at the ADC – moves correctional officers through a series of pay ranges. Annual pay-for-performances vary from year-to-year, and have ranged from 0.0% and 3.0% since FY 2010.
The table below summarizes the pay structure of each jurisdiction surveyed, the steps to maximum, the years to maximum, and the value of each step or pay-for-performance increase:
Northern Virginia Public Safety Pay Structures
Type of Pay Plan
Steps to Maximum
Value of Pay-for-Performance or Step
Increase Notes
Prince William County Pay Range n/a Varies -
Alexandria City Pay Scale 19 5%, 3.5%, or 2.3%, depending on YOS
One step for each YOS; some career progressions accelerate through step schedule more quickly through Career
Ladder Program
Arlington County (Police) Pay Range n/a 3.50% Annual 3.50% merit increases until
maximum
Fairfax County Pay Scale 10 5% through 9 YOS 5% at 15 and 20 YOS
On step for each YOS through Step 9; step 10 (15 YOS) and Step 11 (20
YOS) considered longevity
Loudoun County Pay Range n/a Varies -
Rappahannock Regional Jail Pay Range n/a Varies -
The practice of providing alternating 3% pay-performance and 2% market pay adjustments, if continued indefinitely, presents a challenge to employees reaching the top of the pay range. Consequently, many respondents to the employee surveys report that they are unable to project their future earnings, and do not believe they will reach the maximum of the pay range – an important factor for projecting retirement income as well.
The following chapters include additional detail on regional hiring practices at entry and rank differentials by each public safety employee group.

57 | P a g e
V. Retirement and Health Benefits Prince William County offers retirement, health, and retiree health benefits that are competitive with other large employers in Northern Virginia. The sections that follow outline the County’s benefit offerings, as well as benchmarking of cost-sharing and plan design features. Prince William County Benefits Offerings Pension Offerings
For pension benefits, Prince William County participates in the Virginia Retirement System (VRS) for all public safety employees. Additionally, fire and rescue personnel participate in a supplemental retirement plan, which is not available to the Sheriff’s Office and ADC personnel. Through the VRS, Prince William County public safety employees contribute 5% of salary and are eligible for normal retirement at age 50 with 25 years of service or age 60 with five years of service. The benefits formula in retirement is 1.85% x average final salary x years of service. Additionally, all public safety personnel are eligible for a hazardous duty supplement until Social Security Normal Retirement Age - $13,584 annually.
In addition to the VRS, Prince William County police, and fire and rescue personnel participate in a supplemental pension plan. Employees contribute an additional 1.44% of salary (6.44% total, including VRS). At age 55 or 25 years of service, retirees are eligible for one of the three options in addition to the VRS benefit:
• Option 1: Final average earnings x 1.5% x years of credited service or ((final average earnings x 1.65%) – ($1,200) x (years of credited service)), whichever is greater. Annual pay terminating at age 50
• Option 2: $640 per month for 15 years
• Option 3: Lump sum payment consisting (employee contributions + interest) x 2. Interest subject to determination of Board of Supervisors and currently at 8.5%
Not having the opportunity to participate in the supplemental retirement plan was stated as a source of employee dissatisfaction in focus groups, as well as the comment sections of the employee survey, and discussions with command staff.
The table on the following page compares the pension benefits available to each County public safety employee group.

58 | P a g e
Prince William County Pension Plan Offerings by Public Safety Employee Group
Supplemental
Retirement Plan
(County)
Hazardous Duty
Supplement (VRS)
Employee Contribution
Normal Retirement
Age Benefit Formula
Police Fire & Rescue
6.44% (5.00% VRS + 1.44% Suppl.)
Age 50 w/25 YOS
or Age 60 w/5 YOS
1.85% x AFS[1] x YOS +
Hazardous Duty Supplement of $13,584 annually until SSNRA[2]
+ County Supplement of
$7,680 for 15 years following retirement
(Option 2)
ADC Sheriff’s Office - 5.00%
(VRS)
Age 50 w/25 YOS
or Age 60 w/5 YOS
1.85% x AFS x YOS +
Hazardous Duty Supplement of $13,584 annually until SSNRA
[1] AFS denotes Average Final Salary [2] SSNRA denotes Social Security Normal Retirement Age
At retirement, all public safety personnel at Prince William County may also receive one-quarter of accrued sick leave, less 480 hours, at the current rate of pay.
Health Benefits Offerings
For health benefits, all Prince William County employees have access to the same health benefits plan offerings, and contribute the same percentage of premium. The County uses a “buy-up” cost sharing framework, where the County’s contributions for the lowest cost plan (Anthem-Healthkeepers POS) are the same as higher cost plans (Anthem-PPO Core and Anthem-PPO Enhanced). Under this arrangement, employees have the option of choosing more comprehensive healthcare coverage, but are responsible for 100% of the incremental cost.
As detailed in the table that follows, Prince William County employees contribute approximately 18.3% of premium for single coverage and approximately 36.4% of premium for dependent coverage through the Anthem PPO Enhanced plan, the highest enrollment health plan in the County.
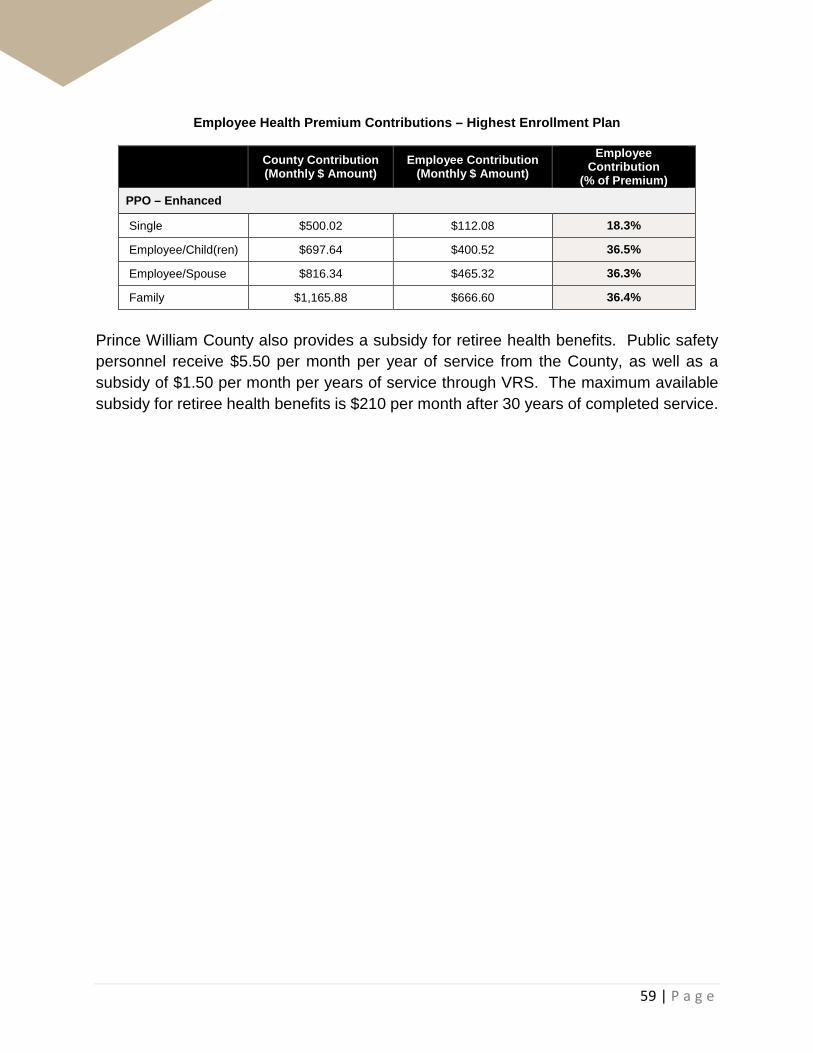
59 | P a g e
Employee Health Premium Contributions – Highest Enrollment Plan
County Contribution (Monthly $ Amount)
Employee Contribution (Monthly $ Amount)
Employee Contribution
(% of Premium) PPO – Enhanced
Single $500.02 $112.08 18.3%
Employee/Child(ren) $697.64 $400.52 36.5%
Employee/Spouse $816.34 $465.32 36.3%
Family $1,165.88 $666.60 36.4%
Prince William County also provides a subsidy for retiree health benefits. Public safety personnel receive $5.50 per month per year of service from the County, as well as a subsidy of $1.50 per month per years of service through VRS. The maximum available subsidy for retiree health benefits is $210 per month after 30 years of completed service.

60 | P a g e
Pension Comparisons Police and Fire & Rescue Pension Comparisons
Prince William County police, and fire and rescue personnel participate in VRS and have access to the County’s supplemental retirement plan. At 6.44% (VRS + Supplemental Plan), Prince William County has the second lowest employee contribution in the comparison group.
Police and Fire & Rescue Pension Benefit Comparisons [1]
Employee Contribution
Normal Retirement Age Benefit Formula
Social Security
Participation
Prince William County
6.44% (5.00% VRS + 1.44% Suppl.)
Age 50 w/25 YOS
or Age 60 w/5 YOS
1.85% x AFS[2] x YOS + Hazardous Duty Supplement of $13,584
annually until SSNRA [3] + County Supplement of $7,680 for 15 years following retirement (Option 2)
Alexandria City 8.00%
Age 50 w/25 YOS
or Age 55 w/5 YOS
2.5% x AFS X YOS (1 - 20 YOS) 3.2% x AFS x YOS (21 - 30 YOS)
Arlington County 7.50%
Any age w/25 YOS
or Age 52 w/5 YOS
2.7% x AFS X YOS
Fairfax County (Police) 8.65% Any age with 25
YOS or Age 55 2.8% x AFS X YOS X 1.03 -
Fairfax County (Fire & Rescue) 7.08%
Any age with 25 YOS or Age 55
with 6 YOS
2.8% x AFS X YOS X 1.03 + 0.3% x FAE x YOS x 1.03 (pre-Social
Security benefit)
Loudoun County 5.00%
Age 50 w/25 YOS
or Age 60 w/5 YOS
1.85% x AFS x YOS + Hazardous Duty Supplement of $13,584
until SSNRA
[1] Police and Fire & Rescue employees are in the same pension plan in all jurisdictions detailed, except for Fairfax County. [2] AFS = Average Final Salary [3] SSNRA = Social Security Normal Retirement Age

61 | P a g e
ADC & Sheriff’s Office Pension Comparisons
Prince William County ADC and Sheriff’s Office personnel participate in VRS. At 5.00%, Prince William County is tied for the lowest employee contribution in the comparison group. Main elements of pension plans for Sheriff’s Office and jail officer personnel are summarized in the table below.
ADC & Sheriff’s Office Retirement Benefits Comparisons (Most Current Pension Tier)
Employee Contribution
Normal Retirement
Age Benefit Formula
Social Security
Participation
Prince William County
5.00% (VRS)
Age 50 w/25 YOS
or Age 60 w/5 YOS
1.85% x AFS[1] x YOS + Hazardous Duty Supplement of $13,584 annually until SSNRA[2]
Alexandria City
VRS: 5.00% City
Supplemental: 0.00%
Rule of 90 (Age + YOS =
90) or SSNRA[2] and 5
YOS
VRS: 1.65% x AFS x YOS
City Supplemental: 0.6% x AFS x YOS (0-4) + 0.9% x AFS x YOS (5-14) +
1.0% x AFS x YOS (15+)
Arlington County 7.50%
Any age w/25 YOS
or Age 52 w/5 YOS
2.7 % x AFS X YOS
Fairfax County 7.08% Any age with 25 YOS or Age 55
with 6 YOS
2.5% x AFS x YOS
Pre-Social Security Benefit 2.8% x AFS X YOS X 1.03
Loudoun County 5.00%
Age 50 w/25 YOS
or Age 60 w/5 YOS
1.85% x AFS x YOS + Hazardous Duty Supplement of
$13,584 until SSNRA
Rappahannock Regional Jail
5.00% (VRS)
Age 50 w/25 YOS
or Age 60 w/5 YOS
1.85% x AFS x YOS + Hazardous Duty Supplement of
$13,584 annually until SSNRA
[1] AFS = Average Final Salary [2} SSNRA = Social Security Normal Retirement Age

62 | P a g e
Health & Retiree Health Benefits Comparisons Prince William County employee contributions to healthcare premiums are competitive with the Northern Virginia jurisdictions surveyed. As shown in the table below, when compared against other PPO plans in the region, Prince William County public safety employee contributions to health premiums compare favorably on a percent of premium and monthly dollar amount basis.
Employee Contributions in Northern Virginia Jurisdictions – Highest Enrolled PPO Plan, Active Employees
Plan Year 2017-2018
Employee Premium (% of Premium)
Employee Premium (Monthly $ Amount)
Individual Family Individual Family
Prince William County 18.3% 36.4% $112.08 $666.60
Alexandria City 33.0% 36.6% $286.31 $863.46
Arlington County 44.9% 48.3% $423.11 $1,366.63
Fairfax County 18.1% 34.1% $133.29 $644.65
Loudoun County 15.3% 25.3% $135.20 $593.20
Median (excluding PWC) 25.5% 35.4% $210.76 $754.05
PWC Rank (higher rank denotes lower EE cost)
3 of 5 3 of 5 1 of 5 3 of 5
Rappahannock Regional Jail 15.0% 26.3% $103.10 $561.42
For retiree health coverage, Prince William County police officers receive a monthly subsidy, up to $210 per month when accounting for the County and VRS subsidies. This structure is common across the comparison group – with the City of Alexandria, Arlington County, and Fairfax County using similar structures. Though within the mainstream of the jurisdictions analyzed, the County’s subsidy is the lowest within the comparison group.

63 | P a g e
Retiree Health Comparisons – Employer Subsidies Effective July 1, 2017
Employer Subsidy
Prince William County Maximum of $210 per month with 30 YOS
VRS Subsidy: maximum of $45/month ($1.50/month per YOS)
County Subsidy: maximum of $165/month ($5.50/month per YOS)
Alexandria City Maximum of $260 per month with 25 YOS
Employees granted 4% of maximum subsidy for each year of service
Arlington County
Pre-Medicare: Maximum of $300 per month with 25 YOS
Employer subsidy provided varies by YOS at retirement: 25+ YOS: $300
23-24 YOS: $276 20-22 YOS: $240 15-19 YOS: $180 10-14 YOS: $120
0-9 YOS: $60
Medicare-eligible retirees pay 10% of the premium of the County-sponsored Medicare supplement plans
Fairfax County
Maximum of $220 per month with 25 YOS
The subsidy provided varies by years of service at retirement: 25+ YOS: $220 (maximum)
20-24 YOS: $190 15-19 YOS: $155 10-14 YOS: $65
5-9 YOS: $30
Loudoun County
Retirees with at least 10 years of County service are eligible for health care coverage.
Pre-Medicare retirees are covered under the County's Cigna POS or OAP plan. Retirees pay a percentage of premium based on years of service, level of coverage,
and plan selected. 25+ YOS: 10.7-39.6% 20-24 YOS: 29-57.7%
15-19 YOS: 60.3-75.8% 10-14 YOS: 78.1-87.9%
Medicare-eligible retirees are only eligible for coverage under the County's Cigna
Medicare Surround Plan. Retirees must enroll in Medicare Parts A & B. Retirees pay a percentage of premium based on years of service.
25+ YOS: 11.6% 20-24 YOS: 19% 15-19 YOS: 69% 10-14 YOS: 86%
Rappahannock Regional Jail
Retirees are eligible for same medical coverage as active employees with same premium split (e.g., 15%/26% of premium for single/family PPO coverage)

64 | P a g e
VI. Police
Summary of Findings Compensation
• Relative to the Northern Virginia comparison group, Prince William County’s police cash compensation is competitive at entry.
• The County has the second highest entry rate for new recruits, which can be increased further with recruitment incentives.
• Compensation for mid-career officers, however, lags other law enforcement agencies in the region from a total direct cash compensation perspective.
• Overall, the premium pays offered by the County are in-line with the comparison group.
Retention
• Employee turnover and quit rates among Prince William County police personnel have risen steadily since FY 2012, and now are among the highest in the Northern Virginia comparison group.
• This represents a stark change from earlier in the decade, when the County possessed one of the lowest attrition rates among the employers surveyed.
• Since FY 2013, voluntarily resignations, not retirements, has been the principal cause of the Department’s attrition.
• Employee surveys and focus groups highlight compensation as the primary internal factor driving employee dissatisfaction, motivating employees to voluntarily leave the Department.
• Pay compression, comparative pay levels, and inability to project future earnings are cited as the concerns/issues with the current compensation package. A large majority of respondents to the active police employee survey reported that:
o Employees with longer tenure should have higher levels of base pay;
o Their pay levels are not appropriate for their level of responsibility and tenure; and
o They are unable to reasonably estimate their future earnings in five, 10, or 15 years.
• As a result, employees with fewer than five years of service are the most likely to resign. Not incidentally, this is the approximate career juncture where the County’s comparative compensation levels begin to lag the Northern Virginia comparison group.

65 | P a g e
• These findings indicate that approaches to alleviate pay compression, align compensation levels with tenure, and provide a more predictable schedule of future earnings – e.g., a pay scale – may have the greatest effect on improving the Department’s retention experience.
Recruitment
• From a recruitment perspective, the Department continues to maintain a large pipeline of strong recruits.
• Generally, recruits look favorably upon their recruitment process and hold a positive impression of the Department. Nevertheless, more than 50% of recruits report that they are unsure if they will spend their entire law enforcement career with the Department.
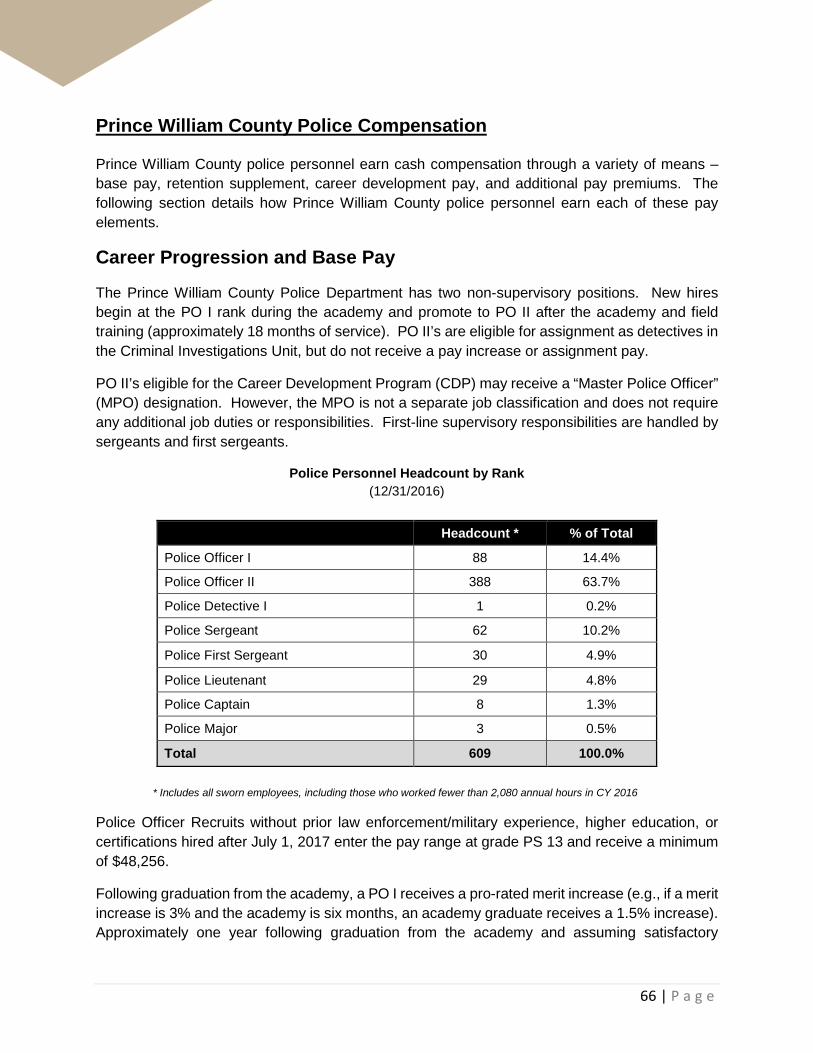
66 | P a g e
Prince William County Police Compensation Prince William County police personnel earn cash compensation through a variety of means – base pay, retention supplement, career development pay, and additional pay premiums. The following section details how Prince William County police personnel earn each of these pay elements.
Career Progression and Base Pay
The Prince William County Police Department has two non-supervisory positions. New hires begin at the PO I rank during the academy and promote to PO II after the academy and field training (approximately 18 months of service). PO II’s are eligible for assignment as detectives in the Criminal Investigations Unit, but do not receive a pay increase or assignment pay.
PO II’s eligible for the Career Development Program (CDP) may receive a “Master Police Officer” (MPO) designation. However, the MPO is not a separate job classification and does not require any additional job duties or responsibilities. First-line supervisory responsibilities are handled by sergeants and first sergeants.
Police Personnel Headcount by Rank (12/31/2016)
Headcount * % of Total
Police Officer I 88 14.4%
Police Officer II 388 63.7%
Police Detective I 1 0.2%
Police Sergeant 62 10.2%
Police First Sergeant 30 4.9%
Police Lieutenant 29 4.8%
Police Captain 8 1.3%
Police Major 3 0.5%
Total 609 100.0% * Includes all sworn employees, including those who worked fewer than 2,080 annual hours in CY 2016
Police Officer Recruits without prior law enforcement/military experience, higher education, or certifications hired after July 1, 2017 enter the pay range at grade PS 13 and receive a minimum of $48,256.
Following graduation from the academy, a PO I receives a pro-rated merit increase (e.g., if a merit increase is 3% and the academy is six months, an academy graduate receives a 1.5% increase). Approximately one year following graduation from the academy and assuming satisfactory

67 | P a g e
performance and completion of field training, PO I’s receive a non-competitive promotion to PO II. The promotion to PO II results in movement to the minimum of grade PS 14 ($52,749) assuming no additional recruitment incentives.
Assuming no additional promotions and no entry into the Department’s CDP, a rank-and-file police officer will continue through the PO II pay range (PS 14) – through market pay adjustments in years in which they are provided – until the pay range maximum is reached ($89,523 as of FY 2018, excluding retention supplement). Competitive promotions to sergeant and first sergeant (first-line supervisor) and lieutenant (second-line supervisor) result in an increase in base pay of 5% and movement to the PS 15, PS 16 and PS 17 pay grades, respectively. Promotions to captain (third-line supervisor) result in a pay increase of 10% (grade PS 19).
The table below illustrates the pay ranges for each uniformed title in the police department:
Prince William County Police Pay Ranges Effective July 1, 2017 – June 30, 2018
Grade Minimum Maximum Maximum + Retention
Supplement Police Officer I (Recruit) PS 13 $48,256 $81,910 $86,006
Police Officer II PS 14 $52,749 $89,523 $93,999
Police Sergeant PS 15 $57,845 $98,238 $103,150
Police First Sergeant PS 16 $63,856 $108,410 $113,831
Police Lieutenant PS 17 $70,741 $120,120 $125,541
Police Captain PS 19 $81,432 $138,258 $143,679
Police Major PS 21 $89,794 $152,464 $157,885
Hiring Practices at Entry
While the pay range minimum for a PO I is at grade PS 13 is $48,256, the actual base pay earned at entry will vary considerably according to prior law enforcement experience, prior military experience, language skills, and educational attainment. A police officer may receive any combination of recruitment incentives (up to the midpoint of the PS 13 pay range) listed below:
• Prior Law Enforcement Experience: 2.0% increase over entry for 2 YOS, 5.0% increase for up to 5 YOS, maximum of 7.0% for 5+ YOS
• Virginia Certified Law Enforcement Officer: 10.0% increase over entry for officers who are a certified police officer in the Commonwealth of Virginia

68 | P a g e
• Military Experience: minimum increase of 1.5% increase over entry for honorable discharge and achievement of rank E-4 though E-6 or W-1 through W-3; minimum of 3.0% increase for rank E-7 through E-9, W-4, or O-1 or higher
• Education: 1.5% increase over entry for an associate’s degree, 3.0% increase for a bachelor’s degree, 4.5% increase for a master’s degree, 6.0% increase for a doctoral degree
• Language: 5.0% increase for demonstrated ability to read, understand, and fluently speak Spanish
• EMT-B Certification: 1.5% increase over entry base pay Given the variety of pay premiums that may influence base pay at entry, the range for base pay for officers in any given year of service may fluctuate materially.
As a result, officers with the same level of experience with the Department will earn different levels of base compensation. Moreover, depending on recruitment incentives earned, officers with less tenure at the department may earn higher levels of base pay than officers who possess more tenure with the department in the same rank. In the absence of a well-defined pay progression, variances between pay can continue throughout the course of a career with the department without equalizing.
A separate, but related, factor that contributes to misaligned expectations among police officers involves the promotional increases received when promoted to PO II.
When promoted to PO II, officers receive an automatic 5% wage increase. If the 5% increase results in pay level below the pay range minimum for PS 14 ($52,749), officers automatically move to the PS 14 pay range minimum.
In practice, however, the movement to the PS 14 pay range results in the relative erosion of recruitment incentives For example, an officer with two years of experience (not certified in the Commonwealth of Virginia) and a bachelor’s degree will be eligible for 5.0% increase (2.0% + 3.0%) over entry as a PO II. But when he/she promotes to PO II, the officer receives a pay increase to the PO II pay range minimum of PS 14, not the pay range minimum + 5.0%. Consequently, in this example, one year following graduation from the academy, the officer with prior experience and a bachelor’s degree earns the same base pay as an officer with no experience and no bachelor’s degree.
A large portion of current employees report that they are unaware of this feature of the pay schedule. In the active employee survey, 75% of respondents (159 of 212 respondents for whom this situation applied) reported that they found out their education incentive pay did not carryover when they promoted to PO II.
69 | P a g e
Approximately 38% of active employee survey respondents (n = 360) reported that the Department’s educational hiring incentive pay premium was a “very important” or “important” factor in their decision to join the Department.
Among police officer recruits, 63% of survey respondents (29 of 46) reported that educational incentives were “very important” or “important” factors in deciding to join the Department, but no respondent reported that it was the “primary reason” he/she chose to join the Department.
Accordingly, officer expectations are not always aligned with Departmental pay practices. Most officers with prior experience, certifications, and higher education believe that their recruitment incentives will carry through to promotion as a PO II. This misalignment of expectations can contribute to job dissatisfaction levels among police officers in the early stages of their career, and most at risk to voluntarily resign.
Additional Compensation
Additional pay premiums received by the majority of police officers include:
• Retention Supplement: After two years of service, all uniformed police personnel receive a retention supplement of 5% of base pay up to the maximum of Grade PS 16. Though issued in a separate pay check, the retention supplement is considered pensionable compensation and treated as part of base pay by the Virginia Retirement System (VRS).
• Holiday Pay: Prince William County police personnel receive 12 holidays. Most employees (e.g., patrol) receive 2.5x pay (1.5x premium) for working 10 holidays and comp time for 2 holidays. Employees on other shifts receive 2.5x pay (1.5x premium) for working 6 holidays, and a day of leave (no additional compensation or leave) for the remaining holidays. Employees working 8-hour shifts receive 6 paid holidays at 2.5x pay (1.5x premium) and 6 days of leave. For those officers receiving this premium, the additional compensation averaged approximately $3,000 in calendar year 2016.
• Shift Differential: Shift differential pay is provided to law enforcement personnel below the rank of Captain. Officers who work between 9:00 PM and 7:00 AM receive an additional $0.70 per hour actually worked. In calendar year 2016, 66% of PO IIs (258 officers) received this premium at some point during the year. For those employees receiving this premium, the additional compensation averaged $811 in calendar year 2016.
• Field Training Officer: Police officers serving as a field training officer (FTO) receive one
hour of overtime for each day an officer serves as an FTO (48 days total)
Employees may also receive Performance Plus Pay – a one-time payment based on employee evaluations. Employees who receive an “exceeds” rating earn an additional 1% lump-sum payment; employees with a “greatly exceeds” rating receive an additional lump-sum payment of
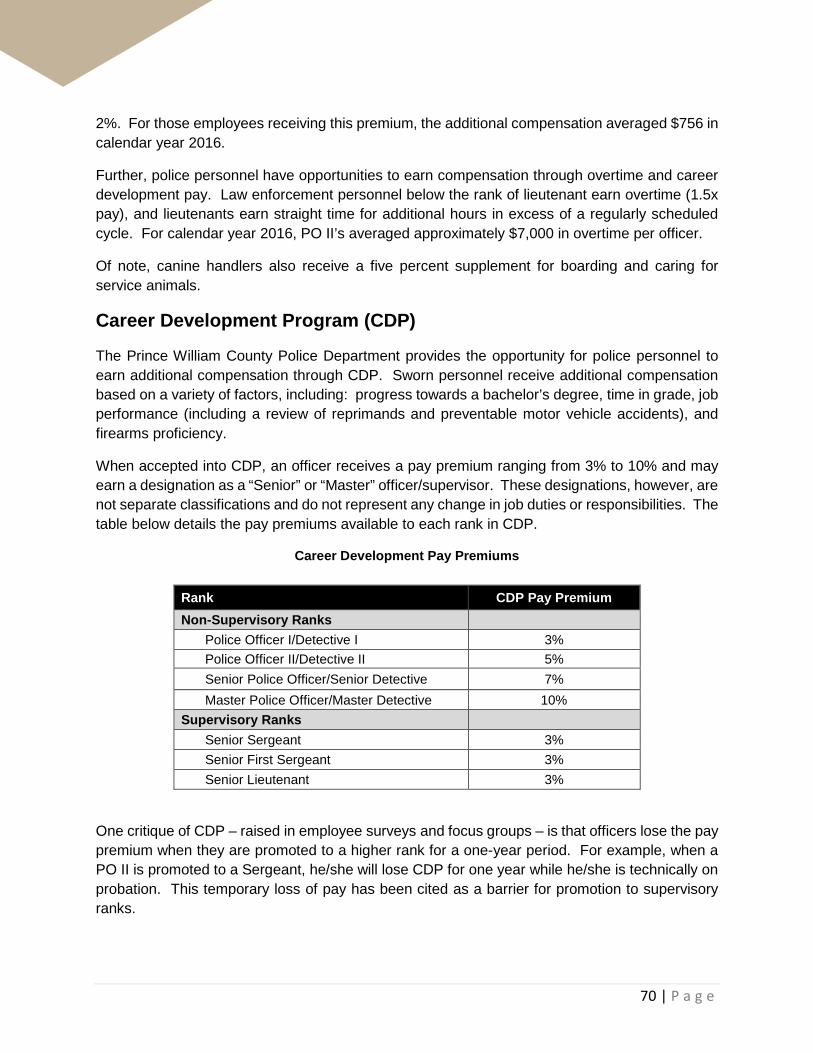
70 | P a g e
2%. For those employees receiving this premium, the additional compensation averaged $756 in calendar year 2016.
Further, police personnel have opportunities to earn compensation through overtime and career development pay. Law enforcement personnel below the rank of lieutenant earn overtime (1.5x pay), and lieutenants earn straight time for additional hours in excess of a regularly scheduled cycle. For calendar year 2016, PO II’s averaged approximately $7,000 in overtime per officer.
Of note, canine handlers also receive a five percent supplement for boarding and caring for service animals.
Career Development Program (CDP)
The Prince William County Police Department provides the opportunity for police personnel to earn additional compensation through CDP. Sworn personnel receive additional compensation based on a variety of factors, including: progress towards a bachelor’s degree, time in grade, job performance (including a review of reprimands and preventable motor vehicle accidents), and firearms proficiency.
When accepted into CDP, an officer receives a pay premium ranging from 3% to 10% and may earn a designation as a “Senior” or “Master” officer/supervisor. These designations, however, are not separate classifications and do not represent any change in job duties or responsibilities. The table below details the pay premiums available to each rank in CDP.
Career Development Pay Premiums
Rank CDP Pay Premium Non-Supervisory Ranks
Police Officer I/Detective I 3% Police Officer II/Detective II 5% Senior Police Officer/Senior Detective 7% Master Police Officer/Master Detective 10%
Supervisory Ranks Senior Sergeant 3% Senior First Sergeant 3% Senior Lieutenant 3%
One critique of CDP – raised in employee surveys and focus groups – is that officers lose the pay premium when they are promoted to a higher rank for a one-year period. For example, when a PO II is promoted to a Sergeant, he/she will lose CDP for one year while he/she is technically on probation. This temporary loss of pay has been cited as a barrier for promotion to supervisory ranks.

71 | P a g e
Across all ranks, 240 employees (approx. 39.6%) received an average of $2,791 in CDP pay as of 12/31/2016. One result of CDP is that it creates disincentives for promotions. A master police officer (MPO) receives a 10% pay differential over PO II without any changes in duties and responsibilities, while a sergeant receives a 5% pay differential over PO II with expanded job duties and additional supervisory responsibilities. Additionally, to be eligible for promotion, sergeants must forgo CDP for one year when in probationary status. Take-Home Vehicles
The police department has a take-home vehicle program, subject to vehicle availability. The full-time vehicle program provides a single take-home vehicle to an officer, while participants in the part-time program share a take-home vehicle with an officer on a complementary shift. To be eligible, officers must live in Prince William County. Vehicles are prioritized by officer tenure.
Leave
In addition to cash compensation, uniformed Police William County Police personnel receive annual leave allowances based on years of service. All Prince William County employees receive the same prorated number of annual leave days, based on the number of standard scheduled hours. As law enforcement personnel work 40-hour workweeks (2,080 annual hours), Prince William County employees accrue between 110.9 and 221.7 hours of annual leave per year, depending on years of service, as summarized in the table below.
Prince William County Leave Allowances – Police Officers
Years of Service (YOS) Annual Leave Accrued
per Year (8-hour day equivalents)
Less than 3 YOS 14
More than 3 YOS, less than 6 YOS 17
More than 6 YOS, less than 9 YOS 21
More than 9 YOS, less than 12 YOS 24
More than 12 YOS 28 In addition to annual leave, paid leave is available for non-job related illness and injury (104 hours per year), work-related disability, military service, civil leave (e.g., jury duty), and bereavement leave.

72 | P a g e
Northern Virginia Police Compensation The section that follows provides comparisons of Prince William County police compensation with the Northern Virginia comparison group. With more than 600 sworn personnel, the Prince William County Police Department is the second largest department in the region as illustrated in the table below.
Police Force Size Northern Virginia Comparison Group9
Number of Sworn Officers Population Sworn Officers
Per 100,000 Prince William County 602 455,120 132 Alexandria City 306 155,810 196 Arlington County 365 230,050 159 Loudoun County 526 385,945 136 Fairfax County 1,327 1,138,652 117
Base Pay Comparisons
Entry pay is an important factor in generating a pipeline of talented and qualified recruits. At entry, Prince William County entry-level police officer base pay – excluding any recruitment differentials for education, certifications, or prior experience – is competitive with the large Northern Virginia jurisdictions surveyed. At $48,256, Prince William County ranks 2 of 5 jurisdictions – trailing only Fairfax County.
Maximum base + longevity represents another important career juncture for analysis. As the highest pay level attained, the pay range maximum often serves as the basis for post-retirement pension calculations. At maximum base pay + longevity (i.e., inclusive of the retention supplement in Prince William County), Prince William County again compares favorably – ranking 1 of 5 jurisdictions.
The figure on the following page details the pay ranges for each jurisdiction in the comparison group.
9 Sources: U.S. Census Bureau, American Community Survey 2016 1- Year Estimates, Federal Bureau of Investigations, Uniform Crime Reporting, 2015

73 | P a g e
Full Performance Police Officer Pay Ranges Effective 6/30/2018
Range spreads represent another analytical approach to evaluate a pay range. A pay range spread is calculated by taking the difference between minimum and maximum of a pay range and dividing by the minimum. It quantifies the opportunity for advancement within a pay grade or career path without promotion.
The figure on the next page summarizes the range spreads for rank-and-file career progressions in Prince William County and the comparison group. The entry rate shown for Prince William County, and the comparison jurisdictions, is the recruit rate without any recruitment incentives. The maximum is the full-performance classifications (i.e., PO II in Prince William County) including retention supplements/longevity. With a range spread of 94.8%, Prince William County represents the second highest range spread in the comparison group.
$48,256 $46,993 $47,863 $48,006 $50,932
$93,999$87,719
$93,466$87,880 $87,112
$0
$10,000
$20,000
$30,000
$40,000
$50,000
$60,000
$70,000
$80,000
$90,000
$100,000
Prince WilliamCounty
LoudounCounty
AlexandriaCity
ArlingtonCounty
Fairfax County

74 | P a g e
Full Performance Police Officer Pay Range Spreads Effective 6/30/2018
Looking at pay range maximums and range spreads alone, however, does not reveal the full story of police officer compensation. Pay ranges and range spreads are measures of wage opportunity, but do not provide insight into earnings at specific career junctures, or average compensation earned over the course of a career. Additionally, they do not reflect the impacts of years where pay-for-performance pay was frozen or other components of compensation received by a large portion of workforce – such as holiday pay.
71.0%
83.1%
86.7%
94.8%
95.3%
0.0% 25.0% 50.0% 75.0% 100.0% 125.0%
Fairfax County
Arlington County
Loudoun County
Prince William County
Alexandria City
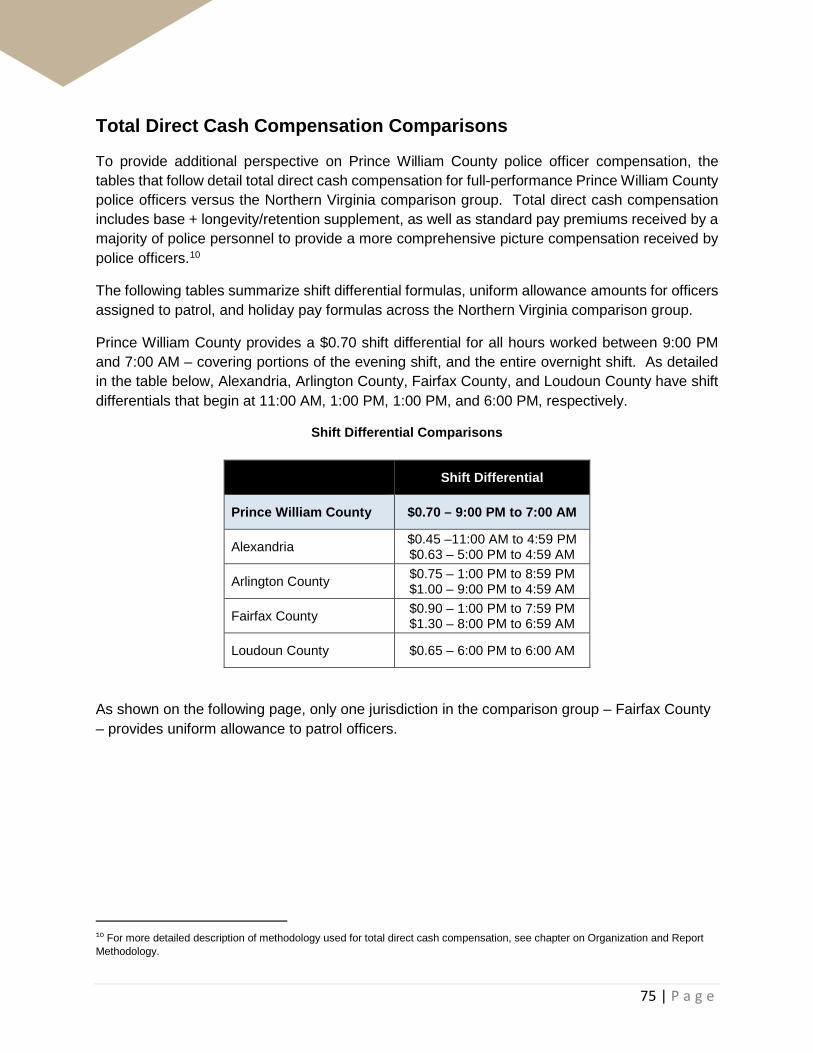
75 | P a g e
Total Direct Cash Compensation Comparisons
To provide additional perspective on Prince William County police officer compensation, the tables that follow detail total direct cash compensation for full-performance Prince William County police officers versus the Northern Virginia comparison group. Total direct cash compensation includes base + longevity/retention supplement, as well as standard pay premiums received by a majority of police personnel to provide a more comprehensive picture compensation received by police officers.10
The following tables summarize shift differential formulas, uniform allowance amounts for officers assigned to patrol, and holiday pay formulas across the Northern Virginia comparison group.
Prince William County provides a $0.70 shift differential for all hours worked between 9:00 PM and 7:00 AM – covering portions of the evening shift, and the entire overnight shift. As detailed in the table below, Alexandria, Arlington County, Fairfax County, and Loudoun County have shift differentials that begin at 11:00 AM, 1:00 PM, 1:00 PM, and 6:00 PM, respectively.
Shift Differential Comparisons
Shift Differential
Prince William County $0.70 – 9:00 PM to 7:00 AM
Alexandria $0.45 –11:00 AM to 4:59 PM $0.63 – 5:00 PM to 4:59 AM
Arlington County $0.75 – 1:00 PM to 8:59 PM $1.00 – 9:00 PM to 4:59 AM
Fairfax County $0.90 – 1:00 PM to 7:59 PM $1.30 – 8:00 PM to 6:59 AM
Loudoun County $0.65 – 6:00 PM to 6:00 AM
As shown on the following page, only one jurisdiction in the comparison group – Fairfax County – provides uniform allowance to patrol officers.
10 For more detailed description of methodology used for total direct cash compensation, see chapter on Organization and Report Methodology.

76 | P a g e
Uniform Allowance Comparisons
Uniform Allowance
(Patrol) Prince William County -
Alexandria -
Arlington County -
Fairfax County $400
Loudoun County -
Prince William County’s holiday pay schedule is competitive with the comparison group. The Police Chief designates 10 holidays that will be eligible for 2.5x pay and two holidays that will be eligible for comp time.
Holidays and Holiday Pay
Number of Holidays Holiday Pay Formula (Patrol)
Prince William County 12 holidays 2.5x pay (1.5x premium) for 10 holidays if worked; comp time for 2 holidays if worked
Alexandria 11.25 holidays 8 hours of straight time if holiday is worked, 8 hours of leave if holiday is not worked
Arlington County 12.25 holidays 8 hours of pay or leave regardless if holiday is worked
Fairfax County 11.75 holidays 11.5 hours of pay or leave if working a holiday 8 hours of pay or leave if holiday not worked
Loudoun County 13.50 holidays 8.5 hours at 2.5x pay (1.5x premium) for each holiday worked; 8.5 hours at 1.0x pay (1.0x premium)

77 | P a g e
As detailed in the table below, when accounting for these additional elements of cash compensation – shift differential, uniform allowance, and holiday pay, Prince William County continues to trail the Northern Virginia median by more than 6.0% at five YOS, and more than 10% at 10 and 15 YOS.
Police Officer Pay Comparisons – Total Direct Cash Compensation Select Career Junctures, Effective 12/31/2016
Prince William County
Alexandria City
Arlington County
Fairfax County
Loudoun County
PWC Rank
NOVA Median
PWC Variance
5 YOS $62,554 $68,941 $64,473 $71,353 $60,368 4 of 5 $66,707 -6.2%
10 YOS $67,975 $81,918 $73,785 $78,456 $62,146 4 of 5 $76,120 -10.7%
15 YOS $79,633 $91,672 $87,409 $90,192 $71,935 4 of 5 $88,801 -10.3%
20 YOS $92,249 $95,899 $93,170 $94,340 $83,290 4 of 5 $93,755 -1.6%
25 YOS $96,527 $95,899 $93,170 $94,340 $92,203 1 of 5 $93,755 3.0%
30 YOS $99,736 $95,899 $93,170 $94,340 $92,203 1 of 5 $93,755 6.4%
25-Year
Avg $75,674 $81,459 $77,900 $81,286 $68,938 4 of 5 $79,593 -4.9%
30-Year Avg $79,518 $83,866 $80,445 $83,462 $72,816 4 of 5 $81,954 -3.0%
Beginning in Year 6 and continuing through Year 19 of service, Prince William County total direct cash compensation trails the comparison group in each year of service – denoted by red shading on the following page.

78 | P a g e
Total Direct Cash Compensation – Police Officer Effective 12/31/2016
Prince William County
Alexandria City
Arlington County
Fairfax County
Loudoun County PWC Rank NOVA
Median PWC
Variance ($ Amount)
PWC Variance
(%) Year 1 $53,505 $50,679 $51,456 $56,065 $49,727 2 of 5 $51,067 $2,437 4.8% Year 2 $54,629 $53,165 $56,347 $59,114 $51,195 3 of 5 $54,756 -$127 -0.2% Year 3 $58,985 $58,523 $58,278 $64,699 $52,708 2 of 5 $58,401 $584 1.0% Year 4 $59,581 $61,402 $60,262 $68,054 $56,947 4 of 5 $60,832 -$1,251 -2.1% Year 5 $63,560 $63,515 $62,332 $71,353 $58,632 2 of 5 $62,923 $637 1.0% Year 6 $62,554 $68,941 $64,473 $71,353 $60,368 4 of 5 $66,707 -$4,154 -6.2% Year 7 $65,142 $71,322 $66,674 $74,818 $60,441 4 of 5 $68,998 -$3,856 -5.6% Year 8 $65,178 $73,783 $68,968 $74,818 $60,515 4 of 5 $71,376 -$6,198 -8.7% Year 9 $67,172 $73,779 $68,968 $74,818 $60,592 4 of 5 $71,374 -$4,202 -5.9% Year 10 $68,799 $80,099 $71,328 $74,818 $60,357 4 of 5 $73,073 -$4,274 -5.8% Year 11 $67,975 $81,918 $73,785 $78,456 $62,146 4 of 5 $76,120 -$8,146 -10.7% Year 12 $70,831 $83,778 $76,329 $82,275 $63,988 4 of 5 $79,302 -$8,471 -10.7% Year 13 $70,195 $85,683 $78,946 $86,286 $65,885 4 of 5 $82,314 -$12,120 -14.7% Year 14 $72,389 $87,633 $81,671 $86,286 $67,843 4 of 5 $83,978 -$11,590 -13.8% Year 15 $76,391 $89,630 $84,491 $86,286 $69,859 4 of 5 $85,388 -$8,997 -10.5% Year 16 $79,633 $91,672 $87,409 $90,192 $71,935 4 of 5 $88,801 -$9,168 -10.3% Year 17 $80,209 $93,762 $90,430 $90,192 $74,074 4 of 5 $90,311 -$10,102 -11.2% Year 18 $87,472 $95,899 $93,170 $90,192 $76,277 4 of 5 $91,681 -$4,209 -4.6% Year 19 $89,009 $95,899 $93,170 $90,192 $78,546 4 of 5 $91,681 -$2,672 -2.9% Year 20 $93,642 $95,899 $93,170 $90,192 $80,883 2 of 5 $91,681 $1,961 2.1% Year 21 $92,249 $95,899 $93,170 $94,340 $83,290 4 of 5 $93,755 -$1,506 -1.6% Year 22 $95,155 $95,899 $93,170 $94,340 $85,770 2 of 5 $93,755 $1,400 1.5% Year 23 $99,739 $95,899 $93,170 $94,340 $88,323 1 of 5 $93,755 $5,984 6.4% Year 24 $99,735 $95,899 $93,170 $94,340 $90,954 1 of 5 $93,755 $5,980 6.4% Year 25 $98,131 $95,899 $93,170 $94,340 $92,203 1 of 5 $93,755 $4,376 4.7% Year 26 $96,527 $95,899 $93,170 $94,340 $92,203 1 of 5 $93,755 $2,772 3.0% Year 27 $98,534 $95,899 $93,170 $94,340 $92,203 1 of 5 $93,755 $4,779 5.1% Year 28 $99,135 $95,899 $93,170 $94,340 $92,203 1 of 5 $93,755 $5,380 5.7% Year 29 $99,736 $95,899 $93,170 $94,340 $92,203 1 of 5 $93,755 $5,981 6.4% Year 30 $99,736 $95,899 $93,170 $94,340 $92,203 1 of 5 $93,755 $5,981 6.4% 25-Year Avg $75,674 $81,459 $77,900 $81,286 $68,938 4 of 5 $79,593 - -4.9% 30-Year Avg $79,518 $83,866 $80,445 $83,462 $72,816 4 of 5 $81,954 - -3.0%
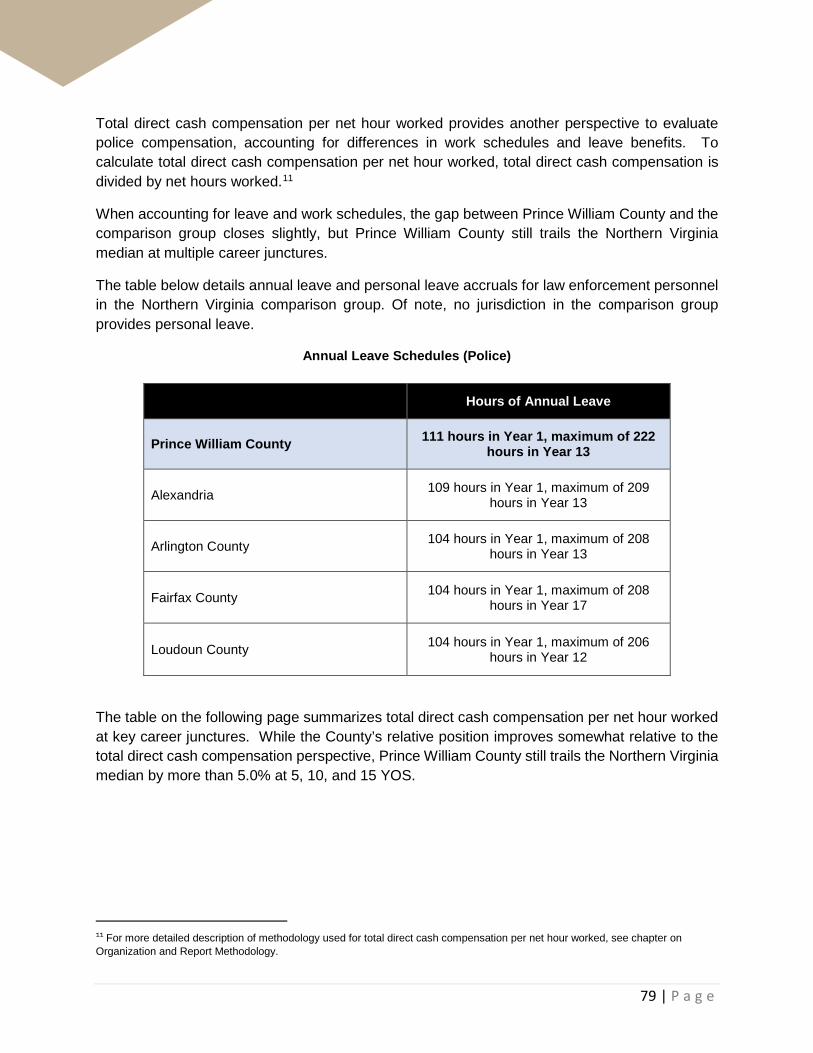
79 | P a g e
Total direct cash compensation per net hour worked provides another perspective to evaluate police compensation, accounting for differences in work schedules and leave benefits. To calculate total direct cash compensation per net hour worked, total direct cash compensation is divided by net hours worked.11
When accounting for leave and work schedules, the gap between Prince William County and the comparison group closes slightly, but Prince William County still trails the Northern Virginia median at multiple career junctures.
The table below details annual leave and personal leave accruals for law enforcement personnel in the Northern Virginia comparison group. Of note, no jurisdiction in the comparison group provides personal leave.
Annual Leave Schedules (Police)
Hours of Annual Leave
Prince William County 111 hours in Year 1, maximum of 222 hours in Year 13
Alexandria 109 hours in Year 1, maximum of 209 hours in Year 13
Arlington County 104 hours in Year 1, maximum of 208 hours in Year 13
Fairfax County 104 hours in Year 1, maximum of 208 hours in Year 17
Loudoun County 104 hours in Year 1, maximum of 206 hours in Year 12
The table on the following page summarizes total direct cash compensation per net hour worked at key career junctures. While the County’s relative position improves somewhat relative to the total direct cash compensation perspective, Prince William County still trails the Northern Virginia median by more than 5.0% at 5, 10, and 15 YOS.
11 For more detailed description of methodology used for total direct cash compensation per net hour worked, see chapter on Organization and Report Methodology.
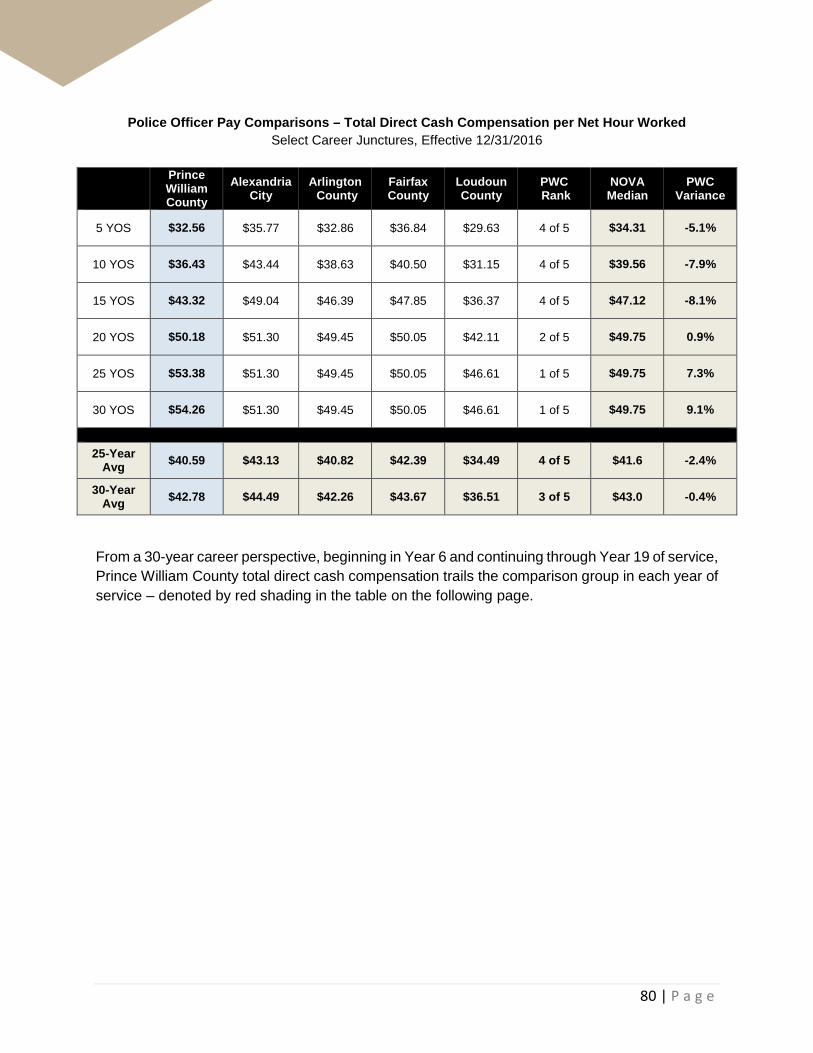
80 | P a g e
Police Officer Pay Comparisons – Total Direct Cash Compensation per Net Hour Worked Select Career Junctures, Effective 12/31/2016
Prince William County
Alexandria City
Arlington County
Fairfax County
Loudoun County
PWC Rank
NOVA Median
PWC Variance
5 YOS $32.56 $35.77 $32.86 $36.84 $29.63 4 of 5 $34.31 -5.1%
10 YOS $36.43 $43.44 $38.63 $40.50 $31.15 4 of 5 $39.56 -7.9%
15 YOS $43.32 $49.04 $46.39 $47.85 $36.37 4 of 5 $47.12 -8.1%
20 YOS $50.18 $51.30 $49.45 $50.05 $42.11 2 of 5 $49.75 0.9%
25 YOS $53.38 $51.30 $49.45 $50.05 $46.61 1 of 5 $49.75 7.3%
30 YOS $54.26 $51.30 $49.45 $50.05 $46.61 1 of 5 $49.75 9.1%
25-Year
Avg $40.59 $43.13 $40.82 $42.39 $34.49 4 of 5 $41.6 -2.4%
30-Year Avg $42.78 $44.49 $42.26 $43.67 $36.51 3 of 5 $43.0 -0.4%
From a 30-year career perspective, beginning in Year 6 and continuing through Year 19 of service, Prince William County total direct cash compensation trails the comparison group in each year of service – denoted by red shading in the table on the following page.

81 | P a g e
Total Direct Cash Compensation per Net Hour Worked – Police Officer Effective 12/31/2016
Prince William County
Alexandria City
Arlington County
Fairfax County
Loudoun County PWC Rank NOVA
Median PWC
Variance ($ Amount)
PWC Variance
(%) Year 1 $27.45 $25.74 $25.88 $28.19 $23.91 2 of 5 $25.81 $1.64 6.4% Year 2 $28.03 $27.12 $28.34 $29.72 $24.71 3 of 5 $27.73 $0.30 1.1% Year 3 $30.26 $29.97 $29.31 $32.53 $25.55 2 of 5 $29.64 $0.62 2.1% Year 4 $31.01 $31.59 $30.71 $35.13 $27.72 3 of 5 $31.15 -$0.14 -0.5% Year 5 $33.08 $32.82 $31.77 $36.84 $28.66 2 of 5 $32.29 $0.79 2.4% Year 6 $32.56 $35.77 $32.86 $36.84 $29.63 4 of 5 $34.31 -$1.76 -5.1% Year 7 $34.40 $37.17 $34.44 $38.63 $29.79 4 of 5 $35.80 -$1.40 -3.9% Year 8 $34.42 $38.61 $35.62 $38.63 $29.95 4 of 5 $37.12 -$2.70 -7.3% Year 9 $35.47 $38.79 $35.62 $38.63 $30.12 4 of 5 $37.12 -$1.65 -4.4% Year 10 $36.87 $42.29 $37.34 $38.63 $30.13 4 of 5 $37.98 -$1.11 -2.9% Year 11 $36.43 $43.44 $38.63 $40.50 $31.15 4 of 5 $39.56 -$3.14 -7.9% Year 12 $37.96 $44.63 $39.96 $42.48 $32.21 4 of 5 $41.22 -$3.26 -7.9% Year 13 $38.18 $45.84 $41.90 $44.55 $33.31 4 of 5 $43.22 -$5.04 -11.7% Year 14 $39.38 $46.88 $43.34 $44.55 $34.30 4 of 5 $43.95 -$4.57 -10.4% Year 15 $41.56 $47.95 $44.84 $44.55 $35.32 4 of 5 $44.69 -$3.14 -7.0% Year 16 $43.32 $49.04 $46.39 $47.85 $36.37 4 of 5 $47.12 -$3.80 -8.1% Year 17 $43.63 $50.16 $47.99 $47.85 $37.45 4 of 5 $47.92 -$4.29 -8.9% Year 18 $47.58 $51.30 $49.45 $47.85 $38.56 4 of 5 $48.65 -$1.06 -2.2% Year 19 $48.42 $51.30 $49.45 $47.85 $39.71 3 of 5 $48.65 -$0.23 -0.5% Year 20 $50.94 $51.30 $49.45 $47.85 $40.89 2 of 5 $48.65 $2.29 4.7% Year 21 $50.18 $51.30 $49.45 $50.05 $42.11 2 of 5 $49.75 $0.43 0.9% Year 22 $51.76 $51.30 $49.45 $50.05 $43.36 1 of 5 $49.75 $2.02 4.1% Year 23 $54.26 $51.30 $49.45 $50.05 $44.65 1 of 5 $49.75 $4.51 9.1% Year 24 $54.25 $51.30 $49.45 $50.05 $45.98 1 of 5 $49.75 $4.51 9.1% Year 25 $53.38 $51.30 $49.45 $50.05 $46.61 1 of 5 $49.75 $3.63 7.3% Year 26 $52.51 $51.30 $49.45 $50.05 $46.61 1 of 5 $49.75 $2.76 5.6% Year 27 $53.60 $51.30 $49.45 $50.05 $46.61 1 of 5 $49.75 $3.85 7.7% Year 28 $53.93 $51.30 $49.45 $50.05 $46.61 1 of 5 $49.75 $4.18 8.4% Year 29 $54.26 $51.30 $49.45 $50.05 $46.61 1 of 5 $49.75 $4.51 9.1% Year 30 $54.26 $51.30 $49.45 $50.05 $46.61 1 of 5 $49.75 $4.51 9.1% 25-Year Avg $40.59 $43.13 $40.82 $42.39 $34.49 4 of 5 $41.61 - -2.4% 30-Year Avg $42.78 $44.49 $42.26 $43.67 $36.51 3 of 5 $42.96 - -0.4%

82 | P a g e
Additional Compensation
The section that follows provides detail on additional compensation (i.e., pay premiums, take-home vehicle programs, and career development programs) received by officers in Prince William County and the Northern Virginia comparison group.
Prince William County does not provide on-call pay. Three jurisdictions analyzed – Arlington County, Fairfax County, and Loudoun County – provide on-call pay. Though in practice, Arlington County reports that on-call pay is rarely paid. Instead, officers are usually recalled to work, when needed, and paid call back pay.
On-Call Pay Comparisons
On-Call Pay
Prince William County None
Alexandria None
Arlington County 1 hour (if scheduled to work); 2 hours (if
scheduled day off). Employee may choose pay or leave
Fairfax County 1 hour (if scheduled to work); 2 hours (if
scheduled day off). Employee may choose pay or leave
Loudoun County $3.97 per hour
Prince William County provides a 5% pay premium for Spanish at time of hire or $1,752.04 per year for employees who are proficient in Spanish, but did not receive the 5% differential at hire. Arlington, Fairfax, and Loudoun Counties also offer second language pay premiums.
Language Pay Comparisons
Language Pay
Prince William County 5% of base at time of hire or $1,752.04/year (Spanish only)
Alexandria -
Arlington County $0.68/hr; $1,414/yr (Spanish only)
Fairfax County One step at time of hire + $1,300/yr for certification in a second language
Loudoun County 5% of base pay (Spanish only)

83 | P a g e
Prince William County police personnel may receive between 1.5% and 6.0% at time of hire for educational attainment. Police personnel who earn additional higher education degrees after employment with Department but not at the pay range maximum, will receive up to a 6.0% (1.5% associates, 3.0% bachelors, 4.5% masters, and 6.0% doctorate) increase in base pay.
Education Incentive Pay
Education Incentive Pay
Prince William County Between 1.5% (Associate’s Degree) and 6.0% (Doctorate)
Alexandria -
Arlington County -
Fairfax County New hires may receive a step increase at time of hire based on educational attainment
Loudoun County Between 5.0% (Associate’s Degree) and 15.0% (Doctorate)
Prince William County Police Department field training officers (FTO) receive one hour of overtime per day they serve in an FTO capacity.
Field Training Officer Pay
Field Training Officer Pay
Prince William County 1 hour of Overtime per day as FTO
Alexandria 5% of base pay
Arlington County $1.34/hour
Fairfax County $3.00/hour
Loudoun County $2.00/hour
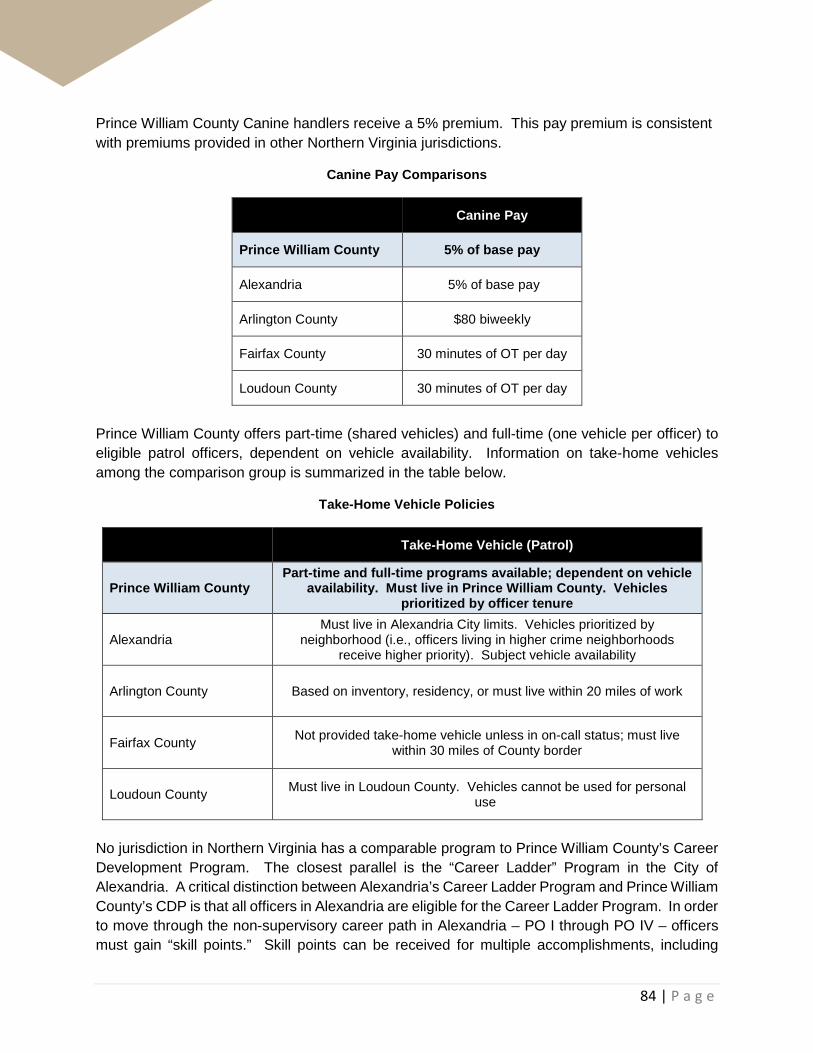
84 | P a g e
Prince William County Canine handlers receive a 5% premium. This pay premium is consistent with premiums provided in other Northern Virginia jurisdictions.
Canine Pay Comparisons
Canine Pay
Prince William County 5% of base pay
Alexandria 5% of base pay
Arlington County $80 biweekly
Fairfax County 30 minutes of OT per day
Loudoun County 30 minutes of OT per day
Prince William County offers part-time (shared vehicles) and full-time (one vehicle per officer) to eligible patrol officers, dependent on vehicle availability. Information on take-home vehicles among the comparison group is summarized in the table below.
Take-Home Vehicle Policies
Take-Home Vehicle (Patrol)
Prince William County Part-time and full-time programs available; dependent on vehicle
availability. Must live in Prince William County. Vehicles prioritized by officer tenure
Alexandria Must live in Alexandria City limits. Vehicles prioritized by
neighborhood (i.e., officers living in higher crime neighborhoods receive higher priority). Subject vehicle availability
Arlington County Based on inventory, residency, or must live within 20 miles of work
Fairfax County Not provided take-home vehicle unless in on-call status; must live within 30 miles of County border
Loudoun County Must live in Loudoun County. Vehicles cannot be used for personal use
No jurisdiction in Northern Virginia has a comparable program to Prince William County’s Career Development Program. The closest parallel is the “Career Ladder” Program in the City of Alexandria. A critical distinction between Alexandria’s Career Ladder Program and Prince William County’s CDP is that all officers in Alexandria are eligible for the Career Ladder Program. In order to move through the non-supervisory career path in Alexandria – PO I through PO IV – officers must gain “skill points.” Skill points can be received for multiple accomplishments, including

85 | P a g e
education, specialty assignment, and becoming certified in a second language. Accordingly, the Career Ladder Program is layered into the pay progression – it is not a separate pathway available to only a portion of the police force.
Career Development Programs
Career Development Program
Prince William County Career Development Program
Alexandria Career Ladder
Arlington County -
Fairfax County -
Loudoun County -

86 | P a g e
Hiring Practices at Entry
Hiring practices at entry vary considerably across the comparison group. At entry base pay, the City of Alexandria and Arlington County do not take education, language, and prior law enforcement experience outside of Northern Virginia into consideration. Law enforcement certification by the Virginia Department of Criminal Justice Services, however, is a factor that is taken into consideration during the lateral hire process.
Fairfax and Loudoun Counties, however, will adjust an officer/deputy sheriff’s entry rate to account for a combination of education, language, and prior work experience. Alexandria, Arlington County, and Fairfax County each have well-defined pay progressions. Consequently, any differences in base pay among officers with the same tenure is equalized when officers reach the maximum of the pay schedule/range.
Additional detail on the hiring practices of police officers is provided below:
• The City of Alexandria does not provide increase in base pay at hire for educational attainment or prior law enforcement experience outside of Northern Virginia. Lateral hires that are certified by the Virginia Department of Criminal Justice Services may be eligible for additional adjustment to base pay, usually approximately 10%.
• In Arlington County, the standard practice is for all new hires to start at the pay range minimum. However, in rare instances, a lateral hire may enter at a higher rate. In these instances, the starting rate is at the Chief’s discretion, in concurrence with the County Human Resources Department.
• In Fairfax County, lateral hires may receive additional pay steps as entry based on education, language skills, and prior law enforcement experience. Pay levels between lateral hires and hires who join the Department at the pay scale minimum are equalized after 10 years of service, assuming that annual pay-for-performance increases are authorized by the Board of County Supervisors.
• In Loudoun County, deputy sheriffs – who perform patrol and criminal investigation law enforcement services – receive adjustments to base pay at hire according to education, law enforcement/military experience, and language proficiency (Spanish) up to the pay range midpoint. Deputies receive 5% for every two years of law enforcement experience (regardless if in Virginia or out of state); 5% for an Associate’s degree, 10% for a Bachelor’s degree, and 15% for a Master’s degree or higher, and 5% for Spanish language proficiency. These recruitment incentives, however, are not always cumulative. The final dollar amount provided will be compared to base salary of deputies currently on the payroll, and adjusted to be consistent with pay levels for deputies with similar qualifications and work experience.
87 | P a g e
Rank Structure & Supervisory Pay Comparisons
Focus group meetings and surveys from current and separated employees highlight three areas of focus regarding rank structure and supervisory pay:
• Non-Supervisory Career Path • Insufficient pay differentials between ranks • Overtime rank differentials
Each of these issues, in part, can contribute to the pay compression seen in the police department pay plan.
Non-Supervisory Career Path
Approximately 78% of the Prince William County Police Department is comprised of non-supervisory police officers (PO I and PO II).12 Many police departments create a clear career path for officers to grow in both pay and duties without assuming a supervisory role. Maintaining such a career path allows for officers to grow in both pay and duties, as well as, encourages officers to stay with a department through the duration of a career.
While officers have the opportunity to earn the designation of “Master Police Officer” (MPO) through the Department’s Career Development Program (CDP), there is no formal classification for a competitive non-supervisory lead police officer in Prince William County. Prince William County MPO have the same job duties and responsibilities as PO II’s.
As detailed in the table on the following page, among the Northern Virginia comparison group, three jurisdictions (Arlington County, Fairfax County, and Loudoun County) have a separate competitive, non-supervisory lead police officer classifications within their compensation plan. Additionally, in Alexandria, the Police Officer IV position – though not a competitive placement – requires participation in the Department’s Career Ladder Program, and calls for “considerable latitude for independent judgement” and advanced and specialized work on assignments.13
12 As of 12/31/2016 departmental payroll run. 13 City of Alexandria, Police Officer IV Class Specification.

88 | P a g e
Law Enforcement Non-Supervisory Career Path
Non-Competitive, Non-Supervisory Ranks
Competitive, Non-Supervisory Rank
Prince William County Police Officer I
Police Officer II Completion of Field Training (approx. 1 year following academy graduation)
- - Master Police Officer (participation in CDP; no change in duties)
Alexandria City Police Officer I Police Officer II 2 YOS as Police Officer I
Police Officer III 3 YOS as Police Officer II
Police Officer IV 4 YOS as Police Officer III
-
Arlington County Police Officer I Police Officer II 1 YOS as Police Officer I - -
Corporal/Master Police Officer 3 YOS & competitive process
Fairfax County Police Officer I Police Officer II 2 YOS as Police Officer I - -
Master Police Officer 5 YOS as PO II & competitive process
Loudoun County Recruit Deputy Sheriff 1 YOS as Recruit
Deputy First Class 2 YOS as Deputy Sheriff
- Master Deputy 12 YOS & competitive process
Supervisory Pay Comparisons
The table that follows shows base compensation + longevity (including retention bonus) for three levels of supervisory ranks. In Prince William County, first-line supervisor responsibilities are handled by Sergeants and First-Sergeants – an arrangement that is not uncommon to the Northern Virginia comparisons group. Fairfax County and Loudoun County have similar organizational structures.
At maximum base pay + longevity, Prince William County ranks above the median for all three levels of supervision.
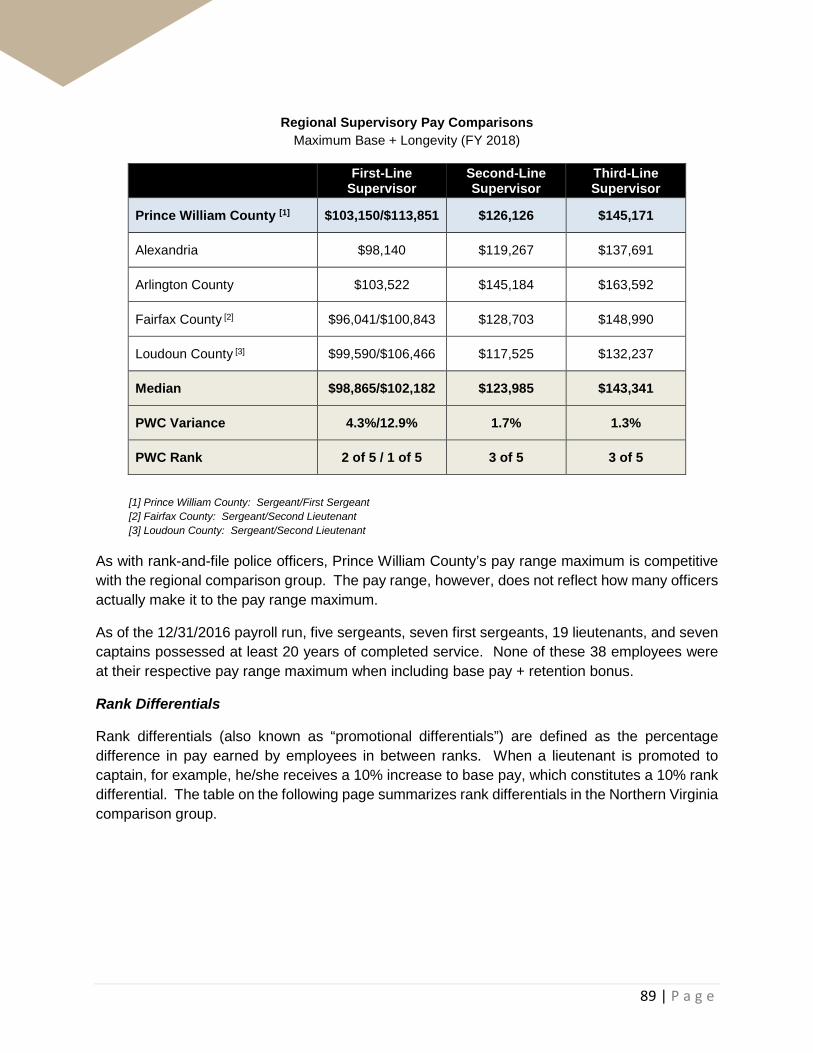
89 | P a g e
Regional Supervisory Pay Comparisons Maximum Base + Longevity (FY 2018)
First-Line Supervisor
Second-Line Supervisor
Third-Line Supervisor
Prince William County [1] $103,150/$113,851 $126,126 $145,171
Alexandria $98,140 $119,267 $137,691
Arlington County $103,522 $145,184 $163,592
Fairfax County [2] $96,041/$100,843 $128,703 $148,990
Loudoun County [3] $99,590/$106,466 $117,525 $132,237
Median $98,865/$102,182 $123,985 $143,341
PWC Variance 4.3%/12.9% 1.7% 1.3%
PWC Rank 2 of 5 / 1 of 5 3 of 5 3 of 5
[1] Prince William County: Sergeant/First Sergeant [2] Fairfax County: Sergeant/Second Lieutenant [3] Loudoun County: Sergeant/Second Lieutenant
As with rank-and-file police officers, Prince William County’s pay range maximum is competitive with the regional comparison group. The pay range, however, does not reflect how many officers actually make it to the pay range maximum.
As of the 12/31/2016 payroll run, five sergeants, seven first sergeants, 19 lieutenants, and seven captains possessed at least 20 years of completed service. None of these 38 employees were at their respective pay range maximum when including base pay + retention bonus.
Rank Differentials
Rank differentials (also known as “promotional differentials”) are defined as the percentage difference in pay earned by employees in between ranks. When a lieutenant is promoted to captain, for example, he/she receives a 10% increase to base pay, which constitutes a 10% rank differential. The table on the following page summarizes rank differentials in the Northern Virginia comparison group.

90 | P a g e
Police Rank Differentials
First-Line Supervisor Second-Line Supervisor Third-Line Supervisor
Prince William County
Sergeant: 5.0% over PO II 1st Sergeant: 5.0% over
Sergeant
Lieutenant: 5.0% over 1st Sergeant
Captain: 10.0% over Lieutenant
Alexandria Sergeant: 5.0% over PO IV Lieutenant: 21.5% over Sergeant
Captain: 15.4% over Lieutenant
Arlington County Sergeant: 10.0% over
Corporal; 15% over PO II
Lieutenant: 10% over Sergeant
Captain: 10% over Lieutenant
Fairfax County
Sergeant: 10.7% over PO II; 5.0% over MPO
2nd Lieutenant: 5.0% over Sergeant
1st Lieutenant: 27.6% over 2nd
Lieutenant
Captain: 15.8% over 1st Lieutenant
Loudoun County
Sergeant: 10% over Deputy First Class;
5.0% over Master Deputy 2nd Lieutenant: 5.0% over
Sergeant
1st Lieutenant: 5.0% over 2nd Lieutenant
Captain: 5.0% over 1st Lieutenant
Overtime Differentials
In the focus group meetings, police lieutenants and captains articulated concerns regarding compensation for hours worked in excess of a regularly scheduled work week. From an internal comparability perspective, police lieutenants are eligible for straight time for excess hours worked, however, they noted that second-line supervisors in the fire department – fire captains – are eligible for 1.5x pay or leave for excess hours worked. Police captains receive no additional compensation (cash or leave) for excess hours worked, which is consistent with fire/rescue personnel.
From an external comparability perspective, for second-line supervisors (i.e., police lieutenants), Alexandria City, Fairfax County and Loudoun County provide 1.5x pay for at least some hours worked in excess of a regular workweek.
For third-line supervisors (i.e., police captains), all jurisdictions – with the exception of Loudoun County – provide straight time for hours worked in excess of a regular workweek. Prince William County police captains do not receive additional compensation for excess hours worked.

91 | P a g e
Police Overtime Differentials
Non-Competitive Rank & File
Competitive, Non-Supervisory
First-Line Supervisor
Second-Line Supervisor
Third-Line Supervisor
Prince William County
Police Officer I-II
OT: 1.5x pay or comp time
-
Sergeant and 1st Sergeant
OT: 1.5x pay or
comp time
Lieutenant
OT: 1.0x pay or comp time
Captain
OT: N/A
Alexandria City
Police Officer I-IV
OT: 1.5x pay or comp time
-
Sergeant
OT: 1.5x pay or comp time
Lieutenant
OT: 1.0x pay or comp time for shift extension; 1.5x pay or comp time
for special details
Captain
OT: 1.0x pay
Arlington County Police Officer I-II
OT: 1.5x pay
Police Corporal
OT: 1.5x pay
Sergeant
OT: 1.5x pay
Lieutenant
OT: 1.0x pay or comp time
Captain
OT: 1.0x pay or comp time
Fairfax County
Police Officer I-II
OT: 1.5x pay or comp time
Master Police Officer
OT: 1.5x pay or comp time
Sergeant and Second Lieutenant
OT: 1.5x pay or
comp time
Lieutenant
OT: 1.0x pay or comp time for admin; 1.5x pay or comp time for
police work
Captain
OT: 1.0x pay or comp time
Loudoun County
Recruit, Deputy Sheriff, Deputy First
Class
OT: 1.5x pay or comp time
Master Deputy
OT: 1.5x pay or comp time
Sergeant and Second Lieutenant
OT: 1.5x pay or
comp time
First Lieutenant
OT: 1.5x pay or comp time
Captain
OT: No addition pay; 3 extra personal days
per year

92 | P a g e
Retention of Police Personnel This section focuses on two principal types of employee separations – voluntary resignations and service retirements. Voluntary resignations – or “quits” – refer to individuals who resign from the Department before becoming eligible for an unreduced pension benefit. Service retirements refer to individuals who separate from the Department after becoming eligible for an unreduced pension benefit, and leave the Department to start a second career, or leave the workforce all together.
Additionally, retention is evaluated through the lens of two metrics:
• Turnover Rate: percentage of employees who leave the Department for all reasons (e.g., quits, service retirements, medical retirements, terminations, resignations in lieu of termination, voluntary demotions, and death)
• Quit Rate: percentage of employees who voluntarily resign, or quit, from the Department
Quits vs. Retirements
Departments may face different retention challenges – and require differing solutions – depending on the structural forces driving attrition trends. The table on the following page details all sworn Police Department personnel by year of service as of 12/31/2016. The Prince William County Police Department is a relatively “younger” Department – i.e., nearly three-quarters (73.9%) of rank-and-file police officers (PO I and PO II) have fewer than 10 years of service with the Department. As such, a smaller proportion of officers are approaching normal service retirement age.
The Virginia Retirement System provides a normal service retirement at 25 years of service, and as illustrated in the table on the following page, only 11.1% (53 of 476) of rank-and-file police officers (PO I and PO II) are within 10 years of normal service retirement. While many public sector agencies – and some public safety agencies – are facing a “retirement bubble” where a large percentage of the workforce is either eligible or soon-to-be eligible for retirement, this is not the case with the Prince William County Police Department.

93 | P a g e
Employee Distribution by Year of Service – Prince William County Police Department (Effective 12/31/2016)
Years Served Year
POLICE OFFICER
I
POLICE OFFICER
II POLICE
SERGEANT POLICE FIRST
SERGEANT POLICE
LIEUTENANT POLICE
CAPTAIN POLICE MAJOR
Headcount by YOS
Headcount as a % of
Total 0 1 72 1 - - - - - 73 11.99% 1 2 14 33 - - - - - 47 7.72% 2 3 1 40 - - - - - 41 6.73% 3 4 - 19 - - - - - 19 3.12% 4 5 - 27 - - - - - 27 4.43% 5 6 - 26 - - - - - 26 4.27% 6 7 1 25 1 - - - - 27 4.43% 7 8 - 8 2 - - - - 10 1.64% 8 9 - 18 6 1 - - - 25 4.11% 9 10 - 27 3 - - - - 30 4.93% 10 11 - 40 5 1 - - - 46 7.55% 11 12 - 19 5 - - - - 24 3.94% 12 13 - 19 6 4 - - - 29 4.76% 13 14 - 16 5 3 - - - 24 3.94% 14 15 - 12 7 2 3 - - 24 3.94% 15 16 - 16 6 2 1 - - 25 4.11% 16 17 - 6 3 3 1 - - 13 2.13% 17 18 - 9 5 3 5 - - 22 3.61% 18 19 - 7 2 3 - 1 - 13 2.13% 19 20 - 2 1 2 2 - - 7 1.15% 20 21 - 6 1 1 3 1 1 13 2.13% 21 22 - 3 1 1 5 1 - 11 1.81% 22 23 - 3 2 - 2 - - 7 1.15% 23 24 - 1 - 1 1 - - 3 0.49% 24 25 - - - - - - - - 0.00% 25 26 - 1 - - 1 - 1 3 0.49% 26 27 - 2 1 1 1 - - 5 0.82% 27 28 - - - - 2 1 1 4 0.66% 28 29 - 1 - - - - - 1 0.16%
29+ 30+ - 2 - 2 2 4 - 10 1.64%
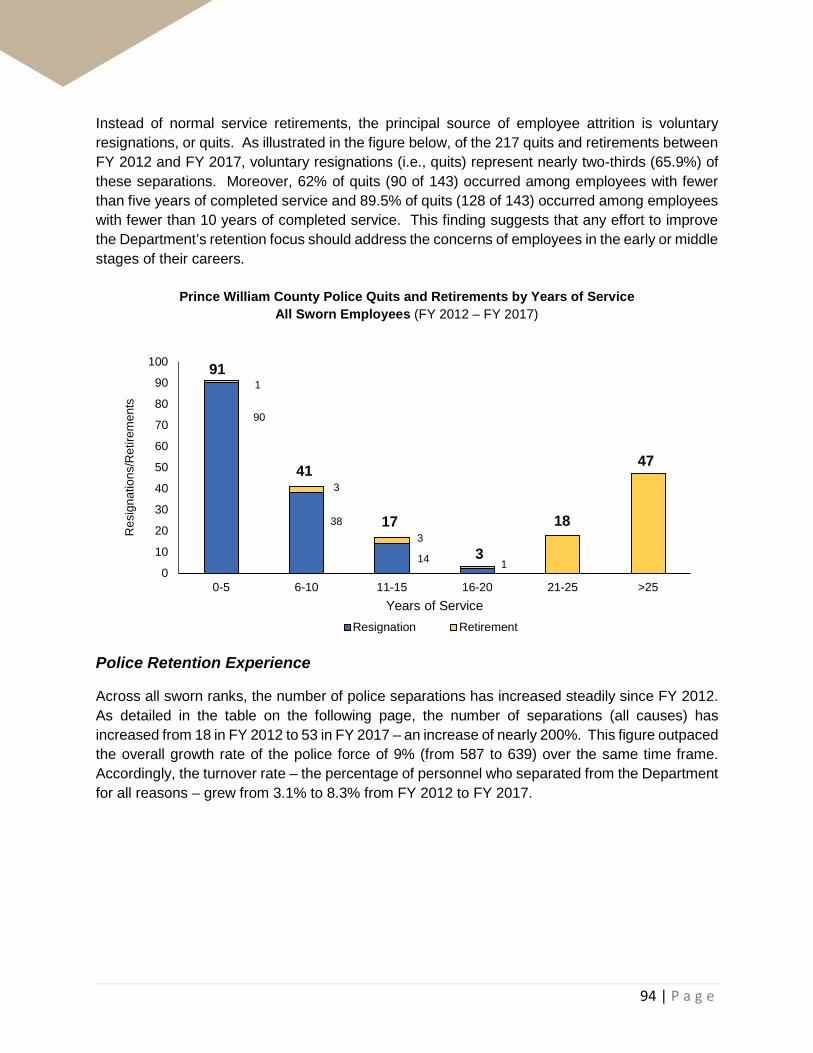
94 | P a g e
Instead of normal service retirements, the principal source of employee attrition is voluntary resignations, or quits. As illustrated in the figure below, of the 217 quits and retirements between FY 2012 and FY 2017, voluntary resignations (i.e., quits) represent nearly two-thirds (65.9%) of these separations. Moreover, 62% of quits (90 of 143) occurred among employees with fewer than five years of completed service and 89.5% of quits (128 of 143) occurred among employees with fewer than 10 years of completed service. This finding suggests that any effort to improve the Department’s retention focus should address the concerns of employees in the early or middle stages of their careers.
Prince William County Police Quits and Retirements by Years of Service All Sworn Employees (FY 2012 – FY 2017)
Police Retention Experience
Across all sworn ranks, the number of police separations has increased steadily since FY 2012. As detailed in the table on the following page, the number of separations (all causes) has increased from 18 in FY 2012 to 53 in FY 2017 – an increase of nearly 200%. This figure outpaced the overall growth rate of the police force of 9% (from 587 to 639) over the same time frame. Accordingly, the turnover rate – the percentage of personnel who separated from the Department for all reasons – grew from 3.1% to 8.3% from FY 2012 to FY 2017.
90
38
14
1
3
3
1
91
41
17
3
18
47
0
10
20
30
40
50
60
70
80
90
100
0-5 6-10 11-15 16-20 21-25 >25
Res
igna
tions
/Ret
irem
ents
Years of ServiceResignation Retirement
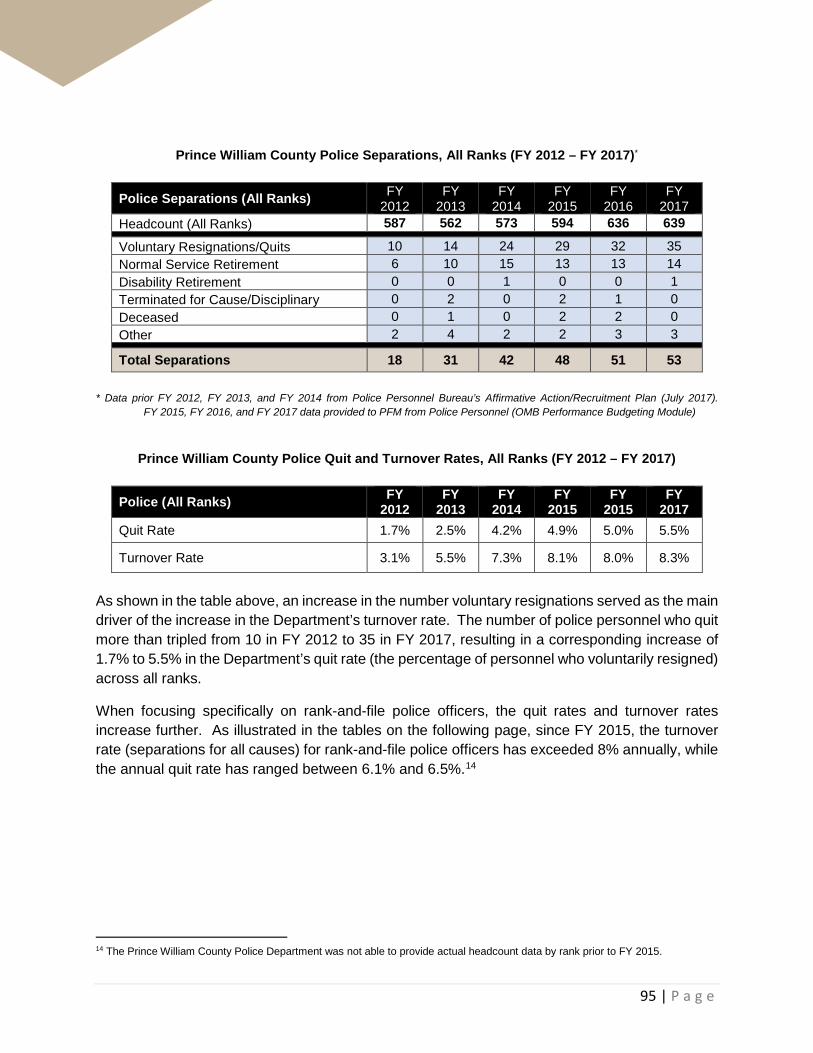
95 | P a g e
Prince William County Police Separations, All Ranks (FY 2012 – FY 2017)*
Police Separations (All Ranks) FY 2012
FY 2013
FY 2014
FY 2015
FY 2016
FY 2017
Headcount (All Ranks) 587 562 573 594 636 639
Voluntary Resignations/Quits 10 14 24 29 32 35 Normal Service Retirement 6 10 15 13 13 14 Disability Retirement 0 0 1 0 0 1 Terminated for Cause/Disciplinary 0 2 0 2 1 0 Deceased 0 1 0 2 2 0 Other 2 4 2 2 3 3
Total Separations 18 31 42 48 51 53 * Data prior FY 2012, FY 2013, and FY 2014 from Police Personnel Bureau’s Affirmative Action/Recruitment Plan (July 2017). FY 2015, FY 2016, and FY 2017 data provided to PFM from Police Personnel (OMB Performance Budgeting Module)
Prince William County Police Quit and Turnover Rates, All Ranks (FY 2012 – FY 2017)
Police (All Ranks) FY 2012
FY 2013
FY 2014
FY 2015
FY 2015
FY 2017
Quit Rate 1.7% 2.5% 4.2% 4.9% 5.0% 5.5%
Turnover Rate 3.1% 5.5% 7.3% 8.1% 8.0% 8.3%
As shown in the table above, an increase in the number voluntary resignations served as the main driver of the increase in the Department’s turnover rate. The number of police personnel who quit more than tripled from 10 in FY 2012 to 35 in FY 2017, resulting in a corresponding increase of 1.7% to 5.5% in the Department’s quit rate (the percentage of personnel who voluntarily resigned) across all ranks.
When focusing specifically on rank-and-file police officers, the quit rates and turnover rates increase further. As illustrated in the tables on the following page, since FY 2015, the turnover rate (separations for all causes) for rank-and-file police officers has exceeded 8% annually, while the annual quit rate has ranged between 6.1% and 6.5%.14
14 The Prince William County Police Department was not able to provide actual headcount data by rank prior to FY 2015.
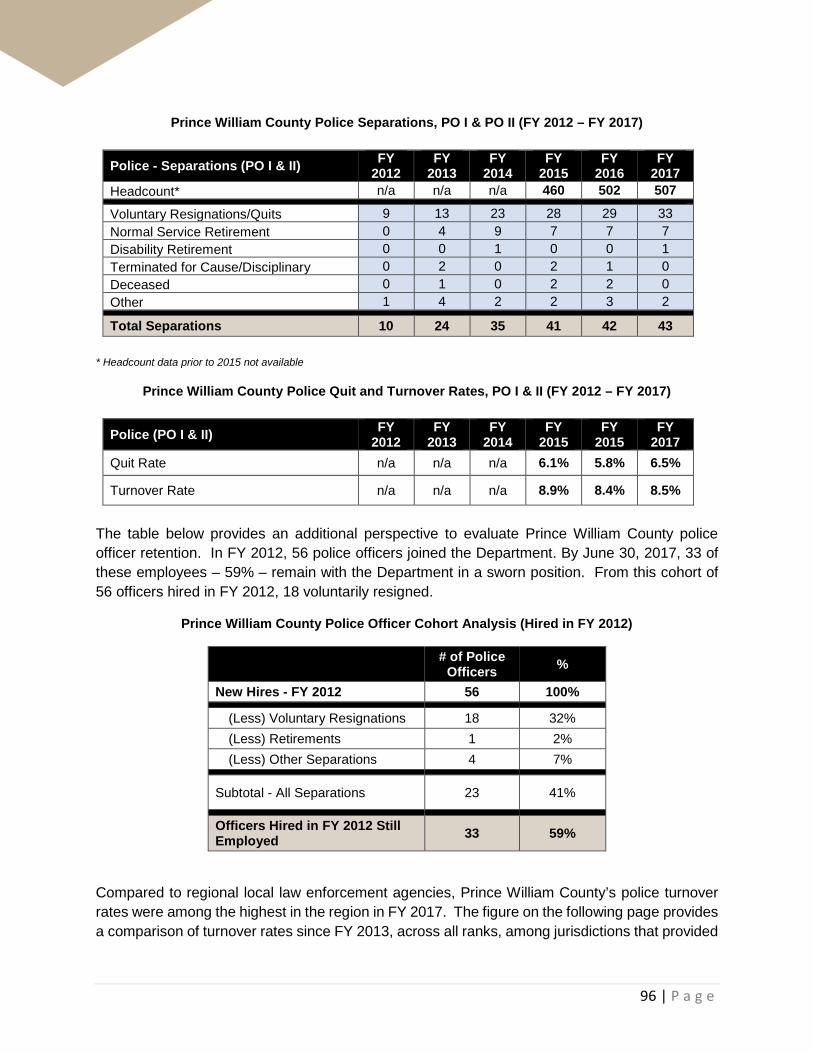
96 | P a g e
Prince William County Police Separations, PO I & PO II (FY 2012 – FY 2017)
Police - Separations (PO I & II) FY 2012
FY 2013
FY 2014
FY 2015
FY 2016
FY 2017
Headcount* n/a n/a n/a 460 502 507
Voluntary Resignations/Quits 9 13 23 28 29 33 Normal Service Retirement 0 4 9 7 7 7 Disability Retirement 0 0 1 0 0 1 Terminated for Cause/Disciplinary 0 2 0 2 1 0 Deceased 0 1 0 2 2 0 Other 1 4 2 2 3 2
Total Separations 10 24 35 41 42 43 * Headcount data prior to 2015 not available
Prince William County Police Quit and Turnover Rates, PO I & II (FY 2012 – FY 2017)
Police (PO I & II) FY 2012
FY 2013
FY 2014
FY 2015
FY 2015
FY 2017
Quit Rate n/a n/a n/a 6.1% 5.8% 6.5%
Turnover Rate n/a n/a n/a 8.9% 8.4% 8.5%
The table below provides an additional perspective to evaluate Prince William County police officer retention. In FY 2012, 56 police officers joined the Department. By June 30, 2017, 33 of these employees – 59% – remain with the Department in a sworn position. From this cohort of 56 officers hired in FY 2012, 18 voluntarily resigned.
Prince William County Police Officer Cohort Analysis (Hired in FY 2012)
# of Police Officers %
New Hires - FY 2012 56 100% (Less) Voluntary Resignations 18 32% (Less) Retirements 1 2% (Less) Other Separations 4 7%
Subtotal - All Separations 23 41%
Officers Hired in FY 2012 Still Employed 33 59%
Compared to regional local law enforcement agencies, Prince William County’s police turnover rates were among the highest in the region in FY 2017. The figure on the following page provides a comparison of turnover rates since FY 2013, across all ranks, among jurisdictions that provided
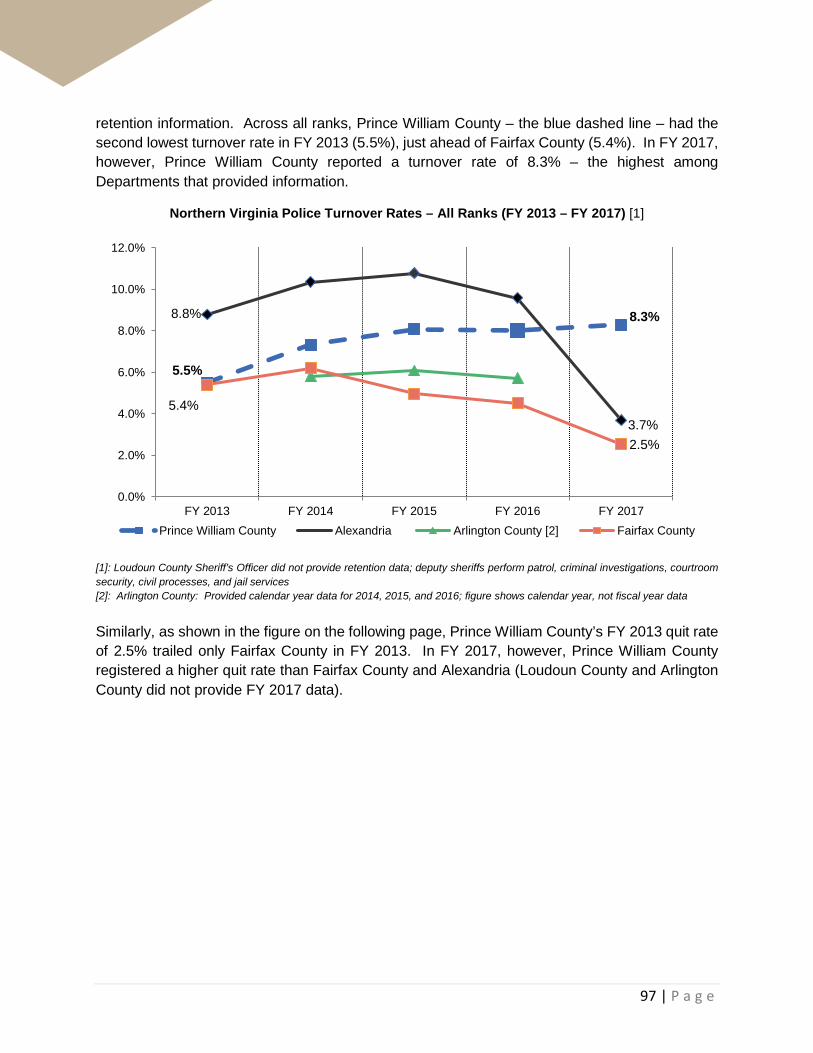
97 | P a g e
retention information. Across all ranks, Prince William County – the blue dashed line – had the second lowest turnover rate in FY 2013 (5.5%), just ahead of Fairfax County (5.4%). In FY 2017, however, Prince William County reported a turnover rate of 8.3% – the highest among Departments that provided information.
Northern Virginia Police Turnover Rates – All Ranks (FY 2013 – FY 2017) [1]
[1]: Loudoun County Sheriff’s Officer did not provide retention data; deputy sheriffs perform patrol, criminal investigations, courtroom security, civil processes, and jail services [2]: Arlington County: Provided calendar year data for 2014, 2015, and 2016; figure shows calendar year, not fiscal year data
Similarly, as shown in the figure on the following page, Prince William County’s FY 2013 quit rate of 2.5% trailed only Fairfax County in FY 2013. In FY 2017, however, Prince William County registered a higher quit rate than Fairfax County and Alexandria (Loudoun County and Arlington County did not provide FY 2017 data).
5.5%
8.3%8.8%
3.7%5.4%
2.5%
0.0%
2.0%
4.0%
6.0%
8.0%
10.0%
12.0%
FY 2013 FY 2014 FY 2015 FY 2016 FY 2017Prince William County Alexandria Arlington County [2] Fairfax County
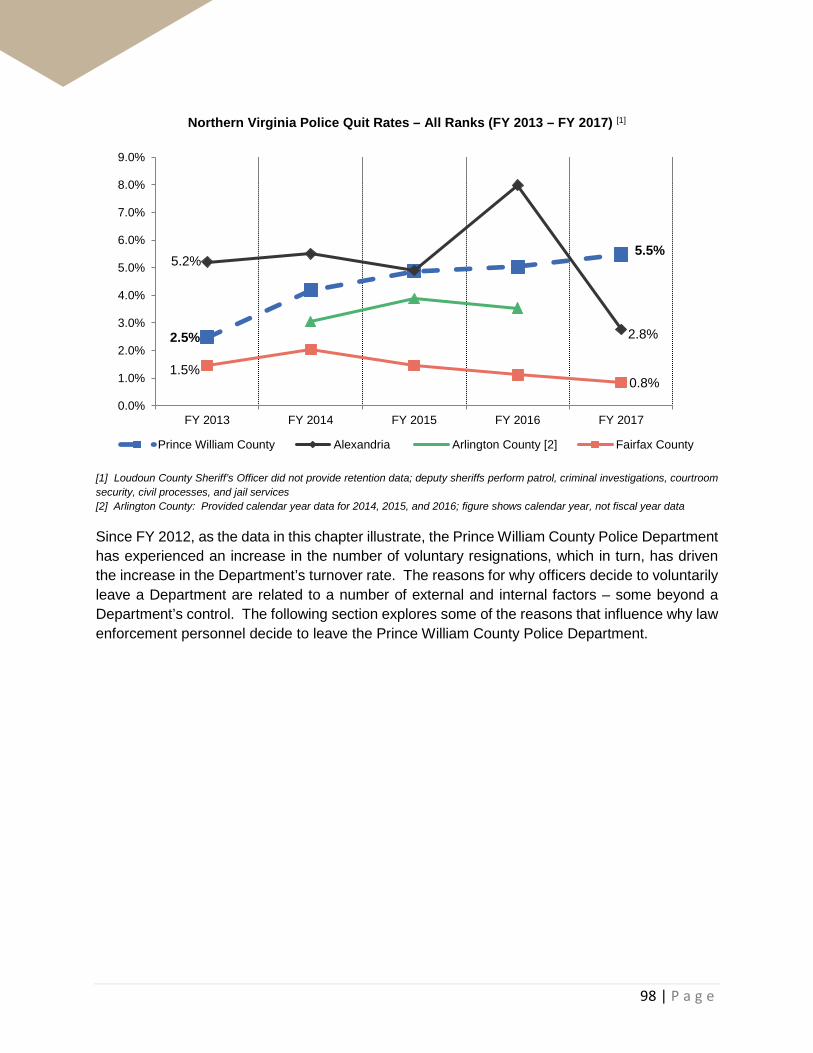
98 | P a g e
Northern Virginia Police Quit Rates – All Ranks (FY 2013 – FY 2017) [1]
[1] Loudoun County Sheriff’s Officer did not provide retention data; deputy sheriffs perform patrol, criminal investigations, courtroom security, civil processes, and jail services [2] Arlington County: Provided calendar year data for 2014, 2015, and 2016; figure shows calendar year, not fiscal year data
Since FY 2012, as the data in this chapter illustrate, the Prince William County Police Department has experienced an increase in the number of voluntary resignations, which in turn, has driven the increase in the Department’s turnover rate. The reasons for why officers decide to voluntarily leave a Department are related to a number of external and internal factors – some beyond a Department’s control. The following section explores some of the reasons that influence why law enforcement personnel decide to leave the Prince William County Police Department.
2.5%
5.5%5.2%
2.8%
1.5%0.8%
0.0%
1.0%
2.0%
3.0%
4.0%
5.0%
6.0%
7.0%
8.0%
9.0%
FY 2013 FY 2014 FY 2015 FY 2016 FY 2017
Prince William County Alexandria Arlington County [2] Fairfax County
99 | P a g e
Drivers of Attrition
Prince William County police officers are leaving the Department for a variety of external and internal factors. External factors provide the opportunity to leave, while internal factors provide the motivation. These factors have the most influence among early and mid-career fire and rescue personnel.
External Factors
There are multiple external drivers that may contribute to an individual officer’s decision to voluntarily resign. In the employee surveys, some current and former employees reported that they had interest in relocating to another part of the Country for family or personal reasons. Others may have other job opportunities – such as the opportunity to work for a family business – that may be outside the control of the Department.
A primary external driver is the economy. As the economy has improved since the Great Recession, outside employment opportunities have increased. This has been the case in other regional law enforcement agencies (including the federal government). Concomitantly, wage growth in many of these agencies has exceeded that of Prince William County, creating both an opportunity and financial benefit for sworn Prince William County police personnel to move to a different law enforcement agency.
While the principal comparison group for analysis across all employee groups within this report is the largest local government employers in Northern Virginia, additional employers – primarily the federal government and the Prince William County Sheriff’s Office – represent additional competitors for Prince William County police officers as well.
At the time of hire, nearly 64% of current employees reported considering jobs with other regional police departments, and more than 44% of current employees reported that they considered federal employment. As illustrated in the table on the following page, similar proportions of police recruits reported considering regional local governments (65.2%) and federal law enforcement (41.3%) as well.

100 | P a g e
Active Employee and Police Recruit Survey Question – “Did you consider other jobs before choosing Prince William County Police Department? Check all that apply.”
Respondents could select more than one option; totals will not equal 100%
Active Employee Survey (N=360)
Recruit Survey (N=46)
% Count % Count
Regional local police departments (e.g. Arlington County, Fairfax County, City of Manassas, etc.)
63.9% 230 65.2% 30
Federal law enforcement 44.2% 159 41.3% 19
Local police departments in other parts of the Country 26.7% 96 19.6% 9
State law enforcement 23.3% 84 21.7% 10
Non-law enforcement career 17.8% 64 6.5% 3
Only considered the Prince William County Police Department 15.0% 54 13.0% 6
Other Sheriff's Office 6.1% 22 8.7% 4
Prince William County Sheriff's Office 3.1% 11 4.4% 2
Among the respondents in the police recruit survey who responded that they were considering regional local police departments, 87.7% reported that they considered Fairfax County. The District of Columbia (Metro PD) ranked second, with 26.7%. Findings are detailed in the table on the following page.

101 | P a g e
Police Recruit Survey Question – “If ‘Regional Local Police Departments’ was selected, which other departments did you consider joining?”
(N = 30); Respondents could select more than one option; totals will not equal 100%
% Count
Fairfax County 86.7% 26
District of Columbia (Metro) 26.7% 8
Arlington County 23.3% 7
Loudoun County 23.3% 7 Regional municipal police departments (e.g., City of Manassas, Fairfax City, etc.) 16.7% 5
Other 13.3% 4
Alexandria 10.0% 3 According to available data collected by the Department, the competing employers who attract the largest number of separated Prince William County police officers are the federal government and the Prince William County Sheriff’s Office.
PFM analyzed self-reported exit survey data collected by the Prince William County Police Department’s Personnel Bureau. As detailed in the table on the following page, among the 137 employees who voluntarily resigned between June 2011 and January 2017, 57 employees provided some information on their new employer.15 Among these 57 employees, 23 (40.4%) reported leaving Prince William County to work for a law enforcement capacity for the federal government.
Fifteen employees (26.3%) reported leaving the Prince William County Police Department for the Prince William County Sheriff’s Office. The remainder reported leaving Prince William County for other regional local law enforcement positions (15.8%), out-of-state local law enforcement agencies (8.8%), regional fire departments (5.3%), the Virginia State Patrol (1.8%) and “other” (1.8%).
15 Of note, 64 employees reported leaving for personal reasons, a “career change,” or did not disclose their reason for resigning. Additionally, 16 employees cited relocation as the principal reason for resigning. No additional information on the new employer for these 80 employees was reported.

102 | P a g e
Police Officer Resignation Analysis (Prince William County Police Department Exit Surveys)
New Employer # %
Federal Government 23 40.4%
Prince William County Sheriff’s Office 15 26.3%
Local Law Enforcement (Regional) 9 15.8%
Local Law Enforcement (Out-of-State) 5 8.8%
Fire Department (Regional) 3 5.3%
Virginia State Police 1 1.8%
Other 1 1.8%
Total 57 100.0%
Federal Government
The presence of federal law enforcement employers in the Washington, DC region is a retention challenge faced by all local governments. The greater Washington, DC region – and Northern Virginia in particular – is home to multiple federal law enforcement agencies.
Federal agencies frequently seek officers with prior local law enforcement experience, and many agencies have compensation plans that credit prior law enforcement experience when determining starting pay. Further, multiple federal agencies have fixed pay scales, which allow new officers to project their future earnings schedule.
Within the separated employee survey, 50 respondents – including those who retired with a service pension – provided information on their current employer. Ten respondents (20%) reported that they currently work for the federal government. Agencies where former Prince William County police officers/supervisors who responded to the separated employee survey currently work include: Bureau of Alcohol, Tobacco, Firearms, and Explosives (ATF), Federal Bureau of Investigations (FBI), Department of Defense, Department of Justice (not FBI), and Department of State.
Within the active employee survey, 24.9% of police officers (i.e., excluding supervisors) reported applying for a law enforcement position in the prior 12 months. Of the 51 police officers who provided additional commentary on this topic, 27 explicitly mentioned federal employment. In the comments section of the survey, many of these employees noted that they applied for federal law enforcement positions, including the FBI, Drug Enforcement Agency (DEA), ATF, and U.S. Marshal’s Office.
Special agents in each of these organizations receive locality pay – which varies according to geographical area – as well as Law Enforcement Availability Pay (LEAP) totaling 25% of base +
103 | P a g e
locality pay.16 As summarized below, the starting pay levels at each of these agencies exceed the starting pay levels in Prince William County (all data effective January 1, 2017):
• FBI (special agent): An FBI special agent assigned to the Northern Virginia/DC region and no prior government service will receive $62,556 (GL-10) + 25% LEAP for a total of $78,195. New hires with prior government service may be eligible to receive additional pay that is commensurate with one’s highest previous pay
• DEA and ATF (special agent): Special agents assigned to the Northern Virginia/DC region will receive between $55,939 (GL-5, Step 1) and $91,625 (GL-9, Step 10) at entry, including locality pay and LEAP
• U.S Marshall (Deputy U.S. Marshall): $63,669 at entry (GL-7), including locality pay and LEAP
Additionally, multiple survey respondents reported that they applied to federal law enforcement agencies with positions that are not eligible for LEAP. Specific agencies referenced in the comments section of the survey included – the Capitol Police, U.S. Customs and Border Protection, and Secret Service. The starting pay level at each of these agencies is detailed below (all data effective January 1, 2017 and include locality pay for the Northern Virginia/DC region):
• Capitol Police (police officer): $59,256 at entry (private), $61,333 following graduation (private with training), and $68,711 after 30 months of service (private first class)
• U.S. Customs and Border Protection (border patrol agent): Two years of local law enforcement would qualify for entry as the GL-9 level with a minimum of $56,805, increasing to $66,510 after 1 year of service (GL-11), and $79,720 after 2 years of service (GL-12)
• Secret Service (uniform division, officer): $59,068 at entry; $69,703 after three years of service
Federal law enforcement opportunities represent a retention challenge not only for Prince William County, but for all local law enforcement agencies in the region. As illustrated above, most of these employers have starting salaries higher than the Northern Virginia local law enforcement agencies in the comparison group – not just Prince William County.
Additionally, a federal law enforcement career may have some drawbacks from the perspective of local police officers. Federal agencies often require relocation as a condition of employment, and special agents may be subject to transfer throughout their careers, based upon the needs of the respective agency. Further, the scope of work may be materially different – e.g., border
16 If transferred to another region of the Country, the special agent may experience an increase or decrease in locality pay, depending on the locality pay rates of the region to which he/she is transferred.
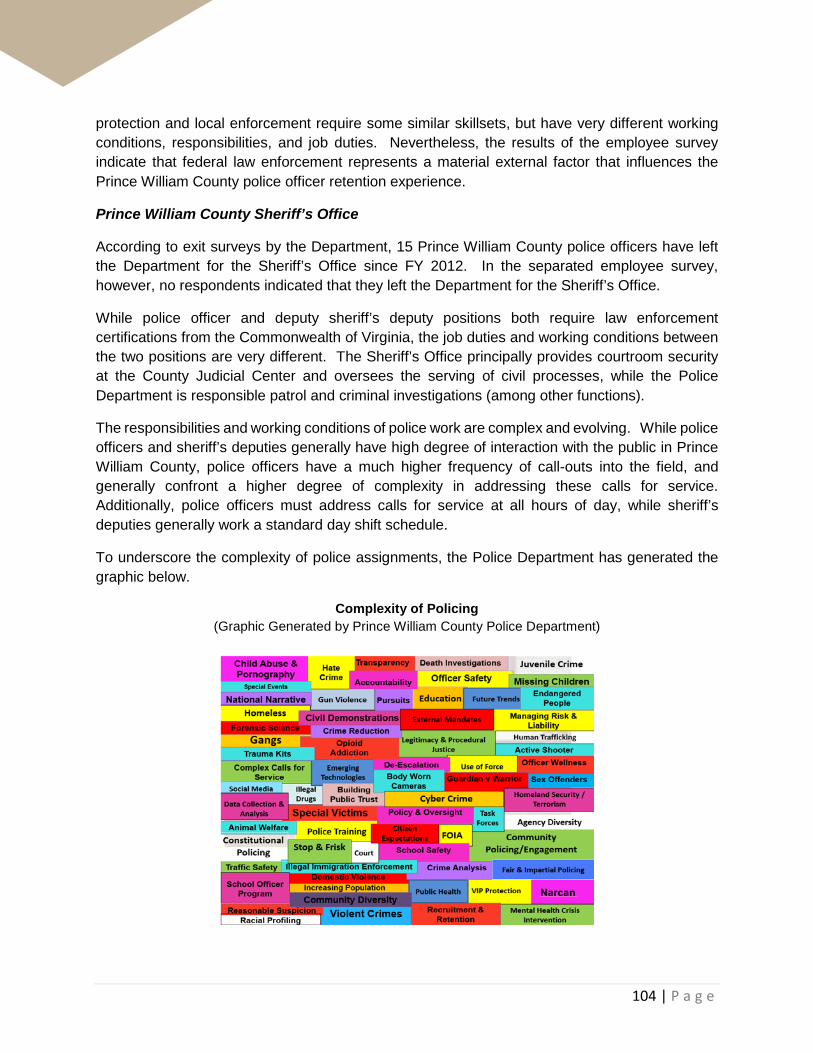
104 | P a g e
protection and local enforcement require some similar skillsets, but have very different working conditions, responsibilities, and job duties. Nevertheless, the results of the employee survey indicate that federal law enforcement represents a material external factor that influences the Prince William County police officer retention experience.
Prince William County Sheriff’s Office
According to exit surveys by the Department, 15 Prince William County police officers have left the Department for the Sheriff’s Office since FY 2012. In the separated employee survey, however, no respondents indicated that they left the Department for the Sheriff’s Office.
While police officer and deputy sheriff’s deputy positions both require law enforcement certifications from the Commonwealth of Virginia, the job duties and working conditions between the two positions are very different. The Sheriff’s Office principally provides courtroom security at the County Judicial Center and oversees the serving of civil processes, while the Police Department is responsible patrol and criminal investigations (among other functions).
The responsibilities and working conditions of police work are complex and evolving. While police officers and sheriff’s deputies generally have high degree of interaction with the public in Prince William County, police officers have a much higher frequency of call-outs into the field, and generally confront a higher degree of complexity in addressing these calls for service. Additionally, police officers must address calls for service at all hours of day, while sheriff’s deputies generally work a standard day shift schedule.
To underscore the complexity of police assignments, the Police Department has generated the graphic below.
Complexity of Policing (Graphic Generated by Prince William County Police Department)
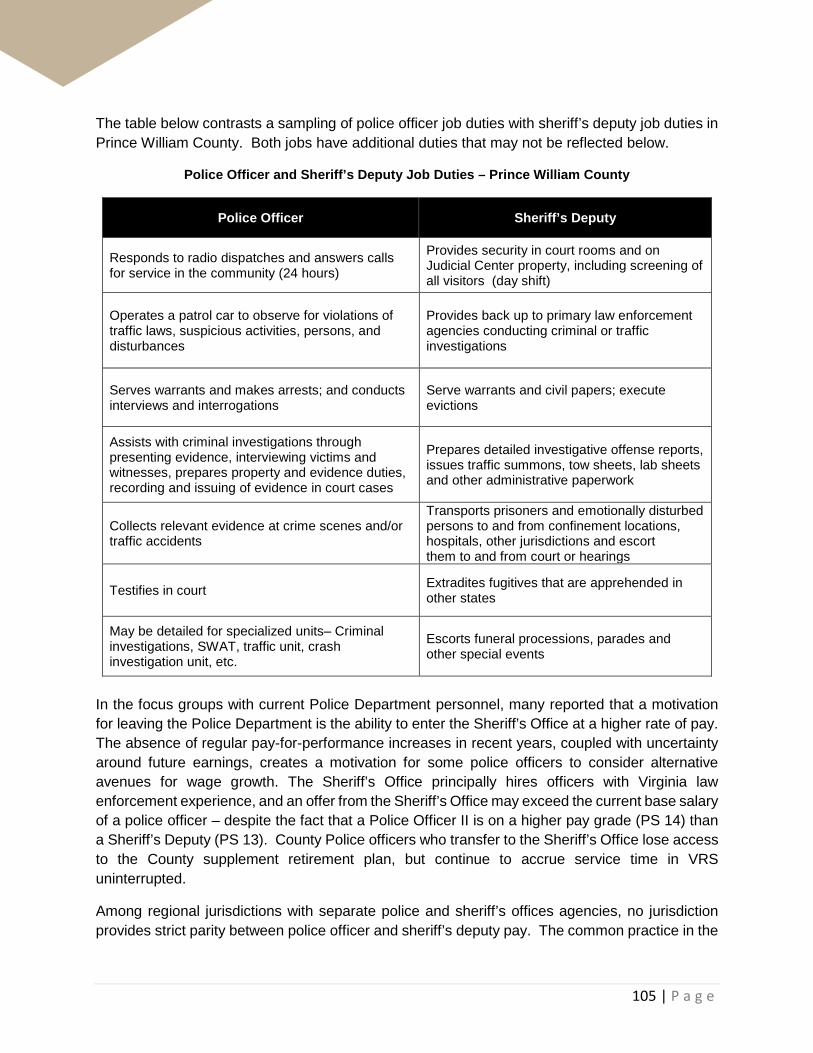
105 | P a g e
The table below contrasts a sampling of police officer job duties with sheriff’s deputy job duties in Prince William County. Both jobs have additional duties that may not be reflected below.
Police Officer and Sheriff’s Deputy Job Duties – Prince William County
Police Officer Sheriff’s Deputy
Responds to radio dispatches and answers calls for service in the community (24 hours)
Provides security in court rooms and on Judicial Center property, including screening of all visitors (day shift)
Operates a patrol car to observe for violations of traffic laws, suspicious activities, persons, and disturbances
Provides back up to primary law enforcement agencies conducting criminal or traffic investigations
Serves warrants and makes arrests; and conducts interviews and interrogations
Serve warrants and civil papers; execute evictions
Assists with criminal investigations through presenting evidence, interviewing victims and witnesses, prepares property and evidence duties, recording and issuing of evidence in court cases
Prepares detailed investigative offense reports, issues traffic summons, tow sheets, lab sheets and other administrative paperwork
Collects relevant evidence at crime scenes and/or traffic accidents
Transports prisoners and emotionally disturbed persons to and from confinement locations, hospitals, other jurisdictions and escort them to and from court or hearings
Testifies in court Extradites fugitives that are apprehended in other states
May be detailed for specialized units– Criminal investigations, SWAT, traffic unit, crash investigation unit, etc.
Escorts funeral processions, parades and other special events
In the focus groups with current Police Department personnel, many reported that a motivation for leaving the Police Department is the ability to enter the Sheriff’s Office at a higher rate of pay. The absence of regular pay-for-performance increases in recent years, coupled with uncertainty around future earnings, creates a motivation for some police officers to consider alternative avenues for wage growth. The Sheriff’s Office principally hires officers with Virginia law enforcement experience, and an offer from the Sheriff’s Office may exceed the current base salary of a police officer – despite the fact that a Police Officer II is on a higher pay grade (PS 14) than a Sheriff’s Deputy (PS 13). County Police officers who transfer to the Sheriff’s Office lose access to the County supplement retirement plan, but continue to accrue service time in VRS uninterrupted.
Among regional jurisdictions with separate police and sheriff’s offices agencies, no jurisdiction provides strict parity between police officer and sheriff’s deputy pay. The common practice in the

106 | P a g e
region is for police officers to earn higher pay levels – perhaps, in part, in recognition of the comparatively higher degree of complexity, and frequency for calls for service, associated with policing. As summarized in the table that follows, the City of Alexandria, Arlington County, and Fairfax County have separate pay plans for police officers and sheriff’s deputies with a higher pay scale/pay range maximum offered for police officers. In Loudoun County, the Sheriff’s Office performs all law enforcement functions.
Regional Police-Sheriff Pay Relationships (Effective 6/30/2018)
Full Performance Deputy Sheriff
Full Performance Police Officer
Sheriff's Deputy Maximum as % of Police Maximum
Prince William County $81,910 $93,999 87.1% Alexandria City $89,532 $93,466 95.8%
Arlington County $85,155 $87,880 96.9%
Fairfax County $83,761 $87,112 96.2%
Loudoun County N/A N/A - Another motivation reported in Police Department focus groups is the shift schedule. Some officers prefer to work a more traditional workweek. Providing court room security at the Judicial Center provides most sheriffs’ deputies with the opportunity to work a 5 on/2 off work week and take holidays as leave. In contrast, police officers may be assigned to evening and night shifts which require frequent calls for service during overnight hours.
Virginia State Police
In the Department’s exit survey data, only one employee left for the Virginia State Police. In September of 2017, however, the Virginia State Police began accepting applicants to its “Accelerated Lateral Entry Program” (ALEP) which provides a starting base pay of $60,587 to Troopers assigned to Northern Virginia ($48,719 if outside Northern Virginia). This development, potentially, could introduce a new competitor for Prince William County police officers.
To qualify for the program, applicants must be Virginia Department of Criminal Justice certified law enforcement officers with at least 3 years of service. Additionally, applicants enter a condensed eight-week training academy.
ALEP applicants, however, only have limited discretion over their geographical placement. Applicants must provide up to three jurisdictions where they are willing to accept assignment (or indicate willingness to be assigned anywhere in the Commonwealth). Assignments to a jurisdiction are ultimately based on departmental needs and vacancies.
Additionally, the State Police implemented an across-the-board base salary adjustment of $6,793 for all sworn officers, as well as 3% salary adjustment in the FY 2018.

107 | P a g e
ALEP and the FY 2018 salary adjustments were initiated in response to State Police’s own challenges with recruitment and retention. For example, prior to the FY 2018 salary adjustments, the entry rate for Virginia State Troopers was $36,207 (now $44,290). Because the agency lacks a well-defined pay progression and froze pay-for-performance wage increases in multiple years since the Great Recession, the agency also experienced severe pay compression. However, the agency maintains a pay range and has opted not to create a pay scale.
Internal Factors
Opportunities at other agencies alone do not motivate police officers to resign. A review of separated employee surveys, current employee surveys, as well as focus group interviews with current Prince William County Police Department employees identified one primary factor affecting job satisfaction – compensation. Specific compensation issues raised include:
• Pay Compression • Pay levels – particularly for mid-career personnel • Lack of certainty around future pay increases and inability to project future earnings
Additional concerns that were noted in focus groups and the survey, but were less widely shared, included: the loss of CDP following a promotion (i.e., “promotional pay cut”), lack of pay premiums, desire for a more liberal take-home vehicle policy, and overtime at 1.5x pay for lieutenants.
Insights from Active Employees
Employee insights on satisfaction can help identify internal factors that drive attrition, as well as identify cohorts at greatest risk for resignation. Additionally, employee attitudes and perspectives can provide guidance on which potential recommendations will resonate most powerfully with employees, and be most effective at stemming attrition.
Employee insights were gleaned from a combination of employee focus groups with each rank below major, meetings with command staff, and an employee survey of uniformed police personnel below the rank of major that generated 364 responses.17
Of the respondents to the active police employee survey, 70.4% reported their rank as “officer” while 29.6% reported their rank as “supervisor.” As of the 12/31/2016 payroll run, approximately 78% of sworn police personnel held the rank of PO I or PO II.
17 Not all respondents answered all questions. Accordingly, the number of responses for any specific question (N) may vary.

108 | P a g e
Active Police Survey Respondents by Rank (All Ranks; N = 362)
As shown in the figure below, nearly 90% (88.9%) of respondents are currently assigned to either operations or CID.
Active Police Survey Respondents by Division (All Ranks; N = 361)
Additionally, the table on the following page provides a breakdown of survey respondents by tenure – nearly 50% (48.7%) respondents are mid-career employees with between 6 and 15 years
70.4%
78.3%
29.6%
21.7%
0.0% 25.0% 50.0% 75.0% 100.0%
Active Employee Survey
Headcount 12/31/2016
Officer
Supervisor
Operations61.8%
Criminal Investigations
(CID)27.1%
Support Services9.4%
Office of the Chief1.4%
Financial & Technical
Services (FTSD)0.3%

109 | P a g e
of service. As of the 12/31/2016 payroll run, approximately 43.0% of sworn personnel had between 6 and 15 years of tenure with the Department.
Table 75: Active Employees vs. Active Police Survey Respondents by Years of Service18
Active Employees (N=609)
Active Survey (N=364)
YOS % %
0 – 2 26.4% 13.2%
3 – 5 11.8% 11.8%
6 – 10 22.7% 21.2%
11 – 15 20.7% 27.5%
16 – 20 11.2% 17.0%
21+ 7.2% 9.3%
To evaluate general satisfaction levels, survey respondents were asked to assess the statement “I am satisfied professionally.” Nearly one in two (49.8%) respondents replied “very true” or “true.” Approximately 15.6% responded “not very true” or “completely untrue”, as illustrated in the figure below.
“I am satisfied professionally” (All Ranks; N = 353)
18 Source: Payroll run 12/31/2016 and Active Employee Survey (N=364)
13.0% 36.8% 34.6% 12.5%
3.1%
0% 25% 50% 75% 100%
Very True
True
Somewhat True
Not Very True
CompletelyUntrue

110 | P a g e
The figure on the following page explores employee satisfaction levels across 10 specific dimensions of compensation, working conditions and benefits. Two dimensions receive aggregate scores greater than 80% - “shift schedule” (88.6% very satisfied or satisfied) and “my squad/colleagues” (87.8% very satisfied or satisfied). Of note, more than 50% of respondents reported that they were “very satisfied” with their shift schedule.
On the opposite end of the spectrum, the two dimensions related to compensation received the highest dissatisfaction scores – “future pay increases” (87.2% completely unsatisfied or not very satisfied) and ”pay” (73.6% completely unsatisfied or not very satisfied). Of note, more than 50% respondents reported that they were “completely unsatisfied” by future pay increases.
Leave benefits are viewed favorably by most police employees surveyed, with 68.6% of employees reporting that they are very satisfied or satisfied. Health and retirement benefits are viewed more neutrally, with satisfaction scores (39.2% and 38.8%, respectively) outweighing dissatisfaction scores (23.6% and 21.2%).
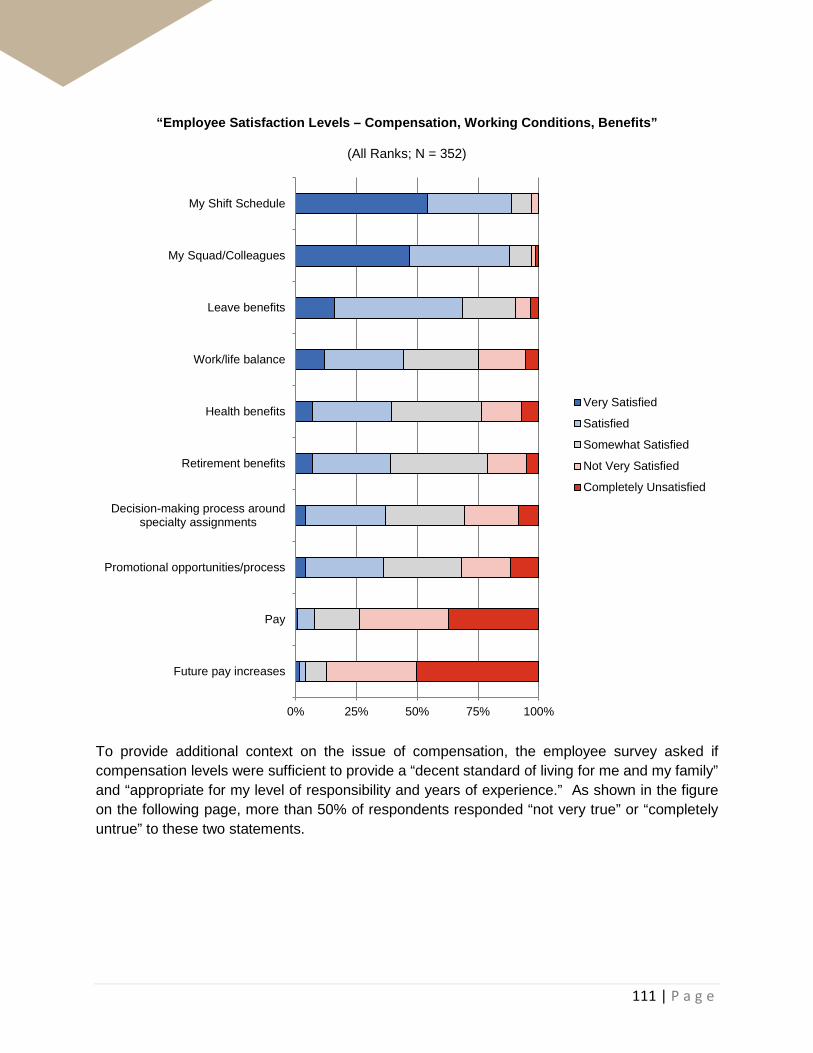
111 | P a g e
“Employee Satisfaction Levels – Compensation, Working Conditions, Benefits”
(All Ranks; N = 352)
To provide additional context on the issue of compensation, the employee survey asked if compensation levels were sufficient to provide a “decent standard of living for me and my family” and “appropriate for my level of responsibility and years of experience.” As shown in the figure on the following page, more than 50% of respondents responded “not very true” or “completely untrue” to these two statements.
0% 25% 50% 75% 100%
Future pay increases
Pay
Promotional opportunities/process
Decision-making process aroundspecialty assignments
Retirement benefits
Health benefits
Work/life balance
Leave benefits
My Squad/Colleagues
My Shift Schedule
Very Satisfied
Satisfied
Somewhat Satisfied
Not Very Satisfied
Completely Unsatisfied

112 | P a g e
Employee Satisfaction Levels – Compensation (All Ranks; N = 352)
When asked to identify the most effective compensation approach to retain employees, comments in the active police employee survey generally touched upon a desire for more clarity/transparency in the pay progression, resolution of pay compression, and an adjustment to compensation levels. A selection of survey comments from officers (i.e., excluding supervisors) on these issues are presented below:
• “Clear path to understand compensation. Don't make is a secret. If you have a listed top out pay for an officer show me how to get there.”
• “I think pay compression is a huge issue. For those of us who stuck it out during the recession and housing market crash, we need to get to where we were supposed to be.”
• “Having a clear salary increase chart and method of determining current salary.”
• “Give more step increases. When I joined the department, officers with 15 years on were topped out. I have 14 years on and it will be impossible for me to top out.”
1.4%
2.8%
4.5%
12.2%
14.5%
33.1%
33.7%
32.9%
45.9%
19.0%
0% 25% 50% 75% 100%
My pay is appropriate for my level ofresponsibility and years of experience
I believe that a career with PrinceWilliam County will provide a decent
standard of living for me and my family
Very True
True
Somewhat True
Not Very True
CompletelyUntrue

113 | P a g e
• “I believe that the ‘fix’ first needs to focus on the mid-gap employees, bringing them in-line with true and accurate time and service pay. Then, I believe that the issue could be fixed by implementing a pay structure/scale.”
• “We need a step program. Plain and simple. People need to know financially where they are going.”
The figure on the following page evaluates how nine attributes influence current police employees’ decisions to remain with the Prince William County Police Department. Compensation – “pay levels” and “ability to project my future earnings” – rank as the most influential attributes with 82.9% and 79.8% of respondents reporting these two attributes as “very influential” or “influential,” respectively.
“Treatment of more tenured employees” and “supportive management” rank third and fourth respectively, with more than 75% of respondents ranking these two attributes as “very influential” or “influential.” These findings suggest that while compensation is the primary factor in retaining active police employees, non-economic factors – such as fostering and maintaining positive relationships with management – also play an important role as well.

114 | P a g e
“What factors are likely to influence whether you remain with the Prince William County Police Department?”
(All Ranks; N = 353)
When asked to evaluate the comparative strengths of the Department, “shift schedule” and “co-workers” were cited by 88.6% and 77.2% of respondents, respectively. As shown in the table on the following page, only one respondent of 245 noted “pay” as a strength of the Department.
0% 25% 50% 75% 100%
Pay levels
Ability to project my futureearnings
Treatment of more tenuredemployees
Supportive management
Wage increases received byneighboring departments
Years to retirement eligibility
Meaningful work
Promotional opportunities
Ability to remain in my currentspecialty
Very Influential
Influential
SomewhatInfluential
Not veryInfluential
Not Influential atAll

115 | P a g e
“What do you consider strengths of the Prince William County Police Department?”
(Police Officers; N = 245; Totals will not equal 100% as respondents can check multiple options)
% Count Shift Schedule 88.6% 217 Co-workers 72.2% 177 Leave benefits 47.8% 117 Retirement benefits 37.6% 92 Health benefits 30.2% 74 Management/leadership 17.1% 42 Opportunities for promotional advancement 15.9% 39 Other (please specify) 11.4% 28 Pay 0.4% 1
Insights from Separated Employees
The perspectives of separated employees provide a useful lens through which to view current internal factors affecting retention challenges. The survey of separated employees explored why these individuals left the Department, and gauge their current attitudes towards the Department.
Fifty-nine (59) former Prince William County Police Department officers and supervisors responded to the separated employee survey. In the survey responses and commentary from open-ended questions, dissatisfaction with compensation is a recurring theme. Of the 59 respondents – including personnel who resigned and personnel who retired – 45 respondents provided open-ended commentary. More than 50% (25) of these responses specifically mention compensation-related issues as a retention challenge facing the Department.
Of these 59 respondents to the police separated employee survey, 22 respondents identified as former employees who separated from the Department with less than 15 YOS, and therefore, were not eligible for normal service retirement. Though a small sample size, the insights from this group of former Prince William County police personnel mirrors many of the attitudes and perspectives of current employees.
As shown in the table on the following page, 50% of the separated employees surveyed with fewer than 15 YOS reported compensation (pay levels or lack of certainty around future wage increases) as the primary factor in their decision to leave the department.

116 | P a g e
Separated Police Survey – “Which was the primary factor in your decision to separate from the Prince William County Police Department?”
(N =18); respondents not eligible for normal service retirement
% Count Pay levels 44.4% 8 Other 27.8% 5 Lack of opportunities for specialty assignment 11.1% 2 Lack of certainty around future wage increases 5.6% 1 Shift schedule 5.6% 1 Interactions with management/supervisors 5.6% 1
When asked to provide commentary on the primary factor for separation from the Department, one respondent identified “pay levels, pay compression, lack of certainty of future increases” contributing to the decision to leave the Department.
Another respondent highlighted distortions in the pay schedule, and the subsequent impacts on morale:
Pay compression was another serious problem for me. When new hires with masters degrees but no other police experience, however otherwise well qualified, were graduating from the academy and making as much or more than me (with 10 years of service), that seriously aggravated me and others I worked with. Worse, management either could not or would not directly address the issue or give us any hope that such an issue could be resolved.
Most of the separated employees with less than 15 YOS at the time of separation reported that that they planned on staying with the Department for the duration of their career – two-thirds (12 of 18 respondents) reported they anticipated spending their entire career with the department at hire.
Yet at some point in their service, their attitude changed. For example, one separated employee noted that with alternating pay-for-performance increases and market pay adjustments served as the impetus for him/her to leave the Department:
I realized that with the current pay / COLA system in place, I would not ever make top salary for a police officer / detective if I did 25 years of service AND they never increased top pay…This lack of pay raises would also significantly hurt my pension at retirement and make it almost mandatory to get a second retirement.
The separated police employee survey also asked respondents about the importance of a multitude of factors that influenced their decision to leave the Department. Again, compensation emerges as the dominant theme among personnel who separated from the Department before eligible for service retirement.
As shown in the figure on the following page, respondents were asked to rate the importance of 13 factors on a scale of “very important” to “not important at all” in their decision to separate from

117 | P a g e
the Department. Four of the five factors that were most important (i.e., ranked “very important” or “important”) related to cash compensation – lack of certainty around future pay raises (77.8%), pay levels (72.2%), pay compression (61.1%), and lack of certification/premium pays (61.1%). This ranking suggests dissatisfaction with compensation levels and/or structure among survey respondents.
Separated Police Survey – “Please rate how important each factor was in your decision to separate from the Prince William County Police Department”
(N =18); respondents not eligible for normal service retirement
To provide additional context on the issue of compensation, respondents were asked if their monthly take-home pay increased when they left the Department. Nearly two-thirds of respondents (11 of 17) reported that their monthly take-home pay increased when they left the
0% 25% 50% 75% 100%
Lack of certainty around future payincreases
Pay levels
Retirement benefits
Pay compression (i.e., insufficient paydifferentials between years of service
and/or rank)
Lack of certification/premium pays
Leave benefits
Interaction withmanagement/supervisors
Health benefits
Work-related stress/pressure
Lack of opportunities for promotion
Decision-making process aroundtransfers
Shift schedule
Lack of opportunities for specialtyassignment
Very Important
Important
Somewhat Important
Not Very Important
Not Important At All

118 | P a g e
Department. As shown in the figure that follows, approximately 53% of respondents (9 of 17) reported an increase in monthly take-home pay between $1,000 and $2,999.
Separated Police Survey – “When I left the Prince William County Police Department, my monthly take-home pay…”
(N =17); respondents not eligible for normal service retirement
When asked about what actions could be taken to prevent employees from leaving the Department, the majority of comments reference compensation. Some representative comments are listed below:
• “Pay adjustment”
• “Better pay”
• “Reinstate COLAs and merit increases every year, not alternating years; increase pay levels of first-line supervisors.”
• “Structured, scheduled salary increases. While I know PWC could have not paid me as much as federal, I would have liked to be able to project my future income and investments.”
• “With the current climate in law-enforcement, officers are more and more finding themselves asking if it is worth their time and risk continuing in this profession. If there is little incentive (pay, cola adjustments, pay increases, etc.) offered by the employer, the decision is easy to leave.”
Decreased23.5%
Increased by less than $1,000
5.9%
Increased by $1,000 to $2,999
52.9%
Increased by $3,000 to $4,999
0.0%
Increased by more than $5,000
5.9%
Remained the same11.8%
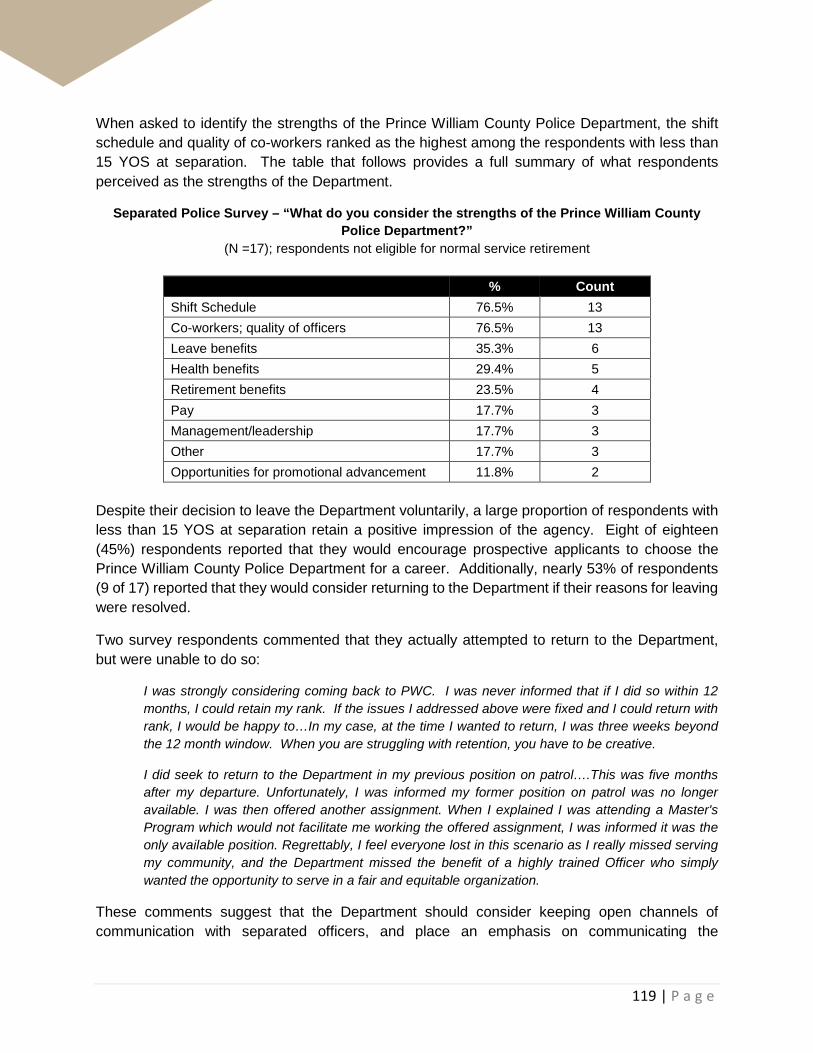
119 | P a g e
When asked to identify the strengths of the Prince William County Police Department, the shift schedule and quality of co-workers ranked as the highest among the respondents with less than 15 YOS at separation. The table that follows provides a full summary of what respondents perceived as the strengths of the Department.
Separated Police Survey – “What do you consider the strengths of the Prince William County Police Department?”
(N =17); respondents not eligible for normal service retirement
% Count Shift Schedule 76.5% 13 Co-workers; quality of officers 76.5% 13 Leave benefits 35.3% 6 Health benefits 29.4% 5 Retirement benefits 23.5% 4 Pay 17.7% 3 Management/leadership 17.7% 3 Other 17.7% 3 Opportunities for promotional advancement 11.8% 2
Despite their decision to leave the Department voluntarily, a large proportion of respondents with less than 15 YOS at separation retain a positive impression of the agency. Eight of eighteen (45%) respondents reported that they would encourage prospective applicants to choose the Prince William County Police Department for a career. Additionally, nearly 53% of respondents (9 of 17) reported that they would consider returning to the Department if their reasons for leaving were resolved.
Two survey respondents commented that they actually attempted to return to the Department, but were unable to do so:
I was strongly considering coming back to PWC. I was never informed that if I did so within 12 months, I could retain my rank. If the issues I addressed above were fixed and I could return with rank, I would be happy to…In my case, at the time I wanted to return, I was three weeks beyond the 12 month window. When you are struggling with retention, you have to be creative.
I did seek to return to the Department in my previous position on patrol….This was five months after my departure. Unfortunately, I was informed my former position on patrol was no longer available. I was then offered another assignment. When I explained I was attending a Master's Program which would not facilitate me working the offered assignment, I was informed it was the only available position. Regrettably, I feel everyone lost in this scenario as I really missed serving my community, and the Department missed the benefit of a highly trained Officer who simply wanted the opportunity to serve in a fair and equitable organization.
These comments suggest that the Department should consider keeping open channels of communication with separated officers, and place an emphasis on communicating the

120 | P a g e
requirements for returning to service as part of the exit interview process. The favorable experiences of working at Prince William County – e.g., strong affinity for fellow officers and convenient shift schedule – still resonate with some separated employees.
Though a small sample size, an analysis of separated employees generally mirrors common themes which surfaced during focus groups and the survey with active employees. Though compensation was the driving force behind many officers leaving the Department, approximately half of the respondents reported at least a somewhat favorable impression of the Department – as evidenced by their willingness to recommend prospective applicants to choose the Prince William County Police Department for a career.
Anticipating Attrition
Resignations – not retirements – are the main driver of the Department’s increase in employee turnover. Accordingly, this section of the report uses data from the active employee survey to identify which cohorts of employees are most likely to resign. As will be shown in the pages that follow, the survey data suggest that officers with fewer than five years of service are at greatest risk of voluntarily resignation.
When looking across all ranks, 36% of active police employees reported that they envision spending their entire law enforcement career with Prince William County, while nearly half (47.9%) responded that they were “unsure.”
“Do you see yourself spending your entire law enforcement career with Prince William County?” (All Ranks; N = 353)
Of the 353 police employees who answered this question, 280 respondents (79%) provided additional commentary explaining the main factors that would affect their decision to stay or leave with the Department. Of these 280 responses, approximately 70% explicitly mention low pay levels, high cost of living in the County, or lack of clarity around pay increases as a factor for
Yes36.0%
No16.1%
Unsure47.9%

121 | P a g e
potentially leaving the Department. Additionally, approximately 13% of these 280 respondents report that they are too close to retirement to consider transitioning to another Department.
When refining this dataset to look at officers only – i.e., excluding supervisors – the proportion of employees who view themselves as spending an entire career with the Department declines further. Among all police officers, 24.9% of respondents view themselves as spending their entire law enforcement career with the Department.
When refining this result further by tenure, proportion of employees who see themselves spending an entire career with the Department plummets. Among the 89 officers (i.e., excluding supervisors) with fewer than five years of service, only 6 (6.7%) responded that they see themselves spending their entire law enforcement career with the Department. Among the 42 officers with between three and five years of service – none (0%) reported that they see themselves spending their entire career with the Department.
Active Police Survey – Have you applied for a law enforcement position with another law enforcement agency within the past 12 months?
(Police Officers, Excluding Supervisors)
Not incidentally, as illustrated in the previous section on Northern Virginia cash compensation, it is before the fifth year of service – where the largest proportion of police officers are applying for other law enforcement jobs (38.1%) and the lowest proportion envision themselves spending an entire career with the Department (0.0%) – in which Prince William County police officer compensation begins to lag behind other regional employers.
Those who applied for other law enforcement positions in the past 12 months reported higher levels of dissatisfaction with compensation than the overall police force. In particular, 76.7% of police personnel (all ranks) who applied for another position reported that they did not believe that a career with Prince William County will provide a decent standard of living versus 51.8% of the police force as whole (see following table). This finding suggests that providing greater certainty
25.1%
19.1%
38.1%
28.8% 27.6%
8.0%24.9%
12.8%
0.0%
23.4% 25.4%
73.3%
0.0%
10.0%
20.0%
30.0%
40.0%
50.0%
60.0%
70.0%
80.0%
0.0%
5.0%
10.0%
15.0%
20.0%
25.0%
30.0%
35.0%
40.0%
All Officers Officer 0-2YOS
Officer 3-5YOS
Officer 6-10YOS
Officer 11-15YOS
Officer 16-20YOS
Applied for a law enforcement position in past 12 months
Intend to spend entire career with PWC Police Dept.
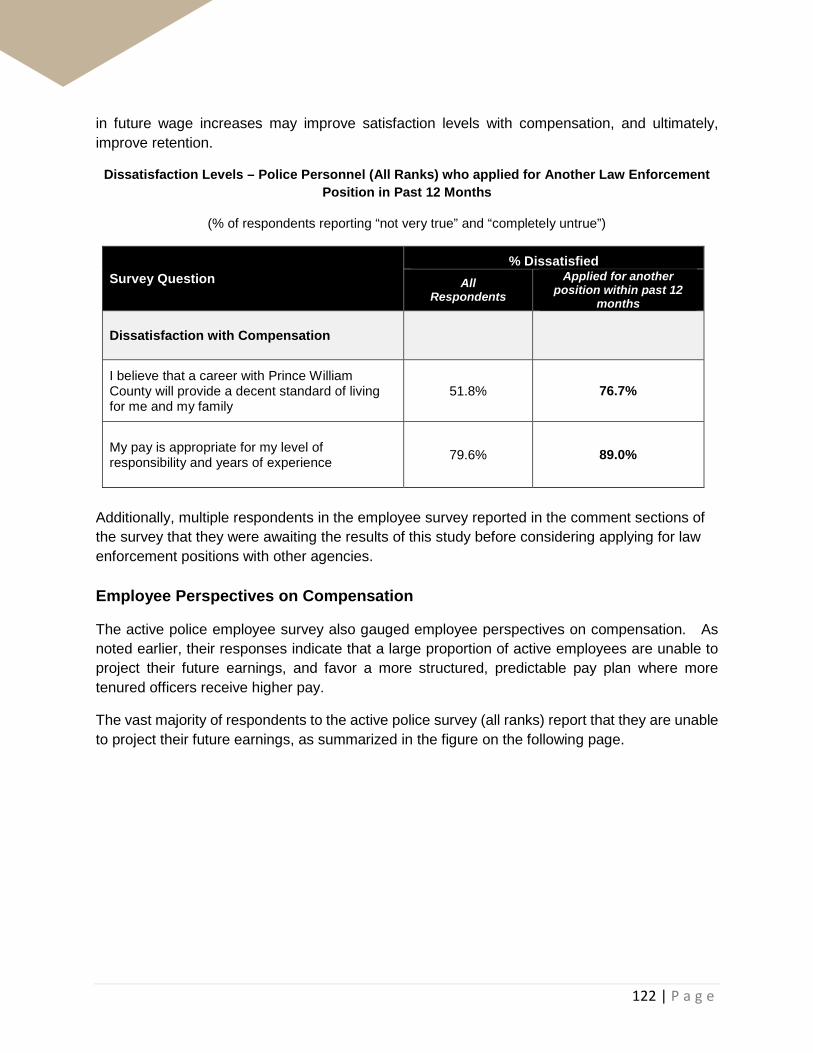
122 | P a g e
in future wage increases may improve satisfaction levels with compensation, and ultimately, improve retention.
Dissatisfaction Levels – Police Personnel (All Ranks) who applied for Another Law Enforcement Position in Past 12 Months
(% of respondents reporting “not very true” and “completely untrue”)
Survey Question % Dissatisfied
All Respondents
Applied for another position within past 12
months
Dissatisfaction with Compensation
I believe that a career with Prince William County will provide a decent standard of living for me and my family
51.8% 76.7%
My pay is appropriate for my level of responsibility and years of experience 79.6% 89.0%
Additionally, multiple respondents in the employee survey reported in the comment sections of the survey that they were awaiting the results of this study before considering applying for law enforcement positions with other agencies. Employee Perspectives on Compensation
The active police employee survey also gauged employee perspectives on compensation. As noted earlier, their responses indicate that a large proportion of active employees are unable to project their future earnings, and favor a more structured, predictable pay plan where more tenured officers receive higher pay.
The vast majority of respondents to the active police survey (all ranks) report that they are unable to project their future earnings, as summarized in the figure on the following page.
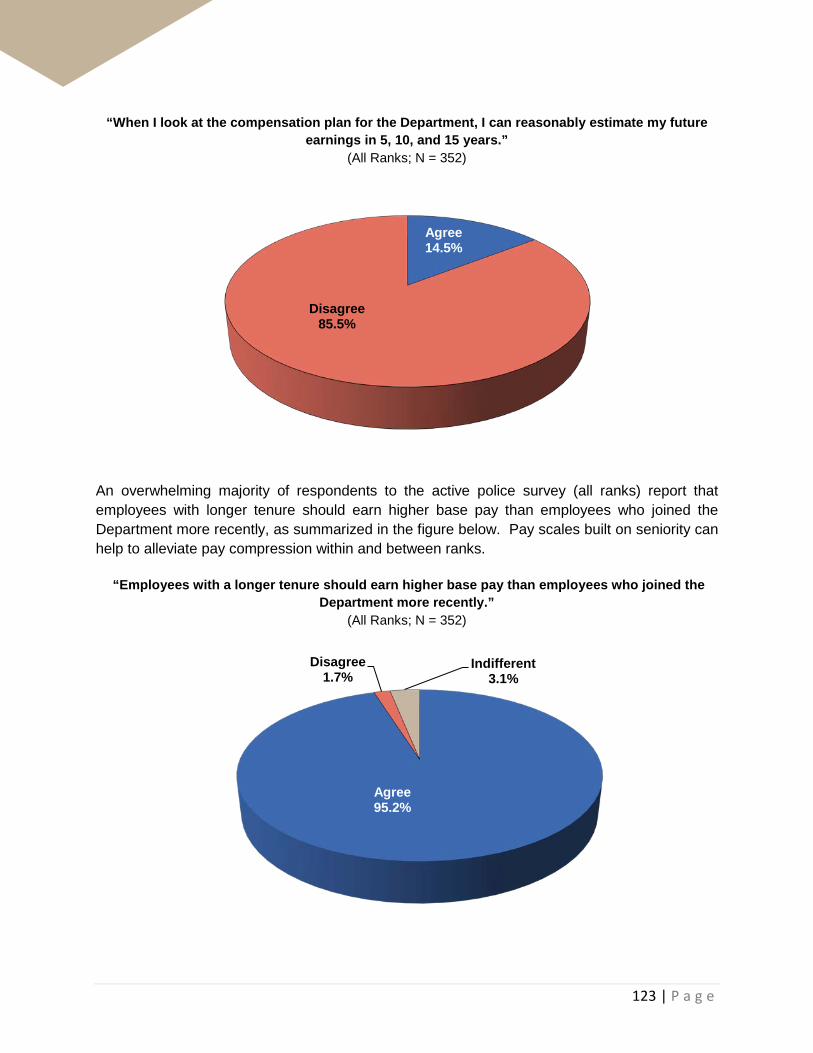
123 | P a g e
“When I look at the compensation plan for the Department, I can reasonably estimate my future earnings in 5, 10, and 15 years.”
(All Ranks; N = 352)
An overwhelming majority of respondents to the active police survey (all ranks) report that employees with longer tenure should earn higher base pay than employees who joined the Department more recently, as summarized in the figure below. Pay scales built on seniority can help to alleviate pay compression within and between ranks.
“Employees with a longer tenure should earn higher base pay than employees who joined the
Department more recently.” (All Ranks; N = 352)
Agree14.5%
Disagree85.5%
Agree95.2%
Disagree1.7%
Indifferent3.1%
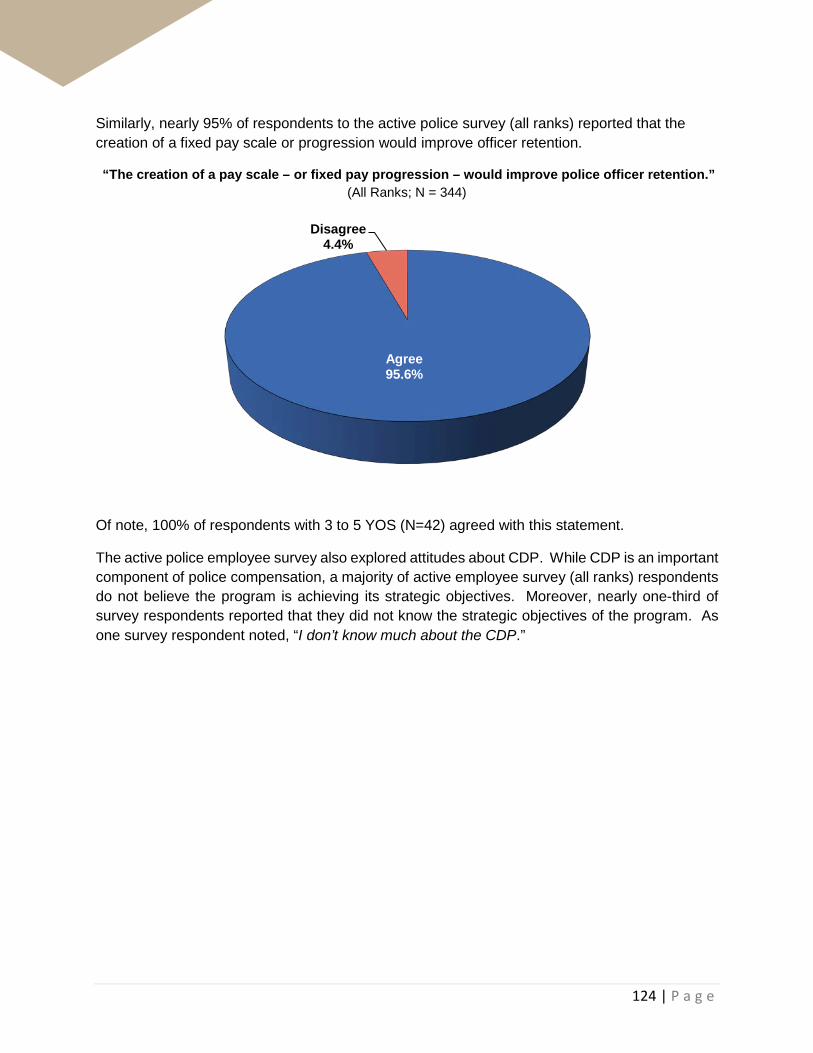
124 | P a g e
Similarly, nearly 95% of respondents to the active police survey (all ranks) reported that the creation of a fixed pay scale or progression would improve officer retention.
“The creation of a pay scale – or fixed pay progression – would improve police officer retention.” (All Ranks; N = 344)
Of note, 100% of respondents with 3 to 5 YOS (N=42) agreed with this statement.
The active police employee survey also explored attitudes about CDP. While CDP is an important component of police compensation, a majority of active employee survey (all ranks) respondents do not believe the program is achieving its strategic objectives. Moreover, nearly one-third of survey respondents reported that they did not know the strategic objectives of the program. As one survey respondent noted, “I don’t know much about the CDP.”
Agree95.6%
Disagree4.4%

125 | P a g e
“Do you believe that the Career Development Program (CDP) achieves its strategic objectives?” (All Ranks, N = 350)
Despite mixed attitudes towards CDP, 62% of active police survey respondents (201 of 324) believe that the program should continue, with modifications. As underscored in multiple comments by current employees, the officers and supervisors who earn CDP view the premium as part of base pay. Elimination of the pay premium – or “re-allocation” as noted by one survey respondent – would likely be viewed unfavorably by employees, and exacerbate retention challenges faced by the Department:
• “Whatever decision is made, you can't take money from the people who are and have been participating in the program!!!”
• “Bad idea to take away this additional pay from persons who have maintained it for a long period.”
• “There should be no ‘re-allocation’ of funds because that is what most senior members of the department rely on to make a decent wage.”
Many respondents also noted that CDP participants receive additional compensation, but perform no additional duties, negatively affecting morale:
• “CDP is kind of stagnant. You have folks here that assume a lot more responsibilities with collateral assignment and duties with no compensation which I don't see as being fair”
• “Too many people make too much money for not doing anything additional. It was developed to inspire others to be a supervisor, not take one class a year and get extra money with no additional work. Either add more responsibilities to it or get rid of it all together”
Yes, 16.6%
No, 53.4%
I don't know what the CDP strategic
objectives are, 30.0%

126 | P a g e
CDP contributes to the over complexity and opacity of the Department’s current compensation plan, but the comments from the employee survey suggest that employees recognize the value of having a career pathway with additional responsibilities beyond those of a rank-and-file officer.
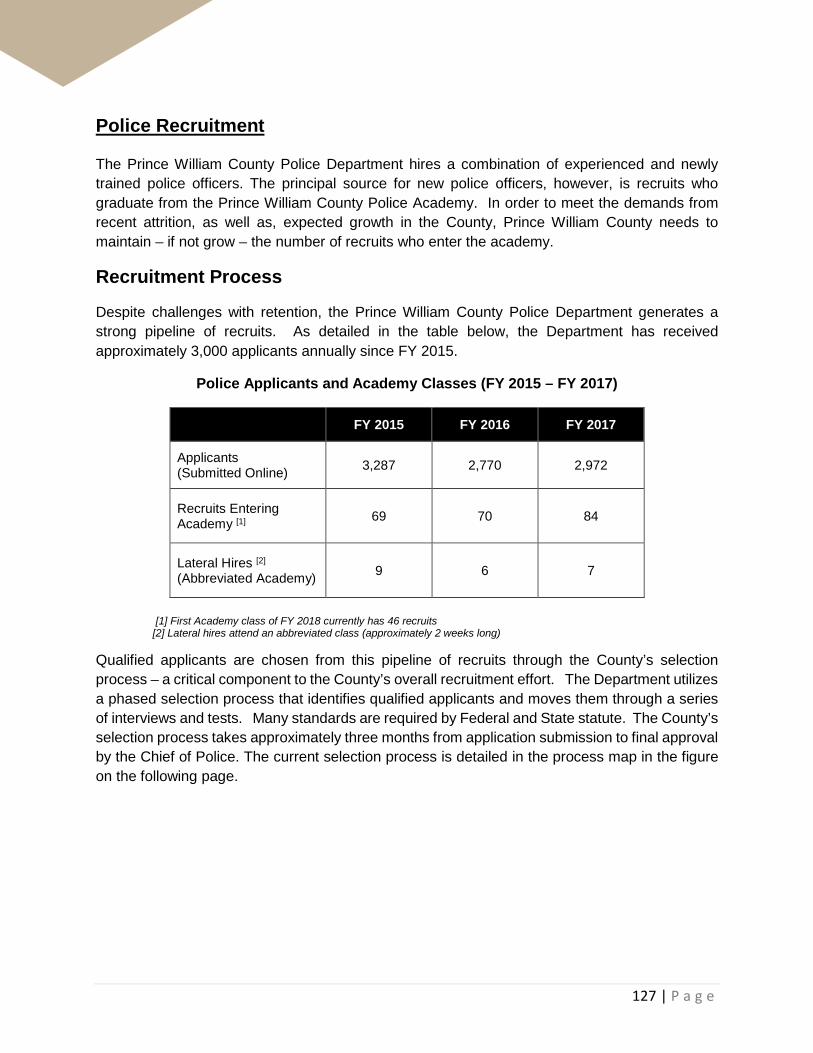
127 | P a g e
Police Recruitment The Prince William County Police Department hires a combination of experienced and newly trained police officers. The principal source for new police officers, however, is recruits who graduate from the Prince William County Police Academy. In order to meet the demands from recent attrition, as well as, expected growth in the County, Prince William County needs to maintain – if not grow – the number of recruits who enter the academy.
Recruitment Process
Despite challenges with retention, the Prince William County Police Department generates a strong pipeline of recruits. As detailed in the table below, the Department has received approximately 3,000 applicants annually since FY 2015.
Police Applicants and Academy Classes (FY 2015 – FY 2017)
FY 2015 FY 2016 FY 2017
Applicants (Submitted Online) 3,287 2,770 2,972
Recruits Entering Academy [1] 69 70 84
Lateral Hires [2] (Abbreviated Academy) 9 6 7
[1] First Academy class of FY 2018 currently has 46 recruits [2] Lateral hires attend an abbreviated class (approximately 2 weeks long)
Qualified applicants are chosen from this pipeline of recruits through the County’s selection process – a critical component to the County’s overall recruitment effort. The Department utilizes a phased selection process that identifies qualified applicants and moves them through a series of interviews and tests. Many standards are required by Federal and State statute. The County’s selection process takes approximately three months from application submission to final approval by the Chief of Police. The current selection process is detailed in the process map in the figure on the following page.

128 | P a g e
Police Recruitment Process Map

129 | P a g e
Generally, police recruits reported a favorable experience in the recruitment process. On a scale of 1 through 10 – with 10 being the highest rating – the average rating was 8.9, with 93.5% (43 of 46 respondents) providing a rating of 8 or higher. As a point of comparison, respondents to the active employee survey provided an average rating of 7.0.
“Please Rate Your Experience with the Prince William County Recruitment Process” (Scale of 1 to 10, 10 being the most favorable rating)
One recruit commented “the [recruitment] process itself was huge in making up my mind. I felt like a person as opposed to a number” [emphasis added].
Another recruit reflected on his/her recruitment experience in comparative context:
I had been told the process to get into law enforcement could take 6-9 months. I believe it was 2-3 months from submitting my application to my meeting with Chief Barnard. The recruitment process was thorough and efficient and through every step of the process, I felt like my application mattered. A feeling that was not reciprocated from other regional local law enforcement agencies. [Emphasis added]
Interactions with recruitment personnel and the speed with which a formal offer can be made are important factors for police recruits in choosing a police department. Therefore, a positive recruitment experience represents a potential comparative advantage for the Prince William County Police Department in attracting qualified personnel.
8.9
7.0
0.0
1.0
2.0
3.0
4.0
5.0
6.0
7.0
8.0
9.0
10.0
Recruit Survey (n=46) Active Police Employee Survey(n=355)
Average Rating

130 | P a g e
Backgrounds of Applicants and Recruits
Much of the information in this section will draw on information from an online survey of police recruits that were in the academy as of August 2017. Data were collected from 46 individual responses. Some demographic highlights of the sample group include:
• More than 2/3 of the recruit class surveyed were between the ages of 21 and 25 (31 of 46)
• Nearly 70% of recruits possessed one of the following: an associate’s degree (8.7%, 4 recruits), bachelor’s degree (58.7%, 27 recruits), or a master’s degree or higher (2.2%, 1 recruit). The remainder of recruits (30.4%, 14) possessed a GED or high school diploma
• Approximately 59% (27 of 46 respondents) reported living in the Northern
Virginia/Washington, DC metropolitan region
The table below provides a summary of recruit survey applicants by race (self-reported).
Police Recruit Survey Respondents by Race19 (Respondents could select more than one option; totals will not equal 100%)
Race Prince William County
Police Recruits
N=46
Police Active N=357
African-American 19.7% 6.5% 5.0% White 46.3% 76.1% 85.7% Hispanic/Latino 21.5% 6.5% 10.1% Asian 7.7% 10.9% 2.0% Other (please specify) 0.6% 0.0% 2.0%
The figure on the following page summarizes the prior experience of the recruits who responded to the survey. Of the 46 respondents to the recruit survey, 34.8% reported having prior military service. Approximately one-quarter reported that employment with the Prince William County Police Department represented their first full-time job. Less than 7% reported prior law enforcement experience.
19 U.S. Census Bureau, American Community Survey 2011-2015 5-Year Estimates; Police Active and Recruit Surveys; Percentages will not add up to 100% because respondents were allowed to select multiple options

131 | P a g e
Police Recruit Survey Respondents by Prior Work Experience (N = 46); respondents could select more than one option; totals will not equal 100%
By comparison, thirty-five (35%) percent of respondents to the current police employee survey (i.e., uniformed employees who are not recruits) reported prior military experience before joining the Department. Relative to the recruit survey, however, a lower proportion of active employees reported that the Prince William County Police Department represented their first full-time job (12.2% vs. 23.9%) and a higher proportion reported prior law enforcement experience (21.4% vs. 6.5%). These comparisons may be partially skewed by the fact that lateral hires with law enforcement certification in the Commonwealth of Virginia are captured in the active police employee survey, but not in the recruit survey. Similarly, the recruit survey has a much lower sample size (46 vs. 364). See the figure on the following page for more detail.
Nevertheless, newer recruits tend to have less job experience and prior law-enforcement experience, placing an even greater emphasis on the role of field training officers in integrating new officers into the police force.
54.4%
34.8%
23.9%
6.5%
0.0%
10.0%
20.0%
30.0%
40.0%
50.0%
60.0%
70.0%
Other workexperience
Military Service Prince WilliamCounty is my first
full-time job
Other lawenforcementexperience

132 | P a g e
Active Police Survey Respondents by Prior Work Experience (N = 360); respondents could select more than one option; totals will not equal 100%
61.7%
35.0%
21.4%
12.2%
0.0%
10.0%
20.0%
30.0%
40.0%
50.0%
60.0%
70.0%
Other workexperience
Military experience Other lawenforcementexperience
Prince WilliamCounty is my first
full-time job
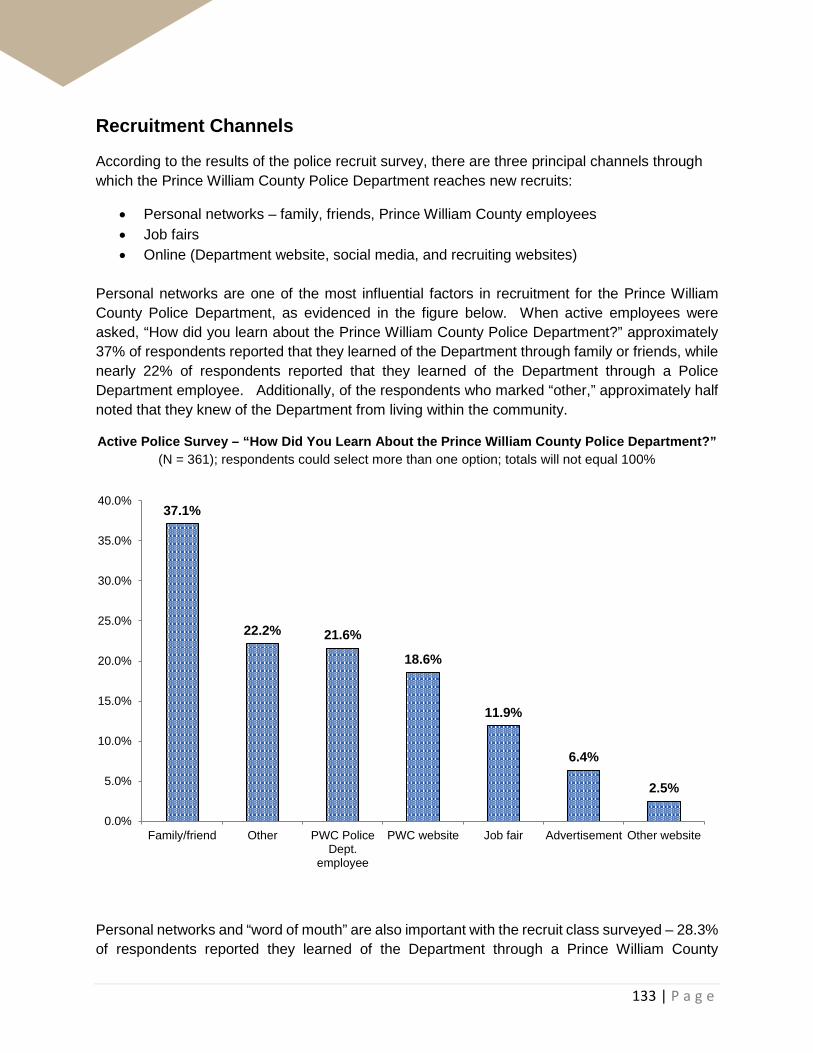
133 | P a g e
Recruitment Channels
According to the results of the police recruit survey, there are three principal channels through which the Prince William County Police Department reaches new recruits:
• Personal networks – family, friends, Prince William County employees • Job fairs • Online (Department website, social media, and recruiting websites)
Personal networks are one of the most influential factors in recruitment for the Prince William County Police Department, as evidenced in the figure below. When active employees were asked, “How did you learn about the Prince William County Police Department?” approximately 37% of respondents reported that they learned of the Department through family or friends, while nearly 22% of respondents reported that they learned of the Department through a Police Department employee. Additionally, of the respondents who marked “other,” approximately half noted that they knew of the Department from living within the community.
Active Police Survey – “How Did You Learn About the Prince William County Police Department?” (N = 361); respondents could select more than one option; totals will not equal 100%
Personal networks and “word of mouth” are also important with the recruit class surveyed – 28.3% of respondents reported they learned of the Department through a Prince William County
37.1%
22.2% 21.6%
18.6%
11.9%
6.4%
2.5%
0.0%
5.0%
10.0%
15.0%
20.0%
25.0%
30.0%
35.0%
40.0%
Family/friend Other PWC PoliceDept.
employee
PWC website Job fair Advertisement Other website

134 | P a g e
employee, and 26.1% reported they learned of the Department through a family member or friend (see figure below). Multiple respondents mentioned that interactions with individual Prince William County Police Officers left favorable impressions, generating interest in the Department.
From a recruitment perspective, therefore, current employees serve as ambassadors for the Department since they play a significant role in attracting prospective applicants to the Department. Higher levels of current employee satisfaction can potentially bolster and improve recruitment efforts. As one recruit commented in the survey, “my interactions with officers and investigators solidified my decision [to join the department].”
Police Recruit Survey – “How Did You Learn About the Prince William County Police Department?”
(N = 361); respondents could select more than one option; totals will not equal 100%
The recruit survey also highlights the efforts of Department personnel to connect with prospective applicants in-person as more than one-third (34.8%) of recruits reported that they learned about the Department through job fairs. This finding reflects the Department’s concerted effort to attend job fairs to target qualified recruits. The Department also regularly tracks the number of applicants generated from job fairs attended so that recruitment resources are dedicated to activities that yield the highest proportion of high-quality applicants. The recruit survey results suggest these efforts have been successful in attracting qualified applicants to the Department.
34.8%
30.4%28.3%
26.1%
15.2%
10.9%
0.0% 0.0%0.0%
5.0%
10.0%
15.0%
20.0%
25.0%
30.0%
35.0%
40.0%
135 | P a g e
Additionally, a large proportion of recruits reported learning about the Department online – 30.4% learned about the Department through the County website, while 10.9% reported that they visited another website. Additional websites/online platforms where recruits reported learning about the Prince William County Police Department included: governmentjobs.com, policeapp.com, policeone.com, ziprecruiter.com, indeed.com, and Facebook. Accordingly, the Department’s website and social media presence should continue to be a focus of marketing and outreach efforts.
No recruits reported learning about the Department through print or radio advertising.
A common theme expressed in the comments sections of the police active employee survey is the perceived untapped potential of military recruitment. While more than one-third of active employees and recruits report having military experience, there is a perception that additional outreach effort is possible – particularly given the presence of the Marine Corps Base in Quantico in Prince William County and Fort Belvoir in Fairfax County.
Two examples of comments from the open-ended sections of the employee survey are presented below:
Go back to emphasis on prior military….The likelihood that a recruit with a bachelor's degree that comes to us straight out of college will stay for 25 years is slim. They are most likely looking to jump to the feds after doing 3 to 5 years. Individuals coming out of the military are looking to settle and put down roots.
When I started almost 20 years ago, 3/4 or more of my academy class did not have college, in fact most of us were prior military. The vast majority of my class is still with the department and most have been promoted more than once along the way.
Given the Department’s positive history with military recruits and the geographical proximity of military installations, the Department may consider exploring additional networking with military transition programs, as well as marketing through military-focused online platforms.
Understanding Recruit Motivations
Individuals who choose a career in law enforcement, by definition, have a strong commitment to public service. But once an individual decides to pursue a career in law enforcement, multiple factors can influence which Department he/she chooses to join. While compensation represents an important consideration for recruits, the police recruit survey suggests it is not the most pressing factor for new recruits. Non-economic factors, such as the reputation of the department, and logistical considerations – such as the speed at which employees move through the application pipeline – are critical factors as well.
As detailed in the figure that follows, nearly all recruits surveyed (97.8%) responded that the reputation of the Prince William County Police Department ranks as a “very important” or “important” factor in the decision to the join Department. “Benefits” represented the only other factor receiving a very important/important mark greater than 90% (91.1%). Opportunities for specialty assignment (89.1%), shift schedule (86.7%), promotional opportunities (84.8%), and
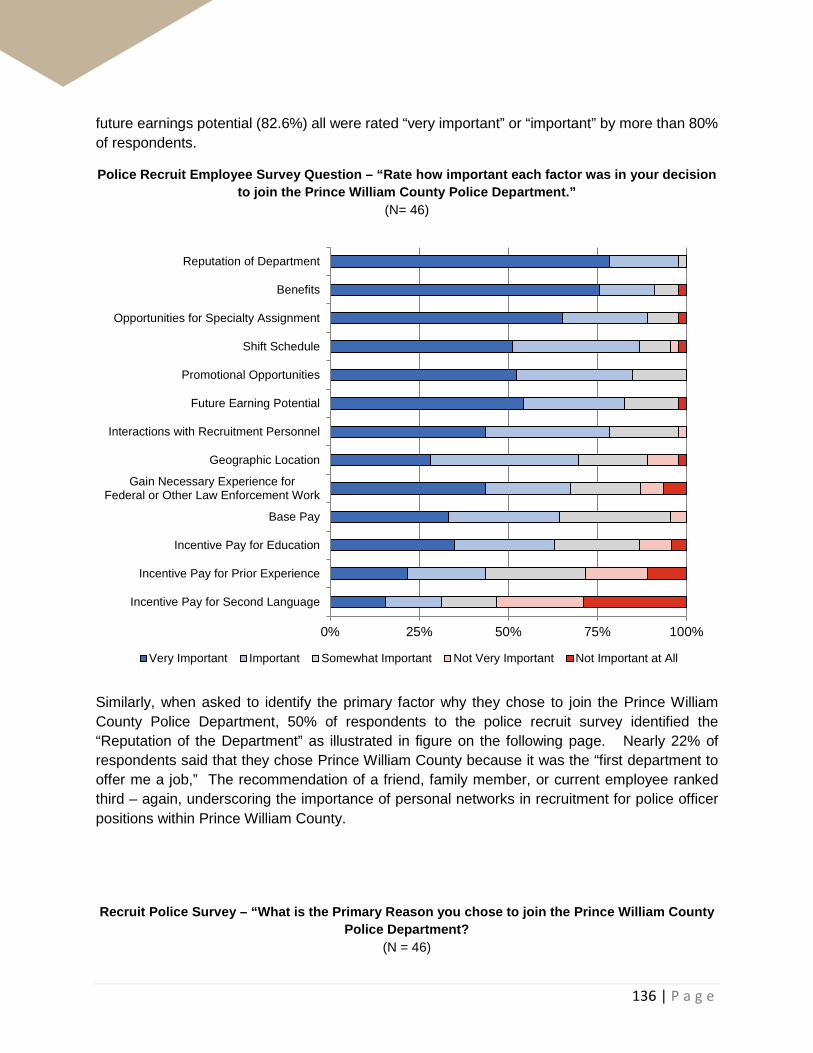
136 | P a g e
future earnings potential (82.6%) all were rated “very important” or “important” by more than 80% of respondents.
Police Recruit Employee Survey Question – “Rate how important each factor was in your decision to join the Prince William County Police Department.”
(N= 46)
Similarly, when asked to identify the primary factor why they chose to join the Prince William County Police Department, 50% of respondents to the police recruit survey identified the “Reputation of the Department” as illustrated in figure on the following page. Nearly 22% of respondents said that they chose Prince William County because it was the “first department to offer me a job,” The recommendation of a friend, family member, or current employee ranked third – again, underscoring the importance of personal networks in recruitment for police officer positions within Prince William County.
Recruit Police Survey – “What is the Primary Reason you chose to join the Prince William County Police Department?
(N = 46)
0% 25% 50% 75% 100%
Reputation of Department
Benefits
Opportunities for Specialty Assignment
Shift Schedule
Promotional Opportunities
Future Earning Potential
Interactions with Recruitment Personnel
Geographic Location
Gain Necessary Experience forFederal or Other Law Enforcement Work
Base Pay
Incentive Pay for Education
Incentive Pay for Prior Experience
Incentive Pay for Second Language
Very Important Important Somewhat Important Not Very Important Not Important at All

137 | P a g e
As shown in the figure on the following page, more than one-third (1/3) of respondents to the current employee survey reported that “the first department to hire me” served as the primary reason why they chose to join the Prince William County Police Department. This finding underscores the importance of maintaining a streamlined application process that minimizes the time between the submission of an application and hire date, while at the same time, being comprehensive enough to screen for the most qualified talent. Many of the strongest applicants may have applications pending with multiple law enforcement agencies.
50.0%21.7%
10.9%
8.7%
2.2%
2.2%
2.2%
2.2%
0.0%
0.0%
0.0% 10.0% 20.0% 30.0% 40.0% 50.0%
Reputation of the Department
First department to offer me a job
Recommendation of a friend, family member, orcurrent employee
Live in the area
Base Pay
Incentives for prior military or law enforcementexperience
Shift Schedule
Other
Incentives for education or language pay
Benefits

138 | P a g e
Active Police Survey – “What is the Primary Reason you chose to join the Prince William County Police Department?”
(N = 362)
The recruit survey also provides insight into the factors which may influence retention. Employees are motivated to excel, grow, and take on additional responsibility through multiple economic and non-economic variables. The table that follows summarizes the responses received to the question, “What factors are most likely to influence whether you remain with the Prince William County Police Department?” Two non-economic responses – “meaningful work” and “supportive management” ranked in the top three responses (in addition to pay levels).
36.5%
23.2%
12.7%
10.5%
8.3%
5.3%
1.4%
0.8%
0.8%
0.6%
0.0% 10.0% 20.0% 30.0% 40.0%
First department to hire me
Live in the area
Reputation of the Department
Recommendation of a friend, family member orcurrent employee
Other
Shift schedule
Benefits
Base Pay
Incentives for prior military or law enforcementexperience
Incentives for education or language pay

139 | P a g e
Police Recruit Employee Survey Question – “What factors are likely to influence your decision to remain with the Prince William County Police Department?”
(N = 46)
Factor "Very Important" or "Important"
Meaningful work 100.0% Pay levels 93.5% Supportive management 93.3% Promotional opportunities 82.6% Treatment of more tenured employees 76.1% Ability to project my future earnings 76.1% Years to retirement eligibility 67.4% Wage increases received by neighboring departments 60.9%
While non-economic factors are important, resoundingly, pay levels and future pay increases – influence whether recruits see themselves staying with the Department for the duration of their law enforcement career. Less than half of recruits reported that they envisioned spending their entire law enforcement career with the Prince William County Police Department: As shown in the figure below, while only 2.2% of respondents (1) responded definitively “no,” more than half of respondents reported that they were “unsure” if they would spend the duration of their law enforcement career with the County.
Police Recruit Employee Survey Question – “Do you see yourself spending your entire law enforcement career with the Prince William County Police Department?”
(N = 46)
Yes45.7%
No2.2%
Unsure52.2%

140 | P a g e
Twenty respondents provided additional commentary when asked to explain the main factors that would affect their decision to stay or leave the Department. Eight of these responses mentioned current pay or future pay increases as main factors that would influence their decision to remain with the Department. The ability to promote in rank/training opportunities also represented a recurring theme in the open-ended responses. Three respondents mentioned that the availability of federal law enforcement jobs could also influence their plans to stay with the Department for the duration of their law enforcement career.
One recruit response mentioned that the following factors would influence his/her decision to remain with the department: “Pay Increases as well as promotional opportunities. Stagnation would be the primary reason for me to consider leaving.”
Thus, while non-economic factors play a critical role in attracting qualified applicants to the Prince William County Police Department, uncertainty around the prospects of future pay increases emerges as a concern for recruits – which may potentially fuel future attrition. A more predictable compensation plan, coupled with providing opportunities for professional growth, could potentially resolve some of the uncertainty for incoming recruits.
Finally, the recruit survey provides some valuable insight into messaging that will resonate well with incoming recruits. The Department may consider incorporating the messages below in communications with prospective applicants, as well as marketing and online materials:
• Department with a strong reputation
• Attractive shift schedule
• Ample opportunities for growth (e.g., promotion and specialty assignments)
• Understanding management and strong mentorship
• Strong future earning potential
• Competitive health, retirement, and supplemental benefits plans

141 | P a g e
VII. Fire & Rescue Compensation, Retention, and Recruitment
Summary of Findings
Compensation
• Relative to the Northern Virginia comparison group, Prince William County’s fire and rescue cash compensation is competitive at entry, but trails Fairfax County.
• Compensation for mid-career fire and rescue technicians lags other Departments in the region when evaluating annual total direct cash compensation – particularly Fairfax County.
• When adjusting compensation for annual hours actually worked, however, Prince William County’s relative position improves. Fire and Rescue operations personnel in Prince William County are scheduled to work 2,496 annual hours, while their counterparts in Alexandria, Arlington County, and Fairfax County are scheduled to work 2,912 annual hours. Nonetheless, based on feedback from focus groups and the employee survey, DFR employees appear to focus upon annual compensation levels, not hourly compensation levels.20
• Holiday pay compensation represents a significant component of direct cash compensation for Prince William County fire and rescue personnel. The Department’s holiday pay formula, however, provides operational personnel who work the County’s day shift with fewer opportunities to earn holiday pay – lowering total direct cash compensation received relative to personnel who work 24-hour shifts.
• Paramedic pay premiums are in-line with regional Departments; however Prince William County is the only Department that does not provide additional compensation for specialty technician certifications.
Retention
• Employee turnover and quit rates among Prince William County fire and rescue personnel have generally followed the attrition rates in the region between FY 2013 and FY 2017. Other Departments have experienced greater volatility in their quit and turnover rates.
• During the first two months of FY 2018, however, the Department has experienced an increase in voluntary resignations (8 technician quits in FY 2018 to date vs. 14 in all of FY 2017).
20 While many DFR employees appear to place a greater emphasis on annual pay levels, fire/rescue personnel in other Departments in the region and throughout the Country may place a greater emphasis on hourly pay.
142 | P a g e
• Since FY 2013, voluntary resignations, not retirements, have been the principal cause of the Department’s attrition. The majority of fire and rescue technicians who voluntarily resign from DFR leave for Fairfax County.
• Employee surveys and focus groups highlight annual compensation levels and shift schedules (i.e., the day shift) as the primary internal factors driving employee dissatisfaction, motivating employees to voluntarily leave the Department. The inconvenience and perceived “pay cut” involved in working the day shift, pay compression, comparative pay levels, and inability to project future earnings are cited as the concerns/issues with the current compensation package.
• Large majorities of respondents to the active fire and rescue employee survey reported that:
o They will consider other employment options because of the possibility of working the day shift;
o Employees with longer tenure should have higher levels of base pay;
o Their pay levels are not appropriate for their level of responsibility and tenure; and
o They are unable to reasonably estimate their future earnings in five, 10, or 15 years.
• These findings suggest that approaches address the Department’s shift schedule and improve annual compensation, mitigate pay compression, align compensation levels with tenure, and provide a more predictable schedule of future earnings – e.g., a pay scale – may have the greatest effect on improving the Department’s retention experience.
Recruitment
• From a recruitment perspective, the Department continues to maintain a large pipeline of strong recruits.
• Generally, recruits look favorably upon their recruitment process and hold a positive impression of the Department. Nevertheless, nearly 50% of recruits report that they are unsure if they will spend their entire fire and rescue career with the Department.

143 | P a g e
Prince William County Fire and Rescue Compensation Prince William County fire and rescue personnel earn cash compensation through a variety of means including: base pay, retention supplement, holiday pay, and paramedic pay. The following section details how Prince William County fire and rescue personnel earn each of these pay elements.
Career Progression and Base Pay
The Prince William County Department of Fire and Rescue has two non-supervisory positions. New hires begin at the Fire and Rescue Technician I (Technician I) rank during the academy and remain there following graduation. Technician I’s can promote to Fire and Rescue Technician II (Technician II), a non-supervisory, competitive position. First-line supervisory duties are handled by Fire Lieutenants.
Fire & Rescue Personnel Headcount by Rank (12/31/2016)*
Headcount % of Total
F&R Technician I 200 34.2%
F&R Technician II 236 40.3%
F&R Lieutenant 102 17.4%
F&R Captain 34 5.8%
F&R Battalion Chief 9 1.5%
Assistant Fire & Rescue Chief 3 0.5%
Deputy F&R Chief 1 0.2%
Total 585 100.0% * Includes all full-time sworn employees, excluding those who worked less than 2,184 annual hours in CY 2016
Technician I’s enter the pay range at grade PS 13 and receive the pay range minimum of $48,256.
Following graduation from the academy, Technician I’s receive a pro-rated merit increase (e.g., if a merit increase is 3% and the academy is six months, an academy graduate receives a 1.5% increase). After a minimum of two completed years of service, the Technician I is eligible for the non-supervisory, competitive position to Technician II. At the time of promotion, Technician I’s receive a 5% increase in base pay or move to the minimum of grade PS 14, whichever is greater. As of the 12/31/2016 payroll run, most Technician I’s have promoted to Technician II by four years of completed service.
Assuming no additional promotions, Technician II’s will continue through the pay range (PS 14) – through pay-for-performance increases in years in which they are provided – until the pay range maximum is reached ($89,523 as of FY 2018, excluding retention supplement). Competitive

144 | P a g e
promotions to lieutenant and captain result in an increase in base pay of 10% and 5%, as well as movement to the PS 16 and PS 17 pay grades, respectively. Promotions to battalion chief (third-line supervisory) result in a pay increase of 10% (grade PS 19).
The table below illustrates the pay ranges for each uniformed title within the Department:
Prince William County Fire and Rescue Pay Ranges Effective July 1, 2017 – June 30, 2018
Grade Minimum Maximum Maximum + Retention
Supplement F&R Technician I PS 13 $48,256 $81,910 $86,006
F&R Technician II PS 14 $52,749 $89,523 $93,999
F&R Lieutenant PS 16 $63,856 $108,410 $113,831
F&R Captain PS 17 $70,741 $120,120 $125,541
F&R Battalion Chief PS 19 $81,432 $138,258 $143,679
Assistant Fire & Rescue Chief PS 21 $89,794 $152,464 $157,885
Hiring Practices at Entry
Technician I’s begin at the grade PS 13 minimum of $48,256 (FY 2018). There are no recruitment incentives included in base pay.
A one-time bonus of $3,000, paid at graduation from the academy, is available to Advanced Life Support service providers (i.e., paramedics) and recruits who would otherwise be eligible for Technician II based on tenure with another Department.
Additional Compensation
Additional pay premiums received by the majority of fire and rescue personnel include:
• Retention Supplement: After two years of service, all uniformed fire and rescue personnel receive a retention supplement of 5% of base pay capped at 5% of the PS 16 pay range maximum. The retention supplement is considered pensionable compensation and treated as part of base pay in Virginia Retirement System (VRS).
• Holiday Pay: Prince William County fire and rescue personnel in operations receive 12 holidays. Employees on 24-hour shifts receive 2.5x pay (1.5x premium) for 18 hours of pay per holiday. Pay is received regardless of whether or not the 24-hour shift employee worked during the holiday. Employees on the day shift receive 2.5x pay (1.5x premium) if the holiday falls on the employee’s rotating day off. A day of leave is granted if the
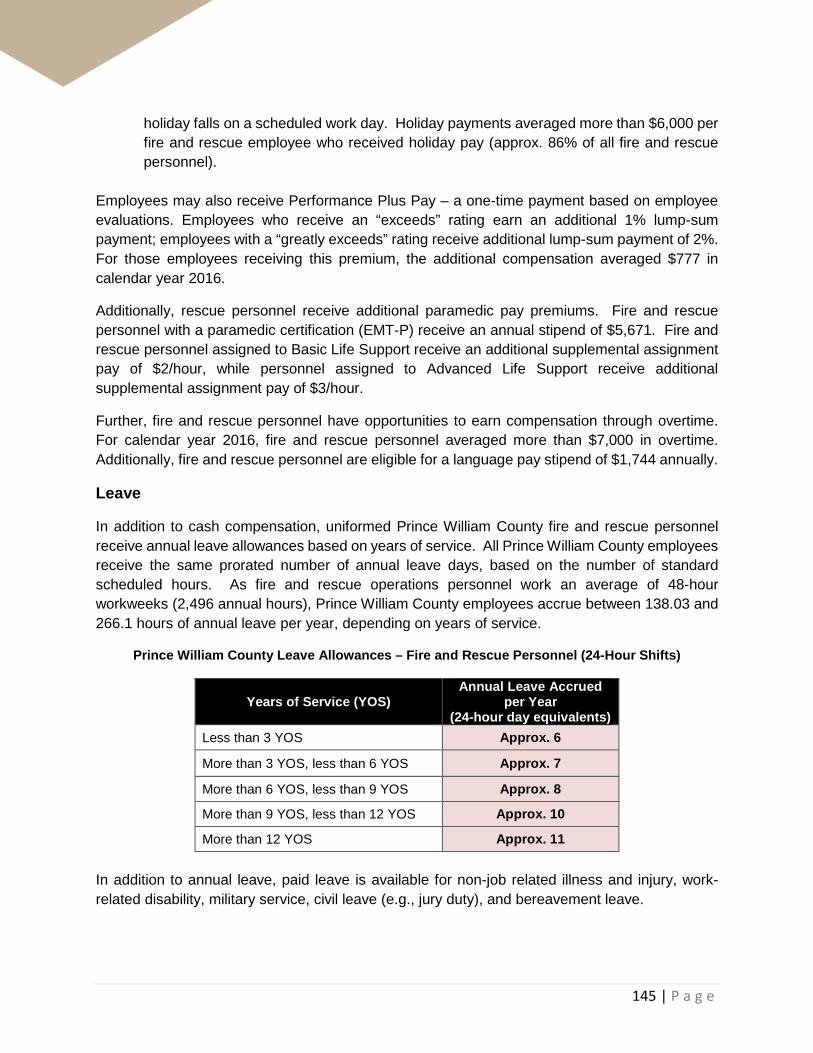
145 | P a g e
holiday falls on a scheduled work day. Holiday payments averaged more than $6,000 per fire and rescue employee who received holiday pay (approx. 86% of all fire and rescue personnel).
Employees may also receive Performance Plus Pay – a one-time payment based on employee evaluations. Employees who receive an “exceeds” rating earn an additional 1% lump-sum payment; employees with a “greatly exceeds” rating receive additional lump-sum payment of 2%. For those employees receiving this premium, the additional compensation averaged $777 in calendar year 2016.
Additionally, rescue personnel receive additional paramedic pay premiums. Fire and rescue personnel with a paramedic certification (EMT-P) receive an annual stipend of $5,671. Fire and rescue personnel assigned to Basic Life Support receive an additional supplemental assignment pay of $2/hour, while personnel assigned to Advanced Life Support receive additional supplemental assignment pay of $3/hour.
Further, fire and rescue personnel have opportunities to earn compensation through overtime. For calendar year 2016, fire and rescue personnel averaged more than $7,000 in overtime. Additionally, fire and rescue personnel are eligible for a language pay stipend of $1,744 annually.
Leave
In addition to cash compensation, uniformed Prince William County fire and rescue personnel receive annual leave allowances based on years of service. All Prince William County employees receive the same prorated number of annual leave days, based on the number of standard scheduled hours. As fire and rescue operations personnel work an average of 48-hour workweeks (2,496 annual hours), Prince William County employees accrue between 138.03 and 266.1 hours of annual leave per year, depending on years of service.
Prince William County Leave Allowances – Fire and Rescue Personnel (24-Hour Shifts)
Years of Service (YOS) Annual Leave Accrued
per Year (24-hour day equivalents)
Less than 3 YOS Approx. 6
More than 3 YOS, less than 6 YOS Approx. 7
More than 6 YOS, less than 9 YOS Approx. 8
More than 9 YOS, less than 12 YOS Approx. 10
More than 12 YOS Approx. 11 In addition to annual leave, paid leave is available for non-job related illness and injury, work-related disability, military service, civil leave (e.g., jury duty), and bereavement leave.

146 | P a g e
Northern Virginia Fire and Rescue Compensation The section that follows provides comparisons of Prince William County fire and rescue compensation with the Northern Virginia comparison group. With more than 560 uniformed personnel, the Prince William County Department of Fire and Rescue is the second largest department in the region.
Fire and Rescue Force Size Northern Virginia Comparison Group21
Number of
Fire/Rescue Personnel*
Population Sworn
Fire/Rescue Personnel Per
100,000* Prince William County 561 455,210 123
Alexandria City 236 155,810 151
Arlington County 280 230,050 122
Loudoun County 486 385,945 126
Fairfax County 1,396 1,138,652 123 * denotes career staff only; does not include volunteers
Base Pay Comparisons
Entry pay is an important factor in generating a pipeline of talented and qualified recruits. At entry, Prince William County entry-level fire and rescue base pay is competitive with the Northern Virginia jurisdictions surveyed. At $48,256, Prince William County ranks 2nd of 5 jurisdictions – trailing only Fairfax County.
Maximum base + longevity represents another important career juncture for analysis. As the highest pay level attained, the pay range maximum often serves as the basis for post-retirement pension calculations. At maximum base pay + longevity (i.e., inclusive of the retention supplement in Prince William County), Prince William County again compares favorably – ranking 2nd of 5 jurisdictions.
Prince William County compares favorably and entry and maximum, even though fire and rescue personnel have fewer annual work appearances than their counterparts in Alexandria, Arlington County, and Fairfax County. The figure on the following page details the pay ranges for each jurisdiction in the comparison group.
21 Sources: U.S. Census Bureau, American Community Survey 2016, 1-Year Estimates Department headcounts as of 7/1/2017 and provided by individual jurisdictions
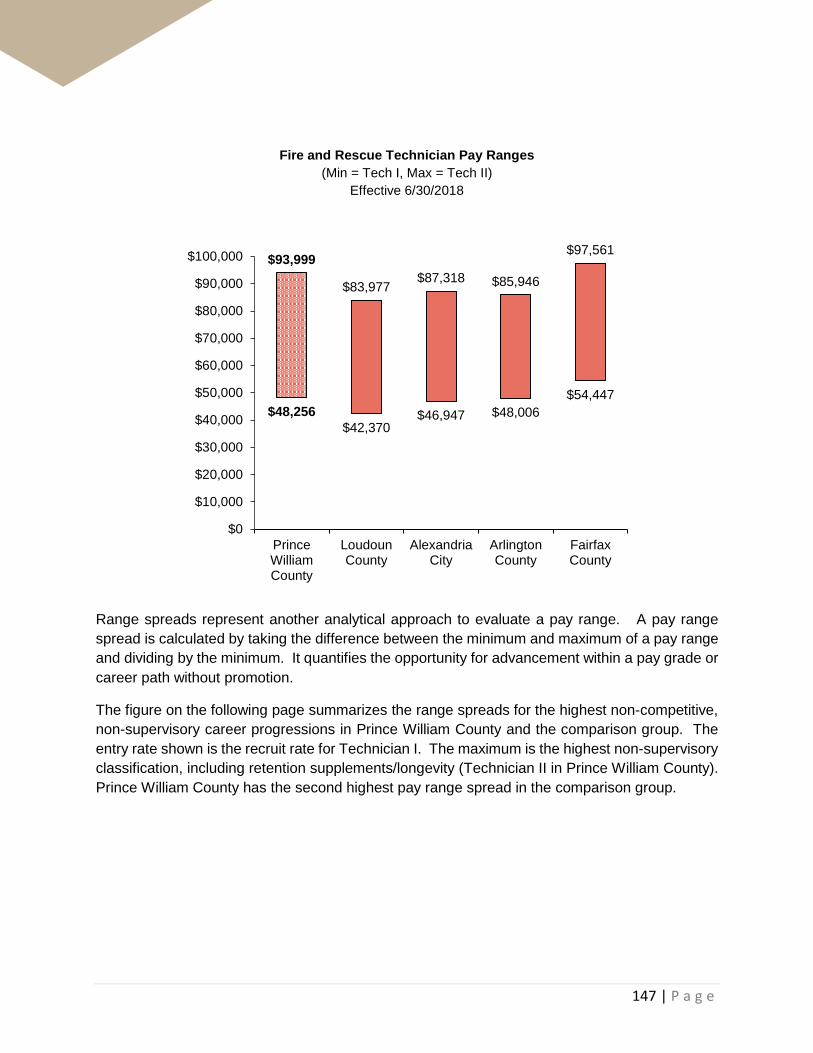
147 | P a g e
Fire and Rescue Technician Pay Ranges (Min = Tech I, Max = Tech II)
Effective 6/30/2018
Range spreads represent another analytical approach to evaluate a pay range. A pay range spread is calculated by taking the difference between the minimum and maximum of a pay range and dividing by the minimum. It quantifies the opportunity for advancement within a pay grade or career path without promotion.
The figure on the following page summarizes the range spreads for the highest non-competitive, non-supervisory career progressions in Prince William County and the comparison group. The entry rate shown is the recruit rate for Technician I. The maximum is the highest non-supervisory classification, including retention supplements/longevity (Technician II in Prince William County). Prince William County has the second highest pay range spread in the comparison group.
$48,256$42,370
$46,947 $48,006$54,447
$93,999
$83,977$87,318 $85,946
$97,561
$0
$10,000
$20,000
$30,000
$40,000
$50,000
$60,000
$70,000
$80,000
$90,000
$100,000
PrinceWilliamCounty
LoudounCounty
AlexandriaCity
ArlingtonCounty
FairfaxCounty

148 | P a g e
Fire Technician Pay Range Spreads (Min = Tech I, Max = Tech II)
Effective 6/30/2018
Looking at pay range maximums and range spreads alone, however, does not reveal the full story of fire technician compensation. Pay ranges and range spreads are measures of wage opportunity, but do not provide insight into earnings at specific career junctures, or average compensation earned over the course of a career. Additionally, they do not reflect the impacts of years where pay-for-performance pay was frozen or other components of compensation received by a large portion of workforce – such as holiday pay.
Total Direct Cash Compensation
To provide additional perspective on Prince William County fire and rescue compensation, the tables that follow detail total direct cash compensation for a full-performance Prince William County fire and rescue technician versus the Northern Virginia comparison group. Total direct cash compensation includes base + longevity/retention supplement, as well as standard pay premiums – including scheduled overtime, where applicable – received by a majority of fire and rescue personnel to provide a more comprehensive picture compensation received by fire technicians.22
The tables that follow summarize shift differential formulas and holiday pay formulas across the Northern Virginia comparison group. No jurisdiction offers uniform allowances to fire and rescue personnel.
22 For more detailed description of methodology used for total direct cash compensation, see chapter on Organization and Report Methodology.
79.0%
79.2%
86.0%
94.8%
98.2%
0.0% 25.0% 50.0% 75.0% 100.0% 125.0%
Arlington County
Fairfax County
Alexandria City
Prince William County
Loudoun County

149 | P a g e
Fairfax County is the only jurisdiction that provides shift differentials to fire/rescue personnel.
Shift Differential Comparisons
Shift Differential
Prince William County -
Alexandria -
Arlington County -
Fairfax County $0.73 – 4:00 PM to 6:59 AM
Loudoun County -
Prince William County fire and rescue personnel on a 24-hour shift receive a very competitive holiday pay benefit relative to the comparison group – the highest number of hours (18) and only one of two jurisdictions that provides a 1.5x premium. One jurisdiction, Loudoun County, operates a day shift with the same hours as Prince William County. Loudoun County fire and rescue personnel on the day shift receive the same compensation formula as employees on 24-hour shifts.
Holidays and Holiday Pay
Number of Holidays Holiday Pay Formula
Prince William County (24-Hour Shift) 12 holidays 18 hours at 2.5x pay (1.5x premium), regardless if
holiday is worked
Prince William County (Day Shift) 12 holidays
12 hours at 2.5x pay (1.5x premium) if holiday is not worked; day of leave if holiday falls on
scheduled work day
Alexandria 11.25 holidays 11.25 hours of straight time, regardless if holiday is worked
Arlington County 12.25 holidays 12 hours of straight time, regardless if holiday is worked
Fairfax County 11.75 holidays 16 hours of pay or leave if working a holiday; 11.2 hours of pay or leave if holiday not worked
Loudoun County (24-hour + day shift) 13.5 holidays 8.5 hours at 2.5x pay (1.5x premium), regardless if
holiday is worked
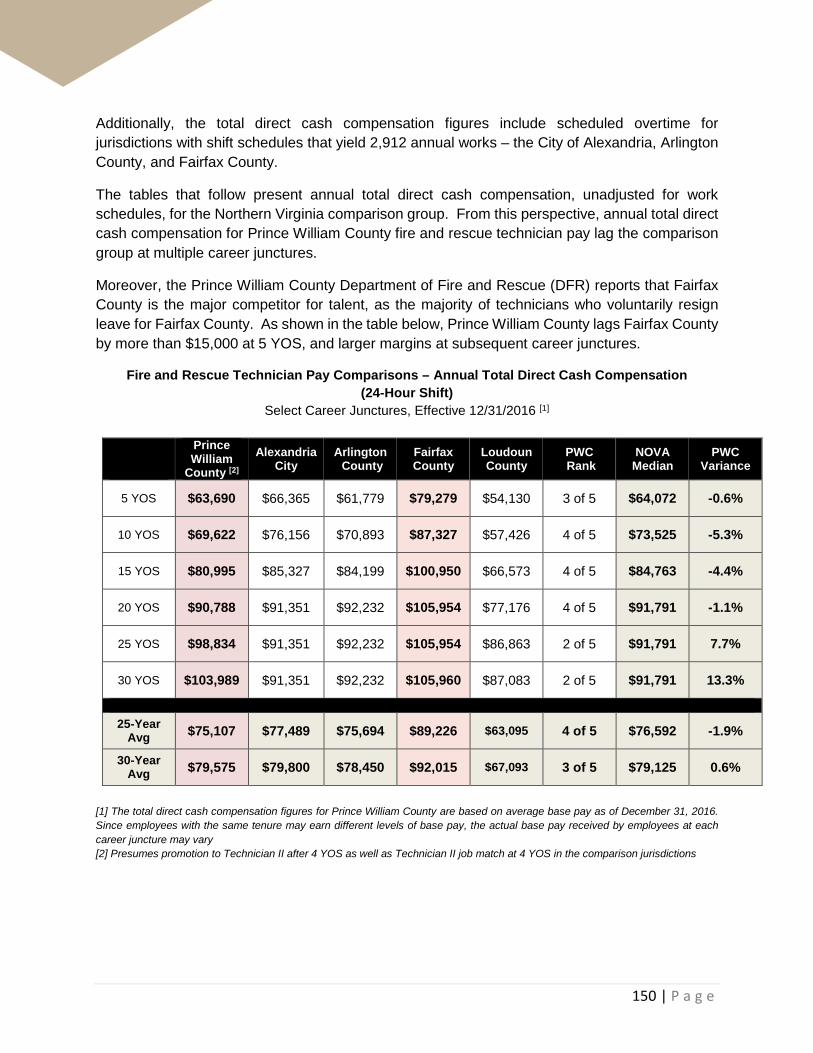
150 | P a g e
Additionally, the total direct cash compensation figures include scheduled overtime for jurisdictions with shift schedules that yield 2,912 annual works – the City of Alexandria, Arlington County, and Fairfax County.
The tables that follow present annual total direct cash compensation, unadjusted for work schedules, for the Northern Virginia comparison group. From this perspective, annual total direct cash compensation for Prince William County fire and rescue technician pay lag the comparison group at multiple career junctures.
Moreover, the Prince William County Department of Fire and Rescue (DFR) reports that Fairfax County is the major competitor for talent, as the majority of technicians who voluntarily resign leave for Fairfax County. As shown in the table below, Prince William County lags Fairfax County by more than $15,000 at 5 YOS, and larger margins at subsequent career junctures.
Fire and Rescue Technician Pay Comparisons – Annual Total Direct Cash Compensation (24-Hour Shift)
Select Career Junctures, Effective 12/31/2016 [1]
Prince William
County [2] Alexandria
City Arlington County
Fairfax County
Loudoun County
PWC Rank
NOVA Median
PWC Variance
5 YOS $63,690 $66,365 $61,779 $79,279 $54,130 3 of 5 $64,072 -0.6%
10 YOS $69,622 $76,156 $70,893 $87,327 $57,426 4 of 5 $73,525 -5.3%
15 YOS $80,995 $85,327 $84,199 $100,950 $66,573 4 of 5 $84,763 -4.4%
20 YOS $90,788 $91,351 $92,232 $105,954 $77,176 4 of 5 $91,791 -1.1%
25 YOS $98,834 $91,351 $92,232 $105,954 $86,863 2 of 5 $91,791 7.7%
30 YOS $103,989 $91,351 $92,232 $105,960 $87,083 2 of 5 $91,791 13.3%
25-Year
Avg $75,107 $77,489 $75,694 $89,226 $63,095 4 of 5 $76,592 -1.9%
30-Year Avg $79,575 $79,800 $78,450 $92,015 $67,093 3 of 5 $79,125 0.6%
[1] The total direct cash compensation figures for Prince William County are based on average base pay as of December 31, 2016. Since employees with the same tenure may earn different levels of base pay, the actual base pay received by employees at each career juncture may vary [2] Presumes promotion to Technician II after 4 YOS as well as Technician II job match at 4 YOS in the comparison jurisdictions

151 | P a g e
Fire and Rescue Technician Pay Comparisons – Annual Total Direct Cash Compensation (24-Hour Shift) Effective 12/31/2016
Prince William
County Alexandria
City Arlington County
Fairfax County
Loudoun County PWC Rank NOVA
Median PWC Variance
($ Amount) Year 1 $50,969 $50,245 $51,518 $59,506 $43,722 3 of 5 $50,881 $88 Year 2 $53,709 $52,757 $53,836 $62,440 $45,033 3 of 5 $53,296 $412 Year 3 $56,411 $58,160 $55,722 $65,524 $46,384 3 of 5 $56,941 -$529 Year 4 $57,116 $61,067 $57,672 $68,738 $47,776 4 of 5 $59,369 -$2,253 Year 5 $61,078 $64,120 $59,690 $71,982 $54,130 3 of 5 $61,905 -$827 Year 6 $63,690 $66,365 $61,779 $79,279 $54,130 3 of 5 $64,072 -$383 Year 7 $65,473 $68,688 $63,942 $79,279 $54,130 3 of 5 $66,315 -$842 Year 8 $67,249 $71,093 $66,180 $79,279 $54,130 3 of 5 $68,636 -$1,388 Year 9 $67,276 $71,093 $66,180 $79,279 $54,130 3 of 5 $68,636 -$1,361 Year 10 $68,548 $73,580 $68,496 $83,205 $55,754 3 of 5 $71,038 -$2,491 Year 11 $69,622 $76,156 $70,893 $87,327 $57,426 4 of 5 $73,525 -$3,903 Year 12 $70,919 $77,907 $73,375 $91,655 $59,149 4 of 5 $75,641 -$4,722 Year 13 $72,130 $79,700 $75,943 $96,200 $60,924 4 of 5 $77,821 -$5,691 Year 14 $74,780 $81,532 $78,601 $96,200 $62,751 4 of 5 $80,066 -$5,286 Year 15 $77,050 $83,408 $81,352 $96,200 $64,634 4 of 5 $82,380 -$5,329 Year 16 $80,995 $85,327 $84,199 $100,950 $66,573 4 of 5 $84,763 -$3,768 Year 17 $82,209 $87,289 $87,146 $100,950 $68,570 4 of 5 $87,218 -$5,009 Year 18 $88,244 $89,295 $90,196 $100,950 $70,627 4 of 5 $89,745 -$1,502 Year 19 $89,220 $91,351 $92,232 $100,950 $72,746 4 of 5 $91,791 -$2,572 Year 20 $90,788 $91,351 $92,232 $100,950 $74,928 4 of 5 $91,791 -$1,003 Year 21 $91,205 $91,351 $92,232 $105,954 $77,176 4 of 5 $91,791 -$586 Year 22 $92,356 $91,351 $92,232 $105,960 $79,491 2 of 5 $91,791 $565 Year 23 $93,935 $91,351 $92,232 $105,960 $81,876 2 of 5 $91,791 $2,144 Year 24 $95,540 $91,351 $92,232 $105,960 $84,333 2 of 5 $91,791 $3,749 Year 25 $97,173 $91,351 $92,232 $105,960 $86,863 2 of 5 $91,791 $5,382 Year 26 $98,834 $91,351 $92,232 $105,954 $87,083 2 of 5 $91,791 $7,043 Year 27 $100,523 $91,351 $92,232 $105,960 $87,083 2 of 5 $91,791 $8,732 Year 28 $102,241 $91,351 $92,232 $105,960 $87,083 2 of 5 $91,791 $10,450 Year 29 $103,989 $91,351 $92,232 $105,960 $87,083 2 of 5 $91,791 $12,198 Year 30 $103,989 $91,351 $92,232 $105,960 $87,083 2 of 5 $91,791 $12,198 25-Year Avg $75,107 $77,489 $75,694 $89,226 $63,095 4 of 5 $76,592 -$1,484 30-Year Avg $79,575 $79,800 $78,450 $92,015 $67,093 3 of 5 $79,125 $451

152 | P a g e
Total direct cash compensation per net hour worked provides another perspective to evaluate fire and rescue compensation, accounting for differences in work schedules. To calculate total direct cash compensation per net hour worked, total direct cash compensation is divided by net hours worked.23
The table below details the shift schedules in each jurisdiction. Prince William County is the only Department in the comparison group with a shift schedule that yields 2,496 annual hours. Alexandria, Arlington County, and Fairfax County work shift schedules yielding 2,912 annual hours. Fire and rescue personnel in these Departments are required to make more annual appearances. Conversely, in Loudoun County, fire and rescue personnel work shift schedules yielding 2,184 hour and are required to make fewer appearances.
Fire and Rescue Shift Schedules
Hours per Shift
Annual Hours Schedule
Prince William County (24-hour) 24 2,496 24 hours on, 48 hours off
+ Kelly Day Prince William County (Day Shift) 12 2,496 4 days on, weekends off, rotating
day off during week
Alexandria 24 2,912 24 hours on; 24 hours off; 24 hours
on; 24 hours off; 24 hours on; 96 hours off
Arlington County 24 2,912 24 hours on; 24 hours off; 24 hours
on; 24 hours off; 24 hours on; 96 hours off
Fairfax County 24 2,912 24 hours on; 24 hours off; 24 hours
on; 24 hours off; 24 hours on; 96 hours off
Loudoun County (24-hour) 24 2,184 24 hours on, 72 hours off
Loudoun County (Day Shift)* 12 2,184
4 days on, weekends off, rotating day off during week (10-week rotation, 2
days worked in final week of rotation)
* Loudoun County also has a 7/12 with a constant two-week rotation
23 For more detailed description of methodology used for total direct cash compensation per net hour worked, see chapter on Organization and Report Methodology.

153 | P a g e
The table below details annual leave accruals for fire and rescue personnel in the Northern Virginia comparison group.
Annual Leave & Personal Schedules (Fire and Rescue)
Hours of Annual Leave
Prince William County 125 hours in Year 1, maximum of 250 hours in Year 13
Alexandria 156 hours in Year 1, maximum of 300 hours in Year 13
Arlington County 104 hours in Year 1, maximum of 208 hours in Year 13
Fairfax County 146 hours in Year 1, maximum of 291 hours in Year 17
Loudoun County 104 hours in Year 1, maximum of 206 hours in Year 12
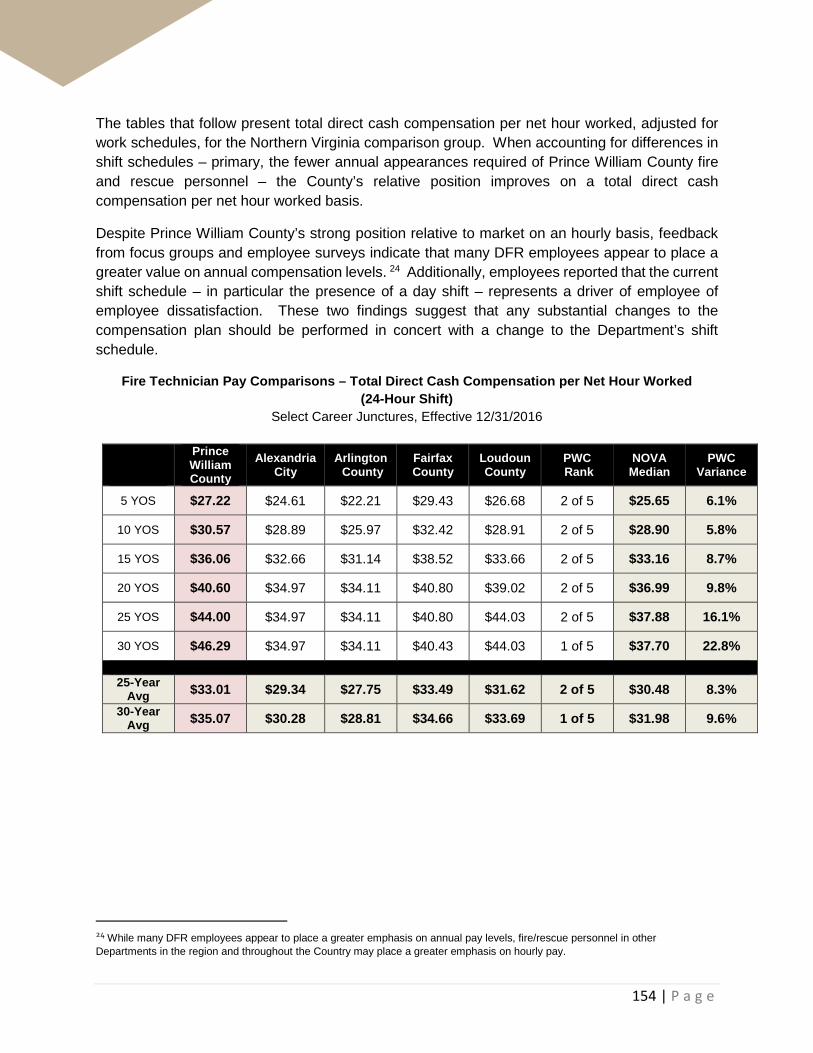
154 | P a g e
The tables that follow present total direct cash compensation per net hour worked, adjusted for work schedules, for the Northern Virginia comparison group. When accounting for differences in shift schedules – primary, the fewer annual appearances required of Prince William County fire and rescue personnel – the County’s relative position improves on a total direct cash compensation per net hour worked basis.
Despite Prince William County’s strong position relative to market on an hourly basis, feedback from focus groups and employee surveys indicate that many DFR employees appear to place a greater value on annual compensation levels. 24 Additionally, employees reported that the current shift schedule – in particular the presence of a day shift – represents a driver of employee of employee dissatisfaction. These two findings suggest that any substantial changes to the compensation plan should be performed in concert with a change to the Department’s shift schedule.
Fire Technician Pay Comparisons – Total Direct Cash Compensation per Net Hour Worked (24-Hour Shift)
Select Career Junctures, Effective 12/31/2016
Prince William County
Alexandria City
Arlington County
Fairfax County
Loudoun County
PWC Rank
NOVA Median
PWC Variance
5 YOS $27.22 $24.61 $22.21 $29.43 $26.68 2 of 5 $25.65 6.1%
10 YOS $30.57 $28.89 $25.97 $32.42 $28.91 2 of 5 $28.90 5.8%
15 YOS $36.06 $32.66 $31.14 $38.52 $33.66 2 of 5 $33.16 8.7%
20 YOS $40.60 $34.97 $34.11 $40.80 $39.02 2 of 5 $36.99 9.8%
25 YOS $44.00 $34.97 $34.11 $40.80 $44.03 2 of 5 $37.88 16.1%
30 YOS $46.29 $34.97 $34.11 $40.43 $44.03 1 of 5 $37.70 22.8%
25-Year
Avg $33.01 $29.34 $27.75 $33.49 $31.62 2 of 5 $30.48 8.3%
30-Year Avg $35.07 $30.28 $28.81 $34.66 $33.69 1 of 5 $31.98 9.6%
24 While many DFR employees appear to place a greater emphasis on annual pay levels, fire/rescue personnel in other Departments in the region and throughout the Country may place a greater emphasis on hourly pay.

155 | P a g e
Fire Technician Pay Comparisons – Total Direct Cash Compensation per Net Hour Worked (24-Hour Shift) Effective 12/31/2016
Prince William County
Alexandria City
Arlington County
Fairfax County
Loudoun County PWC Rank NOVA
Median PWC
Variance ($ Amount)
Year 1 $21.50 $18.23 $18.35 $21.51 $21.11 2 of 5 $19.73 $1.77 Year 2 $22.65 $19.23 $19.17 $22.57 $21.83 1 of 5 $20.53 $2.12 Year 3 $23.79 $21.29 $19.84 $23.69 $22.58 1 of 5 $21.93 $1.86 Year 4 $24.41 $22.45 $20.73 $25.52 $23.35 2 of 5 $22.90 $1.51 Year 5 $26.10 $23.67 $21.46 $26.72 $26.57 3 of 5 $25.12 $0.98 Year 6 $27.22 $24.61 $22.21 $29.43 $26.68 2 of 5 $25.65 $1.57 Year 7 $28.36 $25.59 $23.20 $29.43 $26.79 2 of 5 $26.19 $2.17 Year 8 $29.13 $26.60 $24.01 $29.43 $26.90 2 of 5 $26.75 $2.37 Year 9 $29.14 $26.72 $24.01 $29.43 $27.02 2 of 5 $26.87 $2.27 Year 10 $30.10 $27.78 $25.09 $30.89 $27.95 2 of 5 $27.86 $2.23 Year 11 $30.57 $28.89 $25.97 $32.42 $28.91 2 of 5 $28.90 $1.67 Year 12 $31.14 $29.69 $26.88 $34.03 $29.90 2 of 5 $29.80 $1.34 Year 13 $32.11 $30.51 $28.09 $35.71 $30.80 2 of 5 $30.65 $1.46 Year 14 $33.29 $31.21 $29.07 $35.71 $31.72 2 of 5 $31.47 $1.82 Year 15 $34.30 $31.93 $30.09 $35.71 $32.68 2 of 5 $32.30 $2.00 Year 16 $36.06 $32.66 $31.14 $38.52 $33.66 2 of 5 $33.16 $2.90 Year 17 $36.60 $33.41 $32.23 $38.52 $34.67 2 of 5 $34.04 $2.56 Year 18 $39.28 $34.18 $33.36 $38.52 $35.71 1 of 5 $34.94 $4.34 Year 19 $39.72 $34.97 $34.11 $38.52 $36.78 1 of 5 $35.87 $3.84 Year 20 $40.41 $34.97 $34.11 $38.52 $37.88 1 of 5 $36.42 $3.99 Year 21 $40.60 $34.97 $34.11 $40.80 $39.02 2 of 5 $36.99 $3.61 Year 22 $41.11 $34.97 $34.11 $40.43 $40.19 1 of 5 $37.58 $3.54 Year 23 $41.82 $34.97 $34.11 $40.43 $41.39 1 of 5 $37.70 $4.12 Year 24 $42.53 $34.97 $34.11 $40.43 $42.64 2 of 5 $37.70 $4.83 Year 25 $43.26 $34.97 $34.11 $40.43 $43.91 2 of 5 $37.70 $5.56 Year 26 $44.00 $34.97 $34.11 $40.80 $44.03 2 of 5 $37.88 $6.11 Year 27 $44.75 $34.97 $34.11 $40.43 $44.03 1 of 5 $37.70 $7.05 Year 28 $45.51 $34.97 $34.11 $40.43 $44.03 1 of 5 $37.70 $7.81 Year 29 $46.29 $34.97 $34.11 $40.43 $44.03 1 of 5 $37.70 $8.59 Year 30 $46.29 $34.97 $34.11 $40.43 $44.03 1 of 5 $37.70 $8.59 25-Year Avg $33.01 $29.34 $27.75 $33.49 $31.62 2 of 5 $30.48 $2.66 30-Year Avg $35.07 $30.28 $28.81 $34.66 $33.69 1 of 5 $31.98 $3.49
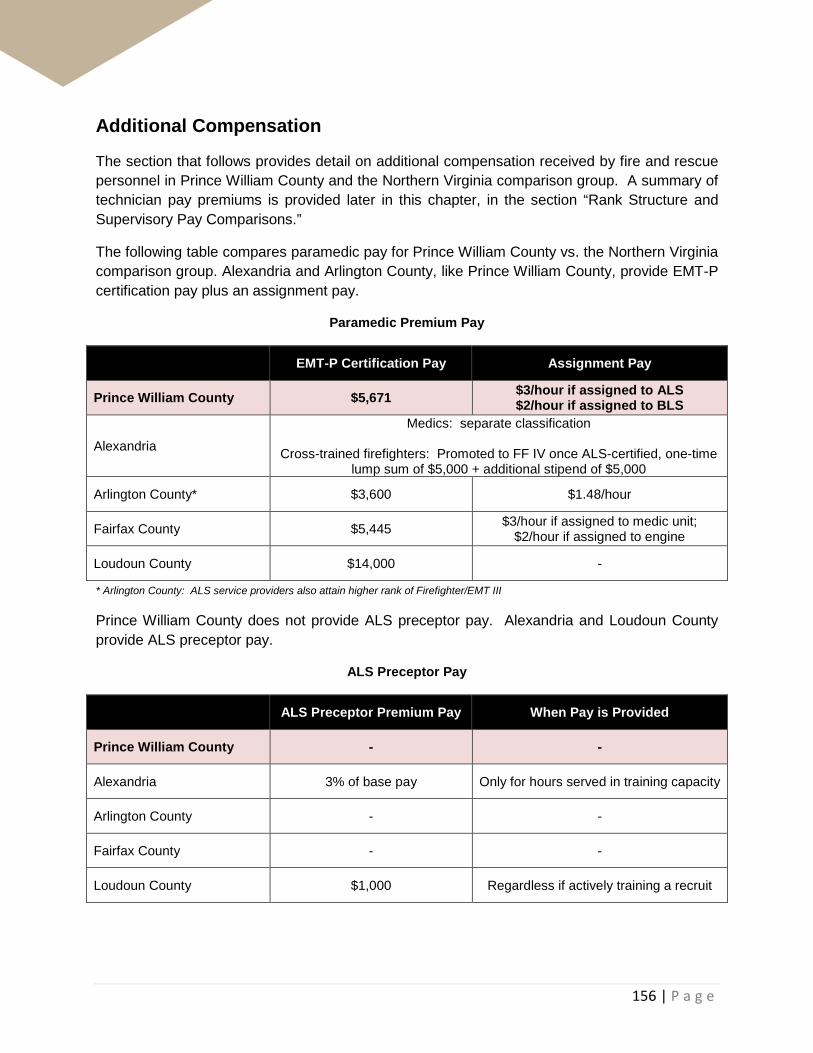
156 | P a g e
Additional Compensation
The section that follows provides detail on additional compensation received by fire and rescue personnel in Prince William County and the Northern Virginia comparison group. A summary of technician pay premiums is provided later in this chapter, in the section “Rank Structure and Supervisory Pay Comparisons.”
The following table compares paramedic pay for Prince William County vs. the Northern Virginia comparison group. Alexandria and Arlington County, like Prince William County, provide EMT-P certification pay plus an assignment pay.
Paramedic Premium Pay
EMT-P Certification Pay Assignment Pay
Prince William County $5,671 $3/hour if assigned to ALS $2/hour if assigned to BLS
Alexandria
Medics: separate classification
Cross-trained firefighters: Promoted to FF IV once ALS-certified, one-time lump sum of $5,000 + additional stipend of $5,000
Arlington County* $3,600 $1.48/hour
Fairfax County $5,445 $3/hour if assigned to medic unit; $2/hour if assigned to engine
Loudoun County $14,000 -
* Arlington County: ALS service providers also attain higher rank of Firefighter/EMT III
Prince William County does not provide ALS preceptor pay. Alexandria and Loudoun County provide ALS preceptor pay.
ALS Preceptor Pay
ALS Preceptor Premium Pay When Pay is Provided
Prince William County - -
Alexandria 3% of base pay Only for hours served in training capacity
Arlington County - -
Fairfax County - -
Loudoun County $1,000 Regardless if actively training a recruit

157 | P a g e
Only one Department in the comparison group – Loudoun County – provides an education incentive. No Department provides an education differential for new hires with a college degree.
Education Incentive Pay
Education Incentive Pay
Prince William County -
Alexandria -
Arlington County -
Fairfax County -
Loudoun County
5.0% if earned bachelor’s degree directly related to job after joining the Department; if bachelor’s
degree at time of hire no additional pay differential
As illustrated in the table below, Arlington County and Prince William County are the only Departments that provide language pay to fire/rescue personnel.
Language Pay Comparisons
Language Pay
Prince William County 5% of base at time of hire or $1,752.04/year (Spanish only)
Alexandria -
Arlington County $0.68/hr; $1,414/yr (Spanish only)
Fairfax County -
Loudoun County -
Hiring Practices at Entry
Hiring practices for fire and rescue personnel are generally consistent across the comparison group. The standard practice is for new employees to be hired at the pay range minimum.
One jurisdiction – Fairfax County – reported offering recruitment incentives to paramedics. Fairfax County firefighter medic recruits receive a two-step increase in pay (along with certification and assignment pay) following the completion of their internship and being authorized by the operations medical director.
158 | P a g e
Rank Structure & Supervisory Pay Comparisons
In focus group meetings and employee surveys, multiple employees highlighted the Department’s lack of technical certification pays. The section that follows outlines non-supervisory career path options available to fire and rescue personnel in the region, as well as supervisory pay comparisons.
Non-Supervisory Career Path
Approximately 75% of DFR employees are non-supervisory fire and rescue technicians (Technician I and II).25 Many regional fire and rescue departments create career paths for fire and rescue personnel to grow in both pay and duties without assuming a supervisory role. Maintaining such a career path allows for fire and rescue personnel to grow in both pay and duties, as well as, encourages personnel to stay with a department through the duration of a career.
In Prince William County, fire and rescue technicians may stay at the Technician I level for the duration of a career. In practice, however, most Technician I’s promote to Technician II by four years of service with the Department. At DFR, the Technician II classification acts as an “officer in charge” in the absence of a supervisory officer. Among the comparison jurisdictions, equivalent Technician II’s also serve as “officers in charge.” However, the frequency with which a DFR Technician II serves in an officer-in-charge capacity appears to be higher than in other regional Departments.
The promotional differential for a Technician II is 5%. Fairfax County has a differential of up to 10% (5% if fewer than 5 YOS) and Loudoun County has a 10% differential for their promotional, non-supervisory fire and rescue technician job classification. Arlington County and Alexandria do not have separate promotional, non-supervisory ranks equivalent to DFR’s Technician II, but fire/rescue personnel receive non-competitive 5% wage increases – in addition to pay-for-performance increases – within the first two years of service.
Additionally, as detailed in the tables that follow, all jurisdictions except for Prince William County, provide the opportunity to earn technician certifications or possess a non-competitive, non-supervisory rank/classification in their non-supervisory firefighter/paramedic career progression. Of note, Fairfax County requires technician certifications as a requirement for promotion to their fire technician/master fire technician positions.
25 As of 12/31/2016 departmental payroll run.

159 | P a g e
Fire and Rescue Non-Supervisory Career Path
Non-Competitive, Non-Supervisory Ranks
Competitive, Non-Supervisory Rank
Prince William County
Fire and Rescue Technician I
- - Fire and Rescue Technician II 2 YOS & Competitive Process
Alexandria City Firefighter I Firefighter II 2 YOS as Firefighter I
Firefighter III Obtain special operations certification
Firefighter IV EMT-P dual role provider
-
Arlington County Firefighter/EMT II Firefighter/EMT II 2 YOS as Firefighter/EMT I
Firefighter/EMT III FF/EMT II + EMT-P - -
Fairfax County Firefighter Firefighter/Medic EMT-P certification - -
Fire Technician & Master Fire Technician Obtain special operations certification or specialize in an area
Loudoun County Firefighter/EMT - - - Fire-Rescue Technician
Fire and Rescue Technical Certifications
Technician Certifications
Prince William County -
Alexandria
FF IVs who are dual service provides eligible for 3% certification pay for one certification; Employees who are in fire suppression only (FF II) can move to a separate rank (FF III) with a technical certification
(e.g., HazMat, Technical Rescue, Marine Operations)
Arlington County
Value added Fire Marshal, HazMat, Instructor, SCBA Repair, Tech
Rescue ($546)
Fire Marshal Tech, HazMat Tech, Tech Rescue Tech, Training Instructor I, ($1,429 annually)
Certified Bomb Specialist, Fire Marshal Specialist, HazMat Specialist,
Tech Rescue Specialist, Training Instructor II/III ($2,885 annually)
Fairfax County Firefighters with certain specialty certifications (e.g., HazMat and TROT) eligible for Fire Technician classification at a higher pay grade
Loudoun County Tech premiums provided: HazMat Technician ($1,500 annually),
HazMat Specialist ($2,500 annually), Swift Water Technician ($1,500 annually), SCBA Repair Technician ($1,500)
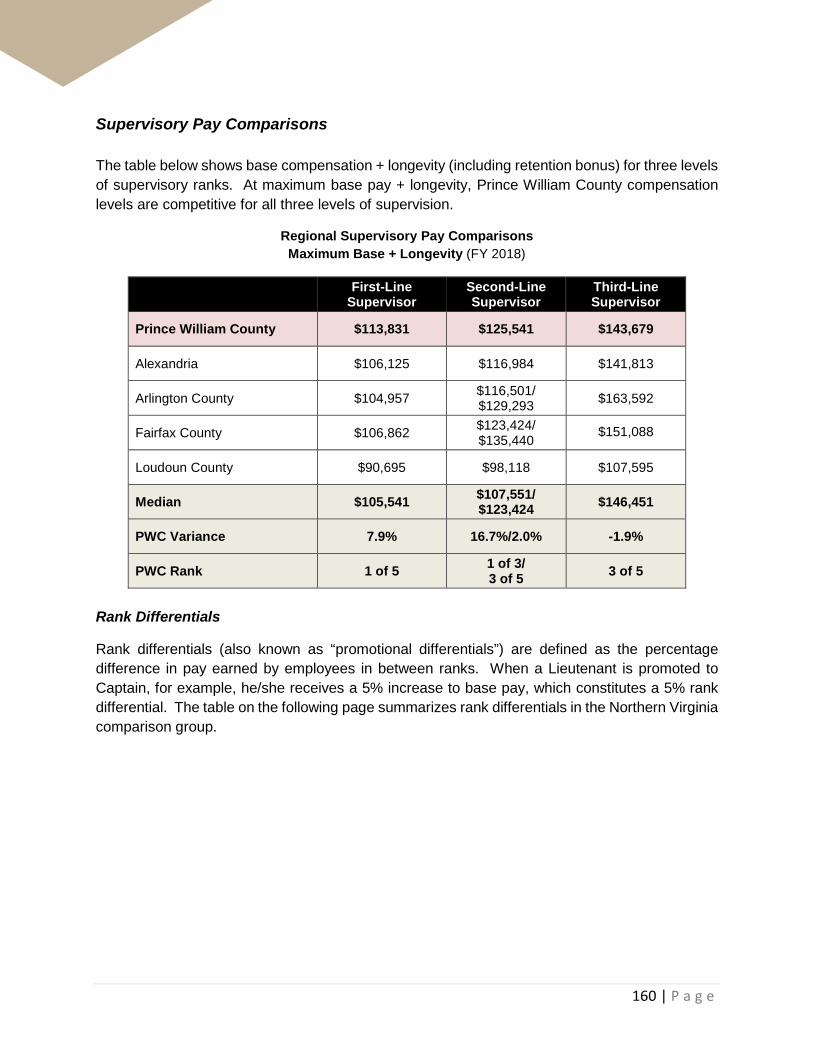
160 | P a g e
Supervisory Pay Comparisons The table below shows base compensation + longevity (including retention bonus) for three levels of supervisory ranks. At maximum base pay + longevity, Prince William County compensation levels are competitive for all three levels of supervision.
Regional Supervisory Pay Comparisons Maximum Base + Longevity (FY 2018)
First-Line Supervisor
Second-Line Supervisor
Third-Line Supervisor
Prince William County $113,831 $125,541 $143,679
Alexandria $106,125 $116,984 $141,813
Arlington County $104,957 $116,501/ $129,293 $163,592
Fairfax County $106,862 $123,424/ $135,440 $151,088
Loudoun County $90,695 $98,118 $107,595
Median $105,541 $107,551/ $123,424 $146,451
PWC Variance 7.9% 16.7%/2.0% -1.9%
PWC Rank 1 of 5 1 of 3/ 3 of 5 3 of 5
Rank Differentials
Rank differentials (also known as “promotional differentials”) are defined as the percentage difference in pay earned by employees in between ranks. When a Lieutenant is promoted to Captain, for example, he/she receives a 5% increase to base pay, which constitutes a 5% rank differential. The table on the following page summarizes rank differentials in the Northern Virginia comparison group.

161 | P a g e
Fire and Rescue Rank Differentials
First-Line Supervisor Second-Line Supervisor Third-Line Supervisor
Prince William County
Lieutenant: 10.0% over Technician II
Captain: 5.0% over Lieutenant
Battalion Chief: 10.0% over Captain
Alexandria Lieutenant: 15.8% over FF III; 21.5% over FF II
Captain: 10.2% over Lieutenant
Battalion Chief: 21.2% over Captain
Arlington County Lieutenant: 10.0% over
FF/EMT III; 15.0% over FF/EMT II
Captain I: 10.0% over Lieutenant;
Captain II: 10% over Captain I
Battalion Chief: 10.0% over Captain II
Fairfax County Lieutenant: 15.0% over Tech; 10.0% over Master Tech
Captain I: 15.5% over Lieutenant
Captain II: 9.7% over Captain I
Battalion Chief: 11.6% over Captain II
Loudoun County Lieutenant: 10.0% over Fire Technician
Captain: 10.0% over Lieutenant
Battalion Chief: 10.0% over Lieutenant
Overtime Differentials
The table on the following page details overtime differentials earned by rank in each of the Northern Virginia jurisdictions surveyed.
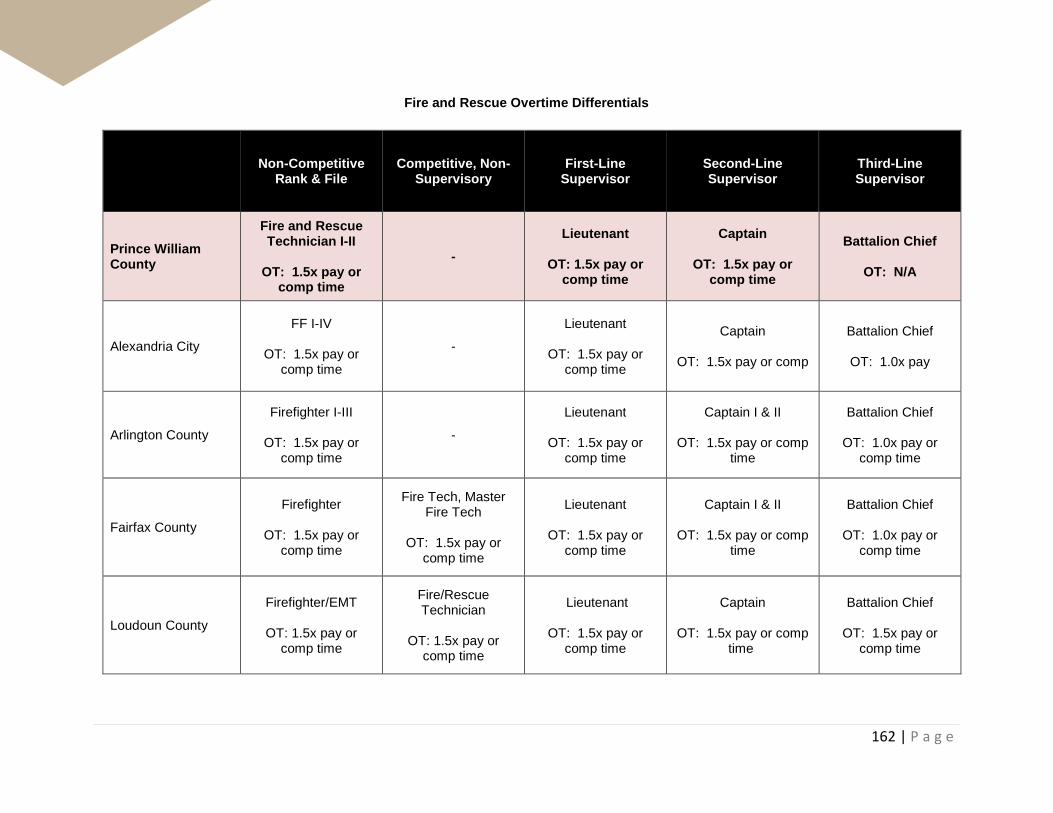
162 | P a g e
Fire and Rescue Overtime Differentials
Non-Competitive Rank & File
Competitive, Non-Supervisory
First-Line Supervisor
Second-Line Supervisor
Third-Line Supervisor
Prince William County
Fire and Rescue Technician I-II
OT: 1.5x pay or
comp time
- Lieutenant
OT: 1.5x pay or
comp time
Captain
OT: 1.5x pay or comp time
Battalion Chief
OT: N/A
Alexandria City
FF I-IV
OT: 1.5x pay or comp time
-
Lieutenant
OT: 1.5x pay or comp time
Captain
OT: 1.5x pay or comp
Battalion Chief
OT: 1.0x pay
Arlington County
Firefighter I-III
OT: 1.5x pay or comp time
-
Lieutenant
OT: 1.5x pay or comp time
Captain I & II
OT: 1.5x pay or comp time
Battalion Chief
OT: 1.0x pay or comp time
Fairfax County
Firefighter
OT: 1.5x pay or comp time
Fire Tech, Master Fire Tech
OT: 1.5x pay or
comp time
Lieutenant
OT: 1.5x pay or comp time
Captain I & II
OT: 1.5x pay or comp time
Battalion Chief
OT: 1.0x pay or comp time
Loudoun County
Firefighter/EMT
OT: 1.5x pay or comp time
Fire/Rescue Technician
OT: 1.5x pay or
comp time
Lieutenant
OT: 1.5x pay or comp time
Captain
OT: 1.5x pay or comp time
Battalion Chief
OT: 1.5x pay or comp time

163 | P a g e
Retention of Fire and Rescue Personnel This section focuses on two principal types of employee separations – voluntary resignations and service retirements. Voluntary resignations – or “quits” – refer to individuals who resign from the Department before becoming eligible for an unreduced pension benefit. Service retirements refer to individuals who separate from the Department after becoming eligible for an unreduced pension benefit, and leave the Department to start a second career, or leave the workforce all together.
Additionally, retention is evaluated through the lens of two metrics:
• Turnover Rate: percentage of employees who leave the Department for all reasons (e.g., quits, service retirements, medical retirements, terminations, resignations in lieu of termination, voluntary demotions, and death)
• Quit Rate: percentage of employees who voluntarily resign, or quit, from the Department
Quits vs. Retirements
Departments may face different retention challenges – and require differing solutions – depending on the structural forces driving attrition trends. The table on the following page details all uniformed personnel in the Department of Fire and Rescue by year of service as of 12/31/2016. Prince William County’s Fire and Rescue Department is a relatively “younger” Department – i.e., over three-quarters (77.8%) of fire and rescue technicians (Technician I and II) have fewer than 10 years of service with the Department. As such, a smaller proportion of employees are approaching normal service retirement age.
The Virginia Retirement System provides a normal service retirement at 25 years of service, and as illustrated in the table on the following page, only 16.5% (72 of 436) of fire and rescue technicians (Technician I and II) are within 10 years of normal service retirement. While many public sector agencies – and some public safety agencies – are facing a “retirement bubble” where a large percentage of the workforce is either eligible or soon-to-be eligible for retirement, this is not the case with the Prince William County Department of Fire and Rescue.
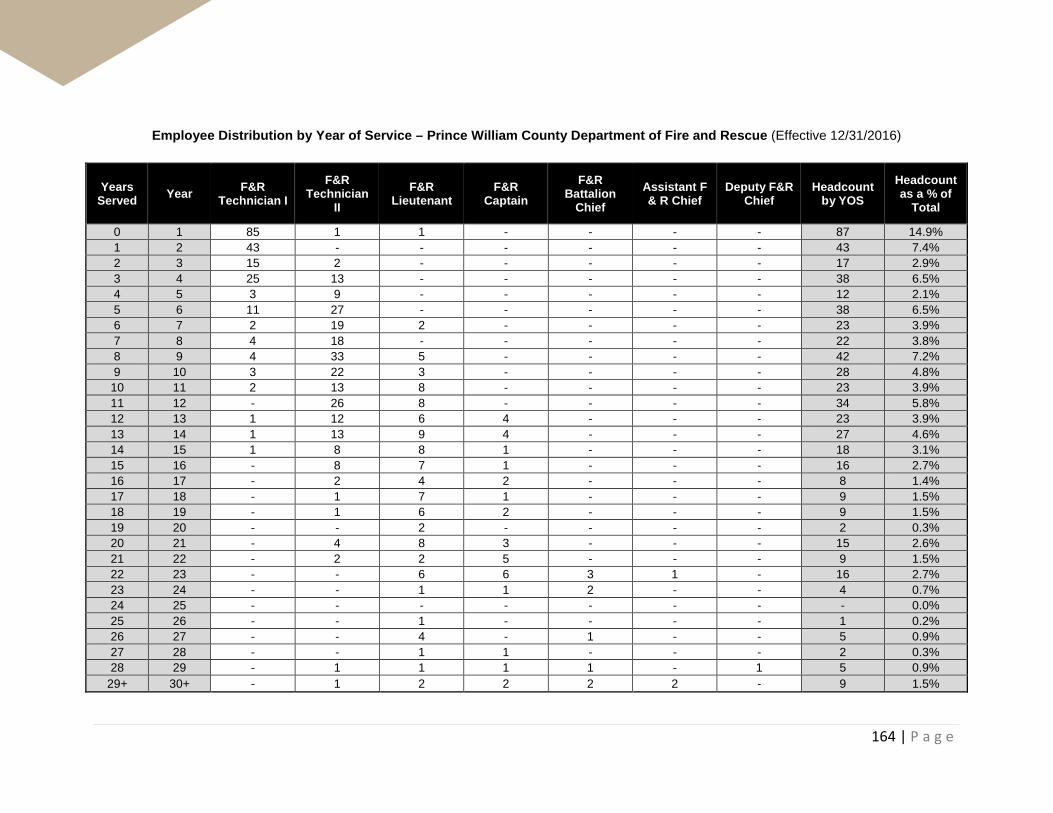
164 | P a g e
Employee Distribution by Year of Service – Prince William County Department of Fire and Rescue (Effective 12/31/2016)
Years Served Year F&R
Technician I F&R
Technician II
F&R Lieutenant
F&R Captain
F&R Battalion
Chief Assistant F & R Chief
Deputy F&R Chief
Headcount by YOS
Headcount as a % of
Total
0 1 85 1 1 - - - - 87 14.9% 1 2 43 - - - - - - 43 7.4% 2 3 15 2 - - - - - 17 2.9% 3 4 25 13 - - - - - 38 6.5% 4 5 3 9 - - - - - 12 2.1% 5 6 11 27 - - - - - 38 6.5% 6 7 2 19 2 - - - - 23 3.9% 7 8 4 18 - - - - - 22 3.8% 8 9 4 33 5 - - - - 42 7.2% 9 10 3 22 3 - - - - 28 4.8% 10 11 2 13 8 - - - - 23 3.9% 11 12 - 26 8 - - - - 34 5.8% 12 13 1 12 6 4 - - - 23 3.9% 13 14 1 13 9 4 - - - 27 4.6% 14 15 1 8 8 1 - - - 18 3.1% 15 16 - 8 7 1 - - - 16 2.7% 16 17 - 2 4 2 - - - 8 1.4% 17 18 - 1 7 1 - - - 9 1.5% 18 19 - 1 6 2 - - - 9 1.5% 19 20 - - 2 - - - - 2 0.3% 20 21 - 4 8 3 - - - 15 2.6% 21 22 - 2 2 5 - - - 9 1.5% 22 23 - - 6 6 3 1 - 16 2.7% 23 24 - - 1 1 2 - - 4 0.7% 24 25 - - - - - - - - 0.0% 25 26 - - 1 - - - - 1 0.2% 26 27 - - 4 - 1 - - 5 0.9% 27 28 - - 1 1 - - - 2 0.3% 28 29 - 1 1 1 1 - 1 5 0.9%
29+ 30+ - 1 2 2 2 2 - 9 1.5%

165 | P a g e
Instead of normal service retirements, the principal source of employee attrition is voluntary resignations, or quits. As illustrated in the figure below, of the 79 quits and retirements between FY 2012 and FY 2017, voluntary resignations (i.e., quits) represent almost three-quarters (74.6%) of these separations. Moreover, 64.4% of quits (38 of 59) occurred among employees with fewer than five years of completed service and 88.1% of quits (52 of 59) occurred among employees with fewer than 10 years of completed service.
Prince William County Fire and Rescue Quits and Retirements by Years of Service
All Sworn Employees (FY 2012 – FY 2017)
Fire and Rescue Retention Experience
Across all uniformed Fire and Rescue ranks, Prince William County’s turnover rate has been relatively steady since FY 2013. As shown in the tables in the following page, in FY 2015, the turnover rate more than doubled off of a low of 2.7% in FY 2014 to 5.4%, but otherwise, turnover rates have remained consistent at 4.3% or 4.8%. Similarly, the Department’s quit rate across all ranks bottomed in FY 2014 at 1.4%, and spiked to 3.9% in FY 2015. Since FY 2015, the quit rate across all ranks has declined steadily to 2.5% in FY 2017.
Data shown do not reflect the uptick in separations during the first few months of FY 2018.
38
14
7
1
14
14
0
5
10
15
20
25
30
35
40
45
0-5 6-10 11-15 16-20 21-25 >25
Res
igna
tions
/Ret
irem
ents
Years of Service
Resignation Retirement

166 | P a g e
Prince William County Fire and Rescue Separations, All Ranks (FY 2012 – FY 2017)
Fire & Rescue Separations (All Ranks)
FY 2012
FY 2013
FY 2014
FY 2015
FY 2016
FY 2017
Headcount (All Ranks) - 470 487 515 520 561
Voluntary Resignations/Quits 8 13 7 20 18 14 Normal Service Retirement 6 6 2 4 5 8 Disability Retirement 0 0 0 1 0 0 Terminated for Cause/Disciplinary 4 1 3 2 1 2 Deceased 0 0 0 0 0 0 Other 2 0 1 1 1 0
Total Separations 20 20 13 28 25 24
Prince William County Quit and Turnover Rates, All Ranks (FY 2012 – FY 2017)
Fire & Rescue (All Ranks) FY 2012
FY 2013
FY 2014
FY 2015
FY 2016
FY 2017
Quit Rate - 2.8% 1.4% 3.9% 3.5% 2.5%
Turnover Rate - 4.3% 2.7% 5.4% 4.8% 4.3%
Similarly, quit rates and turnover rates for fire and rescue technicians bottomed in FY 2014, spiked in FY 2015, declined again in FYs 2016 and FY 2017
Prince William County Fire and Rescue Separations, Fire Technician (FY 2012 – FY 2017)
Fire & Rescue Separations (Technician I & II)
FY 2012
FY 2013
FY 2014
FY 2015
FY 2016
FY 2017
Headcount - 322 334 356 359 386
Voluntary Resignations/Quits 8 13 7 18 17 14 Normal Service Retirement 1 1 1 0 0 1 Disability Retirement 0 0 0 1 0 0 Terminated for Cause/Disciplinary 4 1 3 1 1 2 Deceased 0 0 0 0 0 0 Other 2 0 1 1 0 0
Total Separations 15 15 12 21 18 17

167 | P a g e
Prince William County Quit and Turnover Rates, Fire Technician (FY 2012 – FY 2017)
Fire & Rescue (Fire Technicians) FY 2012
FY 2013
FY 2014
FY 2015
FY 2016
FY 2017
Quit Rate - 4.0% 2.1% 5.1% 4.7% 3.6%
Turnover Rate - 4.7% 3.6% 5.9% 5.0% 4.4%
As a whole, between FY 2013 and FY 2017 Prince William County’s Fire and Rescue retention rates have been less volatile relative to the comparison group. Alexandria and Arlington County experienced more dramatic spikes in attrition across all ranks in FY 2015 and FY 2016, but otherwise, Prince William County’s Fire and Rescue turnover rates are in-line with other attrition rates in the region across all ranks over this time period.
The figures below compare Prince William County’s fire and rescue turnover and quit rates, across all ranks, relative to the Northern Virginia comparison group.
Northern Virginia Fire and Rescue Turnover Rates – All Ranks (FY 2013 – FY 2017)

168 | P a g e
Northern Virginia Fire and Rescue Quit Rates – All Ranks (FY 2013 – FY 2017)
When focusing solely on non-supervisory fire and rescue positions, Prince William County’s turnover and quit rates, again, are consistent with other Departments in the region – generally tracking the midpoint. While the Department’s fire and rescue technician quit rates were the highest in the region in FY 2015 at 5.1%, they have since declined to 3.6% in FY 2017. As detailed in the figures that follow, in FY 2017 Fairfax County and Loudoun County reported lower turnover and quit rates than Prince William County, while Alexandria and Arlington reported higher rates.
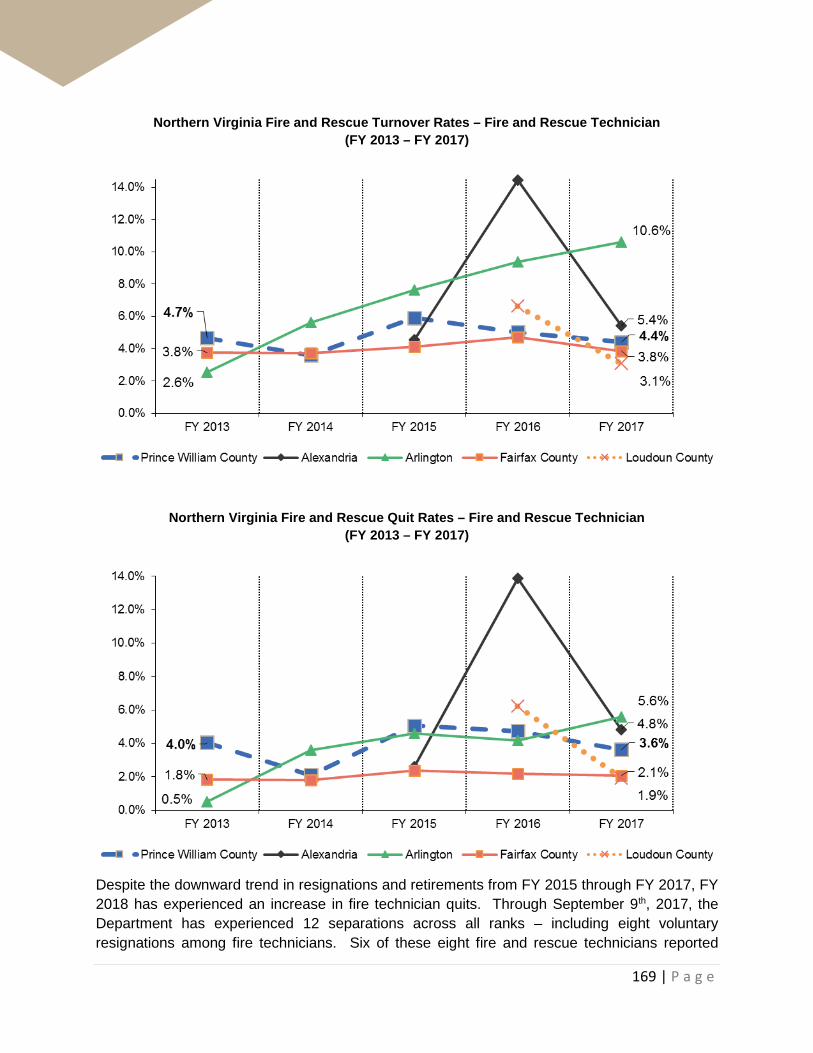
169 | P a g e
Northern Virginia Fire and Rescue Turnover Rates – Fire and Rescue Technician (FY 2013 – FY 2017)
Northern Virginia Fire and Rescue Quit Rates – Fire and Rescue Technician (FY 2013 – FY 2017)
Despite the downward trend in resignations and retirements from FY 2015 through FY 2017, FY 2018 has experienced an increase in fire technician quits. Through September 9th, 2017, the Department has experienced 12 separations across all ranks – including eight voluntary resignations among fire technicians. Six of these eight fire and rescue technicians reported
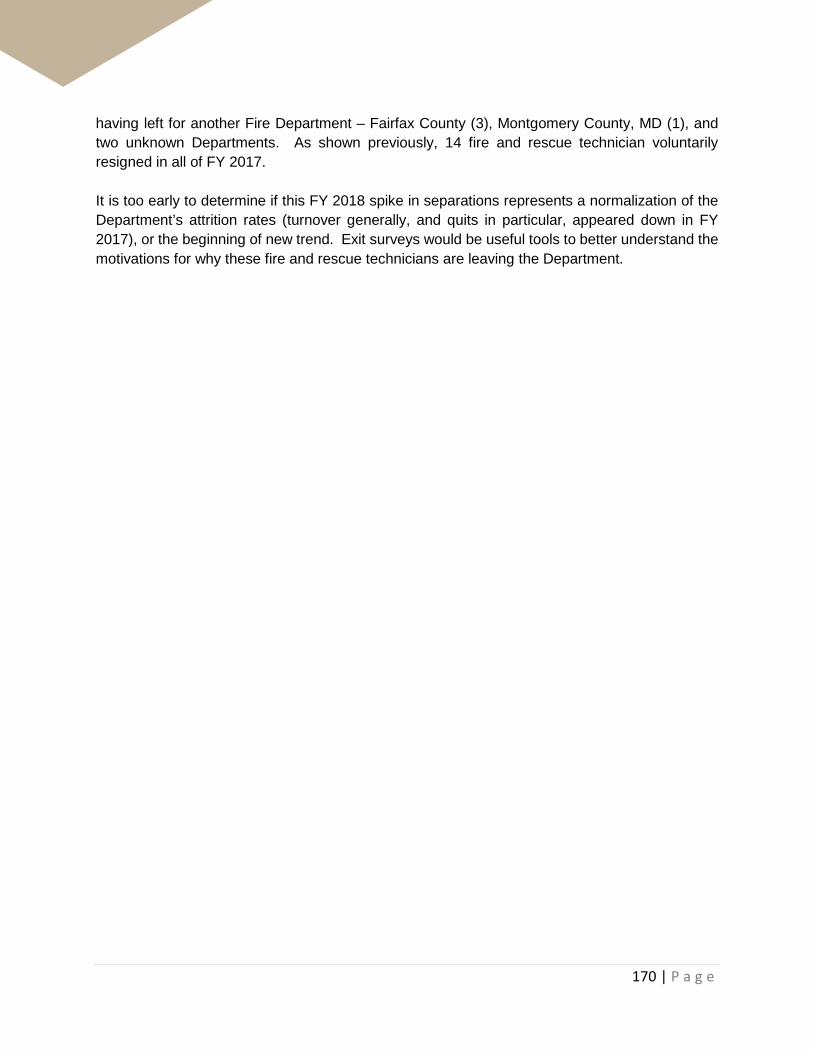
170 | P a g e
having left for another Fire Department – Fairfax County (3), Montgomery County, MD (1), and two unknown Departments. As shown previously, 14 fire and rescue technician voluntarily resigned in all of FY 2017. It is too early to determine if this FY 2018 spike in separations represents a normalization of the Department’s attrition rates (turnover generally, and quits in particular, appeared down in FY 2017), or the beginning of new trend. Exit surveys would be useful tools to better understand the motivations for why these fire and rescue technicians are leaving the Department.
171 | P a g e
Drivers of Attrition
Prince William County uniformed fire and rescue employees are leaving the Department for a variety of external and internal factors. External factors provide the opportunity to leave, while internal factors provide the motivation. These factors have the most influence among early and mid-career fire and rescue personnel.
External Factors
There are multiple external drivers that may contribute to an individual firefighter or paramedic’s decision to voluntarily resign. In the employee surveys, some current and former employees reported that they had interest in relocating to another part of the Country for family or personal reasons. Others may have other job opportunities – such as the opportunity to work a family business – that may be outside the control of the Department.
A primary external driver is the economy. As the economy has improved since the Great Recession, outside employment opportunities have increased. This has been the case in other regional Departments and EMS service providers. At the same time, wage growth in many of these agencies has exceeded that of Prince William County, creating both an opportunity and financial benefit for Prince William County fire and rescue personnel to join another organization.
At the time of hire, more than 72% of current employees reported considering jobs with other regional fire departments, and more than 36% of current employees considered local fire departments in other parts of the country. As illustrated in the table on the following page, higher proportions of fire and rescue recruits reported considering regional local governments (92.3%) and local fire and rescue departments in other parts of the country (61.5%) as well.
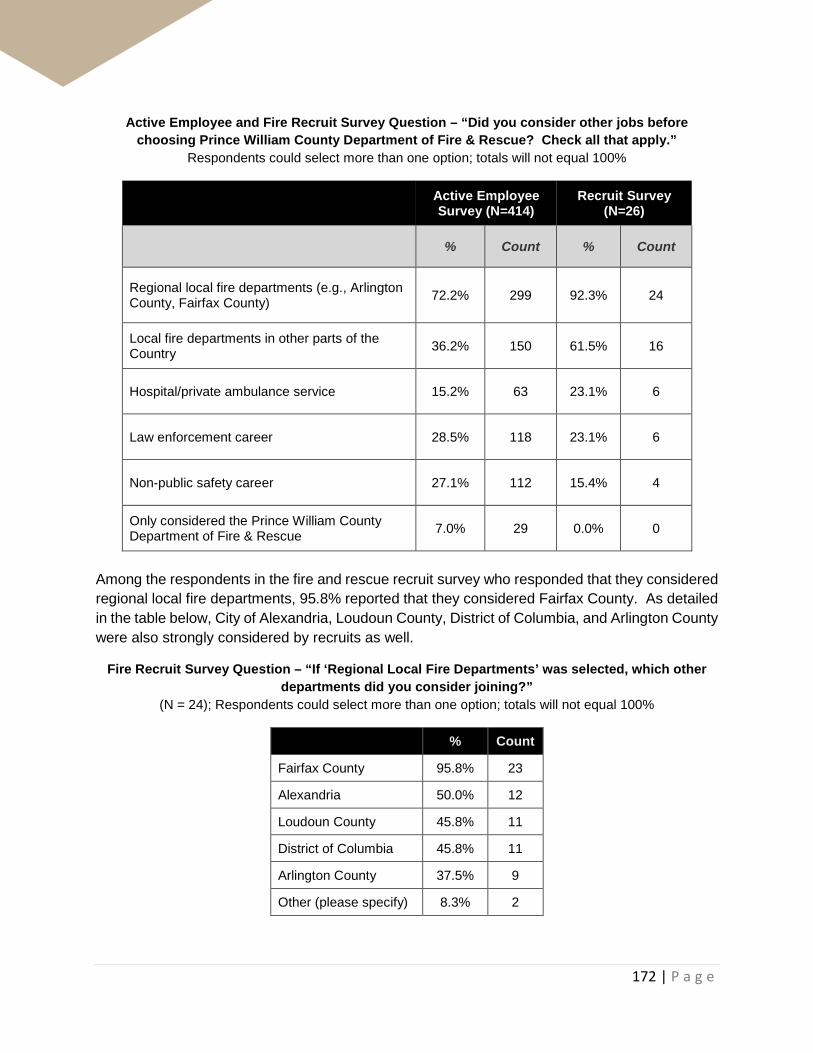
172 | P a g e
Active Employee and Fire Recruit Survey Question – “Did you consider other jobs before choosing Prince William County Department of Fire & Rescue? Check all that apply.”
Respondents could select more than one option; totals will not equal 100%
Active Employee Survey (N=414)
Recruit Survey (N=26)
% Count % Count
Regional local fire departments (e.g., Arlington County, Fairfax County) 72.2% 299 92.3% 24
Local fire departments in other parts of the Country 36.2% 150 61.5% 16
Hospital/private ambulance service 15.2% 63 23.1% 6
Law enforcement career 28.5% 118 23.1% 6
Non-public safety career 27.1% 112 15.4% 4
Only considered the Prince William County Department of Fire & Rescue 7.0% 29 0.0% 0
Among the respondents in the fire and rescue recruit survey who responded that they considered regional local fire departments, 95.8% reported that they considered Fairfax County. As detailed in the table below, City of Alexandria, Loudoun County, District of Columbia, and Arlington County were also strongly considered by recruits as well.
Fire Recruit Survey Question – “If ‘Regional Local Fire Departments’ was selected, which other departments did you consider joining?”
(N = 24); Respondents could select more than one option; totals will not equal 100%
% Count
Fairfax County 95.8% 23
Alexandria 50.0% 12
Loudoun County 45.8% 11
District of Columbia 45.8% 11
Arlington County 37.5% 9
Other (please specify) 8.3% 2

173 | P a g e
According to available data collected by the Department, Fairfax County represents the competing employer who attracts the largest number of separated DFR employees.
PFM analyzed self-reported exit survey data collected by DFR’s personnel bureau. As detailed in the table below, among the 71 employees who voluntarily resigned between June 2015 and October 2017, 35 employees provided some information on their new employer. Among these 35 employees, 20 (57.1%) reported leaving Prince William County DFR to work for the Fairfax County Department of Fire and Rescue.
Fire & Rescue Resignation Analysis (July 2015 - October 2017) (Prince William County Department of Fire & Rescue Exit Surveys)
New Fire Department #
Fairfax County 20
Washington D.C. 3
City of Virginia Beach 2
Bedford County 1
Chesterfield County 1
City of Fairfax 1
City of Manassas 1
City of New York, NY 1
City of Philadelphia, PA 1
Fauquier County 1 Metropolitan Washington Airport Authority (MWAA) 1
Montgomery County, MD 1
West Palm Beach Gardens, FL 1
In focus groups and employee surveys, DFR employees reported that higher annual compensation levels and the ability to work exclusively 24-hour shifts (i.e., no day shifts) as attractive features of employment with Fairfax County – even though the Fairfax County work schedule results in more annual appearances for personnel assigned to operations.
Internal Factors
Opportunities at other departments alone do not motivate fire and rescue personnel to resign. A review of current employee surveys, separated employee surveys, as well as focus group interviews with current Prince William County Fire and Rescue Department employees identified two primary factors affecting job satisfaction – the day shift and annual compensation.
Fire and rescue technicians working the day shift reported significantly lower satisfaction levels with their work schedules and work/life balance. Further, all fire and rescue technicians who did

174 | P a g e
not work the day shift reported that the possibility of being transferred to the day shift influenced whether they considered other employment options.
Compensation concerns raised primarily focused around pay compression, pay levels, lack of certainty around future pay increases, and reduction in total compensation (i.e., holiday pay) when working the day shift. Additional secondary factors have contributed to employee dissatisfaction, including transparency and decision-making processes around transfers and promotions, as well as working arrangements with volunteer companies.
Insights from Active Employees Employee insights on satisfaction can help identify internal factors that drive attrition, as well as identify cohorts at greatest risk for resignation. Additionally, employee attitudes and perspectives can provide guidance on which potential recommendations will resonate most powerfully with employees, and be most effective at stemming attrition.
Employee insights were gleaned from a combination of employee focus groups with each rank up through battalion chief, meetings with command staff, and an employee survey of uniformed fire and rescue personnel below the rank of assistant chief that generated 422 responses.26
Of the 422 respondents to the active fire and rescue employee survey, 71.2% reported their rank as a Technician I or Technician II while 28.8% indicated that they are currently in a supervisory rank (lieutenant, captain, and battalion chief). As shown in the following figure, this proportion generally aligns with the employee distribution of the Department as of 12/31/2016.
26 Not all respondents answered all questions. Accordingly, the number of responses for any specific question (N) may vary.

175 | P a g e
Active Fire Survey Respondents by Rank (All Ranks; N = 420)
As shown in the figure below, nearly two-thirds (72.4%) of respondents are currently assigned to fire suppression.
Active Fire Survey Respondents by Section (All Ranks; N = 420)
Additionally, the table in the following page provides a breakdown of survey respondents by tenure – nearly half (44.7%) of respondents are mid-career employees with between 6 and 15 years of service – closely mirroring figures in the 12/31/2016 payroll run.

176 | P a g e
Active Employees vs. Active Fire and Rescue Survey Respondents by Years of Service27
Active Employees (N=585)
Active Survey (N=423)
YOS % %
0 - 2 24.8% 24.4%
3 - 5 15.0% 13.0%
6 - 10 23.6% 27.2%
11 - 15 20.2% 17.5%
16 - 20 7.4% 9.7%
21+ 9.1% 8.3%
To evaluate general satisfaction levels, survey respondents were asked to assess the statement “I am satisfied professionally.” Nearly two in three (65.4%) respondents replied “very true” or “true.” Approximately 7.7% responded “not very true” or “completely untrue”, as illustrated in the figure below.
“I am satisfied professionally” (All Ranks; N = 401)
The following figure explores employee satisfaction levels across 11 specific dimensions of compensation, working conditions, and benefits. While none of the dimensions received aggregate scores greater than 75% for responses of “very satisfied” or “satisfied,” across all employees, “my station” and “my work schedule” received the highest satisfaction scores.
On the opposite end of the spectrum, the three dimensions receiving the highest dissatisfaction scores included: “decision-making process around transfers” (58.5% completely unsatisfied or not
27 Source: Payroll run as of 12/31/2016 and Active Employee Survey (n=423). Percentages are rounded to nearest tenth
17.5% 47.9% 26.9% 6.7% 1.0%
0% 25% 50% 75% 100%
Very True
True
SomewhatTrue
Not Very True
CompletelyUntrue
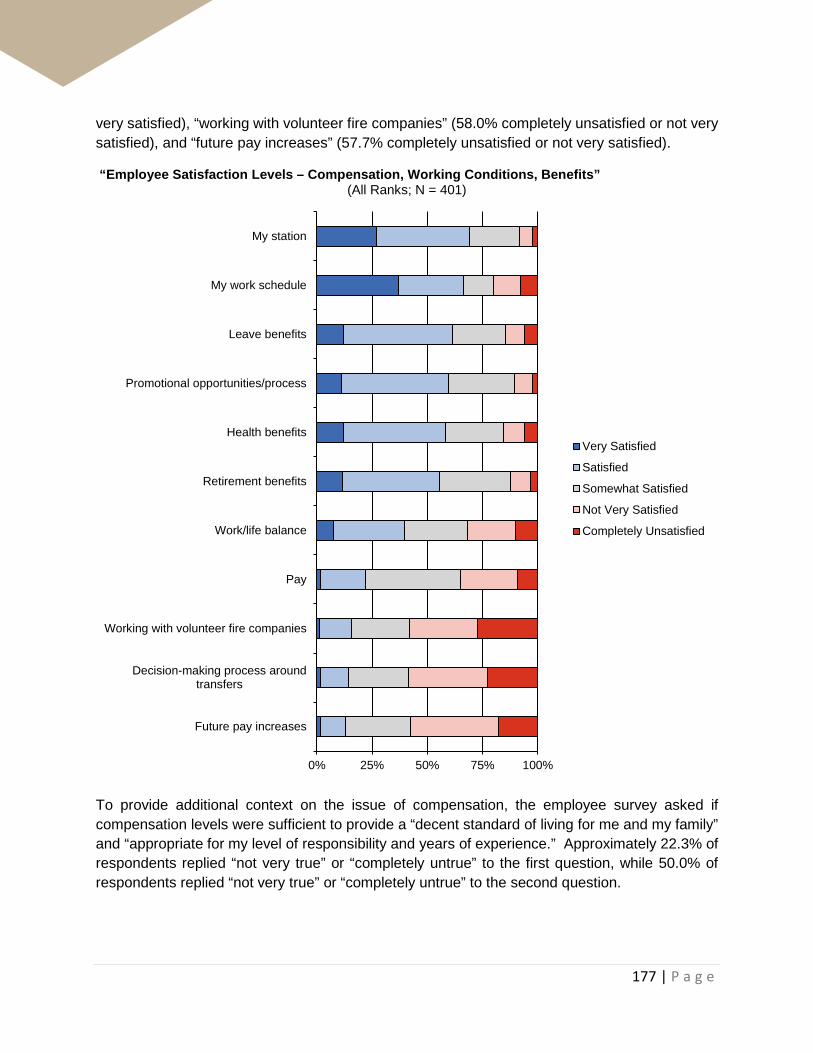
177 | P a g e
very satisfied), “working with volunteer fire companies” (58.0% completely unsatisfied or not very satisfied), and “future pay increases” (57.7% completely unsatisfied or not very satisfied).
“Employee Satisfaction Levels – Compensation, Working Conditions, Benefits” (All Ranks; N = 401)
To provide additional context on the issue of compensation, the employee survey asked if compensation levels were sufficient to provide a “decent standard of living for me and my family” and “appropriate for my level of responsibility and years of experience.” Approximately 22.3% of respondents replied “not very true” or “completely untrue” to the first question, while 50.0% of respondents replied “not very true” or “completely untrue” to the second question.
0% 25% 50% 75% 100%
Future pay increases
Decision-making process aroundtransfers
Working with volunteer fire companies
Pay
Work/life balance
Retirement benefits
Health benefits
Promotional opportunities/process
Leave benefits
My work schedule
My station
Very Satisfied
Satisfied
Somewhat Satisfied
Not Very Satisfied
Completely Unsatisfied
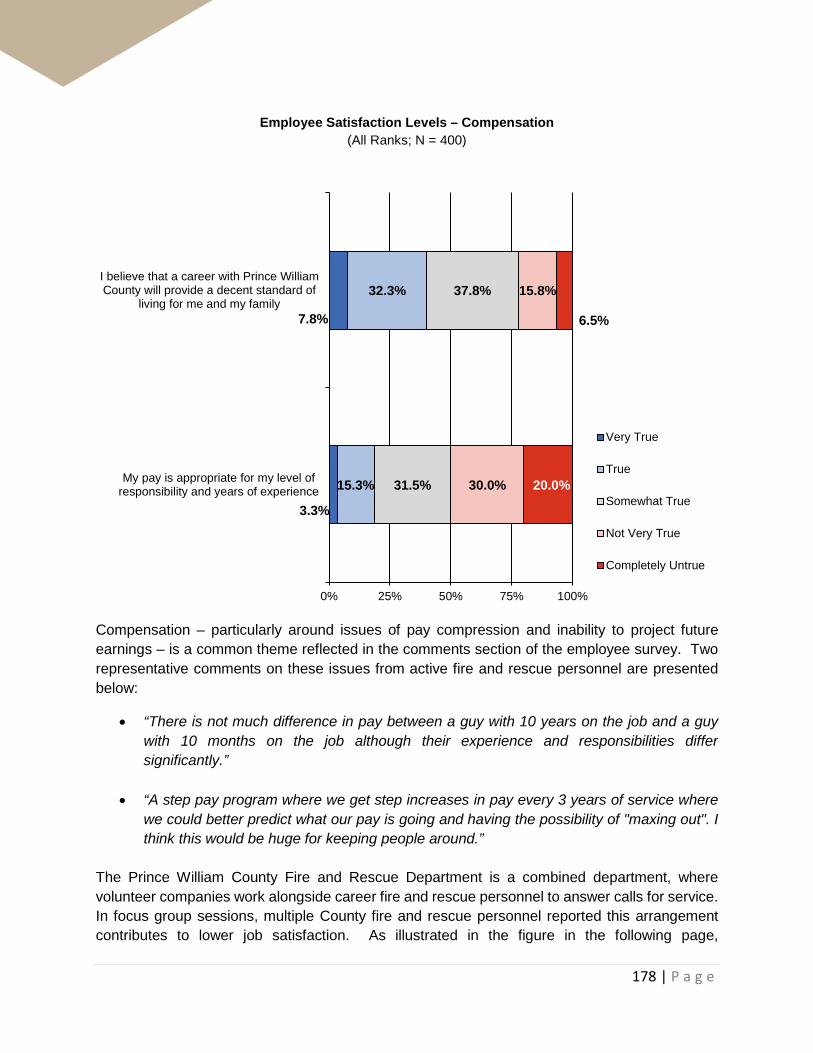
178 | P a g e
Employee Satisfaction Levels – Compensation (All Ranks; N = 400)
Compensation – particularly around issues of pay compression and inability to project future earnings – is a common theme reflected in the comments section of the employee survey. Two representative comments on these issues from active fire and rescue personnel are presented below:
• “There is not much difference in pay between a guy with 10 years on the job and a guy with 10 months on the job although their experience and responsibilities differ significantly.”
• “A step pay program where we get step increases in pay every 3 years of service where we could better predict what our pay is going and having the possibility of "maxing out". I think this would be huge for keeping people around.”
The Prince William County Fire and Rescue Department is a combined department, where volunteer companies work alongside career fire and rescue personnel to answer calls for service. In focus group sessions, multiple County fire and rescue personnel reported this arrangement contributes to lower job satisfaction. As illustrated in the figure in the following page,
3.3%
7.8%
15.3%
32.3%
31.5%
37.8%
30.0%
15.8%
20.0%
6.5%
0% 25% 50% 75% 100%
My pay is appropriate for my level ofresponsibility and years of experience
I believe that a career with Prince WilliamCounty will provide a decent standard of
living for me and my family
Very True
True
Somewhat True
Not Very True
Completely Untrue

179 | P a g e
approximately two-thirds of those surveyed viewed volunteer companies as a “liability” for the Department, underscoring the organizational tensions between career staff and volunteers.
“Do you view volunteer companies as an asset or a liability for the Department?” (N = 400)
On August 1st of 2017, the Board of County Supervisors adopted a new ordinance to restructure Prince William County Fire and Rescue Service under a “strong chief” framework placing the Chief of the Department in charge of career fire/rescue personnel, as well as volunteers.
The figure on the following page evaluates how nine attributes influence current fire and rescue employees’ decision to remain with the Prince William County Department of Fire and Rescue. “Supportive management” and “meaningful work” rank as the most influential attributes with 82.8% and 81.0% of respondents reporting these two attributes as “very influential” or “influential,” respectively. Two compensation factors also received influence scores above 75.0% – “pay levels” (80.7%) and “wage increases received by neighboring departments” (75.2%).

180 | P a g e
“What factors are likely to influence whether you remain with the Prince William County Department of Fire & Rescue?”
(All Ranks; N = 400)
When asked to evaluate the comparative strengths of the Department, “co-workers” and “opportunities for professional advancement” were cited by more than 65% of respondents. As detailed in the table on the following page, “pay” ranked second to last with fewer than 17.0% reporting this attribute of the Department as a strength.
0% 25% 50% 75% 100%
Ability to remain on my current shift
Promotional opportunities
Ability to project my future earnings
Treatment of more tenured employees
Years to retirement eligibility
Wage increases received byneighboring departments
Pay levels
Meaningful work
Supportive management
Very Influential
Influential
Somewhat Influential
Not very Influential
Not Influential at All
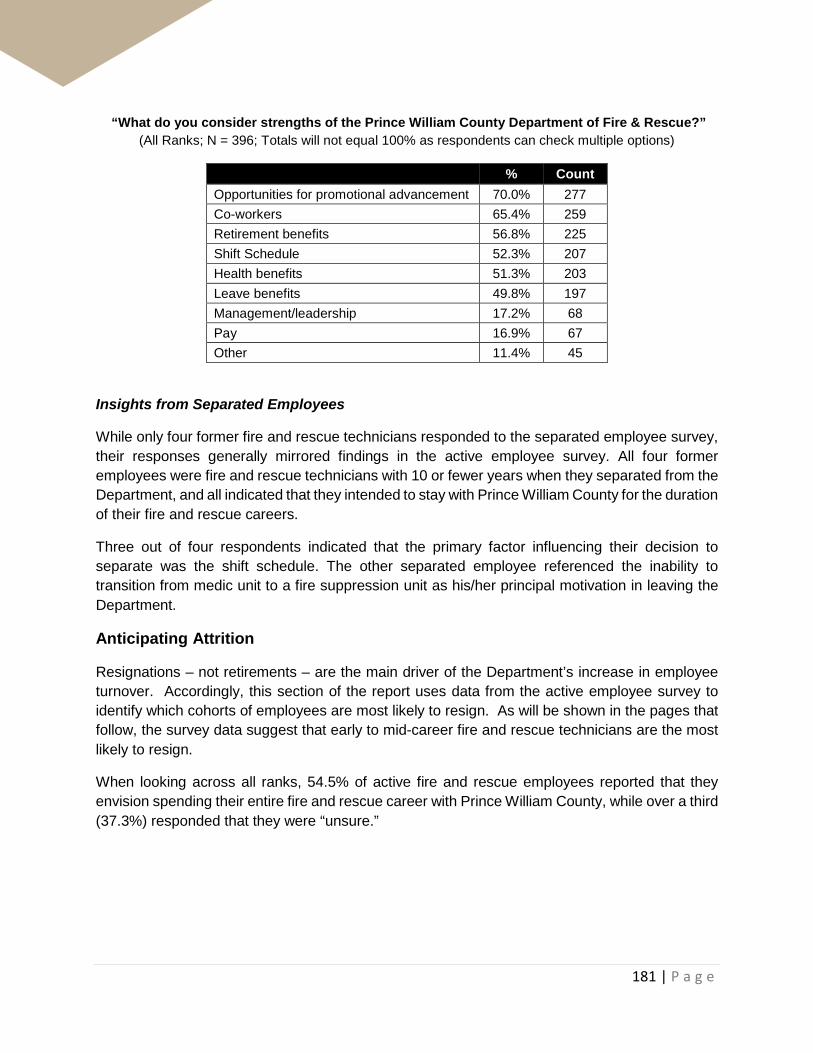
181 | P a g e
“What do you consider strengths of the Prince William County Department of Fire & Rescue?” (All Ranks; N = 396; Totals will not equal 100% as respondents can check multiple options)
% Count Opportunities for promotional advancement 70.0% 277 Co-workers 65.4% 259 Retirement benefits 56.8% 225 Shift Schedule 52.3% 207 Health benefits 51.3% 203 Leave benefits 49.8% 197 Management/leadership 17.2% 68 Pay 16.9% 67 Other 11.4% 45
Insights from Separated Employees
While only four former fire and rescue technicians responded to the separated employee survey, their responses generally mirrored findings in the active employee survey. All four former employees were fire and rescue technicians with 10 or fewer years when they separated from the Department, and all indicated that they intended to stay with Prince William County for the duration of their fire and rescue careers.
Three out of four respondents indicated that the primary factor influencing their decision to separate was the shift schedule. The other separated employee referenced the inability to transition from medic unit to a fire suppression unit as his/her principal motivation in leaving the Department.
Anticipating Attrition
Resignations – not retirements – are the main driver of the Department’s increase in employee turnover. Accordingly, this section of the report uses data from the active employee survey to identify which cohorts of employees are most likely to resign. As will be shown in the pages that follow, the survey data suggest that early to mid-career fire and rescue technicians are the most likely to resign.
When looking across all ranks, 54.5% of active fire and rescue employees reported that they envision spending their entire fire and rescue career with Prince William County, while over a third (37.3%) responded that they were “unsure.”

182 | P a g e
Fire Active Employee Survey Question – “Do you see yourself spending your entire fire/EMS career with the Prince William County Department of Fire & Rescue?”
(N = 402)
Of the 402 fire and rescue employees who answered this question, 77 respondents (19.2%) provided additional commentary explaining the main factors that would convince them to leave the Department. Common themes cited included pay compression, annual pay levels, and concern about being transferred to the day shift.
When refining this dataset to look at Technicians I and II only – i.e., excluding supervisors – the proportion of employees who view themselves spending an entire career with the Department declines from 54.5% to 46.6%. As illustrated in the figure that follows, which groups responses by tenure, between 41.1% and 45.1% of fire and rescue technicians with 10 or fewer years of completed service report that they see themselves spending their entire fire/EMS career with the Department.

183 | P a g e
“Do you see yourself spending your entire fire/EMS career with the Prince William County Department of Fire & Rescue?” – By Tenure
(Technicians I and II; N = 281)
Across all fire and rescue technicians, 23.8% respondents reported that they applied for another fire and rescue position within the prior 12 months. Nearly 30% of fire and rescue technicians with fewer than two completed years of service reported applying for another position within the prior 12 months.
Active Fire Survey – Have you applied for a fire/EMS position with another agency within the past 12 months? (Fire and Rescue Technicians)
(N=281)
41.1%
45.1%
44.2%
46.6%
0% 25% 50% 75% 100%
Tech 6-10 YOS
Tech 3-5 YOS
Tech 0-2 YOS
All Fire/Rescue Techs
Yes No Unsure
23.8%
29.5%
23.5%
26.7%
8.3%
0.0%0.0%
5.0%
10.0%
15.0%
20.0%
25.0%
30.0%
35.0%
AllFire/RescueTechnicians
0-2 YOS 3-5 YOS 6-10 YOS 11-15 YOS 16-20 YOS

184 | P a g e
To further refine the subset of fire and rescue technicians who may leave the department, the employee survey asked if the respondent worked on the day shift or a 24-hour shift. One of the principal concerns voiced by fire and rescue technicians concerning the day shift is that because of lost holiday pay opportunities, a transfer to the day shift results in a “pay cut” from a total direct cash compensation perspective. As explained in the table below, which contrasts the differing holiday pay formulas for a Fire and Rescue Technician I working on a 24-hour shift and day shift, fire and rescue technicians working on 24-hour shifts earn additional holiday pay cash compensation not available to technicians working on the day shift.
Holiday Pay Earned by Technician I on 24-Hour Shift vs. Day Shift
24-Hour Shifts Day Shift Base Pay $48,256 Base $48,256 Hourly Pay $19.33 Hourly Pay $19.33
Holiday Pay Formula: 1.5x premium pay for 12 holidays. 18 hours of pay per holiday. Pay
received regardless if holiday is worked
Holiday Pay Formula: 1.5x premium pay if holiday falls on employee's rotating day off. A day of leave (i.e., a day off) if holiday falls on
scheduled work day Holiday Pay Calculations Holiday Pay Calculations
# of Holidays 12 # of Holidays 12 # of Holiday Hours per shift 18 # of Holiday Hours per shift 12 Pay Premium 1.5 Pay Premium 1.5 Leave Premium 0 Leave Premium 0 % of holidays receiving pay 100% % of holidays receiving pay 20% % of holidays receiving leave 0% % of holidays receiving leave 80% Total Holiday Pay ($) $6,264 Total Holiday Pay ($) $835 Total Holiday Leave (hours) 0 Total Holiday Leave (hours) 115.2 Value of Holiday Pay + Leave $6,264 Value of Holiday Pay + Leave $3,062
Beyond holiday pay, there are other challenges reported with working the day shift. Though the day shift represents no additional scheduled hours, it requires more appearances at the fire station. This translates to additional commuting time, and costs for employees, as well as, fewer opportunities for pick up additional shifts at overtime. Further, the shift start time of 6:00 AM presents challenges for employees who need to coordinate childcare options.
One survey respondent provided some perspective on the role of the day shift in employee retention:
The entire department being on the same shift schedule would be the most effective way to retain employees. There are very few members of the department that I have conversed with who are satisfied with the day work schedule. When I talk to members who leave the department for other jurisdictions, they all say that guaranteed 24-hour shift work is the main reason why they leave for other departments. I feel like the morale is low for those who are on day work, because they are over-worked and fatigued due to the nature of the job and having to perform it 4 days per week as opposed to 2-3 days per week on shift work.

185 | P a g e
As detailed in the figure below, there is a stark difference in satisfaction levels (“very satisfied” or “satisfied”) regarding work schedules for fire and rescue technicians working 24-hour shifts (91.5%) and those working day shifts (27.0%).
“Select the option that most closely reflects your opinion about your work schedule:” (Day Shift; N = 89; 24 Hour Shift; N = 188)
As illustrated in the figure on the following page, a greater proportion of technicians who work 24-hour shifts reported the possibility of transferring to the day shift as a “significant impediment” or “reason why I think about leaving the Department” than fire technicians who work on the day shift. This finding suggests that the possibility of working the day shift – even for those who are not assigned to work days – may be factor in voluntary resignation rates.
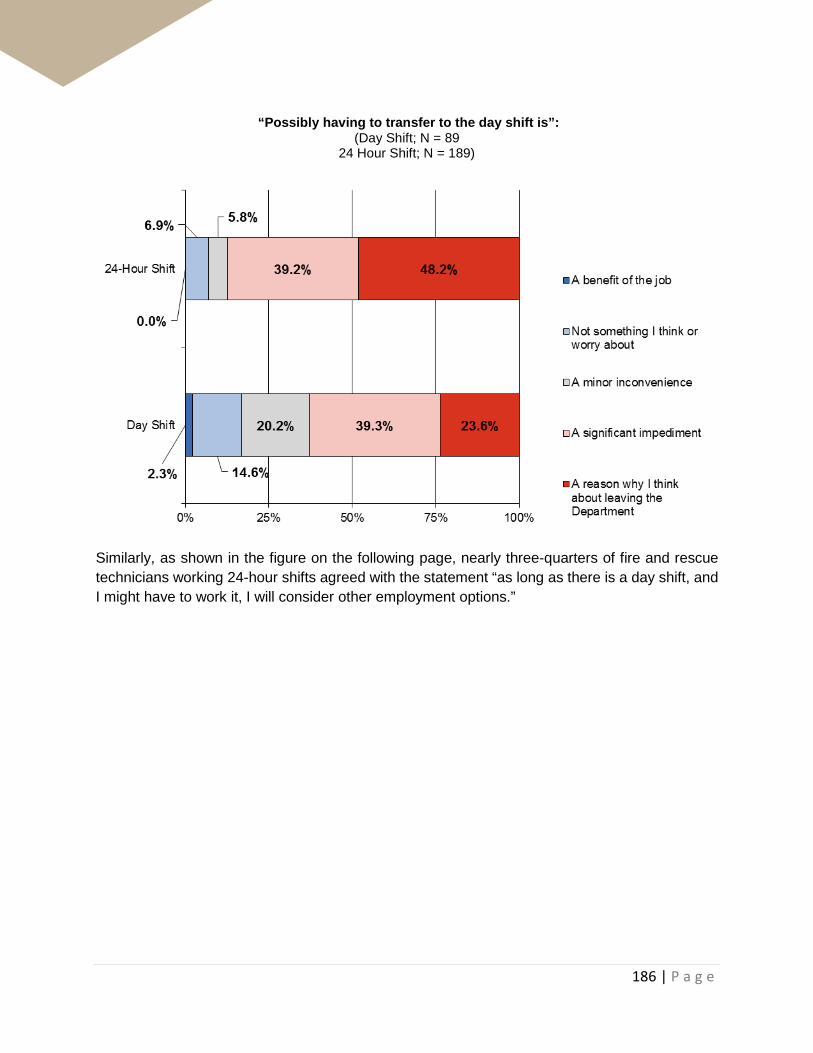
186 | P a g e
“Possibly having to transfer to the day shift is”: (Day Shift; N = 89
24 Hour Shift; N = 189)
Similarly, as shown in the figure on the following page, nearly three-quarters of fire and rescue technicians working 24-hour shifts agreed with the statement “as long as there is a day shift, and I might have to work it, I will consider other employment options.”
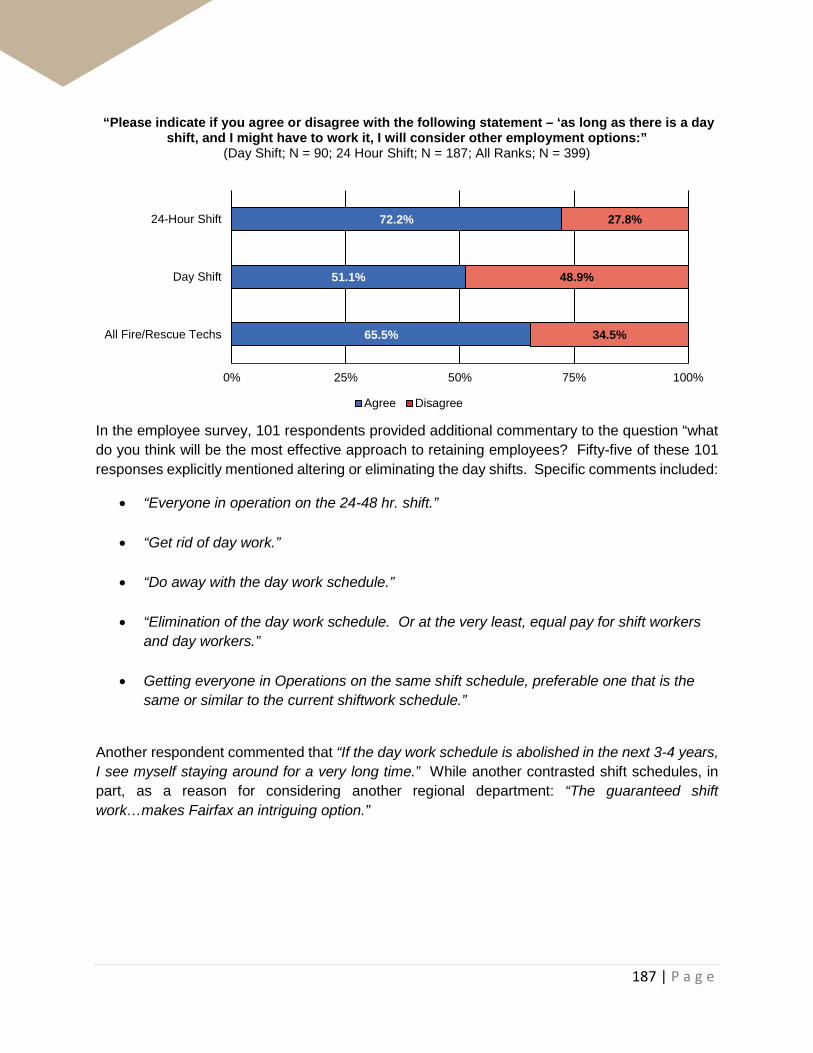
187 | P a g e
“Please indicate if you agree or disagree with the following statement – ‘as long as there is a day shift, and I might have to work it, I will consider other employment options:”
(Day Shift; N = 90; 24 Hour Shift; N = 187; All Ranks; N = 399)
In the employee survey, 101 respondents provided additional commentary to the question “what do you think will be the most effective approach to retaining employees? Fifty-five of these 101 responses explicitly mentioned altering or eliminating the day shifts. Specific comments included:
• “Everyone in operation on the 24-48 hr. shift.”
• “Get rid of day work.”
• “Do away with the day work schedule.”
• “Elimination of the day work schedule. Or at the very least, equal pay for shift workers and day workers.”
• Getting everyone in Operations on the same shift schedule, preferable one that is the same or similar to the current shiftwork schedule.”
Another respondent commented that “If the day work schedule is abolished in the next 3-4 years, I see myself staying around for a very long time.” While another contrasted shift schedules, in part, as a reason for considering another regional department: “The guaranteed shift work…makes Fairfax an intriguing option.”
65.5%
51.1%
72.2%
34.5%
48.9%
27.8%
0% 25% 50% 75% 100%
All Fire/Rescue Techs
Day Shift
24-Hour Shift
Agree Disagree
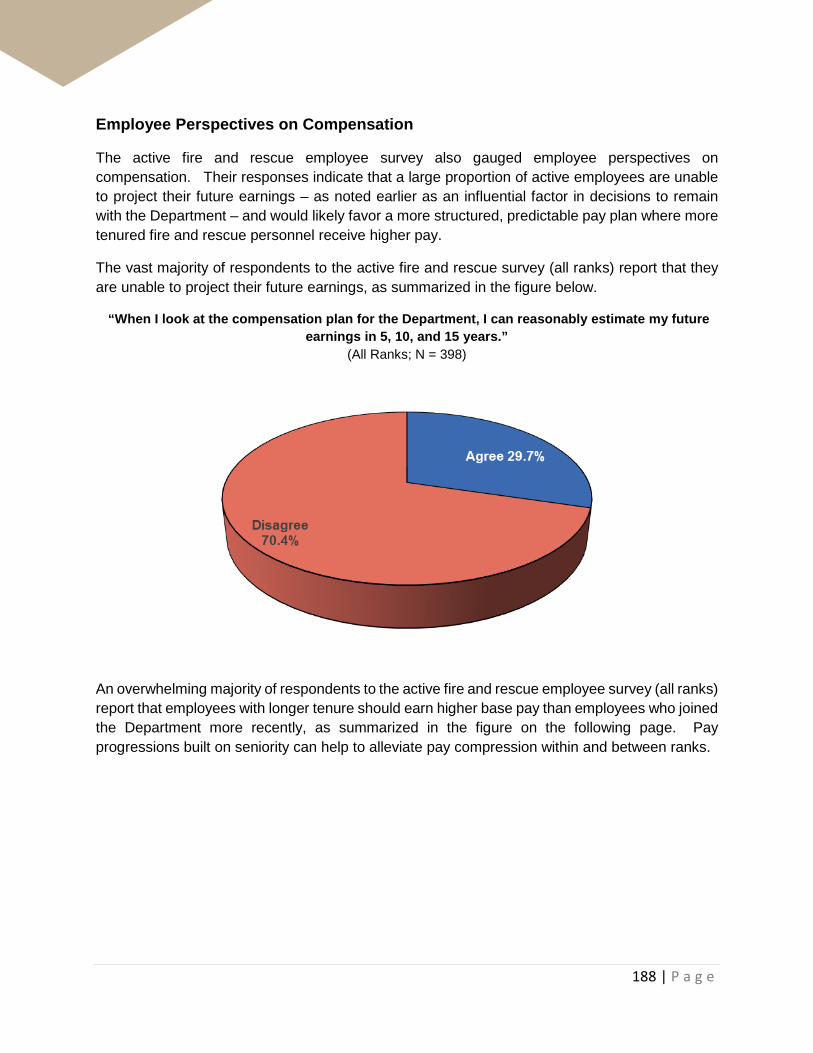
188 | P a g e
Employee Perspectives on Compensation
The active fire and rescue employee survey also gauged employee perspectives on compensation. Their responses indicate that a large proportion of active employees are unable to project their future earnings – as noted earlier as an influential factor in decisions to remain with the Department – and would likely favor a more structured, predictable pay plan where more tenured fire and rescue personnel receive higher pay.
The vast majority of respondents to the active fire and rescue survey (all ranks) report that they are unable to project their future earnings, as summarized in the figure below.
“When I look at the compensation plan for the Department, I can reasonably estimate my future earnings in 5, 10, and 15 years.”
(All Ranks; N = 398)
An overwhelming majority of respondents to the active fire and rescue employee survey (all ranks) report that employees with longer tenure should earn higher base pay than employees who joined the Department more recently, as summarized in the figure on the following page. Pay progressions built on seniority can help to alleviate pay compression within and between ranks.
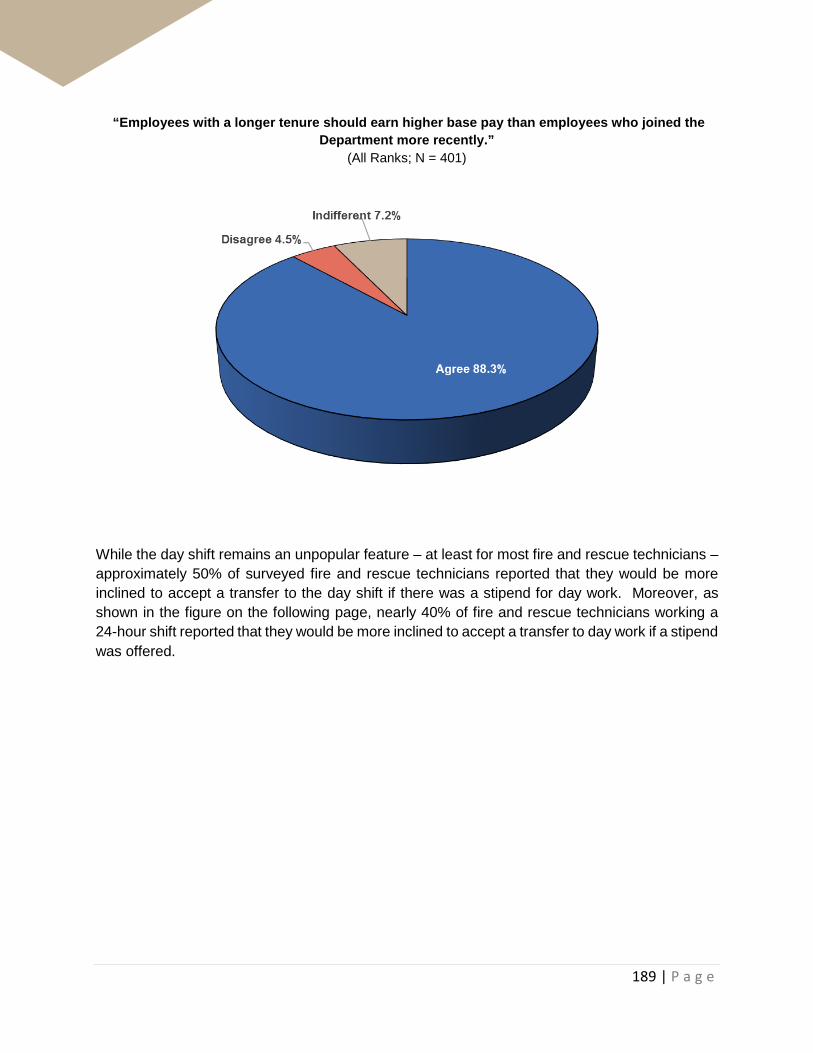
189 | P a g e
“Employees with a longer tenure should earn higher base pay than employees who joined the Department more recently.”
(All Ranks; N = 401)
While the day shift remains an unpopular feature – at least for most fire and rescue technicians – approximately 50% of surveyed fire and rescue technicians reported that they would be more inclined to accept a transfer to the day shift if there was a stipend for day work. Moreover, as shown in the figure on the following page, nearly 40% of fire and rescue technicians working a 24-hour shift reported that they would be more inclined to accept a transfer to day work if a stipend was offered.

190 | P a g e
“If the Department offered a stipend for day work, I would be…”:
(Day Shift; N = 90 24 Hour Shift; N = 188)
70.0%
39.4%
30.0%
60.6%
0% 25% 50% 75% 100%
Day Shift
24-Hour Shift
More inclined to volunteer for/accept a transfer to day work
No more or less inclined than I currently am to accept a transfer to day work
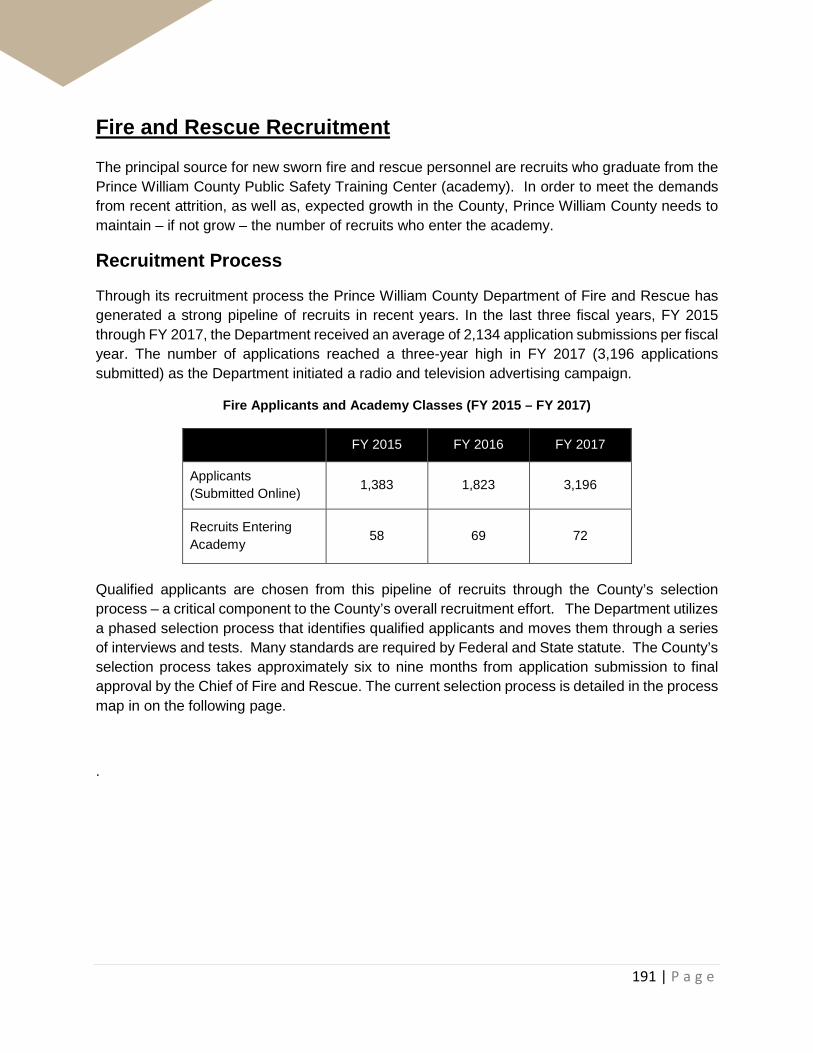
191 | P a g e
Fire and Rescue Recruitment The principal source for new sworn fire and rescue personnel are recruits who graduate from the Prince William County Public Safety Training Center (academy). In order to meet the demands from recent attrition, as well as, expected growth in the County, Prince William County needs to maintain – if not grow – the number of recruits who enter the academy.
Recruitment Process
Through its recruitment process the Prince William County Department of Fire and Rescue has generated a strong pipeline of recruits in recent years. In the last three fiscal years, FY 2015 through FY 2017, the Department received an average of 2,134 application submissions per fiscal year. The number of applications reached a three-year high in FY 2017 (3,196 applications submitted) as the Department initiated a radio and television advertising campaign.
Fire Applicants and Academy Classes (FY 2015 – FY 2017)
FY 2015 FY 2016 FY 2017
Applicants (Submitted Online) 1,383 1,823 3,196
Recruits Entering Academy 58 69 72
Qualified applicants are chosen from this pipeline of recruits through the County’s selection process – a critical component to the County’s overall recruitment effort. The Department utilizes a phased selection process that identifies qualified applicants and moves them through a series of interviews and tests. Many standards are required by Federal and State statute. The County’s selection process takes approximately six to nine months from application submission to final approval by the Chief of Fire and Rescue. The current selection process is detailed in the process map in on the following page.
.

192 | P a g e
Fire Recruitment Process Map
Generally, fire and rescue recruits reported a favorable experience in the recruitment process. On a scale of 1 through 5 – with 5 being the highest rating – the average rating was 4.3, with 92.6% (25 of 27 respondents) providing a rating of 4 or higher. As a point of comparison, respondents to the active employee survey provided an average rating of 3.8.

193 | P a g e
“Please Rate Your Experience with the Prince William County Recruitment Process” (Scale of 1 to 5, 5 being the most favorable rating)
One recruit commented, “The recruitment staff is excellent, very timely and professional. The recruit core training staff is just as excellent.” [Emphasis added]
Another recruit reflected on his/her recruitment experience:
People in personnel/recruitment were wonderful and they were a key reason I decided to join the PWC DFR. Everyone there treated me like a person (as opposed to just a number). Also, I was happy to see officers in personnel/recruitment working hard and leading by example. [Emphasis added]
Interactions with recruitment personnel and the timeliness of the selection process are important factors for fire and rescue recruits in choosing an employer. Therefore, a positive recruitment experience represents a potential comparative advantage for the Prince William County Department of Fire and Rescue in attracting qualified personnel.
Backgrounds of Recruits
Much of the information in this section will draw on information from an online survey of Fire and Rescue recruits that were in the academy as of August 2017. Data were collected from 27 individual responses. Some demographic highlights of the sample group include:
• More than 3/4 of the recruits that provided their age range were between the ages of 21 and 30 (20 of 26).
4.3
3.8
0.0
1.0
2.0
3.0
4.0
5.0
Recruit Survey(n =27)
Active Employee Survey(n =412)
Aver
age
Rat
ing
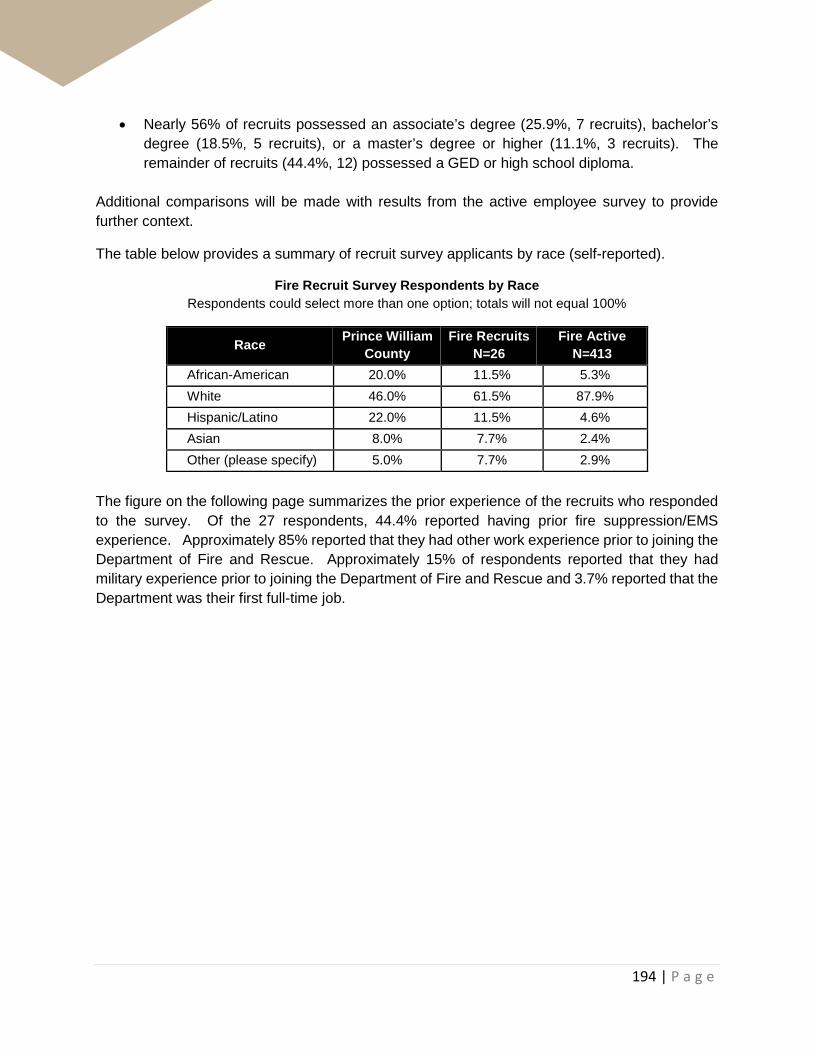
194 | P a g e
• Nearly 56% of recruits possessed an associate’s degree (25.9%, 7 recruits), bachelor’s degree (18.5%, 5 recruits), or a master’s degree or higher (11.1%, 3 recruits). The remainder of recruits (44.4%, 12) possessed a GED or high school diploma.
Additional comparisons will be made with results from the active employee survey to provide further context.
The table below provides a summary of recruit survey applicants by race (self-reported).
Fire Recruit Survey Respondents by Race Respondents could select more than one option; totals will not equal 100%
Race Prince William County
Fire Recruits N=26
Fire Active N=413
African-American 20.0% 11.5% 5.3% White 46.0% 61.5% 87.9% Hispanic/Latino 22.0% 11.5% 4.6% Asian 8.0% 7.7% 2.4% Other (please specify) 5.0% 7.7% 2.9%
The figure on the following page summarizes the prior experience of the recruits who responded to the survey. Of the 27 respondents, 44.4% reported having prior fire suppression/EMS experience. Approximately 85% reported that they had other work experience prior to joining the Department of Fire and Rescue. Approximately 15% of respondents reported that they had military experience prior to joining the Department of Fire and Rescue and 3.7% reported that the Department was their first full-time job.

195 | P a g e
Fire and Rescue Recruit Survey Respondents by Prior Work Experience (N = 27); respondents could select more than one option; totals will not equal 100%
These results from the recruit survey generally mirror the results from the active employee survey, which are presented in the figure below.
Active Fire and Rescue Survey Respondents by Prior Work Experience (N = 420); respondents could select more than one option; totals will not equal 100%
85.2%
44.4%
14.8%
3.7%0.0%
10.0%
20.0%
30.0%
40.0%
50.0%
60.0%
70.0%
80.0%
90.0%
100.0%
Other workexperience
Other firesuppression/EMS
experience
Military experience Prince WilliamCounty is my first
full-time job
80.7%
57.6%
13.1%
4.5%
0.0%
10.0%
20.0%
30.0%
40.0%
50.0%
60.0%
70.0%
80.0%
90.0%
Other work experience Other firesuppression/EMS
experience
Military experience Prince William County ismy first full-time job

196 | P a g e
Recruitment Channels According to the results of the Fire and Rescue recruit survey, there are three principal channels through which the Prince William County Department of Fire and Rescue reaches new recruits:
• Personal networks – family, friends, Prince William County employees • Online • Volunteer fire companies
These three channels had a significant impact on applicants who successfully navigated the application process and entered the Prince William County Public Safety Training Center as recruits.
Personal networks are one of the most influential factors in recruitment for the Prince William County Department of Fire and Rescue, as evidenced in the figure on the following page. When active employees were asked, “How did you learn about the Prince William County Department of Fire and Rescue?” approximately 41.2% of respondents reported that they learned of the Department through family or friends, while 22.7% of respondents reported that they learned of the Department through a County employee. Nineteen percent of active employees learned about the Department by being active in a volunteer fire company.

197 | P a g e
Active Fire and Rescue Survey – “How Did You Learn About the Prince William County Department of Fire and Rescue?”
(N = 415); respondents could select more than one option; totals will not equal 100%
Personal networks and “word of mouth” remain key recruitment tools, as demonstrated by the recruit class surveyed – 51.9% of respondents reported that they learned of the Department through a family member or friend, and 22.2% reported they learned of the Department through a County employee. Additionally, 11.1% of recruits learned about the Department from being active in a volunteer fire company.
From a recruitment perspective, therefore, current employees serve as ambassadors for the Department since they play a significant role in attracting prospective applicants to the Department. Higher levels of current employee satisfaction can potentially bolster and improve recruitment efforts.
41.2%
23.1% 22.7%
19.0%
10.8%
7.7% 7.0%
2.2%0.2%
0.0%
5.0%
10.0%
15.0%
20.0%
25.0%
30.0%
35.0%
40.0%
45.0%

198 | P a g e
Fire and Rescue Recruit Survey – “How Did You Learn About the Prince William County Department of Fire and Rescue?”
(N = 27); respondents could select more than one option; totals will not equal 100%
The recruit survey also highlights the efforts of Department personnel to connect with prospective applicants online. A large proportion of recruits reported learning about the Department online – 37.0% learned about the Department through the County website, while 25.9% reported that they visited another website. Additional websites/online platforms where recruits reported learning about the Prince William County Department of Fire and Rescue included: governmentjobs.com, indeed.com, and Facebook. Accordingly, the Department’s website and social media presence should continue to be a focus of marketing and outreach efforts.
One recruit reported learning about the Department through television advertising. This suggests that television and radio may raise the profile of the Department – as evidenced by the increase
51.9%
37.0%
25.9%22.2%
11.1%
3.7%0.0% 0.0% 0.0%
0.0%
10.0%
20.0%
30.0%
40.0%
50.0%
60.0%

199 | P a g e
in online applications in FY 2017 – but has not yielded a large cohort of recruits who have successfully navigated the recruitment process.
Understanding Recruit Motivations
Individuals who choose a career in fire and rescue, by definition, have a strong commitment to public service. Once an individual decides to pursue a career in fire and rescue, multiple factors can influence which Department he/she chooses to join. While compensation represents an important consideration for recruits, the fire and rescue recruit survey suggests it is not the only pressing factor for new recruits. Non-economic factors, such as logistical considerations –the speed at which employees move through the application pipeline – and the reputation of the department, are critical factors as well.
When asked to identify the primary factor why they chose to join the Prince William County Department of Fire and Rescue, 59.3% of respondents said that they chose Prince William County because it was the “First department that offered me a job,” as illustrated in the figure below. Nearly 14.8% of respondents said that they chose Prince William County because they “Live in the area.” “The reputation of the Department”, ranked third – again, underscoring the importance of non-economic factors in recruitment for fire and rescue positions within Prince William County.
Fire and Rescue Recruit Survey – “What is the Primary Reason you chose to join the Prince William County Department of Fire and Rescue?
(N = 27)
59.3%
14.8%
11.1%
3.7%
3.7%
3.7%
3.7%
0.0%
0.0% 10.0% 20.0% 30.0% 40.0% 50.0% 60.0% 70.0%
First department that offered me a job
Live in the area
Reputation of the Department
Recommendation of a friend, family member, orcurrent employee
Pay
Shift Schedule
Other (please specify)
Benefits
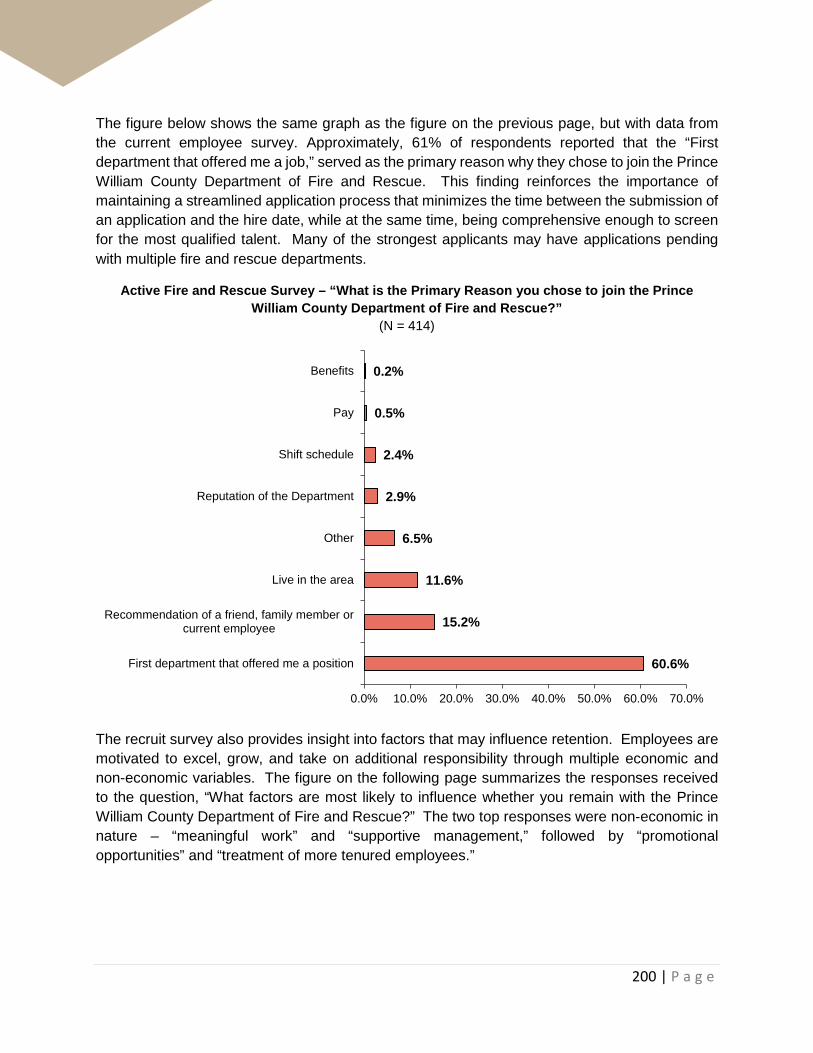
200 | P a g e
The figure below shows the same graph as the figure on the previous page, but with data from the current employee survey. Approximately, 61% of respondents reported that the “First department that offered me a job,” served as the primary reason why they chose to join the Prince William County Department of Fire and Rescue. This finding reinforces the importance of maintaining a streamlined application process that minimizes the time between the submission of an application and the hire date, while at the same time, being comprehensive enough to screen for the most qualified talent. Many of the strongest applicants may have applications pending with multiple fire and rescue departments.
Active Fire and Rescue Survey – “What is the Primary Reason you chose to join the Prince William County Department of Fire and Rescue?”
(N = 414)
The recruit survey also provides insight into factors that may influence retention. Employees are motivated to excel, grow, and take on additional responsibility through multiple economic and non-economic variables. The figure on the following page summarizes the responses received to the question, “What factors are most likely to influence whether you remain with the Prince William County Department of Fire and Rescue?” The two top responses were non-economic in nature – “meaningful work” and “supportive management,” followed by “promotional opportunities” and “treatment of more tenured employees.”
60.6%
15.2%
11.6%
6.5%
2.9%
2.4%
0.5%
0.2%
0.0% 10.0% 20.0% 30.0% 40.0% 50.0% 60.0% 70.0%
First department that offered me a position
Recommendation of a friend, family member orcurrent employee
Live in the area
Other
Reputation of the Department
Shift schedule
Pay
Benefits
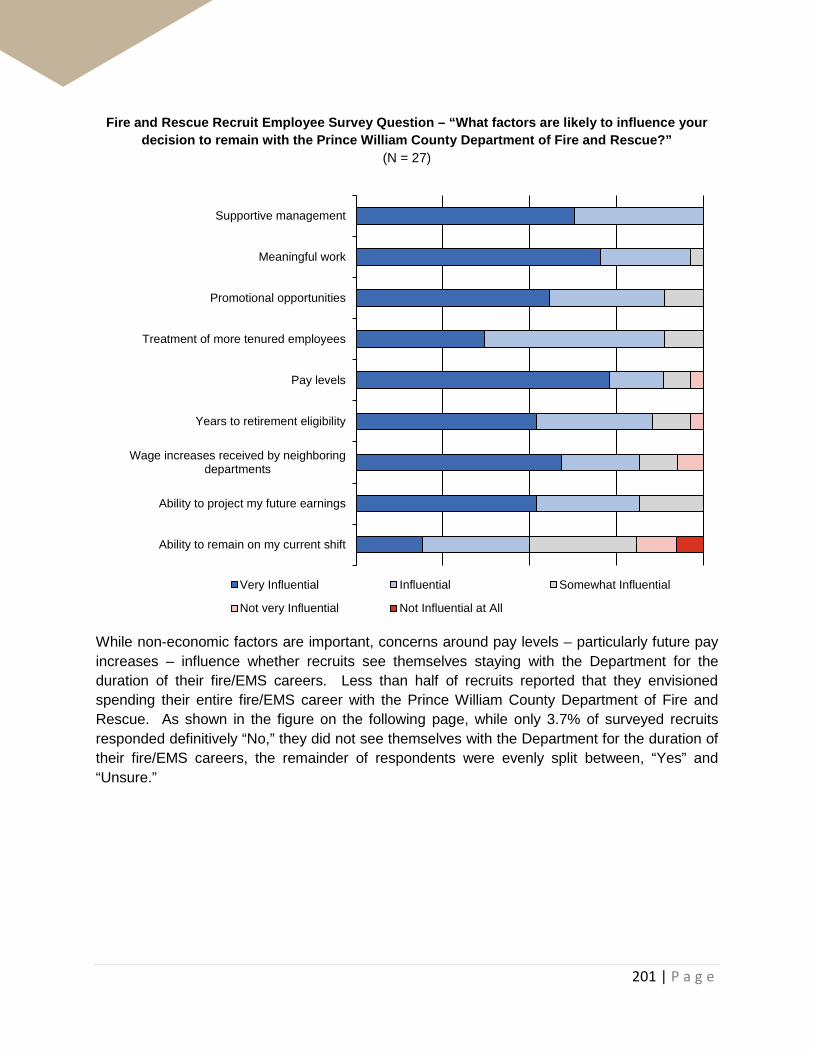
201 | P a g e
Fire and Rescue Recruit Employee Survey Question – “What factors are likely to influence your decision to remain with the Prince William County Department of Fire and Rescue?”
(N = 27)
While non-economic factors are important, concerns around pay levels – particularly future pay increases – influence whether recruits see themselves staying with the Department for the duration of their fire/EMS careers. Less than half of recruits reported that they envisioned spending their entire fire/EMS career with the Prince William County Department of Fire and Rescue. As shown in the figure on the following page, while only 3.7% of surveyed recruits responded definitively “No,” they did not see themselves with the Department for the duration of their fire/EMS careers, the remainder of respondents were evenly split between, “Yes” and “Unsure.”
Supportive management
Meaningful work
Promotional opportunities
Treatment of more tenured employees
Pay levels
Years to retirement eligibility
Wage increases received by neighboringdepartments
Ability to project my future earnings
Ability to remain on my current shift
Very Influential Influential Somewhat Influential
Not very Influential Not Influential at All

202 | P a g e
Fire and Rescue Recruit Employee Survey Question – “Do you see yourself spending your entire fire/EMS career with the Prince William County Department of Fire and Rescue?”
(N = 27)
Six respondents provided additional commentary when asked to explain the main factors that would affect their decision to stay or leave the Department. This commentary included mentions of the ability to promote, the opportunity to be a dual service provider (fire and ALS), and whether or not the County adopted a pay scale with a defined progression. One recruit response mentioned that the following factors would influence his/her decision to remain with the department: “I think the advancements and specialty jobs are what keep me interested in the department. If we had a comparable pay scale to the other counties in the area I wouldn't even consider them.” [Emphases added]
Thus, while non-economic factors play a critical role in attracting qualified applicants to the Prince William County Department of Fire and Rescue, uncertainty around the prospects of future pay increases emerges as a concern for recruits – which may potentially contribute future attrition. A more predictable compensation plan, coupled with providing opportunities for professional growth, could potentially resolve some of the uncertainty for incoming recruits.
Finally, the recruit survey provides some valuable insight into messaging that will resonate well with incoming recruits. The Department may consider incorporating the messages below in communications with prospective applicants, as well as in marketing and online materials:
• Ample opportunities for growth (e.g., promotion and specialty assignments) • Department with a strong reputation • Understanding management and strong mentorship • Strong future earning potential • Competitive health, retirement, and supplemental benefits plans
Yes48.2%
No3.7%
Unsure48.2%

203 | P a g e
VIII. Sheriff’s Office Compensation, Retention, and Recruitment
Summary of Findings Compensation
• Organizational functions and scope of duties for sheriff’s deputies vary widely in the region. Prince William County sheriff’s deputies are the only deputies in the region whose scope of duties focus primarily on courtroom security and civil processes – deputies in other jurisdictions in the comparison group may be responsible for jail services and/or patrol and criminal investigations.
• Nevertheless, relative to the Northern Virginia comparison group, starting pay for Prince William County’s sheriff deputy pay is competitive.
• Prince William County has the second highest entry rate for new hires among regional Sheriff’s Offices. In practice, the starting rate is usually increased further with recruitment incentives since the Sheriff’s Office principally hires individuals with prior law enforcement experience.
• Overall, the premium pays offered by the County are in-line with the comparison group.
Retention
• Because of the comparatively small size of the Sheriff’s Office – approximately 80 sworn employees – employee turnover and quit rates can be volatile from year-to-year. Nevertheless, in FY 2017, employee turnover quit rates and turnover rates were the lowest since FY 2013.
• Most Sheriff’s Offices surveyed did not have attrition data by assignment, making comparisons across jurisdictions difficult.
• Since FY 2013, attrition has been driven by a mix of voluntarily resignations and retirements – one type of separation is not driving the attrition process.
• Employee surveys and focus groups highlight compensation as the primary internal factor driving employee dissatisfaction, motivating employees to voluntarily leave the Department.
• Pay compression and inability to project future earnings are cited as the concerns/issues with the current compensation package. A majority of respondents to the active Sheriff’s Office employee survey reported that:
o Employees with longer tenure should have higher levels of base pay;
o Their pay levels are not appropriate for their level of responsibility and tenure; and

204 | P a g e
o They are unable to reasonably estimate their future earnings in five, 10, or 15 years.
• These findings indicate that approaches to alleviate pay compression, align compensation levels with tenure, and provide a more predictable schedule of future earnings – e.g., a well-defined pay progression – may have the greatest effect on improving employee satisfaction, and maintain the agency’s low attrition rates.
Recruitment
• From a recruitment perspective, the Department continues to maintain a large pipeline of strong recruits.
• More than three-quarters of employee respondents report having prior law enforcement experience prior to joining the Sheriff’s Office; nearly one-quarter of respondents report having previously worked at the Prince William County Police Department.
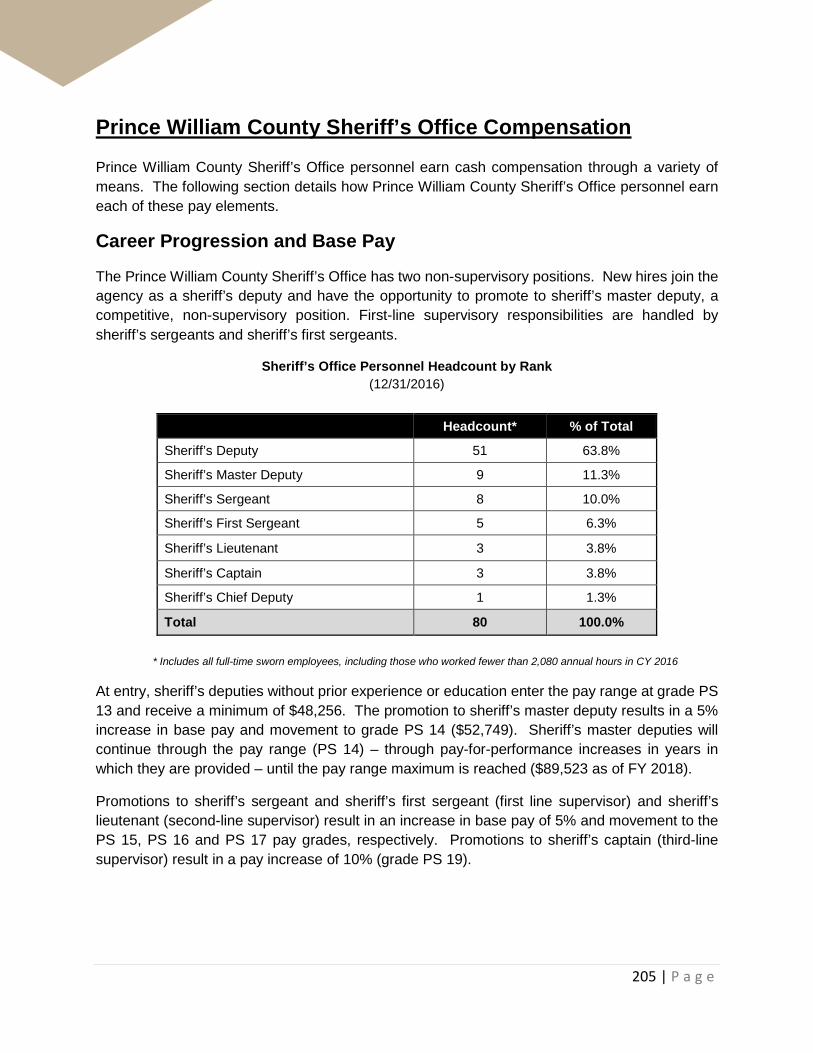
205 | P a g e
Prince William County Sheriff’s Office Compensation Prince William County Sheriff’s Office personnel earn cash compensation through a variety of means. The following section details how Prince William County Sheriff’s Office personnel earn each of these pay elements.
Career Progression and Base Pay
The Prince William County Sheriff’s Office has two non-supervisory positions. New hires join the agency as a sheriff’s deputy and have the opportunity to promote to sheriff’s master deputy, a competitive, non-supervisory position. First-line supervisory responsibilities are handled by sheriff’s sergeants and sheriff’s first sergeants.
Sheriff’s Office Personnel Headcount by Rank (12/31/2016)
Headcount* % of Total
Sheriff’s Deputy 51 63.8%
Sheriff’s Master Deputy 9 11.3%
Sheriff’s Sergeant 8 10.0%
Sheriff’s First Sergeant 5 6.3%
Sheriff’s Lieutenant 3 3.8%
Sheriff’s Captain 3 3.8%
Sheriff’s Chief Deputy 1 1.3%
Total 80 100.0% * Includes all full-time sworn employees, including those who worked fewer than 2,080 annual hours in CY 2016
At entry, sheriff’s deputies without prior experience or education enter the pay range at grade PS 13 and receive a minimum of $48,256. The promotion to sheriff’s master deputy results in a 5% increase in base pay and movement to grade PS 14 ($52,749). Sheriff’s master deputies will continue through the pay range (PS 14) – through pay-for-performance increases in years in which they are provided – until the pay range maximum is reached ($89,523 as of FY 2018).
Promotions to sheriff’s sergeant and sheriff’s first sergeant (first line supervisor) and sheriff’s lieutenant (second-line supervisor) result in an increase in base pay of 5% and movement to the PS 15, PS 16 and PS 17 pay grades, respectively. Promotions to sheriff’s captain (third-line supervisor) result in a pay increase of 10% (grade PS 19).

206 | P a g e
The table below illustrates the pay ranges for each uniformed title in the Sheriff’s Office:
Prince William County Sheriff’s Office Pay Ranges Effective July 1, 2017 – June 30, 2018
Grade Minimum Maximum
Sheriff’s Deputy PS 13 $48,256 $81,910
Sheriff’s Master Deputy PS 14 $52,749 $89,523
Sheriff’s Sergeant PS 15 $57,845 $98,238
Sheriff’s First Sergeant PS 16 $63,856 $108,410
Sheriff’s Lieutenant PS 17 $70,741 $120,120
Sheriff’s Captain PS 19 $81,432 $138,258
Sheriff’s Chief Deputy PS 21 $89,794 $152,464
Hiring Practices at Entry
The Sheriff’s Office principally hires employees with prior law enforcement experience; in recent years few new hires have gone through the academy. Accordingly, while the pay range minimum for a Sheriff’s Deputy is at grade PS 13 is $48,256, the actual base pay earned at entry will vary considerably according to prior law enforcement experience, prior military experience, language skills, and educational attainment. A Sheriff’s Deputy may receive any combination of recruitment incentives (up to the midpoint of the PS 13 pay range) listed below:
• Intra-County Transfers: Applicants to the Sheriff’s Office from other Prince William County departments may receive a pay increase, based on a case-by-case basis, as determined by the Sheriff.
• Virginia Certified Law Enforcement Officer: 5.0% increase over entry for officers who are a certified law enforcement officer in the Commonwealth of Virginia and possess more than 2 YOS. An additional 5% is available for certified officers who have successfully completed a Court Security/Civil Process School and/or Jailor Basic Academy in the Commonwealth of Virginia.
• Military Experience: 2.0% over entry for up to 2 YOS, 5% for 2 to 5 YOS.
• Education: 2.0% increase over entry for an associate’s degree, 5.0% increase for a bachelor’s degree, 7.0% increase for a master’s degree.
207 | P a g e
Given the variety of pay premiums that may influence base pay at entry, the range for base pay for sheriff’s deputies in any given year of service may fluctuate materially.
As a result, deputies with the same level of experience with the Sheriff’s Office will earn different levels of base compensation. Moreover, depending on recruitment incentives earned, sheriff’s deputies with less tenure at the department may earn higher levels of base pay than deputies who possess more tenure with the department in the same rank. In the absence of a well-defined pay progression, variances between pay can continue throughout the course of a career with the Sheriff’s Office without equalizing.
Additional Compensation
Additional pay premiums received by sheriff’s deputies include:
• Holiday Pay: Prince William County Sheriff’s Office personnel receive 12 holidays and receive 2.5x pay (1.5x premium) if the holiday is worked. For those employees receiving this premium, the additional compensation averaged $698 in calendar year 2016.
• Shift Differential: Shift differential pay is provided to sheriff’s deputies only for work between 9:00 PM and 7:00 AM. Sheriff’s deputies receive an additional $0.70 per hour actually worked. For those sheriff’s deputies receiving this premium, the additional compensation averaged $253 in calendar year 2016.
• Performance Plus Pay: Employees may also receive Performance Plus Pay, a one-time payment based on employee evaluations. Employees who receive an “exceeds” rating earn an additional 1% lump-sum payment; employees with a “greatly exceeds” rating receive additional lump-sum payment of 2%. For those employees receiving this premium, the additional compensation averaged $921 in calendar year 2016.
Further, Sheriff’s Office personnel have opportunities to earn compensation through overtime. Sheriff’s Office personnel up to the rank of sheriff’s lieutenant earn overtime (1.5x pay), and sheriff’s lieutenants earn straight time for additional hours in excess of a regularly scheduled cycle. For calendar year 2016, sworn Sheriff’s Office employees who were eligible for this premium earned an average of approximately $2,700. Sheriff’s deputies are also eligible for a language pay stipend for Spanish fluency of $1,752.
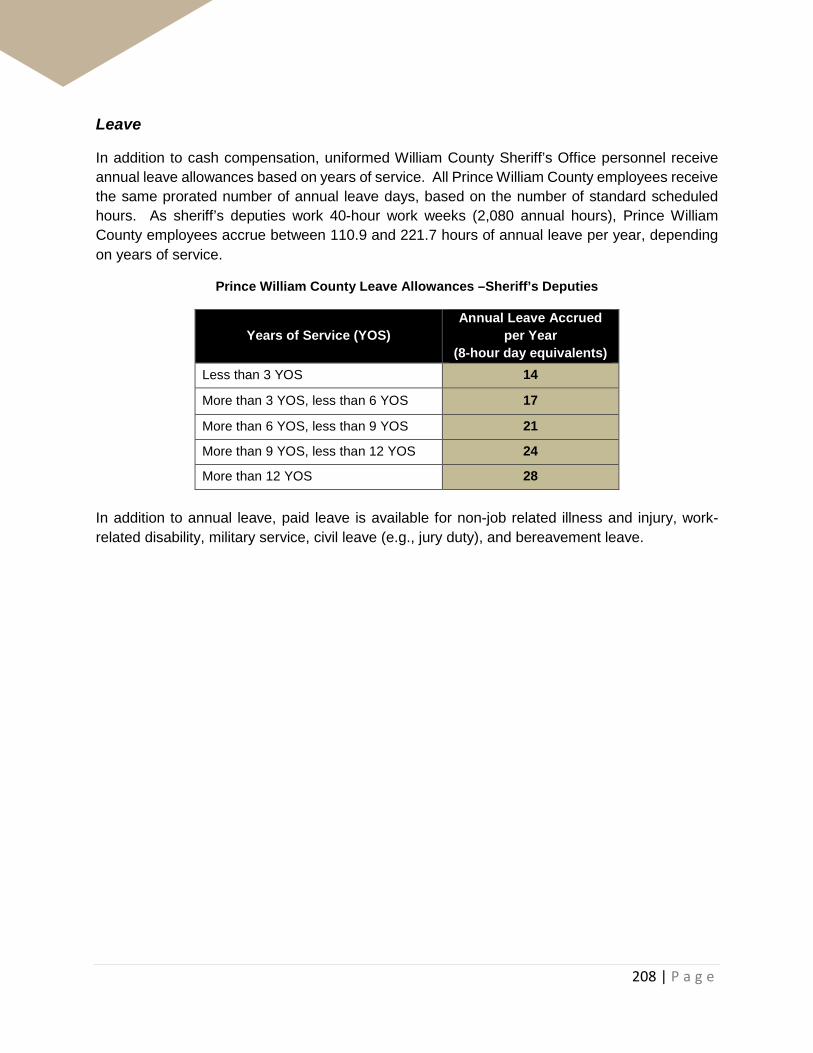
208 | P a g e
Leave
In addition to cash compensation, uniformed William County Sheriff’s Office personnel receive annual leave allowances based on years of service. All Prince William County employees receive the same prorated number of annual leave days, based on the number of standard scheduled hours. As sheriff’s deputies work 40-hour work weeks (2,080 annual hours), Prince William County employees accrue between 110.9 and 221.7 hours of annual leave per year, depending on years of service.
Prince William County Leave Allowances –Sheriff’s Deputies
Years of Service (YOS) Annual Leave Accrued
per Year (8-hour day equivalents)
Less than 3 YOS 14
More than 3 YOS, less than 6 YOS 17
More than 6 YOS, less than 9 YOS 21
More than 9 YOS, less than 12 YOS 24
More than 12 YOS 28 In addition to annual leave, paid leave is available for non-job related illness and injury, work-related disability, military service, civil leave (e.g., jury duty), and bereavement leave.

209 | P a g e
Northern Virginia Sheriff’s Office Compensation The section that follows provides comparisons of Prince William County sheriff’s deputy compensation with the Northern Virginia comparison group.
The scope of duties varies considerably among sheriff’s deputies in the region. While Prince William County sheriff’s deputies primarily focus on court room security and civil processes, over the course of a career, deputies in other jurisdictions may also work in patrol, criminal investigations, or jail services – assignments that fall outside role of the Sheriff’s Office in Prince William County.
Sheriff’s Office Duties – Northern Virginia
General Law Enforcement
Services Jail
Services Process Service
Court Security
Prisoner Transport
Child Support
Enforcement
Domestic Violence
Intervention
Prince William County - - - Fairfax County - - - Alexandria City - - - Arlington County - - Loudoun County
Additionally, Prince William County sheriff’s deputies provide back up to primary law enforcement agencies conducting criminal or traffic investigations within the County, assists with civil investigations, and operates juvenile restorative justice program for at-risk youth.
Base Pay Comparisons
Among the Northern Virginia comparison group with separate Police and Sheriff’s Departments, only Arlington County offers pay parity. Alexandria City and Fairfax County maintain separate pay plans for these two employee groups. As noted in the table above, Loudoun County’s Sheriff’s Department also provides general law enforcement services (e.g., patrol and criminal investigations).
Even though the job duties of a Prince William County sheriff’s deputy can be materially different from deputy sheriffs in the region, as shown in the table on the following page, Prince William County’s sheriff’s deputy starting base pay ranks 2 of 5 relative to the comparison group.
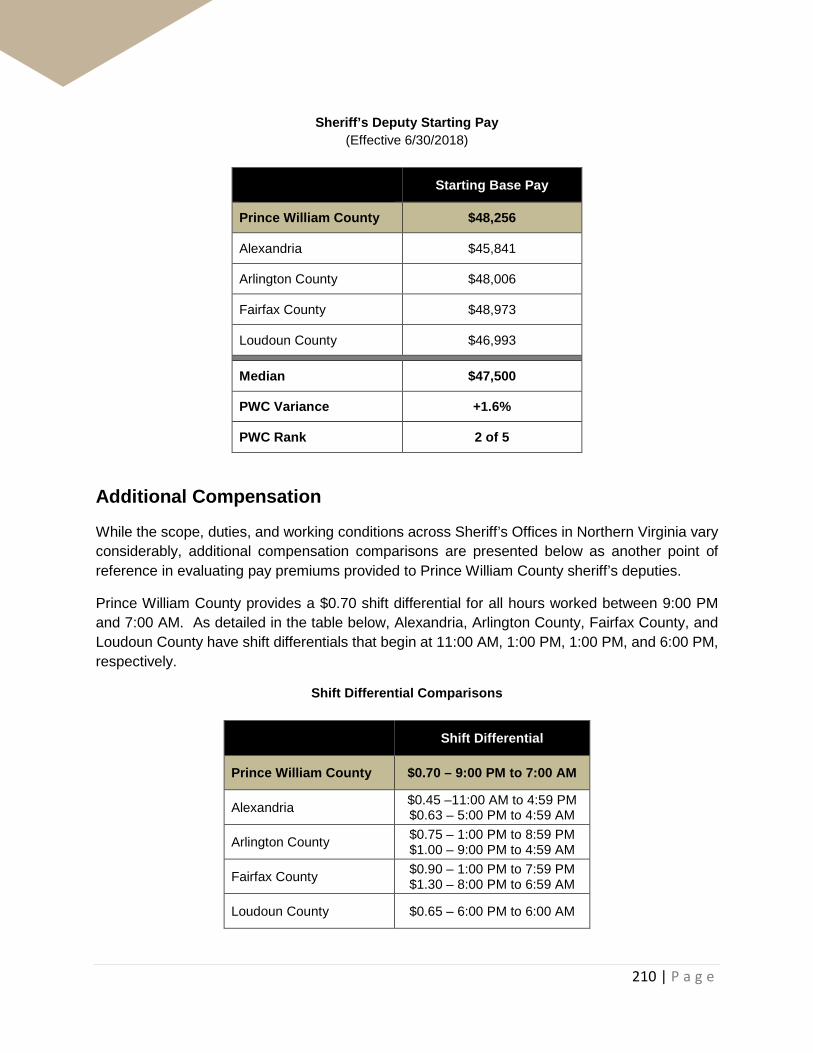
210 | P a g e
Sheriff’s Deputy Starting Pay (Effective 6/30/2018)
Starting Base Pay
Prince William County $48,256
Alexandria $45,841
Arlington County $48,006
Fairfax County $48,973
Loudoun County $46,993
Median $47,500
PWC Variance +1.6%
PWC Rank 2 of 5
Additional Compensation
While the scope, duties, and working conditions across Sheriff’s Offices in Northern Virginia vary considerably, additional compensation comparisons are presented below as another point of reference in evaluating pay premiums provided to Prince William County sheriff’s deputies.
Prince William County provides a $0.70 shift differential for all hours worked between 9:00 PM and 7:00 AM. As detailed in the table below, Alexandria, Arlington County, Fairfax County, and Loudoun County have shift differentials that begin at 11:00 AM, 1:00 PM, 1:00 PM, and 6:00 PM, respectively.
Shift Differential Comparisons
Shift Differential
Prince William County $0.70 – 9:00 PM to 7:00 AM
Alexandria $0.45 –11:00 AM to 4:59 PM $0.63 – 5:00 PM to 4:59 AM
Arlington County $0.75 – 1:00 PM to 8:59 PM $1.00 – 9:00 PM to 4:59 AM
Fairfax County $0.90 – 1:00 PM to 7:59 PM $1.30 – 8:00 PM to 6:59 AM
Loudoun County $0.65 – 6:00 PM to 6:00 AM

211 | P a g e
Only one jurisdiction in the comparison group – Fairfax County – provides uniform allowance to deputy sheriffs.
Uniform Allowance Comparisons
Uniform Allowance
Prince William County -
Alexandria -
Arlington County -
Fairfax County $500
Loudoun County -
Prince William County’s holiday pay schedule is competitive with other Sheriff’s Offices in the region.
Holidays and Holiday Pay
Number of Holidays Holiday Pay Formula
Prince William County 12 holidays 2.5x pay (1.5x premium) if holiday is worked; no additional premium if holiday is not worked
Alexandria 11.25 holidays 2.5x pay or leave (1.5x premium) for each holiday worked; no additional compensation if holiday not
worked
Arlington County 12.25 holidays 8 hours of pay or leave regardless if holiday is worked
Fairfax County 11.75 holidays 2.0x pay (1.0x premium) if holiday is worked; no additional premium if holiday is not worked
Loudoun County 13.5 holidays 8.5 hours at 2.5x pay (1.5x premium) for each holiday worked; 8.5 hours at 1.0x pay (1.0x premium)
Prince William County does not provide on-call pay, though sheriff’s deputies are typically on call four days per month. Three jurisdictions analyzed – Arlington County, Fairfax County, and Loudoun County – provide on-call pay. Though in practice, Arlington County reports that on-call pay is rarely paid. Instead, deputies are usually recalled to work, when needed, and paid call back pay.

212 | P a g e
On-Call Pay Comparisons
On-Call Pay
Prince William County None
Alexandria None
Arlington County 1 hour (if scheduled to work); 2 hours (if
scheduled day off). Employee may choose pay or leave
Fairfax County 1 hour (if scheduled to work); 2 hours (if
scheduled day off). Employee may choose pay or leave
Loudoun County $3.97 per hour
Most Sheriff’s Offices reviewed provide language pay, including Prince William County.
Language Pay Comparisons
Language Pay
Prince William County 5% of base at time of hire or $1,752.04/year (Spanish only)
Alexandria -
Arlington County $0.68/hour; $1,414/year (Spanish only)
Fairfax County One step at time of hire + $1,300/year for certification in a second language
Loudoun County 5% of base pay (Spanish only)
In addition to the education incentive pay at hire, Prince William County sheriff’s deputies may also receive additional compensation if they obtain a Bachelor’s or Master’s degree, as shown on the table on the following page.

213 | P a g e
Education Incentive Pay
Education Incentive Pay
Prince William County Between 2.0% (Associate’s Degree) and 7.0%
(Master’s Degree) at hire; 2% in-grade increase if degree (Bachelor’s or Master’s)
obtained while employed
Alexandria -
Arlington County -
Fairfax County New hires may receive a step increase at time of hire based on educational attainment
Loudoun County Between 5.0% (Associate’s Degree) and 15.0% (Doctorate)
Sheriff’s Office field training officers (FTO) receive one hour of overtime per day they serve in an FTO capacity.
Field Training Officer Pay
Field Training Officer Pay
Prince William County 1 hour of OT for each day assigned
Alexandria 5% of base pay
Arlington County $1.34/hour
Fairfax County $3.00/hour
Loudoun County $2.00/hour
Hiring Practices at Entry
Hiring practices at entry vary considerably across the comparison group. At entry base pay, the City of Alexandria and Arlington County do not take education, language, and prior law enforcement experience outside of Northern Virginia into consideration. Law enforcement certification by the Virginia Department of Criminal Justice Services, however, is a factor that is taken into consideration during the lateral hire process.
Fairfax and Loudoun Counties, however, will adjust an officer/deputy sheriff’s entry rate to account for a combination of education, language, and prior work experience. Alexandria, Arlington County, and Fairfax County each have well-defined pay progressions, and as such, and any

214 | P a g e
differences in base pay among deputies with the same tenure is equalized when deputies reach the maximum of the pay schedule/range.
Additional detail on the hiring practices of sheriff’s deputies is provided below:
• The City of Alexandria may provide an increase in base pay for deputy sheriffs at hire, subject to the discretion of the Sheriff.
• In Arlington County, the standard practice is for all new hires to start at the pay range minimum. However, in rare instances, a lateral hire may enter at a higher rate. In these instances, the starting rate is at the Sheriff’s discretion, in concurrence with the County Human Resources Department.
• Fairfax County has a lateral hire program that provides allows new hires with prior applicable experience to start at a higher step in on the County pay schedule.
• In Loudoun County, deputy sheriffs receive adjustments to base pay at hire according to education, law enforcement/military experience, and language proficiency (Spanish) up to the pay range midpoint. Deputies receive 5% for every two years of law enforcement experience (regardless if in Virginia or out of state); 5% for an Associate’s degree, 10% for a Bachelor’s degree, and 15% for a Master’s degree or higher, and 5% for Spanish language proficiency. These recruitment incentives, however are not always cumulative. The final dollar amount provided will be compared to base salary of deputies currently on the payroll, and adjusted to be consistent with pay levels for deputies with similar qualifications and work experience.
Rank Structure
Approximately 75% of the Sheriff’s Office is comprised of non-supervisory deputies (sheriff’s deputies and master deputies).28 Many regional Sheriff’s Offices create career paths for employees to grow in both pay and duties without assuming as supervisory role. Maintaining such a career path allows for employees to grow in both pay and duties, as well as, encourages personnel to stay with a department through the duration of a career.
The following table provides a summary of the non-supervisory career paths available to sheriff’s deputies in the Northern Virginia comparison group.
28 As of 12/31/2016 departmental payroll run.

215 | P a g e
Sheriff’s Deputy Non-Supervisory Career Path
Non-Competitive, Non-Supervisory Ranks Competitive, Non-Supervisory Rank
Prince William County Sheriff’s Deputy - - Sheriff’s Master Deputy
Alexandria City Deputy Sheriff I Deputy Sheriff II Deputy Sheriff III Master Deputy Sheriff
Arlington County Deputy Sheriff Deputy Sheriff II - Corporal
Fairfax County Deputy Sheriff I Deputy Sheriff II - Master Deputy Sheriff
Loudoun County Recruit Deputy Sheriff Deputy First Class Master Deputy
Rank Differentials
Rank differentials, also known as “promotional differentials,” are defined as the percentage difference in pay earned by employees between ranks. When a sheriff’s lieutenant is promoted to captain, for example, he/she receives a 10% increase to base pay, which constitutes a 10% rank differential.
In the Prince William County Sheriff’s Office, supervisors receive rank differentials of 5% for promotion to sergeant through lieutenant, and 10% for promotion to captain.

216 | P a g e
Sheriff’s Deputy Rank Differentials
First-Line Supervisor Second-Line Supervisor Third-Line Supervisor
Prince William County
Sergeant: 5.0% over Master Deputy
1st Sergeant: 5.0% over Sergeant
Lieutenant: 5.0% over 1st Sergeant
Captain: 10.0% over Lieutenant
Alexandria Sergeant: 10.0% over Master Deputy
Lieutenant: 10.0% over Sergeant
Captain: 20.0% over Lieutenant
Arlington County Sergeant: 10.0% over
Corporal; 15% over DS II
Lieutenant: 10% over Sergeant
Captain: 10% over Lieutenant
Fairfax County
Sergeant: 10.2% over DS II; 5.0% over Master Deputy 2nd Lieutenant: 5.0% over
Sergeant
1st Lieutenant: 27.6% over 2nd
Lieutenant
Captain: 10.3% over 1st Lieutenant
Loudoun County
Sergeant: 10% over Deputy First Class;
5.0% over Master Deputy 2nd Lieutenant: 5.0% over
Sergeant
1st Lieutenant: 5.0% over 2nd Lieutenant
Captain: 5.0% over 1st Lieutenant
Overtime Differentials
The table on the following page details overtime differentials earned by rank in each of the Northern Virginia jurisdictions surveyed.

217 | P a g e
Sheriff’s Deputy Overtime Differentials
Non-Competitive Rank & File
Competitive, Non-Supervisory
First-Line Supervisor
Second-Line Supervisor
Third-Line Supervisor
Prince William County
Sheriff’s Deputy
OT: 1.5x pay or comp time
Sheriff’s Master Deputy
OT: 1.5x pay or
comp time
Sergeant and 1st Sergeant
OT: 1.5x pay or
comp time
Lieutenant
OT: 1.0x pay or comp time
Captain
OT: N/A
Alexandria City
Deputy Sheriff I-II
OT: 1.5x pay or comp time
Master Deputy Sheriff
OT: 1.5x pay or
comp time
Sergeant
OT: 1.5x pay or comp time
Lieutenant
OT: 1.0x pay
Captain
OT: 1.0x pay
Arlington County Deputy Sheriff I-II
OT: 1.5x pay
Corporal
OT: 1.5x pay
Sergeant
OT: 1.5x pay
Lieutenant
OT: 1.0x pay or comp time
Captain
OT: 1.0x pay or comp time
Fairfax County
Sheriff I-II
OT: 1.5x pay or comp time
Master Deputy
OT: 1.5x pay or comp time
Sergeant and Second Lieutenant
OT: 1.5x pay or
comp time
Lieutenant
OT: 1.0x pay or comp time
Captain
OT: 1.0x comp time
Loudoun County
Recruit, Deputy Sheriff, Deputy First
Class
OT: 1.5x pay or comp time
Master Deputy
OT: 1.5x pay or comp time
Sergeant and Second Lieutenant
OT: 1.5x pay or
comp time
First Lieutenant
OT: 1.5x pay or comp time
Captain
OT: No addition pay; 3 extra personal days
per year

218 | P a g e
Retention of Deputy Sheriffs This section focuses on two principal types of employee separations – voluntary resignations and service retirements. Voluntary resignations – or “quits” – refer to individuals who resign from the Sheriff’s Office before becoming eligible for an unreduced pension benefit. Service retirements refer to individuals who separate from the Sheriff’s Office after becoming eligible for an unreduced pension benefit, and leave the Office to pursue other employment, or leave the workforce all together.
Additionally, retention is evaluated through the lens of two metrics:
• Turnover Rate: percentage of employees who leave the Sheriff’s Office for all reasons (e.g., quits, service retirements, medical retirements, terminations, resignations in lieu of termination, voluntary demotions, and death)29
• Quit Rate: percentage of employees who voluntarily resign, or quit, from the Sheriff’s Office
Quits vs. Retirements
Departments may face different retention challenges – and require differing solutions – depending on the structural forces driving attrition trends. The table on the following page details all sworn Sheriff’s Office personnel by year of service as of 12/31/2016. Almost three-quarters (70.6%) of rank-and-file sheriff’s deputies (Sheriff’s Deputy and Sheriff’s Master Deputy) have 10 or fewer years of service with the Sheriff’s Office. However, many deputies come to Sheriff’s Office from other law enforcement agencies, and may have accrued VRS service with another department.
29 Though employees who take a voluntary demotion may remain with the Department, they do so in a non-law enforcement capacity, and are therefore characterized as “separations” for the purposes of the turnover rate calculations

219 | P a g e
Employee Distribution by Year of Service – Prince William County Sheriff’s Office (Effective 12/31/2016)
Years Served Year Sheriff’s
Deputy Sheriff’s Master Deputy
Sheriff’s Sergeant
Sheriff’s First
Sergeant Sheriff’s
Lieutenant Sheriff’s Captain
Sheriff’s Chief
Deputy Headcount
by YOS Headcount as a % of
Total 0 1 4 1 - - - - - 5 6.25% 1 2 9 - - - - - - 9 11.25% 2 3 5 - - - - - - 5 6.25% 3 4 3 - - - - - - 3 3.75% 4 5 1 - - - - - - 1 1.25% 5 6 1 1 - - - - - 2 2.50% 6 7 1 - - - - - - 1 1.25% 7 8 6 2 - - - - - 8 10.00% 8 9 2 - 1 - - - - 3 3.75% 9 10 2 - 1 - - - - 3 3.75% 10 11 2 1 1 - - - - 4 5.00% 11 12 2 1 2 - - - - 5 6.25% 12 13 2 1 1 1 - - - 5 6.25% 13 14 - 1 1 1 - - - 3 3.75% 14 15 3 - 1 - - 1 - 5 6.25% 15 16 2 - - 1 - 1 - 4 5.00% 16 17 2 - - - - 1 - 3 3.75% 17 18 - - - 1 - - - 1 1.25% 18 19 1 - - 1 - - - 2 2.50% 19 20 2 - - - - - - 2 2.50% 20 21 1 - - - - - - 1 1.25% 21 22 - - - - - - - - 0.00% 22 23 - - - - - - - - 0.00% 23 24 - 1 - - 1 - 1 3 3.75% 24 25 - - - - 1 - - 1 1.25% 25 26 - - - - - - - - 0.00% 26 27 - - - - - - - - 0.00% 27 28 - - - - 1 - - 1 1.25% 28 29 - - - - - - - - 0.00%
29+ 30+ - - - - - - - - 0.00%
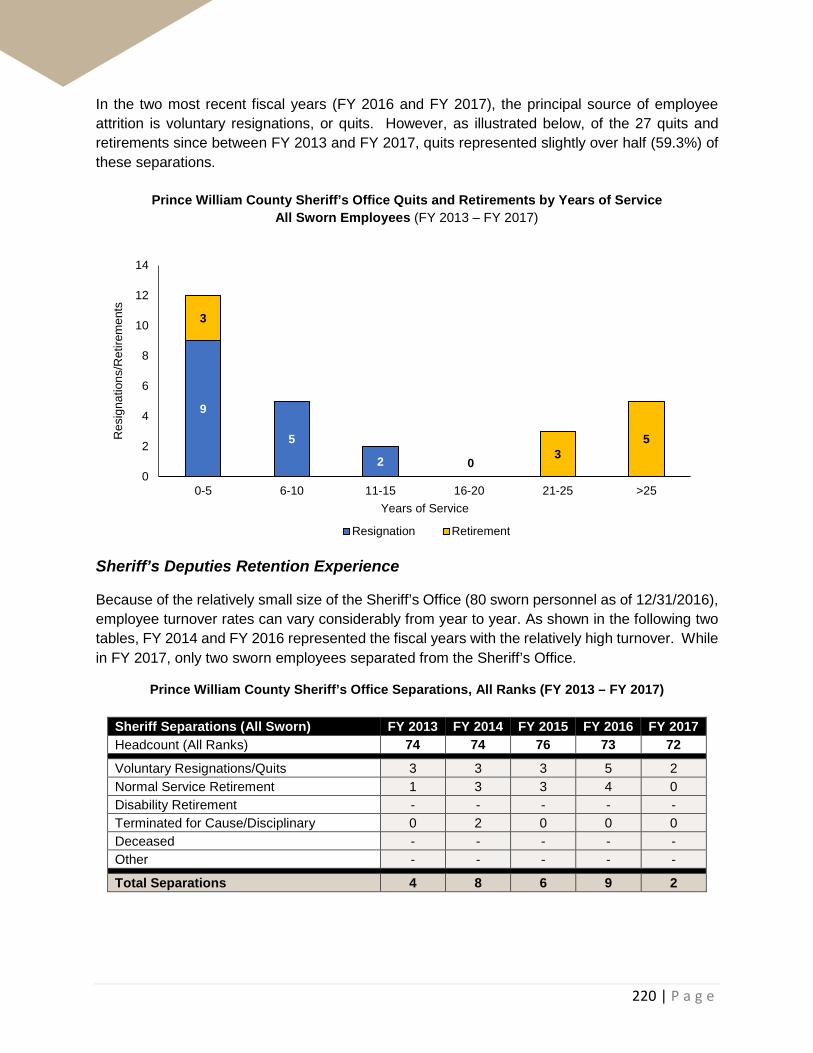
220 | P a g e
In the two most recent fiscal years (FY 2016 and FY 2017), the principal source of employee attrition is voluntary resignations, or quits. However, as illustrated below, of the 27 quits and retirements since between FY 2013 and FY 2017, quits represented slightly over half (59.3%) of these separations.
Prince William County Sheriff’s Office Quits and Retirements by Years of Service All Sworn Employees (FY 2013 – FY 2017)
Sheriff’s Deputies Retention Experience
Because of the relatively small size of the Sheriff’s Office (80 sworn personnel as of 12/31/2016), employee turnover rates can vary considerably from year to year. As shown in the following two tables, FY 2014 and FY 2016 represented the fiscal years with the relatively high turnover. While in FY 2017, only two sworn employees separated from the Sheriff’s Office.
Prince William County Sheriff’s Office Separations, All Ranks (FY 2013 – FY 2017)
Sheriff Separations (All Sworn) FY 2013 FY 2014 FY 2015 FY 2016 FY 2017 Headcount (All Ranks) 74 74 76 73 72
Voluntary Resignations/Quits 3 3 3 5 2 Normal Service Retirement 1 3 3 4 0 Disability Retirement - - - - - Terminated for Cause/Disciplinary 0 2 0 0 0 Deceased - - - - - Other - - - - -
Total Separations 4 8 6 9 2
9
5
2
3
03
5
0
2
4
6
8
10
12
14
0-5 6-10 11-15 16-20 21-25 >25
Res
igna
tions
/Ret
irem
ents
Years of Service
Resignation Retirement

221 | P a g e
Prince William County Separations, Sheriff’s Deputy and Sheriff’s Master Deputy (FY 2013 – FY 2017)
Sheriffs - Separations (Deputy & Master Deputy)
FY 2013
FY 2014
FY 2015
FY 2016
FY 2017
Headcount 55 55 55 57 59
Voluntary Resignations/Quits 1 2 3 3 0 Normal Service Retirement - - - - - Disability Retirement 2 3 3 5 2 Terminated for Cause/Disciplinary 0 2 0 0 0 Deceased - - - - - Other - - - - -
Total Separations 3 7 6 8 2 Only one jurisdiction, Alexandria, provided historical retention data for deputies primarily detailed to courtroom security. At the Alexandria’s Sheriff’s Office, between 30 and 33 deputies (all ranks) have been assigned to courtroom security annually since FY 2013. Over this period, one deputy resigned. No more than two deputies retired in a given year during this time period.
Drivers of Attrition
Prince William County sheriff’s deputies leave the Agency for a variety of external and internal factors. External factors provide the opportunity to leave, while internal factors provide the motivation. These factors have the most influence among early and mid-career personnel.
External Factors
There are multiple external drivers that may contribute to individual’s decision to voluntarily resign. One reason may include the relocation to another part of the Country for family or personal reasons. Another may be for other job opportunities – such as the opportunity to work a family business – that may be outside the control of the Agency.
A primary external driver is the economy. As the economy has improved since the Great Recession, outside employment opportunities have increased. This has been the case in other regional Departments. At the same time, wage growth in many of these agencies has exceeded that of Prince William County, creating both an opportunity and financial benefit for Prince William County personnel to join another organization.
The following table details some of the other employers current sworn personnel considered when hired by the Sheriff’s Office.
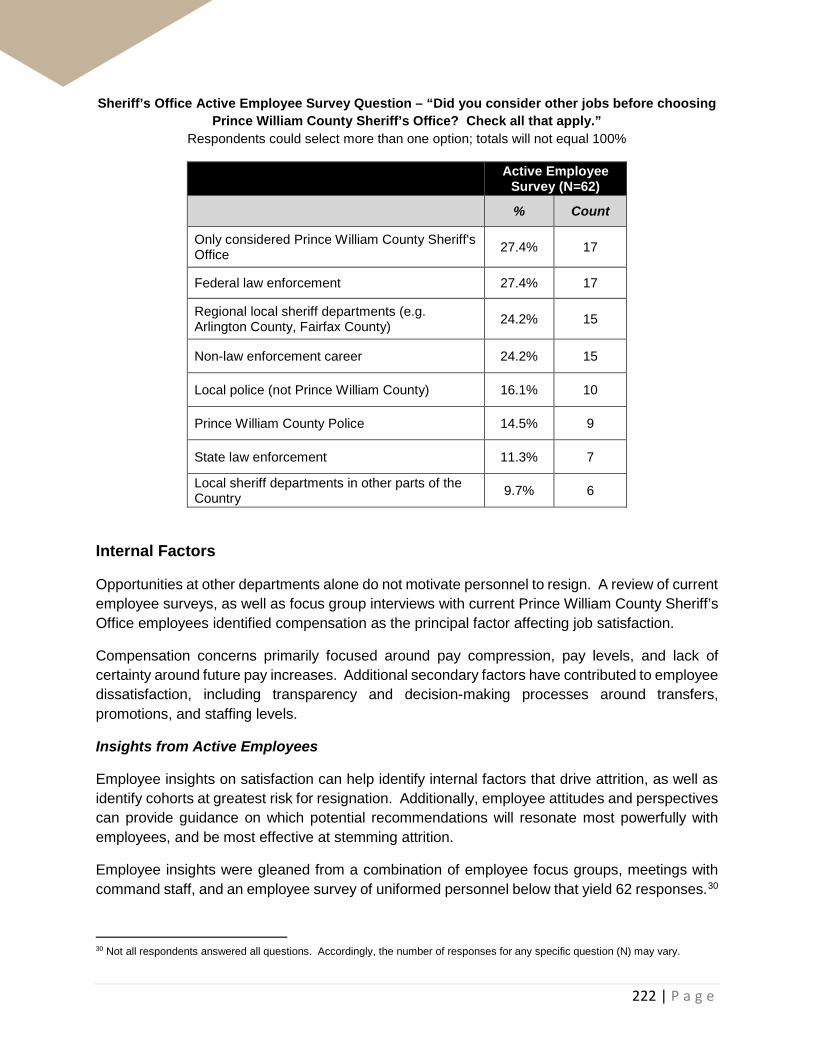
222 | P a g e
Sheriff’s Office Active Employee Survey Question – “Did you consider other jobs before choosing Prince William County Sheriff’s Office? Check all that apply.”
Respondents could select more than one option; totals will not equal 100%
Active Employee Survey (N=62)
% Count
Only considered Prince William County Sheriff's Office 27.4% 17
Federal law enforcement 27.4% 17
Regional local sheriff departments (e.g. Arlington County, Fairfax County) 24.2% 15
Non-law enforcement career 24.2% 15
Local police (not Prince William County) 16.1% 10
Prince William County Police 14.5% 9
State law enforcement 11.3% 7
Local sheriff departments in other parts of the Country 9.7% 6
Internal Factors
Opportunities at other departments alone do not motivate personnel to resign. A review of current employee surveys, as well as focus group interviews with current Prince William County Sheriff’s Office employees identified compensation as the principal factor affecting job satisfaction.
Compensation concerns primarily focused around pay compression, pay levels, and lack of certainty around future pay increases. Additional secondary factors have contributed to employee dissatisfaction, including transparency and decision-making processes around transfers, promotions, and staffing levels.
Insights from Active Employees Employee insights on satisfaction can help identify internal factors that drive attrition, as well as identify cohorts at greatest risk for resignation. Additionally, employee attitudes and perspectives can provide guidance on which potential recommendations will resonate most powerfully with employees, and be most effective at stemming attrition.
Employee insights were gleaned from a combination of employee focus groups, meetings with command staff, and an employee survey of uniformed personnel below that yield 62 responses.30
30 Not all respondents answered all questions. Accordingly, the number of responses for any specific question (N) may vary.
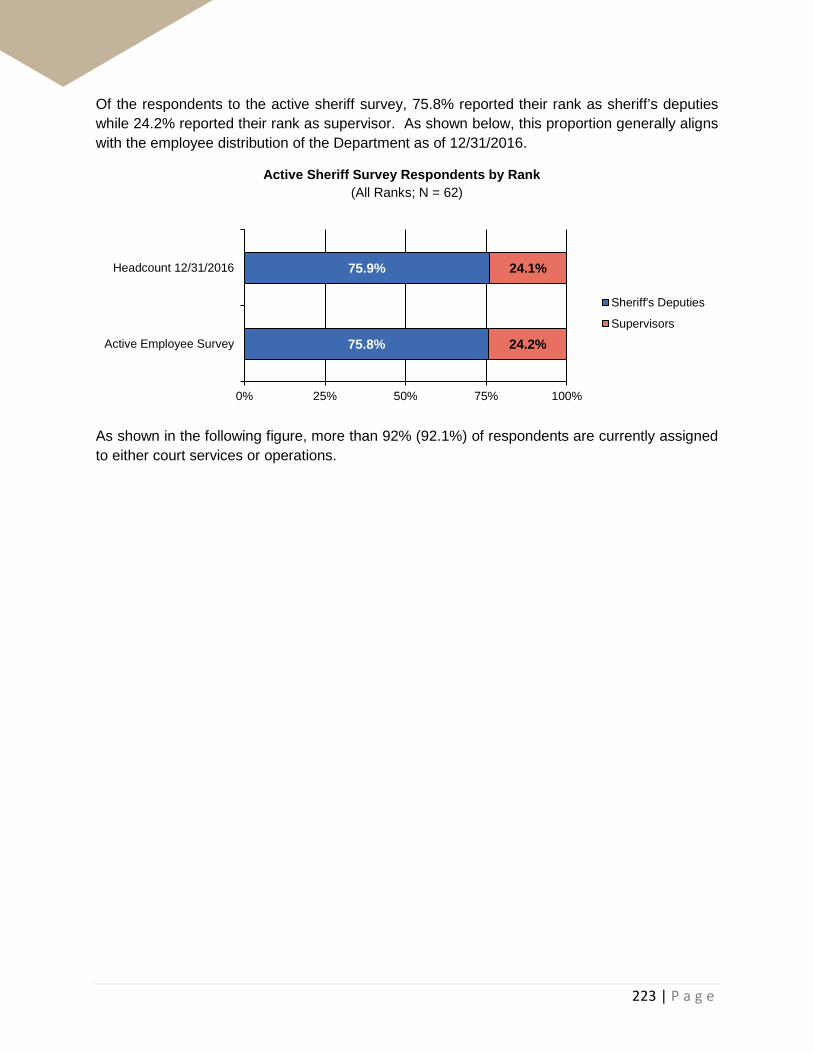
223 | P a g e
Of the respondents to the active sheriff survey, 75.8% reported their rank as sheriff’s deputies while 24.2% reported their rank as supervisor. As shown below, this proportion generally aligns with the employee distribution of the Department as of 12/31/2016.
Active Sheriff Survey Respondents by Rank (All Ranks; N = 62)
As shown in the following figure, more than 92% (92.1%) of respondents are currently assigned to either court services or operations.
75.8%
75.9%
24.2%
24.1%
0% 25% 50% 75% 100%
Active Employee Survey
Headcount 12/31/2016
Sheriff's Deputies
Supervisors
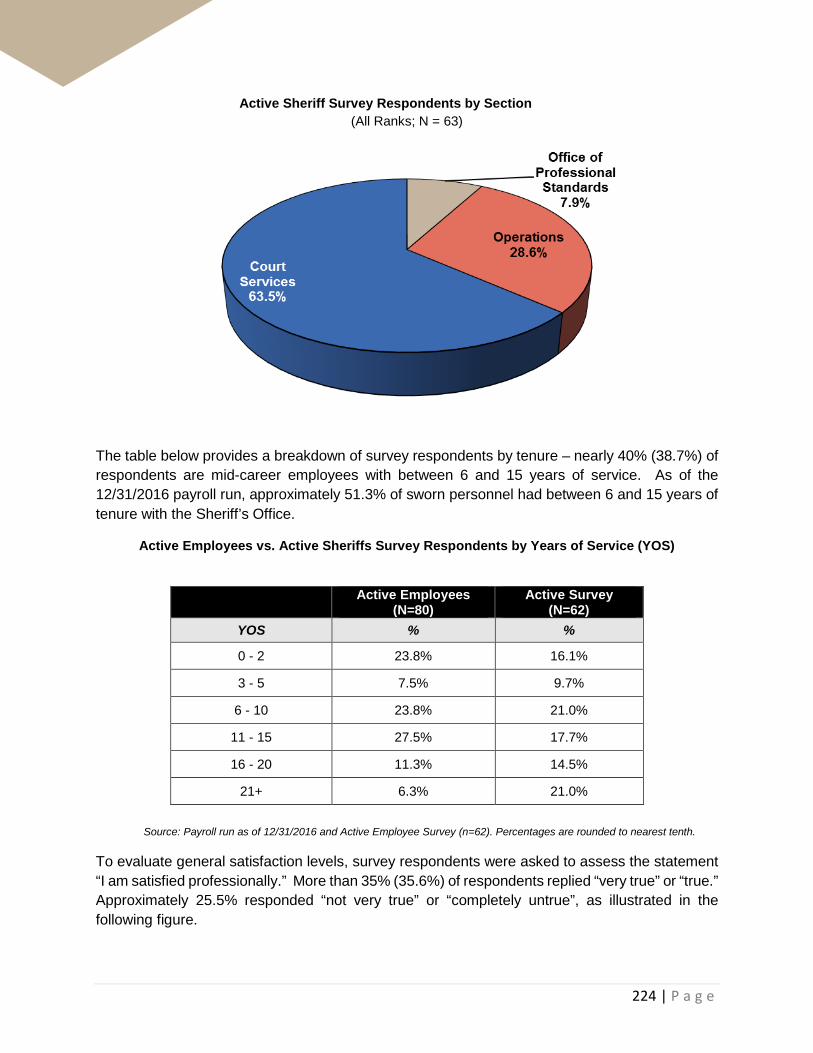
224 | P a g e
Active Sheriff Survey Respondents by Section (All Ranks; N = 63)
The table below provides a breakdown of survey respondents by tenure – nearly 40% (38.7%) of respondents are mid-career employees with between 6 and 15 years of service. As of the 12/31/2016 payroll run, approximately 51.3% of sworn personnel had between 6 and 15 years of tenure with the Sheriff’s Office.
Active Employees vs. Active Sheriffs Survey Respondents by Years of Service (YOS)
Active Employees (N=80)
Active Survey (N=62)
YOS % %
0 - 2 23.8% 16.1%
3 - 5 7.5% 9.7%
6 - 10 23.8% 21.0%
11 - 15 27.5% 17.7%
16 - 20 11.3% 14.5%
21+ 6.3% 21.0%
Source: Payroll run as of 12/31/2016 and Active Employee Survey (n=62). Percentages are rounded to nearest tenth.
To evaluate general satisfaction levels, survey respondents were asked to assess the statement “I am satisfied professionally.” More than 35% (35.6%) of respondents replied “very true” or “true.” Approximately 25.5% responded “not very true” or “completely untrue”, as illustrated in the following figure.

225 | P a g e
“I am satisfied professionally” (All Ranks; N = 59)
In focus groups, a concern was raised concerning staffing levels. This concern was also captured in the employee survey. Survey respondents were asked to assess the statement “We are understaffed.” More than one in two (59.3%) of respondents replied “very true” or “true.” Approximately 20.4% responded “not very true” or “completely untrue,” as illustrated below.
“We are understaffed” (All Ranks; N = 59)
The figure on the following page explores employee satisfaction levels across 11 specific dimensions of compensation, working conditions and benefits. One dimension receives an aggregate score greater than 75% - “work schedule” (very satisfied or satisfied). Of note, more than 50% of respondents reported that they were either “satisfied” or “very satisfied” with: “work/life balance,” “leave benefits,” and the “opportunity to obtain/maintain certifications.”
27.1% 32.2% 20.3% 15.3%
5.1%
0% 25% 50% 75% 100%
Very True
True
Somewhat True
Not Very True
Completely Untrue

226 | P a g e
On the opposite end of the spectrum, the dimension receiving the highest dissatisfaction score was “future pay increases” – more than 75% of respondents replied “completely unsatisfied” or “not very satisfied.”
“Employee Satisfaction Levels – Compensation, Working Conditions, Benefits”
(All Ranks; N = 57)
To provide additional context on the issue of compensation, the employee survey asked if compensation levels were “appropriate for my level of responsibility and years of experience” and sufficient to provide a “decent standard of living for me and my family” and Approximately 59.3% of respondents replied “not very true” or “completely untrue” to the first question, while 27.1% of respondents replied “not very true” or “completely untrue” to the second question.
0% 25% 50% 75% 100%
Future pay increases
Promotional opportunities/process
Decision-making process aroundassignments
Pay
Retirement benefits
Opportunity to move into a specialtyrole
Health benefits
Opportunity to obtain/maintaincertifications
Leave benefits
Work/life balance
My work schedule
Very Satisfied
Satisfied
Somewhat Satisfied
Not Very Satisfied
Completely Unsatisfied

227 | P a g e
Employee Satisfaction Levels – Compensation (All Ranks; N = 59)
In focus groups and comments in the employee survey, multiple employees referenced the lack of retention bonus as contributing to job dissatisfaction. Additionally, multiple Sheriff’s Office employees reported that they should be eligible for inclusion into the supplemental retirement plan currently available to police and fire and rescue personnel.
One respondent equated the lack of retention bonus and a different retirement benefits structure to not being “consider[ed]” a public safety agency in the eyes of the County:
The County does not consider the sheriff's office as public safety. So, we do not receive the same benefits as police and fire...when the police department receives new positions, this impacts our daily operations. By this, if they receive 25 employees, that is new cases, tickets, and more citizens entering our facility on a daily basis, with us operating with the same number of employees that we had. There is no consideration to including us in the staffing plan, which would improve morale and allow for deputies to take time off, which is limited due to staffing issues.
The quote above also provides first-hand insight into employee attitudes within the Sheriff’s Officer around staffing levels.
1.7%
1.7%
33.9%
11.9%
37.3%
27.1%
20.3%
39.0%
6.8%
20.3%
0% 25% 50% 75% 100%
I believe that a career with Prince WilliamCounty will provide a decent standard of
living for me and my family
My pay is appropriate for my level ofresponsibility and years of experience
Very True
True
Somewhat True
Not Very True
Completely Untrue
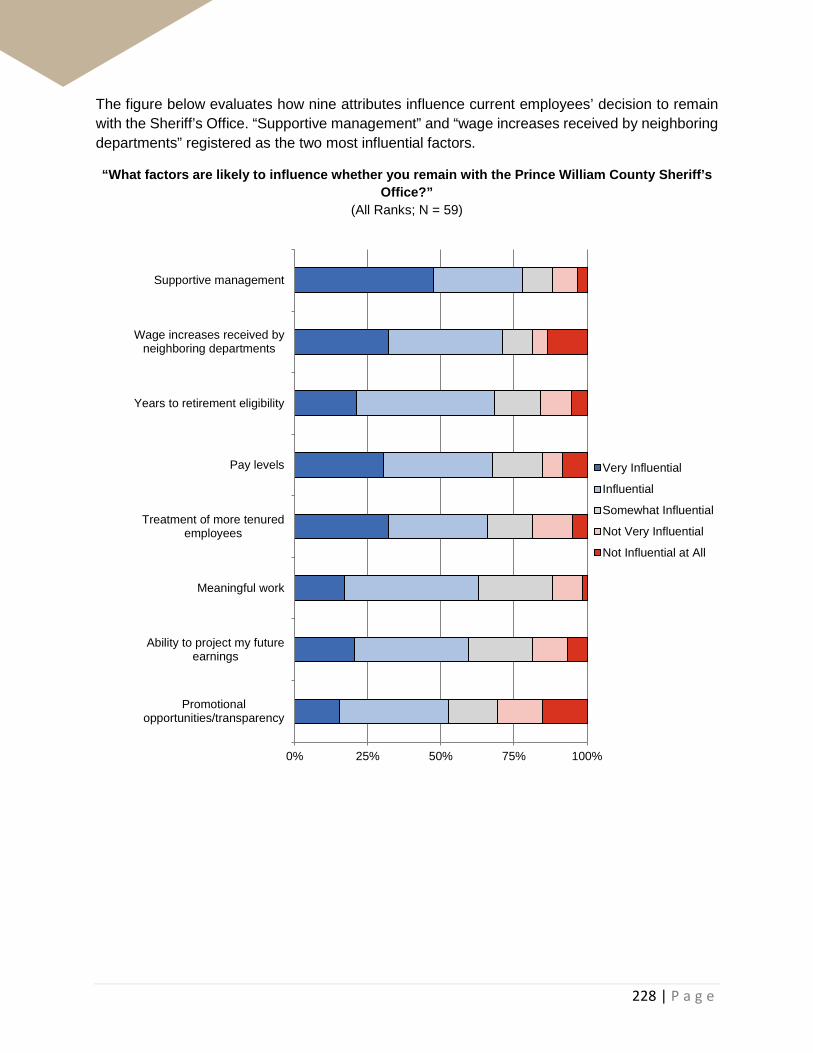
228 | P a g e
The figure below evaluates how nine attributes influence current employees’ decision to remain with the Sheriff’s Office. “Supportive management” and “wage increases received by neighboring departments” registered as the two most influential factors.
“What factors are likely to influence whether you remain with the Prince William County Sheriff’s Office?”
(All Ranks; N = 59)
0% 25% 50% 75% 100%
Supportive management
Wage increases received byneighboring departments
Years to retirement eligibility
Pay levels
Treatment of more tenuredemployees
Meaningful work
Ability to project my futureearnings
Promotionalopportunities/transparency
Very Influential
Influential
Somewhat Influential
Not Very Influential
Not Influential at All

229 | P a g e
When asked to evaluate the comparative strengths of the Sheriff’s Office, “schedule” was cited by more than 86% of respondents. Pay was cited by 8.5% of respondents as a strength.
“What do you consider strengths of the Prince William County Sheriff’s Office?” (All ranks; N = 59; Totals will not equal 100% as respondents can check multiple options)
% Count Schedule 86.4% 51 Co-workers 54.2% 32 Health benefits 35.6% 21 Leave benefits 33.9% 20 Retirement benefits 32.2% 19 Other (please specify) 11.9% 7 Pay 8.5% 5 Management/leadership 6.8% 4 Opportunities for promotional advancement 1.7% 1
Anticipating Attrition
As illustrated in the two figures on the following page, when looking across all ranks, 45.0% of active Sheriff’s Office employees reported that they envision spending their entire law enforcement career with Prince William County, while over a third (38.3%) responded that they were “unsure.” Approximately 17% of respondents replied that they applied for a job with another law enforcement agency within the past 12 months.

230 | P a g e
“Do you see yourself spending your entire law enforcement career with the Prince William County Sheriff’s Office?” (All Ranks; N = 60)
“Have you applied for a law enforcement position with another organization within the past 12 months?”
(All Ranks; N = 58)
Employee Perspectives on Compensation
The employee survey also gauged employee perspectives on compensation. Responses indicate that a large proportion of active employees are unable to project their future earnings – an influential factor in decisions to remain with the Department – and would likely favor a more structured, predictable pay plan where more tenured personnel receive higher pay.

231 | P a g e
“When I look at the compensation plan for the Sheriff’s Office, I can reasonably estimate my future earnings in 5, 10, and 15 years.”
(All Ranks; N = 60)
“Employees with a longer tenure should earn higher base pay than employees who more recently joined the Sheriff’s Office.”
(All Ranks; N = 59)
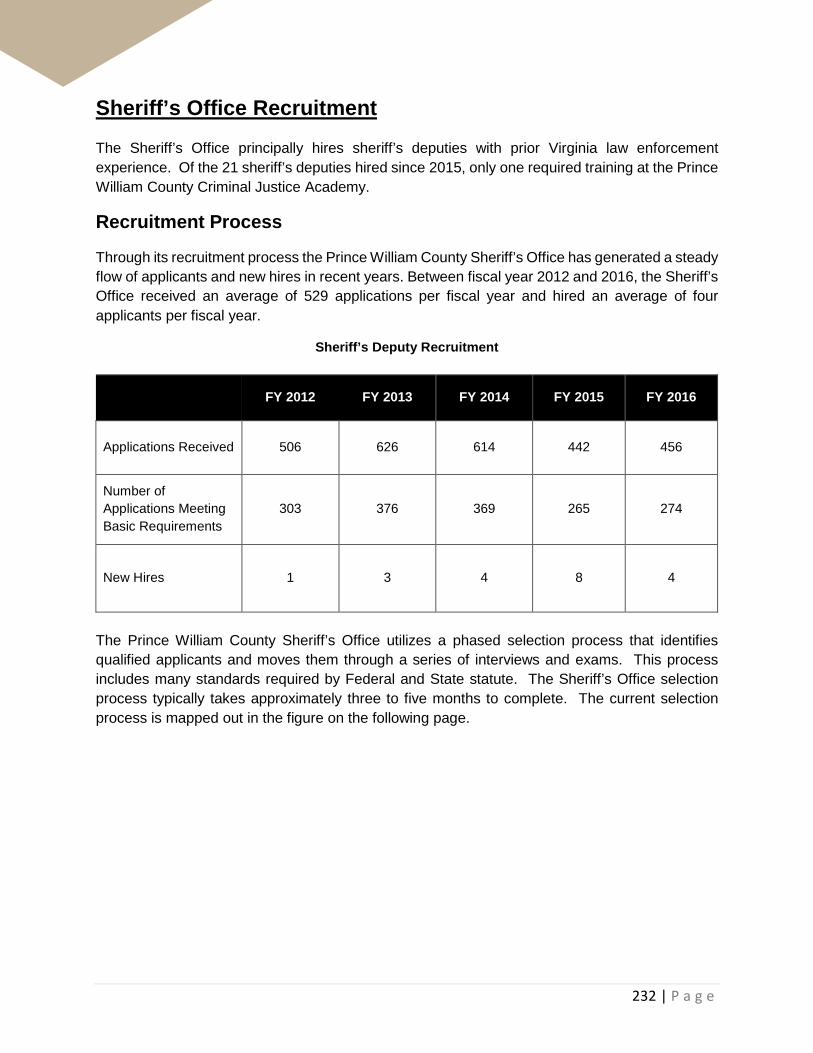
232 | P a g e
Sheriff’s Office Recruitment The Sheriff’s Office principally hires sheriff’s deputies with prior Virginia law enforcement experience. Of the 21 sheriff’s deputies hired since 2015, only one required training at the Prince William County Criminal Justice Academy.
Recruitment Process
Through its recruitment process the Prince William County Sheriff’s Office has generated a steady flow of applicants and new hires in recent years. Between fiscal year 2012 and 2016, the Sheriff’s Office received an average of 529 applications per fiscal year and hired an average of four applicants per fiscal year.
Sheriff’s Deputy Recruitment
FY 2012 FY 2013 FY 2014 FY 2015 FY 2016
Applications Received
506 626 614 442 456
Number of Applications Meeting Basic Requirements
303 376 369 265 274
New Hires 1 3 4 8 4
The Prince William County Sheriff’s Office utilizes a phased selection process that identifies qualified applicants and moves them through a series of interviews and exams. This process includes many standards required by Federal and State statute. The Sheriff’s Office selection process typically takes approximately three to five months to complete. The current selection process is mapped out in the figure on the following page.

233 | P a g e
Sheriff’s Office Recruitment Process Map
Generally, sworn active Sheriff’s Office personnel reported a favorable experience in the recruitment process. On a scale of 1 through 10 – with 10 being the most favorable rating – the average rating was a 7, with 69.4% (43 of 62 respondents) providing a rating of 7 or higher.

234 | P a g e
“Please Rate Your Experience with the Prince William County Recruitment Process” (All Ranks; N = 62, Scale of 1 to 10, 10 being the most favorable rating)
Rating Percent Count
1 1.6% 1 2 4.8% 3 3 3.2% 2 4 1.6% 1 5 14.5% 9 6 4.8% 3 7 25.8% 16 8 16.1% 10 9 6.5% 4
10 21.0% 13
One sworn active employee commented, “The recruitment process was exceptional. The recruiter was extremely professional, courteous and thorough.” [Emphasis added].
Interactions with recruitment personnel and the timeliness of the selection process are important factors for prospective sheriff’s deputies choosing a department. Therefore, a positive recruitment experience represents a potential comparative advantage for the Prince William County Sheriff’s Office in attracting qualified personnel.
Prior Work Experience
As previously noted, the Prince William county Sheriff’s Office relies heavily on lateral hires to maintain its workforce. The figure on the following page summarizes the prior work experience of the active employees surveyed. Of the 62 respondents to the active survey, 75.8% reported having prior law enforcement experience, including 22.6% who previously worked for the Prince William County Police Department.
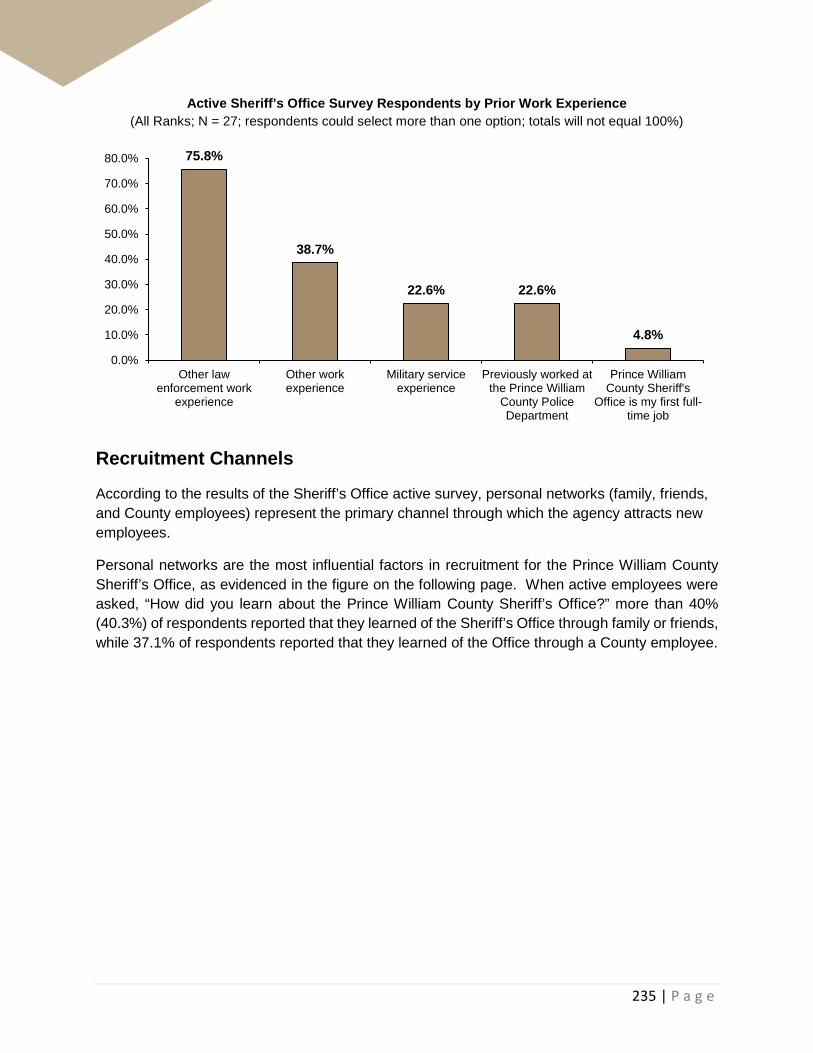
235 | P a g e
Active Sheriff’s Office Survey Respondents by Prior Work Experience (All Ranks; N = 27; respondents could select more than one option; totals will not equal 100%)
Recruitment Channels
According to the results of the Sheriff’s Office active survey, personal networks (family, friends, and County employees) represent the primary channel through which the agency attracts new employees.
Personal networks are the most influential factors in recruitment for the Prince William County Sheriff’s Office, as evidenced in the figure on the following page. When active employees were asked, “How did you learn about the Prince William County Sheriff’s Office?” more than 40% (40.3%) of respondents reported that they learned of the Sheriff’s Office through family or friends, while 37.1% of respondents reported that they learned of the Office through a County employee.
75.8%
38.7%
22.6% 22.6%
4.8%
0.0%
10.0%
20.0%
30.0%
40.0%
50.0%
60.0%
70.0%
80.0%
Other lawenforcement work
experience
Other workexperience
Military serviceexperience
Previously worked atthe Prince William
County PoliceDepartment
Prince WilliamCounty Sheriff's
Office is my first full-time job

236 | P a g e
Active Sheriff’s Office Survey – “How Did You Learn about the Prince William County Sheriff’s Office?”
(All Ranks; N = 62; respondents could select more than one option; totals will not equal 100%)
From a recruitment perspective, therefore, current employees serve as ambassadors for the Sheriff’s Office since they play a significant role in attracting prospective applicants to the Office. Higher levels of current employee satisfaction can potentially bolster and improve recruitment efforts.
Understanding Motivations for Joining the Sheriff’s Office
Individuals who choose a career in law enforcement, by definition, have a strong commitment to public service. But once an individual decides to pursue a career in law enforcement, multiple factors can influence which agency he/she chooses to join. While compensation represents an important consideration for recruits, the Sheriff’s Office active employee survey suggests it is not the only pressing factor for new hires. Non-economic factors, such as work schedule, logistical considerations – the speed at which employees move through the application pipeline – and the reputation of the department, are critical factors as well.
When asked to identify the primary factor why they chose to join the Prince William County Sheriff’s Office, 28.6% of respondents said that they chose Prince William County because of the Sheriff’s Office “Work Schedule”, as illustrated in the following figure. Twenty-seven percent of respondents said that they chose Prince William County based on a “Recommendation of a friend, family member, or current employee”.
40.3%37.1%
12.9% 11.3%
4.8% 3.2%0.0% 0.0%
0.0%
10.0%
20.0%
30.0%
40.0%
50.0%
Family/friend Prince WilliamCounty
employee
Prince WilliamCountywebsite
Other (pleasespecify)
Printadvertisement
Other website Job fair Radioadvertisement

237 | P a g e
Sheriff’s Office Active Survey – “What is the Primary Reason you chose to join the Prince William County Sheriff’s Office?
(All Ranks; N = 63)
The active survey also provides insight into factors that may improve recruitment. The comments below summarize many of the responses received when active employees were asked to provide suggestions on how the Sheriff’s Office may expand its talent pool:
• “I would suggest being open and honest about the pros and cons of the Job. People really appreciate honesty. I would also suggest having a more diverse group (i.e. race, ethnicity, age, gender) of people in the Office of Professional Standards.”
• “NEW hires. Don't focus on retirees looking to extend their careers and second retirements. Hire individuals who have an interest in becoming a deputy in Prince William County and who are willing and committed to going through our academy and investing their future in us.”
• “I think we need to start going to college job fairs and military job fairs. If we go to a military job fair, we should at least have someone that was or that is still in the military to go with the leader of the recruiting team.”
There are a variety of factors that play a role in attracting qualified applicants to the Prince William County Sheriff’s Office. Current employees were vocal during focus groups and provided ample commentary on how to improve the Sheriff Office’s recruitment. The main themes of both the focus groups and survey comments, were to recruit younger applicants that do not have prior law
28.6%
27.0%
14.3%
12.7%
7.9%
4.8%
3.2%
1.6%
0.0%
0.0% 10.0% 20.0% 30.0%
Shift schedule
Recommendation of a friend, family memberor current employee
Easy transition due to my prior lawenforcement experience
Live in the area
Reputation of the Sheriff's Office
First department that hired me
Pay
Other
Benefits

238 | P a g e
enforcement experience and to be straightforward about the job duties of the positions (i.e., predominantly courtroom security).

239 | P a g e
IX. Adult Detention Center Compensation, Retention, and Recruitment
Summary of Findings Compensation
• Prince William County is the only jurisdiction in the Northern Virginia comparison group with a separate jail officer classification. In the other jurisdictions surveyed, detention centers are staffed by deputy sheriffs with a different of job duties, working conditions, and certification/training requirements.
• Nevertheless, relative to deputy sheriffs in the Northern Virginia comparison group, starting pay for Adult Detention Center (ADC) jail officers is competitive. The ADC has the second highest starting rate for new hires among regional Sheriff’s Offices.
• ADC total direct cash compensation is significantly higher than the Rappahannock Regional Jail, the closest multi-jurisdictional detention center staffed by jail officers, not deputy sheriffs.
• Overall, the premium pays offered by the County are in-line with the comparison group (including the Rappahannock Regional Jail).
Retention
• Relative to other public safety positions, jail services tend to have higher rates of employee turnover.
• The ADC’s employee turnover and quit rates have risen since FY 2015, but remain well below the employee turnover and quit rates reported by the Rappahannock Regional Jail.
• Since FY 2013 voluntary resignations, not retirements, has been the principal cause of attrition – especially in the first five years of service.
• Employee surveys and focus groups highlight compensation and monthly shift turnover (from days to night, and vice versa) as the primary internal factors driving employee dissatisfaction.
• Pay compression and inability to project future earnings are cited as the concerns/issues with the current compensation package. A large proportion of respondents to the ADC active employee survey reported that:
o Employees with longer tenure should have higher levels of base pay;
o Their pay levels are not appropriate for their level of responsibility and tenure;
240 | P a g e
o They are unable to reasonably estimate their future earnings in five, 10, or 15 years; and
o The monthly rotation from days to nights may be a contributing factor why many jail officers leave the ADC.
• These findings indicate that approaches to alleviate pay compression, align compensation levels with tenure, and provide a more predictable schedule of future earnings – e.g., a well-defined pay progression – may have the greatest effect on improving employee satisfaction, and maintain lower attrition rates. Additionally, exploring options to reduce the frequency of turnover from day to night shifts may also improve job satisfaction levels.
Recruitment
• Generally, recruits look favorably upon their recruitment process and hold a positive impression of the Department, but only 14% of recruits surveyed report that they see themselves spending their entire career with the ADC

241 | P a g e
Prince William County ADC Compensation Prince William County ADC personnel earn cash compensation through a variety of means. The following section details how ADC personnel earn each of these pay elements.
Career Progression and Base Pay
The ADC has two non-supervisory positions. New hires join the agency as a jail officer and have the opportunity to promote to master jail officer, a competitive, non-supervisory position. First-line supervisory responsibilities are handled by jail sergeants and jail first sergeants.
ADC Personnel Headcount by Rank (12/31/2016)
Headcount * % of Total
Jail Officer 154 57.0%
Master Jail Officer 49 18.1%
Jail Sergeant 32 11.9%
Jail First Sergeant 18 6.7%
Jail Lieutenant 11 4.1%
Jail Captain 4 1.5%
Jail Major 2 0.7%
Total 270 100.0% * Includes all full-time sworn employees, included those who worked less than 2,080 annual hours in CY 2016
At entry, jail officers without prior experience or education enter the pay range at grade PS 13 and receive a minimum of $48,256. The promotion to master jail officer results in a 5% increase in base pay and movement to grade PS 14 ($52,749). Master jail officers will continue through the pay range (PS 14) – through pay-for-performance increases in years in which they are provided – until the pay range maximum is reached ($89,523 as of FY 2018).
Competitive promotions to jail sergeant and jail first sergeant (first line supervisor), jail lieutenant (second-line supervisor), and jail captain (third-line supervisor) result in an increase in base pay of 5% and movement to the PS 15, PS 16, PS 17, and PS 18 pay grades, respectively.
The following table illustrates the pay ranges for each sworn title in the ADC:

242 | P a g e
Prince William County ADC Pay Ranges Effective July 1, 2017 – June 30, 2018
Grade Minimum Maximum
Jail Officer PS 13 $48,256 $81,910
Master Jail Officer PS 14 $52,749 $89,523
Jail Sergeant PS 15 $57,845 $98,238
Jail First Sergeant PS 16 $63,856 $108,410
Jail Lieutenant PS 17 $70,741 $120,120
Jail Captain PS 18 $78,790 $133,744
Jail Major PS 20 $85,509 $145,184
Hiring Practices at Entry
While the pay range minimum for a jail officer is grade PS 13, $48,256, the actual base pay earned at entry will vary considerably according to prior correctional experience, prior military experience, language skills, and educational attainment. A jail officer may receive a combination of the recruitment incentives listed below:
• Prior Experience: 1% - 6% (1% for each year of service up to a maximum of 6%, or 72 months)
• Department of Criminal Justice Services Jail Certified Officer: 3.0% increase over entry for officers who are DCJS-certified; increase in addition to any adjustment for prior experience
• Education: 1.5% increase over entry for an associate’s degree, 3% over entry for a bachelor’s degree, 4.5% over entry for a master’s degree and 6.0% over entry for a doctoral degree
• Language: $68.07 per pay period for Spanish language proficiency
Given the variety of recruitment incentives that may influence base pay at entry, the range for base pay for jail officers in any given year of service may fluctuate materially.
As a result, employees with the same level of experience with the ADC will earn different levels of base compensation. Moreover, depending on recruitment incentives earned, jail officers with less tenure at the ADC may earn higher levels of base pay than experienced jail officers with longer tenure with the ADC in the same rank. In the absence of a well-defined pay progression, variances between pay can continue throughout the course of a career without equalizing.

243 | P a g e
Additional Compensation
Additional pay premiums received by the majority of ADC officers include:
• Holiday Pay: Prince William County ADC personnel receive 12 holidays. Holiday pay is 1.5x premium (2.5x total) for hours actually worked. If a jail officer does not work a holiday, then he/she receives 8 hours of additional straight pay. If a shift straddles a holiday, the hours actually worked on the holiday are paid at 1.5x premium and the remaining hours are pay at a 1.0x premium for a maximum of 8 hours. For those employees receiving this premium, the additional compensation averaged approximately $2,500 in calendar year 2016.
• Shift Differential: Shift differential pay is provided to ADC personnel below the rank of Captain. Officers who work a minimum of five hours between 7:00 PM and 7:00 AM receive an additional $0.70 per hour actually worked. For those employees receiving this premium, the additional compensation averaged approximately $600 in calendar year 2016.
• Employees may also receive Performance Plus Pay, a one-time payment based on employee evaluations. Employees who receive an “exceeds” rating earn an additional 1% lump-sum payment; employees with a “greatly exceeds” rating receive an additional lump-sum payment of 2%. For those employees receiving this premium, the additional compensation averaged approximately $600 in calendar year 2016.
Further, ADC personnel have opportunities to earn compensation through overtime. Personnel below the rank of lieutenant earn overtime (1.5x pay), Lieutenants receive straight time for additional time in excess of a normal work schedule and captains receive no additional compensation. For those employees receiving this premium, the additional compensation averaged approximately $3,200 in calendar year 2016.
ADC personnel are also eligible for a language stipend for being proficient in Spanish paid at a flat rate of $68.07 per pay period.
Leave
In addition to cash compensation, ADC personnel receive annual leave allowances based on years of service. All Prince William County employees receive the same prorated number of annual leave days, based on the number of standard scheduled hours. ADC employees accrue between 110.9 and 221.7 hours of annual leave per year, depending on years of service.

244 | P a g e
Prince William County Leave Allowances – Jail Officers
Years of Service (YOS) Annual Leave Accrued
per Year (8-hour day equivalents)
Less than 3 YOS 14
More than 3 YOS, less than 6 YOS 17
More than 6 YOS, less than 9 YOS 21
More than 9 YOS, less than 12 YOS 24
More than 12 YOS 28 In addition to annual leave, paid leave is available for non-job related illness and injury, work-related disability, military service, civil leave (e.g., jury duty), and bereavement leave.
Northern Virginia Jail Officer Compensation The Prince William – Manassas Regional Adult Detention is a regional facility staffed by jail officers. In Alexandria, Arlington County, Fairfax County, and Loudoun County, detention centers are operated by the Sheriff’s Office, and staffed by deputy sheriffs. In these jurisdictions, deputy sheriffs spend a portion of their careers in jail services, but may have the opportunities to work in other areas of public safety/law enforcement as well, such as: courtroom security, civil processes, and patrol/criminal investigations. Accordingly, the job duties and working conditions may be very different for deputy sheriffs and jail officers. The training and law enforcement certification requirements from the Commonwealth of Virginia Department of Criminal Justice services are also different for jail officers and deputy sheriffs as well. The geographically closest detention center staffed by jail officers is the Rappahannock Regional Jail in Stafford County. Rappahannock Regional Jail serves the City of Fredericksburg, King George County, Spotsylvania County, and Stafford County. The average daily population in the Rappahannock Regional Jail31 is (1,380), versus (1,033) at the Prince William County ADC. 32 The table on the following page details the functions performed by employees providing jail services in each Northern Virginia community.
31 Rappahannock Regional Jail Authority CAFR FY 2016 32 Prince William County ADC Annual Report FY 2016

245 | P a g e
Northern Virginia Jail Officer Functions
Classification Jail Services
Courtroom Security
Civil Processes
Patrol/Criminal Investigations
Prince William County (ADC) Jail Officer - - -
Rappahannock Regional Jail
Correctional Officer - - -
Alexandria Deputy Sheriff -
Arlington County Deputy Sheriff -
Fairfax County Deputy Sheriff -
Loudoun County Deputy Sheriff
Shift Rotations
Jail officers in the Rappahannock Regional Jail work 12-hour shifts, with the shift rotating from days to nights every two months. At the ADC, the rotation from day to nights occurs monthly.
As illustrated in the table below, most Northern Virginia Sheriff’s Offices operate detention facilities with fixed shifts. Only one jurisdiction – Fairfax County – incorporates monthly shift rotations into security shift schedules.
Security Shift Rotation Practices – Regional Detention Centers
Classification Shift Rotation Practices
Prince William County (ADC) Jail Officer Rotating shifts; monthly shift change
Rappahannock Regional Jail Correctional Officer Rotating Shifts; Shift Change every 2 months
Alexandria Deputy Sheriff Fixed shifts
Arlington County Deputy Sheriff Fixed shifts
Fairfax County Deputy Sheriff 4 squads – 2 fixed; 2 rotate monthly
Loudoun County Deputy Sheriff Fixed Shifts

246 | P a g e
Base Pay Comparisons
Starting pay for ADC jail officers is competitive relative to regional employers. Despite the differences in job duties and training requirements with regional deputy sheriffs who provide jail services in the Northern Virginia comparison group, ADC starting jail officer pay represents the median value of the comparison group (3 of 5).
Jail Officer/Deputy Sheriff Starting Pay (Effective 6/30/2018)
Classification Starting Base Pay
Prince William County (ADC) Jail Officer $48,256
Alexandria Deputy Sheriff $45,841
Arlington County Deputy Sheriff $48,006
Fairfax County [1] Deputy Sheriff $50,831
Loudoun County [2] Deputy Sheriff Recruit $46,979
Median - $49,000
PWC Variance - -1.5%
PWC Rank - 3 of 5
[1] Fairfax County: includes $2,500 environmental pay [2] Loudoun County: includes $3,000 supplement for assignment to detention center
ADC starting base pay is also substantially higher than a correctional officer – a classification with the same job duties – at the Rappahannock Regional Jail.
Jail Officer/Correctional Officer Pay Range (Effective 6/30/2018)
Classification Minimum Maximum
Prince William County Jail Officer $48,256 $81,910
Rappahannock Regional Jail Correctional Officer $34,895 $58,610
Difference ($ Amount) - $13,361 $23,300
Difference (%) - +38.3% +39.8%

247 | P a g e
Total Direct Cash Compensation
To provide additional perspective on ADC compensation, the tables that follow detail total direct cash compensation for an ADC jail officer versus a correctional officer at the Rappahannock Regional Jail.33 By 10 completed years of service, a majority of ADC jail officers promote to Master Jail Officer. The analysis that follows presumes that a correctional officer at Rappahannock Regional Jail promotes to corporal at the same career juncture.
The Prince William County career progression is based on an actual payroll run performed as of 12/31/2016. Comparisons for the Rappahannock Regional Jail are effective July 1, 2017, and do not account for historical wage freezes.34
Jail Officer/Master Jail Officer – Total Direct Cash Compensation Select Career Junctures, Effective 12/31/2016
Prince William
County Rappahannock Regional Jail
PWC Variance ($ Amount)
PWC Variance (%)
5 YOS $55,272 $42,423 $12,849 30.3%
10 YOS $58,752 $45,241 $13,512 29.9%
15 YOS $70,290 $51,541 $18,749 36.4%
20 YOS $77,742 $56,905 $20,837 36.6%
25 YOS $90,957 $62,828 $28,129 44.8%
30 YOS $93,371 $64,536 $28,834 44.7%
25-Year Avg $66,268 $49,248 $17,020 34.6%
30-Year Avg $70,705 $51,809 $18,896 36.5%
33 For more detailed description of methodology used for total direct cash compensation per net hour worked, see chapter on Organization and Report Methodology. 34 Historical wage data not available for Rappahannock Regional Jail.
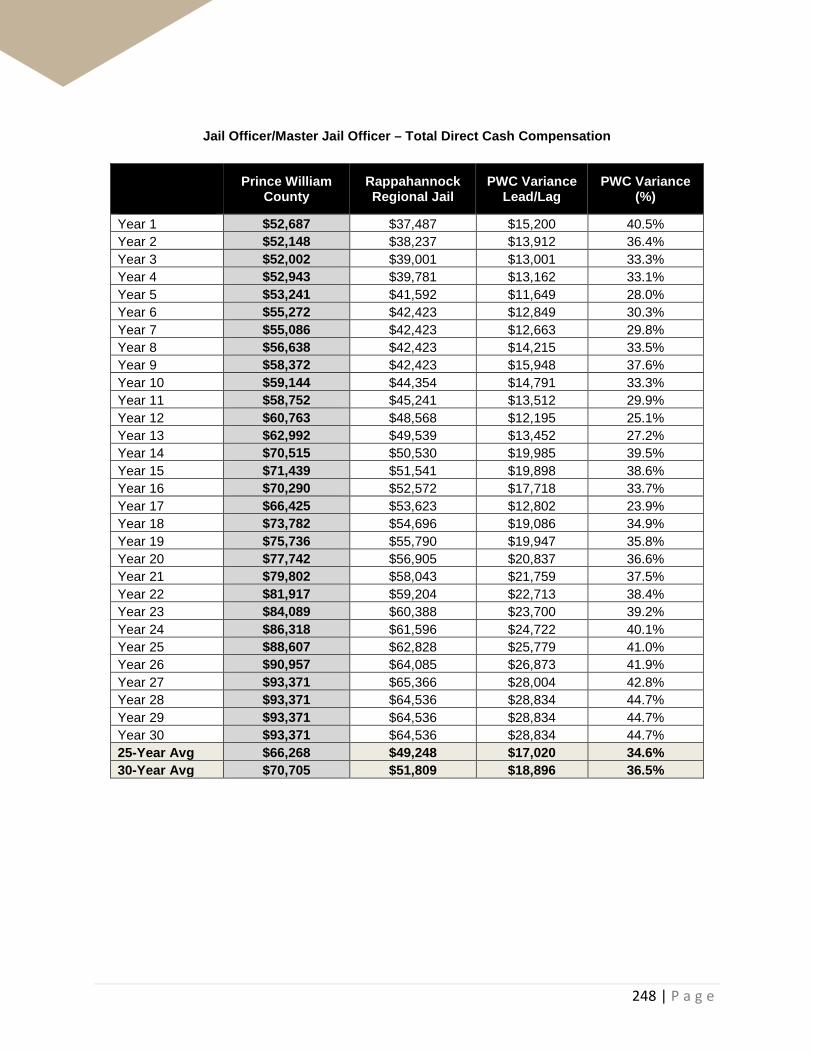
248 | P a g e
Jail Officer/Master Jail Officer – Total Direct Cash Compensation
Prince William County
Rappahannock Regional Jail
PWC Variance Lead/Lag
PWC Variance (%)
Year 1 $52,687 $37,487 $15,200 40.5% Year 2 $52,148 $38,237 $13,912 36.4% Year 3 $52,002 $39,001 $13,001 33.3% Year 4 $52,943 $39,781 $13,162 33.1% Year 5 $53,241 $41,592 $11,649 28.0% Year 6 $55,272 $42,423 $12,849 30.3% Year 7 $55,086 $42,423 $12,663 29.8% Year 8 $56,638 $42,423 $14,215 33.5% Year 9 $58,372 $42,423 $15,948 37.6% Year 10 $59,144 $44,354 $14,791 33.3% Year 11 $58,752 $45,241 $13,512 29.9% Year 12 $60,763 $48,568 $12,195 25.1% Year 13 $62,992 $49,539 $13,452 27.2% Year 14 $70,515 $50,530 $19,985 39.5% Year 15 $71,439 $51,541 $19,898 38.6% Year 16 $70,290 $52,572 $17,718 33.7% Year 17 $66,425 $53,623 $12,802 23.9% Year 18 $73,782 $54,696 $19,086 34.9% Year 19 $75,736 $55,790 $19,947 35.8% Year 20 $77,742 $56,905 $20,837 36.6% Year 21 $79,802 $58,043 $21,759 37.5% Year 22 $81,917 $59,204 $22,713 38.4% Year 23 $84,089 $60,388 $23,700 39.2% Year 24 $86,318 $61,596 $24,722 40.1% Year 25 $88,607 $62,828 $25,779 41.0% Year 26 $90,957 $64,085 $26,873 41.9% Year 27 $93,371 $65,366 $28,004 42.8% Year 28 $93,371 $64,536 $28,834 44.7% Year 29 $93,371 $64,536 $28,834 44.7% Year 30 $93,371 $64,536 $28,834 44.7% 25-Year Avg $66,268 $49,248 $17,020 34.6% 30-Year Avg $70,705 $51,809 $18,896 36.5%

249 | P a g e
Additional Compensation
While the scope, duties, and working conditions of employees assigned to detention centers in Northern Virginia vary considerably, additional compensation comparisons are presented below as another point of reference in evaluating pay premiums provided to ADC personnel.
The ADC provides a $0.70 shift differential for all hours worked between 7:00 PM and 7:00 AM. The Rappahannock Regional Jail does not provide a shift differential. All Sheriff’s Offices in the region provide a shift differential.
Shift Differential Comparisons
Classification Shift Differential
Prince William County (ADC) Jail Officer $0.70 – 7:00 PM to 7:00 AM
Rappahannock Regional Jail Correctional Officer -
Alexandria Deputy Sheriff $0.45 –11:00 AM to 4:59 PM $0.63 – 5:00 PM to 4:59 AM
Arlington County Deputy Sheriff $0.75 – 1:00 PM to 8:59 PM $1.00 – 9:00 PM to 4:59 AM
Fairfax County Deputy Sheriff $0.90 – 1:00 PM to 7:59 PM $1.30 – 8:00 PM to 6:59 AM
Loudoun County Deputy Sheriff $0.65 – 6:00 PM to 6:00 AM
The Rappahannock Regional Jail does not provide a uniform allowance. Only one jurisdiction in the comparison group – Fairfax County – provides uniform allowance to deputy sheriffs.
Uniform Allowance Comparisons
Classification Uniform Allowance
Prince William County (ADC) Jail Officer -
Rappahannock Regional Jail Correctional Officer -
Alexandria Deputy Sheriff -
Arlington County Deputy Sheriff -
Fairfax County Deputy Sheriff $500
Loudoun County Deputy Sheriff -
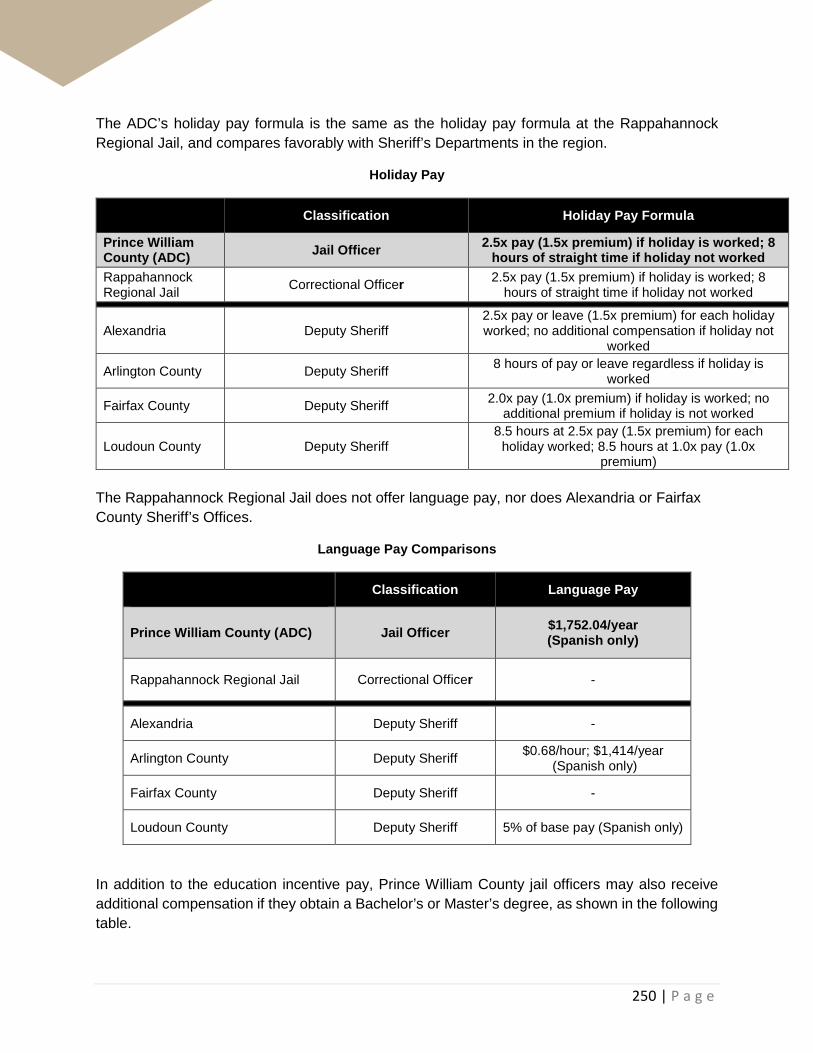
250 | P a g e
The ADC’s holiday pay formula is the same as the holiday pay formula at the Rappahannock Regional Jail, and compares favorably with Sheriff’s Departments in the region.
Holiday Pay
Classification Holiday Pay Formula
Prince William County (ADC) Jail Officer 2.5x pay (1.5x premium) if holiday is worked; 8
hours of straight time if holiday not worked Rappahannock Regional Jail Correctional Officer 2.5x pay (1.5x premium) if holiday is worked; 8
hours of straight time if holiday not worked
Alexandria Deputy Sheriff 2.5x pay or leave (1.5x premium) for each holiday worked; no additional compensation if holiday not
worked
Arlington County Deputy Sheriff 8 hours of pay or leave regardless if holiday is worked
Fairfax County Deputy Sheriff 2.0x pay (1.0x premium) if holiday is worked; no additional premium if holiday is not worked
Loudoun County Deputy Sheriff 8.5 hours at 2.5x pay (1.5x premium) for each
holiday worked; 8.5 hours at 1.0x pay (1.0x premium)
The Rappahannock Regional Jail does not offer language pay, nor does Alexandria or Fairfax County Sheriff’s Offices.
Language Pay Comparisons
Classification Language Pay
Prince William County (ADC) Jail Officer $1,752.04/year (Spanish only)
Rappahannock Regional Jail Correctional Officer -
Alexandria Deputy Sheriff -
Arlington County Deputy Sheriff $0.68/hour; $1,414/year (Spanish only)
Fairfax County Deputy Sheriff -
Loudoun County Deputy Sheriff 5% of base pay (Spanish only)
In addition to the education incentive pay, Prince William County jail officers may also receive additional compensation if they obtain a Bachelor’s or Master’s degree, as shown in the following table.

251 | P a g e
Education Incentive Pay
Classification Education Incentive Pay
Prince William County (ADC) Jail Officer
Up to 7.0% (Master’s Degree) at hire; 2% in-grade increase if degree (Bachelor’s or
Master’s) obtained while employed Rappahannock Regional Jail Correctional Officer -
Alexandria Deputy Sheriff -
Arlington County Deputy Sheriff -
Fairfax County Deputy Sheriff New hires may receive a step increase at time of hire based on educational attainment
Loudoun County Deputy Sheriff Between 5.0% (Associate’s Degree) and 15.0% (Doctorate)
At the ADC, Master Jail Officers serve as field training officers as part of their job duties.
Field Training Officer Pay
Classification Field Training Officer Pay
Prince William County (ADC) Jail Officer Master Jail Officer
Rappahannock Regional Jail Correctional Officer 2.5% of base pay
Alexandria Deputy Sheriff 5.0% of base pay
Arlington County Deputy Sheriff $1.34/hr
Fairfax County Deputy Sheriff $3.00/hr
Loudoun County Deputy Sheriff $2.00/hr

252 | P a g e
Hiring Practices at Entry
The Rappahannock Regional Jail will adjust starting base pay up to 5% for prior experience.
Among the Sheriff’s Offices in the region, hiring practices at entry vary. At entry base pay, the City of Alexandria and Arlington County do not take education, language, and prior law enforcement experience outside of Northern Virginia into consideration. Law enforcement certification by the Virginia Department of Criminal Justice Services, however, is a factor that is taken into consideration during the lateral hire process.
Fairfax and Loudoun Counties, however, will adjust an officer/deputy sheriff’s entry rate to account for a combination of education, language, and prior work experience. Alexandria, Arlington County, and Fairfax County each have well-defined pay progressions, and as such, and any differences in base pay among deputies with the same tenure is equalized when deputies reach the maximum of the pay schedule/range.
See the previous chapter additional detail on hiring practices in regional Sheriff’s Offices.
Rank Structure
Approximately 75% of the ADC is comprised of non-supervisory jail officers (jail officers and master jail officers).35 The table below provides a summary of the non-supervisory career paths available to correctional officers at the Rappahannock Regional Jail.
Jail Officer/Correctional Officer Non-Supervisory Career Path
Non-Competitive, Non-Supervisory Ranks Competitive, Non-Supervisory Rank
Prince William County (ADC) Jail Officer - - Master Jail Officer
Rappahannock Regional Jail
Correctional Officer
Correctional Officer First Class (4 YOS)
Master Correctional
Officer (8 YOS)
Corporal (competitive process)
Rank Differentials
Rank differentials (also known as “promotional differentials” are defined as the percentage difference in pay earned by employees in between ranks. When a lieutenant is promoted to captain, for example, he/she receives a 5% increase to base pay, which constitutes a 5% rank differential.
At the ADC, supervisory jail officers receive rank differentials of 5% for promotions through captain. At the Rappahannock Regional Jail, supervisory rank differentials range from 3.00% to 7.75%, at the discretion of the superintendent.
35 As of 12/31/2016 departmental payroll run.

253 | P a g e
Jail Officer/Correctional Officer Rank Differentials
First-Line Supervisor Second-Line Supervisor Third-Line Supervisor
Prince William County (ADC)
Sergeant: 5.0% over Master Jail Officer
1st Sergeant: 5.0% over Sergeant
Lieutenant: 5.0% over 1st Sergeant
Captain: 5.0% over Lieutenant
Rappahannock Regional Jail
Sergeant: 3.00% - 7.75% over Corporal; 1st Sergeant:
3.00% - 7.75% over Corporal;
Lieutenant: 3.00% -7.75% over 1st
Sergeant
Captain: 3.00% -7.75% over Lieutenant
Overtime Differentials
The table below compares the overtime at the ADC versus the Rappahannock Regional Jail.
Jail Officer/Correctional Officer Overtime Differentials
Non-
Competitive Rank & File
Competitive, Non-
Supervisory First-Line
Supervisor Second-Line Supervisor
Third-Line Supervisor
Prince William County (ADC)
Jail Officer
OT: 1.5x pay or comp time
Master Jail Officer
OT: 1.5x pay or comp time
Sergeant and 1st Sergeant
OT: 1.5x pay or
comp time
Lieutenant
OT: 1.0x pay or comp time
Captain
OT: N/A
Rappahannock Regional Jail
Correctional Officer
OT: 1.5x pay or
comp time
Corporal
OT: 1.5x pay or comp time
Sergeant and 1st Sergeant
OT: 1.5x pay or
comp time
Lieutenant
OT: 1.0x pay
Captain
OT: N/A

254 | P a g e
Retention of ADC Personnel This section focuses on two principal types of employee separations – voluntary resignations and service retirements. Voluntary resignations – or “quits” – refer to individuals who resign from the ADC before becoming eligible for an unreduced pension benefit. Service retirements refer to individuals who separate from the ADC after becoming eligible for an unreduced pension benefit, and leave the ADC to pursue other employment, or leave the workforce all together.
Additionally, retention is evaluated through the lens of two metrics:
• Turnover Rate: percentage of employees who leave the ADC for any reason (e.g., quits, service retirements, medical retirements, terminations, resignations in lieu of termination, voluntary demotions/transfers, and death)36
• Quit Rate: percentage of employees who voluntarily resign, or quit, from the ADC
Quits vs. Retirements
Departments may face different retention challenges – and require differing solutions – depending on the structural forces driving attrition trends. The table on the following page details all sworn ADC personnel by year of service as of 12/31/2016. Nearly 90% (88.7%) of sworn rank-and-file employees (jail officer and master jail officer) have fewer than 10 years of service, though many of these employees may have VRS pension credit with another employer.
The Virginia Retirement System provides a normal service retirement at 25 years of service. As illustrated in the table on the following page, less than 10% (8.9%) of all sworn employees are within 10 years of normal service retirement (15 to 24 years served).
36 Though employees who take a voluntary demotion/transfer may remain with the ADC or with Prince William County, they do so in a non-law enforcement capacity, and are therefore characterized as “separations” for the purposes of the turnover rate calculations

255 | P a g e
Employee Distribution by Year of Service – Prince William County Adult Detention Center (ADC) (Effective 12/31/2016)
Years Served Year Jail Officer Master Jail
Officer Jail
Sergeant Jail First Sergeant
Jail Lieutenant
Jail Captain Jail Major Headcount
by YOS Headcount as a % of
Total 0 1 26 - - - - - - 26 9.63% 1 2 30 - - - - - - 30 11.11% 2 3 15 - - - - - - 15 5.56% 3 4 10 - - - - - - 10 3.70% 4 5 16 - - - - - - 16 5.93% 5 6 9 3 - - - - - 12 4.44% 6 7 11 2 - - - - - 13 4.81% 7 8 5 6 - - - - - 11 4.07% 8 9 15 7 1 - - - - 23 8.52% 9 10 8 7 4 - - - - 19 7.04% 10 11 4 6 3 - - - - 13 4.81% 11 12 - 9 3 - - - - 12 4.44% 12 13 - 2 4 1 - - - 7 2.59% 13 14 - 3 3 - - - - 6 2.22% 14 15 1 1 5 2 - - - 9 3.33% 15 16 1 1 1 1 - - - 4 1.48% 16 17 - 1 1 2 - - - 4 1.48% 17 18 - - 1 - 1 - - 2 0.74% 18 19 - - 1 - 1 - - 2 0.74% 19 20 1 - - - 1 - - 2 0.74% 20 21 1 - - - - - - 1 0.37% 21 22 - - 1 4 - - - 5 1.85% 22 23 - - - - 1 - - 1 0.37% 23 24 - - - 3 - - - 3 1.11% 24 25 - - - - - - - - 0.00% 25 26 - 1 1 1 - - - 3 1.11% 26 27 - - 1 2 1 - - 4 1.48% 27 28 1 - 2 1 4 2 - 10 3.70% 28 29 - - - 1 1 - - 2 0.74%
29+ 30+ - - - - 1 2 2 5 1.85%
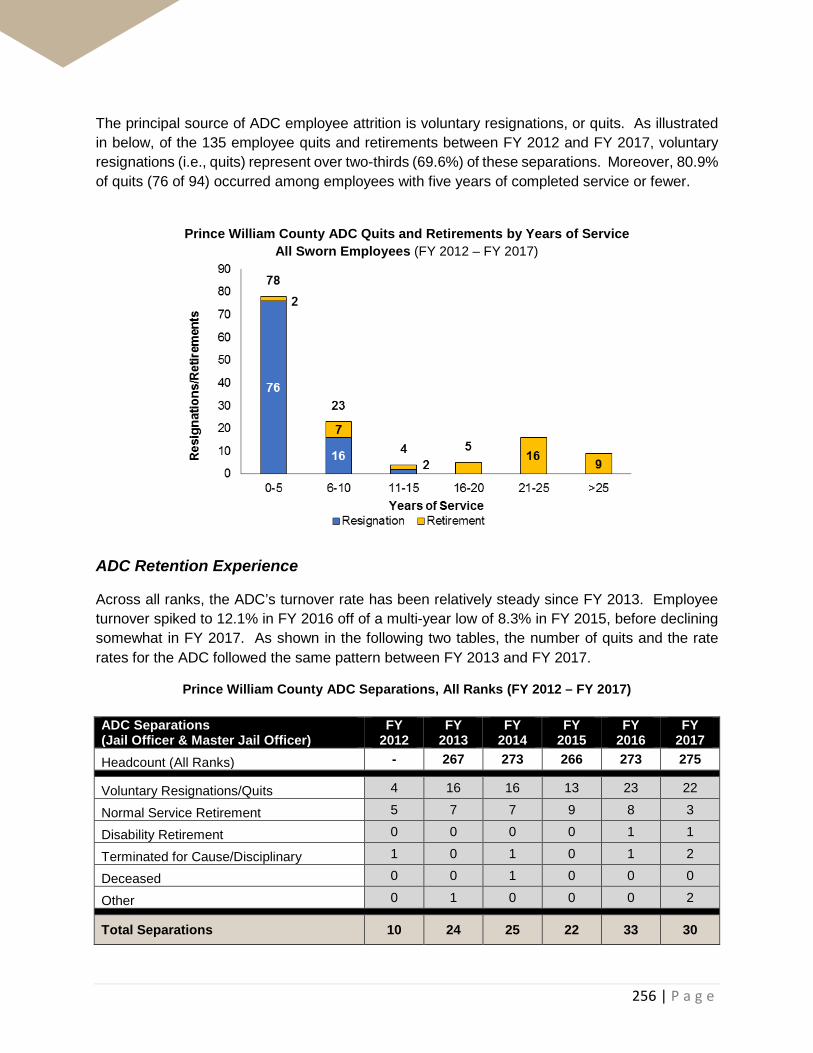
256 | P a g e
The principal source of ADC employee attrition is voluntary resignations, or quits. As illustrated in below, of the 135 employee quits and retirements between FY 2012 and FY 2017, voluntary resignations (i.e., quits) represent over two-thirds (69.6%) of these separations. Moreover, 80.9% of quits (76 of 94) occurred among employees with five years of completed service or fewer.
Prince William County ADC Quits and Retirements by Years of Service All Sworn Employees (FY 2012 – FY 2017)
ADC Retention Experience
Across all ranks, the ADC’s turnover rate has been relatively steady since FY 2013. Employee turnover spiked to 12.1% in FY 2016 off of a multi-year low of 8.3% in FY 2015, before declining somewhat in FY 2017. As shown in the following two tables, the number of quits and the rate rates for the ADC followed the same pattern between FY 2013 and FY 2017.
Prince William County ADC Separations, All Ranks (FY 2012 – FY 2017)
ADC Separations (Jail Officer & Master Jail Officer)
FY 2012
FY 2013
FY 2014
FY 2015
FY 2016
FY 2017
Headcount (All Ranks) - 267 273 266 273 275
Voluntary Resignations/Quits 4 16 16 13 23 22
Normal Service Retirement 5 7 7 9 8 3
Disability Retirement 0 0 0 0 1 1
Terminated for Cause/Disciplinary 1 0 1 0 1 2
Deceased 0 0 1 0 0 0
Other 0 1 0 0 0 2
Total Separations 10 24 25 22 33 30

257 | P a g e
Prince William County ADC Quit and Turnover Rates, All Ranks (FY 2013 – FY 2017)
ADC (All Ranks) FY 2013
FY 2014
FY 2015
FY 2016
FY 2017
Quit Rate 6.0% 5.9% 4.9% 8.4% 8.0%
Turnover Rate 9.0% 9.2% 8.3% 12.1% 10.9%
When focusing specifically on non-supervisory jail officers, jail officer attrition increases. As detailed in the following two tables, more than 10% of non-supervisory jail officers voluntarily resigned from the ADC in FY 2016 and FY 2017.
Prince William County ADC Separations, Jail Officer and Master Jail Officer (FY 2012 – FY 2017)
ADC Separations (Jail Officer & Master Jail Officer)
FY 2012
FY 2013
FY 2014
FY 2015
FY 2016
FY 2017
Headcount (All Ranks) - 201 206 200 206 209
Voluntary Resignations/Quits 4 16 16 13 22 22 Normal Service Retirement 3 2 3 5 4 1 Disability Retirement 0 0 0 0 1 1 Terminated for Cause/Disciplinary 1 0 1 0 1 2 Deceased 0 0 1 0 0 0 Other 0 1 0 0 0 2
Total Separations 8 19 21 18 28 28
Prince William County ADC Quit and Turnover Rates, Jail Officer & Master Jail Officer (FY 2012 – FY 2017)
Rank and File (Jail Officer & Master Jail Officer)
FY 2012
FY 2013
FY 2014
FY 2015
FY 2016
FY 2017
Quit Rate - 8.0% 7.8% 6.5% 10.7% 10.5%
Turnover Rate - 9.5% 10.2% 9.0% 13.6% 13.4%

258 | P a g e
The table below provides an additional perspective than can be used to evaluate Prince William County ADC sworn employee retention. In FY 2013, 25 jail officers joined the ADC as new hires or as a lateral hires. As of June 30, 2017, 16 of these employees – 64.0% – remain with the ADC.
ADC Jail Officer Cohort Analysis (Hired in FY 2013)
# of Jail Officers %
New Hires - FY 2013 25 100% (Less) Voluntary Resignations 8 32% (Less) Other Separations 1 4%
Subtotal - All Separations 9 36% Jail Officers Hired in FY 2013 Still Employed 16 64%
While the ADC turnover rates and quit rates are the among the highest among Prince William County public safety employee groups, elevated attrition levels for correctional positions – relative to other occupations – is not uncommon. The ADC’s turnover rates compare favorably to other Virginia correctional institutions. For example, the State of Virginia has seen correctional officer and senior correctional officer turnover rates rise from 17.0% in FY 2013 to 25.4% FY 2017 (through March of 2017). 37
Looking regionally, the Rappahannock Regional Jail provided historical jail officer turnover data since FY 2014. Additionally, the City of Alexandria provided turnover data on deputy sheriffs assigned to the detention center.
As illustrated in the following figure, the ADC’s turnover rate has ranged between 8.3% and 12.1% between FY 2014 and FY 2017, which generally tracks the historical retention experience in Alexandria. By contrast, the Rappahannock Regional Jail’s turnover rate has not fallen below has not fallen below 25.6%, and reportedly approached 40% (38.8%) in FY 2017.
37 Virginia Department of Corrections, Presentation for Senate Finance Committee, June 15, 2017

259 | P a g e
Jail Officer Turnover Rate (All Ranks) ADC vs. Rappahannock Regional Jail & Alexandria Detention Center

260 | P a g e
Drivers of Attrition
Prince William County ADC employees are leaving the ADC for a variety of external and internal factors. External factors provide the opportunity to leave, while internal factors provide the motivation. These factors have the most influence on early career ADC jail officers.
External Factors
There are multiple external drivers that may contribute to an individual employee’s decision to voluntarily resign. An employee may have interest in relocating to another part of the Country for family or personal reasons, which may be outside the employer’s control.
A primary external driver that is also outside of the control of the ADC is the economy. As the economy has improved since the Great Recession, outside employment opportunities have increased. Concomitantly, pay in competing agencies may exceed that of the ADC, creating both an opportunity and financial benefit for ADC personnel to move to a different detention center or law enforcement agency.
At the time of hire, nearly a third (31%) of current employees reported considering jobs with other regional local detention centers, and more than 30% (30.9%) of current employees reported that they considered “other law enforcement careers.”
As illustrated in the table on the following page, similar proportions of ADC recruits reported considering other regional local detention centers (35.7%). In the recruit survey, fewer recruits (14.3%) reported that they considered other law enforcement careers, while more than 50% of recruit survey respondents reported that they considered local law enforcement outside of Prince William County prior to joining the ADC.

261 | P a g e
Active Employee and ADC Recruit Survey Question – “Did you consider other jobs before choosing Prince William County Adult Detention Center? Check all that apply.”
Respondents could select more than one option; totals will not equal 100%
Active Employee Survey (N=223)
Recruit Survey (N=14)
% Count % Count
Northern Virginia/DC Area local detention centers (e.g. Arlington County, Fairfax County) 31.4% 70 35.7% 5
Other law enforcement career 30.9% 69 14.3% 2
Non-law enforcement career 26.0% 58 7.1% 1
Local law enforcement (outside Prince William County) 25.6% 57 28.6% 4
Local law enforcement (within Prince William County) 23.3% 52 50.0% 7
Only considered the Prince William County ADC 16.1% 36 0.0% 0
State Dept. of Corrections 9.0% 20 0.0% 0
Local detention centers in other parts of the Country 5.8% 13 7.1% 1
Additionally, the federal government may represent another potential draw on ADC talent. Through a series of executive orders, the Department of Homeland Security has been authorized to hire up to an additional 5,000 border patrol agents and 10,000 immigration and customs enforcement agents and officers.38 Internal Factors
Opportunities at other detention centers and law enforcement agencies alone do not motivate personnel to resign. A review employee surveys and focus group respondents indicate one primary factor affecting job satisfaction – compensation. Specific compensation issues raised include:
38 Executive Order: Secretary John Kelly “Implementing the President’s Border Security and Immigration Enforcement Improvements Policies” PDF p. 3-4, Feb 20, 2017. Executive Order: John Kelly “Enforcement of the Immigration Laws to Serve the National Interest” PDF p. 5, Feb 20, 2017.

262 | P a g e
• Pay levels – particularly for mid-career personnel • Lack of certainty around future pay increases and inability to project future earnings
Additional important, but secondary non-economic issues raised include:
• Monthly rotation from night to day shift (and vice versa) for employees assigned to security shift
• Perception of insufficient staffing levels
Insights from Active Employees
Employee insights on satisfaction can help identify internal factors that drive attrition, as well as identify cohorts at greatest risk for resignation. Additionally, employee attitudes and perspectives can provide guidance on which potential recommendations will resonate most powerfully with employees, and be most effective at stemming attrition.
Employee insights were gleaned from a combination of employee focus groups, meetings with supervisors, and an employee survey of sworn ADC personnel that generated 234 responses.39
Of the 234 respondents to the active ADC employee survey, 75.3% reported their rank as a Jail Officer or Master Jail Officer, while 24.7% indicated that they are currently in a supervisory rank (sergeant, first sergeant, lieutenant, captain, and major) – this breakdown of survey respondents closely mirrors the actual ADC workforce as of 12/31/2016.
Active Employee Survey, Rank-and-File/Supervisory Survey Respondents (All Ranks; N = 231)
39 Not all respondents answered all questions. Accordingly, the number of responses for any specific question (N) may vary.

263 | P a g e
Most respondents reported they were currently assigned to a security shift.
ADC Active Employee, “Are you currently assigned to a "specialty position" or a "security shift"? (All Ranks; N = 229)
The figure below provides a breakdown of the specialty assignments of the 38.4% of survey respondents that are assigned to a specialty positions.
ADC Active Employee, “Which specialty are you assigned to?"

264 | P a g e
Survey respondents’ tenure with the ADC generally mirrors the workforce as whole, though a smaller proportion of early career employees responded to the survey.
Active Employees vs. Active ADC Survey Respondents by Years of Service (YOS)
Active Employees (N=270)
Active Survey (N=233)
YOS % %
0 – 2 26.3% 18.9%
3 – 5 14.1% 17.2%
6 – 10 29.3% 27.0%
11 – 15 14.1% 16.7%
16 – 20 4.1% 6.4%
21+ 12.2% 13.7% Source: Payroll run as of 12/31/2016 and Active Employee Survey (n=233). Percentages are rounded to nearest tenth.
To evaluate general satisfaction levels, survey respondents were asked to assess the statement “I am satisfied professionally.” As shown below, less than half (40.3%) of respondents replied “very true” or “true.” Approximately 25% responded “not very true” or “completely untrue”, as illustrated below.
“I am satisfied professionally” (All Ranks; N = 201)
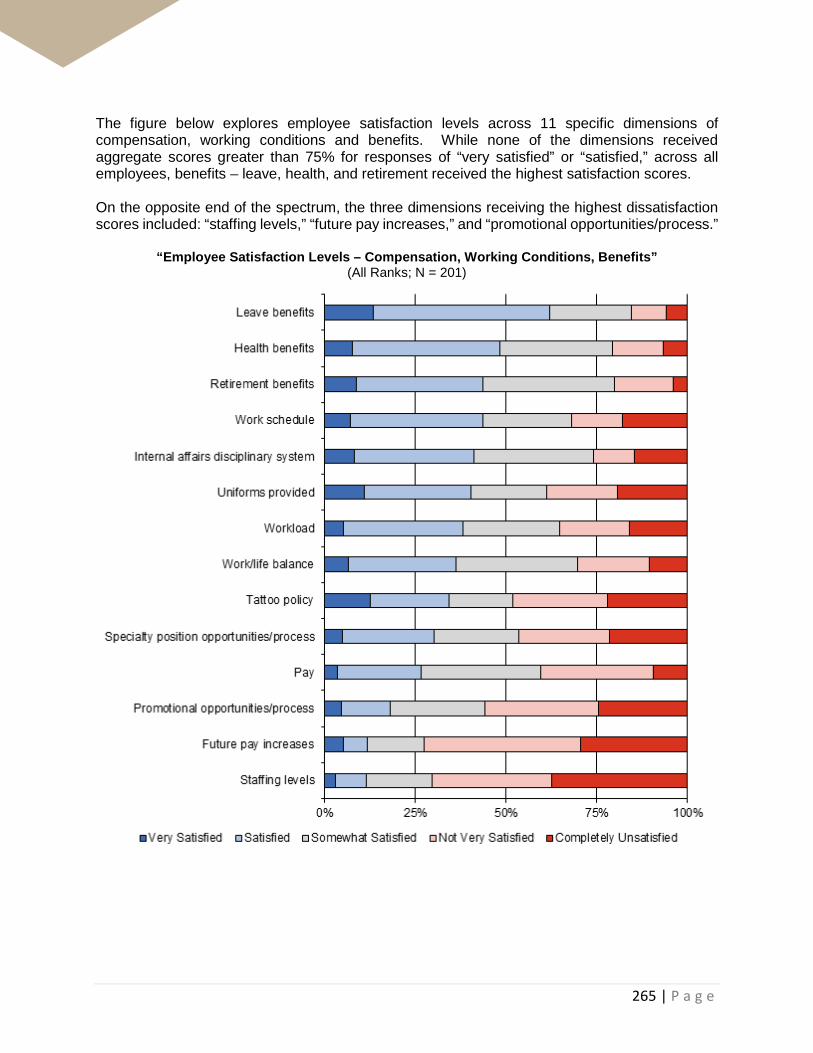
265 | P a g e
The figure below explores employee satisfaction levels across 11 specific dimensions of compensation, working conditions and benefits. While none of the dimensions received aggregate scores greater than 75% for responses of “very satisfied” or “satisfied,” across all employees, benefits – leave, health, and retirement received the highest satisfaction scores. On the opposite end of the spectrum, the three dimensions receiving the highest dissatisfaction scores included: “staffing levels,” “future pay increases,” and “promotional opportunities/process.”
“Employee Satisfaction Levels – Compensation, Working Conditions, Benefits” (All Ranks; N = 201)
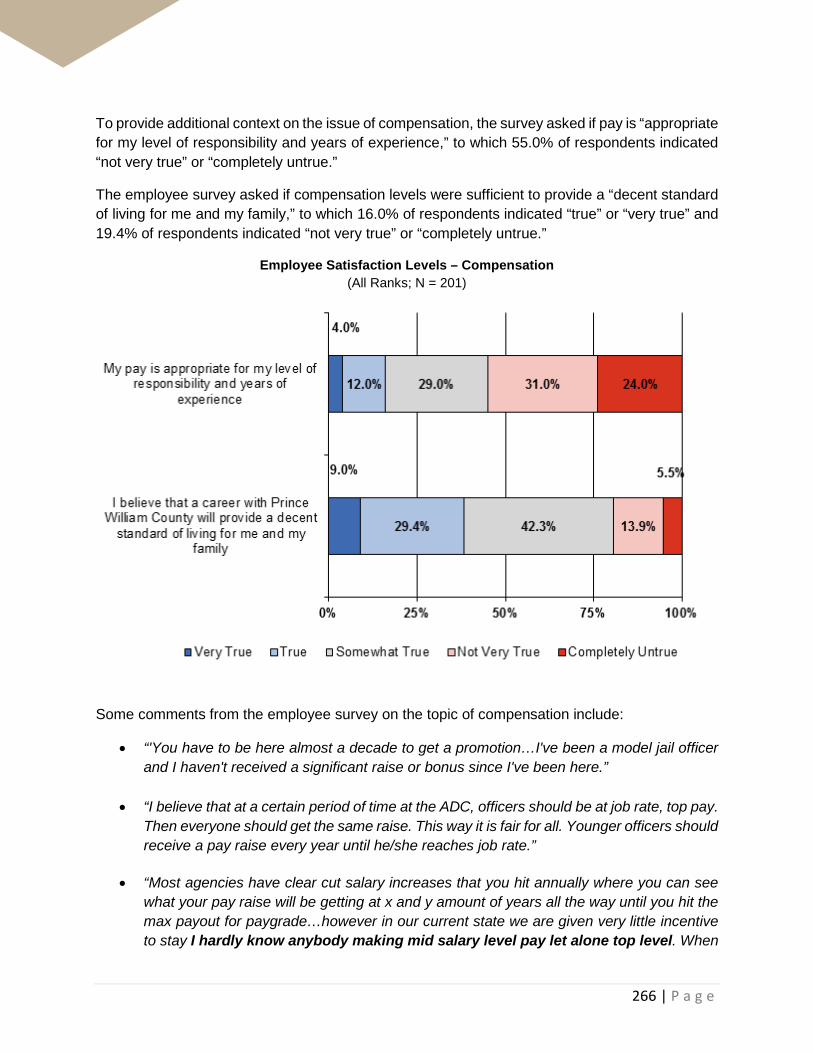
266 | P a g e
To provide additional context on the issue of compensation, the survey asked if pay is “appropriate for my level of responsibility and years of experience,” to which 55.0% of respondents indicated “not very true” or “completely untrue.”
The employee survey asked if compensation levels were sufficient to provide a “decent standard of living for me and my family,” to which 16.0% of respondents indicated “true” or “very true” and 19.4% of respondents indicated “not very true” or “completely untrue.”
Employee Satisfaction Levels – Compensation (All Ranks; N = 201)
Some comments from the employee survey on the topic of compensation include:
• “'You have to be here almost a decade to get a promotion…I've been a model jail officer and I haven't received a significant raise or bonus since I've been here.”
• “I believe that at a certain period of time at the ADC, officers should be at job rate, top pay. Then everyone should get the same raise. This way it is fair for all. Younger officers should receive a pay raise every year until he/she reaches job rate.”
• “Most agencies have clear cut salary increases that you hit annually where you can see what your pay raise will be getting at x and y amount of years all the way until you hit the max payout for paygrade…however in our current state we are given very little incentive to stay I hardly know anybody making mid salary level pay let alone top level. When
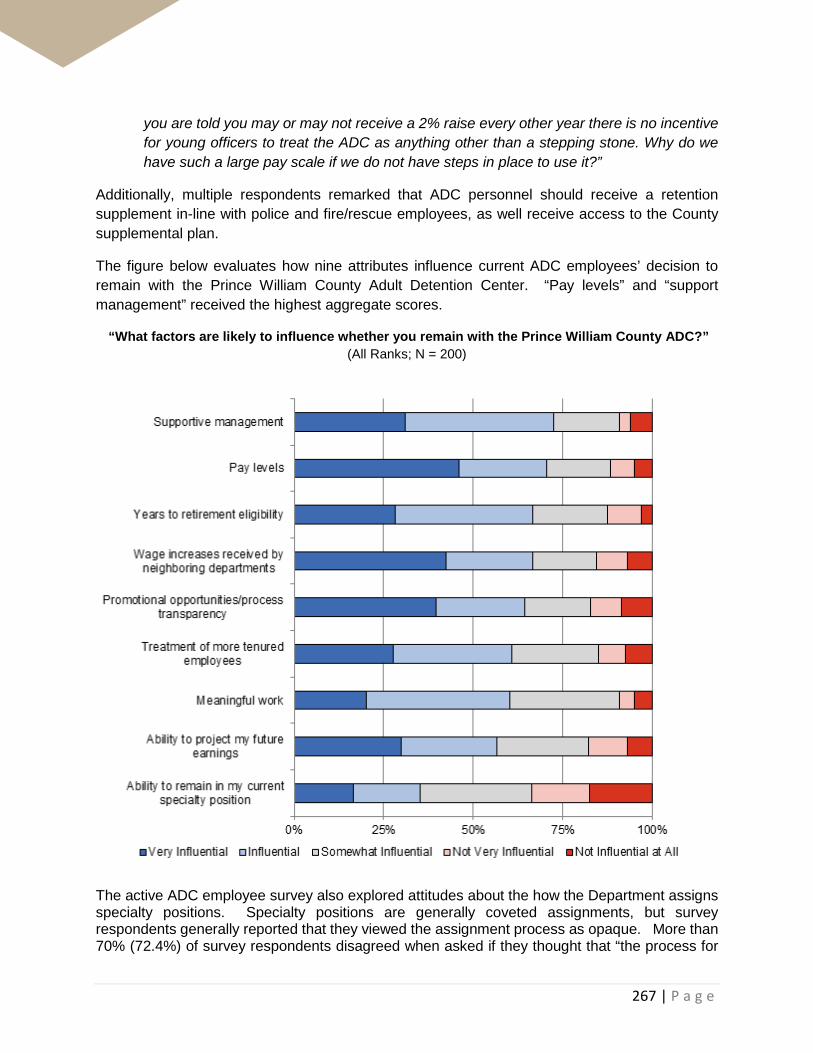
267 | P a g e
you are told you may or may not receive a 2% raise every other year there is no incentive for young officers to treat the ADC as anything other than a stepping stone. Why do we have such a large pay scale if we do not have steps in place to use it?”
Additionally, multiple respondents remarked that ADC personnel should receive a retention supplement in-line with police and fire/rescue employees, as well receive access to the County supplemental plan.
The figure below evaluates how nine attributes influence current ADC employees’ decision to remain with the Prince William County Adult Detention Center. “Pay levels” and “support management” received the highest aggregate scores.
“What factors are likely to influence whether you remain with the Prince William County ADC?” (All Ranks; N = 200)
The active ADC employee survey also explored attitudes about the how the Department assigns specialty positions. Specialty positions are generally coveted assignments, but survey respondents generally reported that they viewed the assignment process as opaque. More than 70% (72.4%) of survey respondents disagreed when asked if they thought that “the process for
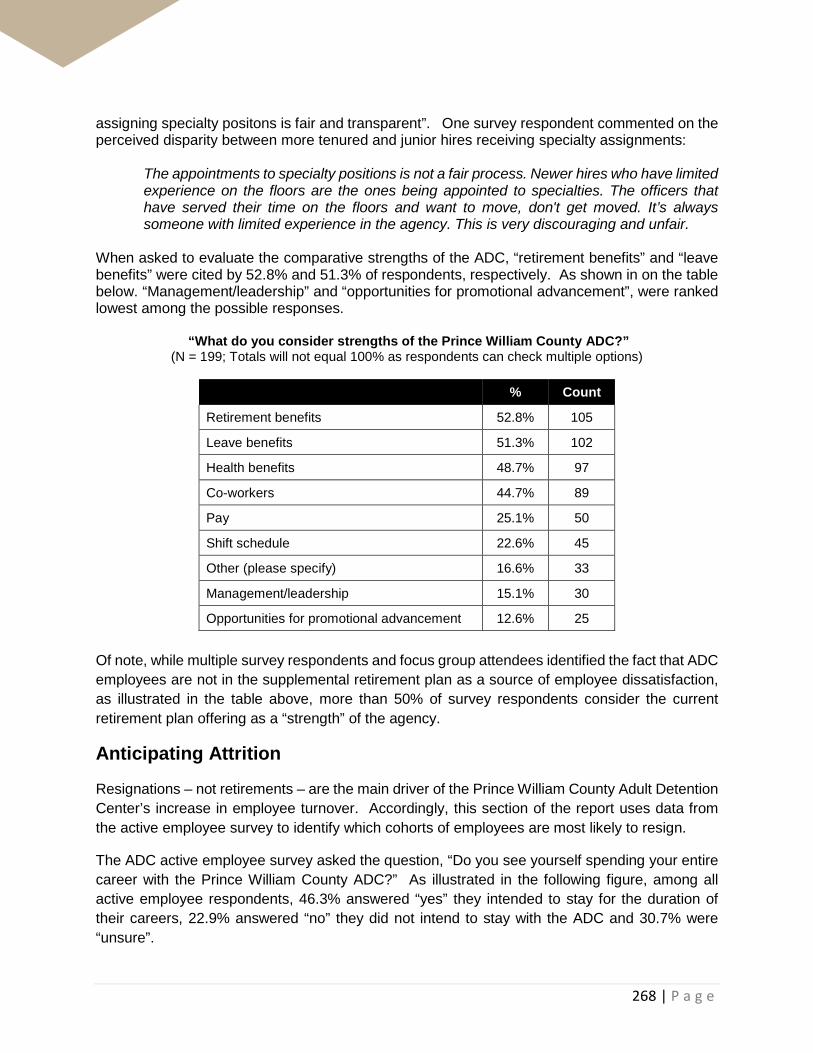
268 | P a g e
assigning specialty positons is fair and transparent”. One survey respondent commented on the perceived disparity between more tenured and junior hires receiving specialty assignments:
The appointments to specialty positions is not a fair process. Newer hires who have limited experience on the floors are the ones being appointed to specialties. The officers that have served their time on the floors and want to move, don't get moved. It’s always someone with limited experience in the agency. This is very discouraging and unfair.
When asked to evaluate the comparative strengths of the ADC, “retirement benefits” and “leave benefits” were cited by 52.8% and 51.3% of respondents, respectively. As shown in on the table below. “Management/leadership” and “opportunities for promotional advancement”, were ranked lowest among the possible responses.
“What do you consider strengths of the Prince William County ADC?” (N = 199; Totals will not equal 100% as respondents can check multiple options)
% Count
Retirement benefits 52.8% 105
Leave benefits 51.3% 102
Health benefits 48.7% 97
Co-workers 44.7% 89
Pay 25.1% 50
Shift schedule 22.6% 45
Other (please specify) 16.6% 33
Management/leadership 15.1% 30
Opportunities for promotional advancement 12.6% 25 Of note, while multiple survey respondents and focus group attendees identified the fact that ADC employees are not in the supplemental retirement plan as a source of employee dissatisfaction, as illustrated in the table above, more than 50% of survey respondents consider the current retirement plan offering as a “strength” of the agency.
Anticipating Attrition
Resignations – not retirements – are the main driver of the Prince William County Adult Detention Center’s increase in employee turnover. Accordingly, this section of the report uses data from the active employee survey to identify which cohorts of employees are most likely to resign.
The ADC active employee survey asked the question, “Do you see yourself spending your entire career with the Prince William County ADC?” As illustrated in the following figure, among all active employee respondents, 46.3% answered “yes” they intended to stay for the duration of their careers, 22.9% answered “no” they did not intend to stay with the ADC and 30.7% were “unsure”.
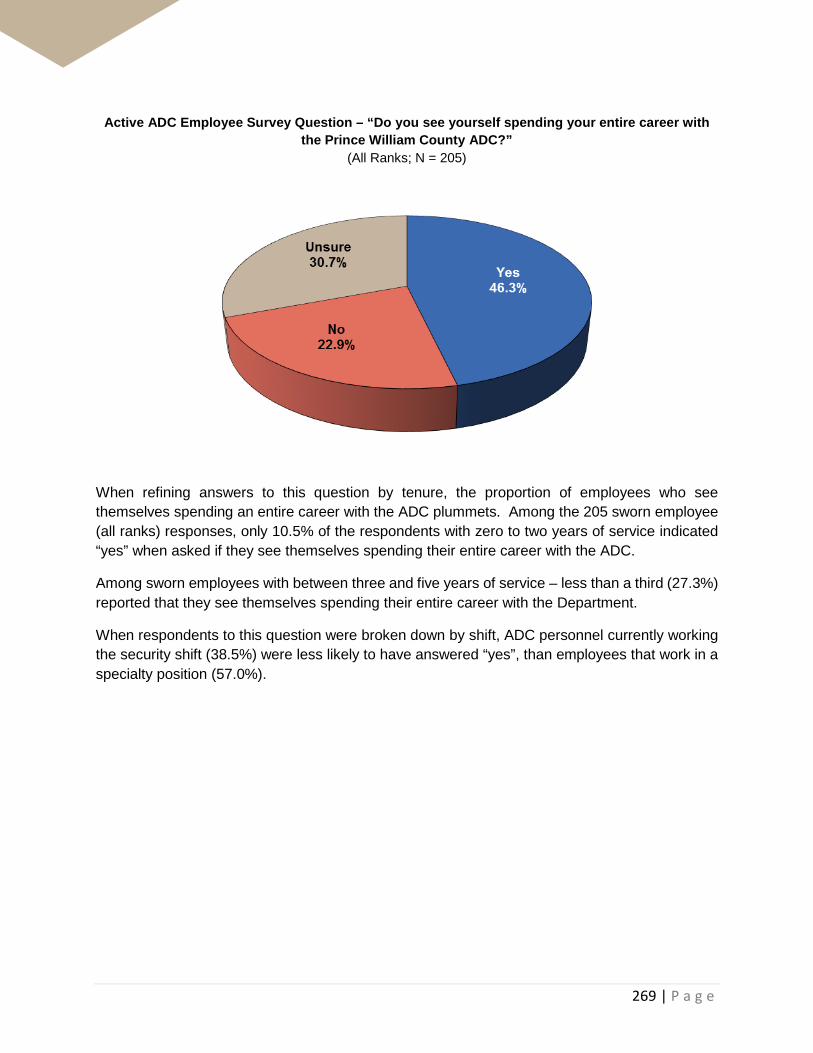
269 | P a g e
Active ADC Employee Survey Question – “Do you see yourself spending your entire career with the Prince William County ADC?”
(All Ranks; N = 205)
When refining answers to this question by tenure, the proportion of employees who see themselves spending an entire career with the ADC plummets. Among the 205 sworn employee (all ranks) responses, only 10.5% of the respondents with zero to two years of service indicated “yes” when asked if they see themselves spending their entire career with the ADC.
Among sworn employees with between three and five years of service – less than a third (27.3%) reported that they see themselves spending their entire career with the Department.
When respondents to this question were broken down by shift, ADC personnel currently working the security shift (38.5%) were less likely to have answered “yes”, than employees that work in a specialty position (57.0%).

270 | P a g e
“Do you see yourself spending your entire career with the Prince William County ADC?” – by Tenure
(All Ranks; N = 205)
To further refine the subset of sworn employees who may leave the department, the employee survey asked if the respondent had applied for another law enforcement position or detention center position in the prior 12 months.
Across all ranks, approximately 25% (24.8%) (50 of 202) of active sworn employees responded “yes” they had applied for another law enforcement or detention center position within the last year. As shown in the figure on the following page, the proportion of active sworn employees who reported applying to another law enforcement agency or detention center in the prior 12 months increases to over 50% (51.4%) for sworn employees with zero to two years of service.

271 | P a g e
Active ADC Survey – Have you applied for a law enforcement position with another law enforcement agency within the past 12 months?
(All Ranks; N = 202)
Security shift personnel work 12-hour shifts with a shift rotation every month. In focus groups and the employee survey, employees report that the monthly turnover contributes to high levels of stress, fatigue, and exhaustion – resulting in higher levels of employee dissatisfaction. As noted previously, most detention centers in the region use either fixed shifts or shift rotations of every two months. As shown in the following figure, in the active employee survey, nearly two-thirds (66%) of respondents considered the monthly shift rotation “a significant impediment” or “a reason why many officers leave the ADC.”
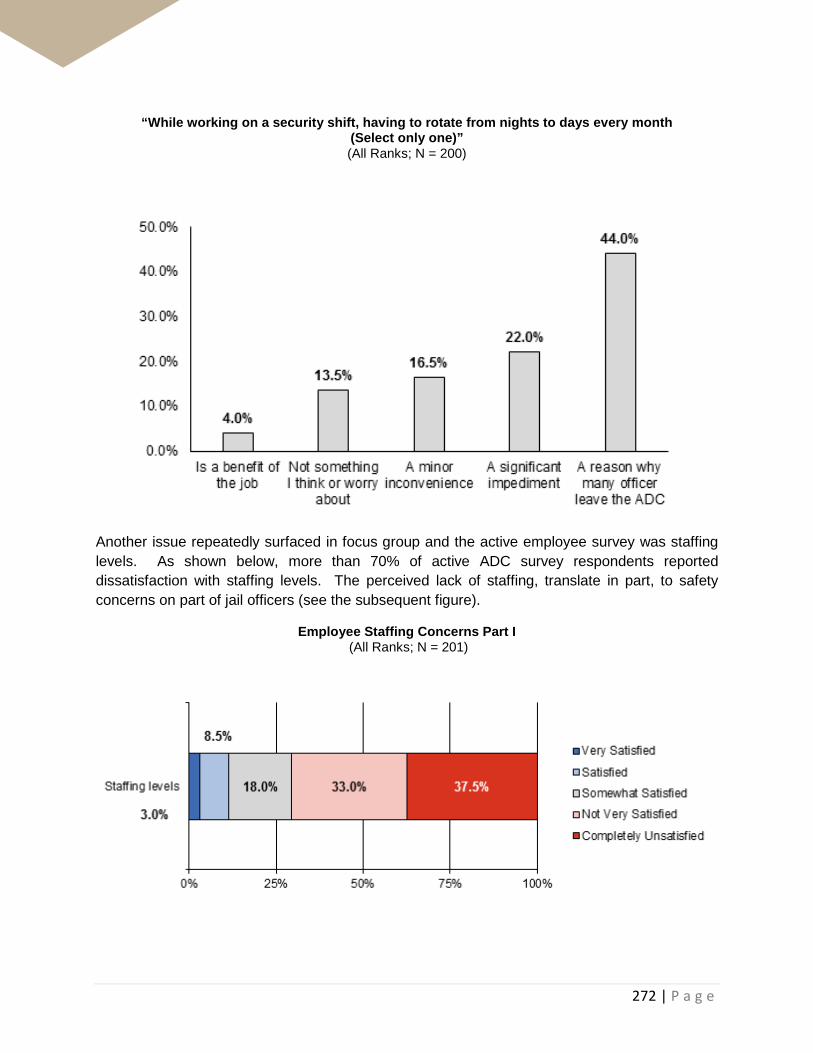
272 | P a g e
“While working on a security shift, having to rotate from nights to days every month (Select only one)” (All Ranks; N = 200)
Another issue repeatedly surfaced in focus group and the active employee survey was staffing levels. As shown below, more than 70% of active ADC survey respondents reported dissatisfaction with staffing levels. The perceived lack of staffing, translate in part, to safety concerns on part of jail officers (see the subsequent figure).
Employee Staffing Concerns Part I (All Ranks; N = 201)

273 | P a g e
In the figure below, when active sworn employees were asked if they felt unsafe due to understaffing, approximately a third (32.8%) responded, “Very True”, or “True”.
Employee Staffing Concerns Part II (All Ranks; N = 201)
Employee Perspectives on Compensation
The active ADC employee survey also gauged employee perspectives on compensation. Their responses indicate that a large proportion of active employees are unable to project their future earnings. This is an influential factor in an employee’s decision to remain with the ADC. Sworn ADC personnel would likely favor a more structured, predictable pay plan where more tenured personnel receive higher pay.
The majority of respondents to the active ADC survey (all ranks) report that they are unable to project their future earnings, as summarized in the figure on the following page.

274 | P a g e
“When I look at the compensation plan for the ADC, I can reasonably estimate my future earnings in 5, 10, and 15 years.”
(All Ranks; N = 200)
Additionally, 91.6% of respondents to the active ADC survey (all ranks) report that employees with longer tenure should earn higher base pay than employees who joined the ADC more recently, as summarized below.
“Employees with a longer tenure should earn higher base pay than employees who joined the Department more recently.”
(All Ranks; N = 202)

275 | P a g e
The following comments from the active employee survey capture some of the current dissatisfaction with pay that was expressed by employees in both focus groups and the survey:
• “People are starting here at the jail make about just as much as I do and I've been here 6 years. I feel that is not a good thing and I feel underpaid compared to a new officer.”
• “I stayed here because the benefits and pay was competitive with the surrounding counties
which is not true today.”
• “Although employment at the ADC has been a positive experience so far. If progression and pay continues at a pace that isn't competitive with other agencies in the area, I will consider leaving. I need to be employed by an agency that sees value in investing in me as an employee, so that I can in turn produce quality work for the agency.”
It should be noted that new hires were in large part satisfied with their entry pay, but when asked “What factors are likely to influence whether you remain with the Prince William County Adult Detention Center?” the top two answers were, “Wage increases received by neighboring departments” and “Treatment of more tenured employees.”
As one recruit explained, “Starting out is great, long term isn’t so great. [The] pay raise[s] after a few years [are not] appealing.”

276 | P a g e
Recruitment The Prince William County Adult Detention Center (ADC) actively recruits and employs a diverse workforce. In order to meet replacement demands from attrition, as well as, expected growth in the region, the ADC needs to maintain – if not grow – the number of applicants hired each year.
Recruitment Process
As detailed below, the ADC has generated an average of 276 applicants annually since FY 2015. For FY 2018, the ADC has received 83 applicants as of October 2017 (Q1 of FY 2018).
ADC Applicants and Academy Classes (FY 2015 – FY 2017)
FY 2015 FY 2016 FY 2017
Applicants (Submitted Online) 342 239 247
Recruits Entering Academy 26 33 20
Employed as of April 2017 14; 53.8% 25; 75.8% 20; 100.0%
Qualified applicants are chosen from this pipeline of recruits through the County’s selection process – a critical component to the County’s overall recruitment effort. The Prince William County ADC utilizes a phased selection process that identifies qualified applicants and moves them through a series of interviews and tests. Many standards are required by Federal and State statute. The current selection process is detailed in the process map on the following page.
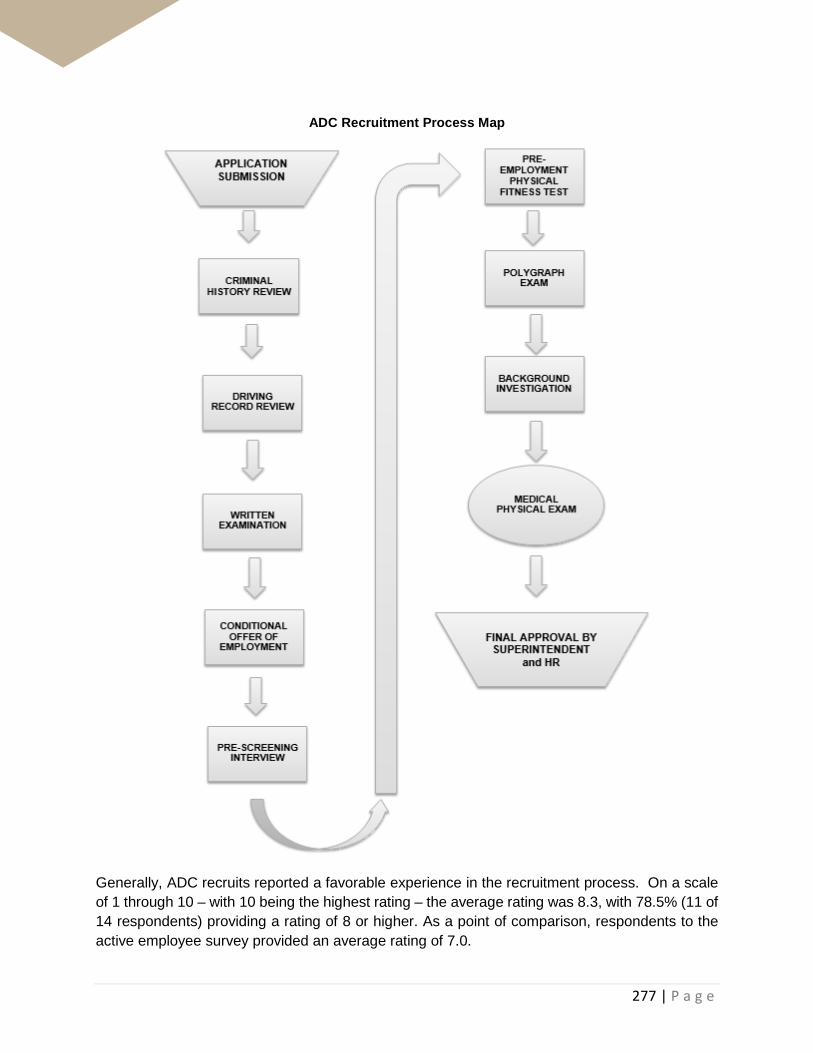
277 | P a g e
ADC Recruitment Process Map
Generally, ADC recruits reported a favorable experience in the recruitment process. On a scale of 1 through 10 – with 10 being the highest rating – the average rating was 8.3, with 78.5% (11 of 14 respondents) providing a rating of 8 or higher. As a point of comparison, respondents to the active employee survey provided an average rating of 7.0.
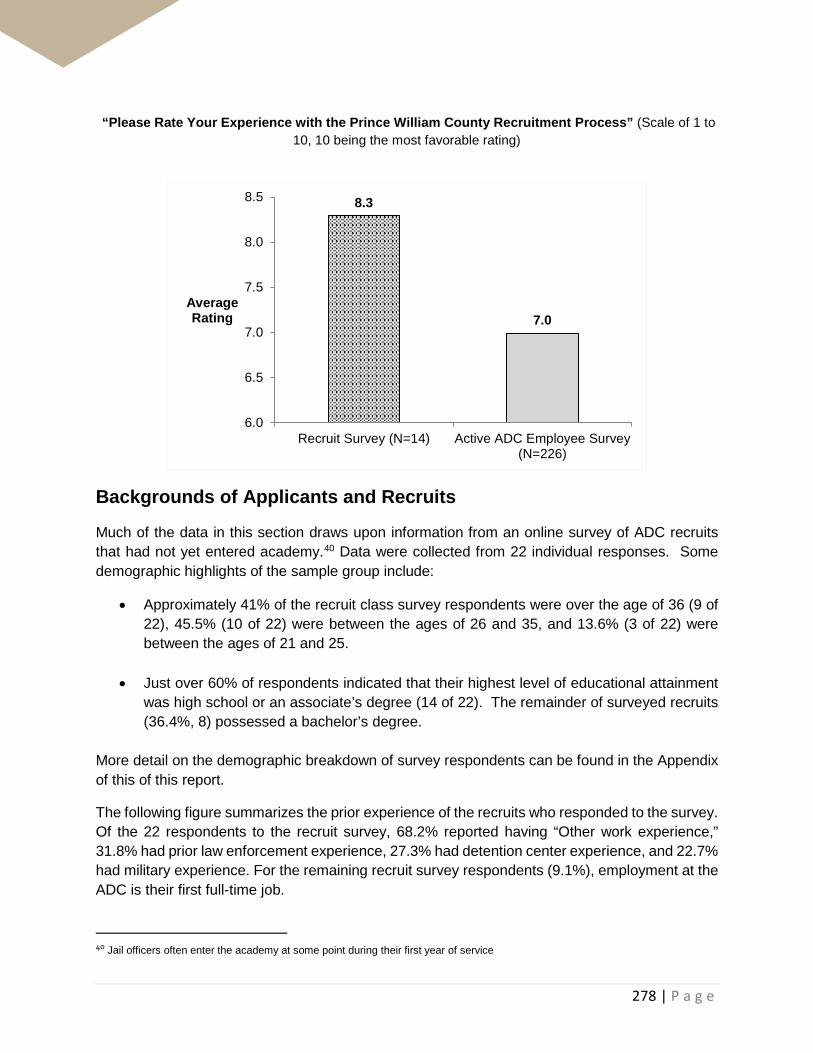
278 | P a g e
“Please Rate Your Experience with the Prince William County Recruitment Process” (Scale of 1 to 10, 10 being the most favorable rating)
Backgrounds of Applicants and Recruits
Much of the data in this section draws upon information from an online survey of ADC recruits that had not yet entered academy.40 Data were collected from 22 individual responses. Some demographic highlights of the sample group include:
• Approximately 41% of the recruit class survey respondents were over the age of 36 (9 of 22), 45.5% (10 of 22) were between the ages of 26 and 35, and 13.6% (3 of 22) were between the ages of 21 and 25.
• Just over 60% of respondents indicated that their highest level of educational attainment was high school or an associate’s degree (14 of 22). The remainder of surveyed recruits (36.4%, 8) possessed a bachelor’s degree.
More detail on the demographic breakdown of survey respondents can be found in the Appendix of this of this report.
The following figure summarizes the prior experience of the recruits who responded to the survey. Of the 22 respondents to the recruit survey, 68.2% reported having “Other work experience,” 31.8% had prior law enforcement experience, 27.3% had detention center experience, and 22.7% had military experience. For the remaining recruit survey respondents (9.1%), employment at the ADC is their first full-time job.
40 Jail officers often enter the academy at some point during their first year of service
8.3
7.0
6.0
6.5
7.0
7.5
8.0
8.5
Recruit Survey (N=14) Active ADC Employee Survey(N=226)
Average Rating
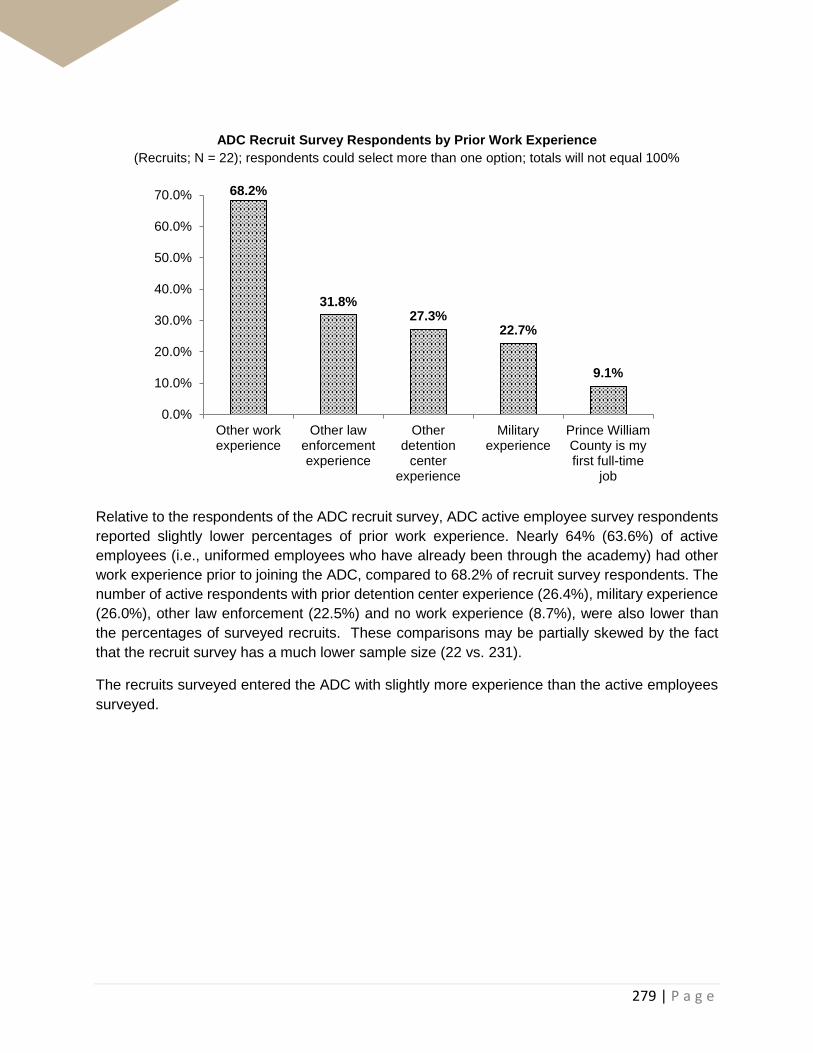
279 | P a g e
ADC Recruit Survey Respondents by Prior Work Experience
(Recruits; N = 22); respondents could select more than one option; totals will not equal 100%
Relative to the respondents of the ADC recruit survey, ADC active employee survey respondents reported slightly lower percentages of prior work experience. Nearly 64% (63.6%) of active employees (i.e., uniformed employees who have already been through the academy) had other work experience prior to joining the ADC, compared to 68.2% of recruit survey respondents. The number of active respondents with prior detention center experience (26.4%), military experience (26.0%), other law enforcement (22.5%) and no work experience (8.7%), were also lower than the percentages of surveyed recruits. These comparisons may be partially skewed by the fact that the recruit survey has a much lower sample size (22 vs. 231).
The recruits surveyed entered the ADC with slightly more experience than the active employees surveyed.
68.2%
31.8%27.3%
22.7%
9.1%
0.0%
10.0%
20.0%
30.0%
40.0%
50.0%
60.0%
70.0%
Other workexperience
Other lawenforcementexperience
Otherdetention
centerexperience
Militaryexperience
Prince WilliamCounty is myfirst full-time
job

280 | P a g e
ADC Active Survey Respondents by Prior Work Experience (Recruits; N = 231); respondents could select more than one option; totals will not equal 100%
As recruitment data show, 26.0% of ADC active survey respondents and 22.7% of ADC recruit survey respondents have prior military experience. The military provides a strong pipeline of recruits for the ADC. When asked how to improve recruitment efforts, both recruit and active survey respondents answered that the ADC’s tattoo policies were too restrictive and may be restricting the military pipeline of potential applicants. The ADC’s Standard Operational Procedures (revised 7/31/2017), allows sworn staff to have tattoos, but they must be covered by wearing either an agency issued long sleeve shirt or a sleeve that closely matches their skin color.
The table on the following page, illustrates that the ADC is attracting a racially diverse mix of applicants. The percent of recruit survey respondents that identify as African-American and Latino outpace both County and active survey respondent averages.
63.6%
26.4% 26.0%22.5%
8.7%
0.0%
10.0%
20.0%
30.0%
40.0%
50.0%
60.0%
70.0%
Other workexperience
Otherdetention
centerexperience
Militaryexperience
Other lawenforcementexperience
Prince WilliamCounty is myfirst full-time
job

281 | P a g e
ADC Recruit Survey Respondents by Race41 Respondents could select more than one option; totals will not equal 100%
Race Prince William County
ADC Recruits
N=22 ADC Active
N=227
African-American 20.0% 40.9% 33.5% White 46.0% 31.8% 52.9% Hispanic/Latino 22.0% 27.3% 9.3% Asian 8.0% 0.0% 3.1% Other 5.0% 0.0% 3.1%
Recruitment Channels
According to the results of the ADC recruit survey; there are two principal channels through which the Prince William County ADC reaches new recruits:
• Personal networks – family, friends, Prince William County employees • Online
Personal networks are one of the most influential factors in recruitment for the Prince William County ADC, as evidenced in the following figure. When active employees were asked, “How did you learn about the Prince William County ADC?” Nearly 42% (41.9%) of respondents reported that they learned of the ADC through family or friends, while 15.0% of respondents reported that they learned of the ADC through a County employee.
41 Source: Prince William County, Economic Development, Demographics; Prince William County, Human Resources Department
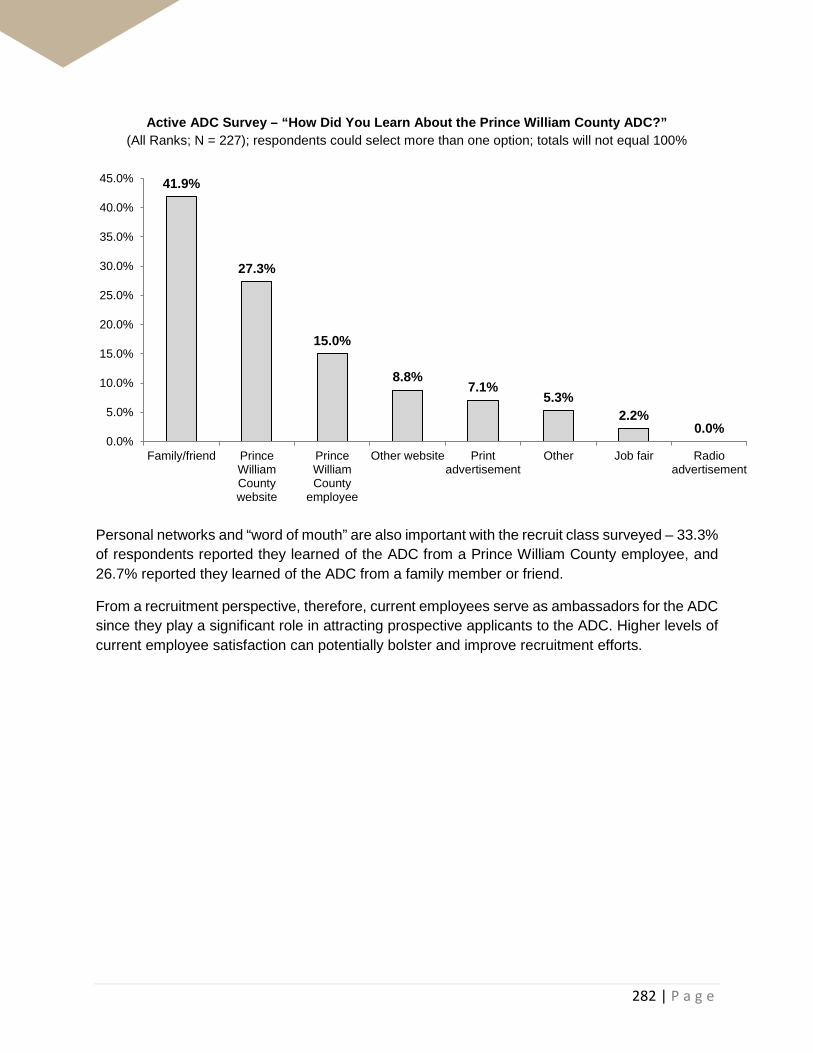
282 | P a g e
Active ADC Survey – “How Did You Learn About the Prince William County ADC?” (All Ranks; N = 227); respondents could select more than one option; totals will not equal 100%
Personal networks and “word of mouth” are also important with the recruit class surveyed – 33.3% of respondents reported they learned of the ADC from a Prince William County employee, and 26.7% reported they learned of the ADC from a family member or friend.
From a recruitment perspective, therefore, current employees serve as ambassadors for the ADC since they play a significant role in attracting prospective applicants to the ADC. Higher levels of current employee satisfaction can potentially bolster and improve recruitment efforts.
41.9%
27.3%
15.0%
8.8%7.1%
5.3%2.2%
0.0%0.0%
5.0%
10.0%
15.0%
20.0%
25.0%
30.0%
35.0%
40.0%
45.0%
Family/friend PrinceWilliamCountywebsite
PrinceWilliamCounty
employee
Other website Printadvertisement
Other Job fair Radioadvertisement

283 | P a g e
ADC Recruit Survey – “How Did You Learn About the Prince William County ADC?”
(Recruits; N = 15); respondents could select more than one option; totals will not equal 100%
Additionally, one out of every three recruits reported learning about the ADC on the Prince William County website – another 13.3% reported that they visited another website. Recruits also reported learning about the Prince William County ADC through postings on governmentjobs.gov.
The ADC’s tattoo policy was a common topic referenced in the comments section of the employee surveys. While more than one-fourth of active employees and recruits report having military experience, there is a perception that there is a large contingency of qualified military applicants who are passed over during the recruitment process for having tattoos that do not comply with the ADC’s policies, despite being in full compliance with military guidelines. This is particularly relevant for the ADC given the proximity of the Marine Corps Base in Quantico located in Prince William County and Fort Belvoir in bordering Fairfax County. Some relevant comments from the surveys include:
• “With changing the tattoo policy I think you are on the right track. A lot of members in the military has tattoos.”
33.3% 33.3%
26.7%
13.3%
6.7%
0.0% 0.0% 0.0%0.0%
5.0%
10.0%
15.0%
20.0%
25.0%
30.0%
35.0%
40.0%
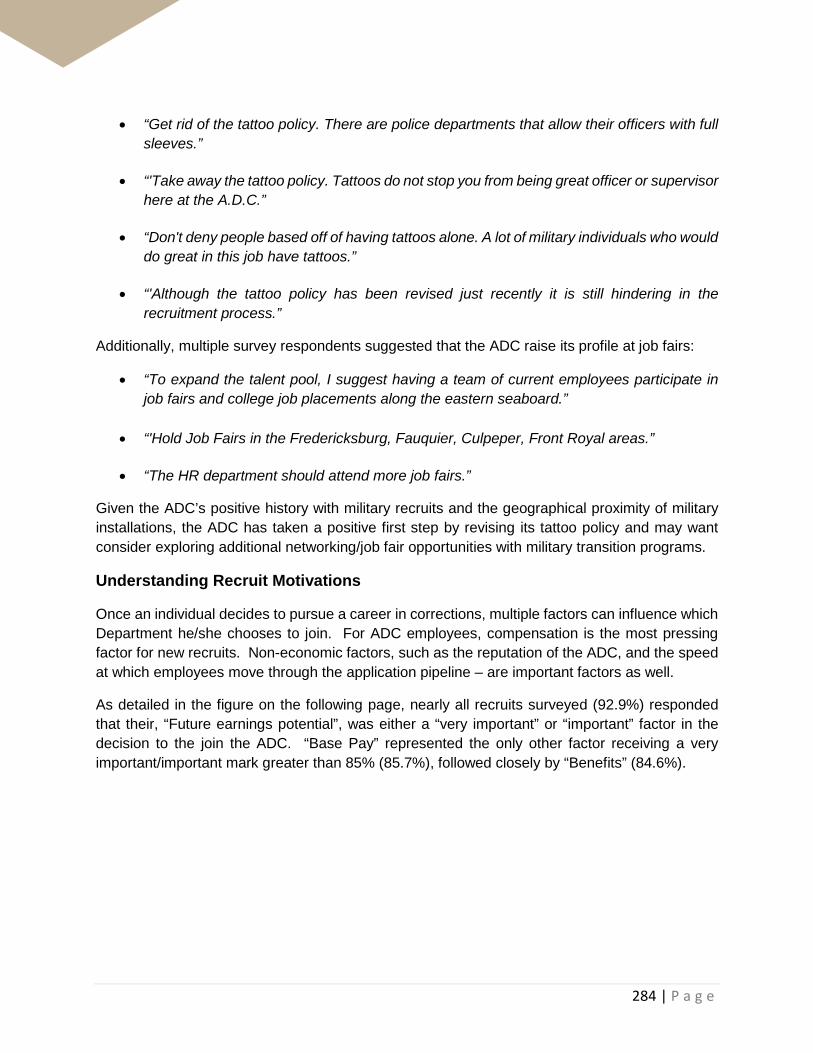
284 | P a g e
• “Get rid of the tattoo policy. There are police departments that allow their officers with full sleeves.”
• “'Take away the tattoo policy. Tattoos do not stop you from being great officer or supervisor here at the A.D.C.”
• “Don't deny people based off of having tattoos alone. A lot of military individuals who would do great in this job have tattoos.”
• “'Although the tattoo policy has been revised just recently it is still hindering in the recruitment process.”
Additionally, multiple survey respondents suggested that the ADC raise its profile at job fairs:
• “To expand the talent pool, I suggest having a team of current employees participate in job fairs and college job placements along the eastern seaboard.”
• “'Hold Job Fairs in the Fredericksburg, Fauquier, Culpeper, Front Royal areas.”
• “The HR department should attend more job fairs.”
Given the ADC’s positive history with military recruits and the geographical proximity of military installations, the ADC has taken a positive first step by revising its tattoo policy and may want consider exploring additional networking/job fair opportunities with military transition programs.
Understanding Recruit Motivations
Once an individual decides to pursue a career in corrections, multiple factors can influence which Department he/she chooses to join. For ADC employees, compensation is the most pressing factor for new recruits. Non-economic factors, such as the reputation of the ADC, and the speed at which employees move through the application pipeline – are important factors as well.
As detailed in the figure on the following page, nearly all recruits surveyed (92.9%) responded that their, “Future earnings potential”, was either a “very important” or “important” factor in the decision to the join the ADC. “Base Pay” represented the only other factor receiving a very important/important mark greater than 85% (85.7%), followed closely by “Benefits” (84.6%).

285 | P a g e
ADC Recruit Employee Survey Question – “Rate how important each factor was in your decision to join the Prince William County ADC.”
(Recruits; N= 14)
Similarly, when asked to identify the primary factor why they chose to join the Prince William County ADC, the top four reasons were, “First department that hired me”, “Pay, “Benefits” and “To build my resume, so I can leave for other employment”, as illustrated in the figure on the following page. With an older more experienced workforce, in an area that is rich with public safety employment opportunities, the timeliness of the ADC’s hiring process will be critical to maintaining and growing the ADC’s workforce.
0% 25% 50% 75% 100%
Future earnings potential
Base Pay
Benefits
Promotional opportunities
Gain necessary experience for federal or other lawenforcement career
Geographic location
Interactions with recruitment personnel
Reputation of ADC
Opportunities for specialty assignment
Shift schedule
Very Important Important Somewhat Important Not Very Important Not Important At All

286 | P a g e
Recruit ADC Survey – “What is the Primary Reason you chose to join the Prince William County ADC?
(Recruits; N = 13)
In comparison, current ADC sworn personnel reported less of an emphasis on building their resumes so that they could leave for other employment. More than 26% of respondents reported that the, “First department that hired me”, served as the primary reason why they chose to join the Prince William County ADC.
Active ADC Survey – “What is the Primary Reason you chose to join the Prince William County
ADC?” (All Ranks; N = 227)
23.1%
23.1%
15.4%
15.4%
7.7%
7.7%
7.7%
0.0%
0.0%
0.0%
0.0% 5.0% 10.0% 15.0% 20.0% 25.0%
First department that hired me
Pay
Benefits
To build my resume, so I can leave for otheremployment
Recommendation of a friend, family member, orcurrent employee
Live in the area
Other
Reputation of the ADC
Shift schedule
To receive law enforcement training
26.4%19.8%
17.6%
11.5%
9.7%
6.2%
5.7%
1.8%
1.3%
0.0% 10.0% 20.0% 30.0%
First department that hired me
Recommendation of a friend, family member, or currentemployee
Pay
Live in the area
Other (please specify)
Benefits
To build my resume, so I can leave for other employment
Shift schedule
Reputation of the ADC
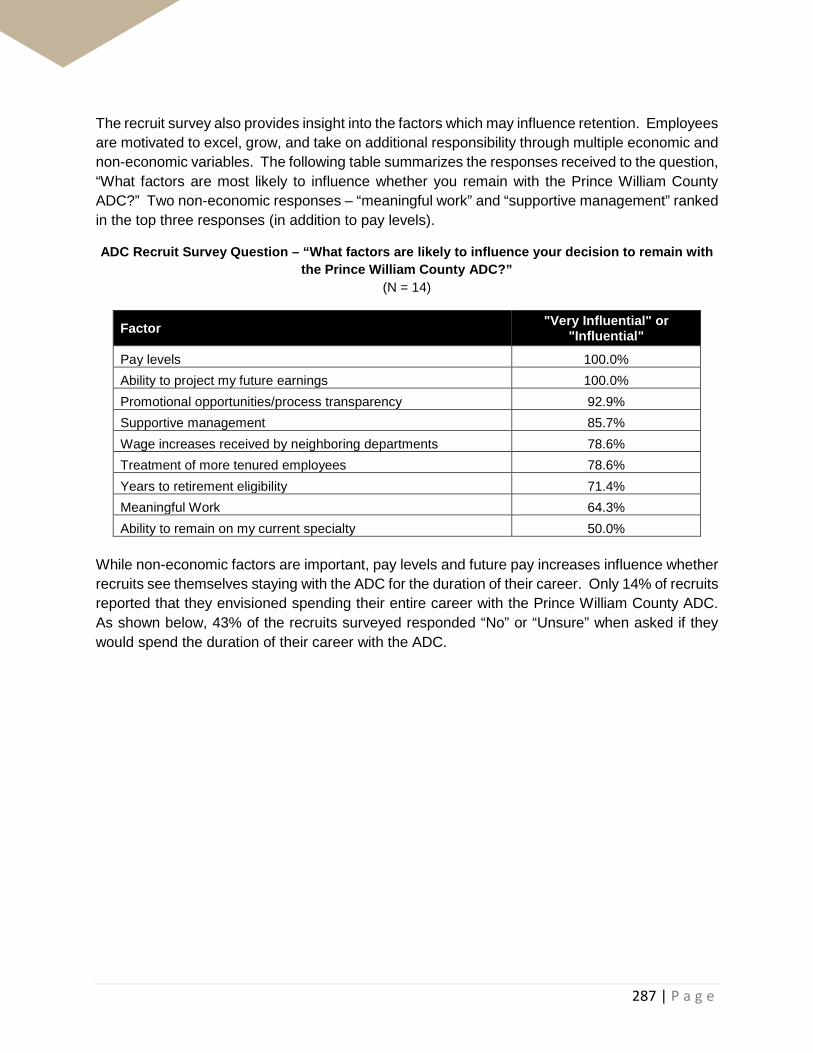
287 | P a g e
The recruit survey also provides insight into the factors which may influence retention. Employees are motivated to excel, grow, and take on additional responsibility through multiple economic and non-economic variables. The following table summarizes the responses received to the question, “What factors are most likely to influence whether you remain with the Prince William County ADC?” Two non-economic responses – “meaningful work” and “supportive management” ranked in the top three responses (in addition to pay levels).
ADC Recruit Survey Question – “What factors are likely to influence your decision to remain with the Prince William County ADC?”
(N = 14)
Factor "Very Influential" or "Influential"
Pay levels 100.0% Ability to project my future earnings 100.0% Promotional opportunities/process transparency 92.9% Supportive management 85.7% Wage increases received by neighboring departments 78.6% Treatment of more tenured employees 78.6% Years to retirement eligibility 71.4% Meaningful Work 64.3% Ability to remain on my current specialty 50.0%
While non-economic factors are important, pay levels and future pay increases influence whether recruits see themselves staying with the ADC for the duration of their career. Only 14% of recruits reported that they envisioned spending their entire career with the Prince William County ADC. As shown below, 43% of the recruits surveyed responded “No” or “Unsure” when asked if they would spend the duration of their career with the ADC.

288 | P a g e
ADC Recruit Employee Survey Question – “Do you see yourself spending your entire career with the Prince William County ADC?”
(Recruits; N = 14)
While non-economic factors play a role in attracting qualified applicants to the Prince William County ADC, current pay levels and future earnings emerge as the primary concern for recruits – which may potentially fuel future attrition. A more predictable compensation plan, could potentially resolve some of the uncertainty for incoming recruits.
Finally, the recruit survey provides some valuable insight into messaging that will resonate well with incoming recruits. The ADC may consider incorporating the messages below in communications with prospective applicants, as well as marketing and online materials:
• Competitive entry pay and future earning potential;
• Ample opportunities for growth (e.g., promotion and specialty assignments); and • Strong comprehensive benefits package (health, retirement, and leave).
Yes14.3%
No42.9%
Unsure42.9%

289 | P a g e
X. Appendix I. Discussion of Retention Best Practices The recommended options within this report are designed to address pressing public safety employee retention concerns, and provide a roadmap for increasing job satisfaction and ultimately employee retention. Nevertheless, retaining high quality public safety employees should be viewed as an objective requiring ongoing effort. This sections summarizes a series of retention best practices for Prince William County to consider integrating into its human capital management activities. The practices listed represent a mix of the tactical and strategic, are divided into three general categories – analytical, compensation, and non-economic practices. Analytical Practices Public safety agencies, working in concert with the County Department of Human Resources and outside resources – when needed – should consider integrating the following practices into their talent management activities:
• Regularly monitor departmental turnover and quit rates, particularly at the rank-and-file level (i.e., police officer, fire rescue technician, jail officer and sheriff’s deputy).
• Perform exit interviews and anonymous web-based surveys to capture data on reasons why employees voluntarily resign. While multiple County Departments capture information in exit interviews, anonymous web-based surveys may allow departing employees to be more candid about their attitudes and perspectives and share more information that could be useful to the County in developing future retention strategies (e.g., the name of new employer). Additionally, regularly capture and analyze key demographic data (e.g., years of service, assignment, station, etc.) to see if any patterns or trends can be identified among public safety employees separating from the County.
• Regularly monitor compensation and benefits trends, as well as hiring practices among public safety employers in the region, inclusive the federal law enforcement employers.
• Perform a comprehensive review of employee retention and recruitment every three to five years. This time frame may vary depending on trends quit or turnover rate data, or changes in compensation or benefits offerings in comparison employers.

290 | P a g e
Compensation Practices Maintaining a competitive compensation package represents a critical component of a successful retention strategy. Some general compensation-related best practices to improve retention include:
• Create a clear compensation path so that employees can reasonably estimate future earnings. Elements of a clear compensation path may include – a pay scale or well-defined pay progression, regular pay-for-performance increases, and clear compensation guidelines around promotional advancement.
• Provide transparency and fairness in earnings so that employees can understand pay premiums for which they are eligible and career advancement opportunities they can pursue.
• Maintain a market-competitive compensation package for employees, recognizing that there may be different dynamics driving labor markets for each public safety profession.
• Be mindful of compensation decisions – such as rolling recruitment incentives into base pay – that may create pay compression.
• Provide opportunities for career advancement through non-supervisory career paths (e.g., a master police officer). These alternative career pathways, however, should be well-defined, with duties, responsibilities, and/or professional development requirements that are differentiated from rank-and-file employees.
Non-Economic Practices As evidenced in the employee surveys for all public safety employee groups, “meaningful work” and “supportive management” appear as a significant influencer in employees’ decision to remain with the County. Some non-economic practices that can contribute a supportive and meaningful working environment include:
• Develop and foster open communication by creating an environment where
employees can voice their opinions – appropriately and constructively – to supervisors and command staff.
• Provide transparency and feedback in decision-making around promotions, assignments, and transfers between stations/posts.
• Recognize high-performing employees and encourage employees to provide suggestions and input.

291 | P a g e
• Clearly articulate and emphasize the positive elements and accomplishments of
each agency, linking to the agency’s public safety mission.
• Provide access to training opportunities for employees pursue additional professional development and acquire new skillsets and experiences.
Additionally, it was noted in the separated survey responses that multiple former employees expressed some willingness to return to County employment. Departments may consider establishing communication protocols, and re-recruitment procedures for former public safety employees who leave County employment.
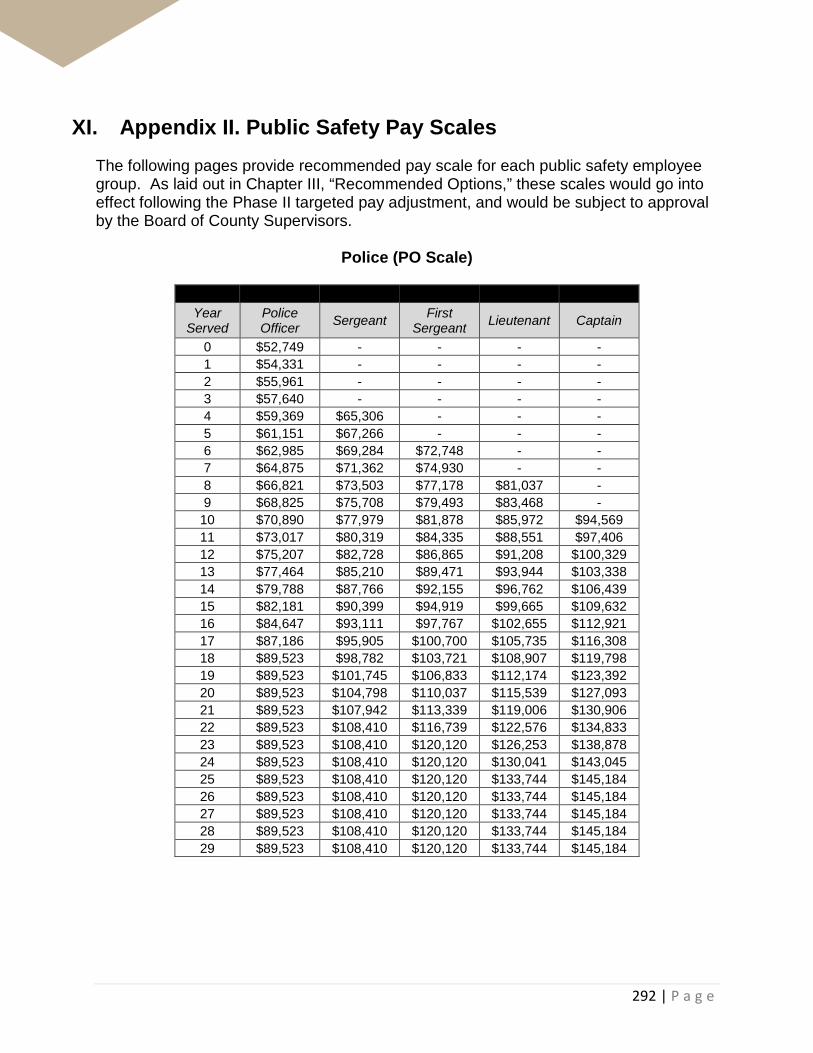
292 | P a g e
XI. Appendix II. Public Safety Pay Scales The following pages provide recommended pay scale for each public safety employee group. As laid out in Chapter III, “Recommended Options,” these scales would go into effect following the Phase II targeted pay adjustment, and would be subject to approval by the Board of County Supervisors.
Police (PO Scale)
Year
Served Police Officer Sergeant First
Sergeant Lieutenant Captain
0 $52,749 - - - - 1 $54,331 - - - - 2 $55,961 - - - - 3 $57,640 - - - - 4 $59,369 $65,306 - - - 5 $61,151 $67,266 - - - 6 $62,985 $69,284 $72,748 - - 7 $64,875 $71,362 $74,930 - - 8 $66,821 $73,503 $77,178 $81,037 - 9 $68,825 $75,708 $79,493 $83,468 -
10 $70,890 $77,979 $81,878 $85,972 $94,569 11 $73,017 $80,319 $84,335 $88,551 $97,406 12 $75,207 $82,728 $86,865 $91,208 $100,329 13 $77,464 $85,210 $89,471 $93,944 $103,338 14 $79,788 $87,766 $92,155 $96,762 $106,439 15 $82,181 $90,399 $94,919 $99,665 $109,632 16 $84,647 $93,111 $97,767 $102,655 $112,921 17 $87,186 $95,905 $100,700 $105,735 $116,308 18 $89,523 $98,782 $103,721 $108,907 $119,798 19 $89,523 $101,745 $106,833 $112,174 $123,392 20 $89,523 $104,798 $110,037 $115,539 $127,093 21 $89,523 $107,942 $113,339 $119,006 $130,906 22 $89,523 $108,410 $116,739 $122,576 $134,833 23 $89,523 $108,410 $120,120 $126,253 $138,878 24 $89,523 $108,410 $120,120 $130,041 $143,045 25 $89,523 $108,410 $120,120 $133,744 $145,184 26 $89,523 $108,410 $120,120 $133,744 $145,184 27 $89,523 $108,410 $120,120 $133,744 $145,184 28 $89,523 $108,410 $120,120 $133,744 $145,184 29 $89,523 $108,410 $120,120 $133,744 $145,184

293 | P a g e
Fire and Rescue (FR Scale) Assumes 2,912 Annual Hours Worked
Year Served Tech I Tech II Lieutenant Captain Battalion
Chief 0 $52,749 - - - - 1 $54,331 - - - - 2 $55,961 $61,558 - - - 3 $57,640 $63,404 - - - 4 $59,369 $65,306 $71,837 - - 5 $61,151 $67,266 $73,992 - - 6 $62,985 $69,284 $76,212 $80,023 - 7 $64,875 $71,362 $78,498 $82,423 - 8 $66,821 $73,503 $80,853 $84,896 $93,385 9 $68,825 $75,708 $83,279 $87,443 $96,187
10 $70,890 $77,979 $85,777 $90,066 $99,073 11 $73,017 $80,319 $88,351 $92,768 $102,045 12 $75,207 $82,728 $91,001 $95,551 $105,106 13 $77,464 $85,210 $93,731 $98,418 $108,259 14 $79,788 $87,766 $96,543 $101,370 $111,507 15 $81,910 $89,523 $99,439 $104,411 $114,852 16 $81,910 $89,523 $102,422 $107,544 $118,298 17 $81,910 $89,523 $105,495 $110,770 $121,847 18 $81,910 $89,523 $108,410 $114,093 $125,502 19 $81,910 $89,523 $108,410 $117,516 $129,267 20 $81,910 $89,523 $108,410 $120,120 $133,145 21 $81,910 $89,523 $108,410 $120,120 $137,140 22 $81,910 $89,523 $108,410 $120,120 $138,258 23 $81,910 $89,523 $108,410 $120,120 $138,258 24 $81,910 $89,523 $108,410 $120,120 $138,258 25 $81,910 $89,523 $108,410 $120,120 $138,258 26 $81,910 $89,523 $108,410 $120,120 $138,258 27 $81,910 $89,523 $108,410 $120,120 $138,258 28 $81,910 $89,523 $108,410 $120,120 $138,258 29 $81,910 $89,523 $108,410 $120,120 $138,258

294 | P a g e
Sheriff’s Office (SH Scale)
Year Served
Sheriff's Deputy
Sheriff's Master Deputy
Sheriff's Sergeant
Sheriff's First
Sergeant
Sheriff's Lieutenant
Sheriff's Captain
0 $48,256 - - - - - 1 $49,704 - - - - - 2 $51,195 $53,755 - - - - 3 $52,731 $55,367 - - - - 4 $54,313 $57,028 $59,880 - - - 5 $55,942 $58,739 $61,676 - - - 6 $57,620 $60,501 $63,526 $66,703 - - 7 $59,349 $62,316 $65,432 $68,704 - - 8 $61,129 $64,186 $67,395 $70,765 $74,303 - 9 $62,963 $66,111 $69,417 $72,888 $76,532 $84,185 10 $64,852 $68,095 $71,499 $75,074 $78,828 $86,711 11 $66,798 $70,137 $73,644 $77,327 $81,193 $89,312 12 $68,802 $72,242 $75,854 $79,646 $83,629 $91,992 13 $70,866 $74,409 $78,129 $82,036 $86,138 $94,751 14 $72,992 $76,641 $80,473 $84,497 $88,722 $97,594 15 $75,181 $78,940 $82,887 $87,032 $91,383 $100,522 16 $77,437 $81,309 $85,374 $89,643 $94,125 $103,537 17 $79,760 $83,748 $87,935 $92,332 $96,949 $106,643 18 $81,910 $86,260 $90,573 $95,102 $99,857 $109,843 19 $81,910 $88,848 $93,290 $97,955 $102,853 $113,138 20 $81,910 $89,523 $96,089 $100,894 $105,938 $116,532 21 $81,910 $89,523 $98,238 $103,920 $109,116 $120,028 22 $81,910 $89,523 $98,238 $107,038 $112,390 $123,629 23 $81,910 $89,523 $98,238 $108,410 $115,762 $127,338 24 $81,910 $89,523 $98,238 $108,410 $119,234 $131,158 25 $81,910 $89,523 $98,238 $108,410 $120,120 $135,093 26 $81,910 $89,523 $98,238 $108,410 $120,120 $138,258 27 $81,910 $89,523 $98,238 $108,410 $120,120 $138,258 28 $81,910 $89,523 $98,238 $108,410 $120,120 $138,258 29 $81,910 $89,523 $98,238 $108,410 $120,120 $138,258

295 | P a g e
ADC (AD SCALE)
Year Served Jail Officer Master Jail
Officer Jail
Sergeant Jail First Sergeant
Jail Lieutenant
Jail Captain
0 $48,256 - - - - - 1 $49,704 - - - - - 2 $51,195 $53,755 - - - - 3 $52,731 $55,367 - - - - 4 $54,313 $57,028 $59,880 - - - 5 $55,942 $58,739 $61,676 - - - 6 $57,620 $60,501 $63,526 $66,703 - - 7 $59,349 $62,316 $65,432 $68,704 - - 8 $61,129 $64,186 $67,395 $70,765 $74,303 - 9 $62,963 $66,111 $69,417 $72,888 $76,532 $80,359 10 $64,852 $68,095 $71,499 $75,074 $78,828 $82,769 11 $66,798 $70,137 $73,644 $77,327 $81,193 $85,253 12 $68,802 $72,242 $75,854 $79,646 $83,629 $87,810 13 $70,866 $74,409 $78,129 $82,036 $86,138 $90,444 14 $72,992 $76,641 $80,473 $84,497 $88,722 $93,158 15 $75,181 $78,940 $82,887 $87,032 $91,383 $95,952 16 $77,437 $81,309 $85,374 $89,643 $94,125 $98,831 17 $79,760 $83,748 $87,935 $92,332 $96,949 $101,796 18 $81,910 $86,260 $90,573 $95,102 $99,857 $104,850 19 $81,910 $88,848 $93,290 $97,955 $102,853 $107,995 20 $81,910 $89,523 $96,089 $100,894 $105,938 $111,235 21 $81,910 $89,523 $98,238 $103,920 $109,116 $114,572 22 $81,910 $89,523 $98,238 $107,038 $112,390 $118,009 23 $81,910 $89,523 $98,238 $108,410 $115,762 $121,550 24 $81,910 $89,523 $98,238 $108,410 $119,234 $125,196 25 $81,910 $89,523 $98,238 $108,410 $120,120 $128,952 26 $81,910 $89,523 $98,238 $108,410 $120,120 $132,821 27 $81,910 $89,523 $98,238 $108,410 $120,120 $133,744 28 $81,910 $89,523 $98,238 $108,410 $120,120 $133,744 29 $81,910 $89,523 $98,238 $108,410 $120,120 $133,744