Prince William County, Virginia · Prince William County, Virginia Department of Parks &...
48
Prince William County, Virginia Department of Parks & Recreation: Billy Casper Golf, LLC Performance Analysis Report Date: March 7, 2016
Transcript of Prince William County, Virginia · Prince William County, Virginia Department of Parks &...
Prince William County, Virginia Department of Parks & Recreation: Billy Casper Golf, LLC Performance Analysis Report Date: March 7, 2016
Table of Contents
Transmittal Letter .................................................................................................................................... 1 Introduction ........................................................................................................................................ 2 - 5 Background ...................................................................................................................................... 6 - 11 Comparisons ................................................................................................................................... 12 - 28 Performance Analysis: Overall and by Round ................................................................................ 29 - 34 Public Opinion ................................................................................................................................. 35 - 36 Observations and Recommendations ............................................................................................. 37 - 39
1
March 7, 2016 The Audit Committee of Prince William County, Virginia 1 County Complex Court Prince William, Virginia 22192 Pursuant to the internal audit plan for fiscal year (“FY”) 2015-16 for Prince William County, Virginia (“County”), approved by the Board of County Supervisors on October 13, 2015, we hereby present the performance audit of the Department of Parks & Recreation’s contract with Billy Casper Golf, LLC. We will be presenting this report to the Audit Committee of Prince William County at the next scheduled meeting on May 10, 2016. Our report includes an overview of the golf industry, as well as analysis and benchmarking against a select peer group for financial performance, total revenue per round, operating cost per round, membership and green fees, and public opinion. Organizations of all types and sizes recognize the value of comparing themselves to other like organizations. This process of benchmarking yields valuable information to leaders and decision makers. However, there are some inherent dangers in the benchmarking process. There are numerous factors which make comparing golf course operations challenging. Thus, there are inherent limitations to this study. There are numerous factors which make like comparisons challenging, because no two organizations are exactly alike. However, there can be great benefits from comparing an organization to similar entities that are all striving to operate efficiently and effectively In addition to the national industry information obtained and utilized, where possible, we used ‘published data’ from respective organization’s budget books, web sites and the Comprehensive Annual Financial Reports. This information has not been audited by RSM US LLP (“RSM”). The information used throughout this analysis has been provided to us by the individual counties and golf courses. We accept no liability for the content of this analysis or for the consequences of any actions taken on the basis of the information provided. We would like to thank the Department of Parks & Recreation and all those involved in assisting our firm with this performance analysis. Respectfully Submitted,
INTERNAL AUDITORS
RSM US LLP 1861 International Drive
Suite 400 McLean, VA 22102
O: 252.637.5154 F: 252.637.5383 www.rsmus.com

Introduction
2
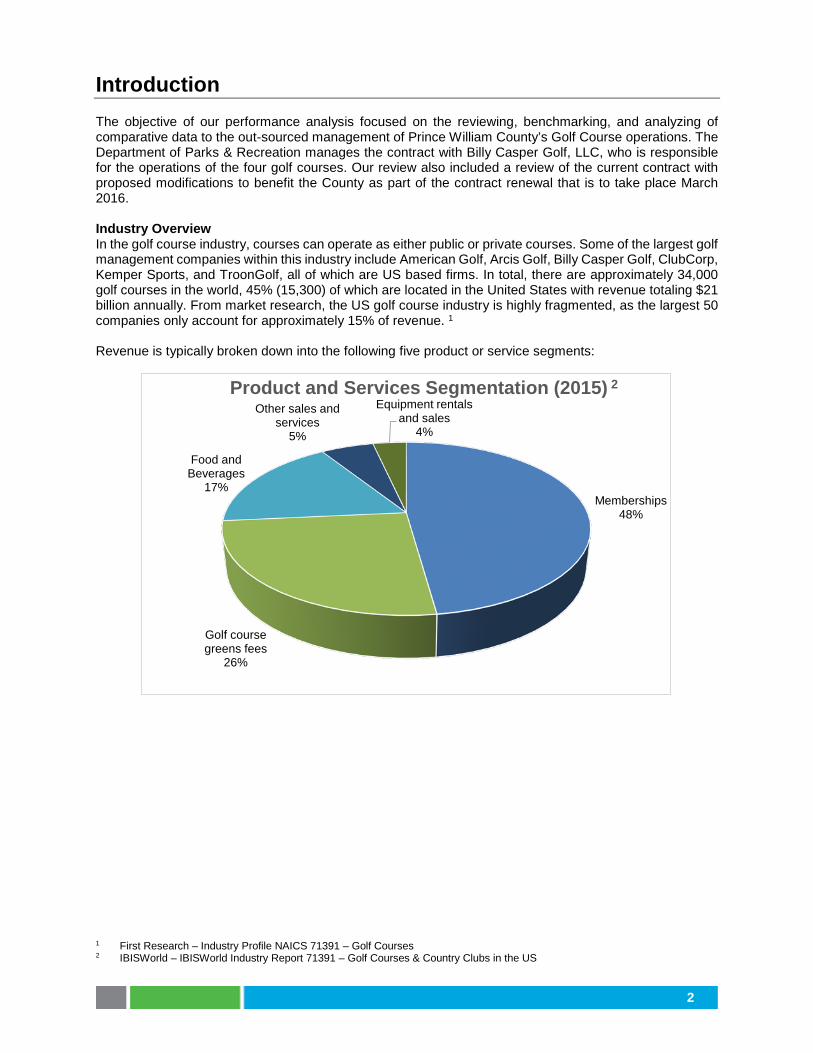
Introduction The objective of our performance analysis focused on the reviewing, benchmarking, and analyzing of comparative data to the out-sourced management of Prince William County’s Golf Course operations. The Department of Parks & Recreation manages the contract with Billy Casper Golf, LLC, who is responsible for the operations of the four golf courses. Our review also included a review of the current contract with proposed modifications to benefit the County as part of the contract renewal that is to take place March 2016. Industry Overview In the golf course industry, courses can operate as either public or private courses. Some of the largest golf management companies within this industry include American Golf, Arcis Golf, Billy Casper Golf, ClubCorp, Kemper Sports, and TroonGolf, all of which are US based firms. In total, there are approximately 34,000 golf courses in the world, 45% (15,300) of which are located in the United States with revenue totaling $21 billion annually. From market research, the US golf course industry is highly fragmented, as the largest 50 companies only account for approximately 15% of revenue. 1 Revenue is typically broken down into the following five product or service segments:
1 First Research – Industry Profile NAICS 71391 – Golf Courses 2 IBISWorld – IBISWorld Industry Report 71391 – Golf Courses & Country Clubs in the US
Memberships48%
Golf course greens fees
26%
Food and Beverages
17%
Other sales and services
5%
Equipment rentals and sales
4%
Product and Services Segmentation (2015) 2
3
Introduction - continued Memberships: In 2015, memberships generated approximately 48% of golf course revenue. Memberships typically grant the member access to unlimited golf activities throughout the year. From 2010 to 2015, golf courses yielded a substantial decline in memberships compared to prior years due to the economic recession which resulted in a rise in unemployment and a subsequent decline in disposable income. However, with the bounce back in the economy during 2010, membership rates began to slowly recover. Membership rates continue to decline from hobbyist and younger demographic. However, the support from consistent golfers has remained dependable, increasing the stability of this segments industry revenue. Green Fees: Green fees are those paid per round by golfers who do not obtain annual memberships. In 2015, this segment accounted for approximately 26% of revenue. This segment has recently been threatened due to a rise in the number of individuals who find the rules of etiquette, such as dress-code and no cell phones, to be either over-bearing or off-putting. Due in part to these factors, the number of individual’s golfers decreased from 28 million in 2009 to 24 million in 2014. Food and Beverage Sales: In 2015, food and beverage sales accounted for a large segment of industry revenue at 17.5%. The majority of this segment is generated specifically by the sale of alcoholic beverages. Similar to the other segments, sales declined during the recession but have since increased with the rise in disposable income, allowing consumers to be more likely to splurge on dining and drinking on the courses. Other Miscellaneous Sales and Services: Other revenue is generated by income through room rentals for events or locker units for club players, registration for sports tournaments and other paid club activities.2 In 2015, this segment accounted for 5% of industry revenue. Rentals, Merchandise Sale, and Other Services: This segment includes renting clubs and carts as well as the sale of merchandise or lessons at the clubhouse. In 2015, this accounted for approximately 4% of the industry revenue. Golf Operations Overview According to market research approximately 75% of golf courses in the United States are open to the public. Private clubs are typically associated with country clubs, golf clubs and real estate developments, whereas, public courses, including commercial and municipal courses, are more typically “daily fee” courses. Whether public or private, all golf courses typically include the similar operations such as scheduling tee times, food service and merchandise sales, and grounds keeping. At golf courses with favorable climates, such as Florida and Southern California popular courses generally host 80,000 to 100,000 rounds of golf per year. However, the average course in the United States hosts approximately 30,000 rounds per year, with privately held courses typically having a lighter capacity.1
1 First Research – Industry Profile NAICS 71391 – Golf Courses 2 IBISWorld – IBISWorld Industry Report 71391 – Golf Courses & Country Clubs in the US
4
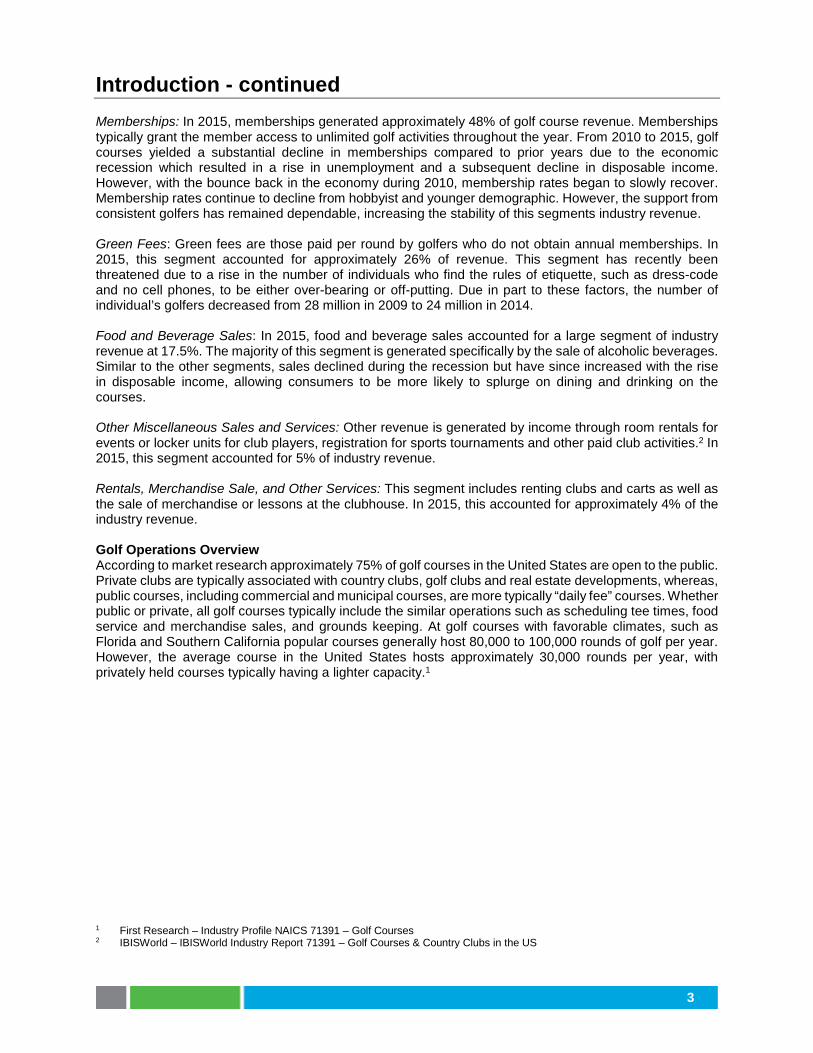
Introduction - continued Sales and Marketing Overview Approximately 25 million people in the United States ages 6 and older play golf, with the average golfer being 54 years old, according to the National Golf Foundation (NGF). According to market research, 75% of golfers are male and 25% are female. Typical marketing strategies include using avenues such as local newspapers, magazines, online advertising, and hosting local tournaments to engage target markets. The median cost of an 18-hole round of golf in the United States is about $40, according to the NGF. Public fee courses typically charge $30 for weekdays and $50 on weekends (due to higher demand). Since 2011, average hourly wages for golf courses have increased by $1.02 raising labor cost and operating expenses.1 According to the NGF, participation rates of households with incomes between $25,000 and $60,000 range between 8.0% and 20.0%, respectively, compared to rates of approximately 30.0% for households with incomes at or over $150,000. Also, according to the NGF, the consumers between the age of 18 and 59 account for an estimated 70% of industry revenue for 2015. However, this demographic is continuing to decline due the time required to play a round of golf. According to the NGF, there were 200,000 less golfers under the age of 35 between 2013 and 2014. Consumers under 18 years of age account for approximately 17% of revenue. These golfers typically have parents who golf which drives this participation. Those who are 60 years and older construct the smallest group of industry services at approximately 14.0% of industry revenue. The majority of golfers who fall within this age range have already entered retirement and therefore have more time to dedicate to leisure activities such as golf. This segment has and is projected to grow over the upcoming years due to an increasing number over adults who are over the age of 60. 2
1 First Research – Industry Profile NAICS 71391 – Golf Courses 2 IBISWorld – IBISWorld Industry Report 71391 – Golf Courses & Country Clubs in the US
0%
5%
10%
15%
20%
25%
Consumersaged under 18
Consumersaged 18 to 29
Consumersaged 30 to 39
Consumer aged40 to 49
Consumer ages50 to 59
Consumersaged 60 and
older
Consumer Age Breakdown (2015)
Consumer Age Breakdown (2015)
5
Introduction - continued Industry Forecast From 2015 to 2020, industry revenue is expected to return back to moderate growth due to higher corporate gains, which results in a rise of disposable incomes. Looking forward, industry research is predicting revenues will increase at an annual rate of 2.7% to $27.4 billion over the next five years leading to 2020. Regardless of these positive economic forecasts, if golf does gain popularity and branch into new demographics, golf courses will continue to experience minimal growth. It is expected that revenue from green fees will continue to decrease year to year, as this segment of the market targets the less frequent golfers, compared to member-generating revenue, which is expected to experience slow growth.2
Third Party Golf Course Management Overview The utilization of third party golf course management companies continues to rise as golf course revenues have declined in recent years. As these management companies are considered to be industry and subject matter experts, many public and private courses look to these firms for guidance and direction on increasing business efficiency and effectiveness. 1
The following is a list of advantages and disadvantages of utilizing a third-party golf course management company:
Advantages Disadvantages
Access to experience and expertise in the areas of facility development, facility marketing, and facility operations.
Lack of insight and control into day-to-day operations.
Ability to utilize industry specific software system to help deliver better services and capture analytics.
Management may still need an individual within the organization structure with golf course experience to oversee the golf operation in order to ensure contract compliance.
Lower expenditures on material by bulk purchasing from wholesalers (i.e. fertilizer and turf).
Management contracts do not always provide a guaranteed income for the organization, but is guaranteed for the management company.
1 First Research – Industry Profile NAICS 71391 – Golf Courses 2 IBISWorld – IBISWorld Industry Report 71391 – Golf Courses & Country Clubs in the US

Background
6
Background Department of Parks & Recreation The Prince William County Park Authority was founded in 1977 by the Prince William Board of County Supervisors. In March of 2012, the Park Authority was dissolved and the Department of Parks & Recreation (“Parks & Recreation”) was established by resolution of the Board of County Supervisors. The department is responsible for providing residents and visitors with recreations, parks, programs, and facilities. Currently, Parks & Recreation manages more than 4,000 acres of premier park land, which includes:
• 50 Parks • 2 Water Parks • 2 Recreational Centers • 2 Community Centers • 6 Sports Complexes • 2 Skate Parks • 1 Ice Rink
In addition, Parks & Recreation operates three 18-hole golf courses and one 9-hole golf course, totaling 854 acres. The golf courses include:
• Forest Greens Golf Club • General’s Ridge Golf Course • Lake Ridge Golf Course • Prince William Golf Course
Forest Greens Golf Club, Lake Ridge Golf Course and Prince William Golf Course are all owned by Prince William County. The General’s Ridge Golf Course is owned by the City of Manassas Park, Virginia and operated by Prince William County’s Parks & Recreation under a lease agreement.
7
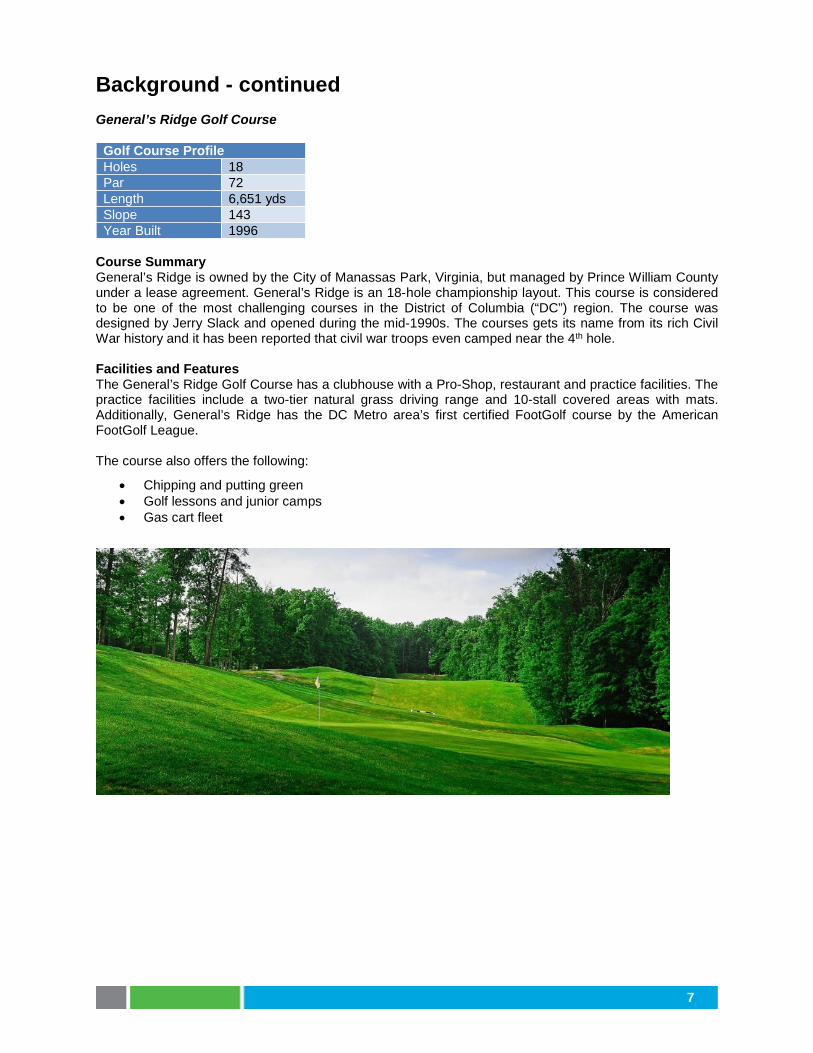
Background - continued General’s Ridge Golf Course
Golf Course Profile Holes 18 Par 72 Length 6,651 yds Slope 143 Year Built 1996
Course Summary General’s Ridge is owned by the City of Manassas Park, Virginia, but managed by Prince William County under a lease agreement. General’s Ridge is an 18-hole championship layout. This course is considered to be one of the most challenging courses in the District of Columbia (“DC”) region. The course was designed by Jerry Slack and opened during the mid-1990s. The courses gets its name from its rich Civil War history and it has been reported that civil war troops even camped near the 4th hole. Facilities and Features The General’s Ridge Golf Course has a clubhouse with a Pro-Shop, restaurant and practice facilities. The practice facilities include a two-tier natural grass driving range and 10-stall covered areas with mats. Additionally, General’s Ridge has the DC Metro area’s first certified FootGolf course by the American FootGolf League. The course also offers the following:
• Chipping and putting green • Golf lessons and junior camps • Gas cart fleet
8
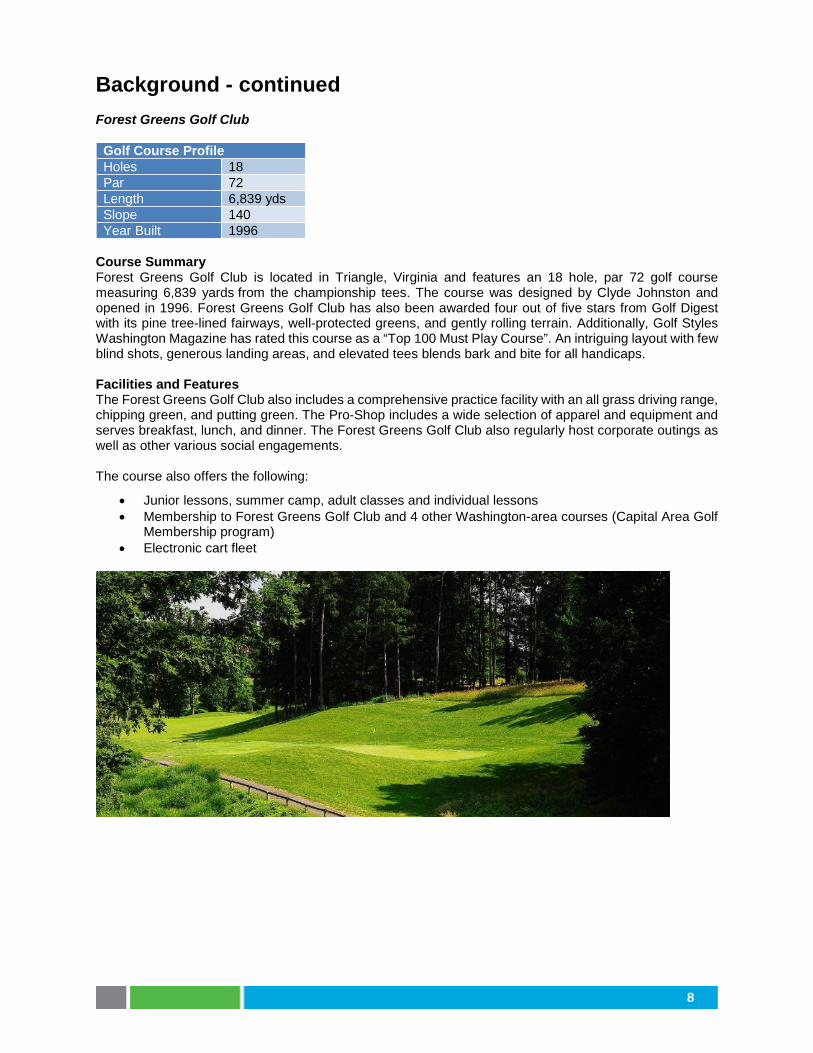
Background - continued Forest Greens Golf Club
Golf Course Profile Holes 18 Par 72 Length 6,839 yds Slope 140 Year Built 1996
Course Summary Forest Greens Golf Club is located in Triangle, Virginia and features an 18 hole, par 72 golf course measuring 6,839 yards from the championship tees. The course was designed by Clyde Johnston and opened in 1996. Forest Greens Golf Club has also been awarded four out of five stars from Golf Digest with its pine tree-lined fairways, well-protected greens, and gently rolling terrain. Additionally, Golf Styles Washington Magazine has rated this course as a “Top 100 Must Play Course”. An intriguing layout with few blind shots, generous landing areas, and elevated tees blends bark and bite for all handicaps. Facilities and Features The Forest Greens Golf Club also includes a comprehensive practice facility with an all grass driving range, chipping green, and putting green. The Pro-Shop includes a wide selection of apparel and equipment and serves breakfast, lunch, and dinner. The Forest Greens Golf Club also regularly host corporate outings as well as other various social engagements. The course also offers the following:
• Junior lessons, summer camp, adult classes and individual lessons • Membership to Forest Greens Golf Club and 4 other Washington-area courses (Capital Area Golf
Membership program) • Electronic cart fleet

9
Background - continued Lake Ridge Golf Course
Golf Course Profile Holes 9 Par 36 Slope N/A Year Built 1992
Course Summary Lake Ridge Golf Course is located in Woodbridge, VA and features a challenging 9-hole par 36 facility. The course is owned and operated by Prince William County and has been for the past 20 years. However, starting in April of 2012, Billy Casper Golf began managing Lake Ridge Golf Course. Lake Ridge Golf Course also offers a number of community events throughout the year. Facilities and Features Lake Ridge Golf Course offers an 18-hole mini golf course and a FootGolf Course, certified by the American FootGolf League. Additionally, the facility has a putting green and ten driving stalls. The course also offers the following:
• Private instructions and golf clinics • Clubhouse with pro-shop and concessions
10
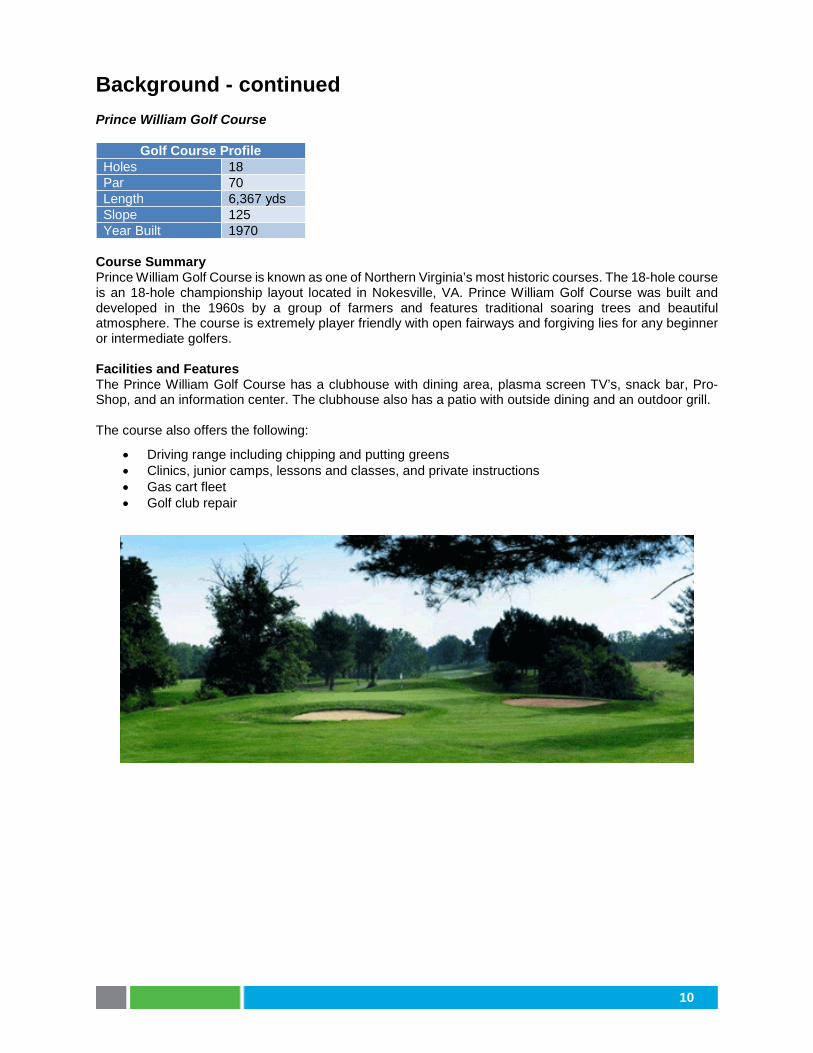
Background - continued Prince William Golf Course
Golf Course Profile Holes 18 Par 70 Length 6,367 yds Slope 125 Year Built 1970
Course Summary Prince William Golf Course is known as one of Northern Virginia’s most historic courses. The 18-hole course is an 18-hole championship layout located in Nokesville, VA. Prince William Golf Course was built and developed in the 1960s by a group of farmers and features traditional soaring trees and beautiful atmosphere. The course is extremely player friendly with open fairways and forgiving lies for any beginner or intermediate golfers. Facilities and Features The Prince William Golf Course has a clubhouse with dining area, plasma screen TV’s, snack bar, Pro-Shop, and an information center. The clubhouse also has a patio with outside dining and an outdoor grill. The course also offers the following:
• Driving range including chipping and putting greens • Clinics, junior camps, lessons and classes, and private instructions • Gas cart fleet • Golf club repair
11
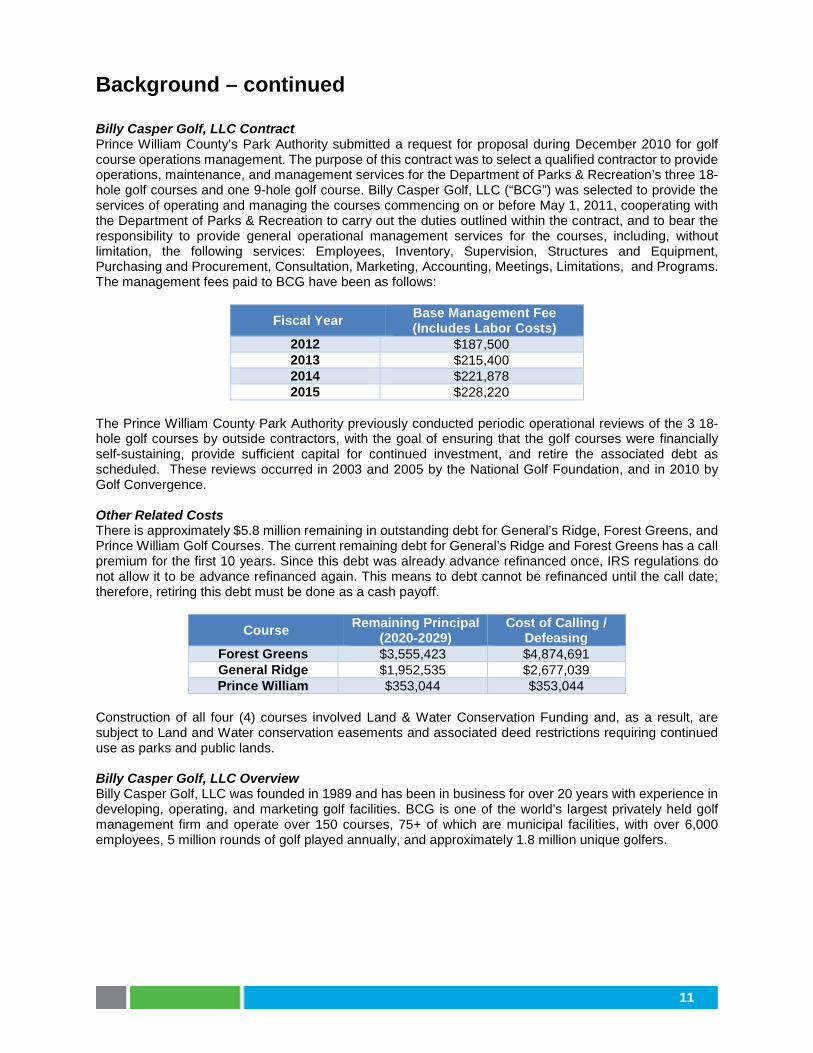
Background – continued Billy Casper Golf, LLC Contract Prince William County’s Park Authority submitted a request for proposal during December 2010 for golf course operations management. The purpose of this contract was to select a qualified contractor to provide operations, maintenance, and management services for the Department of Parks & Recreation’s three 18-hole golf courses and one 9-hole golf course. Billy Casper Golf, LLC (“BCG”) was selected to provide the services of operating and managing the courses commencing on or before May 1, 2011, cooperating with the Department of Parks & Recreation to carry out the duties outlined within the contract, and to bear the responsibility to provide general operational management services for the courses, including, without limitation, the following services: Employees, Inventory, Supervision, Structures and Equipment, Purchasing and Procurement, Consultation, Marketing, Accounting, Meetings, Limitations, and Programs. The management fees paid to BCG have been as follows:
Fiscal Year Base Management Fee (Includes Labor Costs)
2012 $187,500 2013 $215,400 2014 $221,878 2015 $228,220
The Prince William County Park Authority previously conducted periodic operational reviews of the 3 18-hole golf courses by outside contractors, with the goal of ensuring that the golf courses were financially self-sustaining, provide sufficient capital for continued investment, and retire the associated debt as scheduled. These reviews occurred in 2003 and 2005 by the National Golf Foundation, and in 2010 by Golf Convergence. Other Related Costs There is approximately $5.8 million remaining in outstanding debt for General’s Ridge, Forest Greens, and Prince William Golf Courses. The current remaining debt for General’s Ridge and Forest Greens has a call premium for the first 10 years. Since this debt was already advance refinanced once, IRS regulations do not allow it to be advance refinanced again. This means to debt cannot be refinanced until the call date; therefore, retiring this debt must be done as a cash payoff.
Course Remaining Principal (2020-2029)
Cost of Calling / Defeasing
Forest Greens $3,555,423 $4,874,691 General Ridge $1,952,535 $2,677,039 Prince William $353,044 $353,044
Construction of all four (4) courses involved Land & Water Conservation Funding and, as a result, are subject to Land and Water conservation easements and associated deed restrictions requiring continued use as parks and public lands. Billy Casper Golf, LLC Overview Billy Casper Golf, LLC was founded in 1989 and has been in business for over 20 years with experience in developing, operating, and marketing golf facilities. BCG is one of the world’s largest privately held golf management firm and operate over 150 courses, 75+ of which are municipal facilities, with over 6,000 employees, 5 million rounds of golf played annually, and approximately 1.8 million unique golfers.

Comparisons
12
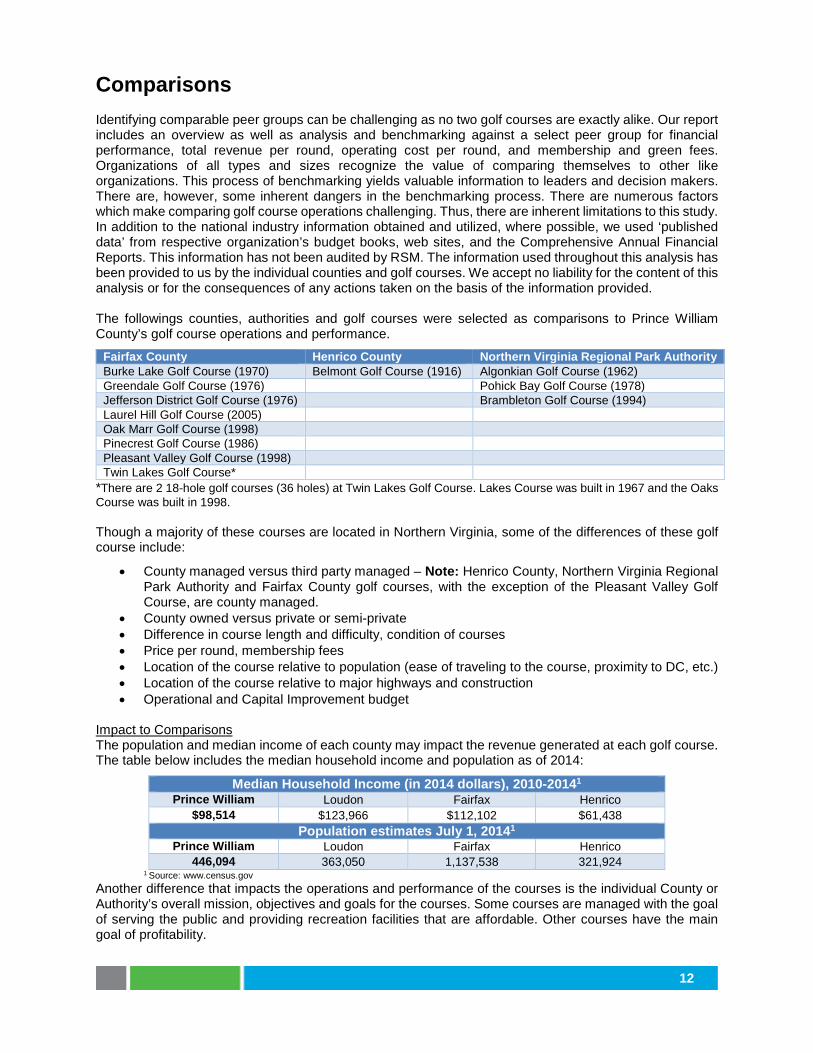
Comparisons Identifying comparable peer groups can be challenging as no two golf courses are exactly alike. Our report includes an overview as well as analysis and benchmarking against a select peer group for financial performance, total revenue per round, operating cost per round, and membership and green fees. Organizations of all types and sizes recognize the value of comparing themselves to other like organizations. This process of benchmarking yields valuable information to leaders and decision makers. There are, however, some inherent dangers in the benchmarking process. There are numerous factors which make comparing golf course operations challenging. Thus, there are inherent limitations to this study. In addition to the national industry information obtained and utilized, where possible, we used ‘published data’ from respective organization’s budget books, web sites, and the Comprehensive Annual Financial Reports. This information has not been audited by RSM. The information used throughout this analysis has been provided to us by the individual counties and golf courses. We accept no liability for the content of this analysis or for the consequences of any actions taken on the basis of the information provided. The followings counties, authorities and golf courses were selected as comparisons to Prince William County’s golf course operations and performance.
Fairfax County Henrico County Northern Virginia Regional Park Authority Burke Lake Golf Course (1970) Belmont Golf Course (1916) Algonkian Golf Course (1962) Greendale Golf Course (1976) Pohick Bay Golf Course (1978) Jefferson District Golf Course (1976) Brambleton Golf Course (1994) Laurel Hill Golf Course (2005) Oak Marr Golf Course (1998) Pinecrest Golf Course (1986) Pleasant Valley Golf Course (1998) Twin Lakes Golf Course*
*There are 2 18-hole golf courses (36 holes) at Twin Lakes Golf Course. Lakes Course was built in 1967 and the Oaks Course was built in 1998. Though a majority of these courses are located in Northern Virginia, some of the differences of these golf course include:
• County managed versus third party managed – Note: Henrico County, Northern Virginia Regional Park Authority and Fairfax County golf courses, with the exception of the Pleasant Valley Golf Course, are county managed.
• County owned versus private or semi-private • Difference in course length and difficulty, condition of courses • Price per round, membership fees • Location of the course relative to population (ease of traveling to the course, proximity to DC, etc.) • Location of the course relative to major highways and construction • Operational and Capital Improvement budget
Impact to Comparisons The population and median income of each county may impact the revenue generated at each golf course. The table below includes the median household income and population as of 2014:
Median Household Income (in 2014 dollars), 2010-20141
Prince William Loudon Fairfax Henrico $98,514 $123,966 $112,102 $61,438
Population estimates July 1, 20141
Prince William Loudon Fairfax Henrico 446,094 363,050 1,137,538 321,924
1 Source: www.census.gov Another difference that impacts the operations and performance of the courses is the individual County or Authority’s overall mission, objectives and goals for the courses. Some courses are managed with the goal of serving the public and providing recreation facilities that are affordable. Other courses have the main goal of profitability.
13
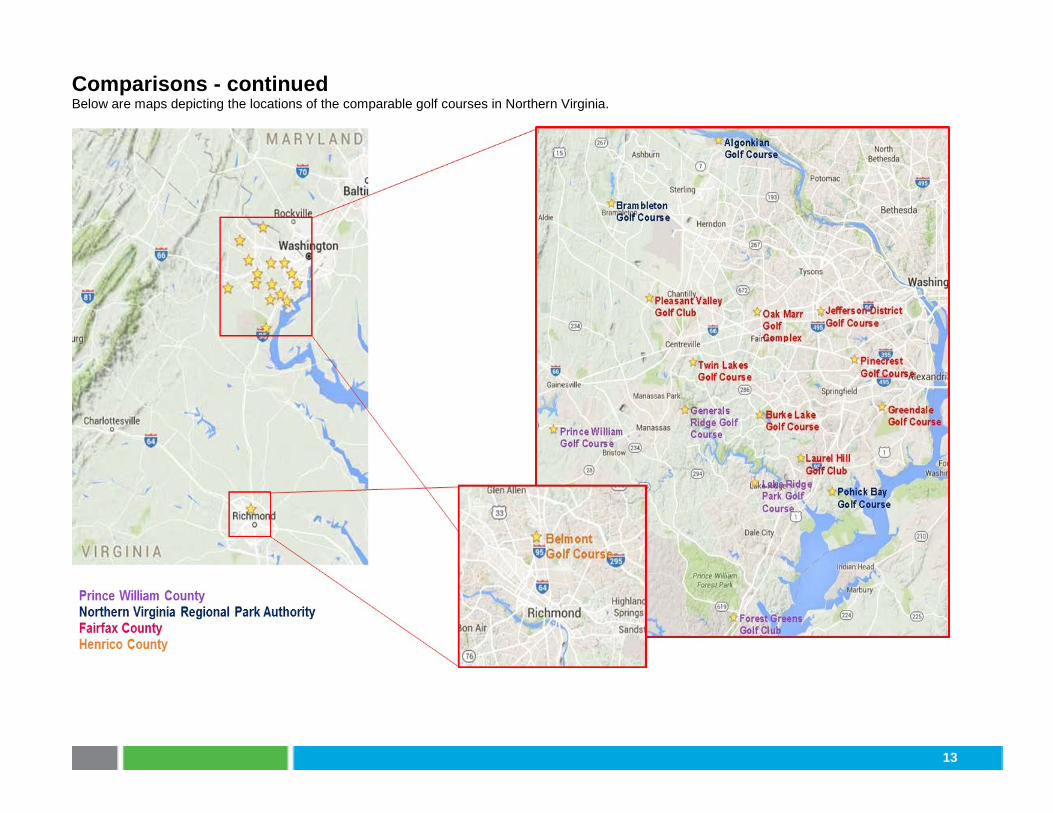
Comparisons - continued Below are maps depicting the locations of the comparable golf courses in Northern Virginia.
14
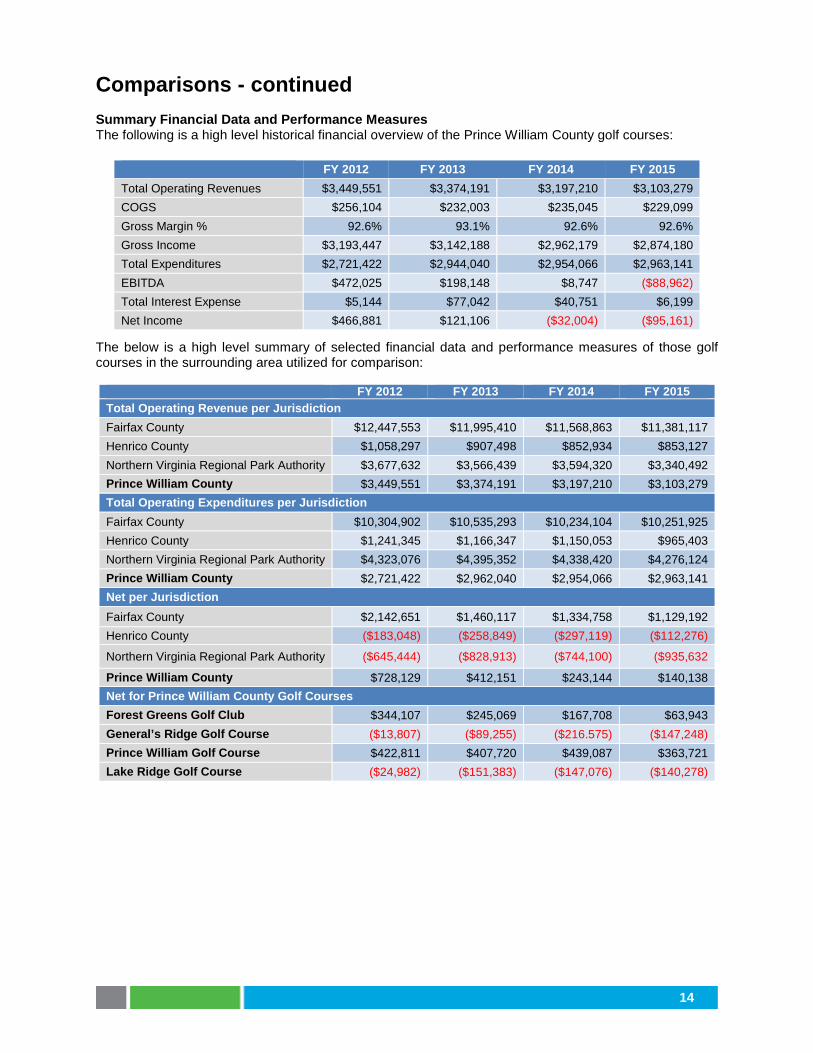
Comparisons - continued Summary Financial Data and Performance Measures The following is a high level historical financial overview of the Prince William County golf courses:
FY 2012 FY 2013 FY 2014 FY 2015 Total Operating Revenues $3,449,551 $3,374,191 $3,197,210 $3,103,279 COGS $256,104 $232,003 $235,045 $229,099 Gross Margin % 92.6% 93.1% 92.6% 92.6% Gross Income $3,193,447 $3,142,188 $2,962,179 $2,874,180 Total Expenditures $2,721,422 $2,944,040 $2,954,066 $2,963,141 EBITDA $472,025 $198,148 $8,747 ($88,962) Total Interest Expense $5,144 $77,042 $40,751 $6,199 Net Income $466,881 $121,106 ($32,004) ($95,161)
The below is a high level summary of selected financial data and performance measures of those golf courses in the surrounding area utilized for comparison:
FY 2012 FY 2013 FY 2014 FY 2015 Total Operating Revenue per Jurisdiction Fairfax County $12,447,553 $11,995,410 $11,568,863 $11,381,117 Henrico County $1,058,297 $907,498 $852,934 $853,127 Northern Virginia Regional Park Authority $3,677,632 $3,566,439 $3,594,320 $3,340,492 Prince William County $3,449,551 $3,374,191 $3,197,210 $3,103,279 Total Operating Expenditures per Jurisdiction Fairfax County $10,304,902 $10,535,293 $10,234,104 $10,251,925 Henrico County $1,241,345 $1,166,347 $1,150,053 $965,403 Northern Virginia Regional Park Authority $4,323,076 $4,395,352 $4,338,420 $4,276,124 Prince William County $2,721,422 $2,962,040 $2,954,066 $2,963,141 Net per Jurisdiction Fairfax County $2,142,651 $1,460,117 $1,334,758 $1,129,192 Henrico County ($183,048) ($258,849) ($297,119) ($112,276)
Northern Virginia Regional Park Authority ($645,444) ($828,913) ($744,100) ($935,632
Prince William County $728,129 $412,151 $243,144 $140,138 Net for Prince William County Golf Courses Forest Greens Golf Club $344,107 $245,069 $167,708 $63,943 General’s Ridge Golf Course ($13,807) ($89,255) ($216.575) ($147,248) Prince William Golf Course $422,811 $407,720 $439,087 $363,721 Lake Ridge Golf Course ($24,982) ($151,383) ($147,076) ($140,278)
15
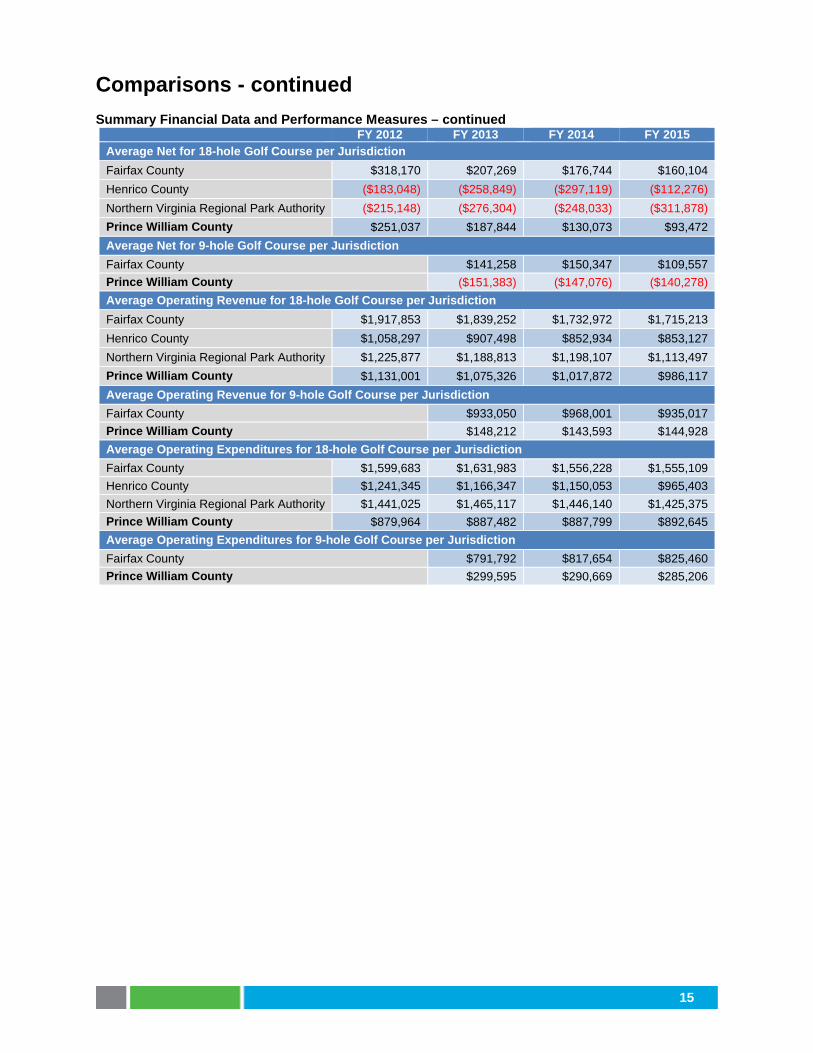
Comparisons - continued Summary Financial Data and Performance Measures – continued
FY 2012 FY 2013 FY 2014 FY 2015 Average Net for 18-hole Golf Course per Jurisdiction Fairfax County $318,170 $207,269 $176,744 $160,104 Henrico County ($183,048) ($258,849) ($297,119) ($112,276) Northern Virginia Regional Park Authority ($215,148) ($276,304) ($248,033) ($311,878) Prince William County $251,037 $187,844 $130,073 $93,472 Average Net for 9-hole Golf Course per Jurisdiction Fairfax County $141,258 $150,347 $109,557 Prince William County ($151,383) ($147,076) ($140,278) Average Operating Revenue for 18-hole Golf Course per Jurisdiction Fairfax County $1,917,853 $1,839,252 $1,732,972 $1,715,213 Henrico County $1,058,297 $907,498 $852,934 $853,127 Northern Virginia Regional Park Authority $1,225,877 $1,188,813 $1,198,107 $1,113,497 Prince William County $1,131,001 $1,075,326 $1,017,872 $986,117 Average Operating Revenue for 9-hole Golf Course per Jurisdiction Fairfax County $933,050 $968,001 $935,017 Prince William County $148,212 $143,593 $144,928 Average Operating Expenditures for 18-hole Golf Course per Jurisdiction Fairfax County $1,599,683 $1,631,983 $1,556,228 $1,555,109 Henrico County $1,241,345 $1,166,347 $1,150,053 $965,403 Northern Virginia Regional Park Authority $1,441,025 $1,465,117 $1,446,140 $1,425,375 Prince William County $879,964 $887,482 $887,799 $892,645 Average Operating Expenditures for 9-hole Golf Course per Jurisdiction Fairfax County $791,792 $817,654 $825,460 Prince William County $299,595 $290,669 $285,206

16
Comparisons - continued Summary Financial Data and Performance Measures - continued
2012 2013 2014 2015 Total Rounds per Jurisdiction
Fairfax County 332,728 310,825 301,594 290,998
Henrico County 36,499 32,567 29,806 28,916
Northern Virginia Regional Park Authority 105,610 100,212 101,122 90,592
Prince William County 94,892 101,549 95,395 98,783
Total Revenue per Round per Jurisdiction
Fairfax County $37.41 $38.60 $38.36 $39.11
Henrico County $29.00 $27.87 $28.62 $29.50
Northern Virginia Regional Park Authority $34.82 $35.59 $35.54 $36.87
Prince William County $36.35 $33.23 $33.52 $31.42
Total Cost per Round per Jurisdiction
Fairfax County $30.97 $33.89 $33.93 $35.23
Henrico County $34.01 $35.81 $38.58 $33.39
Northern Virginia Regional Park Authority $40.93 $43.86 $42.90 $47.20
Prince William County $28.68 $28.99 $30.97 $30.00
Net per Round per Jurisdiction
Fairfax County $6.44 $4.71 $4.43 $3.88
Henrico County ($5.01) ($7.94) ($9.96) ($3.89)
Northern Virginia Regional Park Authority ($6.11) ($8.27) ($7.36) ($10.33)
Prince William County $7.67 $4.24 $2.55 $1.42
Net per Round by Course for Prince William County Golf Courses
Forest Greens Golf Club $10.60 $8.30 $5.78 $2.74
General’s Ridge Golf Course ($0.60) ($4.10) ($11.55) ($7.10)
Prince William Golf Course $12.09 $9.88 $11.38 $9.60
Lake Ridge Golf Course* ($5.62) ($16.80) ($16.23) ($14.24) *9-hole golf course

17
Comparisons - continued Financial Performance – Operating Revenue The following tables contain the operating revenue, by golf course and county or authority, for FY 2012 through FY 2015. Total revenue includes green fees, cart fees, driving ranges, pro-shop sales, food and beverage sales, membership dues, and other rentals and sales.
Operating Revenue FY 2012 FY 2013 FY 2014 FY 2015
Fairfax County
Burke Lake Golf Course $1,085,261 $1,018,123 $1,006,120 $938,691
Greendale Golf Course $1,457,775 $1,422,807 $1,340,389 $1,277,488
Jefferson District Golf Course* $952,860 $967,430 $1,084,574 $1,089,417
Laurel Hill Golf Course $2,097,915 $1,947,172 $1,918,620 $2,097,544
Oak Marr Golf Course* $1,171,611 $1,133,030 $1,115,651 $1,019,482
Pinecrest Golf Course* $733,815 $698,692 $703,777 $696,150
Pleasant Valley Golf Course $1,964,495 $1,931,191 $1,661,461 $1,627,489
Twin Lakes Golf Course** $2,983,822 $2,876,965 $2,738,272 $2,634,855
Henrico County
Belmont Golf Course $1,058,297 $907,498 $852,934 $853,127
Northern Virginia Regional Park Authority
Algonkian Regional Golf Course $1,086,607 $1,078,707 $1,106,554 $978,221
Pohick Bay Golf Course $1,166,383 $1,089,609 $1,040,670 $1,025,243
Brambleton Park Golf Course $1,424,642 $1,398,123 $ 1,447,096 $1,337,028
Prince William County
Forest Greens Golf Club $1,425,928 $1,324,734 $1,228,530 $1,189,053
General's Ridge Golf Course $745,905 $653,398 $541,259 $556,227
Prince William Golf Course $1,221,171 $1,247,847 $1,283,828 $1,213,071
Lake Ridge Golf Course* $56,547 $148,212 $143,593 $144,928 *9-hole golf course **2 18-hole golf courses With the exception of Henrico County, who manages one course, Prince William County’s overall average revenue per golf course is lower compared to the other authorities and counties. Factors could include the location of the other golf courses, as the Fairfax County course are closer to the District of Columbia, and the differences in membership fees and green fees. It may also be due to the overall mission or goals for the courses. The primary mission for some county-owned golf courses may be to obtain a significant profit, while the secondary mission is to provide affordable, recreational facilities for the community.
18
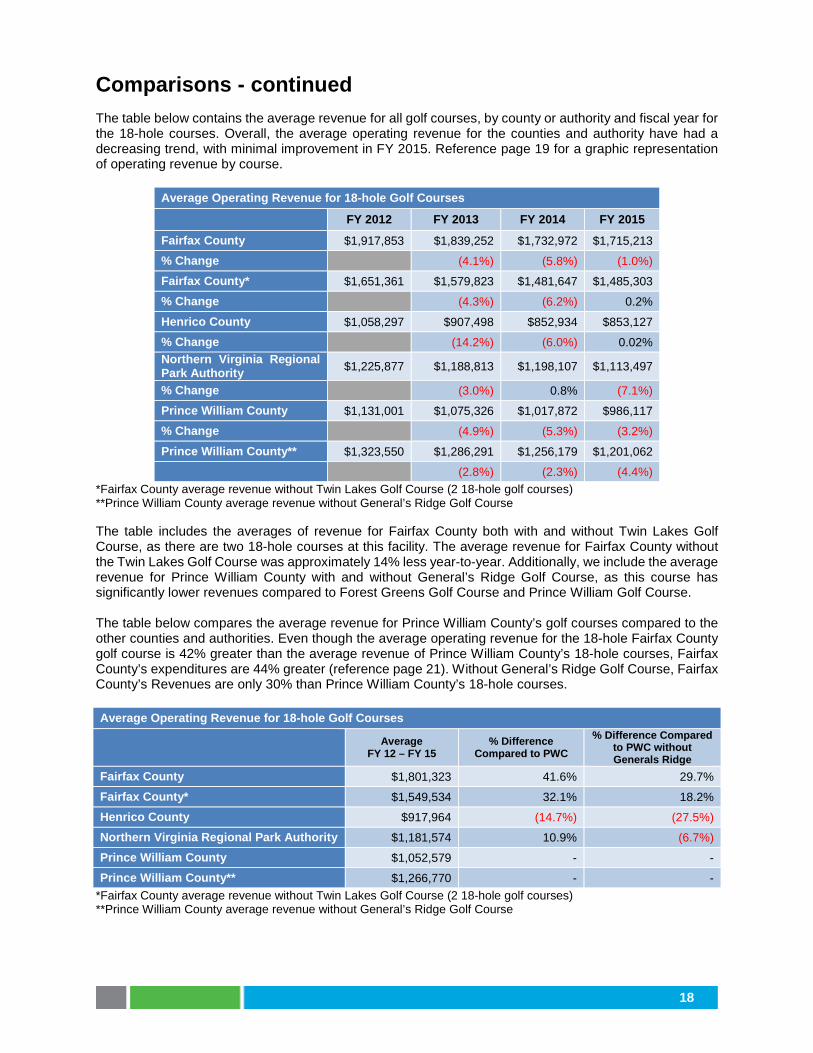
Comparisons - continued The table below contains the average revenue for all golf courses, by county or authority and fiscal year for the 18-hole courses. Overall, the average operating revenue for the counties and authority have had a decreasing trend, with minimal improvement in FY 2015. Reference page 19 for a graphic representation of operating revenue by course.
Average Operating Revenue for 18-hole Golf Courses FY 2012 FY 2013 FY 2014 FY 2015
Fairfax County $1,917,853 $1,839,252 $1,732,972 $1,715,213
% Change (4.1%) (5.8%) (1.0%)
Fairfax County* $1,651,361 $1,579,823 $1,481,647 $1,485,303
% Change (4.3%) (6.2%) 0.2%
Henrico County $1,058,297 $907,498 $852,934 $853,127
% Change (14.2%) (6.0%) 0.02% Northern Virginia Regional Park Authority $1,225,877 $1,188,813 $1,198,107 $1,113,497
% Change (3.0%) 0.8% (7.1%)
Prince William County $1,131,001 $1,075,326 $1,017,872 $986,117
% Change (4.9%) (5.3%) (3.2%)
Prince William County** $1,323,550 $1,286,291 $1,256,179 $1,201,062
(2.8%) (2.3%) (4.4%) *Fairfax County average revenue without Twin Lakes Golf Course (2 18-hole golf courses) **Prince William County average revenue without General’s Ridge Golf Course The table includes the averages of revenue for Fairfax County both with and without Twin Lakes Golf Course, as there are two 18-hole courses at this facility. The average revenue for Fairfax County without the Twin Lakes Golf Course was approximately 14% less year-to-year. Additionally, we include the average revenue for Prince William County with and without General’s Ridge Golf Course, as this course has significantly lower revenues compared to Forest Greens Golf Course and Prince William Golf Course. The table below compares the average revenue for Prince William County’s golf courses compared to the other counties and authorities. Even though the average operating revenue for the 18-hole Fairfax County golf course is 42% greater than the average revenue of Prince William County’s 18-hole courses, Fairfax County’s expenditures are 44% greater (reference page 21). Without General’s Ridge Golf Course, Fairfax County’s Revenues are only 30% than Prince William County’s 18-hole courses. Average Operating Revenue for 18-hole Golf Courses Average
FY 12 – FY 15 % Difference
Compared to PWC % Difference Compared
to PWC without Generals Ridge
Fairfax County $1,801,323 41.6% 29.7%
Fairfax County* $1,549,534 32.1% 18.2%
Henrico County $917,964 (14.7%) (27.5%)
Northern Virginia Regional Park Authority $1,181,574 10.9% (6.7%)
Prince William County $1,052,579 - -
Prince William County** $1,266,770 - - *Fairfax County average revenue without Twin Lakes Golf Course (2 18-hole golf courses) **Prince William County average revenue without General’s Ridge Golf Course

19
Comparisons - continued The table below contains the average revenue for all golf courses, by county and fiscal year for 9-hole courses. Whereas Fairfax County has experienced a decrease in revenue, Prince William County has experienced an increase from FY 2014 to FY 2015.
Average Operating Revenue for 9-hole Golf Course FY 2013 FY 2014 FY 2015
Fairfax County $933,050 $968,001 $935,017
3.8% (3.4%)
Prince William County** $148,212 $143,593 $144,928
(3.1%) .9% **Excludes FY 2012, as Billy Casper Golf, LLC took over the Lake Ridge Operations mid-year FY 2012. The table below compares the average revenue for Prince William County’s 9-hole courses compared to Fairfax County’s 9-hole courses. Fairfax County’s 9-hole courses have significantly higher revenues, which may be due to location, facilities, and additional features and services at the courses.
Average Operating Revenue for 9-hole Golf Course Average FY 13 –
FY 15** % Difference
Compared to PWC Fairfax County $945,356 85%
Prince William County $145,578 - **Excludes FY 2012, as Billy Casper Golf, LLC took over the Lake Ridge Operations mid-year FY 2012.
20
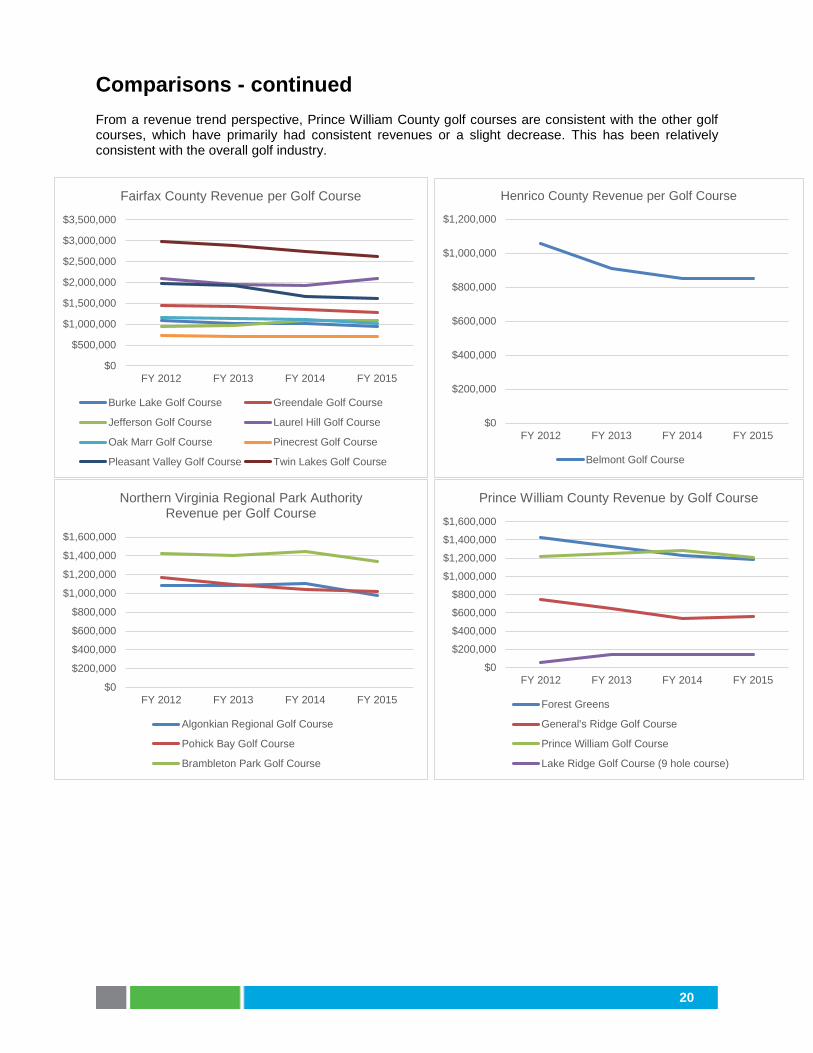
Comparisons - continued From a revenue trend perspective, Prince William County golf courses are consistent with the other golf courses, which have primarily had consistent revenues or a slight decrease. This has been relatively consistent with the overall golf industry.
$0
$200,000
$400,000
$600,000
$800,000
$1,000,000
$1,200,000
FY 2012 FY 2013 FY 2014 FY 2015
Henrico County Revenue per Golf Course
Belmont Golf Course
$0
$500,000
$1,000,000
$1,500,000
$2,000,000
$2,500,000
$3,000,000
$3,500,000
FY 2012 FY 2013 FY 2014 FY 2015
Fairfax County Revenue per Golf Course
Burke Lake Golf Course Greendale Golf Course
Jefferson Golf Course Laurel Hill Golf Course
Oak Marr Golf Course Pinecrest Golf Course
Pleasant Valley Golf Course Twin Lakes Golf Course
$0
$200,000
$400,000
$600,000
$800,000
$1,000,000
$1,200,000
$1,400,000
$1,600,000
FY 2012 FY 2013 FY 2014 FY 2015
Northern Virginia Regional Park Authority Revenue per Golf Course
Algonkian Regional Golf Course
Pohick Bay Golf Course
Brambleton Park Golf Course
$0
$200,000
$400,000
$600,000
$800,000
$1,000,000
$1,200,000
$1,400,000
$1,600,000
FY 2012 FY 2013 FY 2014 FY 2015
Prince William County Revenue by Golf Course
Forest Greens
General's Ridge Golf Course
Prince William Golf Course
Lake Ridge Golf Course (9 hole course)
21
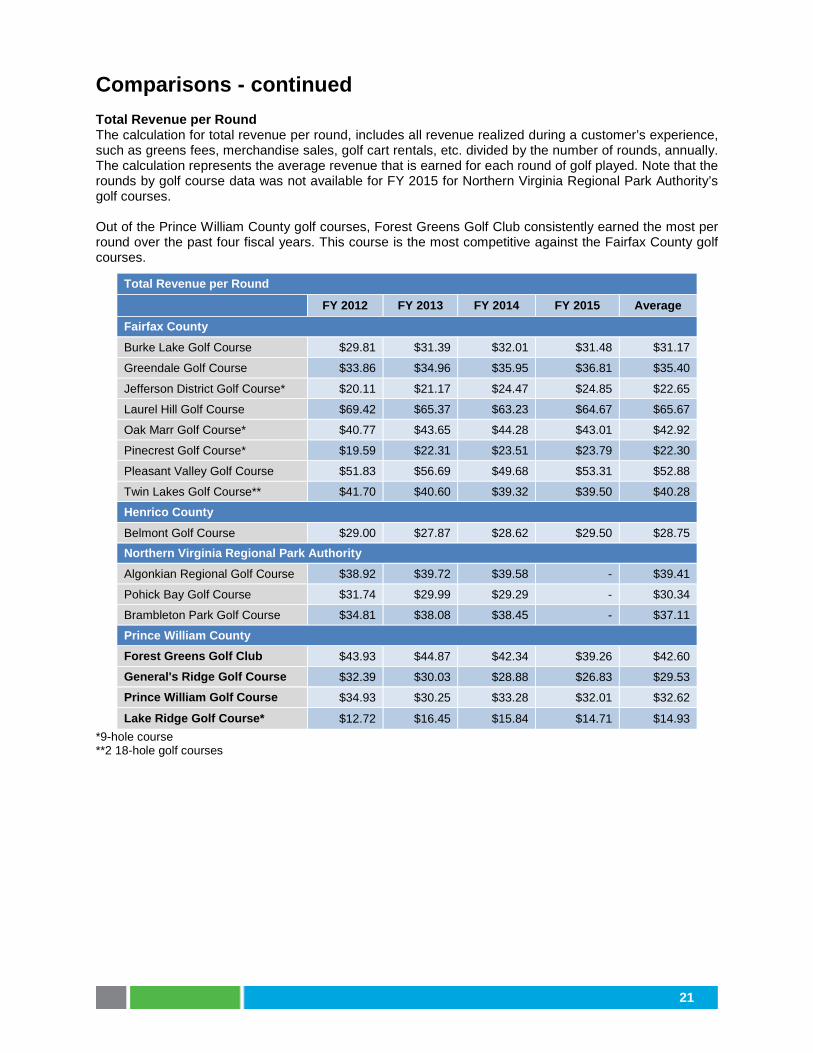
Comparisons - continued Total Revenue per Round The calculation for total revenue per round, includes all revenue realized during a customer’s experience, such as greens fees, merchandise sales, golf cart rentals, etc. divided by the number of rounds, annually. The calculation represents the average revenue that is earned for each round of golf played. Note that the rounds by golf course data was not available for FY 2015 for Northern Virginia Regional Park Authority’s golf courses. Out of the Prince William County golf courses, Forest Greens Golf Club consistently earned the most per round over the past four fiscal years. This course is the most competitive against the Fairfax County golf courses.
Total Revenue per Round FY 2012 FY 2013 FY 2014 FY 2015 Average
Fairfax County
Burke Lake Golf Course $29.81 $31.39 $32.01 $31.48 $31.17
Greendale Golf Course $33.86 $34.96 $35.95 $36.81 $35.40
Jefferson District Golf Course* $20.11 $21.17 $24.47 $24.85 $22.65
Laurel Hill Golf Course $69.42 $65.37 $63.23 $64.67 $65.67
Oak Marr Golf Course* $40.77 $43.65 $44.28 $43.01 $42.92
Pinecrest Golf Course* $19.59 $22.31 $23.51 $23.79 $22.30
Pleasant Valley Golf Course $51.83 $56.69 $49.68 $53.31 $52.88
Twin Lakes Golf Course** $41.70 $40.60 $39.32 $39.50 $40.28
Henrico County
Belmont Golf Course $29.00 $27.87 $28.62 $29.50 $28.75
Northern Virginia Regional Park Authority Algonkian Regional Golf Course $38.92 $39.72 $39.58 - $39.41
Pohick Bay Golf Course $31.74 $29.99 $29.29 - $30.34
Brambleton Park Golf Course $34.81 $38.08 $38.45 - $37.11
Prince William County Forest Greens Golf Club $43.93 $44.87 $42.34 $39.26 $42.60
General's Ridge Golf Course $32.39 $30.03 $28.88 $26.83 $29.53
Prince William Golf Course $34.93 $30.25 $33.28 $32.01 $32.62
Lake Ridge Golf Course* $12.72 $16.45 $15.84 $14.71 $14.93 *9-hole course **2 18-hole golf courses
22
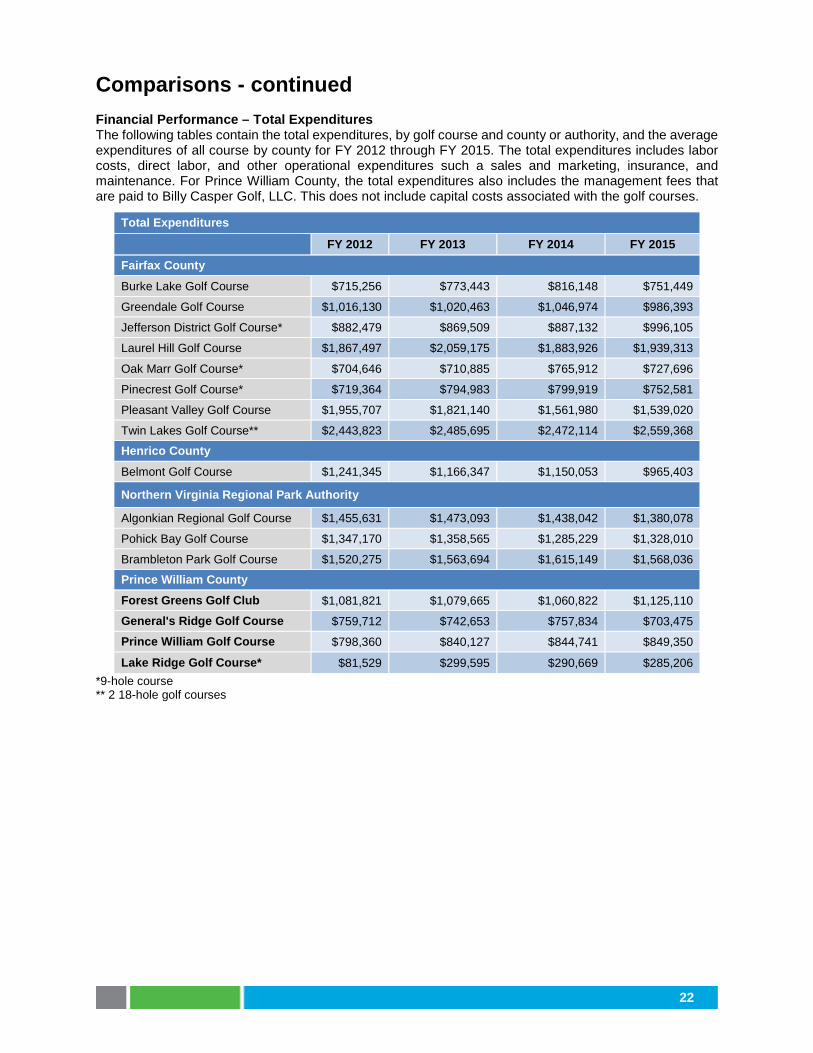
Comparisons - continued Financial Performance – Total Expenditures The following tables contain the total expenditures, by golf course and county or authority, and the average expenditures of all course by county for FY 2012 through FY 2015. The total expenditures includes labor costs, direct labor, and other operational expenditures such a sales and marketing, insurance, and maintenance. For Prince William County, the total expenditures also includes the management fees that are paid to Billy Casper Golf, LLC. This does not include capital costs associated with the golf courses.
Total Expenditures FY 2012 FY 2013 FY 2014 FY 2015
Fairfax County
Burke Lake Golf Course $715,256 $773,443 $816,148 $751,449
Greendale Golf Course $1,016,130 $1,020,463 $1,046,974 $986,393
Jefferson District Golf Course* $882,479 $869,509 $887,132 $996,105
Laurel Hill Golf Course $1,867,497 $2,059,175 $1,883,926 $1,939,313
Oak Marr Golf Course* $704,646 $710,885 $765,912 $727,696
Pinecrest Golf Course* $719,364 $794,983 $799,919 $752,581
Pleasant Valley Golf Course $1,955,707 $1,821,140 $1,561,980 $1,539,020
Twin Lakes Golf Course** $2,443,823 $2,485,695 $2,472,114 $2,559,368
Henrico County
Belmont Golf Course $1,241,345 $1,166,347 $1,150,053 $965,403
Northern Virginia Regional Park Authority
Algonkian Regional Golf Course $1,455,631 $1,473,093 $1,438,042 $1,380,078
Pohick Bay Golf Course $1,347,170 $1,358,565 $1,285,229 $1,328,010
Brambleton Park Golf Course $1,520,275 $1,563,694 $1,615,149 $1,568,036
Prince William County
Forest Greens Golf Club $1,081,821 $1,079,665 $1,060,822 $1,125,110
General's Ridge Golf Course $759,712 $742,653 $757,834 $703,475
Prince William Golf Course $798,360 $840,127 $844,741 $849,350
Lake Ridge Golf Course* $81,529 $299,595 $290,669 $285,206 *9-hole course ** 2 18-hole golf courses
23
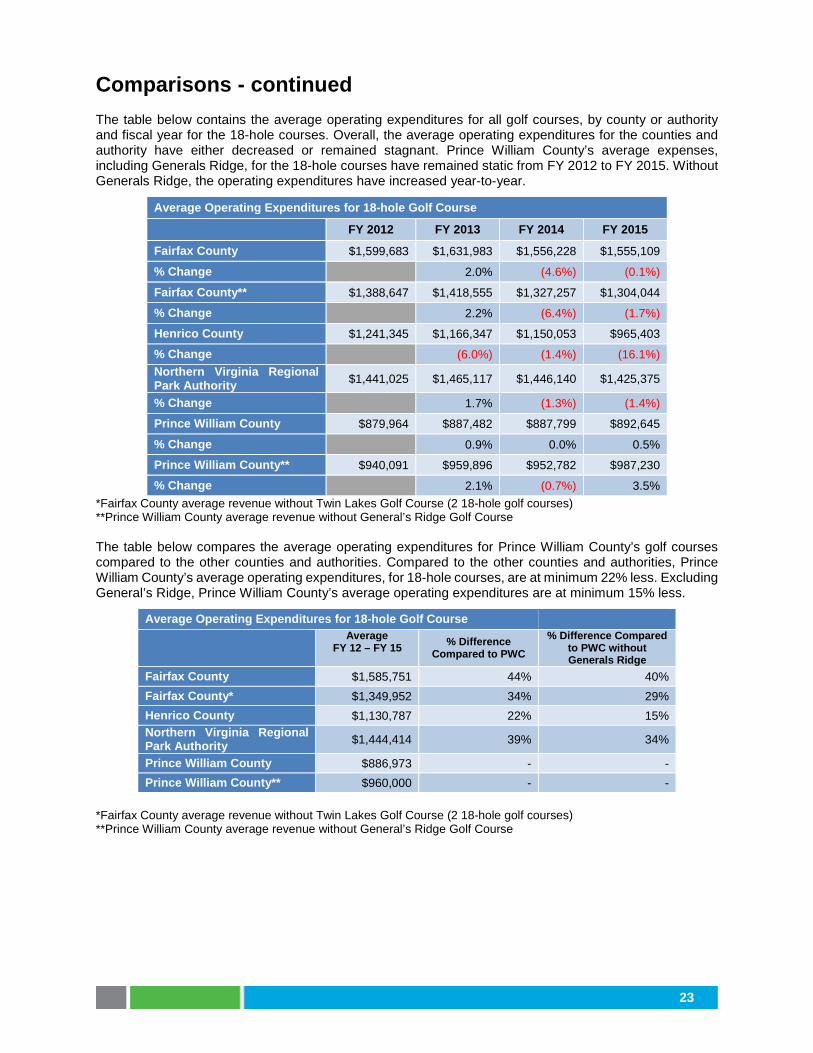
Comparisons - continued The table below contains the average operating expenditures for all golf courses, by county or authority and fiscal year for the 18-hole courses. Overall, the average operating expenditures for the counties and authority have either decreased or remained stagnant. Prince William County’s average expenses, including Generals Ridge, for the 18-hole courses have remained static from FY 2012 to FY 2015. Without Generals Ridge, the operating expenditures have increased year-to-year.
Average Operating Expenditures for 18-hole Golf Course FY 2012 FY 2013 FY 2014 FY 2015
Fairfax County $1,599,683 $1,631,983 $1,556,228 $1,555,109
% Change 2.0% (4.6%) (0.1%)
Fairfax County** $1,388,647 $1,418,555 $1,327,257 $1,304,044
% Change 2.2% (6.4%) (1.7%)
Henrico County $1,241,345 $1,166,347 $1,150,053 $965,403
% Change (6.0%) (1.4%) (16.1%) Northern Virginia Regional Park Authority $1,441,025 $1,465,117 $1,446,140 $1,425,375
% Change 1.7% (1.3%) (1.4%)
Prince William County $879,964 $887,482 $887,799 $892,645
% Change 0.9% 0.0% 0.5%
Prince William County** $940,091 $959,896 $952,782 $987,230
% Change 2.1% (0.7%) 3.5% *Fairfax County average revenue without Twin Lakes Golf Course (2 18-hole golf courses) **Prince William County average revenue without General’s Ridge Golf Course The table below compares the average operating expenditures for Prince William County’s golf courses compared to the other counties and authorities. Compared to the other counties and authorities, Prince William County’s average operating expenditures, for 18-hole courses, are at minimum 22% less. Excluding General’s Ridge, Prince William County’s average operating expenditures are at minimum 15% less.
Average Operating Expenditures for 18-hole Golf Course Average
FY 12 – FY 15 % Difference Compared to PWC
% Difference Compared to PWC without Generals Ridge
Fairfax County $1,585,751 44% 40% Fairfax County* $1,349,952 34% 29% Henrico County $1,130,787 22% 15% Northern Virginia Regional Park Authority $1,444,414 39% 34%
Prince William County $886,973 - - Prince William County** $960,000 - -
*Fairfax County average revenue without Twin Lakes Golf Course (2 18-hole golf courses) **Prince William County average revenue without General’s Ridge Golf Course
24
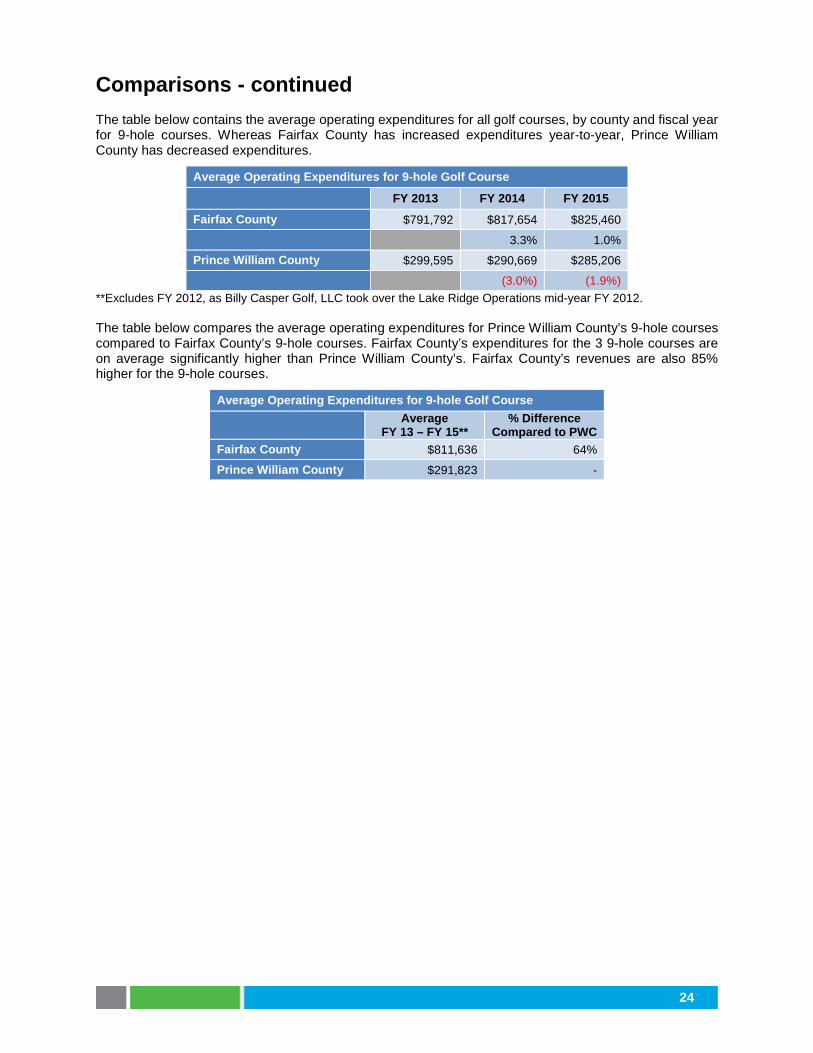
Comparisons - continued The table below contains the average operating expenditures for all golf courses, by county and fiscal year for 9-hole courses. Whereas Fairfax County has increased expenditures year-to-year, Prince William County has decreased expenditures.
Average Operating Expenditures for 9-hole Golf Course FY 2013 FY 2014 FY 2015
Fairfax County $791,792 $817,654 $825,460
3.3% 1.0%
Prince William County $299,595 $290,669 $285,206
(3.0%) (1.9%) **Excludes FY 2012, as Billy Casper Golf, LLC took over the Lake Ridge Operations mid-year FY 2012. The table below compares the average operating expenditures for Prince William County’s 9-hole courses compared to Fairfax County’s 9-hole courses. Fairfax County’s expenditures for the 3 9-hole courses are on average significantly higher than Prince William County’s. Fairfax County’s revenues are also 85% higher for the 9-hole courses.
Average Operating Expenditures for 9-hole Golf Course
Average FY 13 – FY 15**
% Difference Compared to PWC
Fairfax County $811,636 64%
Prince William County $291,823 -

25
Comparisons - continued Cost per Round The calculation for cost per round, includes all expenditures incurred by the golf course, including labor, maintenance, amenities, etc., divided by the number of rounds annually. The calculation represents the average cost for each round of golf played. Note that the rounds by golf course data was not available for FY 2015 for Northern Virginia Regional Park Authority’s golf courses. Out of the Prince William County Golf Courses, Forest Greens Golf Club and General’s Ridge Golf Courses cost the greatest per round.
Cost per Round FY 2012 FY 2013 FY 2014 FY 2015 Average
Fairfax County
Burke Lake Golf Course $19.65 $23.84 $25.97 $25.20 $23.66
Greendale Golf Course $23.60 $25.07 $28.08 $28.42 $26.29
Jefferson District Golf Course* $18.62 $19.03 $20.02 $22.72 $20.10
Laurel Hill Golf Course $61.79 $69.13 $62.08 $59.79 $63.20
Oak Marr Golf Course* $24.52 $27.38 $30.40 $30.70 $28.25
Pinecrest Golf Course* $19.20 $25.39 $26.72 $25.72 $24.26
Pleasant Valley Golf Course $51.60 $53.46 $46.71 $50.41 $50.54
Twin Lakes Golf Course** $34.15 $35.08 $35.50 $38.37 $35.77
Henrico County
Belmont Golf Course $34.01 $35.81 $38.58 $33.39 $35.45
Northern Virginia Regional Park Authority Algonkian Regional Golf Course $52.14 $54.24 $51.44 - $52.61
Pohick Bay Golf Course $36.66 $37.39 $36.17 - $36.74
Brambleton Park Golf Course $37.15 $42.58 $42.92 - $40.88
Prince William County Forest Greens Golf Club $33.33 $36.57 $36.56 $36.52 $35.75
General's Ridge Golf Course $32.99 $34.13 $40.43 $33.93 $35.37
Prince William Golf Course $22.83 $20.36 $21.90 $22.42 $21.88
Lake Ridge Golf Course* $18.34 $33.26 $32.07 $28.96 $28.16 *9-hole golf course **2 18-hole golf courses
26
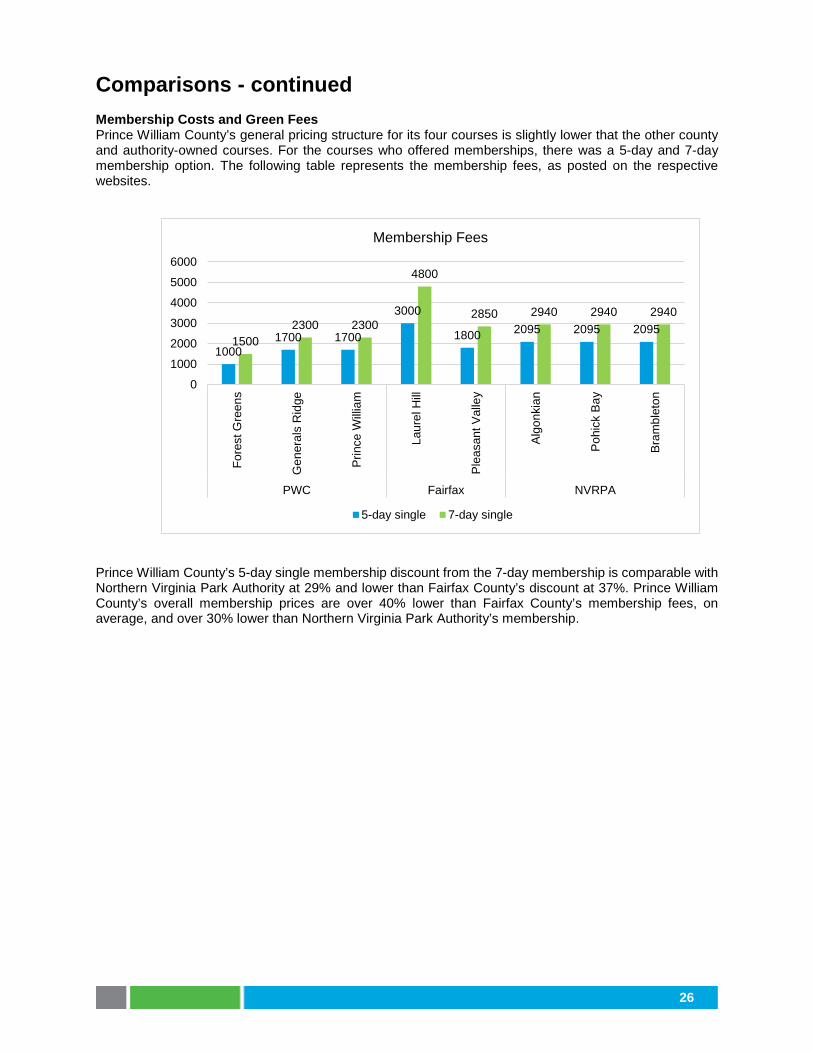
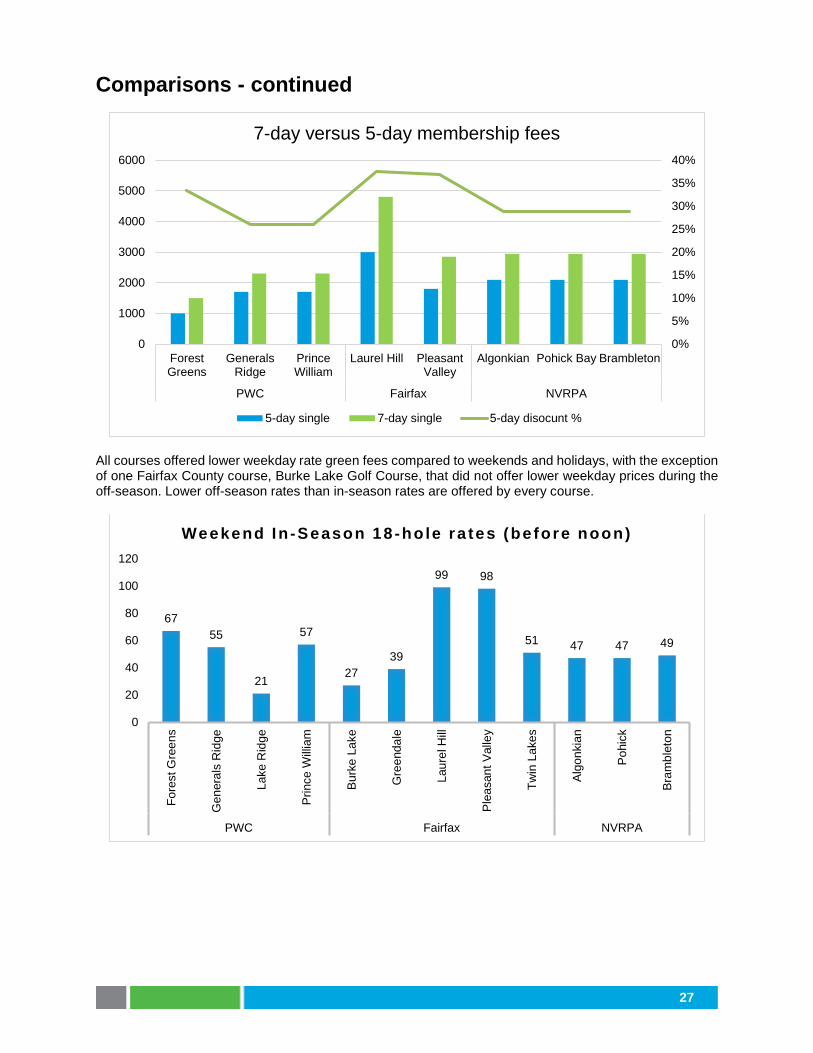
Comparisons - continued Membership Costs and Green Fees Prince William County’s general pricing structure for its four courses is slightly lower that the other county and authority-owned courses. For the courses who offered memberships, there was a 5-day and 7-day membership option. The following table represents the membership fees, as posted on the respective websites.
Prince William County’s 5-day single membership discount from the 7-day membership is comparable with Northern Virginia Park Authority at 29% and lower than Fairfax County’s discount at 37%. Prince William County’s overall membership prices are over 40% lower than Fairfax County’s membership fees, on average, and over 30% lower than Northern Virginia Park Authority’s membership.
10001700 1700
3000
1800 2095 2095 20951500
2300 2300
4800
2850 2940 2940 2940
0
1000
2000
3000
4000
5000
6000
Fore
st G
reen
s
Gen
eral
s R
idge
Prin
ce W
illia
m
Laur
el H
ill
Ple
asan
t Val
ley
Alg
onki
an
Poh
ick
Bay
Bra
mbl
eton
PWC Fairfax NVRPA
Membership Fees
5-day single 7-day single
27
Comparisons - continued
All courses offered lower weekday rate green fees compared to weekends and holidays, with the exception of one Fairfax County course, Burke Lake Golf Course, that did not offer lower weekday prices during the off-season. Lower off-season rates than in-season rates are offered by every course.
6755
21
57
2739
99 98
51 47 47 49
0
20
40
60
80
100
120
Fore
st G
reen
s
Gen
eral
s R
idge
Lake
Rid
ge
Prin
ce W
illia
m
Bur
ke L
ake
Gre
enda
le
Laur
el H
ill
Ple
asan
t Val
ley
Twin
Lak
es
Alg
onki
an
Poh
ick
Bra
mbl
eton
PWC Fairfax NVRPA
Weekend In -Season 18 -ho le ra tes (be fore noon)
0%
5%
10%
15%
20%
25%
30%
35%
40%
0
1000
2000
3000
4000
5000
6000
ForestGreens
GeneralsRidge
PrinceWilliam
Laurel Hill PleasantValley
Algonkian Pohick Bay Brambleton
PWC Fairfax NVRPA
7-day versus 5-day membership fees
5-day single 7-day single 5-day disocunt %
28
Comparisons – continued
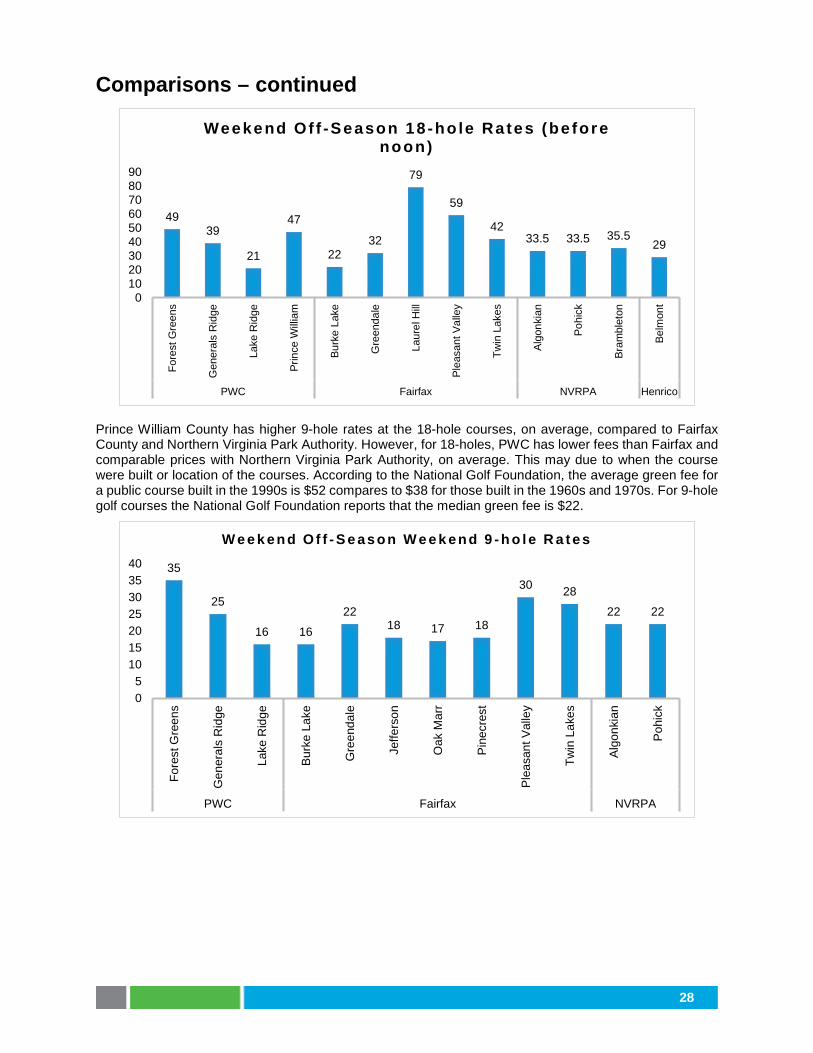
Prince William County has higher 9-hole rates at the 18-hole courses, on average, compared to Fairfax County and Northern Virginia Park Authority. However, for 18-holes, PWC has lower fees than Fairfax and comparable prices with Northern Virginia Park Authority, on average. This may due to when the course were built or location of the courses. According to the National Golf Foundation, the average green fee for a public course built in the 1990s is $52 compares to $38 for those built in the 1960s and 1970s. For 9-hole golf courses the National Golf Foundation reports that the median green fee is $22.
4939
21
47
2232
79
59
4233.5 33.5 35.5
29
0102030405060708090
Fore
st G
reen
s
Gen
eral
s R
idge
Lake
Rid
ge
Prin
ce W
illia
m
Burk
e La
ke
Gre
enda
le
Laur
el H
ill
Plea
sant
Val
ley
Twin
Lak
es
Algo
nkia
n
Pohi
ck
Bram
blet
on
Belm
ont
PWC Fairfax NVRPA Henrico
Weekend Of f -Season 18 -ho le Ra tes (be fore noon)
35
25
16 16
2218 17 18
30 28
22 22
05
10152025303540
Fore
st G
reen
s
Gen
eral
s R
idge
Lake
Rid
ge
Bur
ke L
ake
Gre
enda
le
Jeffe
rson
Oak
Mar
r
Pin
ecre
st
Ple
asan
t Val
ley
Twin
Lak
es
Alg
onki
an
Poh
ick
PWC Fairfax NVRPA
W e e k end O f f - S e aso n W e e k en d 9 - h o l e R a t e s

Performance Analysis: Overall and by Round
29
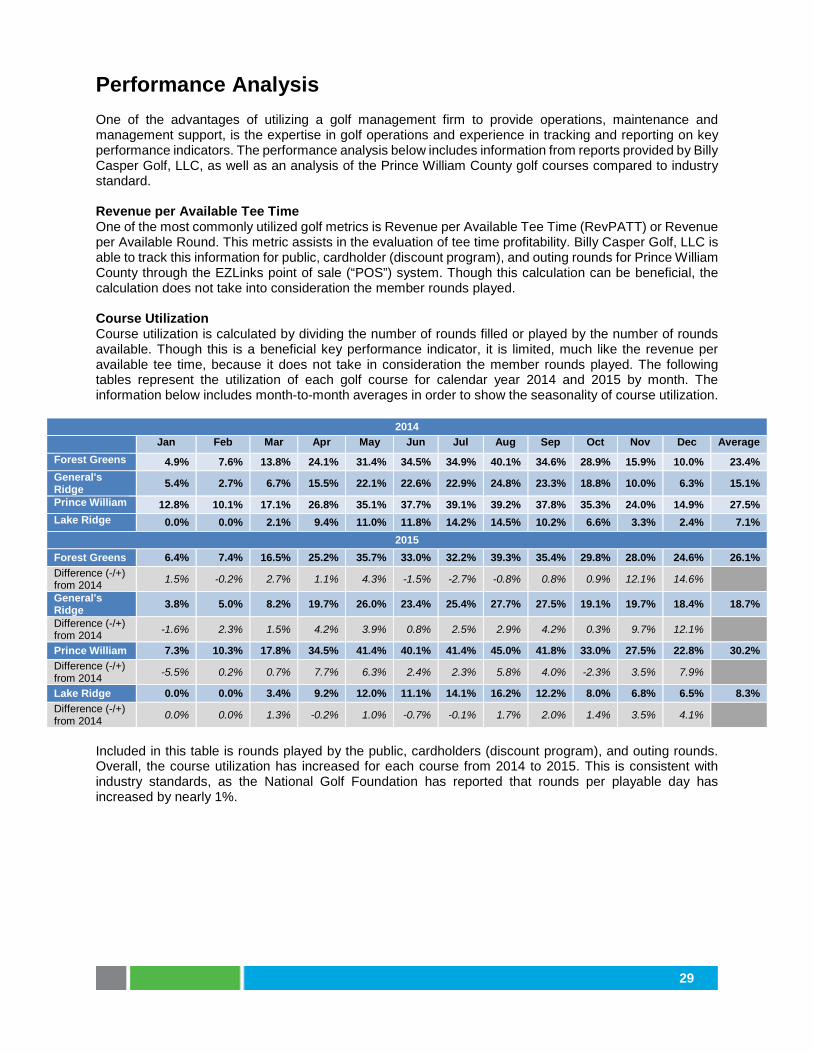
Performance Analysis One of the advantages of utilizing a golf management firm to provide operations, maintenance and management support, is the expertise in golf operations and experience in tracking and reporting on key performance indicators. The performance analysis below includes information from reports provided by Billy Casper Golf, LLC, as well as an analysis of the Prince William County golf courses compared to industry standard. Revenue per Available Tee Time One of the most commonly utilized golf metrics is Revenue per Available Tee Time (RevPATT) or Revenue per Available Round. This metric assists in the evaluation of tee time profitability. Billy Casper Golf, LLC is able to track this information for public, cardholder (discount program), and outing rounds for Prince William County through the EZLinks point of sale (“POS”) system. Though this calculation can be beneficial, the calculation does not take into consideration the member rounds played. Course Utilization Course utilization is calculated by dividing the number of rounds filled or played by the number of rounds available. Though this is a beneficial key performance indicator, it is limited, much like the revenue per available tee time, because it does not take in consideration the member rounds played. The following tables represent the utilization of each golf course for calendar year 2014 and 2015 by month. The information below includes month-to-month averages in order to show the seasonality of course utilization.
2014 Jan Feb Mar Apr May Jun Jul Aug Sep Oct Nov Dec Average Forest Greens 4.9% 7.6% 13.8% 24.1% 31.4% 34.5% 34.9% 40.1% 34.6% 28.9% 15.9% 10.0% 23.4% General's Ridge 5.4% 2.7% 6.7% 15.5% 22.1% 22.6% 22.9% 24.8% 23.3% 18.8% 10.0% 6.3% 15.1%
Prince William 12.8% 10.1% 17.1% 26.8% 35.1% 37.7% 39.1% 39.2% 37.8% 35.3% 24.0% 14.9% 27.5% Lake Ridge 0.0% 0.0% 2.1% 9.4% 11.0% 11.8% 14.2% 14.5% 10.2% 6.6% 3.3% 2.4% 7.1%
2015 Forest Greens 6.4% 7.4% 16.5% 25.2% 35.7% 33.0% 32.2% 39.3% 35.4% 29.8% 28.0% 24.6% 26.1% Difference (-/+) from 2014 1.5% -0.2% 2.7% 1.1% 4.3% -1.5% -2.7% -0.8% 0.8% 0.9% 12.1% 14.6%
General's Ridge 3.8% 5.0% 8.2% 19.7% 26.0% 23.4% 25.4% 27.7% 27.5% 19.1% 19.7% 18.4% 18.7%
Difference (-/+) from 2014 -1.6% 2.3% 1.5% 4.2% 3.9% 0.8% 2.5% 2.9% 4.2% 0.3% 9.7% 12.1%
Prince William 7.3% 10.3% 17.8% 34.5% 41.4% 40.1% 41.4% 45.0% 41.8% 33.0% 27.5% 22.8% 30.2% Difference (-/+) from 2014 -5.5% 0.2% 0.7% 7.7% 6.3% 2.4% 2.3% 5.8% 4.0% -2.3% 3.5% 7.9%
Lake Ridge 0.0% 0.0% 3.4% 9.2% 12.0% 11.1% 14.1% 16.2% 12.2% 8.0% 6.8% 6.5% 8.3% Difference (-/+) from 2014 0.0% 0.0% 1.3% -0.2% 1.0% -0.7% -0.1% 1.7% 2.0% 1.4% 3.5% 4.1%
Included in this table is rounds played by the public, cardholders (discount program), and outing rounds. Overall, the course utilization has increased for each course from 2014 to 2015. This is consistent with industry standards, as the National Golf Foundation has reported that rounds per playable day has increased by nearly 1%.

30
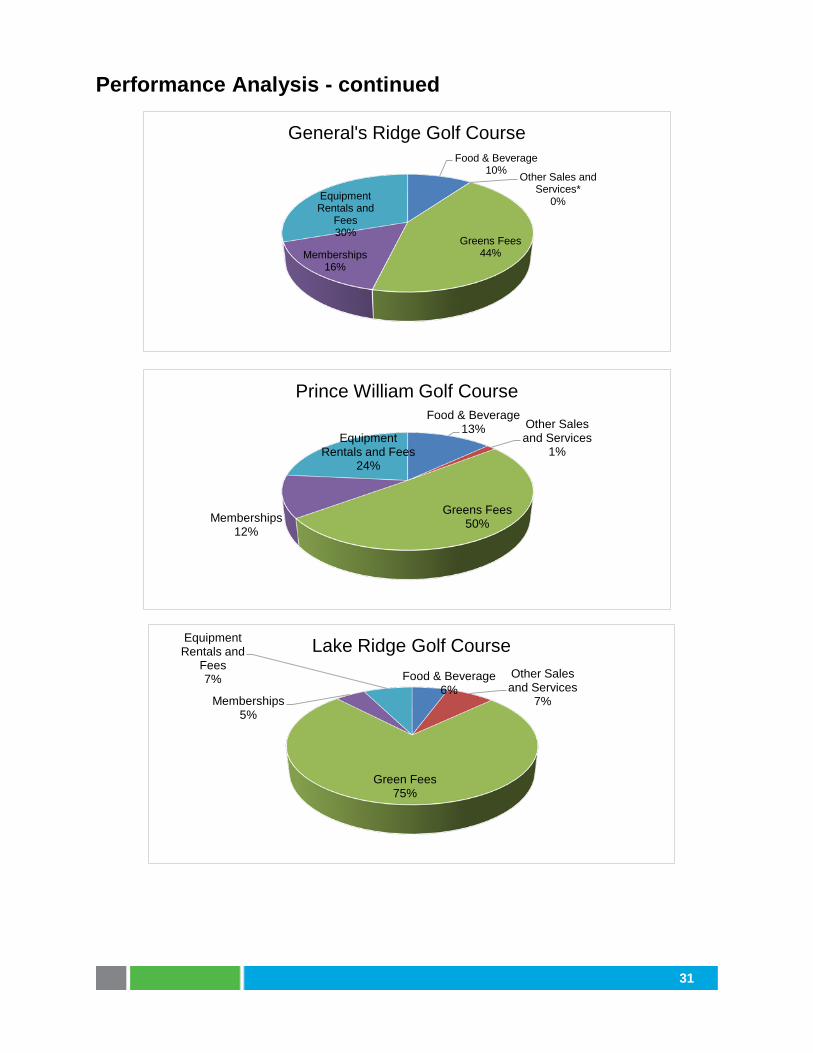
Performance Analysis - continued Revenue Segments – Comparison to Industry Standard As presented in the introduction, golf course revenue is typically broken into 5 major revenue segments:
• Memberships • Green Fees • Food & Beverage • Other Sales and Services • Equipment Rental and Fees
Compared to the industry standard, Prince William County golf courses revenue is consistent for food and beverage, other sales and services, and equipment rentals and fees. The biggest discrepancy is the percentage of revenue for memberships compared to green fees. The percentage of revenue earned for green fees at all four golf courses was at minimum 44%, which is more consistent with the industry standard for what golf courses earn through membership programs. The discrepancy with industry standard is likely because the industry information includes private courses, which primarily earns revenue through memberships. *Other Sales and Services includes miscellaneous income and discounts
Revenue Segment FY 15
Industry Standard %
FY 15 Prince William County
Memberships 48% 11%
Green Fees 26% 50%
Food & Beverage 17% 13%
Other Sales and Services 5% 1% Equipment Rentals and Fees 4% 25%
Food & Beverage15% Other Sales
and Services*0%
Green Fees49%
Memberships10%
Equipment Rentals and
Fees26%
Forest Greens Golf Course
31
Performance Analysis - continued
Food & Beverage10% Other Sales and
Services*0%
Greens Fees44%Memberships
16%
Equipment Rentals and
Fees30%
General's Ridge Golf Course
Food & Beverage13% Other Sales
and Services1%
Greens Fees50%Memberships
12%
Equipment Rentals and Fees
24%
Prince William Golf Course
Food & Beverage6%
Other Sales and Services
7%
Green Fees75%
Memberships5%
Equipment Rentals and
Fees7%
Lake Ridge Golf Course
32
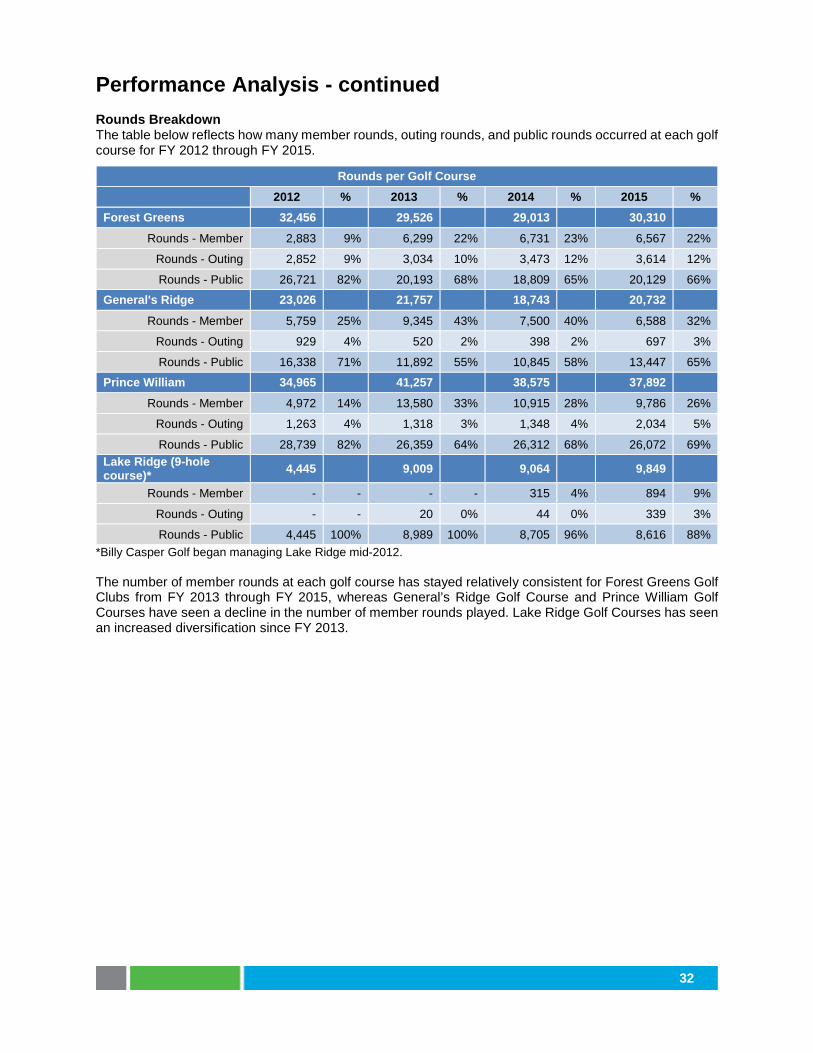
Performance Analysis - continued Rounds Breakdown The table below reflects how many member rounds, outing rounds, and public rounds occurred at each golf course for FY 2012 through FY 2015.
Rounds per Golf Course 2012 % 2013 % 2014 % 2015 %
Forest Greens 32,456 29,526 29,013 30,310
Rounds - Member 2,883 9% 6,299 22% 6,731 23% 6,567 22%
Rounds - Outing 2,852 9% 3,034 10% 3,473 12% 3,614 12%
Rounds - Public 26,721 82% 20,193 68% 18,809 65% 20,129 66%
General's Ridge 23,026 21,757 18,743 20,732
Rounds - Member 5,759 25% 9,345 43% 7,500 40% 6,588 32%
Rounds - Outing 929 4% 520 2% 398 2% 697 3%
Rounds - Public 16,338 71% 11,892 55% 10,845 58% 13,447 65%
Prince William 34,965 41,257 38,575 37,892
Rounds - Member 4,972 14% 13,580 33% 10,915 28% 9,786 26%
Rounds - Outing 1,263 4% 1,318 3% 1,348 4% 2,034 5%
Rounds - Public 28,739 82% 26,359 64% 26,312 68% 26,072 69% Lake Ridge (9-hole course)* 4,445 9,009 9,064 9,849
Rounds - Member - - - - 315 4% 894 9%
Rounds - Outing - - 20 0% 44 0% 339 3%
Rounds - Public 4,445 100% 8,989 100% 8,705 96% 8,616 88% *Billy Casper Golf began managing Lake Ridge mid-2012. The number of member rounds at each golf course has stayed relatively consistent for Forest Greens Golf Clubs from FY 2013 through FY 2015, whereas General’s Ridge Golf Course and Prince William Golf Courses have seen a decline in the number of member rounds played. Lake Ridge Golf Courses has seen an increased diversification since FY 2013.
33
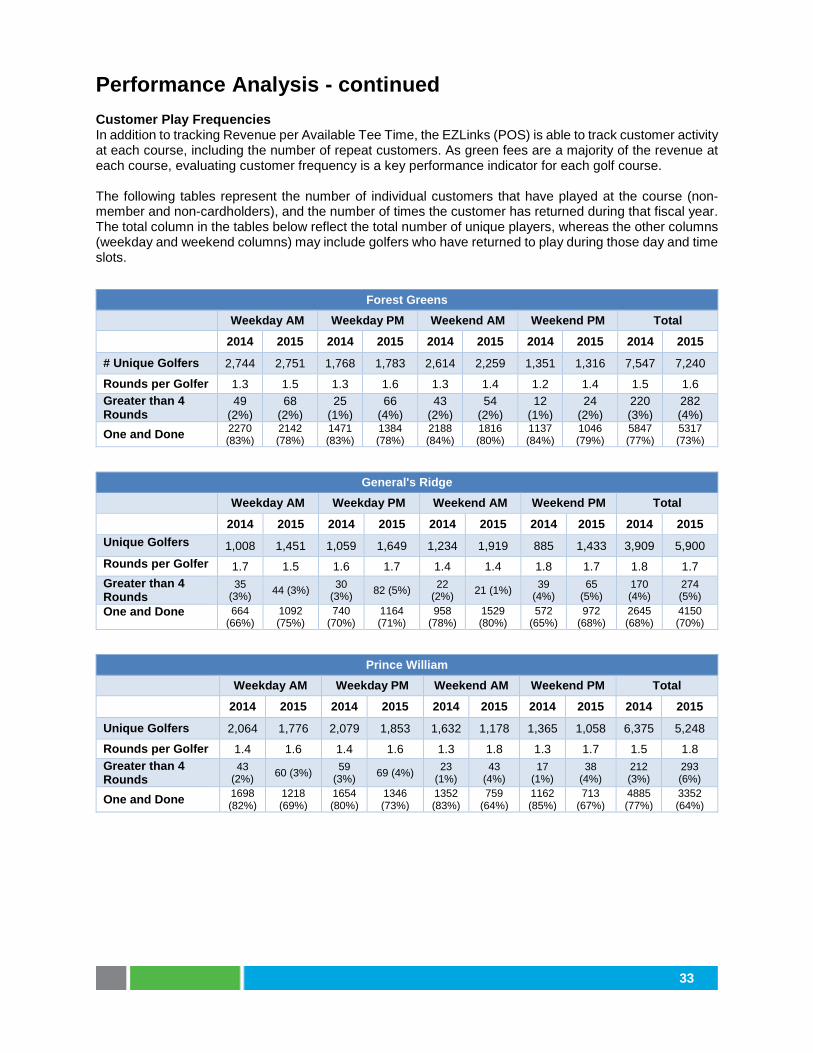
Performance Analysis - continued Customer Play Frequencies In addition to tracking Revenue per Available Tee Time, the EZLinks (POS) is able to track customer activity at each course, including the number of repeat customers. As green fees are a majority of the revenue at each course, evaluating customer frequency is a key performance indicator for each golf course. The following tables represent the number of individual customers that have played at the course (non-member and non-cardholders), and the number of times the customer has returned during that fiscal year. The total column in the tables below reflect the total number of unique players, whereas the other columns (weekday and weekend columns) may include golfers who have returned to play during those day and time slots.
Forest Greens
Weekday AM Weekday PM Weekend AM Weekend PM Total
2014 2015 2014 2015 2014 2015 2014 2015 2014 2015
# Unique Golfers 2,744 2,751 1,768 1,783 2,614 2,259 1,351 1,316 7,547 7,240
Rounds per Golfer 1.3 1.5 1.3 1.6 1.3 1.4 1.2 1.4 1.5 1.6 Greater than 4 Rounds
49 (2%)
68 (2%)
25 (1%)
66 (4%)
43 (2%)
54 (2%)
12 (1%)
24 (2%)
220 (3%)
282 (4%)
One and Done 2270 (83%)
2142 (78%)
1471 (83%)
1384 (78%)
2188 (84%)
1816 (80%)
1137 (84%)
1046 (79%)
5847 (77%)
5317 (73%)
General's Ridge
Weekday AM Weekday PM Weekend AM Weekend PM Total 2014 2015 2014 2015 2014 2015 2014 2015 2014 2015 Unique Golfers 1,008 1,451 1,059 1,649 1,234 1,919 885 1,433 3,909 5,900 Rounds per Golfer 1.7 1.5 1.6 1.7 1.4 1.4 1.8 1.7 1.8 1.7 Greater than 4 Rounds
35 (3%) 44 (3%) 30
(3%) 82 (5%) 22 (2%) 21 (1%) 39
(4%) 65
(5%) 170 (4%)
274 (5%)
One and Done 664 (66%)
1092 (75%)
740 (70%)
1164 (71%)
958 (78%)
1529 (80%)
572 (65%)
972 (68%)
2645 (68%)
4150 (70%)
Prince William
Weekday AM Weekday PM Weekend AM Weekend PM Total 2014 2015 2014 2015 2014 2015 2014 2015 2014 2015
Unique Golfers 2,064 1,776 2,079 1,853 1,632 1,178 1,365 1,058 6,375 5,248
Rounds per Golfer 1.4 1.6 1.4 1.6 1.3 1.8 1.3 1.7 1.5 1.8 Greater than 4 Rounds
43 (2%) 60 (3%) 59
(3%) 69 (4%) 23 (1%)
43 (4%)
17 (1%)
38 (4%)
212 (3%)
293 (6%)
One and Done 1698 (82%)
1218 (69%)
1654 (80%)
1346 (73%)
1352 (83%)
759 (64%)
1162 (85%)
713 (67%)
4885 (77%)
3352 (64%)
34
Performance Analysis - continued
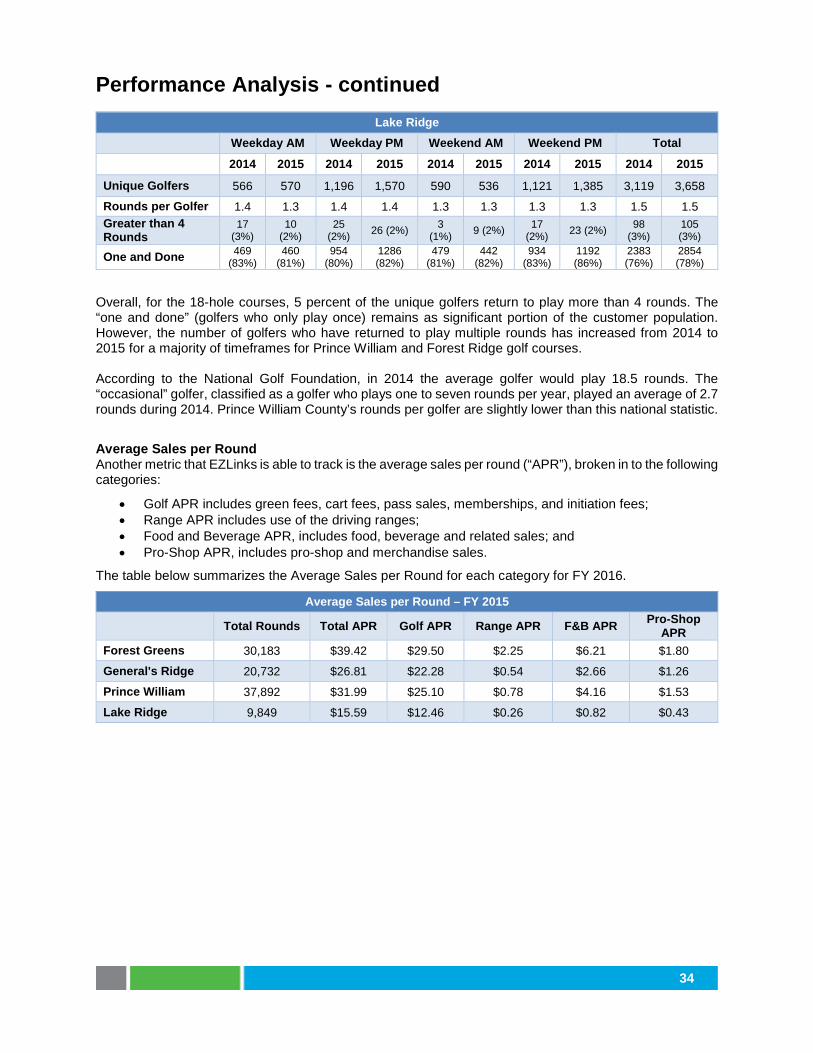
Lake Ridge Weekday AM Weekday PM Weekend AM Weekend PM Total 2014 2015 2014 2015 2014 2015 2014 2015 2014 2015
Unique Golfers 566 570 1,196 1,570 590 536 1,121 1,385 3,119 3,658
Rounds per Golfer 1.4 1.3 1.4 1.4 1.3 1.3 1.3 1.3 1.5 1.5 Greater than 4 Rounds
17 (3%)
10 (2%)
25 (2%) 26 (2%) 3
(1%) 9 (2%) 17 (2%) 23 (2%) 98
(3%) 105 (3%)
One and Done 469 (83%)
460 (81%)
954 (80%)
1286 (82%)
479 (81%)
442 (82%)
934 (83%)
1192 (86%)
2383 (76%)
2854 (78%)
Overall, for the 18-hole courses, 5 percent of the unique golfers return to play more than 4 rounds. The “one and done” (golfers who only play once) remains as significant portion of the customer population. However, the number of golfers who have returned to play multiple rounds has increased from 2014 to 2015 for a majority of timeframes for Prince William and Forest Ridge golf courses. According to the National Golf Foundation, in 2014 the average golfer would play 18.5 rounds. The “occasional” golfer, classified as a golfer who plays one to seven rounds per year, played an average of 2.7 rounds during 2014. Prince William County’s rounds per golfer are slightly lower than this national statistic.
Average Sales per Round Another metric that EZLinks is able to track is the average sales per round (“APR”), broken in to the following categories:
• Golf APR includes green fees, cart fees, pass sales, memberships, and initiation fees; • Range APR includes use of the driving ranges; • Food and Beverage APR, includes food, beverage and related sales; and • Pro-Shop APR, includes pro-shop and merchandise sales.
The table below summarizes the Average Sales per Round for each category for FY 2016.
Average Sales per Round – FY 2015 Total Rounds Total APR Golf APR Range APR F&B APR Pro-Shop
APR Forest Greens 30,183 $39.42 $29.50 $2.25 $6.21 $1.80
General's Ridge 20,732 $26.81 $22.28 $0.54 $2.66 $1.26
Prince William 37,892 $31.99 $25.10 $0.78 $4.16 $1.53
Lake Ridge 9,849 $15.59 $12.46 $0.26 $0.82 $0.43

Public Opinion

35
Public Opinion As a measure of public opinion, we reviewed the mystery shopper reports, which are compiled by Billy Casper Golf, LLC, and data obtained by golfadvisor.com - a website used by golfers to rate and review courses. The Golf Advisor data was organized by course and consists of customer reviews from two viewpoints the last 12 months and all time reviews and rating. The reviews measure overall course condition, value, pace of play, staff friendliness, course layout, and course conditions. Forest Greens Golf Club
Last 12 Months All Time
Number of reviews
Average Rating (out of 5)
% of Golfers Recommended
the Course
Number of reviews
Average Rating (out of 5)
% of Golfers Recommended the
Course 33 3.7 90.9% 102 3.8 89.1%
Overall, reviewers enjoy the location and accessibility of the Forest Greens Golf Club, and it also offers a number of challenges that more advanced golfers find acceptable. The affordable price of green fees is one of the more frequently mentioned positive comments. The most observed complaint for golfers was the slow pace of play and many of these reviews are consistent with customer’s observations that there was not a marshal on the course the day they played. Some of these reviews were from the same holiday weekend. A considerable number of reviews mention the high value of this course for its cost, but suggested the maintenance of the course could use improvement. Overall, the public maintains a positive opinion of Forest Greens. General’s Ridge Golf Course
Last 12 Months All Time
Number of reviews
Average Rating (out of 5)
% of Golfers Recommended the
Course
Number of reviews
Average Rating (out of 5)
% of Golfers Recommended the
Course 32 3.3 68.8% 111 3.3 67.6%
Overall, reviewers find that the course is challenging with an interesting layout that cannot be found at other Northern Virginia golf courses. One’s experience is highly dependent on their preferences to course style, due to the challenges of elevation changes, narrow fairways, and undulated greens. Golfers enjoy the variation of the course the most with each hole offering a new challenge, as well as the favorable green fees. Complaints included golfers being unhappy with course layout and pin placements and how difficult it is to walk the course because of terrain. Overall the public maintains a moderate opinion of General’s Ridge, with room for improvement. Prince William Golf Course
Last 12 Months All Time
Number of reviews
Average Rating (out of 5)
% of Golfers Recommended the
Course
Number of reviews
Average Rating (out of 5)
% of Golfers Recommended the
Course 23 3.9 95.7% 58 3.8 94.7%
Overall, reviewers found this course to be good for beginners and an overwhelming majority (94.7%) would recommend Prince William Golf Course. Golfers reported affordability, an acceptable level of course maintenance, and a moderate level of difficulty. The main concerns reported were slow pace of play, especially on the back nine, poor course conditions after inclement weather, and the poor condition of bunkers and cart paths. Overall the public maintains a positive opinion of Prince William Golf Course.

36
Public Opinion - continued Lake Ridge Park Golf Course
Last 12 Months All Time
Number of reviews
Average Rating (out of
5)
% of Golfers Recommended the
Course
Number of reviews
Average Rating (out of 5)
% of Golfers Recommended the
Course 1 4.0 100.0% 5 3.2 80.0%
The reviews from golfadvisor.com for this course were not as comprehensive as with the other courses. Due to the low number of reviews a consistent opinion could not be determined, but golfer feedback was still provided. Lake Ridge Park Golf Course is a good course for brand new golfers, due to its low cost, pace of play, and ease of walking. The public generally thinks of this course as a place to practice one’s short game.

Observations and Recommendations
37
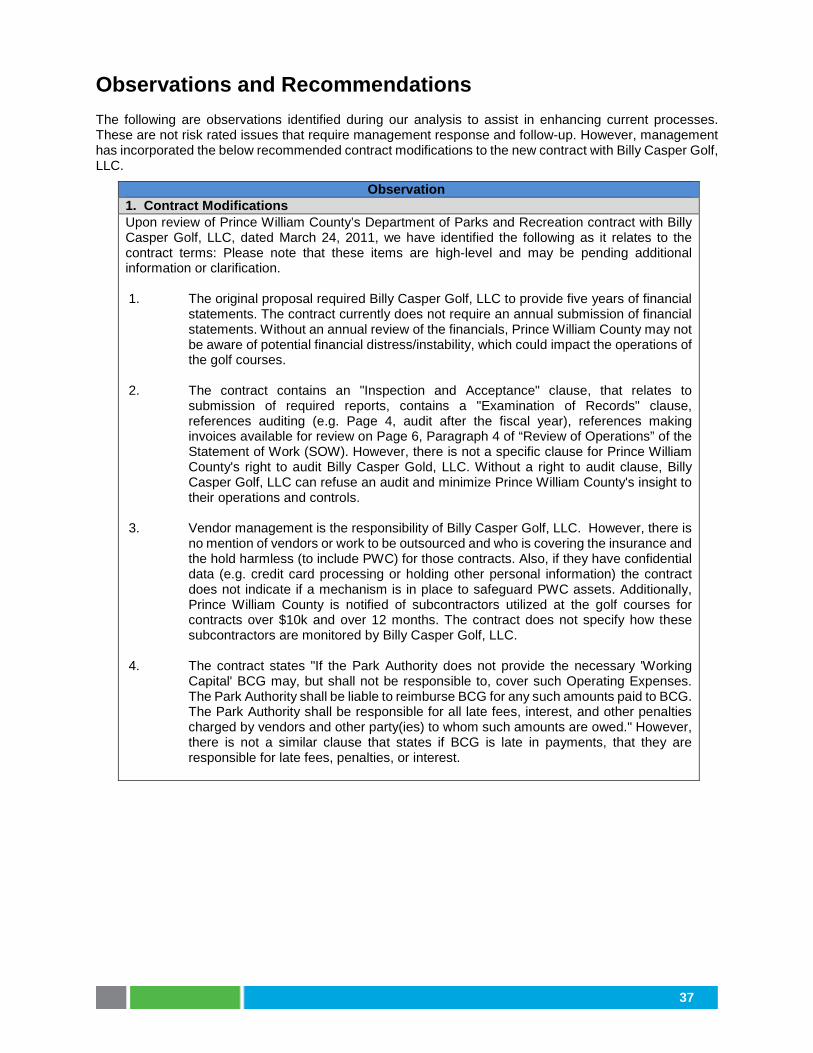
Observations and Recommendations The following are observations identified during our analysis to assist in enhancing current processes. These are not risk rated issues that require management response and follow-up. However, management has incorporated the below recommended contract modifications to the new contract with Billy Casper Golf, LLC.
Observation 1. Contract Modifications Upon review of Prince William County’s Department of Parks and Recreation contract with Billy Casper Golf, LLC, dated March 24, 2011, we have identified the following as it relates to the contract terms: Please note that these items are high-level and may be pending additional information or clarification. 1. The original proposal required Billy Casper Golf, LLC to provide five years of financial
statements. The contract currently does not require an annual submission of financial statements. Without an annual review of the financials, Prince William County may not be aware of potential financial distress/instability, which could impact the operations of the golf courses.
2. The contract contains an "Inspection and Acceptance" clause, that relates to
submission of required reports, contains a "Examination of Records" clause, references auditing (e.g. Page 4, audit after the fiscal year), references making invoices available for review on Page 6, Paragraph 4 of “Review of Operations” of the Statement of Work (SOW). However, there is not a specific clause for Prince William County's right to audit Billy Casper Gold, LLC. Without a right to audit clause, Billy Casper Golf, LLC can refuse an audit and minimize Prince William County's insight to their operations and controls.
3. Vendor management is the responsibility of Billy Casper Golf, LLC. However, there is
no mention of vendors or work to be outsourced and who is covering the insurance and the hold harmless (to include PWC) for those contracts. Also, if they have confidential data (e.g. credit card processing or holding other personal information) the contract does not indicate if a mechanism is in place to safeguard PWC assets. Additionally, Prince William County is notified of subcontractors utilized at the golf courses for contracts over $10k and over 12 months. The contract does not specify how these subcontractors are monitored by Billy Casper Golf, LLC.
4. The contract states "If the Park Authority does not provide the necessary 'Working
Capital' BCG may, but shall not be responsible to, cover such Operating Expenses. The Park Authority shall be liable to reimburse BCG for any such amounts paid to BCG. The Park Authority shall be responsible for all late fees, interest, and other penalties charged by vendors and other party(ies) to whom such amounts are owed." However, there is not a similar clause that states if BCG is late in payments, that they are responsible for late fees, penalties, or interest.
38
Observations and Recommendations – continued
Process Improvement 1. Contract Modifications – continued
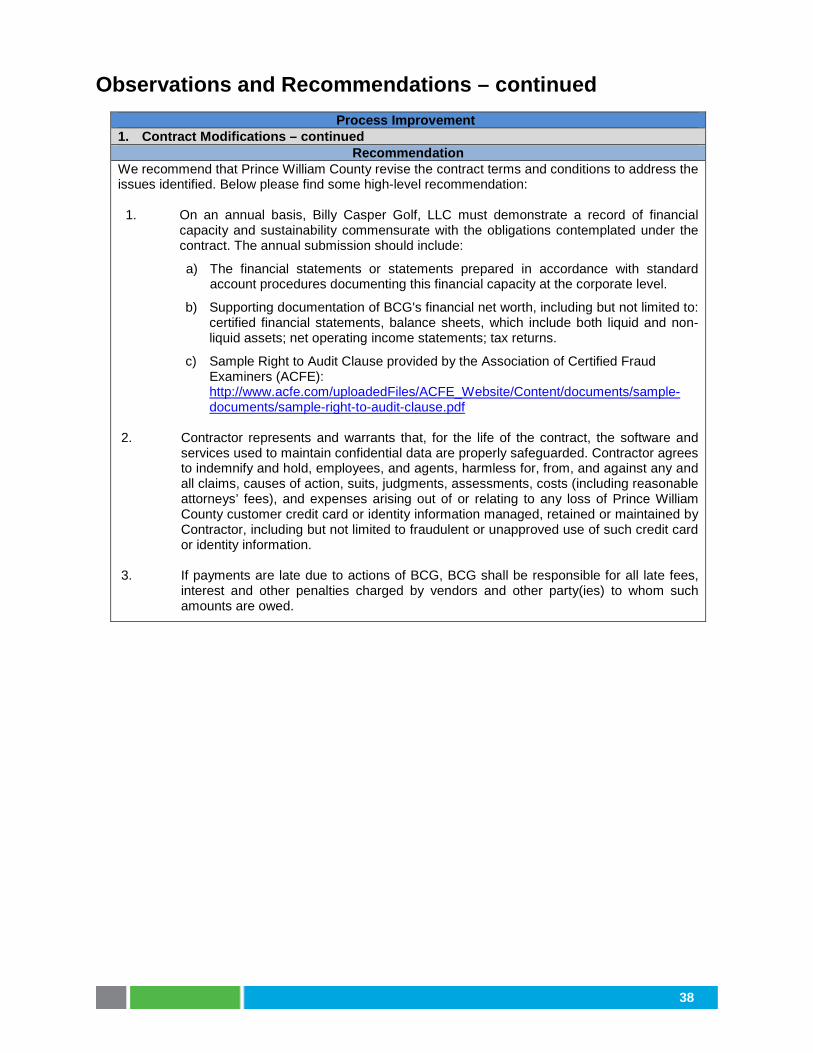
Recommendation We recommend that Prince William County revise the contract terms and conditions to address the issues identified. Below please find some high-level recommendation:
1. On an annual basis, Billy Casper Golf, LLC must demonstrate a record of financial capacity and sustainability commensurate with the obligations contemplated under the contract. The annual submission should include:
a) The financial statements or statements prepared in accordance with standard account procedures documenting this financial capacity at the corporate level.
b) Supporting documentation of BCG's financial net worth, including but not limited to: certified financial statements, balance sheets, which include both liquid and non-liquid assets; net operating income statements; tax returns.
c) Sample Right to Audit Clause provided by the Association of Certified Fraud Examiners (ACFE): http://www.acfe.com/uploadedFiles/ACFE_Website/Content/documents/sample-documents/sample-right-to-audit-clause.pdf
2. Contractor represents and warrants that, for the life of the contract, the software and services used to maintain confidential data are properly safeguarded. Contractor agrees to indemnify and hold, employees, and agents, harmless for, from, and against any and all claims, causes of action, suits, judgments, assessments, costs (including reasonable attorneys’ fees), and expenses arising out of or relating to any loss of Prince William County customer credit card or identity information managed, retained or maintained by Contractor, including but not limited to fraudulent or unapproved use of such credit card or identity information.
3. If payments are late due to actions of BCG, BCG shall be responsible for all late fees, interest and other penalties charged by vendors and other party(ies) to whom such amounts are owed.
39
Observations and Recommendations - continued
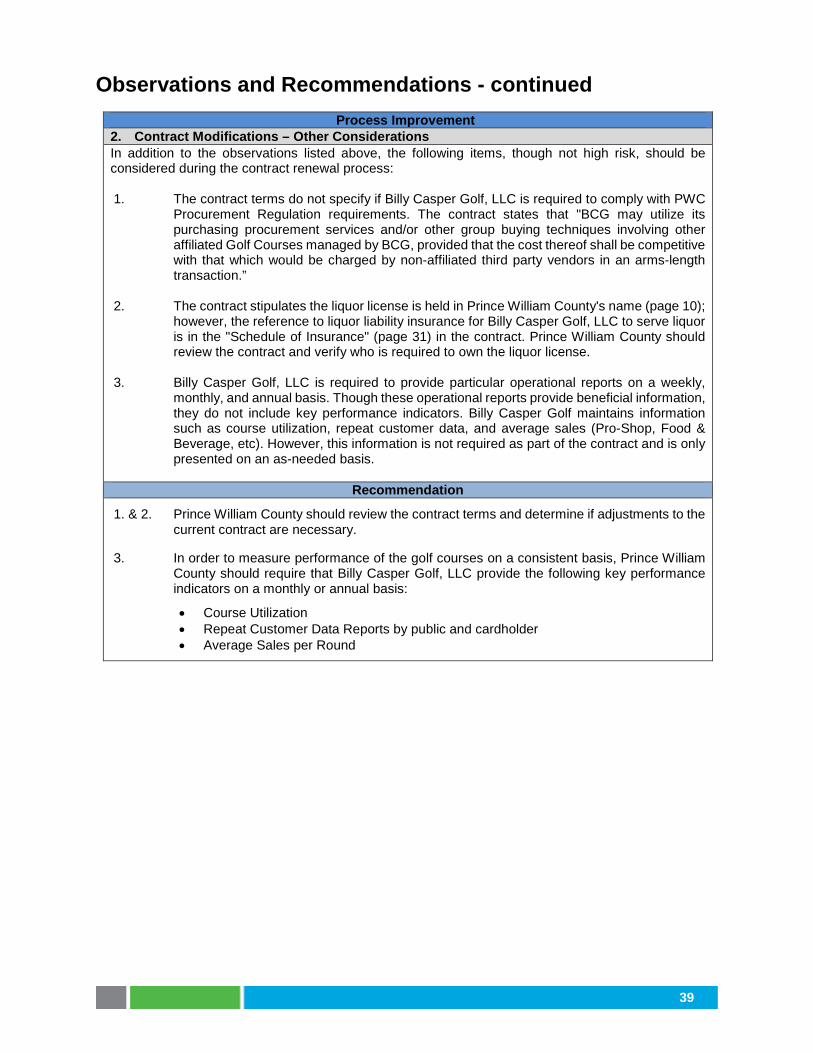
Process Improvement 2. Contract Modifications – Other Considerations In addition to the observations listed above, the following items, though not high risk, should be considered during the contract renewal process: 1. The contract terms do not specify if Billy Casper Golf, LLC is required to comply with PWC
Procurement Regulation requirements. The contract states that "BCG may utilize its purchasing procurement services and/or other group buying techniques involving other affiliated Golf Courses managed by BCG, provided that the cost thereof shall be competitive with that which would be charged by non-affiliated third party vendors in an arms-length transaction.”
2. The contract stipulates the liquor license is held in Prince William County's name (page 10);
however, the reference to liquor liability insurance for Billy Casper Golf, LLC to serve liquor is in the "Schedule of Insurance" (page 31) in the contract. Prince William County should review the contract and verify who is required to own the liquor license.
3. Billy Casper Golf, LLC is required to provide particular operational reports on a weekly,
monthly, and annual basis. Though these operational reports provide beneficial information, they do not include key performance indicators. Billy Casper Golf maintains information such as course utilization, repeat customer data, and average sales (Pro-Shop, Food & Beverage, etc). However, this information is not required as part of the contract and is only presented on an as-needed basis.
Recommendation
1. & 2. Prince William County should review the contract terms and determine if adjustments to the current contract are necessary.
3. In order to measure performance of the golf courses on a consistent basis, Prince William County should require that Billy Casper Golf, LLC provide the following key performance indicators on a monthly or annual basis:
• Course Utilization • Repeat Customer Data Reports by public and cardholder • Average Sales per Round

RSM US LLP is a limited liability partnership and the U.S. member firm of RSM International, a global network of independent audit, tax and consulting firms. The member firms of RSM International collaborate to provide services to global clients, but are separate and distinct legal entities that cannot obligate each other. Each member firm is responsible only for its own acts and omissions, and not those of any other party. Visit rsmus.com/aboutus for more information regarding RSM US LLP and RSM International.
RSM® and the RSM logo are registered trademarks of RSM International Association. The power of being understood® is a registered trademark of RSM US LLP.
© 2015 RSM US LLP. All Rights Reserved.