
Primary and Secondary Control of Parallel Operating ...
162
Department of Electrical and Computer Engineering Primary and Secondary Control of Parallel Operating Converter- Interfaced Distributed Energy Resources in Microgrids Ruwan P. S. Chandrasena This thesis is presented for the Degree of Doctor of Philosophy of Curtin University November 2014
Transcript of Primary and Secondary Control of Parallel Operating ...

Department of Electrical and Computer Engineering
Primary and Secondary Control of Parallel Operating Converter-
Interfaced Distributed Energy Resources in Microgrids
Ruwan P. S. Chandrasena
This thesis is presented for the Degree of
Doctor of Philosophy
of
Curtin University
November 2014

Declaration
To the best of my knowledge and belief this thesis contains no material previously
published by any other person except where due acknowledgment has been made.
This thesis contains no material which has been accepted for the award of any other
degree or diploma in any university.
Signature: R.P.S. Chandrasena
Date: 19/11/2014

iii
Acknowledgements
I am deeply grateful to my supervisors, Dr. Farhad Shahnia and Dr. Sumedha
Rajakaruna for their incomparable guidance, continuous patience and encouragement
throughout my doctoral study. Without your endless support, this thesis could have
been a nightmare.
Then, I wish to express my warmest gratitude to Prof. Arindam Ghosh for his
insightful guidance and support during the course of my study.
I am much obliged to the staff members of the Department of Electrical and
Computer Engineering, Curtin University, especially Zibby Cielma, Russel
Wilkinson, Nicholas King and Mark Fowler for their support rendered in various
ways during this work.
I wish to acknowledge the Faculty of Engineering, University of Ruhuna, Sri Lanka
for granting me the required leave and financial support to pursue my higher studies.
Finally, I need to acknowledge the financial support received from Curtin University
through Curtin International Postgraduate Research Scholarship (CPIRS) to complete
my studies with peace of mind.


v
Dedication
To my beloved wife Shiromi and my kids Omaya and Onali, for their unconditional
love, understanding, commitment and moral support to make this work a success.

vi
Abstract
The necessity of utilizing sustainable energy resources as well as reducing the
energy generation costs and electricity transmission losses are driving the modern
power systems towards embedding renewable energy based dispersed generation
units in the low voltage and medium voltage distribution networks. Nowadays,
photovoltaic cells, wind turbines and fuel cells are among the most popular
distributed energy resources (DER) for generation of electric power. These DERs are
usually converter-interfaced and need to be controlled properly.
The microgrid concept was introduced in 2002 as a better way of harnessing
energy from the renewable energy based DERs. Microgrid is a cluster of DERs and
loads which appears as a single controllable unit that promptly responds to the
demand changes. Microgrid can operate either in grid-connected mode or in off-grid
mode. In grid-connected mode, the grid dictates the voltage and frequency and DERs
can operate at the rated or maximum generation capacities. In off-grid mode, if the
DERs generation capacity is higher than local load demand, they can share the loads
while maintaining the voltage and frequency within acceptable limits.
In this thesis, a hierarchical control system is proposed for the proper operation
and control of the DERs in a microgrid. The proposed primary controller has a robust
and optimal feedback control system which ensures the DERs are generating and
tracking the desired references at their output. The proposed secondary controller
adjusts the set points of the primary controllers of the DERs to ensure the voltage and
frequency are kept within the acceptable limits. It also dynamically adjusts the power
sharing ratio among the DERs in the microgrid and sheds the loads to prevent
voltage and frequency collapse in the system. The developed control system ensures
the DERs can successfully supply all different types of loads in the microgrid such as
balanced, unbalanced and harmonic loads. The in this thesis, both single-phase and
three-phase DERs are considered. In case of single-phase DERs with different
ratings arbitrarily distributed among the three phases in the microgrid, two
alternative methods are proposed to circulate the power from the phase with excess
generation to the other phase(s) which need more power due to lack of generation. In
addition, the possibility of interconnecting two or more neighboring off-grid
microgrids is proposed to reduce the load shedding requirement in a microgrid with
deficiency of power, if the neighboring microgrids have sufficient generation

vii
capacity to supply the generation deficiency in the considered microgrid. Finally, a
dc microgrid system is also proposed and its interconnection with an ac microgrid
through an interlinking converter is discussed. Proper control and management
methods are proposed to ensure the effective operation of the interlinked ac-dc
hybrid microgrid at all different modes of operation. Several scenarios and case
studies are considered and the proposed concepts are validated by extensive
computer-based simulation studies in PSCAD/EMTDC.

ix
Table of Contents
Abstract ....................................................................................................................... vi
Table of Contents ........................................................................................................ ix
List of Figures ........................................................................................................... xiii
List of Tables............................................................................................................ xvii
List of Abbreviations................................................................................................. xix
Chapter 1 Introduction ............................................................................................ 1
1.1 Literature review .................................................................................................... 1
1.1.1 Hierarchical control of microgrids .............................................................. 3
1.1.2 Microgrids with balanced, unbalanced and harmonic loads ....................... 4
1.1.3 Interconnected microgrids ........................................................................... 4
1.1.4 Single-phase DERs in microgrids ............................................................... 6
1.1.5 AC-DC microgrids ...................................................................................... 7
1.2 Aims and objectives of the thesis ........................................................................... 8
1.3 Significance of research ......................................................................................... 8
1.4 Original contributions of the research .................................................................... 8
1.5 Structure of the thesis ............................................................................................. 9
Chapter 2 Microgrid Modeling and Hierarchical Control ................................. 11
2.1 Microgrid structure............................................................................................... 11
2.1.1 DER and converter structure and modeling .............................................. 12
2.1.1.1 Fuel cell .............................................................................................. 12
2.1.1.2 PV ....................................................................................................... 13
2.1.1.3 Battery ................................................................................................ 14
2.1.1.4 DER converter .................................................................................... 15
2.1.1.5 Network Voltage Regulation .............................................................. 16
2.1.1.6 Microgrid resynchronization .............................................................. 16
2.2 Microgrid hierarchical control ............................................................................. 16

x
2.2.1 Outer-loop control of the primary controller during grid-connected mode
……………………………………………………………………….18
2.2.2 Outer-loop control of the primary controller during off-grid mode .......... 22
2.2.3 Inner-loop control ...................................................................................... 26
2.2.4 Additional modules of the central controller............................................. 31
2.2.4.1 Circuit breaker status monitoring module .......................................... 32
2.2.4.2 Dynamic power ratio adjustment module ........................................... 32
2.2.4.3 Droop curve adjustment module ......................................................... 37
2.2.4.4 Load shedding module ........................................................................ 39
2.2.5 DSTATCOM control ................................................................................ 39
2.3 Summary .............................................................................................................. 43
Chapter 3 Primary and Secondary Level Control Results ................................. 45
3.1 Microgrid operation in grid-connected and off-grid modes ................................. 45
3.2 DER and microgrid isolation and resynchronization ........................................... 48
3.3 Microgrid with unbalanced and harmonic loads .................................................. 50
3.3.1 Microgrid with unbalanced loads .............................................................. 51
3.3.1.1 Non-isolated distribution transformer ................................................ 51
3.3.1.2 Isolated distribution transformer ........................................................ 53
3.3.2 Microgrid with harmonic loads ................................................................. 54
3.4 Droop curve adjustment in microgrid .................................................................. 56
3.4.1 Off-grid microgrid within acceptable voltage and frequency ................... 57
3.4.2 Off-grid microgrid with unacceptable voltage and frequency .................. 58
3.5 Dynamic power ratio adjustment in microgrid .................................................... 60
3.6 Summary .............................................................................................................. 61
Chapter 4 Interconnecting Neighboring Microgrids .......................................... 63
4.1 Requirement of interconnecting neighboring microgrids .................................... 63
4.2 System of interconnected off-grid microgrids ..................................................... 64
4.3 Large feeder with multiple interconnected microgrids ........................................ 68
4.4 Summary .............................................................................................................. 74

xi
Chapter 5 Microgrids with Single-phase DERs .................................................. 75
5.1 Network under consideration ............................................................................... 75
5.2 Interphase power circulation ................................................................................ 76
5.2.1 Power circulation through distribution transformer .................................. 77
5.2.2 Power circulation through DSTATCOM .................................................. 78
5.2.2.1 DSTATCOM in low voltage feeder ................................................... 80
5.2.2.2 DSTATCOM in medium voltage feeder ............................................ 82
5.3 Grid-connected and off-grid operation................................................................. 85
5.4 Single phase DER and microgrid isolation and resynchronization ...................... 88
5.5 Power circulation by a DSTATCOM in low voltage feeder ................................ 90
5.5.1 Steady state results .................................................................................... 90
5.5.2 Dynamic results ......................................................................................... 92
5.6 Power circulation by DSTATCOM in medium voltage feeder ........................... 95
5.7 Presence of different types of DERs in microgrid ............................................. 100
5.8 Interconnection of neighboring microgrids with single phase DERs ................ 102
5.9 Summary ............................................................................................................ 105
Chapter 6 AC-DC Hybrid Microgrid ................................................................. 107
6.1 AC-DC microgrid network ................................................................................ 107
6.2 Operation and control of the dc microgrid ......................................................... 109
6.2.1 TC conduction status monitoring module ............................................... 109
6.2.2 Output power control module ................................................................. 109
6.2.3 Converter switching control module ....................................................... 110
6.3 Dynamic operation results of ac-dc microgrid ................................................... 111
6.3.1 Mode-1 .................................................................................................... 112
6.3.2 Mode-2 .................................................................................................... 114
6.3.3 Mode-3 .................................................................................................... 116
6.3.3.1 Load change in the ac bus ................................................................ 116
6.3.3.2 Load change in the dc bus ................................................................ 117

xii
6.3.3.3 AC bus DERs operating in maximum ratings .................................. 118
6.3.3.4 DC bus DERs operating in maximum ratings .................................. 119
6.3.4 Mode-4 .................................................................................................... 120
6.4 Summary ............................................................................................................ 121
Chapter 7 Conclusions and Recommendations ................................................. 123
7.1 Conclusions ........................................................................................................ 123
7.2 Thesis contribution to the knowledge ................................................................ 124
7.3 Recommendations for future research ................................................................ 125
7.3.1 Simultaneous active and reactive power ratio adjustment ...................... 125
7.3.2 Different interconnection topologies and decision making ..................... 125
7.3.3 Control of state of charge of storage units in microgrids ........................ 126
7.3.4 Communication network and data transfer delay effect.......................... 126
References ............................................................................................................... 127
Publications arising from the thesis ...................................................................... 137
Appendix ................................................................................................................. 141

xiii
List of Figures
Fig. 2.1 Structure of the microgrid under consideration. ........................................... 11
Fig. 2.2 Fuel cell and storage model equivalent circuit. ............................................ 13
Fig. 2.3 Equivalent circuit of PV, boost chopper based on MPPT and storage. ........ 14
Fig. 2.4 Structure of the DER converter .................................................................... 15
Fig. 2.5 Hierarchical microgrid control structure ...................................................... 17
Fig. 2.6 (a) Single phase representation of the DER converter, (b) Simplified
equivalent circuit of the DER single-phase converter, (c) Thevenin equivalent circuit.
.................................................................................................................................... 18
Fig. 2.7 Primary and secondary control levels of the microgrid system. ................... 20
Fig. 2.8 Detailed block diagram of the primary control level of the DER converter
control. ....................................................................................................................... 21
Fig. 2.9 Closed-loop switching control block diagram for voltage control strategy
based on LQR. ............................................................................................................ 28
Fig. 2.10 (a) Open loop and closed loop Bode diagram of G1(s), (b) Open loop and
closed loop Bode diagram of G2(s). ........................................................................... 31
Fig. 2.11 (a) Active and reactive power sharing using droop between two DER
converters, (b) Adjustments in the droop curve for dynamic power ratio variations
among the two converters. ......................................................................................... 37
Fig. 2.12 (a) Active and reactive power sharing using droop between two DER
converters, (b) Adjustments in the droop curve for regulating the network voltage
and frequency within the acceptable limits. ............................................................... 38
Fig. 2.13 Radial MV network with five distribution feeders. .................................... 41
Fig. 3.1 Simulation results for MG before DSTATCOM connection: ...................... 47
Fig. 3.2 Simulation results of MG after DSTATCOM connection: ........................... 48
Fig. 3.3 Simulation results for resynchronization of DER-3 and the microgrid: ....... 50
Fig. 3.4 Simulation results of microgrid discussed in section 3.3.1.1. ...................... 53
Fig. 3.5 Simulation results of microgrid considered in section 3.3.1.2. .................... 54
Fig. 3.6 Simulation results of microgrid considered in section 3.3.2: ....................... 56
Fig. 3.7 Structure of the microgrid under consideration. ........................................... 56
Fig. 3.8 Simulation results for considered microgrid in section 3.4.1: ...................... 58
Fig. 3.9 Simulation results for considered microgrid in section 3.4.2: ...................... 59
Fig. 3.10 Simulation results for considered microgrid in section 3.5: ....................... 60
Fig. 4.1 Structure of the interconnected microgrid system. ....................................... 65
Fig. 4.2 Simulation results for system of interconnected MG-1 and MG-2: ............. 67

xiv
Fig. 4.3 Simulation results for the system of interconnected MG-1 and MG-2 when
MG-2 DERs operate at their maximum capacity: ...................................................... 68
Fig. 4.4 Schematic diagram of the large medium voltage feeder with self-healing
capability containing several interconnected microgrids. .......................................... 69
Fig. 4.5 Simulation results for the network in case 1: ................................................ 71
Fig. 4.6 Simulation results for the network in case 2: ................................................ 72
Fig. 4.7 Simulation results for the network in case 3: ................................................ 73
Fig. 5.1 Schematic diagram of the network under consideration. .............................. 76
Fig. 5.2 Schematic diagram of a distribution network with DSTATCOM installed in:
(a) low voltage feeder and (b) medium voltage feeder. ............................................. 78
Fig. 5.3 Simplified network under consideration for power circulation through a
DSTATCOM. ............................................................................................................. 81
Fig. 5.4 Topology of the DSTATCOM connected to the medium voltage feeder ..... 82
Fig. 5.5 Closed-loop switching control block diagram for current control strategy
based on pole-shift. .................................................................................................... 84
Fig. 5.6 Simulation results for community-1 in case-1: ............................................. 88
Fig. 5.7 Simulation results for community-1 in case-2: ............................................. 89
Fig. 5.8 Steady state simulation results before DSTATCOM connection (left column)
and after DSTATCOM connection (right column). (solid line: Phase-A, dashed line:
Phase-B, dotted line: Phase-C) ................................................................................... 92
Fig. 5.9 Simulation results for House Community-1when the three-phase
DSTATCOM is equipped with a common dc bus, .................................................... 93
Fig. 5.10 Simulation results for House Community-1when the three-phase
DSTATCOM is equipped with three separate dc buses, ............................................ 94
Fig. 5.11 Simulation results for House Community–1when the load shedding
algorithm is active ...................................................................................................... 95
Fig. 5.12 Simulation results before DSTATCOM connection (left column) and after
DSTATCOM connection (right column). (solid line: Phase-A, dashed line: Phase-B,
dotted line: Phase-C). ................................................................................................. 97
Fig. 5.13 Simulation results: ...................................................................................... 98
Fig. 5.14 Simulation results before DSTATCOM connection (left column) and after
DSTATCOM connection (right column). (solid line: Phase-A, dashed line: Phase-B,
dotted line: Phase-C). ................................................................................................. 99
Fig. 5.15 Structure of the community-2 under consideration with different types of
DERs. ....................................................................................................................... 100
Fig. 5.16 Simulation results for community-2 in case-5: ......................................... 101
Fig. 5.17 Structure of the interconnected microgrid under consideration. ............... 102
Fig. 5.18 Simulation results for community-1 and 2 in case-6: ............................... 105
Fig. 6.1 Hybrid ac-dc microgrid system in different modes of operation. ............... 108
Fig. 6.2 Power electronic interface for DERs connected to dc buses. ..................... 108

xv
Fig. 6.3 Primary and secondary control levels of the considered dc microgrid system.
.................................................................................................................................. 110
Fig. 6.4 Control schematic of the TC between the ac and dc buses in ac-dc hybrid
microgrid system. ..................................................................................................... 110
Fig. 6.5 Closed-loop switching control block diagram for dc DER converters. ...... 111
Fig. 6.6 Simulation results for the ac bus in Mode-1: .............................................. 113
Fig. 6.7 Simulation results for the dc bus in Mode-1: .............................................. 114
Fig. 6.8 Simulation results for the ac bus in Mode-2: .............................................. 115
Fig. 6.9 Simulation results for the ac and dc bus in Mode-3, case 6.3.3.1: ............. 117
Fig. 6.10 Simulation results for the ac and dc bus in Mode-3, case 6.3.3.2: ........... 118
Fig. 6.11 Simulation results for the ac and dc bus in Mode-3, case 6.3.3.3: ........... 119
Fig. 6.12 Simulation results for the ac and dc bus in Mode-3, case 6.3.3.4: ........... 120
Fig. 6.13 Simulation results for the ac bus in case 6.3.4: ......................................... 121


xvii
List of Tables
Table 2.1 Voltages at different locations in the power system shown in Fig. 2.13 for
different DSTATCOM control modes (pu) ............................................. 42
Table 2.2 Reactive power injection from DSTATCOMs and reactive power flow
from grid to medium voltage feeder for different DSTATCOM control
modes (kVAr) .......................................................................................... 43
Table 3.1 Technical data of the DERs and droop control coefficients for the
network under consideration in Fig. 2.1. ................................................. 46
Table 3.2 Technical data of the DERs and droop control coefficients for the
network under consideration in section 3.2. ............................................ 48
Table 3.3 Technical data of the DERs and droop control coefficients for the
network under consideration in section 3.3. ............................................ 50
Table 3.4 Technical data of the DERs and droop control coefficients for the
network under consideration in Fig. 3.7. ................................................. 56
Table 6.1 Parameters of network, DER converters, filters and TC. controller
coefficients for Fig. 6.1 ......................................................................... 111
Table 6.2 DER converter droop controller coefficients for Fig. 6.1 ...................... 111


xix
List of Abbreviations
ac Alternating Current
CB Circuit Breaker
dc Direct Current
dq Direct Quadrature
DER Distributed Energy Resource
DSTATCOM Distribution Static Compensator
IGBT Insulated Gate Bipolar Transistors
KCL Kirchhoff’s Circuit Laws
LQR Linear Quadratic Regulator
LV Low Voltage
MG Microgrid
MPPT Maximum Power Point Tracking
MV Medium Voltage
pcc Point of Common Coupling
PLL Phase-Locked Loop
pu Per Unit
PV Photovoltaic Cells
TC Tie-Converter
VSC Voltage Source Converter


Chapter 1 Introduction
1.1 Literature review
The ever increasing energy demand along with the necessity of cost reduction
and higher reliability requirements are driving the modern power systems towards
distributed energy resources (DER) as an alternative to the expansion of the current
energy distribution systems [1]. In particular, small DERs, typically with power
levels ranging from few kilowatts to megawatts, located near the loads are gaining
popularity due to their higher operating efficiencies. Nowadays, photovoltaic cells
(PV), wind turbines, fuel cells, batteries and micro turbines are among the most
popular DERs for generation of electric power mostly during peak times or in rural
areas [2]. However, the stochastic nature of the renewable energy sources creates
technical challenges in integrating such energy sources to the distribution grid.
The concept of microgrid (MG) was introduced in 2002 [3] and it has been
identified as a better way of harnessing the energy from the renewable energy based
DERs. Microgrids are clusters of DERs, loads and energy storages. To deliver high
quality and reliable power, the microgrid should appear as a single controllable unit
that promptly responds to the changes in the system [3]. Microgrid can operate either
in grid-connected mode or in off-grid mode due to planned (e.g. network
maintenance) or unplanned (e.g. network fault) network operating conditions [4].
In grid-connected mode, the grid dictates voltage and frequency of the network
and DERs can operate at their nominal (rated) capacities. In this mode of operation,
the desired reference for DERs output can be derived using a constant power control
strategy [5]. Alternatively, in off-grid mode, if the DERs generation capacity is
higher than the local load demand, they will be sharing the loads. In this regard,
voltage and frequency droop control strategy is proposed in [6] for deriving the
references for the DER converters, in order to share the power among parallel

Chapter 1: Introduction
2
converter-interfaced DERs similar to the droop control technique used for power
sharing among generators in a conventional power system. Later, voltage and angle
droop was proposed in [7] to be used instead of the voltage and frequency droop for
converter-interfaced DER applications. For improving the system response, a
modified droop control has been proposed in [8]. For improving the small signal
stability, an arctan power frequency droop has been proposed in [9] instead of the
conventional droop method. Recently, intelligent power sharing algorithms such as
adaptive droop control [10] and intelligent droop control [11] are proposed to remove
the dependency of droop control on line parameters. In addition, in [12], a potential
function based method has been utilized instead of the droop control to adjust
common set points required for power sharing among the DERs in a microgrid.
Stability of the microgrid system with different power sharing algorithms is also
investigated in [13]-[15]. Once the references for the DERs are assigned, the DER
converters can be controlled using either voltage-controlled [16]-[17] or current-
controlled [18]-[19] strategies to track the desired references.
In grid-connected mode, the grid defines the network voltage; however, in off-
grid mode, the network voltage can be indirectly regulated by the DERs based on the
droop control. Although in both modes, the voltage along the low voltage network is
maintained within acceptable limits, it is desired to hold the voltage to the nominal
value of 1 per unit (pu). This can be achieved if one of the DERs in microgrid
regulates the network voltage to 1 pu, referred to as Master DER in [20]. If DERs
generation capacity in an off-grid microgrid is less than the local load demand, load
shedding has to be carried out in order to maintain the voltage and frequency in the
microgrid [21]-[22]. However, the DERs in residential low voltage networks are
owned by customers and are not responsible for network voltage support. This is
because utilizing the converter of a DER to generate reactive power, for supporting
the network voltage profile, will reduce the active power generation capacity of the
converter which is not desired by the owners point of view. Alternatively, a
distribution static compensator (DSTATCOM) can be used in each microgrid to
regulate the voltage at its point of common coupling (pcc) [23].
Another important issue in microgrids is islanding detection and
resynchronization. Islanding is referred to the isolating the microgrid from the main
grid. Different islanding detection methods are presented in [24]. In [24], it is

Chapter 1: Introduction
3
indicated that a communication based method can be utilized to send the circuit
breaker status from the circuit breaker to the DER converters. This method is
preferred among other islanding detection methods since it is free from none
detection zones. Resynchronization is referred to the reconnection process of a DER
to the microgrid or reconnection of a microgrid to grid [25]. If a DER operates in
current-controlled strategy, no resynchronization is required when the DERs are
connecting to the microgrid. However, if a DER operates in voltage-controlled
strategy, proper resynchronization is required. Reconnection should only take place
once the voltage magnitude difference and voltage phase difference across the
respective circuit breaker is zero or lower than a small specified value [25].
Inappropriate reconnection may cause fluctuations in current which can damage the
network assets or result in system instability. Different resynchronisation methods
are proposed in [26]-[28].
General introduction on microgrid basics, including the architecture, protection
and power management is given in [29]-[30]. A review of ongoing research projects
on microgrid in US, Canada, Europe and Japan is presented in [30]-[31]. Different
power management strategies and controlling algorithms for a microgrid are
proposed in [32]-[33].
1.1.1 Hierarchical control of microgrids
A three-level hierarchical control architecture can be identified for microgrid
control as presented in [31]. The distribution network tertiary controller analyses the
data such as load and weather forecast, electricity market and economic dispatch
results to define the references for the output power of each DER within the
microgrid. These references are communicated to the microgrid secondary (central)
controller which passes this information to the primary level controllers. The primary
controllers are within each DER and are responsible for controlling the DER outputs
based on the references received from the central controller. Hence, the required
output of a DER can vary from zero to its maximum capacity based on the
commands of the tertiary controller.
To realize a power ratio among the DERs in the microgrid, droop controller
coefficients need to be designed properly [34]. Many researches propose to design
the coupling inductances of the DERs such that their ratio is inversely proportional to

Chapter 1: Introduction
4
the desired ratio of the output powers of the DERs. However, it is not practical to
adjust the coupling inductances dynamically for varying output power ratios. A
virtual impedance-based technique is introduced and utilized in [35] to overcome this
problem. However, in general, dynamic power sharing ratios can be achieved by
adjusting the droop control coefficients with the help of the central controller for any
ratios of the coupling inductances. However, the secondary control level should also
monitor and adjust the references for the voltage and frequency within the microgrid
if they are fallen outside acceptable ranges.
1.1.2 Microgrids with balanced, unbalanced and harmonic loads
One of the main issues yet to be investigated in microgrids is the effect of
single-phase, unbalanced and harmonic loads on the control, operation and power
sharing among parallel converter interfaced DERs. In the presence of balanced,
unbalanced and linear loads, the converters can be operated in voltage control mode
[7]-[8],[36]-[37] or current control mode [38]-[41]. Majority of the literature on DER
converter control in microgrids utilise current control mode [38]-[41]. For this, the
output current reference for each converter should be calculated properly based on
the load demand and the desired power sharing ratio among existing DERs. Later,
the DER can supply the desired reference current to the microgrid by employing a
proper switching mechanism in the converter. This can be relatively complex when
the microgrid is supplying single-phase, unbalanced or harmonic loads. In this case,
the DERs not only should share the active and reactive power but also should share
harmonic, negative and zero sequence currents. This needs a fast and accurate
negative and zero sequence and harmonic current extraction mechanism as discussed
in [39][42]. If the extracted sequence and harmonic currents mismatch the actual load
requirement, the operation and power sharing of DERs can be significantly affected.
However, by using a voltage control mode, there is no requirement to measure and
analyse the load current and to extract the sequence and harmonic current
components.
1.1.3 Interconnected microgrids
Smart Grid is a term referred to the improved condition of existing electric
networks into more reliable, efficient, sustainable and customer interactive system by

Chapter 1: Introduction
5
properly adding advanced metering, protection and communication infrastructures
[43]-[44]. A general summary of the available smart grid definitions, standards,
protection and management plans and the required information technology, energy
and communication infrastructures are given in [43]. Among various anticipated
smart features, self-healing is a key attribute in smart grid concept. It is mainly
driven by the requirement to improve system reliability [44]-[46]. In a self-healing
network, it is expected that the network can continuously detect, analyze and respond
to faults and restore the feeders with minimum human intervention. Therefore, in
case of a fault in the network, the normal operation can be restored in different feeder
sections by properly isolating only the faulted subsections such that the amount of
the affected loads is minimized. The feasibility study carried out in [47] concludes
that integration of self-healing capabilities to the future smart grids will bring high
financial benefits for both utilities and the customers by reducing the number of
affected customers as well as the amount of unsupplied energy.
For a self-healing network, the intelligent agents are required to adapt the
system operation conditions. These agents are then utilized for analyzing and
maintaining the system reliability in real-time. A framework, required to implement
off-grid agents throughout an interconnected system, was proposed in [48]. Such a
framework can be utilized to support a self-healing smart grid through the system
monitoring and controlling. Some self-healing reconfiguration techniques were
proposed in [49]-[50] to divide the network into isolated grids while minimizing the
number of effected loads. Some utilities in US have already started implementing
self-healing projects [51].
It is expected that in the near future, there will be several microgrids in each
distribution network. They will be located in a neighborhood and the networks will
be facilitated with self-healing capabilities. In such a scenario, an off-grid operation
of a microgrid is not anymore desired due to load shedding possibility. However, in
such systems, the concept of microgrids supporting each other becomes more viable.
The topic of “interconnected microgrids” or “clusters of microgrids” is the next stage
of future research in distribution networks. In [52]-[53] based on the microgrid and
power market concepts and availability of control and communication
infrastructures, a model of distributed off-grid microgrids was proposed. In such a
model, if the DERs generation capacity in an off-grid microgrid is less than the local

Chapter 1: Introduction
6
load demand but there is surplus generation capacity in DERs of neighboring off-grid
microgrids, interconnecting these two microgrids can reduce the load shedding in the
microgird with deficiency of generation. In this model, the DERs in interconnected
microgrids should be properly controlled to share the total load demand in the
interconnected system. With the increased interest in smart grid and self-healing
networks, there will be a possibility of interconnecting off-grid microgrids in the near
future. The following assumptions are required when interconnecting two off-grid
microgrids:
Availability of communication infrastructure among DERs, protection devices
and circuit breakers,
Self-healing capability in the network,
Surplus generation capacity of the DERs in one of the microgrids,
Possibility of bypassing some of the current technical requirements for DER
interconnection.
1.1.4 Single-phase DERs in microgrids
In near future, it is expected that majority of the houses will have single-phase
grid-connected DERs. Hence, a group of neighboring houses can form a low voltage
network which probably is capable of operating in off-grid mode, referred as a low
voltage microgrid. Single-phase DERs in the microgrid will deliver the required
active and reactive power demand while regulating the network voltage magnitude
and frequency within the acceptable limits [32]-[34],[54]-[55].
The microgrid concept is well-established and ample of literature is available
on power management and control in three-phase microgrids. So far, not much
research is carried out on single-phase DERs operation in three-phase microgrids. In
[56], the grid-connected operation of single-phase DERs is discussed. In [57], the
off-grid operation of single-phase DERs is discussed; however, it is assumed that the
three-phase network falls into three separate single-phase networks and the loads in
each phase are only supplied by the DERs in the same phase. Therefore, the off-grid
operation of the single-phase DERs, with different generation capacities, distributed
unequally in a three-phase microgrid is yet to be explored.
Chapter 1: Introduction
7
1.1.5 AC-DC microgrids
It can be envisaged that the majority of houses connected to the future
distribution network will have some form of DERs. Hence, it is realistic to expect
forming a self-controlled small-scale power system named as microgrid [58] by
aggregating the resources in the neighboring houses which are supplied by the same
utility feeder. These houses, referred to as ‘community houses’ in this thesis, can
therefore share the power generated by DERs such as PVs and energy storages units
(e.g. battery banks) during off-grid or grid-connected operation.
Nowadays, most of the domestic loads are designed to work on ac voltage;
hence, proper conversion systems are required to convert the dc voltage, generated
by some DERs, to the ac voltage. Recently, some residential loads have been
designed to operate on dc supply [59]. In [60], an efficiency comparison is carried
out for different types of residential loads supplied by ac and dc supplies. It is shown
that the efficiency of supplying the loads by dc voltage generated by dc DERs, is
higher than that of supplying the loads from the converted ac supply. In [61], a new
efficient dc power distribution system is proposed for future residential premises,
which increases the total conversions efficiency from 80% to 94%. A novel low
voltage bipolar dc distribution system is proposed and verified experimentally in
[62]-[63] for residential applications. In addition, some experiments are already
conducted on deploying smart control over ac and dc DERs within residential
premises [64]-[65].
AC microgrids have been a significant research area since the microgrid
concept was introduced [16],[18],[31]-[34],[66]-[69]. In recent years, the dc
microgrids have also gained attention of the researchers, due to efficiency and
flexibility in their control. In this regard, a hierarchical control system and an
adaptive droop control are introduced for a dc microgrid system in [70]-[71]. The
control and operation of DERs in a dc microgrid in grid-connected and off-grid
statuses are studied in [72]-[73].
In this thesis, a small-scale, low voltage microgrid is considered as the power
supply unit for future community houses. The discussed microgrid integrates both ac
and dc types of loads and DERs, which are connected to the respective ac and dc
buses. These two buses are interconnected through a power converter, referred to as
Tie-Converter (TC). The ac-dc microgrid is a relatively new concept, with its

Chapter 1: Introduction
8
operation not been explored extensively. Therefore, proper primary and secondary
control levels for the dynamic operation of the DERs within a hybrid ac-dc
microgrid, in different modes of operation needs to be studied.
1.2 Aims and objectives of the thesis
The main objective of this thesis is to propose, develop and verify new
strategies for operation and control of the microgrids with different types of loads,
single-phase and three-phase DERs, with ac and dc buses and the possibility of being
interconnected to neighboring microgrids. To achieve this goal, the aims of the
research project are identified as:
developing a primary control level for each DER in the microgrid,
developing a secondary control level for the DERs in the microgrid,
developing a power circulation mechanism among the phases in the presence of
single-phase DERs in the microgrid,
developing a power sharing mechanism among the DERs when two or more
neighboring microgrids are interconnected,
developing a power transfer control between the ac bus and dc bus of ac-dc
microgrids.
1.3 Significance of research
It is expected that the future distribution networks will be in the form of
interconnected microgrids. This research will help to improve the operation and
control of the parallel connected DERs in an interconnected microgrids.
1.4 Original contributions of the research
The main objective of this research was to develop new strategies for dynamic
operation and control of the parallel DERs in the microgrids. The main contributions
of this research can be listed as follows:
Proposing a hierarchical control system for the parallel converter-interfaced
DERs in microgrids to achieve a desired power sharing ratio among them,
Proposing the operation and control strategy for the DERs of a microgrid to
support its neighboring microgrid.

Chapter 1: Introduction
9
Proposing a mechanism of utilizing single-phase DERs with unequally
distributed among the three phases of a microgrid,
Proposing a mechanism of power circulation among the phases of a microgrid
with single phase DERs with different capacities distributed unequally among
the three phases in microgrid,
Proposing a mechanism for power flow control between the ac bus and the dc
bus of ac-dc microgrids.
1.5 Structure of the thesis
This thesis is organized in seven chapters. The research aims and objectives
along with the need and the justification through a literature review for the research
topic are outlined in Chapter 1. The microgrid structure and the developed low level
control of the DERs in grid-connected and off-grid modes of operation are presented
in Chapter 2. A hierarchical control system for the microgird is also discussed in
this chapter and the proposed primary and secondary control levels for the DERs are
presented to achieve a desired power sharing ratio among the DERs as well as proper
voltage and frequency regulation within the microgrid. The simulation results for the
proposed primary and secondary control levels are represented in Chapter 3. In
Chapter 4, the dynamic operation and control of DERs in a system of interconnected
microgrids is presented. The proposed operation strategy for single-phase DERs in a
microgrid is presented in Chapter 5 and a new power circulation strategy is
presented to facilitate the extra power transfer from one phase to another. Chapter 6
discusses the ac-dc hybrid microgrids and hierarchical control of the dc DERs in a dc
microgrid. Power flow control among the ac bus and the dc bus through the
interlinking converter of the hybrid microgrid while maintaining the voltage in both
buses and the frequency in the ac bus is also discussed. Conclusions drawn from this
research and recommendations for future research are given in Chapter 7.


Chapter 2 Microgrid Modeling and
Hierarchical Control
In this chapter, the microgrid structure and its hierarchical control system are
presented. The microgrid is a low voltage network composed of only converter-
interfaced DERs. The hierarchical control system is composed of the primary and
secondary control levels. The secondary control level constitutes several modules
that maintain the voltage and frequency of the microgrid within acceptable limits in
addition to providing a desired power sharing ratio among the DERs. The primary
control level is responsible for ensuring the converters switchings lead to generation
of the derived voltage references by the secondary control system at the converter
output.
2.1 Microgrid structure
Let us consider a medium voltage feeder connected to a low voltage microgrid,
namely microgrid, through distribution transformer T1, as shown in Fig. 2.1. The
microgrid is connected to the grid through a static type circuit breaker, CBM, which is
referred to as the main circuit breaker of the microgrid in the rest of the thesis. The
microgrid has 3 DERs (i.e. DER1 to DER3) and 5 loads. A DSTATCOM is installed
at the secondary side of the distribution transformer in the microgrid to regulate the
voltage at its pcc. The loads are assumed to be residential loads and all DERs are
assumed to be converter-interfaced DERs.
MV Grid
~
DER1
DER2
DER3
L13
L12L
11L
14L
15
CBG
Z1
T1
PG , QG
MG
DSTAT
MV Feeder
CBS
CBM
Fig. 2.1 Structure of the microgrid under consideration.

Chapter 2: Microgrid Modeling and Hierarchical Control
12
During grid-connected mode, all DERs will be operating at their rated
capacities or the capacities determined by the economic analyses. During planned
maintenance or unplanned fault condition on the medium voltage feeder, the
microgrid main circuit breaker CBM is open and the microgrid operates in off-grid
mode while the DERs are sharing its loads. If the load demand in the microgrid is
higher than the power generation capacity of the DERs in the microgrid, non-critical
load shedding must be applied in order to maintain the voltage and frequency of the
microgrid.
2.1.1 DER and converter structure and modeling
The DERs considered in this research are PV, fuel cells and batteries,
connected to the microgrid through voltage source converters (VSC). Detailed
dynamic models of these DERs are utilized in this research. These models are
presented below and their technical data are given in the Appendix.
2.1.1.1 Fuel cell
Fuel cells are gaining popularity in electric networks as a DER because of their
cleanness, high efficiency, and high reliability. A review on their technology,
characteristics and ongoing research are reported in [74]. In this study, a typical PEM
type fuel cell with simplified model shown in Fig. 2.2 is used. Its output V-I
characteristic given in (2.1) is being verified experimentally in [75].
ieiiiV 025.02242.02195.0)log(38.123.371)( (2.1)
Similar characteristic is given for all fuel cells in [76]-[78] where their
numerical values differ according to their rating, output voltage and application. A
boost chopper is used at output of the fuel cell for regulating the necessary dc voltage
vc across the capacitor as shown in Fig. 2.2.
Fuel cells also have several shortcomings, too such as slow dynamic response,
output voltage fluctuation with load and difficult cold start, etc.[78]. Therefore, an
electric storage such as battery or ultracapacitor must be accompanied with the fuel
cell to improve its dynamic characteristics. If the storage is in parallel directly with
the dc bus, its charge and discharge cannot be controlled [78]; therefore, a
bidirectional converter is needed between the dc bus and the electric storage to

Chapter 2: Microgrid Modeling and Hierarchical Control
13
control its state of charge. The basics and detailed control algorithm for the
bidirectional converter of the storage is verified and presented in [79]. The studies
carried out in the thesis, show that the fuel cell has a good and acceptable dynamic
response for power quality improvement and power sharing objectives and no
storage unit on fuel cell is used in the thesis.
i
C)i(V
Fuel Cell
Equivalent circuitBoost Chopper
Bidirectional
DC-DC
Chopper
Battery
Fig. 2.2 Fuel cell and storage model equivalent circuit.
2.1.1.2 PV
A series and parallel combination of PV cells constitute a PV array. Fig. 2.3
shows the simplified equivalent circuit where output voltage is a function of the
output current while the current is a function of load current, ambient temperature
and radiation level [80]. The voltage equation of the PV is calculated by
cs
o
cophc
PV IRI
IIILn
e
AkTV
(2.2)
where
A: constant value for curve fitting
e: electron charge (1.602×10⁻¹⁹ C)
k: Boltzmann constant (1.38×10⁻²³ J/ok)
Ic: output current of PV cell
Iph: photocurrent (1 A)

Chapter 2: Microgrid Modeling and Hierarchical Control
14
Io: diode reverse saturation current (0.2 mA)
Rs: series resistance of PV cell (1 m)
VPV: output voltage of PV cell
Tc: PV cell reference temperature (25oC)
The output chopper controls the voltage vc across the capacitor. A maximum
power point tracking (MPPT) method is used to set the reference voltage of the
chopper to achieve maximum power from the PV based on the load or ambient
condition changes. The MPPT algorithm used in this thesis is given in [80]. A
Proportional-Integral (PI) regulator is used in the chopper in order to achieve the
desired reference voltage set by the MPPT. A battery storage system is connected in
parallel with the dc bus of the chopper output through a bidirectional converter which
is used to control the charging and discharging the battery. Depending on the
terminal voltage of the PV, the battery gets charged or discharged. A more detailed
explanation on bidirectional converter control of PV storage system is given in [81].
0I
C
PV Cell
Equivalent circuitBoost Chopper
Bidirectional
DC-DC
Chopper
Battery
SR
phICV outV
CI
Fig. 2.3 Equivalent circuit of PV, boost chopper based on MPPT and storage.
2.1.1.3 Battery
The battery is assumed to be a constant voltage source with fixed amount of
energy and modeled as a constant dc voltage source with series internal resistance
where the VSC is connected to its output. The battery has a limitation on the duration
of its generated power and depends on the amount of current supplied by it. It is
assumed that the battery is charged at the off-peak load periods of the network and is

Chapter 2: Microgrid Modeling and Hierarchical Control
15
discharged at peak load times through the converter. In this thesis, for the dynamic
study of the network, the battery is assumed to be with full state of charge and no
restriction on rate of discharging.
2.1.1.4 DER converter
The considered DERs have a VSC consisting of three single-phase H-bridges,
as shown in Fig. 2.4. This VSC structure has better controllability and dynamic
performance under unbalanced conditions in the network compared to VSCs with
three-phase three-leg configurations; since in this configuration, each phase is
controlled individually. Alternatively, a three-phase four-leg configuration can be
utilized.
Each H-bridge of VSCs is composed of insulated gate bipolar transistors
(IGBT) with proper parallel reverse diode and snubber circuits. The outputs of each
H-bridge are connected to a single-phase transformer, with 1 : a ratio, and the three
transformers are wye-connected. The transformers provide galvanic isolation as well
as voltage boosting. In this Fig 2.4, the resistance Rf represents the switching and
transformer losses, while the inductance Lf represents the leakage reactance of the
transformers. The filter capacitor Cf is connected to the output of the transformers to
bypass the switching harmonics.
Vdc
Rf
Lf
Cf
Rf
Lf
Rf
Lf
S1
S1
S2
S2
1:a
Cf Cf
LcoupLcoupLcoup
VT,a VT,b VT,c
Fig. 2.4 Structure of the DER converter

Chapter 2: Microgrid Modeling and Hierarchical Control
16
2.1.1.5 Network Voltage Regulation
As mentioned in Chapter 1, in grid-connected mode, the grid dictates the
network voltage and in off-grid mode, the DERs indirectly regulate the network
voltage based on the droop control. Although in both modes, the voltage along the
low voltage network will be within acceptable limits, it is desired to hold the network
voltage to its nominal value of 1 pu. For this, in this research, voltage regulation in
the microgrid is achieved by a DSTATCOM installed at the secondary side of the
distribution transformer of the microgrid, which regulates its pcc voltage to a desired
value, by exchanging reactive power with the network. The implemented
DSTATCOM has the same converter structure as those of the DERs and its control is
discussed in section 2.2.5.
2.1.1.6 Microgrid resynchronization
As mentioned in Chapter 1, in this research, resynchronization of a DER to the
microgrid and a microgrid to the grid is required as DERs are operating in voltage-
controlled strategy. For resynchronisation, the voltage magnitude and angle are
measured on both sides of the circuit breaker. A phase-locked loop (PLL) is utilised
for measuring the voltage angle [25]. The circuit breaker closes once the voltage
angles and magnitudes are the same on both sides of the circuit breaker. However,
based on network and load parameters, resynchronization can be slow and may take
from several milliseconds to minutes [27].
It is to be noted that resynchronisation can be a complicated process depending
on the network configuration, existence of systems of interconnected microgrids and
their location along the medium voltage feeder [82]. Therefore, a general
resynchronisation, self-healing and automatic supply restoration algorithm is
required for this purpose. This controller will utilise communications between the
network circuit breakers.
2.2 Microgrid hierarchical control
For proper operation of a microgrid within a network, a three-level hierarchical
control system [12],[83]-[84], shown in Fig. 2.5 is required as discussed below:
The primary (lowest) control level consists of inner-loop and outer-loop controls.
Inner-loop control is responsible for appropriate switching of the converter

Chapter 2: Microgrid Modeling and Hierarchical Control
17
switches such that a proper tracking of the desired reference of DER converter
output is achieved. This control is based on the references determined by outer-
loop control and the local current and voltage measurements in DER converter
output. Outer-loop control is responsible for proper output power control of
DERs in the microgrid. This control generates the proper references for the inner-
loop control and is different for grid-connected and off-grid modes. The dynamic
performance of DER converters in the system of interconnected microgrids
depends on the primary control level.
DER System1
DER2
Load
MGMG
Central Controller(Secondary Control)
CB
Economic
Dispatch
Distribution Network
Tertiary Controller
Electricity
Market
Load
Forecast
Weather
Forecast
Unit
Commitment
MV
Grid
Primary
Controller
Primary
Controller
DER System 2
Fig. 2.5 Hierarchical microgrid control structure
The secondary control is the central controller of the microgrid. This controller
sends the desired (reference) output power of each DER converter to their
primary controller. In grid-connected mode, the desired output power of each
DER converter is received from the tertiary controller. However, in off-grid
mode, this controller sends reference signals to DER converters in the form of
voltage magnitude and angle, based on monitoring the network voltage and
frequency, whenever required. This controller runs in a slower time frame

Chapter 2: Microgrid Modeling and Hierarchical Control
18
compared to that of the primary control [12]. It is to be noted that in the proposed
system, the DSTATCOMs are operating individually based on their pre-default
set points and are not controlled by the secondary controller.
The tertiary (highest) control communicates with the central controllers in each
microgrid and the protection devices and circuit breakers of the network. In
general, this controller can utilize load forecasting, electricity market and demand
response information for optimal power flow of the network and microgrids [85].
2.2.1 Outer-loop control of the primary controller during grid-connected
mode
Let us consider Fig. 2.6, which shows one phase of the DER VSC and filter
structure shown in Fig. 2.4 (Fig. 2,6a), its equivalent circuit (Fig. 2.6b) and its
thevenin equivalent circuit (Fig. 2.6c). The thevenin equivalent parameters (i.e. VTh
and ZTh) are shown in Fig. 2.6c.
Rf if
+
Lf
u.a.Vdc
Vdc
Cf
Rf
Lf
Lcoup
PCC vTvT
iTP , Q
1:a
Lcoup
Phase-APhase-BPhase-CNeutral
Cf
+ vcf
S1
S2
S3
S4
icf
+
ZTh
+VTh
vT
iT
+ vcf
Lcoup+
(a) (b) (c)
Fig. 2.6 (a) Single phase representation of the DER converter, (b) Simplified
equivalent circuit of the DER single-phase converter, (c) Thevenin equivalent circuit.
From Fig 2.6c, it can be shown that the instantaneous active power (p) and
reactive power (q) supplied from DER-i to its pcc can be expressed as [86]

Chapter 2: Microgrid Modeling and Hierarchical Control
19
icoupiThi
iTiThi
icoupiTh
iiiThiTiiThiiThiT
i
icoupiTh
iiiThiTiiThiiThiT
i
ZZ
ZZ
VVVVVq
ZZ
VVVVVp
,,
,,
,,
,,
2
,,,
,,
,,
2
,,,
cossinsincos
sinsincoscos
(2.3)
where VT is the pcc voltage, Zcoup is the coupling impedance and V = |V |
represents the phasor notation of v(t). It is to be noted that the coupling impedance is
dominantly inductive (i.e. Zcoup jLcoup). In section 2.2.3, it will be shown that after
applying the proposed converter control, ZTh is dominantly inductive in 50 Hz (i.e.
ZTh jLconv) and has a very small magnitude. Therefore, it is expected that VTh Vcf
where Vcf is the voltage across the capacitor Cf. Based on these assumptions, (2.3)
can be simplified as
icoupiconv
iTiTicficfiT
i
icoupiconv
iTicficfiT
i
LL
VVVq
LL
VVp
,,
2
,,,,,
,,
,,,,
cos
sin
(2.4)
The average active power (P) and reactive power (Q) supplied by each DER
can then be calculated from p and q using a low pass filter.
In grid-connected mode, the grid dictates voltage and frequency of the network
and the DERs operate at their nominal (rated) capacities. This can be achieved using
a constant power control mode of operation [5]. In this research, a voltage-controlled
technique is utilized which will monitor the pcc voltage (VT) to regulate DER
converter output voltage (Vcf) such that the desired nominal active and reactive power
are injected into the network. For this, the pcc voltage magnitude and angles should
be measured instantaneously and used in (2.4) to calculate the converter output
reference voltage (Vcf,ref ) for the desired powers and the known coupling inductance.
This reference voltage will later be used in the inner-loop control to generate the
switching signals for the converter. The schematic diagram of the system with the

Chapter 2: Microgrid Modeling and Hierarchical Control
20
discussed control is shown in Fig. 2.7 whereas the detailed block diagram of the
controller is shown in Fig. 2.8.
AC BUS
DER-1 DER-2
Grid-connectedOff-Grid
Voltage reference
generation
Droop Control
Constant PQ Control
Voltage reference
generation
Switching Control
Central Controller
Switching signals for DER-1 converter
Switching signals for DER-2 converter
Solid State CB
Solid State CBstatus
Primary Controller
Secondary Controller
Inner Loop
Outer Loop
2 2 2P , Q , v
1 1 1P , Q , v
Fig. 2.7 Primary and secondary control levels of the microgrid system.

Chapter 2: Microgrid Modeling and Hierarchical Control
21
Fig
. 2.8
Detailed
blo
ck d
iagram
of th
e prim
ary co
ntro
l level o
f the D
ER
con
verter co
ntro
l.
iT vT
+ 9
0°
qi
pi
LP
F
b b
s
+
LP
F
b b
s
+
mn
PQ
Pra
ted
Qra
ted
Vra
ted
Po
wer C
alculatio
nD
roo
p C
on
trol
|Vcf |
+
++
+
Vcf,ref
+V
cfk
1
k2
HP
Fa
as
+
+
0
if
~if,ref
++
u
State F
eedb
ack C
on
trol
+h
h
Hy
steresis
Co
ntro
l
±1
Vo
ltage
Referen
ce
Gen
eration
IGB
T
Driv
er
Circu
it
Inn
er-Lo
op
Co
ntro
l
+1
1
Po
sitive
Seq
uen
ce
Ex
traction
|VT |
vT
cf
rated
Vo
ltage
Referen
ce
Gen
eration
Au
ton
om
ou
s Mo
de
Grid
-con
nected
Mo
de
Op
eration
Mo
de
Selectio
n
Measu
remen
ts
at PC
C
Measu
remen
ts at
Co
nv
erter Filter
Ou
ter-Lo
op
Co
ntro
l
Data
Receiv
ed
from
MG
Cen
tral
Co
ntro
ller
(Seco
nd
ary
Co
ntro
l)

Chapter 2: Microgrid Modeling and Hierarchical Control
22
2.2.2 Outer-loop control of the primary controller during off-grid mode
During off-grid mode, network voltage and frequency should be regulated by
the DERs. In addition, a proper power sharing among the DERs is desired. Below, a
detailed description of the designed and implemented power sharing algorithm based
on droop control is given.
Let us consider the microgrid shown in Fig. 2.1 with 2 DERs (i.e. DER-1 and
DER-2) supplying a common load. DER-1 is connected to the load through a feeder
impedance of Zline,1 where DER-2 is connected to the load through a feeder
impedance of Zline,2. Let us also assume the feeder is highly inductive (i.e. Zline
jLline). Assuming the voltage at load pcc is Vload, the active and reactive power
supplied from each DER can be expressed as
ilineicoupiconv
iloadiloadicficfiload
i
ilineicoupiconv
iloadicficfiload
i
LLL
VVVq
LLL
VVp
,,,
2
,,,,,
,,,
,,,,
cos
sin
(2.5)
As the feeder is assumed to be highly inductive, the active and reactive powers
are decoupled and a decoupled load flow analysis can be applied. In addition, the
angle difference between Vcf and Vload is small. Based on decoupled load flow, the
average active power supplied from each DER to the load is
ilineicoupiconv
loadicficfiload
iLLL
VVP
,,,
,,,
(2.6)
To supply the load with an average active power of Pi , from (2.6), the angle of
the voltage across the filter capacitor of DER-i will be
loadilineicoupiconviicf P ,,,, (2.7)
where loadicf
ii
VV
L
,
Decentralized power sharing among several DERs in a microgrid can be
achieved by changing the voltage magnitude and angle of DERs using the droop
control as [11]

Chapter 2: Microgrid Modeling and Hierarchical Control
23
iirated
line
lineiirated
line
lineiiratedicf
iirated
line
lineiirated
line
lineiiratedicf
QQZ
XPP
Z
RnVV
QQZ
RPP
Z
Xm
,,,,
,,,,
(2.8)
where Vrated and rated are respectively the rated voltage magnitude and angle of the
DER when supplying rated active power (Prated) and reactive power (Qrated). Reactive
power-voltage and active power-angle droop coefficients are represented by n and m,
respectively. By designing the coupling inductance of the DER converter to be ten
times larger than the line impedance, (2.8) can be further simplified as
iiratediiratedicf
iiratediiratedicf
QQnVV
PPm
,,,
,,, (2.9)
Hence, the active and reactive power outputs of the DERs are monitored and
the microgrid voltage and frequency are controlled, accordingly by the outer-loop
control. Therefore, it is expected that the outer-loop control determines the desired
Vcf for each DER in microgrid. The block diagram of outer-loop control is shown in
Fig. 2.8.
Let us assume when each DER changes its output active power from zero to its
nominal (rated) capacity, the DER frequency reduces by . Based on this
assumption, the active power-angle droop coefficient for each DER [87] is derived
from
irated
iP
m,
(2.10)
Assuming to be constant for DERs i and j with different nominal capacities, we
have
irated
jrated
j
i
P
P
m
m
,
, (2.11)
Now, let us assume that all DERs in the microgrid have the same power factor
and when each DER changes its output reactive power from zero to its nominal

Chapter 2: Microgrid Modeling and Hierarchical Control
24
(rated) capacity, the DER voltage reduces by V. Based on this assumption, the
reactive power-voltage droop coefficient for each DER [87] is derived from
irated
iQ
Vn
,
(2.12)
Assuming V to be constant for DERs i and j with different nominal capacities, we
have
irated
jrated
j
i
Q
Q
n
n
,
, (2.13)
Now, for the microgrid in steady state condition, let us assume DER-i and
DER-j have the same rated. Therefore, from (2.9) and (2.11) we have
jjii
jjratedjiiratedijratedirated
jcficf
PmPm
PPmPPm
,,,,
,,
(2.14)
Replacing cf,i and cf,j from (2.7) in (2.14), we have
jjii
jlinejcoupjconvjilineicoupiconvi
PmPm
PP
,,,,,, (2.15)
Therefore, the ratio of the active power supplied by the DERs is equal to
jlinejcoupjconvj
ilineicoupiconvi
i
j
m
m
P
P
,,,
,,,
(2.16)
Eq. (2.16) shows that output active power of each DER is inversely proportional to
the sum of in its output. The three components of conv, coup and line are
dependent on three inductances between the DER and the load. Since has a
parameter of voltage square in its denominator, it is expected that
iicoupilineiconv m ,,, (2.17)
Therefore, (2.16) can be simplified further as

Chapter 2: Microgrid Modeling and Hierarchical Control
25
j
i
i
j
m
m
P
P (2.18)
In a similar way, it can be shown that the ratio of the reactive power supplied
by the DERs in the microgrid will be
j
i
i
j
n
n
Q
Q (2.19)
Hence, based on the above assumption, from (2.11), (2.18) and (2.13), (2.19), it is
expected that the output active and reactive power ratio among two DERs in the
microgrid will be same as the ratio of their nominal active and reactive power
capacities.
On the other hand, in parallel operation of converter-interfaced DERs in a
microgrid, for all the DERs, it is desired that the voltage angle difference across their
coupling inductances (i.e. cf – T) in (2.4) to be constant. This voltage angle
difference is preferred to be small [87] so that it is on the linear section of sinusoidal
P- characteristic of (2.4). Similarly, it is desired the voltage drop across the
coupling inductances (i.e. |Vcf | – |VT |) in (2.4) to be constant, for all the DERs. This
voltage drop is preferred to be small and in the range of 1-2 % [88]. For achieving
these assumptions, the coupling inductances are designed inversely proportional to
the nominal power ratio of DERs as
irated
jrated
irated
jrated
jcoup
icoup
Q
Q
P
P
L
L
,
,
,
,
,
, (2.20)
From (2.3)-(2.20), it is concluded that for an accurate power sharing among
DERs in microgrid, it is required that
irated
jrated
jcoup
icoup
j
i
i
j
irated
jrated
jcoup
icoup
j
i
i
j
Q
Q
L
L
n
n
Q
Q
P
P
L
L
m
m
P
P
,
,
,
,
,
,
,
,
(2.21)

Chapter 2: Microgrid Modeling and Hierarchical Control
26
2.2.3 Inner-loop control
As mentioned before, the outer-loop control regulates the output power of the
DERs by adjusting the proper references for the each DER from (2.4) or (2.9). The
inner-loop control will calculate and apply proper switching signals for the IGBTs in
the DER converter such that the desired voltage (Vcf,ref) is perfectly generated across
the ac filter capacitor (Cf).
It is desired to develop a per-phase based control technique (i.e. abc) instead of
the conventional Direct-Quadrature (dq) transformation based techniques. For this,
let us consider the equivalent single-phase circuit of VSC as shown in Fig. 2.6b. In
this figure, uaVdc represents the converter output voltage, where u is the switching
function. For a 2-level (bipolar) switching, u can take 1, which will be used
subsequently to turn ON/OFF the IGBTs.
Let us consider the DER converter and its output filter as a single system for
which a controller is to be developed. By referring to Fig. 2.6c, the differential
equations that describe the dynamic behavior of this system are given by
iT
icf
fif
icf
if
fiffi
idt
dvCi
vdt
diLiRVdcau
,
,
,
,
,
,..
(2.22)
A closed-loop optimal linear robust controller based on state feedback is
utilized to generate u. Let us assume the state vector x(t) for each phase of the system
is defined as
T
ificfi titvtx ])()([)( ,, (2.23)
where vcf (t) represent the instantaneous voltage across ac filter capacitor, if (t) is the
current passing through filter inductor Lf and T is the transpose operator. Then, the
equivalent circuit of this system can be represented with state space equation of
)()()()( ,2,1 tiBtuBtxAtx iTicii (2.24)
where

Chapter 2: Microgrid Modeling and Hierarchical Control
27
0
1
.
0
1
10
21 f
f
f
f
f
fCB
L
VdcaB
L
R
L
CA (2.25)
In (2.24), uc(t) is the continuous time version of switching function u and iT
represents the network load change effects on this system; hence it is assumed as a
disturbance for the controller.
In the control systems, the desired values for each control parameter in steady
state condition must be known. However, it is rather hard to determine the reference
for if in (2.23). Nevertheless, it is desired if does not have high frequency
components. Therefore, instead of using if as a control parameter, its high frequency
components (ĩf ) can be used in the control system. Based on this assumption, ĩf can
be described and expanded in Laplace domain as [89]
)(ˆ)()(1)()(~
sisisis
sis
ssi fffff
a
a
a (2.26)
where a is the cut-off frequency of this high-pass filter and îf is the low frequency
components of if which is given by
)()(ˆ sis
si ffa
a
(2.27)
Eq. (2.27) can be expressed in differential equation form as
)(ˆ)()(ˆ
titidt
tidff
f a (2.28)
Now, let us define a new state vector for the system, which includes îf as a state
vector, as in [89]
T
ifificfi tititvtx ])(ˆ)()([)( ,,, (2.29)
In this case, the system can be represented with new state space equation of
)()()()( ,2,1 tiBtuBtxAtx iTicii (2.30)
where

Chapter 2: Microgrid Modeling and Hierarchical Control
28
00
0
01
01
0
2
2
1
1
BB
BB
L
R
L
C
Af
f
f
f
aa
(2.31)
Eq. (2.30) can be represented in discrete-time domain as [90]
)()()()1( ,2,1 kiGkuGkxFkx iTicii (2.32)
where
ss
s
T
tA
T
tATAdtBeGdtBeGeF
0
22
0
11
.,,
(2.33)
where Ts is the sampling time. From (2.32), uc(k) can be computed, using a suitable
state feedback control law, as
)]()([)( ,, kxkxKku irefiic
(2.34)
where K is a gain matrix and x'ref (k) is the desired state vector for (2.29), in discrete-
time domain. Fig. 2.9 shows the closed-loop block diagram of an linear quadratic
regulator (LQR)-based control system for the DERs.
cfvky )(
+hh
Hysteresis Control
+1
1
+
)()(
)()()()1( 21
kCxky
kiGkuGkFxkx Tc
u
VSC and Filter System
LQR Gain
kuc kyref
1
1
1
zF
zG
ku
ky
c
1k
+
LQR Gain
2k
High Pass Filter
s
bs+
0~
, reffi
fi~
fi
Fig. 2.9 Closed-loop switching control block diagram for voltage control strategy
based on LQR.
It is to be noted that the desired reference value for vcf (t) for each DER will be
determined by the outer-loop control. This value is calculated from (2.4) when
microgrid operates in grid-connected mode and from (2.9) when microgrid operates

Chapter 2: Microgrid Modeling and Hierarchical Control
29
in off-grid mode. As mentioned before, the desired reference value for ĩf (t) for all
DERs is always set to zero to minimize the high frequency components of the current
flowing through Lf. Therefore, if (t) must only contain low frequency components
(i.e. if (t) = îf (t)). Now, the reference vector, X'ref can be defined for each DER as
T
fficficf
T
ffirefcfiref IIVIIVX ]ˆˆ[]ˆˆ[ ,,,,, (2.35)
As the system behavior in steady-state is interested and assuming a full control
over uc(k), an infinite time LQR [90] based design technique can be utilized to define
K. This controller is more stable than proportional-integrator-derivative (PID) based
controls and prevents the instability among parallel connected DERs when two off-
grid microgrids are interconnected together. In addition, PID based controllers are
not very effective when utilized in per-phase based controls.
In a discrete LQR problem, an objective function J is chosen as
0
,,
)()()(
)()()()()()(
k ii
T
i
irefii
T
irefi
i
kukRku
kxkxkQkxkxkJ (2.36)
where R is the control cost matrix, Q is the state weighting matrix which reflects the
importance of each controlling parameter in x while J(∞) represents the objective
function at infinite time (steady-state condition) for the system. Eq. (2.36) is then
minimized to obtain the optimal control law u(k) through solution of steady state
Riccati equations [90] while satisfying system constraints in (2.32). The LQR
method ensures the desired results for the system while the variations of system load
and source parameters are within acceptable limits of reality.
Eq. (2.34) shows the total tracking error of each DER converter. The tracking
error can be minimized by limiting this error within a very small bandwidth (e.g. h =
10–4). Now, from (2.34), for each DER, the switching function u (i.e. which pairs of
IGBTs to turn ON/OFF) is generated using a hysteresis control based on the error
level as
If uc,i (k) > +h then ui = +1
If –h ≤ uc,i(k) ≤ +h then ui = previous ui
If uc,i(k) < –h then ui = –1
(2.37)
More detail on the discussed converter control is given in [23].
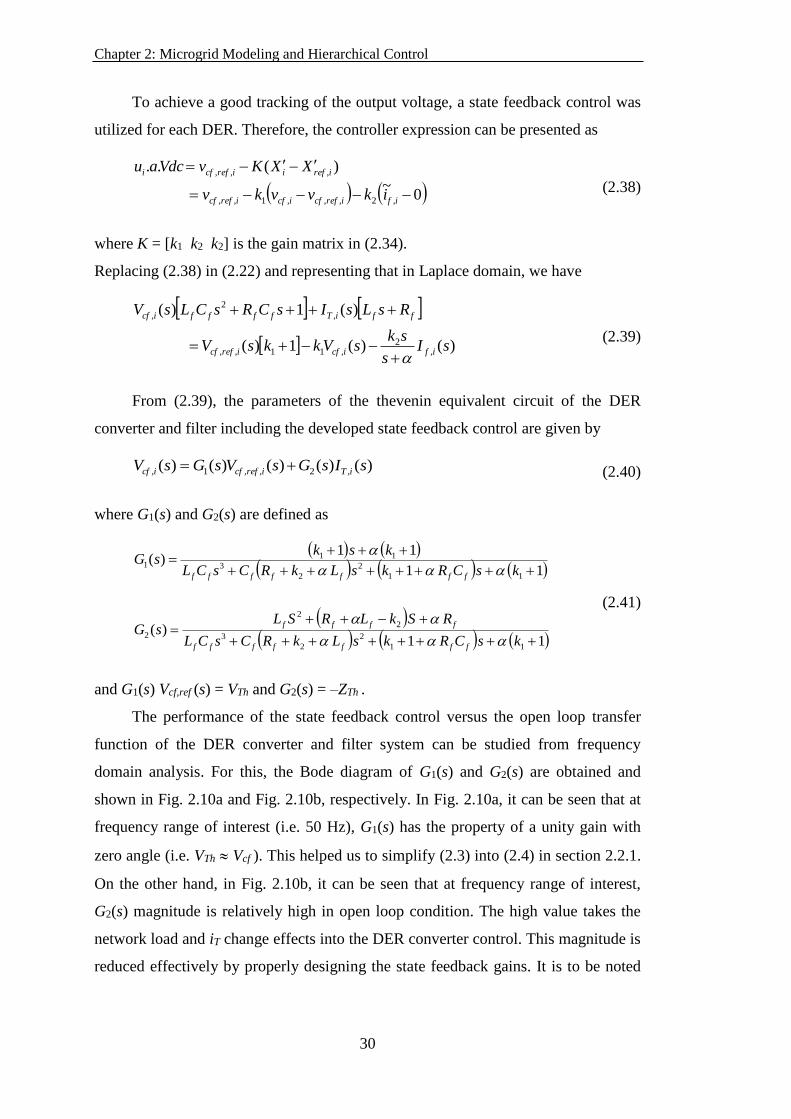
Chapter 2: Microgrid Modeling and Hierarchical Control
30
To achieve a good tracking of the output voltage, a state feedback control was
utilized for each DER. Therefore, the controller expression can be presented as
0~
)(..
,2,,,1,,
,,,
ifirefcficfirefcf
irefiirefcfi
ikvvkv
XXKvVdcau (2.38)
where K = [k1 k2 k2] is the gain matrix in (2.34).
Replacing (2.38) in (2.22) and representing that in Laplace domain, we have
)()(1)(
)(1)(
,2
,11,,
,
2
,
sIs
sksVkksV
RsLsIsCRsCLsV
ificfirefcf
ffiTfffficf
a
(2.39)
From (2.39), the parameters of the thevenin equivalent circuit of the DER
converter and filter including the developed state feedback control are given by
)()()()()( ,2,,1, sIsGsVsGsV iTirefcficf (2.40)
where G1(s) and G2(s) are defined as
11
)(
11
11)(
11
2
2
3
2
2
2
11
2
2
3
111
ksCRksLkRCsCL
RSkLRSLsG
ksCRksLkRCsCL
ksksG
fffffff
ffff
fffffff
aaa
aa
aaa
a
(2.41)
and G1(s) Vcf,ref (s) = VTh and G2(s) = –ZTh .
The performance of the state feedback control versus the open loop transfer
function of the DER converter and filter system can be studied from frequency
domain analysis. For this, the Bode diagram of G1(s) and G2(s) are obtained and
shown in Fig. 2.10a and Fig. 2.10b, respectively. In Fig. 2.10a, it can be seen that at
frequency range of interest (i.e. 50 Hz), G1(s) has the property of a unity gain with
zero angle (i.e. VTh Vcf ). This helped us to simplify (2.3) into (2.4) in section 2.2.1.
On the other hand, in Fig. 2.10b, it can be seen that at frequency range of interest,
G2(s) magnitude is relatively high in open loop condition. The high value takes the
network load and iT change effects into the DER converter control. This magnitude is
reduced effectively by properly designing the state feedback gains. It is to be noted

Chapter 2: Microgrid Modeling and Hierarchical Control
31
that G2(s) is relatively inductive around 50 Hz. This is the reason for assuming ZTh to
be pure inductive in (2.3) in section 2.2.1.
(a)
(b)
Fig. 2.10 (a) Open loop and closed loop Bode diagram of G1(s), (b) Open loop and
closed loop Bode diagram of G2(s).
2.2.4 Additional modules of the central controller
The secondary level control (central controller) communicates with the
distribution network tertiary controller as well as the primary controller of all DERs
within the microgrid. The main responsibility of the central controller is to provide
the references and set points, required for the primary controller of each DER
system. These set points are later used to define the output active and reactive power

Chapter 2: Microgrid Modeling and Hierarchical Control
32
of each DER system. This is valid for both grid-connected and off-grid operating
modes. It is to be noted that the central controller does not operate instantaneously
and has larger time steps (T) compared to the primary controller of each DER
system. Hence, it runs in a slower time frame compared to the primary controllers;
however, it should be faster than the operation time of the under/overvoltage and
under/over frequency relays within the microgrid.
In grid-connected mode, each DER generates an output power based on its
MPPT or the level defined by the distribution network tertiary controller. Hence, in
this case, the microgrid central controller receives the desired ratio of the output
power of the DERs from the tertiary controller and passes those information (set
points) to each DER system.
In off-grid mode, each DER has to generate a portion of the load requirements
within the microgrid. This portion is again defined by the tertiary controller and
passed to each DER system through the central controller. However, in this case, as
the voltage and frequency in the microgrid is not decided by the grid, the central
controller is also responsible for monitoring these two parameters. According to the
load variations in the microgrid, the output power of each DER will vary; however, if
the voltage and frequency of the microgrid increases above or drops below the
acceptable thresholds, the central controller defines new settings for the primary
controller of each DER system and then sends these set points to them. It is to be
noted that this procedure should take place faster than the pre-defined operation time
for under/over frequency relays in the microgrid.
The central controller consists of several modules, as described in detail below.
2.2.4.1 Circuit breaker status monitoring module
Depending on the state of the main circuit breaker, the microgrid operates in
either grid-connected or off-grid mode. In this research, islanding detection is
realized by monitoring the status of the circuit breaker assuming the communication
infrastructure availability to transfer the information to the DERs.
2.2.4.2 Dynamic power ratio adjustment module
From (2.5), assuming Lconv and Lline are much smaller than Lcoup, the ratio of the
average active power between these two DERs can be given as

Chapter 2: Microgrid Modeling and Hierarchical Control
33
22
11
1,
2,
2
1
sin
sin
V
V
L
L
P
P
T
T (2.42)
Now, let us assume the desired active power ratio between these two DERs is
P1/P2 = kp where kp > 0. In many references such as [3][32], for simplicity, it is
assumed that
2211
1,
2,
2
1
sinsin VV
kkL
L
kP
P
p
T
T
p
(2.43)
Similaly, assuming Lconv and Lline are much smaller than Lcoup, the ratio of the reactive
power output between two DERs can be calculated from (2.5) as
322
311
1,
2,
2
1
cos
cos
VV
VV
L
L
Q
Q
T
T
(2.44)
Now, let us assume that the reactive power ratio between these two DERs is
Q1/Q2 = kq where kq > 0. In many references such as [3][32], for simplicity, it is
assumed that
2211
1,
2,
2
1
coscos VV
kkL
L
kkQ
Q
q
T
T
pq
(2.45)
However, in general, it can be assumed that coupling inductances of the two DERs
can have a ratio of k' where k' > 0. In such a case, we have
222211
1,
2,
2
1
sinsinsin VkVk
kV
kL
L
kP
P
p
T
T
p
(2.46)
where k'' = kp/k'. From (2.46), it can be seen that under such conditions, the voltages
at the outputs of both of the DERs are correlated by a factor of k''. It is to be noted
that under such condition, the ratio among the reactive powers of the two DERs will
be as

Chapter 2: Microgrid Modeling and Hierarchical Control
34
322311
1,
2,
2
1
coscos VVk
kVV
kL
L
kQ
Q
q
T
T
q
(2.47)
Hence, from (2.46) and (2.47), it can be seen that in general kp kq. Therefore, the
output active power of the two DERs can be controlled to be equal to the desired
value of kp while the ratio of the reactive power outputs among these two DERs will
not be equal to kp. Hence, if only active power ratio is going to be changed
dynamically, any ratio of the coupling inductances can be selected (considering the
system stability). In addition to the active power, if the reactive power ratio is also
desired to be changed dynamically, a virtual impedance technique as discussed in
[35] can be utilized.
In grid-connected mode as well as the off-grid mode, the distribution network
tertiary controller defines the desired output power ratio among the DERs within a
microgrid. Hence, the ratio among the output powers of two DERs can change
dynamically based on the commands from the tertiary controller which are
transferred to the DERs through the microgrid central controller. Let us assume that
at t = t1, the ratio of the output active power of two DERs (i.e. DER-1 and DER-2 of
Fig. 2.1) is kp1. Hence, from (2.21), we have Prated,2/Prated,1 = m1/m2 = kp1. In this case,
from (2.9), we have
11
1rated,11rated1
ttPPmff (2.48)
The tertiary controller decides to change this ratio to kp2 at t = t2. Hence, from (2.9),
we have
22
1rated,11rated1
ttPPmff (2.49)
Since the load demand in t1 and t2 is the same, the total active power generation by
the DERs will be the same during these two time intervals. Hence, we have
2211
2121
ttttPPPP (2.50)
Replacing the power ratios in (2.50), it can be simplified as

Chapter 2: Microgrid Modeling and Hierarchical Control
35
2
1
11
2111121111
1
1
)1()1(
12
212211
p
ptt
p
t
p
tt
p
tt
p
t
k
kPP
kPkPPkPPkP
(2.51)
From (2.48), (2.49) and (2.51), the frequency variation due to this ratio change is
calculated as
1
12112
11
2
12
2
1
1111111
1
)1
11(
t
p
pp
p
ptttttt
Pmk
kk
k
kmPPPmfff
(2.52)
It is to be noted that this frequency variation is acceptable as far as the new
frequency of the microgrid is between fmax and fmin. Therefore, we have
111
111
1max11
2
12
1min
1max1minmax1min
1
tt
p
ppt
ttttt
ffPmk
kkff
fffffffff
(2.53)
Assuming
1
1
1
1
11
1max2
11
1min1 and
t
t
t
t
Pm
ffH
Pm
ffH
in order to prevent non-acceptable frequency in the microgrid, kp2 must fulfil the
following constraints.
2212
1112
2
1/
1/
0
HHkk
HHkk
k
pp
pp
p
(2.54)
The similar study can be repeated for the voltage magnitude in the microgrid.
Assuming at t = t1, the ratio of the output reactive power of DER-1 and DER-2 of
Fig. 2.1 is kq1, from (2.21), we have Qrated,2/Qrated,1 = n1/n2 = kq1. In this case, from
(2.9), we have
11
1rated,11rated1
ttQQnVV (2.55)

Chapter 2: Microgrid Modeling and Hierarchical Control
36
The tertiary controller decides to change this ratio to kq2 at t = t2. Hence, from (2.9),
we have
22
1rated,11rated1
ttQQnVV (2.56)
Since the load demand in t1 and t2 are the same, the total reactive power generation
by the DERs will be the same during these two time intervals. Hence, we have
2211
2121tttt
QQQQ (2.57)
Replacing the power ratios in (2.57), it can be simplified as
2
1
11
2111121111
1
1
)1()1(
12
212211
q
qtt
qt
qtt
qtt
qt
k
kQQ
kQkQQkQQkQ
(2.58)
From (2.55), (2.56) and (2.58), the voltage variation due to this ratio change is
calculated as
1
12112
11
2
12
2
1
11111111
1
)1
11(
t
q
q
qtttttt
Qnk
kk
k
knQQQnVVV
(2.59)
It is to be noted that this voltage magnitude variation is acceptable as far as the new
voltage magnitude of the microgrid is between |V|max and |V|min. Therefore, we have
111
11
1
1max11
2
12
1min
1max1min
max1min
1
tt
q
qqt
ttt
tt
VVQnk
kkVV
VVVVV
VVVV
(2.60)
Assuming
1
1
1
1
11
1max2
11
1min1 and
t
t
t
t
Qn
VVG
Qn
VVG
in order to prevent non-acceptable voltage magnitude in the microgrid, kq2 must fulfil
the following constraints.

Chapter 2: Microgrid Modeling and Hierarchical Control
37
2212
1112
2
1/
1/
0
GGkk
GGkk
k
q
(2.61)
If kp2 causes violations in the microgrid frequency and voltage magnitude, the frated
and Vrated parameters for the DERs should be adjusted properly to recover the voltage
magnitude and frequency to the acceptable ranges, as discussed below. Fig. 2.11
shows schematically the dynamic power ratio adjustment principle.
f max
fmin
PPrated
2
rated1
Vmin
Vmax
frated
Vrated
m1
m2
PPmax
2
max1
Q = 2
rated1 Q rated
QQmax
2
max1QQ
max
1
max2
(a)
n1n
2
f max
fmin
P rated1
Vmin
Vmax
frated
Vrated
m1 m
2
(b)
n1n
2
Prated
2P
rated,
2
m2
new
new
n2
newft
|V|t
Fig. 2.11 (a) Active and reactive power sharing using droop between two DER
converters, (b) Adjustments in the droop curve for dynamic power ratio variations
among the two converters.
2.2.4.3 Droop curve adjustment module
In grid-connected mode, the voltage and frequency of the microgrid is dictated
by the grid. However, in off-grid mode, these parameters are regulated indirectly by
the output active and reactive power of the DERs. Hence, the droop curve adjustment
module is only active when the microgrid is in off-grid mode. In this case, if the
voltage magnitude or frequency within the microgrid rises above or drops below the
acceptable thresholds, the central controller takes action to shift up or down the rated
values of the droop characteristic. It is desired that for the same output powers of the
DER system, the microgrid voltage magnitude and frequency is retained close to the
desired values. For this, the difference between the frequency of the microgrid with

Chapter 2: Microgrid Modeling and Hierarchical Control
38
its desired value should be calculated. Let us call this difference as f. To adjust the
microgrid frequency to the desired value, a new rated frequency can be defined by
adding f to the previous (old) rated frequency as
ffffff desired
old
rated
old
rated
new
rated (2.62)
Similarly, the difference between the voltage magnitude of the microgrid with
its desired value should be calculated. Let us call this difference as V. To adjust the
microgrid voltage magnitude to the desired value, a new rated voltage can be defined
by adding V to the previous (old) rated voltage magnitude as
VVVVVV desired
old
rated
old
rated
new
rated (2.63)
This is shown schematically in Fig. 2.12.
It is to be noted that, restoring the voltage magnitude and frequency to the rated
values can also be achieved using a PI regulator. However, using the proposed
method, the new references can be directly calculated and transmitted to the primary
controllers of each DER system.
f max
fmin
PPrated
2
rated1
Vmin
Vmax
frated
Vrated
m1
m2
PPmax
2
max1
Q = 2
rated1 Q rated
QQmax
2
max1QQ
max
1
max2
(a)
n1n
2
f max
fmin
frated
new
f oold
PPrated
2
rated1
Pold1 =Pnew
1 Pold2 =P
new
2
Vmin
Vmax
Q old1 =Q new
1 Qold
2 =Q new
2
Voold
Vfrated
old=f o
newV
rated
old=V o
new
Vrated
new
f
(b)
Fig. 2.12 (a) Active and reactive power sharing using droop between two DER
converters, (b) Adjustments in the droop curve for regulating the network voltage
and frequency within the acceptable limits.

Chapter 2: Microgrid Modeling and Hierarchical Control
39
2.2.4.4 Load shedding module
For the microgrid in off-grid mode, if the voltage magnitude and/or frequency
in the ac bus reach a value below the pre-defined minimum acceptable limits even
after droop curve adjustment is applied, the load shedding is required. In this
research, a three-level load-shedding algorithm is developed which monitors the
network frequency. If the frequency drops below the lower limit in any of the phases,
the module applies the first level of load-shedding after a short delay (i.e. 0.2 s in this
study). This may bring the frequency into the acceptable range. Otherwise, the
second load-shedding is applied after a long delay (i.e. 1 s in this study). In a similar
way, the third load shedding is applied after another long delay (i.e. 1 s delay), in
case the second load-shedding also fails to recover the frequency.
2.2.5 DSTATCOM control
As discussed in section 2.1.1.5, voltage regulation in the microgrid is achieved
by a DSTATCOM installed at the secondary side of the distribution transformer,
which regulates its pcc voltage to a desired value. The utilized DSTATCOM in this
research has an LCL filter in its converter output and voltage regulation is achieved
by exchanging reactive power with the network. The reactive power exchange can be
controlled in two different methods. These two methods are:
Voltage control strategy: The first method is based on directly controlling the pcc
voltage. In this method, the difference between the pcc root mean square (rms)
voltage (VT-DSTAT) and its desired value (VT-DSTAT,desired) is utilized to generate the
required voltage magnitude across ac filter capacitor in DSTATCOM as
DSTATTdesiredDSTATTI
PrefDSTATcfDSTATcf VVs
KKVV
,,
(2.64)
where Vcf-DSTAT,ref is the assumed reference value for this voltage, KP and KI are PI
regulator parameters and the suffix DSTAT represents DSTATCOM.
Power factor correction strategy: The second method is based on power factor
correction at pcc. This method is not a direct voltage control method since the
DSTATCOM is controlled to exchange a desired reactive power with the
network (QDSTAT,ref) which is equal to the network reactive power demand in

Chapter 2: Microgrid Modeling and Hierarchical Control
40
downstream side of the DSTATCOM. Hence, the required voltage magnitude
across ac filter capacitor in DSTATCOM can be calculated as
DSTATrefDSTATI
PrefDSTATcfDSTATcf QQs
KKVV
,, (2.65)
where QDSTAT is the measured injected reactive power by the DSTATCOM.
Now, let us consider a radial medium voltage network supplying 5 distribution
transformers with a low voltage feeder in their downstream as shown in Fig. 2.13.
All feeders have a similar impedance load of 88 kW with power factor 0.95 lagging.
We refer to them as F1 to F5. The network does not include any DERs. Initially, no
DSTATCOM is connected to any of the distribution feeders. In this case, voltage
profile of the medium voltage side along the feeder drops from 0.97 pu, at the
beginning of the feeder, to 0.92 pu, at the end of the feeder, as shown in Table 2.1.
Now, let us assume that the DSTATCOMs are connected to the secondary side
of each distribution transformers, as shown in the figure. The operation of each
DSTATCOM is independent from other DSTATCOMs and they all operate in
voltage control mode. Once a DSTATCOM regulates its pcc voltage, the voltage in
the primary side of that transformer (VMVF*) is also regulated accordingly. Hence, in
the considered system, the DSTATCOMs can be utilized to regulate the voltage,
along the medium voltage feeder to a desired voltage profile. This voltage profile can
be chosen as a flat voltage (i.e. 1 pu for all connection points) or a gradually
decreasing voltages (e.g. 1, 0.99,…, 0.96 pu) along the medium voltage feeder. The
fixed voltage set points are assigned for each DSTATCOM. It is to be noted that no
optimization method is utilized to select these set points in this analysis. Since the
DSTATCOMs hold the voltage along the medium voltage feeder, the node voltages
are not affected by load changes.

Chapter 2: Microgrid Modeling and Hierarchical Control
41
T1
MV Feeder
MV Grid
~
T2
T5
F1
L11
DSTATCOM
DSTATCOM2
DSTATCOM5
VMVF1
VMVF2
VMVF5
VDF1
VDF2
VDF5
Qexchange
F2
F5
QDSTAT 1
QDSTAT 2
QDSTAT 3
L5
L2
Fig. 2.13 Radial MV network with five distribution feeders.
The voltage profiles in the primary and secondary side of the transformers for
the above two cases are given in Table 2.1 and the reactive power injection of each
DSTATCOM, along with the reactive power exchange with the grid (Qexchange) are
shown in Table 2.2. From Table 2.1, it can be seen that both cases have similar
results with regard to the voltage profile of the medium voltage feeder. However, in
the case of flat voltage profile, the amount of reactive power injected by
DSTATCOMs gradually increases towards the end of the medium voltage feeder.
Therefore, the DSTATCOMs at feeder end nodes have relatively higher ratings
compared to DSTATCOMs in feeder at beginning when the flat voltage profile is
used. On the other hand, at the beginning of the medium voltage feeder, a huge
reverse reactive power flow (Qexchange) is observed in the case of the flat voltage line
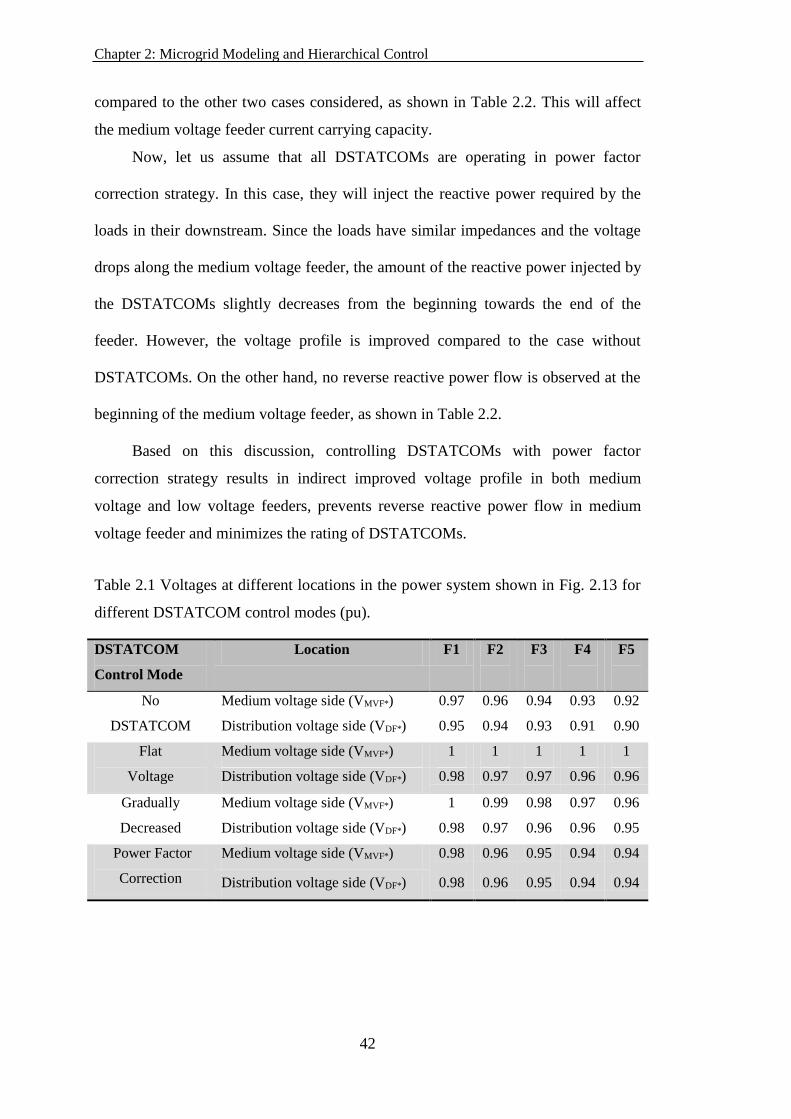
Chapter 2: Microgrid Modeling and Hierarchical Control
42
compared to the other two cases considered, as shown in Table 2.2. This will affect
the medium voltage feeder current carrying capacity.
Now, let us assume that all DSTATCOMs are operating in power factor
correction strategy. In this case, they will inject the reactive power required by the
loads in their downstream. Since the loads have similar impedances and the voltage
drops along the medium voltage feeder, the amount of the reactive power injected by
the DSTATCOMs slightly decreases from the beginning towards the end of the
feeder. However, the voltage profile is improved compared to the case without
DSTATCOMs. On the other hand, no reverse reactive power flow is observed at the
beginning of the medium voltage feeder, as shown in Table 2.2.
Based on this discussion, controlling DSTATCOMs with power factor
correction strategy results in indirect improved voltage profile in both medium
voltage and low voltage feeders, prevents reverse reactive power flow in medium
voltage feeder and minimizes the rating of DSTATCOMs.
Table 2.1 Voltages at different locations in the power system shown in Fig. 2.13 for
different DSTATCOM control modes (pu).
DSTATCOM
Control Mode
Location F1 F2
F3
F4
F5
No
DSTATCOM
Medium voltage side (VMVF*) 0.97 0.96 0.94 0.93 0.92
Distribution voltage side (VDF*) 0.95 0.94 0.93 0.91 0.90
Flat
Voltage
Medium voltage side (VMVF*) 1 1 1 1 1
Distribution voltage side (VDF*) 0.98 0.97 0.97 0.96 0.96
Gradually
Decreased
Medium voltage side (VMVF*) 1 0.99 0.98 0.97 0.96
Distribution voltage side (VDF*) 0.98 0.97 0.96 0.96 0.95
Power Factor
Correction
Medium voltage side (VMVF*) 0.98 0.96 0.95 0.94 0.94
Distribution voltage side (VDF*) 0.98 0.96 0.95 0.94 0.94

Chapter 2: Microgrid Modeling and Hierarchical Control
43
Table 2.2 Reactive power injection from DSTATCOMs and reactive power flow
from grid to medium voltage feeder, for different DSTATCOM control modes
[kVAr].
DSTATCOM
Control Mode
QDSTAT1
QDSTAT2 QDSTAT3 QDSTAT4 QDSTAT5 Qexchange
Flat Voltage 51.37 66.36 76.51 82.62 85.65 -160.07
Gradually Decreased 55.98 59.02 56.97 50.43 39.11 -73.73
Power Factor Correction 28.69 27.79 27.16 26.76 26.38 41.33
No DSTATCOM - - - - - 170.75
The dc capacitor voltage (Vdc) in DERs is stabilized by their dc sources;
however, there is no such a dc source in DSTATCOMs. Vdc in DSTATCOM can be
kept equal to its reference value (Vdc,ref) when the ac system does not exchange any
power with the dc capacitor [91]. This can be reassured if the ac system replenishes
the DSTATCOM converter losses. For this, the angle of the voltage across the ac
filter capacitor (cf) must be varied with respect to the dc capacitor voltage variations
as
2.3 Summary
In this chapter, the primary and secondary control levels for the DERs in a
microgrid are presented. The DERs are all converter-interfaced and voltage-
controlled. The DERs operate in constant power mode when the microgrid is grid-
connected and operate in power sharing mode based on droop during off-grid mode.
The DERs are utilizing an LQR-based state feedback control system which is a
robust and optimal control method. Based on the output active and reactive power of
the DERs, the network voltage and frequency is regulated in the off-grid mode of
operation. Once the voltage and frequency violate the acceptable limits, the
secondary level control takes action to adjust the set points of the droop controller. If
the voltage and frequency fall below the minimum acceptable threshold even after
DSTATdcrefDSTATdcI
PrefDSTATcf VVs
KK
,, (2.66)

Chapter 2: Microgrid Modeling and Hierarchical Control
44
the adjustments are applied by the secondary controller, the non-critical loads need to
be shed to prevent the system collapse. In addition, the secondary control can
dynamically modify the ratio of the active power output of the DERs in off-grid
mode by adjusting the droop control settings. A DSTATCOM can be utilized to
maintain the microgrid voltage both in grid-connected as well as off-grid operation.
Three different control strategies for a DSTATCOM control are discussed.

Chapter 3 Primary and Secondary Level
Control Results
The proposed primary and secondary control levels in Chapter 2 are applied for
a microgrid system and the system performance is investigated in grid-connected and
off-grid modes of operation. Several simulation case studies are built in
PSCAD/EMTDC to verify the operation of the microgrid with the proposed
hierarchical control system. In addition, other issues such as DER resynchronization,
presence of unbalanced and harmonic loads in the microgrid and the dynamic power
sharing ratio adjustment among the DERs are also investigated through these case
studies.
3.1 Microgrid operation in grid-connected and off-grid modes
Let us consider the system shown in Fig. 2.1 to investigate the DERs operation
during grid-connected and off-grid modes. Technical data for this case study is given
in Table 3.1 below. In grid-connected mode, each DER will generate its rated power
and the extra load demand will be supplied by the grid or the excess DER generation
will flow back to the grid. In off-grid mode, the load demand of the microgrid is
shared among the DERs with in the microgrid proportional to their rating. It is to be
noted that the maximum generation capacities of the DERs are not considered in the
preceding study. However, if the system frequency is dropped below the acceptable
level, the load shedding module should disconnect some of the non-critical loads.

Chapter 3: Primary and Secondary Level Control Results
46
Table 3.1 Technical data of the DERs and droop control coefficients for the network
under consideration in Fig. 2.1.
DER Type DER Rating
[kW]
Coupling Inductance
(Lcoup) [mH]
m
[rad/kW]
n
[V/kVAr]
Fuel Cell (DER-1) 4 5.61 1.5708 0.9
PV (DER-2) 3 7.48 2.0944 1.17
Battery (DER-3) 2 11.22 3.1416 1.8
Let us assume in the system shown in Fig. 2.1, CBG and CBM are closed. The
system is assumed to be in steady state condition at t = 0 s and all the DERs are
running at their rated conditions. The DSTATCOM is not connected to the system.
At t = 1 s, the grid is disconnected (i.e. CBG is opened) and the microgrid starts
to operate in off-grid mode. Therefore, the DERs increase their output power to
satisfy the load demand within the microgrid. At t = 2 s a 25% load increase (i.e. 3
kW) and at t = 3 s a load decrease of 25% are applied in the microgrid. It can be seen
that all DERs are sharing the load change proportional to their ratings. At t = 4 s, it is
desired that the microgrid reconnects to the grid. In order to prevent fluctuations in
the current and power, the resynchronization method described in section 2.1.1.6 is
used. The resynchronization is achieved at t = 10.1 s and CBG closes. It can be seen
the system reaches to the steady state condition after each change within 5 cycles.
Fig. 3.1a shows the active power dispatch of grid and the existing DERs in the
microgrid during 0 to 11 seconds in the above-mentioned network while Fig. 3.1b
shows the reactive power dispatch for the same time period.
The voltage profile of the network is also shown in Fig. 3.1c. As it can be seen
in this figure, during the off-grid mode, there might be an uncontrolled voltage
drop/rise in the network, as none of the DERs are regulating the network voltage. In
this research, a DSTATCOM is utilized to regulate the network voltage. To
investigate the efficacy of DSTATCOM, let us now assume that in Fig. 2.1, CBS is
closed and the DSTATCOM is connected. For this condition, the active and reactive
power dispatch of grid and DERs are shown in Fig. 3.2a and Fig. 3.2b, respectively.
The voltage profile of the network is now highly improved and remains close to the
desired value of 1 pu, as shown in Fig. 3.2c. The difference in the active powers in
figures Fig. 3.1a and Fig. 3.2a is due to the fact that voltage is varying before
DSTATCOM installation. The voltage profile of DSTATCOM dc capacitor is shown

Chapter 3: Primary and Secondary Level Control Results
47
in Fig. 3.2d which has a negligible drop of 1% in off-grid mode. The output active
and reactive power of DSTATCOM is also shown in Fig. 3.2e. The oscillations in the
results of Fig. 3.2 are due to the dynamic characteristics of DSTATCOM.
Fig. 3.1 Simulation results for MG before DSTATCOM connection:

Chapter 3: Primary and Secondary Level Control Results
48
Fig. 3.2 Simulation results of MG after DSTATCOM connection:
3.2 DER and microgrid isolation and resynchronization
Another case study is carried out to verify the dynamic performance of DER
converters during getting isolated from the grid and resynchronization before
reconnecting with the grid. It is assumed that the microgrid in section 3.1 is grid-
connected and in steady state condition at t = 0. The technical data of the DERs and
their droop coefficients for this study are given in Table 3.2 below. The rated
capacities of the DERs are selected arbitrarily.
Table 3.2 Technical data of the DERs and droop control coefficients for the network
under consideration in section 3.2.
DER Type DER Rating
[kW]
Coupling Inductance
(Lcoup) [mH]
m
[rad/kW]
n
[V/kVAr]
Fuel Cell (DER-1) 6.6 3.4 0.95 0.54
PV (DER-2) 3.3 6.8 1.9 1.08
Battery (DER-3) 3.3 6.8 1.9 1.08

Chapter 3: Primary and Secondary Level Control Results
49
At t = 1 s, the microgrid main switch (CBM) opens and the microgrid falls into
off-grid mode. At t = 2 s, DER-3 which is supplying 28 % of total load demand (i.e.
4.3 kW), is disconnected from the microgrid. At t = 3 s, the resynchronization of
DER-3 to the microgrid is initiated and at t = 3.68 s, it is connected back to the
microgrid. At t = 4 s, resynchronization of the microgrid to the grid is activated and
at t = 4.15 s, it is reconnected to the grid.
The simulation results are shown in Fig. 3.3. The instantaneous voltage on both
sides of DER-3 circuit breaker and their difference, during reconnection of DER-3 to
the microgrid, are shown in Fig. 3.3a and Fig. 3.3b. The output current of phase-A of
the DERs during reconnection of DER-3 to the microgrid is also shown in Fig. 3.3c.
The instantaneous voltage on both sides of DER-3 circuit breaker and their
difference, during reconnection of the microgrid to the grid, are shown in Fig. 3.3d
and Fig. 3.3e.
DER-3 synchronizes with the microgrid as the voltage difference across DER-3
circuit breaker becomes zero (Fig. 3.3a). The resynchronization takes 0.68 s in the
studied case and due to the proper resynchronization, no abnormal fluctuations are
observed in the output current of DERs (Fig. 3.3c). The microgrid synchronizes with
the grid as the voltage difference across the microgrid main circuit breaker becomes
zero (Fig. 3.3d). The resynchronization takes 0.15 s in the studied case.

Chapter 3: Primary and Secondary Level Control Results
50
Fig. 3.3 Simulation results for resynchronization of DER-3 and the microgrid:
3.3 Microgrid with unbalanced and harmonic loads
For investigating the performance of the microgrid with several converter-
interfaced DERs for different types of loads in the network such as balanced,
unbalanced and harmonic, several case studies are considered. A few of them are
discussed below. The technical data of the DERs and their droop coefficients for this
case study are tabled in Table 3.3 below. The rated capacities of the DERs are
selected arbitrarily.
Table 3.3 Technical data of the DERs and droop control coefficients for the network
under consideration in section 3.3.
DER Type DER Rating
[kW]
Coupling Inductance
(Lcoup) [mH]
m
[rad/kW]
n
[V/kVAr]
Fuel Cell (DER-1) 2 76.2 3.14 1.8
PV (DER-2) 4 38.1 1.57 0.9
Battery (DER-3) 3 49.8 2.05 1.17

Chapter 3: Primary and Secondary Level Control Results
51
3.3.1 Microgrid with unbalanced loads
In this case, let us assume that at t = 0 s CBG, CBM and CBS are closed in the
system shown in Fig. 2.1, and it is in steady state condition. At t = 0.5 s, CBG is
opened to disconnect the grid hence the microgrid operates in off-grid mode.
3.3.1.1 Non-isolated distribution transformer
Let us assume that the circuit breaker in the secondary side of the distribution
transformer still remains connected to the low voltage side. At t = 1.5 s a new single-
phase 2 kW load is connected to phase-A. Later, at t = 2.5 s another single-phase 2
kW load is connected to phase-C.
Fig. 3.4a shows the active power dispatch of the grid and the existing DERs in
the microgrid between 0 and 3.5 seconds in the above-mentioned network. From this
figure, it can be seen that, the total amount of active power generation among DERs
are maintained on the desired power sharing ratio among them.
The active power output of one of the DERs (e.g. DER-1) is shown in Fig. 3.4b
for each phase individually. From this figure, it can be seen that for t < 1.5 s, all three
phases of DER-1 have an equivalent amount of generated active power. However, at
t = 1.5 s when a single-phase load is connected to phase-A, the active power output
of all phases of the DER increases. This increase is slightly higher for phase-A. In a
similar way, at t = 2.5 s when another single-phase load is connected to phase-C, the
output active power of all phases of the DER increases but this increase is more for
phase-C. Similar results are monitored in all the DERs of the microgrid. From this
figure it can be seen that single phase load power demand is shared among the three
phases of the DERs.
Fig. 3.4c shows the active power output of all DERs in their phase-A for the
studied case. From this figure, it can be seen that for a load change in the network,
the contribution of each phase of the DERs in power generation also follows the
desired sharing ratio among them.
It is to be noted that, all phases of the DERs contribute to a single-phase (or
unbalanced) load change in the network since there is a possibility of power
circulation from one phase of microgrid to the other two phases through the windings
of the distribution transformer. Fig. 3.4d shows the active power supplied by the
distribution transformer in the studied case. From this figure, it can be seen that the

Chapter 3: Primary and Secondary Level Control Results
52
distribution transformer output power is zero when the microgrid is working in off-
grid mode with balanced loads (i.e 0.5 < t < 1.5 s). However, it can be seen that for
1.5 < t < 2.5 s there is a negative active power flow into the distribution transformer
in phase-B and C which is circulated and retuned to phase-A where the single phase
load is connected. Similarly, during 2.5 < t < 3.5 s there is a negative active power
flow into the distribution transformer in phase-B which is circulated and retuned to
phase-A and C where the single phase loads are connected to.
The three-phase instantaneous current output of a sample DER (e.g. DER-1) is
shown in Fig. 3.4e which shows the DERs are generating unbalanced current in their
output.

Chapter 3: Primary and Secondary Level Control Results
53
Fig. 3.4 Simulation results of microgrid discussed in section 3.3.1.1.
3.3.1.2 Isolated distribution transformer
Now, let us consider the network of section 3.3.1.1 where the distribution
transformer is isolated from the low voltage side when the grid is disconnected.
Therefore, let us assume that at t = 0.5 s, CBG and CBM open and microgrid
operating in off-grid mode.
As the distribution transformer is isolated from the low voltage side, no power
circulation can take place among the three phases during the off-grid mode operation.
Therefore, it is expected that a single-phase (unbalanced) load change in the network,
the DERs will be contributed only by the same phase of the DER in which the single-
phase load change is applied.
The active power output of one of the DERs (e.g. DER-1) is shown in Fig. 3.5a
for each phase individually. From this figure, it can be seen that for t < 1.5 s, all three
phases of DER-1 have an equivalent amount of generated active power. However, at
t = 1.5 s when a single-phase load is connected to phase-A, only the active power
output of phase-A increases. In a similar way, at t = 2.5 s when another single-phase
load is connected to phase-C, only the output active power of phase-C increases.
Similar results are monitored in all the DERs of the microgrid. From this figure, it
can be seen that single phase load power demand is only supplied by the relevant
single-phase of the DERs.
Fig. 3.5b shows the active power output of all DERs in their phase-A for the
studied case. From this figure, it can be seen that for a load change in the network,
the contribution level of each phase of the DERs in power generation is based on the
desired sharing ratio among them.
Fig. 3.5c shows the active power supplied by the distribution transformer in the
studied case. As the transformer is isolated at t = 0.5 s, its output power becomes
zero.

Chapter 3: Primary and Secondary Level Control Results
54
The three-phase instantaneous current output of a sample DER (e.g. DER-1) is
shown in Fig. 3.5d which shows the DERs are generating unbalanced current in their
output.
Fig. 3.5 Simulation results of microgrid considered in section 3.3.1.2.
3.3.2 Microgrid with harmonic loads
In this section, let us consider the microgrid of Fig. 2.1 with a three phase
harmonic load. The system is in steady state condition at t = 0 s and at t = 0.5 s, the
grid is disconnected (i.e. CBG is opened) and the microgrid will work in off-grid
mode. At t = 1.5 s a new three-phase harmonic load of 3 kW is connected to the
network. At t = 2.5 s, its demand is increased to 6 kW. The harmonic load has a Total

Chapter 3: Primary and Secondary Level Control Results
55
Harmonic Distortion (THD) of 25.5% as shown in the Fast Fourier Transform (FFT)
Spectrum in Fig. 3.6a.
Fig. 3.6b shows the active power dispatch of the grid and the existing DERs in
the microgrid between 0 and 3.5 seconds in the above-mentioned network. The
single-phase active power output of one of the DERs (e.g. DER-1) is shown in Fig.
3.6c. This is same for all phases of A, B and C. The active power output in phase-A
of all three DERs are also shown in Fig. 3.6d. From these figures, it can be seen that
as the load is supplied from the three-phase network, its demand is shared equally
among the three phases of each DER. However, the DERs share the extra demand
based on their desired power sharing ratio.
The three-phase instantaneous current output of a sample DER (e.g. DER-1) is
shown in Fig. 3.6e which shows the output current of the DERs are distorted as
required by the network harmonic load.

Chapter 3: Primary and Secondary Level Control Results
56
Fig. 3.6 Simulation results of microgrid considered in section 3.3.2:.
3.4 Droop curve adjustment in microgrid
The microgrid system shown in Fig. 2.1 with 2 DERs (i.e. DER-1 and DER-2)
is considered in order to investigate the performance of the proposed microgrid
central controller. The DSTATCOM is disconnected and the DERs are responsible
for regulating the system voltage during off-grid mode. The single line diagram of
the considered network is shown in Fig. 3.7. The parameters of network, DER
converters and filters, coupling inductances, loads and the droop control coefficients
are given in Table 3.4. It is to be noted that the droop coefficient “n” has been
selected ten times greater than the normal value in order to exaggerate the terminal
voltage variation to show the effectiveness of the secondary controller.
MV Grid
~
DER1
DER2
L
CBG
Z1
T1
PG , QG
MGMV Feeder
CBM
Fig. 3.7 Structure of the microgrid under consideration.
Table 3.4 Technical data of the DERs and droop control coefficients for the network
under consideration in Fig. 3.7.
DER Type DER Rating
[kW]
Coupling Inductance
(Lcoup) [mH]
m
[rad/kW]
n
[V/kVAr]
DER-1 2 2.72 3.14 18
DER-2 4 1.36 1.57 9

Chapter 3: Primary and Secondary Level Control Results
57
3.4.1 Off-grid microgrid within acceptable voltage and frequency
It is assumed that the microgrid system is initially in steady-state condition,
with a total load demand of approximately 0.41 pu where 1 pu is 6 kW. At t = 0.5 s,
this load is increased to 1 pu and at t = 1 s, the network load is decreased to 0.53 pu.
At t = 1.5 s, the load is further decreased to 0.17 pu.
The output active power ratio among DER-1 and 2, is maintained to 1:2, as
assigned by the central controller (Fig. 3.8a) for all load changes. The microgrid
voltage is within the acceptable limits during all load changes as shown in Fig. 3.8c.
Similarly, the microgrid frequency is also within the acceptable limits during all load
changes as shown in Fig. 3.8d. Hence, the central controller does not issue any new
control commands and Vrated is kept as 1 pu (Fig. 3.8e) while the frated is kept as 50 Hz
(Fig. 3.8f).

Chapter 3: Primary and Secondary Level Control Results
58
Fig. 3.8 Simulation results for considered microgrid in section 3.4.1:
3.4.2 Off-grid microgrid with unacceptable voltage and frequency
Now, let us assume that the microgrid system is initially in steady-state
condition, with a total load demand of approximately 0.15 pu where 1 pu is 18 kW.
The output power of DERs is maintained as 1:2, as assigned by the central controller
(Fig. 3.9a).
At t = 0.5 s, the load is increased to 0.4 pu (Fig. 3.9b) and consequently, the
network voltage drops to 0.89 pu (Fig. 3.9c) which is below the acceptable limit of
0.9 pu. The microgrid frequency is still within the acceptable range (Fig. 3.9d). Since
the central controller operates with a larger time step, as discussed before, it modifies
Vrated for the system (Fig. 3.9e) at the first operating time after the load change (i.e. t
= 1 s). Hence, Vrated is updated to 1.1. It can be seen that, as the central controller
increases the voltage reference for the droop control, the network voltage is restored
to 1 pu.
At t = 1.5 s, another load increase is applied and the system undergoes the
same sequence of events as at t = 0.5 s. The central controller increases the voltage
reference to recover the voltage drop at t = 2.0 s. In this case, the microgrid
frequency decreases beyond its acceptable limit and hence the central controller
updates frated to 51.9 Hz at t = 2.6 s (Fig. 3.9f). Therefore, the microgrid frequency is
restored back to 50 Hz t = 2.6 s. It is to be noted that since the loads were modelled
as constant impedance load, after each Vrated increase at t = 1 and t = 2 s, the load
active power consumption is also increased.
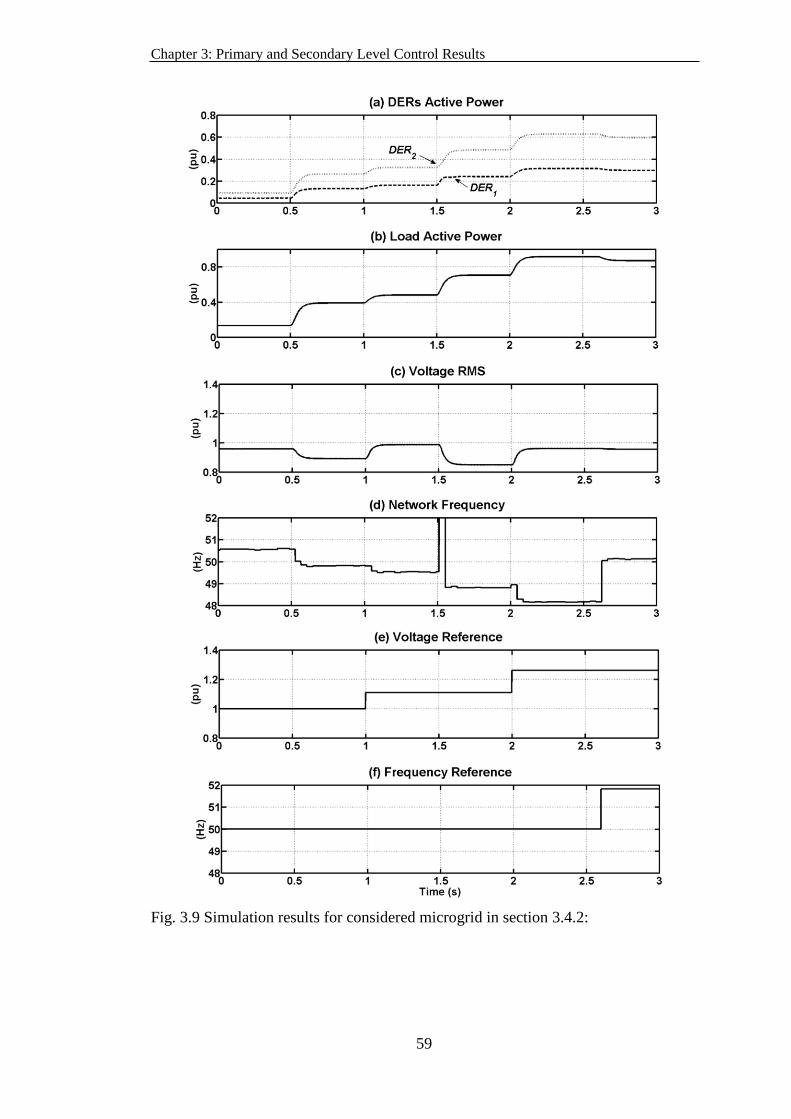
Chapter 3: Primary and Secondary Level Control Results
59
Fig. 3.9 Simulation results for considered microgrid in section 3.4.2:

Chapter 3: Primary and Secondary Level Control Results
60
3.5 Dynamic power ratio adjustment in microgrid
It is assumed that, at t = 0 s, the microgrid system is in steady-state condition.
The two DERs have the same coupling inductance of LT1 = LT2 = 6.8 mH at their
outputs. Initially, the tertiary controller has defined the output active power ratio
among DER1:DER2 to be 1:2 (Fig. 3.10a). Hence, the droop coefficient ratio of the
two DERs is selected as mDER1/mDER2 = 2/1 (Fig. 3.10b). In addition, it selects
Prated1/Prated2 = 2/1. These two ratios are passed to the primary controllers of each
DER system.
At t = 0.5 s, the tertiary controller changes the output active power ratio among
DER1:DER2 to be as 1:1 and passes this information to the central controller. Hence,
the P-f droop coefficients ratio and rated active power ratio between the two DERs
are selected as mDER1/mDER2 = 1/1 and Prated1/Prated2 = 1/1 and then passed to the
primary controllers of each DER system.
At t = 1 s, the tertiary controller orders the microgrid central controller to
facilitate the active power output ratio among DER1:DER2 to be as 3:1. Hence, the
droop coefficient ratio and rated active power ratio between the two DERs are
selected as mDER1/mDER2 = 1/3 and Prated1/Prated2 = 1/3 and then passed to the primary
controllers of each DER system.
Fig. 3.10 Simulation results for considered microgrid in section 3.5:

Chapter 3: Primary and Secondary Level Control Results
61
3.6 Summary
In this chapter, the demonstrated simulation case studies verified the proper
dynamic operation of the DERs through the proposed hierarchical control system.
The DERs can be connected to the microgrid with minimum transients with the help
of the developed synchronization technique. The DERs based on the voltage-
controlled concept can supply the harmonic and unbalanced loads in the network
without any further complexity in the reference generation process. In grid-connected
mode of operation, the DERs generate the maximum (rated) power while they
effectively share the local load in off-grid mode based on the designed droop
settings. The secondary level control successfully adjusts the microgrid voltage and
frequency if they are violated the acceptable limits. In addition, the secondary control
is capable of adjusting the active power sharing ratio among the DERs, in case it is
desired.


Chapter 4 Interconnecting Neighboring
Microgrids
This chapter discusses the dynamic operation and control of DERs in the
system of interconnected microgrids. When several microgrids are located nearby,
interconnection of two or more such neighboring off-grid microgrids can effectively
reduce the load shedding requirement in a microgrid which has power deficiency, if
the neighboring microgrids have excess generation capacity. Microgrids
interconnection command is issued by the network tertiary controller, which is
beyond the scope of this chapter. Several case studies are carried out in
PSCAD/EMTDC to verify the successful operation of the DERs in the system of
interconnected microgrids.
4.1 Requirement of interconnecting neighboring microgrids
It is expected that in the near future, there will be several microgrids in each
distribution network. They will be located in a neighborhood and the networks will
be facilitated with self-healing capabilities. In such a scenario, an off-grid operation
of a microgrid is not anymore desired and the concept of microgrids supporting each
other becomes more viable option. If the DERs generation capacity in an off-grid
microgrid is less than the local load demand but there is surplus generation capacity
in DERs of neighboring off-grid microgrids, interconnecting these two microgrids
can reduce the load shedding requirement in the microgird with deficiency of
generation. In the system of interconnected microgrids, the DERs should be properly
controlled to share the total load demand in the interconnected system. The following
assumptions are required when interconnecting two such off-grid microgrids:
Availability of communication infrastructure among DERs, protection devices
and circuit breakers,

Chapter 4: Interconnecting Neighboring Microgrids
64
Self-healing capability in the network,
Surplus generation capacity in the DERs in one of the microgrids,
Possibility of bypassing some of the current technical requirements for DER
interconnection.
The main contribution of this chapter is demonstrating that the developed and
proposed primary control level for DER converters in Chapter 2 neither results any
undesired dynamic performance nor instability in DER operations when
interconnecting two or more off-grid neighboring microgrids together forming a
cluster of microgrid.
It is to be noted that the linear quadratic regulator (LQR) based technique is
utilized for controlling the DER converters instead of the traditional PID based
controllers. The main characteristic of the PID based controllers is their dependency
on the network and the load parameters. Therefore, tuning the PID control
parameters is vital to achieve an acceptable dynamic performance [90][92][93]. In
case of interconnected microgrids, the initially tuned PID control parameters may not
result in an acceptable dynamic performance and even may lead to instability due to
the changes take place in the network parameters. Therefore, an adaptive or
intelligent PID controls are required which increase the complexity of the controller.
However, LQR is an optimal and robust controller [90] and its control parameters
only depend on the DER converter parameters and are independent from network
and load characteristics. In addition, a per-phase (i.e. abc) based control technique is
utilized in this research instead of the traditional dq transformation in which a PID
controller is not effective in tracking sinusoidal waveforms. Using the proposed per-
phase control technique, even unbalanced systems can be phase controlled
individually. These are the main advantages of the developed and proposed primary
control level in Chapter 2 with regard to the existing DER converter control
strategies. Using the proposed and developed control technique, the desired dynamic
performance of DER converters is achieved in the interconnected off-grid microgrids
operation.
4.2 System of interconnected off-grid microgrids
Let us consider a medium voltage feeder connected to two low voltage
microgrids, namely MG-1 and MG-2, through distribution transformers T1 and T2,

Chapter 4: Interconnecting Neighboring Microgrids
65
as shown in Fig. 4.1. MG-1 has 3 DERs (i.e. DER1 to DER3) and 5 loads while MG-
2 has 2 DERs (i.e. DER4 to DER5) and 4 loads. A DSTATCOM is installed at the
secondary side of the distribution transformer in each microgrid to regulate the
voltage at its pcc. The loads are assumed to be residential loads and all DERs are
assumed to be converter-interfaced DERs.
MV Grid
~
DER1
DER2
DER3
L13
L12L
11L
14L
15
CBM1
CBM2
CBG
DER4
DER5
L22
L23L
24L
21
Z1
Z2
T1
T2
PF2
QF2
PF1
QF1
PG , QG
MG-2
MG-1
DSTAT1 DSTAT2
CBS1
CBS2
MV Feeder
Fig. 4.1 Structure of the interconnected microgrid system.
During grid connected mode, all DERs will be operating at their rated
capacities or the capacities determined by the economic analyses. During planned
maintenance or unplanned fault situations on the medium voltage feeder, the
microgrids will operate in off-grid mode. In this mode, when CBM1 and CBM2 are
open, the DERs in each microgrid will share the loads of that microgrid individually.
If the load demand in one microgrid is higher than the generation capacity of the
DERs in that microgrid, load shedding must be applied to some of the (non-critical)
loads in that microgrid.
Now, let us assume a scenario in which the power generation in MG-2 is less
than its demand; while the power generation capacity of the DERs in MG-1 is higher
than its demand. Assuming the network has self-healing and automatic supply
restoration capability, CBM1 and CBM2 can be closed while CBG will remain open. In
this way, the two microgrids will be interconnected together. Hence, the DERs in
MG-1 can share some of the loads in MG-2 and prevent/reduce load shedding in
MG-2.

Chapter 4: Interconnecting Neighboring Microgrids
66
As an example, let us assume that in system shown in Fig. 4.1, at t = 0 s, circuit
breakers CBG, CBM1, CBM2, CBS1 and CBS2 are closed and the network is at steady
state condition. The considered system has self-healing capability. Now, let us also
assume that due to a fault in the medium voltage grid, after self-healing process, CBG
is open while CBM1 and CBM2 are closed at t = 1. As mentioned before, the operation
of the protection devices and circuit breakers and resynchronization of
interconnecting microgrids during self-healing process is beyond the scope of this
study. In this study, this transition period is not considered. At t = 2 s a load increase
of 25% and at t = 3 s a load decrease of 25% are also applied in MG-1.
The total active power supply from the grid in addition to the active power
flow into each microgrid is shown in Fig. 4.2a. From this figure, it can be seen that
MG-2 has a negative power flow and is delivering, approximately, 20% of the load
demand in MG-1. The active power output of all the DERs in MG-1 and MG-2 are
shown separately in Fig. 4.2b and Fig. 4.2c, respectively. It can be seen that all DERs
in MG-1 and MG-2 are sharing the load demand of the system of interconnected
microgrids proportional to their ratings. The voltage profile in the secondary side of
the distribution transformers in each microgrid is regulated to the desired value of 1
pu as shown in Fig. 4.2d and Fig. 4.2e. The active and reactive power drawn by a
sample load in the network, with a 2.7 kW demand and power factor of 0.95, is also
shown in Fig. 4.2f.
Now, let us assume another case in which the two DERs in MG-2 are running
in their maximum capacity (i.e. 4 and 8 kW, respectively). Let us also assume that at
t = 1 s, due to a fault in the medium voltage, CBG is open while CBM1 and CBM2 are
closed as in the previous case. It is to be noted that the self-healing transition period
is not considered in this study. A 25% load increase and decrease in the network is
applied at t = 2 and 3 s, respectively.
For this case, the total active power supply from the grid in addition to the
active power flow into each microgrid is shown in Fig. 4.3a. From this figure, it can
be seen that MG-1 has a negative power flow and is delivering, approximately, 30%
of the load demand in MG-2. The active power output of all the DERs in MG-1 and
MG-2 are shown separately in Fig. 4.3b and Fig. 4.3c, respectively. It can be seen
that all DERs in MG-2 are running in their maximum rating at all times while the
DERs in MG-1 are sharing the rest of the network load demand proportional to their
ratings.

Chapter 4: Interconnecting Neighboring Microgrids
67
Fig. 4.2 Simulation results for system of interconnected MG-1 and MG-2:

Chapter 4: Interconnecting Neighboring Microgrids
68
Fig. 4.3 Simulation results for the system of interconnected MG-1 and MG-2 when
MG-2 DERs operate at their maximum capacity:
4.3 Large feeder with multiple interconnected microgrids
Now, let us assume a larger medium voltage feeder with self-healing capability
with the single line diagram as shown in Fig. 4.4. The assumed network contains 9
microgrids which can be interconnected at certain times to fulfill the power demand
requirement of each other. Each microgrid is a combination of several DERs and
loads plus a DSTATCOM at the secondary side of their distribution transformer.

Chapter 4: Interconnecting Neighboring Microgrids
69
Fig
. 4.4
Sch
ematic d
iagram
of th
e large m
ediu
m v
oltag
e feeder w
ith self-h
ealing cap
ability
contain
ing sev
eral interco
nnected
micro
grid
s.
MV
Grid
~
CB
M1
CB
GZ
1Z
2
T1
PF
11
PG
MG
-1
DE
R
DST
AT
1
CB
M1
CB
M1
Z3
Z4
T3
T4
PF
14
PF
13
MG
-4DE
R
DST
AT
4
MG
-3
DE
R
DST
AT
3
Zo
ne-1
CB
M1
T2
PF
12
MG
-2DE
R
DST
AT
2
CB
M2
Z7
T5
PF
21
MG
-5
DE
R
DST
AT
5
CB
M2
CB
M2
Z8
T6
PF
22
MG
-6
DE
R
DST
AT
6
CB
M2
Z9
T7
PF
23
MG
-7
DE
R
DST
AT
7
CB
M3
Z11
T8
PF
31
MG
-8
DE
R
DST
AT
8
CB
M3
Z12
T9
PF
32
MG
-9
DE
R
DST
AT
9
CB
M3
Z5
Z6
Z10
Zon
e-3
Zo
ne-2
CB
M1
PZ
on
e2
PZ
on
e3

Chapter 4: Interconnecting Neighboring Microgrids
70
The network is divided into 3 zones by proper installation and coordination of
circuit breakers CBG, CBM1, CBM2 and CBM3, as shown in this figure. This zone
forming can be achieved by deploying the required protection and communication
infrastructure, which is not the scope of this study.
Now, let us assume at t = 0 s the network is in steady state condition and all the
circuit breakers are closed. In case of a fault within any microgrid, the faulty
microgrid can be isolated from the rest of the network by the proper operation of the
low voltage circuit breaker, located in the secondary side of the distribution
transformer, of the relevant microgrid. Let us assume at t = 0.5 s, a fault is occurred
on the medium voltage feeder which is cleared at t = 1 s. Based on the fault location,
three separate cases are considered as below:
Case 1: The fault is on the medium voltage feeder within Zone-2.
Case 2: The fault is on the medium voltage feeder within Zone-1.
Case 3: The fault is on the medium voltage grid (i.e. upstream of Zone-1).
For case 1, when the fault is within Zone-2, it is expected that, based on the
protection and circuit breaker coordination and self-healing process, CBM2 to be
opened while all other circuit breakers are closed. In such a case, the DERs in MG-5,
MG-6 and MG-7 have to independently supply their local load demand and a load
shedding is required if their generation capacity is less than their load demand. At t =
1 s, CBM2 is reclosed after the fault is cleared. Fig. 4.5 shows the simulation results
of the network for this case. The active power supplied from the grid in addition to
the power supplied to Zone-2 and Zone-3 are shown individually in Fig. 4.5a. The
active power flow into each microgrid feeder is also shown for all three zones
separately, in Fig. 4.5b to Fig. 4.5d. From Fig. 4.5c, it can be seen that the active
power flow into the microgrids within Zone-2 becomes zero between 0.5 and 1
second as CBM2 is opened, while no power variation is observed in Zone-1 and Zone-
3 microgrids.

Chapter 4: Interconnecting Neighboring Microgrids
71
Fig. 4.5 Simulation results for the network in case 1:
For case 2, when the fault is within Zone-1, it is expected CBG and CBM1 to be
opened while all other circuit breakers are closed. In such a case, the DERs in MG-1
to MG-4 have to independently supply their local load demand. However, as Zone-2
and Zone-3 microgrids are interconnected, they can share the load demand altogether
and this will prevent or reduce the load shedding for the loads of these two zones.
Fig. 4.6 shows the simulation results for the network in this case. The active power
supplied from the grid in addition to the power supplied to Zone-2 and Zone-3 are
shown individually in Fig. 4.6a. The active power flow into each microgrid feeder is
also shown for all three zones separately, in Fig. 4.6b to Fig. 4.6d. From the
simulation results, it can be seen that the active power flow into the microgrids
within Zone-1 becomes zero between 0.5 and 1 second as CBG and CBM1 are opened.
In addition, it can be seen that the DERs in MG-6, MG-8 and MG-9 have negative
power flow. This indicates that these microgrids are delivering some portion of the
loads within MG-5 and MG-7 in addition to their local loads. If this interconnection
was not possible, then load shedding was inevitable for MG-5 and MG-7.

Chapter 4: Interconnecting Neighboring Microgrids
72
Fig. 4.6 Simulation results for the network in case 2:
For case 3, when the fault is in the upstream of Zone-1, it is expected only CBG
to be opened while all other circuit breakers are closed. In such a case, the microgrids
in all three zones are interconnected and their DERs will share the load demand
altogether. Hence, the load shedding for the loads of these three zones will be
prevented or reduced. Fig. 4.7 shows the simulation results for the network in this
case. The active power supplied from the grid in addition to the power supplied to
Zone-2 and Zone-3 are shown individually in Fig. 4.7a. The active power flow into
each microgrid feeder is also shown for all three zones separately, in Fig. 4.7b to Fig.
4.7d. From the simulation results, it can be seen that the active power flow supplied
by the grid becomes zero between 0.5 and 1 second as CBG is opened. Therefore, all
DERs in the microgrids will increase their output power to pick up the required extra
demand. From the simulation results, it can be seen that MG-3 and MG-9 have zero

Chapter 4: Interconnecting Neighboring Microgrids
73
active power flow. This indicates that all the generation capacity of their DERs is
consumed by their local loads. On the other hand, it can be seen that MG-2, MG-4
and MG-8 have negative power flow. This indicates that these microgrids are
delivering some portion of the loads within MG-1, MG-5, MG-6 and MG-7 in
addition to their local loads. If this interconnection was not possible, then load
shedding was inevitable for these microgrids. This verifies the efficacy of the
proposed operation and control of the DER converters in the system of
interconnected microgrids.
Fig. 4.7 Simulation results for the network in case 3:

Chapter 4: Interconnecting Neighboring Microgrids
74
4.4 Summary
In this chapter, through several simulation case studies, it is shown that two or
more neighboring microgrids can successfully interconnect to each other in a smart
grid network with self-healing capability. It is verified that the proposed primary
control level for the DERs in Chapter 2 can successfully be employed by the DERs
when the neighboring microgrids are interconnected. Based on this concept, it was
shown that a large medium voltage feeder, can be successfully divided into several
microgrid clusters containing few interconnected microgrids, in the event of a main
grid failure.

Chapter 5 Microgrids with Single-phase DERs
The operation and control of single-phase DERs, distributed arbitrary among
the three phases of a microgrid system are presented in this chapter. The power
circulation mechanisms to circulate the excess generated single-phase power from
one phase to the other phase(s) are discussed in detail. Through the simulation
studies in PSCAD/EMTDC, it is verified that a microgrid with single phase DERs
can operate successfully by supporting the loads in all the phases, by circulating the
power to other phase through the proposed power circulation strategy.
5.1 Network under consideration
A group of residential neighboring houses are considered to form a house
community, namely community-1, as shown in Fig. 5.1. It is supplied from a
medium voltage feeder through a three-phase delta/wye-grounded (Dyn-type)
distribution transformer, which is the common practice in Australia [94]. The houses
are assumed to have single-phase supply and some of them are assumed to have
converter-interfaced grid-connected DERs. The community acts as a three-phase
microgrid and can operate in either grid-connected or off-grid mode. The microgrid
connects to the grid or disconnects from the grid through a static transfer switch,
referred to as microgrid main switch, which is installed in the upstream of the
distribution transformer.

Chapter 5: Microgrids with Single-phase DERs
76
DER4 DER3
MV Grid
~
CB2
CB1
T1
PF1
QF1
PG , QG
DSTATCOM1
CB4
Community -1 (MG- 1)
CB3
MV Feeder
DER2DER1
Phase-A
Phase-C
Phase-B
Fig. 5.1 Schematic diagram of the network under consideration.
It is assumed that four houses in community-1 are equipped with single-phase
DERs and all are running in voltage-control mode. All the DERs are assumed to have
energy storages with sufficient storage capacity.
A low voltage DSTATCOM is assumed to be installed at the secondary side of
the distribution transformer, to regulate the voltage at its pcc as proposed in Chapter
2.
The single-phase DERs are connected to the low voltage network through
VSCs with LCL filter at their output, as shown in Fig. 2.6a. The single-phase DER
converter consists of a single-phase H-bridge, using IGBTs. Each IGBT has proper
anti-parallel diode, snubber and protection circuits. The outputs of the H-bridge are
connected to a single-phase transformer, with 1: a ratio. The transformer provides
voltage boosting as well as galvanic isolation. The switching losses in the IGBTs and
the core loss in the transformer are the main sources of power loss of the DER
converter.
5.2 Interphase power circulation
The DERs in Fig. 5.1 are assumed to be single-phase and unequally distributed
amongst the phases. Therefore, it is required to circulate the power generated by the
DERs from the phase in which they are connected to the other phases with more load
demand. This is referred to as interphase power circulation, in this thesis. In case the
interphase power circulation is not available in the network, the three phases of the
Chapter 5: Microgrids with Single-phase DERs
77
microgrid will perform as three individual single-phase networks during off-grid
operation. In such a condition, the loads in the phases with less DER generation
capacity need to be shed to maintain the voltage and frequency of that phase within
the acceptable limits. The interphase power circulation is achieved in two different
methods, as introduced below:
5.2.1 Power circulation through distribution transformer
Interphase power circulation through a transformer is based on the concept of
interphase coupling among the three windings in the transformer secondary. For a
three-phase distribution transformer composed of a 3-limb unified magnetic core
[95], each secondary winding has an interphase coupling with the other secondary
windings. Therefore, the flux generated by a particular phase flows throughout the
core and contribute for inducing voltage in the other secondary windings. For a
three-phase distribution transformer composed of three single-phase transformers,
there are three separate cores; hence, there is no interphase coupling among the
secondary windings, unless the primary windings are connected in delta.
To hold a three-phase balanced voltage across the secondary terminals of the
distribution transformer, a three-phase DSTATCOM is connected to the terminals.
Under such conditions, if a single-phase DER is connected to one terminal and a load
is connected to another terminal, the interphase power circulation takes place through
the distribution transformer; hence, the load will be supplied by the single-phase
DER in the other phase.
However, in this mode of operation, the distribution transformer experiences an
excessive unbalanced condition and hence it may operate while it is heavily
saturated. Hence the losses take place within the transformer could be significant.
Further, at least two phases of the transformer secondary needs to be energized with
proper voltages in order to obtain correct voltage across the third phase with the
required phase difference. Additionally, there can be security and safety concerns
involves with leaving the distribution transformer energized. Alternatively, the power
circulation can be achieved through the DSTATCOM, which is described in detail
below.

Chapter 5: Microgrids with Single-phase DERs
78
5.2.2 Power circulation through DSTATCOM
Alternatively, a DSTATCOM can be used to provide current (power)
circulation among the phases. DSTATCOM can be connected to medium voltage as
well as the low voltage feeders. This is shown schematically in Fig. 5.2.
ZF
132/11 kV
Transformer
ZF
vT
11 kV/410 V
Transformer
iT
Single-phase
Loads and DERs
upstream downstream
(b)
CB
ZF
132/11 kV
Transformer
vT
11 kV/410 V
Transformer
iT
Single-phase
Loads and DERs
upstream
downstream
(a)
CB
Zf
LV
DSTATCOM
and Filter
MV
DSTATCOM
and Filter
Fig. 5.2 Schematic diagram of a distribution network with DSTATCOM installed in:
(a) low voltage feeder and (b) medium voltage feeder.
The main advantage of installing a DSTATCOM in a low voltage feeder is the
elimination of the unbalance reverse power flow into the medium voltage network
due to the unbalance excess generation of the single phase DERs connected to
different phases. However, installation of a few DSTATCOMs in several adjoining
low voltage feeders, supplied by the same medium voltage line, is not cost-effective.
Hence, reduction in the initial investment costs is the main advantage of installing a
DSTATCOM in the medium voltage feeder. In general, several criteria can be
considered in choosing the connection of DSTATCOM to a low voltage or medium
voltage feeder such as:

Chapter 5: Microgrids with Single-phase DERs
79
Economic concerns: The cost of a DSTATCOM is highly dependent on its rating.
Similar to other electrical devices, this cost increases significantly by the increase
of the DSTATCOM rating. Hence, economic analyses can lead to choosing
among the two options of installing one DSTATCOM, with a higher rating, in the
medium voltage feeder or several DSTATCOMs, each with a smaller rating, in
the low voltage feeders.
The level and frequency of reverse power flow in the feeder: The reverse power
flow may be experienced more frequently in the low voltage feeders with higher
percentage. However, it may be neither very frequent nor a high percentage in the
medium voltage feeders. Therefore, the level of reverse power flow in the
medium voltage line can sometimes be insignificant while it is significant in
some low voltage lines.
Reliability concerns: Failure of a DSTATCOM in a low voltage feeder may only
interrupt the power supply to a few customers in the feeder, however; its failure
in a medium voltage feeder may result in power interruption to a larger number
of customers of the medium voltage feeder.
Operational and maintenance concerns: A DSTATCOM installed in a low
voltage feeder will have less operational and maintenance costs and lower
hazards for the personnel under hot line practices, in comparison to those of the
medium voltage installation.
Two different topologies are considered for the DSTATCOM– one when it is
used in low voltage feeder and the other when it is used in medium voltage feeder.
The positioning of the boosting transformer in the output of the DSTATCOM is
different for medium voltage and low voltage applications. This changes the filter
characteristic in the output of the DSTATCOM. In this section, it is shown that
voltage control strategy is suitable for low voltage applications from the output
passive filter arrangement point of view. On the other hand, it is shown that current
control strategy is well suited for medium voltage applications, considering the same.
The current and voltage output references of the DSTATCOM are generated
such that a set of balanced currents are drawn from the upstream side, while
facilitating the circulation of reverse power flow among the phases. In addition, the
used topology for low voltage application provides a reliable path among the phases
in off-grid applications. Hence, when the low voltage feeder is isolated from the

Chapter 5: Microgrids with Single-phase DERs
80
upstream side, the single-phase DERs, controlled in droop, can manage the power
demand of the three-phase network irrespective to the phase they are connected. This
is a novel application of DSTATCOM in addition to voltage control
[96][97][98][99].
The main aim of the DSTATCOM, either in low voltage or in medium voltage,
is to force the upstream currents balanced irrespective of the power flow in its
downstream side. To achieve this, the DSTATCOM must circulate power from one
phase to the other. In other words, it forces the power from the phase with excess
generation to flow to the other phase(s) to avoid reverse power flow in that phase.
Even when there is no reverse power flow and the power to the load is supplied by
the grid, the DSTATCOM balances the upstream currents, but this also occurs as the
power is circulated amongst the phases, through the DSTATCOM.
5.2.2.1 DSTATCOM in low voltage feeder
Let us consider a case that the distribution transformer is isolated form the
downstream side when the microgrid operates in off-grid mode. In this case, the
interphase power circulation is not available through the distribution transformer.
However, it can be accomplished through the DSTATCOM [98]. For this purpose,
the DSTATCOM is required to have a common dc bus, connected to the VSCs of all
three phases. Note that, the structure of three single-phase DSTATCOMs, with three
separate dc buses, cannot be utilized for this purpose.
Fig. 5.3 shows a three-phase DSTATCOM topology to be connected to the low
voltage feeder. This DSTATCOM is connected to a common dc bus, which regulates
its pcc to a balanced three-phase voltage of 1 pu. Since the transformer is isolated
(i.e. CB-TP and CB-TS are open), the currents in the upstream of the DSTATCOM
are all zero (itr_a = itr_b = itr_c = 0). Then, the KCL at DSTATCOM pcc is written as
ccdstat
bbdstat
aadstat
cctrcdstat
bbtrbdstat
aatradstat
ii
ii
ii
iii
iii
iii
_
_
_
__
__
__
0
0
0
(5.1)

Chapter 5: Microgrids with Single-phase DERs
81
Zfb
Zfa
DSTATCOM
Load-2
iga
ic
CB-TP CB-TS
idstat_a
idstat_b
idstat_c
itr_a
itr_b
itr_cY– Zfc
ib
ia
Load-1
DER
Fig. 5.3 Simplified network under consideration for power circulation through a
DSTATCOM.
On the other hand, the three VSCs in the DSTATCOM are connected to a
common dc bus and they are wye-connected through the three single-phase isolating
transformers. Hence, the DSTATCOM consists a closed boundary circuit and based
on KCL, the sum of the currents leaving this closed boundary is zero (i.e. idstat_a +
idstat_b + idstat_c = 0). Therefore, ia = – (ib + ic). On the other hand, as ia = – iga, it is
concluded that iga = ib + ic. This verifies that the loads in phase-B and C are supplied
by the DER in phase-A and the interphase power circulation takes place through the
DSTATCOM [98].
The main aim of the DSTATCOM is to force the upstream currents to be
balanced irrespective of the power flow in its downstream side. This guarantees a
proper power circulation through the DSTATCOM. To have a balanced set of current
flowing in the medium voltage feeder, the voltage at the pcc of the DSTATCOM
must be balanced. This can be achieved by controlling the DSTATCOM such that it
generates and holds a balanced set of voltage at its pcc. A voltage control technique
is utilized to hold a balanced set of voltages across the three filter capacitors (Cf).
The three-phase reference voltage will then be [100]
Tref
AcfDSTAT
ref
ABCcf E ]1[][ 2
, V (5.2)
where EDSTAT is the desired phase rms voltage for the pcc (i.e. 240 V in this study),
δcf,A is the angle of the terminal voltage, vTA and = 1 120º. This voltage is used as
the reference for converter control, as discussed in the next section. The
DSTATCOM exchanges reactive power with the low voltage feeder to hold the
desired voltage at its pcc.
The main assumption above is the presence of a balanced voltage at the
secondary side of the distribution transformer. This may not be true in a real network

Chapter 5: Microgrids with Single-phase DERs
82
where a medium voltage feeder supplies several low voltage feeders and each low
voltage feeder injects some power back into the medium voltage feeder. In such a
case, the medium voltage feeder may induce unbalanced voltages at the secondary
side of the distribution transformer. Hence, installing one DSTATCOM at one of the
low voltage feeders will not guarantee a set of balanced currents to flow in the
upstream of the DSTATCOM. Thereby, a DSTATCOM is required to be installed in
every low voltage feeder in which single-phase DERs are connected. This will
restrict the injection of reverse power flow into the medium voltage feeder.
5.2.2.2 DSTATCOM in medium voltage feeder
Now, let us assume that the DSATATCOM is connected to the medium
voltage feeder. Fig. 5.4 shows the DSTATCOM topology connected to the medium
voltage feeder. A voltage control strategy, similar to the one discussed in section
5.2.2.1 can be utilized. However, in section 5.6, through simulation studies, it will be
shown that although the DSTATCOM will have an acceptable level of tracking of
the voltage across Cf, due to the leakage inductance of the coupling transformers, the
DSTATCOM pcc voltage is not perfectly balanced. Hence, a balanced set of currents
will not be observed in the upstream side.
Vdc
Rf
Lf
Cf
Rf
Lf
Rf
Lf
S1
S1
S2
S2
1:a
Cf Cf
VT,a VT,b VT,c
iT,a iT,b iT,c
1:a 1:a
vcficf
if
+
Fig. 5.4 Topology of the DSTATCOM connected to the medium voltage feeder

Chapter 5: Microgrids with Single-phase DERs
83
To avoid this problem, a current control strategy is utilized. In this method, the
proper references for the output current for each phase of the DSTATCOM are
calculated and the DSTATCOM is controlled to ensure the desired current is injected
into the pcc.
The reference output currents of the DSTATCOM are generated such that
power circulation takes place between the phases. As a consequence, the upstream
currents become balanced. For this purpose, the theory of instantaneous symmetrical
component is utilized [101]. In order to apply this theory, first the fundamental
positive sequence of the pcc voltage is obtained [102]. Let the instantaneous positive
sequence voltages be denoted by vA1, vB1 and vC1. The reference currents can then be
calculated as [91]
ABC
CBA
LCCLBBLAAABCL
ref
ABCT vvvv
ivivivii ][][][ 12
1
2
1
2
1
111
(5.3)
where iL is the current in the downstream of DSTATCOM. This current is used as the
reference for converter control.
Let us consider only one phase of the DSTATCOM circuit shown in Fig. 5.4,
in which the state vector is defined as [90]
T
cffT tvtititx )()()()( (5.4)
where iT is the output current of the DSTATCOM. Then, the state space equation of
the system is written as
)()(
)()()()( 21
tCxty
tvBtuBtAxtx Tc
(5.5)
where
001
001
00
,
0
10
00
2
1
C
LB
aL
VB
C
a
C
a
aLL
R
L
a
AT
T
T
f
dc
ff
ff
f
T
are system matrices.

Chapter 5: Microgrids with Single-phase DERs
84
As the system behavior is governed by the poles of its transfer function (i.e. the
eigenvalues of matrix A), it is often desirable to modify the poles of the system in
order to obtain certain properties such as rise/settling time, damping, overshoot and
stability. In this study, the control system is designed using a discrete-time output
feedback pole-shift control [96]. In this technique, the open-loop poles are shifted
radially towards the origin (i.e. more stable locations) to form the closed-loop poles.
Later, (5.5) is represented in discrete-time domain. Assuming the feedback control
has the form of Fig. 5.5 the system of converter and filter is represented in transfer
function domain as
...1
...3
3
2
2
1
1
3
3
2
2
1
1
1
1
1
zfzfzf
zgzgzg
zF
zG
ku
ky
c
(5.6)
where z–1 is the delay operator. Now, let the control law be given by
kykyzR
zSku refc
1
1
(5.7)
where yref is the desired (reference) output current. From Fig. 5.5, the closed-loop
characteristic equation of the system, (z1), is given as
11111 zSzGzRzFz (5.8)
h
Hysteresis Control
+1
1
+
1zS
1zR )()(
)()()()1( 21
kCxky
kvGkuGkFxkx Tc
u
VSC and Filter System
Pole Shift Control
kuc kyref
1
1
1
zF
zG
ku
ky
c
Tiky )(
+h
Fig. 5.5 Closed-loop switching control block diagram for current control strategy
based on pole-shift.
Unlike the pole-placement technique where (z1) is pre-defined by the user, pole-
shift technique takes the form of
...1 3
3
32
2
21
1
11 zfzfzfzFz (5.9)
where the poles are shifted by towards the origin. In this technique, the closed-loop
poles are obtained by multiplying the open-loop eigenvalues by 0 < < 1 where is

Chapter 5: Microgrids with Single-phase DERs
85
a scalar, close to one (e.g. = 0.8), which is called the pole-shift factor. The pole-
shift factor is the only parameter to be defined in the controller and its value
determines the control gain. It is adjusted such that the controller is limited only for
the first few swings following a large impact on the system. Given β is the absolute
of the largest characteristic root of F(z1), for guaranteeing the closed-loop system
stability, is limited as [103]
b
b
11
(5.10)
Since the penalty on control action can be easily adjusted by as in (5.10), the
closed-loop system will unlikely be instable. This is an advantage of the pole-shift
technique compared to other techniques such as deadbeat control which forces all the
closed-loop poles to the origin, requiring excessive control effort.
Equating (5.8) with (5.9), the controller coefficients in R(z1) and S(z1) can be
obtained. For the system of converter and filter under consideration in this study,
based on the system order in (5.5)-(5.6), S(z–1) and R(z–1) in (5.7) are of the form
2
2
1
1
2
2
1
10
1
1
1
zrzr
zszss
zR
zS
kyky
ku
ref
c
(5.11)
Based on these calculated values, the reference tracking error, uc(k) is defined
from (5.7) and used to achieve a reference tracking error less than the maximum
specified as described in (2.37).
5.3 Grid-connected and off-grid operation
First, a case study is carried out to verify the proper performance of the single-
phase DER converters, during both grid-connected and off-grid modes of operations.
The network of Fig. 5.1 is considered in which it is assumed to be initially grid-
connected and in steady-state condition at t = 0. At t = 1 s, circuit breaker CBM1
opens and the microgrid falls into off-grid mode. At t = 2 s, a balanced three-phase
load demand increase of 60% (i.e. 9 kW) is applied in the network. At t = 3 s, a
single-phase load demand increase of 13.3% (i.e. 2 kW) is applied in phase-A. At t =
4 s, a new single-phase load is connected to phase-B with a demand of 4 kW. Finally,

Chapter 5: Microgrids with Single-phase DERs
86
at t = 5 s, a single-phase load demand decrease of 6.65% (i.e. 1 kW) is applied in
phase-C.
The simulation results are shown in Fig. 5.6. The total active power demand of
community-1 is shown in Fig. 5.6a. The active power supplied by the grid and the
power generation by the single-phase DERs are shown in Fig. 5.6b. Fig. 5.6c and
Fig. 5.6d show the active power flow in the primary and secondary sides of the
distribution transformer. The network frequency is shown in Fig. 5.6e. The rms
voltage in the DSTATCOM pcc is shown in Fig. 5.6f while the active and reactive
power output of the DSTATCOM are shown in Fig. 5.6g.
For t < 1 s, the total surplus of DERs generation is 2.4 kW which is fed back to
the (upstream) grid. The total active power demand remains the same after grid is
disconnected at t = 1 s (Fig. 5.6a) and this demand is supplied by the DERs. The
DERs active power generation drops as the grid is disconnected, since no power is
delivered to the grid at this time (Fig. 5.6b). The three-phase power in the
transformer primary is zero but in secondary, the three phases carry different
amounts of power due to the unbalanced distribution of DERs and loads in the
microgrid (Fig. 5.6c-d). The network frequency is 50 Hz when operating in grid-
connected mode while it is regulated by the DERs through the droop control in off-
grid mode (Fig. 5.6e). The voltage at transformer secondary is regulated to 1 pu by
the DSTATCOM at all times (Fig. 5.6f). The DSTATCOM absorbs approximately 5
kVAr reactive power during grid-connected mode while it injects reactive power in
off-grid mode depending on the network load (Fig. 5.6g). It is to be noted that the
DSTATCOM consumes a constant amount of 3 kW, approximately, for replenishing
the losses in its VSCs [31].
At 1 < t < 2 s, community-1 has 5 kW of demand in each phase while the
DERs generation in phase-A, B and C is respectively 2.9, 8.7 and 4.4 kW. Hence,
phase-B has excess of generation whereas phase-A and C have more demand. In the
secondary side of the distribution transformer, there is a 2.1, –2.7 and 0.6 kW power
flow in phase-A, B and C, respectively (Fig. 5.6d). This shows an interphase power
circulation through the distribution transformer from phase-B to the other phases and
as a result, the single-phase DERs in phase-B not only contribute to the load demand
in this phase, but they also share some of the load demand in the other two phases.
Note that in this condition, the DSTATCOM does not contribute to interphase power
circulation.

Chapter 5: Microgrids with Single-phase DERs
87
At 2 < t < 3 s, all single-phase DERs share the three-phase load increase
proportional to their ratings (Fig. 5.6b). At 3 < t < 4 s, all single-phase DERs increase
their output power to share the single-phase load increase (Fig. 5.6b). At 4 < t < 6 s,
the load changes are shared by the DERs connected to different phases; however, the
DERs in phase-B contribute for the load changes in the other phases based on the
interphase power circulation through the distribution transformer (Fig. 5.6d).
The DERs update their output power based on droop control in response for
different load changes in the network; hence different levels of interphase power
circulation through the distribution transformer are observed (Fig. 5.6d).

Chapter 5: Microgrids with Single-phase DERs
88
Fig. 5.6 Simulation results for community-1 in case-1:
5.4 Single phase DER and microgrid isolation and resynchronization
Another study case is carried out to verify the dynamic performance of single
phase DER converters during transitions from grid-connected to off-grid and vice
versa. It is assumed MG-1, in section 5.3, is grid-connected and in steady state
condition at t = 0. At t = 1 s, the microgrid main switch (CBM) opens and the
microgrid falls into off-grid mode. At t = 2 s, DER-3 which is connected to phase-C
and supplying 28 % of total load demand (i.e. 4.3 kW), is disconnected from MG-1.
At t = 3 s, the resynchronization of DER-3 to the microgrid is initiated and at t = 3.68
s, it is connected back to the microgrid. At t = 4 s, resynchronization of the MG-1 to
the grid is activated and at t = 4.15 s, it is reconnected to the grid.
The simulation results are shown in Fig. 5.7. The total active power demand of
community-1 is shown in Fig. 5.7a. The active power supplied by the grid and the
power generation by single-phase DERs are shown in Fig. 5.7b. Fig. 5.7c and Fig.
5.7d show the active power flow in the primary and secondary sides of the
distribution transformer.
The total active power demand remains the same all the time of the study (Fig.
5.7a). At 1 < t < 4.2 s, CBM is open and the microgrid is operating in off-grid mode;
hence, the power flow across the transformer primary is zero (Fig. 5.7c). As DER-3,
the only generator connected to phase-C, disconnects at t = 2 s, the DERs connected
to phase-B supply the loads on phase-C and an interphase power circulation is

Chapter 5: Microgrids with Single-phase DERs
89
observed through the distribution transformer (Fig. 5.7d). As DER-3 disconnects, its
output power drops to zero and DER-1, 2 and 4 increase their generation
proportional to the desired power sharing ratio to match the local demand (Fig. 5.7b).
The resynchronization took 0.15 s in the studied case. After microgrid
resynchronization, DERs operate at their rated capacity which makes the grid to
absorb 2.4 kW (Fig. 5.7b).
Fig. 5.7 Simulation results for community-1 in case-2:

Chapter 5: Microgrids with Single-phase DERs
90
5.5 Power circulation by a DSTATCOM in low voltage feeder
Another case study is carried out to verify the feasibility of power circulation
through the DSTATCOM. Several case studies are demonstrated below to show the
DSTATCOM operation in steady state and dynamic conditions. In addition, the
network performance in the presence of single-phase DSTATCOMs instead of a
three-phase DSTATCOM is demonstrated.
5.5.1 Steady state results
Let us consider the low voltage feeder of Fig. 5.1, with a delta/wye transformer
and unbalanced loads where a DSTATCOM, with the topology shown in Fig. 2.4, is
installed and controlled based on the voltage control strategy described in section
5.2.2.1. It is assumed that a reverse power flow in phase-A is observed due to the
connection of excessive single-phase generation to this phase.
The steady-state, three-phase instantaneous current waveform in the upstream
feeder, downstream load and the output of the DSTATCOM are shown in Fig. 5.8a-
c, respectively. The phase active power flow along the above-mentioned locations is
shown in Fig. 5.8d-f. Separate results are shown for the cases before and after
connection of the DSTATCOM. The upstream currents are unbalanced due to the
unbalanced downstream currents (Fig. 5.8a,b-left). The active power flow in the
upstream of DSTATCOM is equal to the downstream (Fig. 5.8d,e-left).
The active power flow in the feeder is –20, 35 and 49 kW respectively in
phase-A, B and C (Fig. 5.8d-left). After the DSTATCOM connection, the active
power flow in the DSTATCPOM upstream is 27 kW in all phases (Fig. 5.8d-right).
This is achieved as the DSTATCOM absorbs 43 kW from phase-A and injects 10
and 28.5 kW respectively to phase-B and C (Fig. 5.8f-right). Due to the proper power
circulation through the DSTATCOM, a set of balanced phase current is also
observed in the upstream feeder after the DSTATCOM connection (Fig. 5.8a-right).
This case study demonstrates the principle of power circulation through the
DSTATCOM which is based on absorbing active power from the phase with reverse
flowing power and injecting that power (minus DSTATCOM internal losses) to the
other phases. The output currents and active power flow from the DSTATCOM are
shown in Fig. 5.8c,f-right. The summation of the active powers at the outputs of the

Chapter 5: Microgrids with Single-phase DERs
91
DSTATCOM represents the internal losses of the DSTATCOM (Fig. 5.8f-right). In
this case, the DSTATCOM loss is equal to 4.5 kW.
It is to be noted that since the loads in these simulation results are assumed to
be constant impedance loads, the downstream power before and after DSTATCOM
connection is slightly modified due to the voltage correction by the DSTATCOM.
(a)
(b)
(c)
(d)
(e)
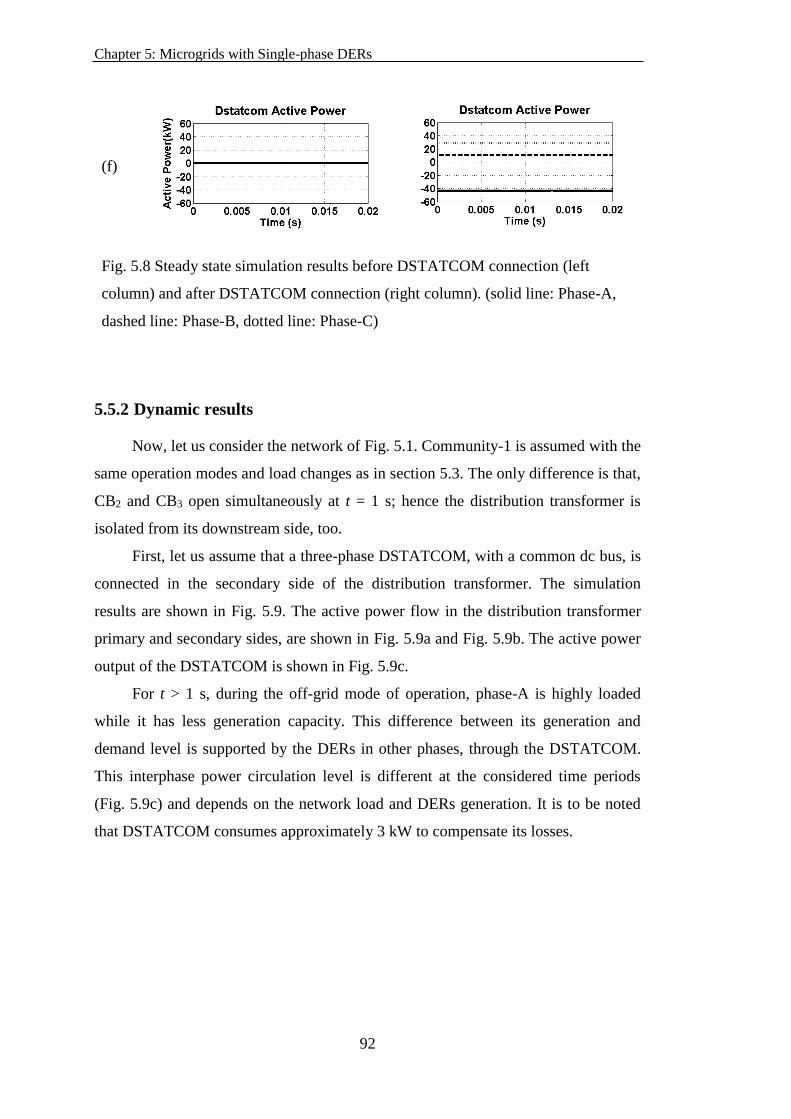
Chapter 5: Microgrids with Single-phase DERs
92
(f)
Fig. 5.8 Steady state simulation results before DSTATCOM connection (left
column) and after DSTATCOM connection (right column). (solid line: Phase-A,
dashed line: Phase-B, dotted line: Phase-C)
5.5.2 Dynamic results
Now, let us consider the network of Fig. 5.1. Community-1 is assumed with the
same operation modes and load changes as in section 5.3. The only difference is that,
CB2 and CB3 open simultaneously at t = 1 s; hence the distribution transformer is
isolated from its downstream side, too.
First, let us assume that a three-phase DSTATCOM, with a common dc bus, is
connected in the secondary side of the distribution transformer. The simulation
results are shown in Fig. 5.9. The active power flow in the distribution transformer
primary and secondary sides, are shown in Fig. 5.9a and Fig. 5.9b. The active power
output of the DSTATCOM is shown in Fig. 5.9c.
For t > 1 s, during the off-grid mode of operation, phase-A is highly loaded
while it has less generation capacity. This difference between its generation and
demand level is supported by the DERs in other phases, through the DSTATCOM.
This interphase power circulation level is different at the considered time periods
(Fig. 5.9c) and depends on the network load and DERs generation. It is to be noted
that DSTATCOM consumes approximately 3 kW to compensate its losses.

Chapter 5: Microgrids with Single-phase DERs
93
Fig. 5.9 Simulation results for House Community-1when the three-phase
DSTATCOM is equipped with a common dc bus,
Now, let us assume a three-phase DSTATCOM, composed of three single-
phase DSTATCOMs with separate dc buses, is connected in the secondary side of
the distribution transformer. The simulation results are shown in Fig. 5.10. The
active power supplied by the grid and the active power generation of the single-phase
DERs is shown in Fig. 5.10a. The network frequency is shown in Fig. 5.10b.
Due to separate dc buses, the DSTATCOM cannot support interphase power
circulation. Hence, in off-grid mode, the network becomes three unrelated single-
phase networks, and the DERs in each network contribute only to the loads in that
network (Fig. 5.10a). As a result a different frequency observed in each phase (Fig.
5.10b).
In such a condition, the frequency of a phase drops if the DERs connected to
that phase generate more than their rated capacities. As an example, at 1 < t < 2 s
phase-A has 5 kW of demand whereas the rated capacity of DER-4, connected to this
phase, is 3.3 kW. Hence, DER-4 increases its output power to meet the demand (Fig.
5.10a) while reducing the network frequency to 49.4 Hz (Fig. 5.10b). In contrast, the
frequency rises if DERs generate less than their rated capacities. As an example, at 1

Chapter 5: Microgrids with Single-phase DERs
94
< t < 2 s phase-B has 9.9 kW of rated generation due to DER-1 and 2 connected to
this phase, whereas it demand is 5 kW. Hence, DER-1 and 2 reduce their output
power to meet the load demand in that phase (Fig. 5.10a); hence, the network
frequency increases to 50.5 Hz (Fig. 5.10b). The frequency variation will be more if
the difference between DER generation and its rated capacity is larger. As an
example, for t > 2 s phase-A is heavily loaded; hence, the network frequency in this
phase drops below 49 Hz (Fig. 5.10b). If proper interphase power circulating
mechanism is in place, this frequency drop could have been avoided.
Fig. 5.10 Simulation results for House Community-1when the three-phase
DSTATCOM is equipped with three separate dc buses,
This section discusses the performance of the microgrid when no power
circulation takes place from one phase to another and hence three phases operate
independently with its own generations. Since, no support is received from other
phases; the heavily loaded phase (i.e. phase-A) experiences sever frequency drop to
below the assumed acceptable level (i.e. 49 Hz in this study). Hence, if a proper load-
shedding scheme is implemented; some loads will be disconnected from this phase.
To verify the performance of the developed three-level load-shedding algorithm,
discussed in section 2.2.4.4, the above case study is repeated assuming that the load-
shedding algorithm is activated. It is assumed that each load-shedding level reduces
approximately 20% of the network load in that phase. The simulation results are
shown in Fig. 5.11. The network frequency is shown in Fig. 5.11a. The active power
flow from the grid and the single-phase DERs is shown in Fig. 5.11b.

Chapter 5: Microgrids with Single-phase DERs
95
Fig. 5.11 Simulation results for House Community–1when the load shedding
algorithm is active.
At t = 2 s, the frequency drops below 49 Hz in phase-A (Fig. 5.11a); hence, the
load-shedding is initiated and disconnects the first set of loads in this phase at t = 2.2
s. As a result, the frequency is increased but still below 49 Hz. Therefore, at t = 3.2 s,
the second set of load-shedding is applied. Similar to the previous time, since the
frequency does not recover back to 49 Hz, the third and final set of load-shedding is
applied at t = 4.2 s, which improves the frequency to the best possible value. The
active power output from the DERs connected to phase-A is modified as the result of
load-shedding in this phase (Fig. 5.11b). In phase-B and C, no load- shedding takes
place since the frequency in these phases remains within the assumed acceptable
range. The load shedding was applied as the interphase power circulation did not
take place. Hence, the simulations in this case demonstrate the advantage of
interphase power circulation for microgrids with single-phase DERs, distributed
unequally among the three phases.
5.6 Power circulation by DSTATCOM in medium voltage feeder
Let us consider the medium voltage feeder of Fig. 5.2b with unbalanced loads
where a DSTATCOM, with the topology shown in Fig. 2.4, is installed and
controlled based on voltage control strategy. The simulation results are shown in Fig.

Chapter 5: Microgrids with Single-phase DERs
96
5.12. Before the DSTATCOM connection, the upstream currents are unbalanced and
equal to those at the downstream of the DSTATCOM (Fig. 5.12a,b-left). Similarly,
the active power flow in each phase is different (Fig. 5.12d-left). However, no
reverse power flow is observed in any of the phases. Hence, the DSTATCOM only
has to facilitate a set of balanced currents in its upstream. After the DSTATCOM is
connected to the feeder, its upstream currents are balanced (Fig. 5.12a-right) while its
downstream remains unbalanced (Fig. 5.12b-right). Similarly, the active power flow
in the DSTATCOM upstream becomes equal to 4 MW in all phases (Fig. 5.12d-
right) while those in the downstream side remain unbalanced (Fig. 5.12e-right). The
output currents and active power flow from the DSTATCOM are shown in Fig.
5.12c,f-right.
Now, let us consider utilizing a DSTATCOM, with the topology shown in Fig.
5.4, in the medium voltage network of case-4, operating in voltage control strategy.
In this configuration, the filter capacitor has a low voltage rating. Before
DSTATCOM connection, the currents in DSTATCOM upstream are unbalanced
(Fig. 5.13a-left). After the DSTATCOM connection, the actual and reference values
of voltage across the filter capacitor are shown together in Fig. 5.13b-left and the
tracking error is shown Fig. 5.13b-right. From this figure, it can be seen that the
tracking error of the controller is about 8 V peak to peak. However, the upstream
current is not balanced (Fig. 5.13a-right), as discussed earlier in section 5.2.2.2.
Hence, for this configuration of DSTATCOM, voltage control strategy fails.

Chapter 5: Microgrids with Single-phase DERs
97
(a)
(b)
(c)
(d)
(e)
(f)
Fig. 5.12 Simulation results before DSTATCOM connection (left column) and after
DSTATCOM connection (right column). (solid line: Phase-A, dashed line: Phase-B,
dotted line: Phase-C).
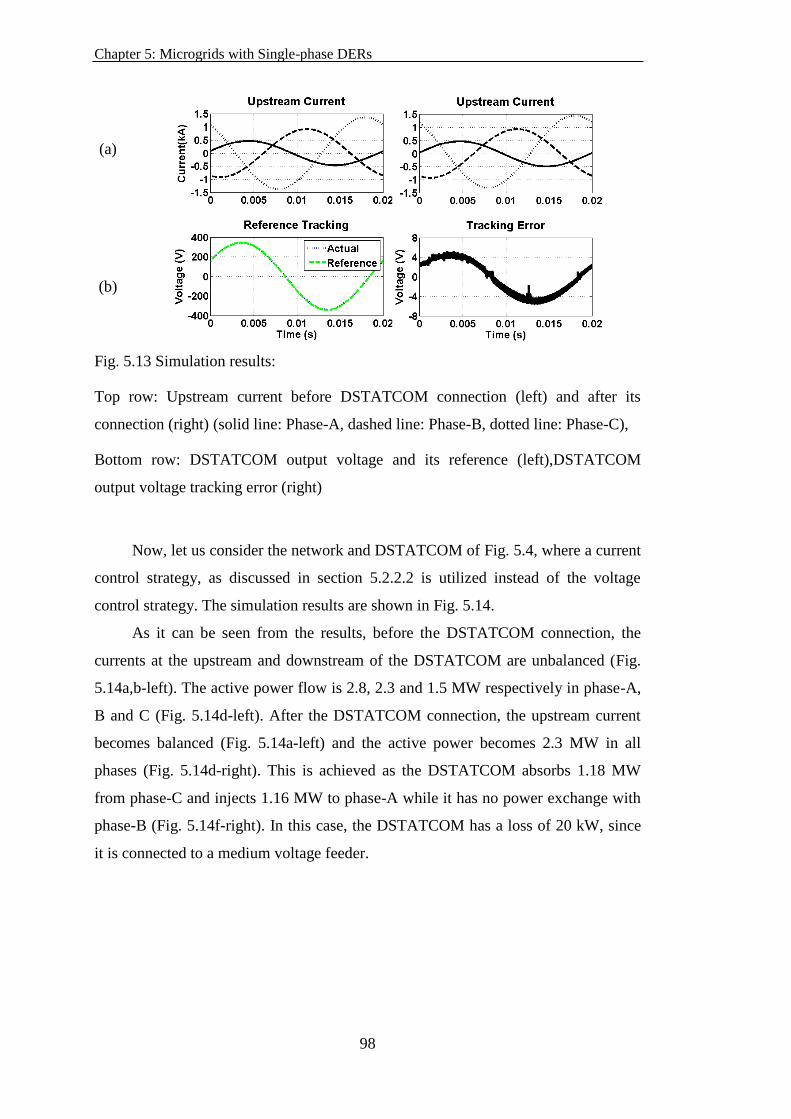
Chapter 5: Microgrids with Single-phase DERs
98
(a)
(b)
Fig. 5.13 Simulation results:
Top row: Upstream current before DSTATCOM connection (left) and after its
connection (right) (solid line: Phase-A, dashed line: Phase-B, dotted line: Phase-C),
Bottom row: DSTATCOM output voltage and its reference (left),DSTATCOM
output voltage tracking error (right)
Now, let us consider the network and DSTATCOM of Fig. 5.4, where a current
control strategy, as discussed in section 5.2.2.2 is utilized instead of the voltage
control strategy. The simulation results are shown in Fig. 5.14.
As it can be seen from the results, before the DSTATCOM connection, the
currents at the upstream and downstream of the DSTATCOM are unbalanced (Fig.
5.14a,b-left). The active power flow is 2.8, 2.3 and 1.5 MW respectively in phase-A,
B and C (Fig. 5.14d-left). After the DSTATCOM connection, the upstream current
becomes balanced (Fig. 5.14a-left) and the active power becomes 2.3 MW in all
phases (Fig. 5.14d-right). This is achieved as the DSTATCOM absorbs 1.18 MW
from phase-C and injects 1.16 MW to phase-A while it has no power exchange with
phase-B (Fig. 5.14f-right). In this case, the DSTATCOM has a loss of 20 kW, since
it is connected to a medium voltage feeder.

Chapter 5: Microgrids with Single-phase DERs
99
(a)
(b)
(c)
(d)
(e)
(f)
Fig. 5.14 Simulation results before DSTATCOM connection (left column) and after
DSTATCOM connection (right column). (solid line: Phase-A, dashed line: Phase-B,
dotted line: Phase-C).

Chapter 5: Microgrids with Single-phase DERs
100
5.7 Presence of different types of DERs in microgrid
A typical microgrid may consist of both voltage controlled and current
controlled single phase and three phase DER converters. Another study case is
carried out to investigate the feasibility of utilizing the proposed and developed
control algorithm for single-phase DERs in a microgrid where different types of
DERs exist.
A new group of residential neighboring houses are considered to form another
house community, namely community-2, as shown in Fig. 5.15. It is assumed that
seven houses in com munity-2 are equipped with DERs, where four of them are
single-phase voltage-controlled, two are single-phase current-controlled and one is
three-phase voltage-controlled. All the DERs are assumed to have energy storages
with sufficient capacity. As before, a low voltage DSTATCOM is assumed to be
installed at the secondary side of the distribution transformer.
MV Grid
~
CB5
CB1
T2
PF2
QF2
PG , QG
DER9
DER8
DER10
Community -2 (MG- 2)
DSTATCOM2
CB7
DER6
DER7
CB6
DER11
MV Feeder
DER5
Phase-B
Phase-C
Three-phase
Phase-A
Fig. 5.15 Structure of the community-2 under consideration with different types of
DERs.
The network is assumed to be grid-connected and in steady-state condition at t
= 0. At t = 1 s, circuit breaker CB5 opens and the microgrid falls into off-grid mode.
At t = 2 s, DER-10 and 11 increase their output power respectively by 100% (i.e. 2
kW) and 60% (i.e. 2 kW). At t = 3 s, DER-10 reduces its output power by 85% (i.e.
3.4 kW) while DER-11 increases its output power by 40% (i.e. 2 kW). At t = 4 s,
DER-10 and 11 output changes back to the same values as at 0 < t < 2 s.

Chapter 5: Microgrids with Single-phase DERs
101
The simulation results are shown in Fig. 5.16. The active power generations of
voltage-controlled and current-controlled DERs are shown in Fig. 5.16a and Fig.
5.16b. The network frequency is shown in Fig. 5.16c.
For t < 1 s, community-2 is operating in grid-connected mode and the DERs
generate their rated power (Fig. 5.16a-b) and the grid supplies the rest of the network
load demand (i.e. 16 kW or 36%) and the network frequency is 50 Hz (Fig. 5.16c).
The output power of current-controlled DERs remains the same after the grid is
disconnected at t = 1 s; hence, the voltage-controlled DERs increase their output
power to share the loads. Hence, the network frequency drops to 49.4 Hz (Fig.
5.16c). As the output power of current-controlled DERs are varied during t > 1 s, the
voltage-controlled DERs, update their output power accordingly to match the local
load demand. Therefore, it can be seen that the single-phase voltage-controlled
DERs, arbitrarily located among the three phases, can operate collaboratively with
the other types of DERs in the microgrid by sharing the network load and regulating
the network frequency based on the assigned droop control.
Fig. 5.16 Simulation results for community-2 in case-5:

Chapter 5: Microgrids with Single-phase DERs
102
5.8 Interconnection of neighboring microgrids with single phase
DERs
The concept of interconnecting two off-grid neighboring microgrids is
proposed in Chapter 4 to improve the network reliability and reduce load-shedding
probability in self-healing networks. Based on the proposed concept, the single-phase
DERs not only can share the loads in the other phases in the same microgrid, but they
can also share the loads in any phase of a neighboring microgrid, if these two off-
grid microgrids are interconnected together. Another case study is carried out to
investigate the feasibility of such operations.
Let us consider the network of Fig. 5.17, with both of the house community 1
and 2. Both communities are assumed to have the same demand of 15 kW.
Community-1 is assumed to have only single-phase DERs with a total generation
capacity of 18.2 kW. In order to build up a worst case scenario, it is assumed that
community-2 has only single-phase DERs (i.e. DER-5 and 7 discussed in section 5.7)
with a total generation capacity of 11.6 kW.
DER4 DER3
MV Grid
~
CB2
CB5
CB1
T1
T2
PF2
QF2
PF1
QF1
PG , QG
DSTATCOM1
CB4
Community -1 (MG- 1)
DER9
DER8
DER10
Community -2 (MG- 2)
DSTATCOM2
CB7
DER6
DER7
CB3CB
6
DER11
MV Feeder
DER2DER1
DER5
Phase-A
Phase-C
Phase-B
Phase-B
Phase-C
Three-phase
Phase-A
Fig. 5.17 Structure of the interconnected microgrid under consideration.
The network is assumed to be grid-connected and in steady-state condition at t
= 0. At t = 0.8 s, circuit breakers CB1, CB2 and CB5 open and both of the microgrids
fall into off-grid mode. At t = 2 s, the resynchronization between the two microgrids
is activated and at t = 2.9 s, they are synchronized and interconnect together by
closing CB2 and CB5. At t = 4 s, a single-phase load of 4 kW is added to phase-B in
community-2. At t = 5 s, another single-phase load of 2 kW is connected to phase-A
in community-2.

Chapter 5: Microgrids with Single-phase DERs
103
The simulation results are shown in Fig. 5.18. The active power flow from the
grid to each microgrid is shown in Fig. 5.18a. The active power flow supplied by the
grid and the power generation by single-phase DERs are shown in Fig. 5.18b. Fig.
5.18c shows the total active power generation by the DERs in each microgrid. Fig.
5.18d-g show the active power flow in primary and secondary sides of the two
distribution transformers, supplying the two microgrids. The network frequency in
each microgrid is shown in Fig. 5.18h.
For t < 0.8 s, the microgrids operate in grid-connected mode and MG-1 exports
2.4 kW surplus of its DERs generation to the grid, while MG-2 imports 4.5 kW from
the grid (Fig. 5.18a). Due to single-phase loads and DERs in each microgrid,
different levels of power import/export is observed in the primary and secondary side
of the distribution transformers in each phase (Fig. 5.18d-g) and the network
frequency remains at 50 Hz (Fig. 5.18h).
At 0.8 < t < 2.9 s, both microgrids are isolated from the grid and there is no
power exchange with the grid (Fig. 5.18a). Hence, both microgrids operate in off-
grid mode independently and the DERs in MG-1 reduce their power generation to
match the local demand while the DERs in MG-2 increase their generation to meet
their local demand (Fig. 5.18b). As a result, the DERs with the same rating in the two
microgrids have different outputs (Fig. 5.18b). In this period, the single-phase DERs
in each microgrid support the local loads based on the interphase power circulation
through their distribution transformers (Fig. 5.18e,g). The two microgrids operate in
two different frequencies in this period (Fig. 5.18h).
For t > 2.9 s, the two off-grid microgrids are interconnected based on the
concept proposed in Chapter 4. In this period, the total load in the system of
interconnected microgrids is shared by all the DERs in both microgrids. Therefore, a
portion of the loads in MG-2 are supplied by the DERs located in MG-1; MG-1
exports approximately 4 kW to MG-2 (Fig. 5.18a). In addition, the DERs with the
same rating in two microgrids have the same outputs, as desired by the power sharing
ratio (Fig. 5.18b). Again, due to the different levels of demand and generation in
each phase, different levels of power flow is observed in the primary and secondary
sides of the distribution transformers (Fig. 5.18d-g). Both microgrids operate in the
same frequency in this period (Fig. 5.18h).

Chapter 5: Microgrids with Single-phase DERs
104

Chapter 5: Microgrids with Single-phase DERs
105
Fig. 5.18 Simulation results for community-1 and 2 in case-6:
5.9 Summary
In this chapter, the successful dynamic operation and control of a microgrid
with single-phase DERs with different capacities, distributed randomly among the
three phases of the network are demonstrated. The single-phase DERs are converter-
interfaced and operated in voltage-control mode. The primary and secondary level
controls proposed in Chapter 2 are employed for the single-phase DERs, too. It is
shown that the excess generated power can be circulated successfully from one phase
to the other phases(s) via the distribution transformer. For this purpose, the
transformer needs to have a delta-wye connection (which is the normal case in
distribution networks). Alternatively, the power circulation can be achieved by the
help of a DSTATCOM installed on the low voltage or medium voltage feeder.
Different topologies and control algorithms are proposed for the DSTATCOM when
installed in the medium voltage feeder and in the low voltage feeder.


Chapter 6 AC-DC Hybrid Microgrid
In this chapter, the operation and control of a hybrid ac-dc microgrid is
presented. The microgrid constitutes an ac bus interconnected to a dc bus via a tie-
converter (TC). The DERs located in both buses operate in different modes of
operation based on the grid availability and the conduction status of the TC. The
objective of the TC is to maintain the dc bus voltage and ac bus voltage during the
off-grid mode of operation of the ac-dc microgrid by controlling the active and
reactive power flow through the TC. Several case studies are conducted in
PSCAD/EMTDC to verify the proper operation of the hybrid ac-dc microgrid in
different modes of operation.
6.1 AC-DC microgrid network
The hybrid ac-dc microgrid structure consists of an ac bus and a dc bus. All the
ac loads and DERs within the microgrid are connected to the ac bus. Similarly, all dc
loads and DERs are connected to the dc bus. A TC is used for interconnecting the ac
bus and dc bus together. The ac bus is connected to grid through a circuit breaker and
a three-phase transformer.
In this study, the ac bus is assumed to be a three-phase 400 V system, supplied
by a 30 kVA, three-phase transformer. The dc bus is assumed to be a 350 V dc
system. Two power-electronic interfaced ac DERs are assumed to be connected to
the ac bus and two power-electronic interfaced dc DERs are assumed to be connected
to the dc bus.
The introduced hybrid microgrid system should be able to operate successfully
in the following modes of operation, as shown schematically in Fig. 6.1:
Mode-1: Isolated ac and dc buses with the ac bus isolated from the grid,
Mode-2: Isolated ac and dc buses with the ac bus connected to the grid,
Mode-3: Interconnected ac and dc buses with the ac bus isolated from grid,

Chapter 6: AC-DC Hybrid Microgrid
108
Mode-4: Interconnected ac and dc buses with the ac bus connected to grid.
AC Bus DC BusGrid
Mode-4
AC Bus DC BusGrid
Mode-3
AC Bus DC BusGrid
Mode-2
AC Bus DC BusGrid
Mode-1TC
TC
TC
TC
+ +
+ +
+ +
+ +
SS
SS
SS
SS
Fig. 6.1 Hybrid ac-dc microgrid system in different modes of operation.
The ac microgrid concept and control is discussed in Chapter 2 The dc
microgrid is formed by a group of dc DERs and loads, connected to the same dc bus.
Each DER is connected to the dc bus through a dc-dc converter. For an energy
storage-based DER, a bidirectional converter is required to provide bidirectional
power flow between the storage and the dc bus. For other dc DERs, a unidirectional
dc-dc converter can be employed. In this study, boost converters are used for
connecting the DERs to the dc bus (Fig. 6.2). The inductor and capacitor are
designed to reduce the current and voltage ripples. It is to be noted that the state of
charge of the batteries are not considered in this research. It has been assumed that
the batteries are charged and available when needed. They are fully charged during
the off-peak hours.
Vdc
Fig. 6.2 Power electronic interface for DERs connected to dc buses.

Chapter 6: AC-DC Hybrid Microgrid
109
6.2 Operation and control of the dc microgrid
The dc microgrid control consists of several modules, namely TC conduction
status monitoring, Output power control and Converter switching control modules, as
described below.
6.2.1 TC conduction status monitoring module
In this study, the dc microgrid islanding detection is based on monitoring the
status of the TC and the assumption of the communication infrastructure availability,
to transfer this information to the dc DERs. Note that no resynchronization is
required for connecting the DERs to the dc bus.
6.2.2 Output power control module
Depending on the status of the TC, the DERs in the dc bus operate in two
different modes:
If the TC is on (i.e. conducting), the DERs are controlled in constant P mode and
hence, the dc bus voltage is regulated by controlling the bidirectional power flow
over the TC.
If the TC is off (i.e. non-conducting), the DERs are operated in voltage control
mode, based on droop. In this case, the voltage of each DER converter is varied
based on the droop control, and pre-defined droop coefficients (m'), to regulate
the dc bus voltage within the acceptable limits, while sharing the loads of the dc
bus with the specified ratio. Hence, the output power of a converter (P) is
measured and used to derive the reference for converter output voltage as [70]
dcrateddcrateddcdc PPmVV ,, (6.1)
where the suffix dc shows droop among DERs in the dc bus.
The block diagram of the control system for the converters of the DERs,
connected to the dc bus, is shown in Fig. 6.3.
Note that the TC conduction status monitoring module issues a command to the
reference selection block to select the proper reference.

Chapter 6: AC-DC Hybrid Microgrid
110
Central Controller
Droop Control
v
SwitchingControl
1P 2P
Vdc,rated
DC BUS
TCStatus
Constant P
SwitchingControl
2v
+ +
m1
m2
Pmax
2Pmax
1
Vmin
Vmax
1v
TCStatus
Constant P
DER-3 DER-4
v v
Off-GridGrid-connected Off-Grid Grid-connected
Fig. 6.3 Primary and secondary control levels of the considered dc microgrid system.
v
Reference Generation
fv,
AC BUS DC BUSTC
SwitchingControl
Fig. 6.4 Control schematic of the TC between the ac and dc buses in ac-dc hybrid
microgrid system.
6.2.3 Converter switching control module
Converter switching control module is responsible for proper turn on and off of
the IGBT in the boost converter, such that the desired reference voltage is generated
across the dc capacitor. In this study, a closed-loop PI based pulse width modulation
(PWM) technique is used to generate the IGBT switching function, u. Assuming a
bipolar switching for the IGBTs, udc takes 1 which will subsequently turn on and
off the IGBT in the boost converter.
The switching function for the IGBT in the boost converter, udc, is generated by
the help of PWM technique and using a feedback over the converter output voltage
and current [104]. The block diagram of the closed-loop switching control system is
shown in Fig. 6.5.

Chapter 6: AC-DC Hybrid Microgrid
111
+
refdcV ,
s
kk I
P
+
refdcI ,
s
kk I
P
Comparator
+Duty ratio
Triangle
Waveform
Boost
Converter
dcu
PWM
PI PI
dcI
dcV
Fig. 6.5 Closed-loop switching control block diagram for dc DER converters.
6.3 Dynamic operation results of ac-dc microgrid
In order to investigate the performance of the proposed hybrid ac-dc microgrid,
with the developed control strategies, the operation modes 1-4 are studied. The
parameters of network, DER converters and filters, loads, TC and droop and
controller coefficients are given in Table 6.1.
Table 6.1 Parameters of network, DER converters, filters and TC. controller
coefficients for Fig. 6.1
MV Network 11 kVrms L-L, 50 Hz
MV Line
Impedance
R = 0.2 , L =10 mH
Transformer 30 kVA, 11 / 0.4 kV, Dyn1, 50 Hz, ZI = 5%
AC Bus 400 Vrms L-L
DC Bus 350 V
VSCs and Filters
for DERs and TC
Rf = 0.1 , Lf = 0.36 mH, Cf = 50 F, Vdc = 350 V, a = 3, h =
10–4, Ts = 10–6 s, k1 = 2.4613, k2 = 2.9606, kP = 1 , kI = 100
Table 6.2 DER converter droop controller coefficients for Fig. 6.1
DER Bus Rating
[kW]
LT
[mH]
m
[rad/kW]
n
[V/kVAr]
ḿ [V/kW]
DER-1 AC 2 2.72 3.1416 18 –
DER-2 AC 4 1.36 1.5708 9 –
DER-3 DC 1 – – – 35
DER-4 DC 2 – – – 17.5

Chapter 6: AC-DC Hybrid Microgrid
112
6.3.1 Mode-1
The TC is assumed to be in non-conducting status; hence, the ac and dc bus are
isolated while the ac bus is assumed to be isolated from the grid, too. Under such
conditions, the DERs in each bus share the load of the relevant bus and the central
controller regulates the ac and dc bus voltages in ± 10% range and the frequency of
ac bus in ± 0.5 Hz range.
It is assumed that the network is initially in steady-state condition, with a total
load demand of approximately 5 kW in the ac bus. At t = 1 s, this load is increased
by 3 kW (i.e. 60%) and at t = 2 s, the network load is decreased by 4 kW (i.e. 50%).
The output active and reactive power ratio among DER-1 and 2, connected to the ac
bus, is maintained as 1:2, as assigned (Fig. 6.6a-b) for all load changes (Fig. 6.6c).
The frequency variations in the ac bus are within the acceptable limits of ± 0.5 Hz
(Fig. 6.6d). The ac bus rms voltage drops below the minimum acceptable limit of –
10% after the load increase at t = 1 s (Fig. 6.6e). Assuming that the central controller
has discrete time steps, as discussed in section 2.2, it applies an adjustment in the
droop curve characteristic of the DERs at t = 1.5 s (i.e. the first monitoring time step
of the central controller after t = 1 s). Hence, the rated voltage of the DERs is
increased from 240 to 258 V (Fig. 6.6f); thereby, the ac bus voltage is restored to
approximately 240 V. After load reduction at t = 2 s, the ac bus voltage rises but does
not exceed the maximum limit; hence central controller does not take any further
action.
Similarly, the DERs in the dc bus share the loads in this bus. It is assumed that
the network is initially in steady-state condition, with a total load demand of 3 kW in
the dc bus. At t = 1 s, this load is increased by another 3 kW (i.e. 100%) and at t = 2
s, the network load is decreased by 1 kW (i.e. 17%). The output active power ratio
among DER-3 and 4, connected to the dc bus, is maintained as 1:2, as assigned (Fig.
6.7a) for all load changes (Fig. 6.7b). The dc bus voltage is kept within the
acceptable 10% limit (Fig. 6.7c); hence no action is taken by the central controller.

Chapter 6: AC-DC Hybrid Microgrid
113
Fig. 6.6 Simulation results for the ac bus in Mode-1:

Chapter 6: AC-DC Hybrid Microgrid
114
Fig. 6.7 Simulation results for the dc bus in Mode-1:
6.3.2 Mode-2
The TC is assumed to be in non-conducting status; hence the ac and dc bus are
isolated while the ac bus is assumed to be connected to the grid. Under such
conditions, the DERs in the ac bus operate in constant power mode, in their rated
conditions, while the DERs in the dc bus operate in voltage control, based on droop,
and the central controller regulates only the dc bus voltage.
It is assumed that the network is initially in steady-state condition, with a load
demand of approximately 7 kW in the ac bus. At t = 1 s, this load is increased by 2
kW (i.e. 29%) and at t = 2 s, decreased by 6 kW (i.e. 66%). The output active and
reactive power of DER-1 and 2, connected to the ac bus, is remained at the rated
values, all the time (Fig. 6.8a-b). For t < 2 s, the grid supplies a portion of the load
demand in the ac bus; however for t > 2 s, the ac bus exports power to the grid (Fig.
6.8a-b), depending on the variations of the load in the ac bus (Fig. 6.8c). The
frequency of the ac bus is 50 Hz (Fig. 6.8d) and the ac bus rms voltage is remained
unaffected (Fig. 6.8e). The performance of DERs in the dc bus is similar to the
results shown in Fig. 6.7 and is not repeated here.

Chapter 6: AC-DC Hybrid Microgrid
115
Fig. 6.8 Simulation results for the ac bus in Mode-2:

Chapter 6: AC-DC Hybrid Microgrid
116
6.3.3 Mode-3
The TC is assumed to be in conducting status; hence the ac and dc bus are
interconnected while the ac bus is assumed to be isolated from the grid. Under such
conditions, the DERs in each bus share the load of the relevant bus and the TC
regulates the voltage in both of the buses. In this case, the central controller operates
as backup for the TC. The results are investigated for different scenarios, as below:
6.3.3.1 Load change in the ac bus
It is assumed that the network is initially in steady-state condition, with a load
demand of approximately 6 kW in the ac bus. At t = 1 s, this load is increased by 2
kW (i.e. 33%) while the load connected to the dc bus is remained as before. The load
change is contributed by DER-1 and 2, connected to the ac bus and the output active
power ratio among them is maintained as 1:2 (Fig. 6.9a). DER-3 and DER-4,
connected to the dc bus, do not contribute to the load change (Fig. 6.9b). For the ac
bus load variation (Fig. 6.9c), the frequency and voltage variations in ac bus are
within acceptable limits (Fig. 6.9d-e) and dc bus voltage is remained unaffected (Fig.
6.9f).

Chapter 6: AC-DC Hybrid Microgrid
117
Fig. 6.9 Simulation results for the ac and dc bus in Mode-3, case 6.3.3.1:
6.3.3.2 Load change in the dc bus
The network of case 6.3.3.1 is considered, with a load demand of 3 kW in the
dc bus. At t = 1 s, this load is increased by 3 kW (i.e. 100%). As the load change is in
the dc bus, the output power of DER-1 and 2 is not affected (Fig. 6.10a); hence, the
ac bus voltage and frequency will not be affected, too. DER-3 and DER-4, connected
to the dc bus, contribute to the load change and the output active power ratio among
them is maintained as 1:2 (Fig. 6.10b) for the load changes in the network (Fig.
6.10c).

Chapter 6: AC-DC Hybrid Microgrid
118
Fig. 6.10 Simulation results for the ac and dc bus in Mode-3, case 6.3.3.2:
6.3.3.3 AC bus DERs operating in maximum ratings
The network of case 6.3.3.1 is considered, where the DERs connected to the ac
bus are assumed to be operating in their maximum ratings. In this condition, the ac
bus load is approximately 6 kW where its 2 kW (33%) is supplied by the TC. At t = 1
s, the load in the ac bus is increased by another 2 kW (30%). The output active power
of the DERs, connected to the ac bus, is remained unaffected (Fig. 6.11a). Hence, the
DERs in the dc bus contribute to this extra load and the power transfer over the TC is
increased by 2 kW (Fig. 6.11a). The output active power ratio among the DERs,
connected to the dc bus, is maintained as 1:2 (Fig. 6.11b) to contribute to the load
variations in the ac bus (Fig. 6.11c).

Chapter 6: AC-DC Hybrid Microgrid
119
Fig. 6.11 Simulation results for the ac and dc bus in Mode-3, case 6.3.3.3:
6.3.3.4 DC bus DERs operating in maximum ratings
The network of case 6.3.3.2 is considered, where the DERs connected to the dc
bus are assumed to be operating in their maximum ratings. In this condition, the dc
bus load is 3 kW while the DERs, connected to this bus, are generating 6 kW.
Therefore, the rest of the generated power is taken by the TC. However, only 1 kW is
delivered to the ac bus (Fig. 6.12a), due to the power losses in the TC, which is
approximately 5 kW. At t = 1 s, the load in the dc bus is increased by another 3 kW
(i.e. 100%). Hence, the DERs in the ac bus contribute to this extra load and the
power transfer over the tie-converter is increased by 3 kW (Fig. 6.12a). The output
active power ratio among the DERs, connected to the ac bus, is maintained as 1:2
(Fig. 6.12a) while the output active power of the DERs, connected to the dc bus, is
remained same as before (Fig. 6.12b) for the load variations in the network (Fig.
6.12c).

Chapter 6: AC-DC Hybrid Microgrid
120
Fig. 6.12 Simulation results for the ac and dc bus in Mode-3, case 6.3.3.4:
6.3.4 Mode-4
The TC is assumed to be in conducting status; hence, the ac and dc buses are
interconnected while the ac bus is assumed to be connected to the grid. Under such
conditions, the DERs in the ac bus operate in constant power mode and the DERs in
the dc bus operate in constant P mode. The extra power required by the loads or the
surplus of the generated power by the DERs is exchanged by the grid.
It is assumed that the network is initially in steady-state condition, with a load
demand of 4 kW in the ac bus and 1 kW in the dc bus. At t = 1 s, a load increase of 6
kW (i.e. 150%) is applied in the ac bus and at t = 2 s, a load increase of 5 kW (i.e.
500%) is applied in the dc bus. The load changes are very high to result in power
flow reversing over the TC. The output power of all the DERs, in both buses, is
maintained, as desired (Fig. 6.13a-b). For t < 1 s, the surplus of the power generated
by dc DERs, minus the TC losses, is delivered to the ac bus and 6 kW surplus in ac
bus is flowing to grid (Fig. 6.13c). As the load in the ac bus is increased at t = 1 s, the
power flow over the TC is remained unaffected. In this case, since the power
generation and demand in the AC bus are equal, the power exchange between the
microgrid and grid is zero (Fig. 6.13c). At t = 2 s, as the load in dc bus increases, the
power flow over the TC is reversed and the TC takes approximately 2 kW from the
ac bus. Hence, bidirectional power flow between the two ac and dc microgrids as
well as the microgrid and grid are validated.

Chapter 6: AC-DC Hybrid Microgrid
121
Fig. 6.13 Simulation results for the ac bus in case 6.3.4:
6.4 Summary
In this chapter, a hierarchical control system is proposed for the dynamic
operation and control of the DERs connected to the ac and dc bus of a hybrid ac-dc
microgrid. A secondary controller successfully regulates the dc bus voltage, ac bus
voltage and ac bus frequency. However, when the two buses are interconnected,
these parameters are effectively controlled by the active power flow and reactive
power exchange by the TC. Four different modes of operation are identified for the
hybrid microgrid and through the simulation results, it is shown that the microgrid
with the proposed control system can successfully operate in all these four modes.


Chapter 7 Conclusions and Recommendations
In this chapter, the general conclusions of the thesis and recommendations for
future research are presented.
7.1 Conclusions
The general conclusions of the thesis are:
(1) Several converter-interfaced DERs can be properly controlled to operate in
their rated or MPPT conditions when the microgrid is operating in grid-
connected mode. In off-grid mode, they can operate in reactive power-
voltage and active power-frequency (or angle) droop to share the required
active and reactive demand of the loads.
(2) Voltage-controlled DERs can effectively supply different types of loads of
the microgrid such as balanced, unbalanced and harmonic loads. Compared
to current-controlled DERs which need relatively complicated negative and
zeros sequence extraction and harmonic component extraction, the voltage-
controlled DERs do not need such computational complexity.
(3) For proper operation and control of the DERs in a microgrid, a hierarchical
control system is required. The DERs performance and reference tracking is
achieved by the help of the primary (lowest) level control. The microgrid
central controller acts as the secondary control system and adjusts the set
points for the primary controller to regulate the network voltage and
frequency, if they are violated. It also sheds the non-critical loads if the
primary control setting adjustments are not sufficient for keeping the voltage
magnitude and frequency within the acceptable limits.
(4) Two or more neighboring microgrids can be interconnected to form a bigger
microgrid in smart grid networks with self-healing capability.
Interconnection of the neighboring microgrids can prevent load shedding in a

Chapter 7: Conclusions and Recommendations
124
microgrid with deficiency of power, if the neighboring microgrids have
enough generation capacity.
(5) A microgrid can be composed of single-phase DERs with different
capacities, arbitrarily distributed among the three phases of the microgrid. In
such a case, the single-phase DERs of the microgrid can operate in droop
during the off-grid mode of operation. The excess power generated in a
phase with higher number of single-phase DERs can be circulated to the
other phase(s) through a distribution transformer with delta/wye
configuration. Alternatively, a DSTATCOM can be utilized in the low
voltage or medium voltage feeder to circulate the power among the phases.
(6) A microgrid can be composed of two buses –ac bus and dc bus, forming a
hybrid ac-dc microgrid. Each bus has several DERs and loads and they are
interlinked through an interlinking converter. This can be a viable network
configuration for the future community houses. Depending on the presence
of the grid or the conduction status of interlinking converter, different modes
of operation can be considered. The DERs in each bus can supply its local
loads whereas the DERs connected to the other bus can effectively supply
the loads through the interlinking converter in case there is a deficiency in
the local generation.
7.2 Thesis contribution to the knowledge
In this thesis, a three level hierarchical control system comprising primary,
secondary and tertiary controllers was proposed for the proper operation and control
of the DERs in a microgrid. The proposed primary controller is based on the
converter voltage control and consists of two control loops; inner loop control and
outer loop control. Outer loop controller generates the reference based on the
operating condition of the microgrid which is fed to the inner loop controller where
the switching signal are generated. An optimal robust feedback control system is
utilized in order to produce the estimated voltage at the converter output. The
proposed secondary controller adjusts the set points for the primary controller to
ensure the voltage and frequency of the system are kept within the acceptable limits.
It also dynamically adjusts the power sharing ratio among the DERs in the microgrid
and sheds the loads to prevent voltage and frequency collapse in the system in the

Chapter 7: Conclusions and Recommendations
125
event of DERs over loading. The numerical simulation carried out on PACAD
ensures that the DERs with the developed control scheme can successfully supply
different types of loads in a microgrid. Both three phase and single phase DERs were
considered. In case of single-phase DERs with different ratings, unequally
distributed among the three phases of a microgrid, two alternative methods were
proposed to circulate the power from the phase with excess generation to the other
phase(s) with lack of generation. In addition, the possibility of interconnecting two or
more neighboring off-grid microgrids has been studied to reduce the load shedding
possibility in a microgrid with deficiency of power, if the neighboring microgrids
have sufficient generation capacity. Finally, a dc microgrid system was also proposed
and its interconnection with an ac microgrid through an interlinking converter was
discussed. Proper control and management methods were proposed to ensure the
proper operation of the interlinked ac-dc hybrid microgrid for different operating
modes. Several scenarios and case studies were considered and the proposed
concepts were validated by extensive computer-based simulation studies in
PSCAD/EMTDC.
7.3 Recommendations for future research
The scope for future research is as given below.
7.3.1 Simultaneous active and reactive power ratio adjustment
In this research, only the dynamic adjustment of the active power among
parallel converter-interfaced DERs was investigated. The proposed method does not
regulate the reactive power share among the DERs. A new dynamic power ratio
adjustment method can be proposed in which the active and reactive power ratios are
adjusted simultaneously for the DERs. In addition, the decision making algorithm
embedded within the network tertiary controller can be developed to define the
desired power ratio among different DERs of a microgrid. This can be a topic for
future research.
7.3.2 Different interconnection topologies and decision making
In this research, the concept of interconnecting two or more neighboring
microgrids was proposed and the primary level control of the DERs was investigated.

Chapter 7: Conclusions and Recommendations
126
The decision making process before interconnection of the microgrids which is the
functionality of the network tertiary controller was not considered in this research.
The different mechanisms of interconnection of two or more neighboring microgrids
as well as the decision making algorithm embedded in the network tertiary controller
can be a topic for future research.
7.3.3 Control of state of charge of storage units in microgrids
The batteries considered as DERs in this research were assumed as sources of
active power in the microgrid. However, they need to be charged as well. Therefore,
the charging and discharging operation of the batteries can be further studied and the
effect of the state of charge of the batteries on the microgrid operation can be
analyzed further. This can be a topic for a future research.
7.3.4 Communication network and data transfer delay effect
In this research, it was assumed that the data transfer in the network (among
the DERs and the microgrid central controller) is carried out immediately. However,
depending on the communication network type and the number of DERs in the
microgrid, the data transferring process may experience large delays and/or data
packet loss may be observed. The proper communication network for the microgrid,
data coding characteristics and the effect of the data transfer delay and data packet
loss can be another topic for a future research.

127
References
[1] B. Kroposki, C. Pink, R. DeBlasio, H. Thomas, M. Simoes, and P. K. Sen, “Benefits
of power electronic interfaces for distributed energy systems,” IEEE Transactions on
Energy Conversion, vol. 25, no. 3, pp. 901–908, 2010.
[2] T. Senjyu, T. Nakaji, K. Uezato, and T. Funabashi, “A hybrid power system using
alternative energy facilities in isolated island,” IEEE Transactions on Energy
Conversion, vol. 20, no. 2, pp. 406–414, 2005.
[3] R. H. Lasseter, “MicroGrids,” in IEEE Power Engineering Society Winter Meeting,
2002, vol. 1, pp. 305–308 vol.1.
[4] N. Hatziargyriou, H. Asano, R. Iravani, and C. Marnay, “Microgrids,” IEEE Power
and Energy Magazine, vol. 5, no. 4, pp. 78–94, 2007.
[5] J. A. P. Lopes, C. L. Moreira, and A. G. Madureira, “Defining control strategies for
MicroGrids islanded operation,” IEEE Transactions on Power Systems, vol. 21, no. 2,
pp. 916–924, 2006.
[6] M. C. Chandorkar, D. M. Divan, and R. Adapa, “Control of parallel connected
inverters in standalone AC supply systems,” IEEE Transactions on Industry
Applications, vol. 29, no. 1, pp. 136–143, 1993.
[7] R. Majumder, A. Ghosh, G. Ledwich, and F. Zare, “Angle droop versus frequency
droop in a voltage source converter based autonomous microgrid,” IEEE Power &
Energy Society General Meeting, pp. 1–8, 2009.
[8] R. Majumder, F. Shahnia, A. Ghosh, G. Ledwich, M. Wishart, and F. Zare, “Operation
and control of a microgrid containing inertial and non-inertial micro sources,” IEEE
Region 10 Conference (TENCON), pp. 1–6, 2009.
[9] C. N. Rowe, T. J. Summers, R. E. Betz, D. J. Cornforth, and T. G. Moore, “Arctan
Power–Frequency Droop for Improved Microgrid Stability,” IEEE Transactions on
Power Electronics, vol. 28, no. 8, pp. 3747–3759, Aug. 2013.
[10] J. C. Vasquez, J. M. Guerrero, A. Luna, P. Rodriguez, and R. Teodorescu, “Adaptive
Droop Control Applied to Voltage-Source Inverters Operating in Grid-Connected and
Islanded Modes,” IEEE Transactions on Industrial Electronics, vol. 56, no. 10, pp.
4088–4096, Oct. 2009.

128
[11] H. Bevrani and S. Shokoohi, “An Intelligent Droop Control for Simultaneous Voltage
and Frequency Regulation in Islanded Microgrids,” IEEE Transactions on Smart Grid,
vol. 4, no. 3, pp. 1505–1513, Sep. 2013.
[12] M. J. Sanjari and G. B. Gharehpetian, “Small signal stability based fuzzy potential
function proposal for secondary frequency and voltage control of islanded microgrid,”
Electric Power Component Systems, vol. 4, no. 5, pp. 1505–1513, 2013.
[13] B. Johnson, A. Davoudi, P. Chapman, and P. Sauer, “A unified dynamic
characterization framework for microgrid systems,” Electric Power Components and
Systems, vol. 40, no. 1, pp. 93–111, 2011.
[14] C. X. Dou, D. L. Liu, X. B. Jia, and F. Zhao, “Management and Control for Smart
Microgrid Based on Hybrid Control Theory,” Electric Power Components and
Systems, vol. 39, no. 8, pp. 813–832, 2011.
[15] R. Majumder, “Some Aspects of Stability in Microgrids,” IEEE Transactions on
Power Systems, vol. 28, no. 3, pp. 3243–3252, Aug. 2013.
[16] R. Majumder, B. Chaudhuri, A. Ghosh, R. Majumder, G. Ledwich, and F. Zare,
“Improvement of stability and load sharing in an autonomous microgrid using
supplementary droop control loop,” IEEE Power and Energy Society General
Meeting, vol. 25, no. 2, pp. 796–808, 2010.
[17] H. Nian and R. Zeng, “Improved control strategy for stand-alone distributed
generation system under unbalanced and non-linear loads,” IET Renewable Power
Generation, vol. 5, no. 5, pp. 323–331, Sep. 2011.
[18] F. Katiraei and M. R. Iravani, “Power Management Strategies for a Microgrid With
Multiple Distributed Generation Units,” IEEE Transactions on Power Systems, vol.
21, no. 4, pp. 1821–1831, 2006.
[19] A. Yazdani and R. Iravani, “A unified dynamic model and control for the voltage-
sourced converter under unbalanced grid conditions,” IEEE Transactions on Power
Delivery, vol. 21, no. 3, pp. 1620–1629, 2006.
[20] W. Huang, M. Lu, and L. Zhang, “Survey on Microgrid Control Strategies,” Energy
Procedia, vol. 12, pp. 206–212, 2011.
[21] Ying-Yi Hong, Ming-Chun Hsiao, Yung-Ruei Chang, Yih-Der Lee, and Hui-Chun
Huang, “Multiscenario Underfrequency Load Shedding in a Microgrid Consisting of
Intermittent Renewables,” IEEE Transactions on Power Delivery, vol. 28, no. 3, pp.
1610–1617, Jul. 2013.
129
[22] K. Seethalekshmi, S. N. Singh, and S. C. Srivastava, “A Synchrophasor Assisted
Frequency and Voltage Stability Based Load Shedding Scheme for Self-Healing of
Power System,” IEEE Transactions on Smart Grid, vol. 2, no. 2, pp. 221–230, Jun.
2011.
[23] A. Ghosh and G. Ledwich, Power quality enhancement using custom power devices.
Kluwer Academic Publishers, 2002.
[24] R. Teodorescu, M. Liserre, and P. Rodriguez, Grid converters for photovoltaic and
wind power systems. Wiley, 2011.
[25] F. Blaabjerg, R. Teodorescu, M. Liserre, and A. V. Timbus, “Overview of Control and
Grid Synchronization for Distributed Power Generation Systems,” IEEE Transactions
on Industrial Electronics, vol. 53, no. 5, pp. 1398–1409, Oct. 2006.
[26] J. Rocabert, G. Azevedo, I. Candela, R. Teoderescu, P. Rodriguez, and I. Etxebarria-
Otadui, “Microgrid connection management based on an intelligent connection agent,”
IEEE 36th Annual Conference on Industrial Electronics (IECON), pp. 3028–3033,
Nov. 2010.
[27] R. Majumder, A. Ghosh, G. Ledwich, and F. Zare, “Control of parallel converters for
load sharing with seamless transfer between grid connected and islanded modes,” in
IEEE Power and Energy Society General Meeting, 2008, pp. 1–7.
[28] T. L. Vandoorn, B. Meersman, J. D. M. De Kooning, and L. Vandevelde, “Transition
From Islanded to Grid-Connected Mode of Microgrids With Voltage-Based Droop
Control,” IEEE Transactions on Power Systems, vol. 28, no. 3, pp. 2545–2553, Aug.
2013.
[29] Il-Yop Chung, Wenxin Liu, D. A. Cartes, E. G. Collins, and Seung-Il Moon, “Control
Methods of Inverter-Interfaced Distributed Generators in a Microgrid System,” IEEE
Transactions on Industry Applications, vol. 46, no. 3, pp. 1078–1088, 2010.
[30] C. K. Sao and P. W. Lehn, “Control and Power Management of Converter Fed
Microgrids,” IEEE Transactions on Power Systems, vol. 23, no. 3, pp. 1088–1098,
2008.
[31] F. Shahnia, R. P. S. Chandrasena, S. Rajakaruna, and A. Ghosh, “Primary control
level of parallel distributed energy resources converters in system of multiple
interconnected autonomous microgrids within self-healing networks,” IET
Generation, Transmission & Distribution, vol. 8, no. 2, pp. 203–222, Feb. 2014.
[32] S. J. Ahn, I. Y. Park, I. Y. Chung, S. I. Moon, and et.al, “Power-Sharing Method of
Multiple Distributed Generators Considering Control Modes and Configurations of a

130
Microgrid,” IEEE Transactions on Power Delivery, vol. 25, no. 3, pp. 2007–2016,
2010.
[33] H. Karimi, H. Nikkhajoei, and R. Iravani, “Control of an Electronically-Coupled
Distributed Resource Unit Subsequent to an Islanding Event,” IEEE Transactions on
Power Delivery, vol. 23, no. 1, pp. 493–501, 2008.
[34] R. Majumder, G. Ledwich, A. Ghosh, S. Chakrabarti, and F. Zare, “Droop Control of
Converter-Interfaced Microsources in Rural Distributed Generation,” IEEE
Transactions on Power Delivery, vol. 25, no. 4, pp. 2768–2778, 2010.
[35] J. M. Guerrero, L. Garcia de Vicuna, J. Matas, M. Castilla, and J. Miret, “Output
Impedance Design of Parallel-Connected UPS Inverters With Wireless Load-Sharing
Control,” IEEE Transactions on Industrial Electronics, vol. 52, no. 4, pp. 1126–1135,
Aug. 2005.
[36] F. Shahnia, R. Majumder, A. Ghosh, G. Ledwich, and F. Zare, “Voltage imbalance
analysis in residential low voltage distribution networks with rooftop PVs,” Electric
Power Systems Research, vol. 81, no. 9, pp. 1805–1814, 2011.
[37] F. Shahnia, R. Majumder, A. Ghosh, G. Ledwich, and F. Zare, “Operation and Control
of a Hybrid Microgrid Containing Unbalanced and Nonlinear Loads,” Electric Power
Systems Research, vol. 80, no. 8, pp. 954–965, 2010.
[38] D. De and V. Ramanarayanan, “Decentralized Parallel Operation of Inverters Sharing
Unbalanced and Nonlinear Loads,” IEEE Transactions on Power Electronics, vol. 25,
no. 12, pp. 3015–3025, Dec. 2010.
[39] U. Borup, F. Blaabjerg, and P. N. Enjeti, “Sharing of nonlinear load in parallel-
connected three-phase converters,” IEEE Transactions on Industry Applications, vol.
37, no. 6, pp. 1817–1823, Dec. 2001.
[40] M. Hamzeh, H. Karimi, and H. Mokhtari, “A New Control Strategy for a Multi-Bus
MV Microgrid Under Unbalanced Conditions,” IEEE Transactions on Power Systems,
vol. 27, no. 4, pp. 2225–2232, Nov. 2012.
[41] T. Vandoorn, B. Meersman, J. De Kooning, and L. Vandevelde, “Controllable
Harmonic Current Sharing in Islanded Microgrids: DG Units With Programmable
Resistive Behavior Toward Harmonics,” IEEE Transactions on Power Delivery, vol.
27, no. 2, pp. 831–841, Apr. 2012.
[42] C. Sao and P. W. Lehn, “Voltage balancing of converter fed microgrids with single
phase loads,” IEEE Power and Energy Society General Meeting, pp. 1–7, Jul. 2008.

131
[43] K. Moslehi and R. Kumar, “A Reliability Perspective of the Smart Grid,” IEEE
Transactions on Smart Grid, vol. 1, no. 1, pp. 57–64, Jun. 2010.
[44] X. Fang, S. Misra, G. Xue, and D. Yang, “Smart Grid — The New and Improved
Power Grid: A Survey,” IEEE Communications Surveys & Tutorials, vol. 14, no. 4,
pp. 944–980, Fourth Quarter 2012.
[45] Haoming Liu, Xingying Chen, Kun Yu, and Yunhe Hou, “The Control and Analysis
of Self-Healing Urban Power Grid,” IEEE Transactions on Smart Grid, vol. 3, no. 3,
pp. 1119–1129, Sep. 2012.
[46] M. Kezunovic, “Smart Fault Location for Smart Grids,” IEEE Transactions on Smart
Grid, vol. 2, no. 1, pp. 11–22, Mar. 2011.
[47] K. Moslehi, A. B. R. Kumar, and P. Hirsch, “Feasibility of a self-healing grid - part II
benefit models and analysis,” IEEE Power Engineering Society General Meeting, p. 8
pp., 2006.
[48] A. Zidan and E. F. El-Saadany, “A Cooperative Multiagent Framework for Self-
Healing Mechanisms in Distribution Systems,” IEEE Transactions on Smart Grid,
vol. 3, no. 3, pp. 1525–1539, Sep. 2012.
[49] S. A. Arefifar, Y. A. I. Mohamed, and T. H. M. El-Fouly, “Supply-Adequacy-Based
Optimal Construction of Microgrids in Smart Distribution Systems,” IEEE
Transactions on Smart Grid, vol. 3, no. 3, pp. 1491–1502, Sep. 2012.
[50] A. Košt’álová and P. M. S. Carvalho, “Towards self-healing in distribution networks
operation: Bipartite graph modelling for automated switching,” Electric Power
Systems Research, vol. 81, no. 1, pp. 51–56, Jan. 2011.
[51] R. J. Yinger, “Self-healing circuits at Southern California Edison,” IEEE Transmission
and Distribution Conference and Exposition (T&D), 2012, pp. 1–3, 7.
[52] R. H. Lasseter, “Smart Distribution: Coupled Microgrids,” IEEE Proceedings of the
DOI - 10.1109/JPROC.2011.2114630, vol. 99, no. 6, pp. 1074–1082, 2011.
[53] S. Rahman, M. Pipattanasomporn, and Y. Teklu, “Intelligent Distributed Autonomous
Power Systems (IDAPS),” IEEE Power Engineering Society General Meeting, pp. 1–
8, Jun. 2007.
[54] A. G. Madureira and J. A. Pecas Lopes, “Coordinated voltage support in distribution
networks with distributed generation and microgrids,” IET Renewable Power
Generation, vol. 3, no. 4, pp. 439–454, 2009.

132
[55] K. Pandiaraj, P. Taylor, N. Jenkins, and C. Robb, “Distributed load control of
autonomous renewable energy systems,” IEEE Transactions on Energy Conversion,
vol. 16, no. 1, pp. 14–19, 2001.
[56] R. Majumder, A. Ghosh, G. Ledwich, and F. Zare, “Operation and control of single
phase micro-sources in a utility connected grid,” IEEE Power & Energy Society
General Meeting, pp. 1–7, 2009.
[57] R. Majumder, “Reactive Power Compensation in Single-Phase Operation of
Microgrid,” IEEE Transactions on Industrial Electronics, vol. 60, no. 4, pp. 1403–
1416, Apr. 2013.
[58] J. Bryan, R. Duke, and S. Round, “Decentralized generator scheduling in a nanogrid
using DC bus signaling,” IEEE Power Engineering Society General Meeting, pp. 977–
982 Vol.1, Jun. 2004.
[59] A. Sannino, G. Postiglione, and M. H. J. Bollen, “Feasibility of a DC network for
commercial facilities,” IEEE Transactions on Industry Applications, vol. 39, no. 5, pp.
1499–1507, Oct. 2003.
[60] A. Goikoetxea, J. M. Canales, R. Sanchez, and P. Zumeta, “DC versus AC in
residential buildings: Efficiency comparison,” IEEE EUROCON, 2013, pp. 1–5, Jul.
2013.
[61] Y. Hayashi, “High power density rectifier for highly efficient future DC distribution
system,” Electrical Engineering Research, vol. 1, no. 3, pp. 49–59, 2013.
[62] H. Kakigano, Y. Miura, and T. Ise, “Low-Voltage Bipolar-Type DC Microgrid for
Super High Quality Distribution,” IEEE Transactions on Power Electronics, vol. 25,
no. 12, pp. 3066–3075, Dec. 2010.
[63] H. Kakigano, Y. Miura, and T. Ise, “Distribution Voltage Control for DC Microgrids
Using Fuzzy Control and Gain-Scheduling Technique,” IEEE Transactions on Power
Electronics, vol. 28, no. 5, pp. 2246–2258, May 2013.
[64] I. Cvetkovic, Dong Dong, Wei Zhang, Li Jiang, D. Boroyevich, F. C. Lee, and P.
Mattavelli, “A testbed for experimental validation of a low-voltage DC nanogrid for
buildings,” 15th International Power Electronics and Motion Control Conference
(EPE/PEMC), 2012, pp. LS7c.5–1, Sep. 2012.
[65] A. Suzdalenko, M. Vorobyov, and I. Galkin, “Development of distributed energy
management system for intelligent household electricity distribution grid,” IEEE
EUROCON, 2013, pp. 1474–1478, Jul. 2013.

133
[66] Jaehong Kim, J. M. Guerrero, P. Rodriguez, R. Teodorescu, and Kwanghee Nam,
“Mode Adaptive Droop Control With Virtual Output Impedances for an Inverter-
Based Flexible AC Microgrid,” Power Electronics, IEEE Transactions on, vol. 26, no.
3, pp. 689–701, Mar. 2011.
[67] M. Savaghebi, A. Jalilian, J. C. Vasquez, and J. M. Guerrero, “Secondary Control
Scheme for Voltage Unbalance Compensation in an Islanded Droop-Controlled
Microgrid,” IEEE Transactions on Smart Grid, vol. 3, no. 2, pp. 797–807, Jun. 2012.
[68] A. Mehrizi-Sani and R. Iravani, “Online Set Point Modulation to Enhance Microgrid
Dynamic Response: Theoretical Foundation,” IEEE Transactions on Power Systems,
vol. 27, no. 4, pp. 2167–2174, Nov. 2012.
[69] M. B. Delghavi and A. Yazdani, “Islanded-Mode Control of Electronically Coupled
Distributed-Resource Units Under Unbalanced and Nonlinear Load Conditions,” IEEE
Transactions on Power Delivery, vol. 26, no. 2, pp. 661–673, Apr. 2011.
[70] Xiaonan Lu, J. M. Guerrero, Kai Sun, and J. C. Vasquez, “An Improved Droop
Control Method for DC Microgrids Based on Low Bandwidth Communication With
DC Bus Voltage Restoration and Enhanced Current Sharing Accuracy,” IEEE
Transactions on Power Electronics, vol. 29, no. 4, pp. 1800–1812, Apr. 2014.
[71] T. Dragicevic, J. M. Guerrero, J. C. Vasquez, and D. Skrlec, “Supervisory Control of
an Adaptive-Droop Regulated DC Microgrid With Battery Management Capability,”
IEEE Transactions on Power Electronics, vol. 29, no. 2, pp. 695–706, Feb. 2014.
[72] Y. Ito, Y. Zhongqing, and H. Akagi, “DC microgrid based distribution power
generation system,” The 4th International Power Electronics and Motion Control
Conference(IPEMC), 2004, vol. 3, pp. 1740–1745 Vol.3, Aug. 2004.
[73] Lie Xu and Dong Chen, “Control and Operation of a DC Microgrid With Variable
Generation and Energy Storage,” IEEE Transactions on Power Delivery, vol. 26, no.
4, pp. 2513–2522, Oct. 2011.
[74] P. Thounthong, B. Davat, S. Rael, and P. Sethakul, “Fuel cell high-power
applications,” IEEE Industrial Electronics Magazine, vol. 3, no. 1, pp. 32–46, Mar.
2009.
[75] Hou Yongping, Gang Wan, Jiang Wei, and Zhuang Mingxi, “Steady State
Performance Modeling of a Fuel Cell Engine,” IEEE International Conference on
Vehicular Electronics and Safety, 2006. ICVES 2006., pp. 424–427, Dec. 2006.

134
[76] S. Yerramalla, “Modeling and simulation of the dynamic behavior of a polymer
electrolyte membrane fuel cell,” Journal of Power Sources, vol. 124, pp. 104–113,
2003.
[77] S. Busquet, “A new approach to empirical electrical modelling of a fuel cell, an
electrolyser or a regenerative fuel cell,” Journal of Power Sources, vol. 134, pp. 41–
48, 2004.
[78] D. Yu and S. Yuvarajan, “Electronic circuit model for proton exchange membrane
fuel cells,” Journal of Power Sources, vol. 142, pp. 238–242, 2005.
[79] Ke Jin, Xinbo Ruan, Mengxiong Yang, and Min Xu, “Power Management for Fuel-
Cell Power System Cold Start,” IEEE Transactions on Power Electronics, vol. 24, no.
10, pp. 2391–2395, Oct. 2009.
[80] I. H. Altas and A. M. Sharaf, “A novel on-line MPP search algorithm for PV arrays,”
IEEE Transactions on Energy Conversion, vol. 11, no. 4, pp. 748–754, Dec. 1996.
[81] R. Gules, J. De Pellegrin Pacheco, H. L. Hey, and J. Imhoff, “A Maximum Power
Point Tracking System With Parallel Connection for PV Stand-Alone Applications,”
IEEE Transactions on Industrial Electronics, vol. 55, no. 7, pp. 2674–2683, Jul. 2008.
[82] V. Spitsa, X. Ran, R. Salcedo, J. F. Martinez, R. E. Uosef, F. de Leon, D. Czarkowski,
and Z. Zabar, “On the transient behavior of large-scale distribution networks during
automatic feeder reconfiguration,” IEEE Transactions on Smart Grid, vol. 3, no. 2, pp.
887–896, Jun. 2012.
[83] J. J. Justo, F. Mwasilu, J. Lee, and J. W. Jung, “AC–microgrids versus DC–microgrids
with distributed energy resources: A review,” Renewable Sustainable Energy Reviews,
vol. 24, pp. 387–405, 2013.
[84] J. M. Guerrero, J. C. Vasquez, and R. Teodorescu, “Hierarchical control of droop-
controlled DC and AC microgrids — a general approach towards standardization,”
35th IEEE Annual Conference of Industrial Electronics, 2009. IECON ’09., pp.
4305–4310, Nov. 2009.
[85] F. Katiraei, R. Iravani, N. Hatziargyriou, and A. Dimeas, “Microgrids management,”
IEEE Power and Energy Magazine, vol. 6, no. 3, pp. 54–65, Jun. 2008.
[86] J. C. Vasquez, R. A. Mastromauro, J. M. Guerrero, and M. Liserre, “Voltage Support
Provided by a Droop-Controlled Multifunctional Inverter,” IEEE Transactions on
Industrial Electronics, vol. 56, no. 11, pp. 4510–4519, Nov. 2009.
135
[87] Robert H. Lasseter, “Control and Design of Microgrid Components.” University of
Wisconsin-Madison.
[88] A. M. Salamah, S. J. Finney, and B. W. Williams, “Autonomous controller for
improved dynamic performance of AC grid, parallel-connected, single-phase
inverters,” IET Generation, Transmission & Distribution, vol. 2, no. 2, pp. 209–218,
Mar. 2008.
[89] A. Ghosh and G. Ledwich, “High bandwidth voltage and current control design for
voltage source converters,” 20th Australasian Universities Power Engineering
Conference (AUPEC), 2010, pp. 1–6, Dec. 2010.
[90] A. Tewari, Modern Control Design with Matlab and Simulink. Wiley, 2002.
[91] A. Ghosh and G. Ledwich, “Load compensating DSTATCOM in weak AC systems,”
IEEE Transactions on Power Delivery, vol. 18, no. 4, pp. 1302–1309, Oct. 2003.
[92] H. Bevrani, Robust Power System Frequency Control. Springer, 2009.
[93] B. Pal and B. Chaudhuri, Robust Control in Power Systems. Springer, 2005.
[94] “Western Power Distribution Construction Standards Handbook, 2007 (Available at
http://www.westernpower.com.au/networkcontractors/Distribution_Construction_Stan
dards_Handbook.html).”
[95] W. Enright, O. B. Nayak, G. D. Irwin, and J. Arrillaga, “An electromagnetic transients
model of multi-limb transformers using normalized core concept,” in International
Conference on Power Systems Transients (IPST), 1997, pp. 93–98.
[96] F. Shahnia, A. Ghosh, G. Ledwich, and F. Zare, “Voltage unbalance improvement in
low voltage residential feeders with rooftop PVs using custom power devices,”
International Journal of Electrical Power & Energy Systems, vol. 55, no. 9, pp. 362–
377, 2014.
[97] Sreenivasarao, Agarwal, and Das, “A T-connected transformer based hybrid
DSTATCOM for three-phase, four-wire systems,” International Journal of Electrical
Power & Energy Systems, vol. 44, no. 1, pp. 964– 970, 2013.
[98] S. Mazumder, A. Ghosh, F. Shahnia, F. Zare, and G. Ledwich, “Excess power
circulation in distribution networks containing distributed energy resources,” IEEE
Power and Energy Society General Meeting, pp. 1–8, Jul. 2012.
[99] F. Shahnia, A. Ghosh, G. Ledwich, and F. Zare, “An approach for current balancing in
distribution networks with rooftop PVs,” in IEEE Power and Energy Society General
Meeting (PES), San Diego, USA, 2012, pp. 1– 6.

136
[100] B. Han, B. Bae, S. Baek, and G. Jang, “New configuration of UPQC for medium-
voltage application,” IEEE Transactions on Power Delivery, vol. 21, no. 3, pp. 1438–
1444, Jul. 2006.
[101] A. Ghosh and A. Joshi, “A new approach to load balancing and power factor
correction in power distribution system,” IEEE Transactions on Power Delivery, vol.
15, no. 1, pp. 417–422, Jan. 2000.
[102] A. Ghosh, A. K. Jindal, and A. Joshi, “Inverter control using output feedback for
power compensating devices,” Conference on Convergent Technologies for the Asia-
Pacific Region (TENCON ),2003, vol. 1, pp. 48–52 Vol.1, Oct. 2003.
[103] G. Ramakrishna and O. P. Malik, “Radial basis function identifier and pole-shifting
controller for power system stabilizer application,” IEEE Transactions on Energy
Conversion, vol. 19, no. 4, pp. 663–670, Dec. 2004.
[104] M. Akbari, S. M. M. Tafreshi, and M. A. Golkar, “Voltage control of a hybrid ac/dc
microgrid in stand-alone operation mode,” IEEE Innovative Smart Grid Technologies
- India (ISGT India), 2011, pp. 363–367, Dec. 2011.
Every reasonable effort has been made to acknowledge the owners of copyright materials. I
would be pleased to hear from any copyright owner who has been omitted or incorrectly
acknowledged.

137
Publications arising from the thesis
Book Chapters
(1) F. Shahnia, R.P.S. Chandrasensa, S. Rajakaruna, and A. Ghosh,
“Interconnected off-grid microgrids in smart grids with self-healing
capability.” in Renewable Energy Integration, Challenges and Solutions,
edited by Hossain, Jahangir, Mahmud, Apel, pp. 347-381, Springer, 2014.
Journal papers (Published)
(2) F. Shahnia, R.P.S. Chandrasena, S. Rajakaruna and A. Ghosh,
“Application of DSTATCOM for Surplus Power Circulation in MV and LV
Distribution Networks with Single-phase Distributed Energy Resources,”
Electric Power Systems Research, Vol. 117, pp. 104-114, Dec. 2014.
(3) F. Shahnia, R.P.S. Chandrasena, S. Rajakaruna and A. Ghosh, “Primary
control level of parallel distributed energy resources converters in system of
multiple interconnected off-grid microgrids within self-healing networks,”
IET Generation, Transmission and Distribution, Vol. 8, Issue 2, pp. 203–222,
2014.
(4) R.P.S. Chandrasena, F. Shahnia, S. Rajakaruna and A. Ghosh, “Dynamic
Operation and Control of a Hybrid Nanogrid System for Future Community
Houses,” Accepted to published in IET Generation, Transmission and
Distribution future publication.
Journal papers (Under Review/Revision)
(5) R.P.S. Chandrasena, F. Shahnia, S. Rajakaruna and A. Ghosh, “Power
Management, Operation and Control of Unequally Distributed Single-Phase
DERs among the Three Phases of a Microgrid,” Provincially accepted to be
published in Electric Power Components and Systems future publication.
Conference papers (Published)
(6) R.P.S. Chandrasena, F. Shahnia and S. Rajakaruna, “Energy storage
options for microgrid applications: A review,” IEEE 9th International

138
Conference on Industrial and Information Systems (ICIIS), Gwalior, India,
Dec. 2014.
(7) R.P.S. Chandrasena, F. Shahnia, A. Ghosh and S. Rajakaruna, “Operation
and control of a hybrid ac-dc nanogrid for future community houses,” 24th
Australasian Universities Power Engineering Conference (AUPEC), Perth,
Australia, Sep/Oct. 2014.
(8) R.P.S. Chandrasena, F. Barbieri, F. Shahnia, A. Ghosh and S. Rajakaruna,
“Developing the guidelines for fabrication of laboratory prototype voltage
source converters,” 24th Australasian Universities Power Engineering
Conference (AUPEC), Perth, Australia, Sep/Oct. 2014.
(9) R.P.S. Chandrasena, F. Shahnia, A. Ghosh and S. Rajakaruna, “Secondary
control in microgrids for dynamic power sharing and voltage/frequency
adjustment,” 24th Australasian Universities Power Engineering Conference
(AUPEC), Perth, Australia, Sep/Oct. 2014.
(10) F. Barbieri, R.P.S. Chandrasena, F. Shahnia, S. Rajakaruna and A.
Ghosh,” Application notes and recommendations on using TMS320F28335
digital signal processor to control voltage source converters,” 24th
Australasian Universities Power Engineering Conference (AUPEC), Perth,
Australia, Sep/Oct. 2014.
(11) F. Shahnia, R.P.S. Chandrasena, A. Ghosh and S. Rajakaruna,
“Application of DSTATCOM for surplus power circulation in MV and LV
distribution networks with single-phase distributed energy resources,” IEEE
Power and Energy Society General Meeting (PES), Washington DC, USA,
July 2014.
(12) R.P.S. Chandrasena, F. Shahnia, S. Rajakaruna and A. Ghosh, “Operation
and control of three phase microgrids consisting of single-phase DERs,”
IEEE 8th International Conference on Industrial and Information Systems
(ICIIS), Kandy, Sri Lanka, Dec. 2013.
(13) R.P.S. Chandrasena, Farhad Shahnia, S. Rajakaruna and A. Ghosh,
“Control, operation and power sharing among parallel converter-interfaced
DERs in a microgrid in the presence of unbalanced and harmonic loads,” 23rd
Australasian Universities Power Engineering Conference (AUPEC), Hobart,
Australia, Sep. 2013.

139
(14) Farhad Shahnia, R.P.S. Chandrasena, S. Rajakaruna and A. Ghosh, “Off-
grid operation of multiple interconnected microgrids with self-healing
capability,” IEEE Power and Energy Society General Meeting (PES), pp. 1-5,
Vancouver, Canada, July 2013.
(15) M.S. Alotibe, R.P.S. Chandrasena and S. Rajakaruna, “Simplified voltage
and frequency controller based on droop control for the dynamic analysis of a
Microgrid,” 22nd Australasian Universities Power Engineering Conference
(AUPEC), pp. 1-8, Bali, Indonesia, Sep. 2012.


141
Appendix
Technical data and parameters
Table A. 1 PV, Boost Chopper, Converter and Controller
No. of PV cells in series 2
No. of PV cells in parallel 3
Output voltage of PV cell 0.1 V dc
Rated output power 3.06 kW
Radiation level 1100
Ambient Temperature 30o C
Output voltage of Chopper 250 V dc
Boost Chopper Parameters L =10 mH, C = 5 mF
Boost Chopper Controller Hysteresis Voltage Control, kp =0.0001,
Hys.bandwidth =0.0002
Converter Structure 3 single-phase H-bridge converter
Converter Loss R =0.1 per phase
Transformer 0.25/0.415 kV, 0.5 MVA, Lr = 4.4 mH
LC Filter Lf =49.8 mH, Cf =50 F
Hysteresis Constant 10–5
Table A. 2 Battery, Converter and Controller
No. of battery units in series 10
No. of battery units in parallel 2
output voltage of battery unit 12 V DC
Rated output power 2 kW, 226 A.hr
Converter Structure 3 single-phase H-bridge converter
Converter Loss R=0.1 per phase
Transformer 0.12/0.415 kV, 0.5 MVA, Lr = 4.4 mH
LC Filter Lf =76.2 mH, Cf =50 F
Hysteresis Constant 10–5

142
Table A. 3 Fuel Cell, Boost Chopper, Converter and Controller
Fuel cell rated power 4 kW
Boost Chopper Parameters L =1 mH, C =1 mF, fsw =10 kHz
Boost Chopper Controller Open loop control, Switch duty cycle=10%
Converter Structure 3 single-phase H-bridge converter
Converter Loss R =1.5 per phase
Transformer 0.4/0.415 kV, 0.25 MVA, Lr = 0.54 mH
LC Filter Lf =38.1 mH, Cf =50 F
Hysteresis Constant 10–5