Study on Heat and Mass Transfer During Urea Prilling Process
Contents lists available at ScienceDirect
International Journal of Pharmaceutics
journal homepage: www.elsevier.com/locate/ijpharm
Prilling of API/fatty acid suspensions: Processability and characterisationE. De Conincka, V. Vanhoornea, A. Elmahdyb, M. Boonec, G. Van Assched, D. Markle,f,B.G. De Geesta, T. De Beerg, C. Vervaeta,⁎
a Laboratory of Pharmaceutical Technology, Ghent University, Ghent, BelgiumbMaterials Science and Technology – DyMaLab Research Group, Department of Electromechanical Systems and Materials, Ghent University, Zwijnaarde, Belgiumc Centre for X-ray Tomography (UGCT), Department of Physics and Astronomy, Ghent University, Ghent, Belgiumd Physical Chemistry and Polymer Science, Vrije Universiteit Brussel, Brussels, Belgiume Strathclyde Institute of Pharmacy and Biomedical Sciences, University of Strathclyde, Glasgow, United Kingdomf EPSRC Centre for Innovative Manufacturing in Continuous Manufacturing and Crystallisation, University of Strathclyde, Glasgow, United Kingdomg Laboratory of Pharmaceutical Process Analytical Technology, Ghent University, Ghent, Belgium
A R T I C L E I N F O
Keywords:PrillingControlled releaseMultiparticulate dosage formsFatty acidsMetformin hydrochlorideParacetamol
A B S T R A C T
Current study evaluated the processability and characteristics of prills made of an active pharmaceutical in-gredient/fatty acid (API/FA) suspension instead of previously studied API/FA solutions to enlarge the applica-tion field of prilling. Metformin hydrochloride (MET) and paracetamol (PAR) were used as model APIs whileboth the effect of drug load (10–40%) and FA chain length (C14–C22) were evaluated. API/FA suspensions wereprocessable on lab-scale prilling equipment without thermal degradation, nozzle obstruction or sedimentation infunction of processing time. The collected prills were spherical (AR≥0.898) with a smooth surface (spheri-city≥ 0.914) and a particle size of± 2.3mm and 2.4mm for MET and PAR prills, respectively, independent ofdrug load and/or FA chain length. In vitro drug release evaluation revealed a faster drug release at higher drugload, higher API water solubility and shorter FA chain length. Solid state characterisation via XRD and Ramanspectroscopy showed that API and FA crystallinity was maintained after thermal processing via prilling andduring storage. Evaluation of the similarity factor indicated a stable drug release (f2 > 50) from MET and PARprills after 6months storage at 25 °C or 40 °C.
1. Introduction
Due to their biocompatibility, low toxicity, low cost and pharma-ceutical approved status, lipids (e.g. oils, waxes, triglycerides, partialglycerides, fatty alcohols and fatty acids (FAs)) have gained interest inthe pharmaceutical industry as versatile excipients to mask taste, pro-tect unstable active pharmaceutical ingredients (APIs), increase thebioavailability and sustain the dissolution rate (Pivette et al., 2012;Rosiaux et al., 2014; Jannin et al., 2008; Reitz and Kleinebudde, 2007;Becker et al., 2015; Aleksovski et al., 2016). Solid lipid-based drugformulations can be produced via solvent-free melting techniques, suchas melt extrusion, melt coating and spray congealing, all relativelyshort, cost-effective and environmentally friendly production processes
(Jannin et al., 2008; Becker et al., 2015; Aleksovski et al., 2016;Vervaeck et al., 2015). Via spray congealing spherical microspheresconsisting of a drug imbedded in a lipid matrix can be produced(Passerini et al., 2010; Martins et al., 2013). A specific type of spraycongealing, called prilling, yields larger spherical particles (dia-meter > 500 µm) resulting in a slower controlled release system andexcellent flow properties for volumetric capsule filling (Rosiaux et al.,2014; Becker et al., 2015; Séquier et al., 2014; Vervaeck et al., 2013).
Although prilling is widely applied in the agricultural industry forthe production of urea beads (Mehrez et al., 2014; Rahamnian andHomayoonfard, 2012; Rahmanian et al., 2013; Rahmanian et al., 2015),its applications in the pharmaceutical field are limited as stated byAleksovski et al. (2016). Pivette et al. examined the controlled-release
https://doi.org/10.1016/j.ijpharm.2019.118756Received 4 August 2019; Received in revised form 29 September 2019; Accepted 30 September 2019
Abbreviations: API, active pharmaceutical ingredient; BA, behenic acid; FA, fatty acid; fps, frames per second; MA, myristic acid; MET, metformin hydrochloride;MPT, metoprolol tartrate; NA, not applicable; PA, palmitic acid; PAR, paracetamol; RH, relative humidity; RHC, rapid heat-cool differential scanning calorimetry; SA,stearic acid; SD, standard deviation; SEM, scanning electron microscopy; SLS, sodium lauryl sulfate; SNV, standard normal variate; TGA, thermogravimetric analysis;USP, United States Pharmacopeia; XRD, X-ray diffraction
⁎ Corresponding author at: Laboratory of Pharmaceutical Technology, Ghent University, Ottergemsesteenweg 460, 9000 Ghent, Belgium. Tel.: +32 9 264 80 69.E-mail addresses: [email protected] (E. De Coninck), [email protected] (V. Vanhoorne), [email protected] (A. Elmahdy),
[email protected] (M. Boone), [email protected] (G. Van Assche), [email protected] (D. Markl), [email protected] (B.G. De Geest),[email protected] (T. De Beer), [email protected] (C. Vervaet).
International Journal of Pharmaceutics 572 (2019) 118756
Available online 21 October 20190378-5173/ © 2019 Elsevier B.V. All rights reserved.
T
mechanism of a highly water-soluble API from lipid microspherescomposed of Compritol 888 and paraffin wax (Pivette et al., 2012).Vervaeck et al. demonstrated that long chain FAs, such as stearic acid(SA) and behenic acid (BA), are excellent matrix formers in a multi-particulate controlled release dosage form manufactured by prilling(Vervaeck et al., 2013). FAs are used as a versatile pharmaceuticalexcipient (e.g. binder during melt granulation (Maejima et al., 1997;Bhagwat et al., 2008), taste masking (Qi et al., 2006; Robson et al.,1999), (enteric) hot-melt coating (Patil et al., 2012; Kulah and Kaya,2011; Jannin and Cuppok, 2013) or matrix for sustained drug releasevia melt agglomeration (Bhagwat et al., 2008; Voinovich et al., 2000).
As the API can be dissolved or suspended in a (mixture of) moltenFA during processing, the physical state of the drug during prillingcould affect processing as well as the characteristics of the prills. AsVervaeck et al. focused on API/FA solutions (e.g. metoprolol tartrate(MPT) in BA) (Vervaeck et al., 2015), no information is available on thefeasibility of prilling API/FA suspensions, as indicated by Séquier et al.(Séquier et al., 2014). Therefore, the aim of current study was toevaluate the potential of prilling for APIs suspended in molten FA. Tofully understand the effect of suspended API particles in the molten FAduring processing, the API-FA solutions of Vervaeck et al. (i.e. MPT inBA) were further investigated in this study (Vervaeck et al., 2015;Vervaeck et al., 2013).
In the first part of this study, the processability of API/FA suspen-sions via prilling was evaluated. An API/FA suspension was defined asprocessable when prills could be generated without thermal degrada-tion, nozzle obstruction or sedimentation during processing at a suffi-ciently high drug load. The second part of this study characterised thefinal prills in terms of size, shape, solid state and dissolution profile.Droplet formation at the nozzle and its solidification in liquid nitrogenwas visualized via high-speed imaging and quantified via rapid heat-cool differential scanning calorimetry (RHC). Metformin hydrochloride(MET) and paracetamol (PAR) were selected as model APIs, both highlysoluble in water and insoluble in FA. Formulations with varying drugload (10–40%) and FA chain lengths (C14–C22) were produced toevaluate the processability of API/FA suspensions and their prill char-acteristics.
2. Materials and methods
2.1. Materials
Four long chain saturated FAs with different carbon chain lengths(C14, C16, C18 and C22) were evaluated: myristic acid (MA) with a C14purity of 99.2%, palmitic acid (PA) with a C16 purity of 99.3%, SA witha C18 purity of 98.3% (Mosselman, Ghlin, Belgium) and BA with a C22purity of 88.9% (Radiacid 0560, Oleon, Ertvelde, Belgium). The meltingpoint of MA, PA, SA and BA is 53 °C, 62 °C, 68 °C and 75 °C, respec-tively. These FAs were combined with MET (Granules, Hyderabad,India), PAR (Mallinckrodt, Manchester, UK) or MPT (Esteve Quimica,Barcelona, Spain) as model drugs with a water solubility of 297 g/l, 8 g/l and 682 g/l (20 °C), respectively. Prills were dissolved in absolute(> 99.8%) ethanol (VWR, Radnor, United States). Dissolution mediawere made with sodium lauryl sulfate (SLS) (Fagron, Waregem,Belgium), potassium dihydrogen phosphate (VWR, Radnor, UnitedStates), sodium hydroxide (Sigma Aldrich, Saint Louis, United States)and hydrochloric acid (VWR, Radnor, United States).
2.2. Methods
2.2.1. PrillingPrills were manufactured using a modified Prilldrop® device (Peira,
Turnhout, Belgium), depicted in Fig. 1. FAs were heated to 30 °C abovetheir melting temperature and subsequently the API was added to themolten FA under continuous stirring (350 rpm – 8 cm long stirring bar).After 15min of intensive stirring at a constant temperature, the prilling
process was started by applying an initial pressure (1 bar) on the re-servoir to feed the viscous API/FA suspension to the thermostatednozzle (Tnozzle= Tmelt FA+30 °C; inner nozzle diameter: 445 µm). Theflow rate through this nozzle was controlled with a pneumatic valvesystem with a calibrated drop time for non-viscous pure water. In-dividual API/FA droplets were formed at the nozzle by lowering thepressure on the vessel (0.1 bar) and adjusting the valve opening (droptime: 0.03 s; interval: 0.10 s). Under these conditions, approximately150 API/FA suspension droplets/min were formed at the nozzle. Theindividual droplets were quench cooled in liquid nitrogen whereby asolid matrix system (prill) was formed.
The effect of drug load (10–40%) and FA chain length (C14–C22) onthe processability of API/FA suspensions and the characteristics of prillswas evaluated, manufacturing 12 different formulations (Table 1). Allformulations were produced in duplicate to evaluate the drug content,solid state, as well as size and shape of the prills for two independentbatches, while the dissolution profile after manufacturing and duringstorage was evaluated for one batch.
2.2.2. Thermogravimetric analysis (TGA)The thermal stability of pure FAs and APIs under extreme processing
conditions (i.e. 2 h at 105 °C) was screened via TGA (Hi-res TGA 2950,TA instruments, Leatherhead, UK). The samples (± 15mg) were he-ated to 110 °C and kept isothermal for 2 h while recording the weightloss.
2.2.3. Hot stage microscopyThe solubility of MET and PAR in molten FAs was determined via
hot stage microscopy (Leica, Wetzlar, Germany). Therefore, a physicalmixture of 1% API in FA was filled in a quartz crucible (diameter:15mm) and heated to 30 °C above the melting temperature of the FA.Physical mixtures were obtained after sieving (180 µm) all compoundsfollowed by homogenous blending (Turbula mixer type T2F, W.A.Bachofen Maschinenfabrik, Basel, Switzerland). The API was defined asinsoluble in the molten FA when API crystals were still visible (mag-nification: 100×) after maintaining the physical mixture at the max-imum processing temperature (Tmelt FA+30 °C) for 1 h.
2.2.4. Rapid heat-cool differential scanning calorimetry (RHC)To evaluate the crystallization kinetics of API/FA solutions and
suspensions, a prototype RHC (TA Instruments, Leatherhead, UK)equipped with a liquid nitrogen cooling unit was used. Tzero calibra-tion was performed at 250 °C/min with sapphire disks, while an indiumstandard was used for the temperature and enthalpy calibration.220 ± 20 µg of pure FA or physical mixtures (125 µm) were filled inlow mass (≤2.1mg) aluminium RHC crucibles. To obtain a pre-treat-ment similar to the prilling process, all samples were kept 30 °C abovethe melting temperature of the used FA for 10min to ensure completemelting of FA and to allow sufficient time for MPT crystals to dissolve.Subsequently, the sample was rapidly cooled (250 °C/min) to a specificcrystallization temperature (68.0 °C, 69.0 °C, 70.0 °C, 70.5 °C, 71.0 °C,71.5 °C and 72.0 °C) and kept isothermal for 2min. Thereafter thesample was cooled down (500 °C/min) to −50 °C and a new pre-treatment was started. The time needed to reach the FA crystallizationpeak maximum when the crystallization temperature was reached, wasused to compare the crystallization rate of the samples.
2.2.5. Size and shape of the suspended APIsSince API particles and/or agglomerates can obstruct the nozzle,
particle size and shape distribution of the suspended APIs was de-termined. The particle size and shape of the dry API powder was ana-lysed via a dynamic image analyser (Camsizer XT, Retsch Technology,Haan, Germany) equipped with an air pressure dispersion unit set at180 – 185 kPa (X-jet, Retsch Technology, Haan, Germany). Powderswere analysed in triplicate to calculate the mean Feret diameter andweighted average aspect ratio (ratio of the minimal to the maximal
E. De Coninck, et al. International Journal of Pharmaceutics 572 (2019) 118756
2
Feret diameter) based on a volume distribution. Additionally, the shapeof the dry API particles was visualized by scanning electron microscopy(SEM) (Quanta 200F, Thermo Fisher Scientific, Waltham, USA) after
sputtering with a gold coating (thickness: 45–50 nm) using an EmtechSC7620 sputter coater (Quorum Technologies, Laughton, UnitedKingdom) to improve the electron conductivity of the samples.
To evaluate API agglomeration in a hydrophobic environment suchas molten FAs, laser diffraction (Malvern Mastersizer S long bench,Malvern Instruments, Malvern, UK) was applied on dispersions of theAPI in Miglyol 812® (IOI Oleo, Hamburg, Germany). As a pre-treat-ment, dispersions were vortexed and subsequently sonicated for 10min(i.e. standard method), ultrasonically vibrated (4 h – 40 kHz) or highshear mixed (10min – 6000 rpm) in a Silverson L4R (EastLongmeadow, United States). After transfer to the wet sample disper-sion unit (1500 rpm) to obtain an obscuration of 10–30%, the sampleswere analysed using a 300RF lens (Malvern Instruments, Malvern, UK).d50 and d90 were determined on a volume-based distribution afterperforming measurements in triplicate.
2.2.6. Drug contentHomogeneity of drug content in the prills as a function of processing
time was assessed over a 1 h period at 6min intervals. Drug content wasspectrophotometrically determined using a double beam spectro-photometer (UV-1650PC, Shimadzu, Antwerp, Belgium) after dissol-ving ± 35mg prills (i.e. 5 prills) in absolute ethanol. MET concentra-tions were calculated based on a calibration curve ranging from 1.9 to9.6 µg/ml at a wavelength of 239 nm. PAR concentrations were calcu-lated based on a calibration curve ranging from 2.2 to 13.0 µg/ml at a
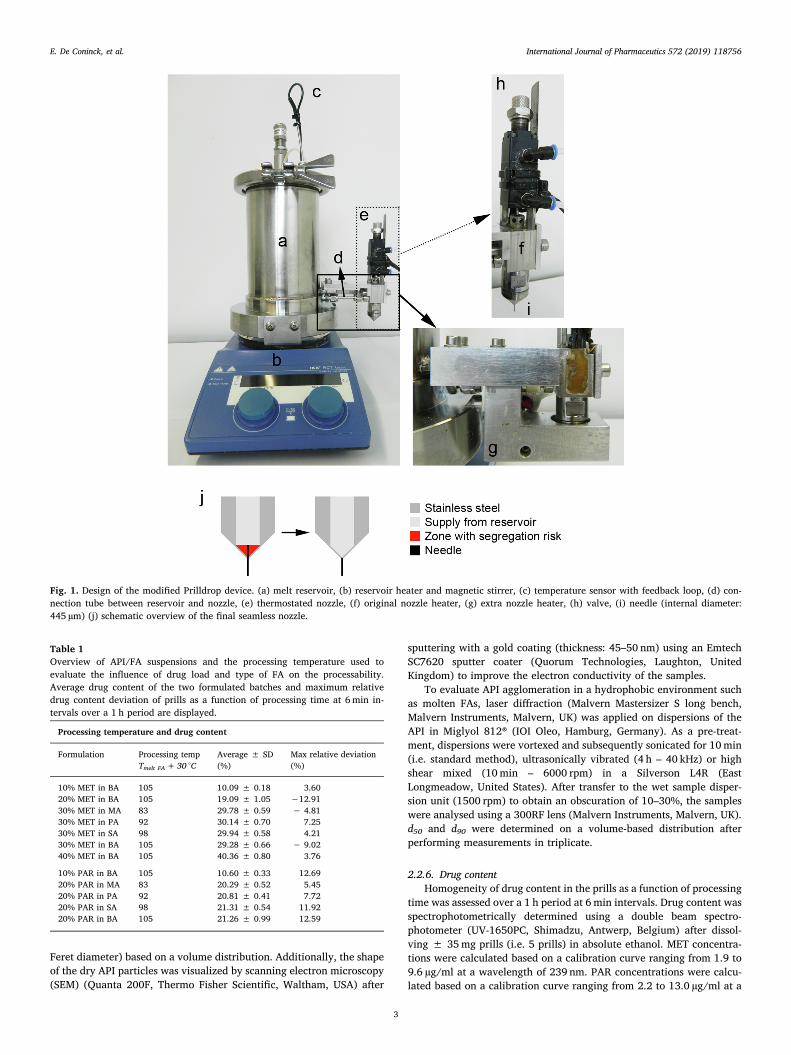
Fig. 1. Design of the modified Prilldrop device. (a) melt reservoir, (b) reservoir heater and magnetic stirrer, (c) temperature sensor with feedback loop, (d) con-nection tube between reservoir and nozzle, (e) thermostated nozzle, (f) original nozzle heater, (g) extra nozzle heater, (h) valve, (i) needle (internal diameter:445 µm) (j) schematic overview of the final seamless nozzle.
Table 1Overview of API/FA suspensions and the processing temperature used toevaluate the influence of drug load and type of FA on the processability.Average drug content of the two formulated batches and maximum relativedrug content deviation of prills as a function of processing time at 6min in-tervals over a 1 h period are displayed.
Processing temperature and drug content
Formulation Processing temp Average ± SD Max relative deviationTmelt FA+ 30 °C (%) (%)
10% MET in BA 105 10.09 ± 0.18 3.6020% MET in BA 105 19.09 ± 1.05 −12.9130% MET in MA 83 29.78 ± 0.59 − 4.8130% MET in PA 92 30.14 ± 0.70 7.2530% MET in SA 98 29.94 ± 0.58 4.2130% MET in BA 105 29.28 ± 0.66 − 9.0240% MET in BA 105 40.36 ± 0.80 3.76
10% PAR in BA 105 10.60 ± 0.33 12.6920% PAR in MA 83 20.29 ± 0.52 5.4520% PAR in PA 92 20.81 ± 0.41 7.7220% PAR in SA 98 21.31 ± 0.54 11.9220% PAR in BA 105 21.26 ± 0.99 12.59
E. De Coninck, et al. International Journal of Pharmaceutics 572 (2019) 118756
3
wavelength of 250 nm. The deviation in drug content relative to thetargeted drug content for each time interval and the average drugcontent of the two independent batches of each formulation were cal-culated.
Via Raman microscopic mapping (Raman Rxn1 Microprobe, KaiserOptical Systems, Ann Arbor, USA) the API distribution in the FA matrixwas evaluated. Cross sections of prills were scanned in both the x and ydirections with a 10× objective lens in area mapping mode using anexposure time of 5 s with 3 accumulations and a step size of 50 µm. Datacollection and data transfer were automated using HoloGRAMS™ datacollection software (version 2.3.5, Kaiser Optical Systems, Ann Arbor,USA), the HoloMAP™ data analysis software (version 2.3.5, KaiserOptical Systems, Ann Arbor, USA) and Matlab software (version 7.1,The MathWorks, Natick, MA, USA). Each mapping was evaluated viamultivariate curve resolution (MCR) to evaluate the homogeneity of theAPI distribution in the FA matrix. Therefore, all spectra of each map-ping were merged in a data matrix and baseline corrected via Pearson’smethod and subsequently normalized.
2.2.7. High-speed imagingDroplet formation at the nozzle and their solidification in liquid
nitrogen was visualized using a Photron Mini AX200 high-speed camera(San Diego, USA) available at DyMaLab at Ghent University, togetherwith adequate lighting. The camera was equipped with a fixed focusmacro lens (Tamron, New York, USA), having a 90mm focal length.Image resolution and frame rate were adjusted during the differentexperiments in order to optimize the visualization of droplet formationand solidification events. The ranges of the image resolutions used were1024×725 to 640× 464 pixels, and the ranges of the frame rates were4000–6400 fps.
2.2.8. Size and shape of the prillsSurface and cross section of prills were examined by SEM (Quanta
200F, Thermo Fisher Scientific, Waltham, USA) after sputtering with agold coating using an Emtech SC7620 sputter coater (QuorumTechnologies, Laughton, United Kingdom) to improve the electronconductivity of the samples.
Size and shape (i.e. aspect ratio and sphericity) of the prills wereevaluated via a dynamic imaging analysis technique (QICPIC,Sympatec, Clausthal-Zellerfeld, Germany). All batches were analysed intriplicate (± 2 g) and Windox 5 software (Sympatec, Clausthal-Zellerfeld, Germany) was used to calculate the mean Feret diameter,weighted average aspect ratio and sphericity (ratio of the perimeter ofthe equivalent circle, PEQPC, to the real perimeter) based on a volumedistribution. The average values of the two batches per formulationwere reported.
2.2.9. Rheology of molten mixturesThe viscosity of pure FA, API/FA suspensions and API/FA solutions
was measured using a stress controlled Haake™ Mars III rheometer(Thermo Fisher Scientific, Waltham, USA) with a 60mm titaniumparallel plate geometry. Depending on their viscosity, samples wereanalysed with flat, non-polished plates or serrated plates to obtain re-liable rheological results that were not influenced by apparent wall slipor protrusion flow (Barnes, 1995; Marchesini et al., 2015). Via a Peltiertemperature controller, the plates were kept at the standard processingtemperature used for prilling (i.e. Tmelt FA+30 °C).
The samples were measured using a gap between the plates of2 ± 0.1mm, this ensured that the gap was at least 10 times larger thanthe particle size of the suspended particles to obtain a continuousmedium (Mendes et al., 2014). The shear rate was varied from 3000 to0.1 s−1 or 500 to 0.01 s−1 in 15 steps (log scale) for measurementsperformed with flat or serrated plates, respectively. Each step was heldfor 30 s to give the sample enough time to stabilize and record an ac-curate torque value. Since sedimentation could occur during sampleloading, the shear rate was varied from higher to lower values to obtain
repeatable rheological results (Marchesini et al., 2015; Mueller et al.,2010). All measurements were performed in triplicate, and the averageand standard deviation were calculated.
2.2.10. Solid state characterisationThe solid state of pure components, physical mixtures (180 µm) and
corresponding prills was analysed via X-ray diffraction (XRD) andRaman spectroscopy. XRD patterns were recorded with a D5000 Cu Kαdiffractor (ʎ= 0.154 nm) (Siemens, Karlsruhe, Germany) with a vol-tage of 40mV in the angular range of 4° < 2θ < 60° using a step scanmode with step size of 0.02° and counting time of 1 s/step.
Raman spectra were recorded in triplicate with a Raman Rxn1spectrometer (Kaiser Optical Systems, Ann Arbor, USA) equipped withan air-cooled CCD detector and a 785 nm Invictus NIR diode laser overthe 0–1800 cm−1 range with a resolution of 4 cm−1, an exposure timeof 5 s and 3 accumulations. Data collection and data transfer were au-tomated using HoloGRAMS™ data collection software (version 2.3.5,Kaiser Optical Systems, Ann Arbor, USA). Spectra were corrected bystandard normal variate (SNV) pre-processing and centred prior to dataanalysis using Simca 14.1.0 (Umetrics, Umeå, Sweden).
2.2.11. In vitro drug releaseIn vitro dissolution tests were performed using USP dissolution
apparatus 2 (paddle speed: 100 rpm) in combination with sinker bas-kets to prevent floating of the hydrophobic prills. The dissolution ap-paratus consisted of a VK 7010 dissolution system coupled to a VK 8000automatic sampling station (Vankel, New Jersey, USA). Prills equiva-lent with 150mg API (sink conditions) were added to 900ml dissolu-tion medium maintained at 37 ± 0.5 °C. Four types of dissolutionmedia were used to evaluate the influence of pH and/or surfactants onthe drug release profile: demineralized water, phosphate buffer (pH7.4), 0.1M HCl (pH 1) and 0.1% SLS aqueous solution. In case of dis-solution tests on MET prills, 5 ml samples were withdrawn on 10 timepoints over a 5 h, 8 h or 12 h period, depending on the drug release rate.For dissolution tests on PAR prills, ten 5ml samples were withdrawnduring 24 h (i.e. 0.5, 1, 2, 4, 6, 8, 12, 16, 20 and 24 h). Those sampleswere analysed spectrophotometrically using a double beam spectro-photometer (UV-1650PC, Shimadzu, Antwerp, Belgium) to calculatethe API concentration from a calibration curve ranging from 1.5 to 14.7µg/ml at a wavelength of 234 nm for MET samples and from 1.7 to 16.9µg/ml at 243 nm for PAR samples.
Similarity between the dissolution profiles obtained in differentmedia was evaluated by calculating the similarity factor f2 as describedby Shah et al. (Eq. (1)), where Rt and St represent the cumulative drugrelease at sample point t of the sample in the reference medium and thesample in the alternative medium, and with n equal to the number oftotal sample points. As described by Shah et al., maximum one samplepoint with a cumulative drug release higher than 85% may be includedto avoid bias in the similarity assessment. Therefore, depending on thedrug release profile, 5–10 sample time points were taken into accountto calculate the similarity factor. Dissolution profiles are consideredsimilar if f2 is ≥50, which corresponds to an average difference of lessthan 10% at all sampling time points (Shah et al., 1998).
= +=
fn
S R50log 1 1 ( ) 100t
nt t2 10 1
21/2
(1)
2.2.12. StorageProcessing and storage of API/FA formulations can change the
crystalline state of formulation components and/or induce interactionsat molecular level between the different components (Becker et al.,2015; Vervaeck et al., 2014; Del Gaudio et al., 2009; Garti and Sato,1988). Therefore, a stability study was performed whereby immediatelyafter production the prills were packed in hermetically sealed bagsunder controlled circumstances (< 35% RH) and stored at 25 °C and
E. De Coninck, et al. International Journal of Pharmaceutics 572 (2019) 118756
4
40 °C for 1 week, 1month, 3months and 6months. Beside evaluation ofthe solid state after storage, the drug release profile was re-evaluatedthroughout the stability study in demineralized water and 0.1% SLSsolution for MET and PAR prills, respectively, by evaluation of the si-milarity factor.
2.2.13. X-ray tomographyThe specific surface area and porosity of prills before and after
dissolution were evaluated using high-resolution X-ray computed to-mography. The scans were performed at the custom-designed micro-CTsetup HECTOR of the Ghent University Centre for X-ray Tomography(UGCT) (Masschaele et al., 2013). The tube voltage was set to 90 kV andthe power of the system was 10W. The exposure time for each projectimage was 1000ms and 2401 projection images were recorded over a360° rotation. The raw data was reconstructed using Octopus Re-construction (TESCAN-XRE, Ghent, Belgium), using the Paganin phaseretrieval algorithm (Paganin et al., 2002). An isotropic voxel size of4 µm was used to analyse at least 15 prills for one batch per formula-tion.
Bespoke data processing was developed in Avizo Fire 9.5 (FEIVisualization Sciences Group, Burlington, United States) to determinethe specific surface area of each prill from the 3D X-ray tomographydata. Initially, the tomography images were denoised using an aniso-tropic diffusion filter in order to improve the robustness of the sub-sequent steps. Thresholding was used to determine a binary volumefrom the denoised data. A marker-based Watershed algorithm was ap-plied on the binary volume to separate the prills and facilitate theanalysis of individual prills. The number of prills analysed is slightlysmaller (i.e. at least 10 prills per formulation) than the total number ofprills imaged as only prills visible in their entirety and clearly separatedfrom each other were analysed. The specific surface area was de-termined per prill and used to normalize surface area to the prill vo-lume. The porosity was determined from the binary volume of all prills.
3. Results and discussion
3.1. Processability
MET and PAR were selected as model APIs to evaluate the proces-sability of API/FA suspensions since thermogravimetric analyses in-dicated no thermal degradation of these APIs or FAs under extremeprocessing conditions (i.e. 2 h at 105 °C), while hot stage microscopydemonstrated their insolubility in molten FA under the applied pro-cessing conditions (Fig. S1).
Prilling of API/FA suspensions initially resulted in obstruction of the445 µm nozzle due to solidification of FA and/or (agglomeration of) thesuspended particles. Solidification of molten FA in the nozzle wasavoided by installing an extra heating pad around the nozzle of theprilling equipment (Fig. 1g). However, nozzle obstruction still occurredas API/FA suspensions were used instead of solutions. As the nozzlediameter was limited (i.e. 445 µm), only a few large API particles (d90)and/or agglomerates of the hydrophilic API in the molten hydrophobicFA could cause nozzle obstruction. The particle size distribution of theAPI in the molten FA was estimated via laser diffraction analysis wherethe API was dispersed in a liquid phase with a hydrophobicity similar toFAs (Table 2). While MET particles remained almost intact (d90wet≈ d90 dry) when dispersed in the liquid phase, PAR agglomerateswere broken up (d90 wet ≪ d90 dry). Unfortunately, nozzle obstructionoccurred and the particle size (d90) could not be sufficiently reduced bythe addition of a surfactant (0.2% polysorbate 80 or 0.2% sorbitanmonolaurate in migylol® 812), ultrasonic vibration or high shearmixing. For example, d90 of unsieved PAR remain intact (76 ± 3 µm),only a slight decrease to 66 µm was observed in case a high shear mixerwas used. However, sieving of the API (using a 50 and 150 µm sieve forMET and PAR, respectively) prior to their addition to the molten FA wasefficient to reduce d90 wet (≤60 µm) of the suspended particles and
consequently prevent obstruction of the nozzle (445 µm) during pro-cessing (Table 2), indicating the importance of size of the API particlesuspended in the FA phase.
The design of the prilling device was also essential towards thequality of the prills. Whereas previous studies processed homogeneousAPI/FA solutions, this study focused on API/FA suspensions, which areintrinsically susceptible to sedimentation (Vervaeck et al., 2013; Nutanet al., 2010). Hence, it was essential to identify the critical parts of theequipment with a high probability of API sedimentation (e.g. due toinadequate flow or stirring) and to subsequently modify the process toensure a constant drug content in the prills throughout the manu-facturing process. While the flow inside the narrowed and shortenedconnection tube between reservoir and nozzle (Fig. 1d) and inside theseamless nozzle (Fig. 1j) was sufficient to avoid sedimentation of thesuspended API, it was observed that the mixing intensity inside thereservoir remained the most critical parameter towards API sedi-mentation. In case a smaller stirring bar was used, sedimentation oc-curred at the seams of the melt reservoir and the drug content of theprills increased in function of processing time. For example, prilling a30% MET in BA formulation with a smaller stirring bar resulted in alinearly increasing drug content from 25.5 to 28.8% during a 1 h pro-duction process. Using of a stirring bar with a diameter equal to thediameter of the melt reservoir avoided API sedimentation in the meltreservoir and yielded prills with a stable drug content and a maximumrelative drug content deviation below 15% for all time points per for-mulation, in accordance with the European Pharmacopoeia guidelines(Table 1).
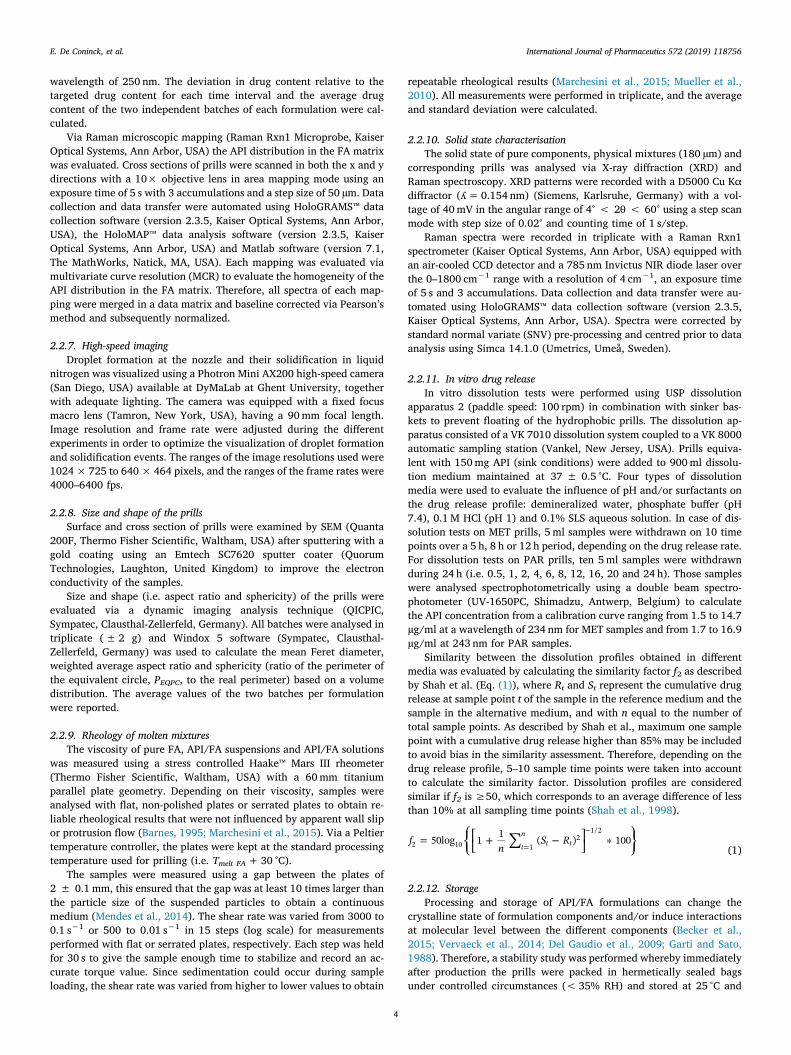
Initial screening experiments revealed that sieved (150 µm) PAR inBA suspensions were processable up to a drug load of 20%, while sieved(50 µm) MET in BA suspensions were processable up to a drug load of40%. Since viscosity is a critical process parameter during dropletformation at the nozzle, this difference in maximum processable drugload could be attributed to the higher viscosity of PAR in BA suspen-sions in comparison with MET in BA suspensions at equal drug loads asillustrated in Fig. 2 (Séquier et al., 2014; Vervaeck et al., 2014; Rawle,2010; Mastropietro et al., 2013). Rheological experiments also revealedan almost Newtonian behaviour for MET suspensions, while distinctshear thinning was observed for PAR suspensions.
Since the measuring temperature was kept consistently 30 °C abovethe melting temperature of the selected FA, varying the FA chain lengthof the formulations did not significantly change the viscosity (Fig. S2).Consequently, the observed differences in viscosity of MET and PARformulations can be attributed to the varying size and shape of MET andPAR suspended particles. Sieved MET (50 µm) and PAR (150 µm) had amean Feret diameter of 17 µm (span 1.84) and 13 µm (span 2.59), re-spectively (Table 2). Due to the lower particle size of PAR in compar-ison with MET, the number of particles and consequently the number ofparticle-particle interactions at equal drug load was higher in the PARsuspensions, resulting in a higher viscosity. Additionally, the degree of
Table 2Particle size (d50, d90 and span) and shape (aspect ratio) of both model APIsmeasured under dry and wet conditions, before and after sieving: MET – 50 µmsieve, PAR – 150 µm sieve.
API powder: size and shape
Measuring conditions MET PAR
d50 d90 Span AR d50 d90 Span AR
(µm) (µm)
Dry Unsieved 111 277 2.26 0.73 25 505 20.69 0.71Sieved 17 37 1.84 0.81 13 38 2.59 0.77
Wet Unsieved 118 220 1.83 NA 42 76 1.41 NASieved 33 60 1.76 NA 23 52 2.23 NA
E. De Coninck, et al. International Journal of Pharmaceutics 572 (2019) 118756
5
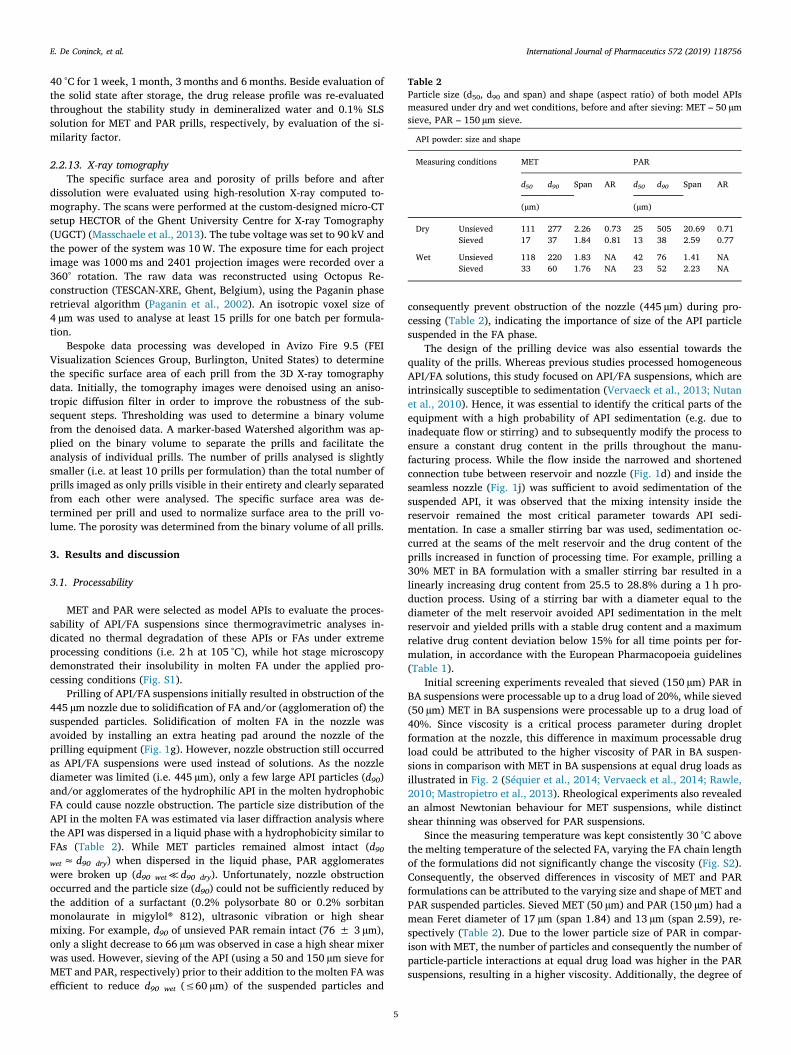
particle-particle interactions in PAR suspensions was favoured by therod shape of PAR particles (AR: 0.765) in comparison with the morespherical MET particles (AR: 0.810) as demonstrated by SEM (Fig. 3).The elongated PAR particles were more resistant to flow as a result oftheir larger specific surface area and non-suitable particle orientation.As these particle-particle interactions are weak, their effect was morepronounced at low shear rates what explained the shear thinning be-haviour of the PAR formulations (Genovese, 2012; Mastropietro et al.,2013; Mueller et al., 2010; Rawle, 2010).
Based on the initial screening experiments, the flow curve obtainedfor a 20% PAR in BA suspension defined the maximum viscosity of aformulation at a specific shear rate that allowed processing via prilling.This observation was in accordance with the measured viscosity ofsuccessfully processed MET (10–40%) in BA and 30% MPT in BA for-mulations. As a remark, Del Gaudio et al. estimated the characteristicviscosity at the nozzle via the Cross model (Robson et al., 1999; Patilet al., 2012). In the current study, multiple processes such as stirring,pumping and droplet formation at the nozzle were ongoing during theprilling process and influenced the processability. Consequently, aspecific shear rate could not be defined and beyond the scope of thisarticle (Séquier et al., 2014). The current viscosity limit was selectedbased on formulations with an observed processability.
In conclusion, the processability of API/FA suspensions was domi-nated by the size and shape of the API powder and independent of theFA chain length. A lower API particle size and aspect ratio resulted inmore particle-particle interactions and a higher viscosity at equal drugload.
3.2. Size and shape of the prills
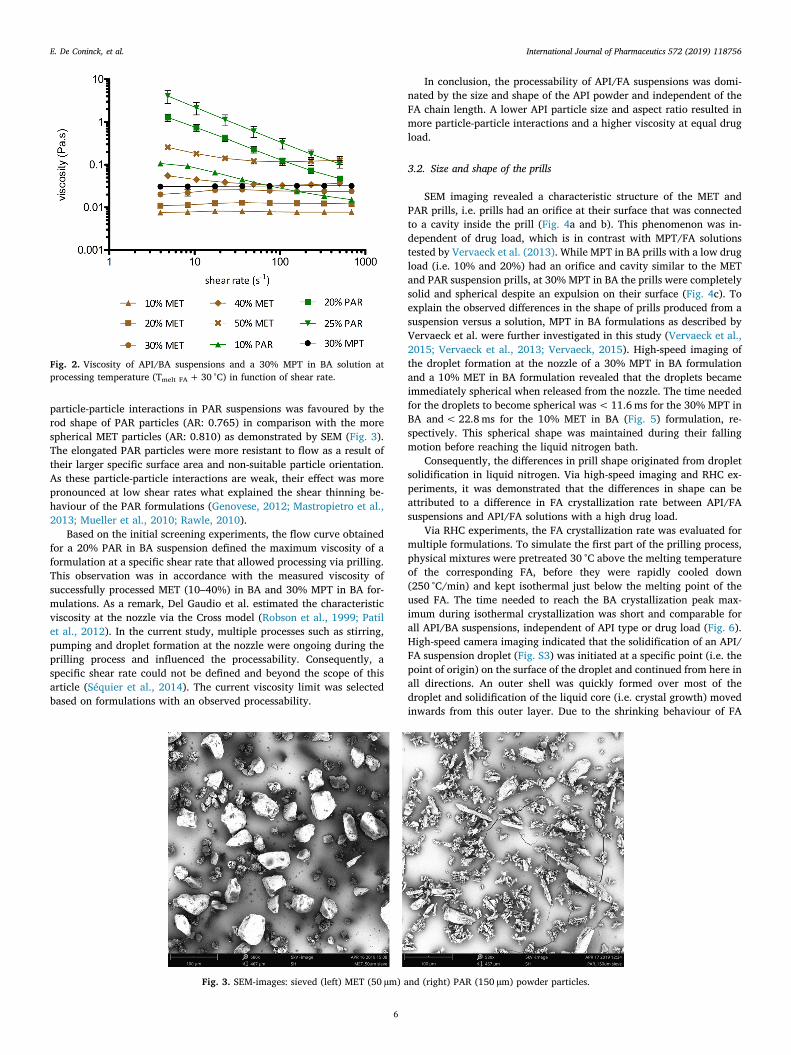
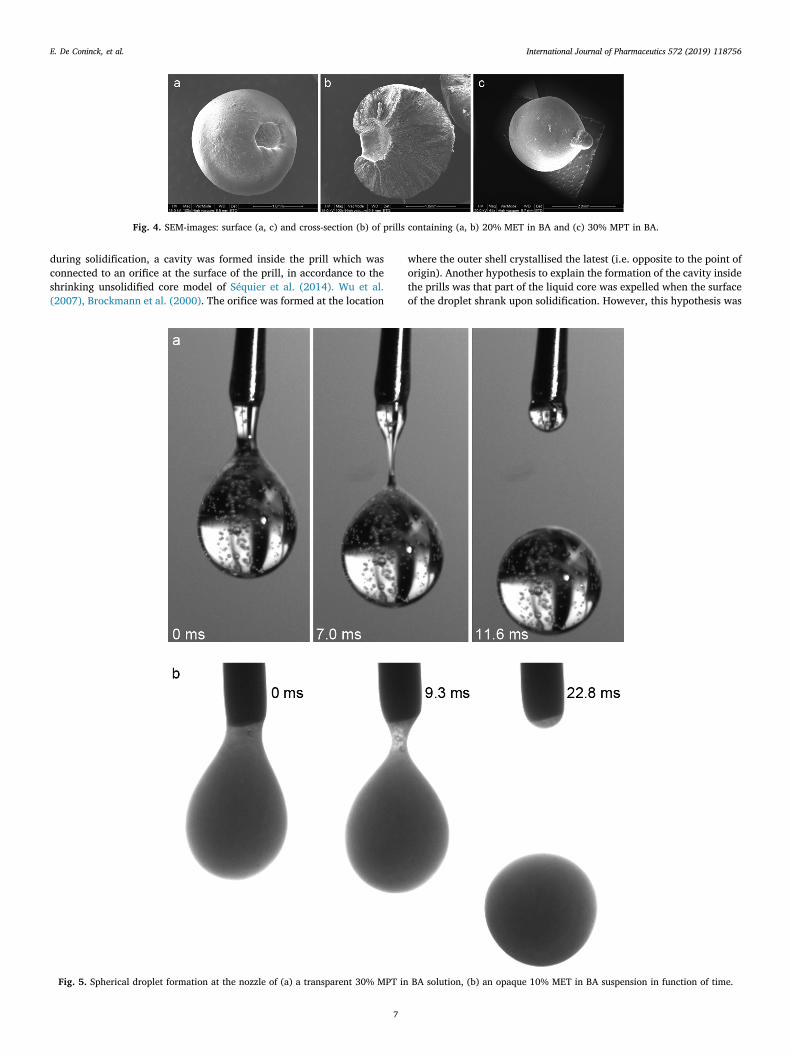
SEM imaging revealed a characteristic structure of the MET andPAR prills, i.e. prills had an orifice at their surface that was connectedto a cavity inside the prill (Fig. 4a and b). This phenomenon was in-dependent of drug load, which is in contrast with MPT/FA solutionstested by Vervaeck et al. (2013). While MPT in BA prills with a low drugload (i.e. 10% and 20%) had an orifice and cavity similar to the METand PAR suspension prills, at 30% MPT in BA the prills were completelysolid and spherical despite an expulsion on their surface (Fig. 4c). Toexplain the observed differences in the shape of prills produced from asuspension versus a solution, MPT in BA formulations as described byVervaeck et al. were further investigated in this study (Vervaeck et al.,2015; Vervaeck et al., 2013; Vervaeck, 2015). High-speed imaging ofthe droplet formation at the nozzle of a 30% MPT in BA formulationand a 10% MET in BA formulation revealed that the droplets becameimmediately spherical when released from the nozzle. The time neededfor the droplets to become spherical was< 11.6ms for the 30% MPT inBA and<22.8ms for the 10% MET in BA (Fig. 5) formulation, re-spectively. This spherical shape was maintained during their fallingmotion before reaching the liquid nitrogen bath.
Consequently, the differences in prill shape originated from dropletsolidification in liquid nitrogen. Via high-speed imaging and RHC ex-periments, it was demonstrated that the differences in shape can beattributed to a difference in FA crystallization rate between API/FAsuspensions and API/FA solutions with a high drug load.
Via RHC experiments, the FA crystallization rate was evaluated formultiple formulations. To simulate the first part of the prilling process,physical mixtures were pretreated 30 °C above the melting temperatureof the corresponding FA, before they were rapidly cooled down(250 °C/min) and kept isothermal just below the melting point of theused FA. The time needed to reach the BA crystallization peak max-imum during isothermal crystallization was short and comparable forall API/BA suspensions, independent of API type or drug load (Fig. 6).High-speed camera imaging indicated that the solidification of an API/FA suspension droplet (Fig. S3) was initiated at a specific point (i.e. thepoint of origin) on the surface of the droplet and continued from here inall directions. An outer shell was quickly formed over most of thedroplet and solidification of the liquid core (i.e. crystal growth) movedinwards from this outer layer. Due to the shrinking behaviour of FA
Fig. 2. Viscosity of API/BA suspensions and a 30% MPT in BA solution atprocessing temperature (Tmelt FA+ 30 °C) in function of shear rate.
Fig. 3. SEM-images: sieved (left) MET (50 µm) and (right) PAR (150 µm) powder particles.
E. De Coninck, et al. International Journal of Pharmaceutics 572 (2019) 118756
6
during solidification, a cavity was formed inside the prill which wasconnected to an orifice at the surface of the prill, in accordance to theshrinking unsolidified core model of Séquier et al. (2014). Wu et al.(2007), Brockmann et al. (2000). The orifice was formed at the location
where the outer shell crystallised the latest (i.e. opposite to the point oforigin). Another hypothesis to explain the formation of the cavity insidethe prills was that part of the liquid core was expelled when the surfaceof the droplet shrank upon solidification. However, this hypothesis was
Fig. 4. SEM-images: surface (a, c) and cross-section (b) of prills containing (a, b) 20% MET in BA and (c) 30% MPT in BA.
Fig. 5. Spherical droplet formation at the nozzle of (a) a transparent 30% MPT in BA solution, (b) an opaque 10% MET in BA suspension in function of time.
E. De Coninck, et al. International Journal of Pharmaceutics 572 (2019) 118756
7
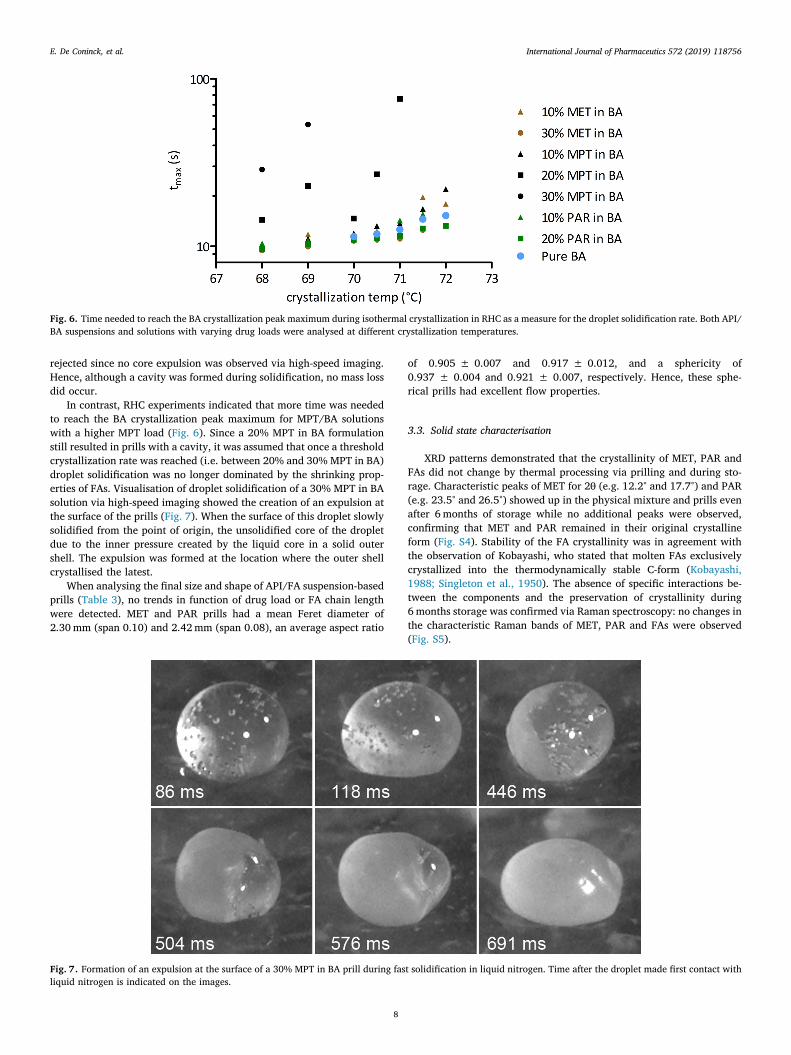
rejected since no core expulsion was observed via high-speed imaging.Hence, although a cavity was formed during solidification, no mass lossdid occur.
In contrast, RHC experiments indicated that more time was neededto reach the BA crystallization peak maximum for MPT/BA solutionswith a higher MPT load (Fig. 6). Since a 20% MPT in BA formulationstill resulted in prills with a cavity, it was assumed that once a thresholdcrystallization rate was reached (i.e. between 20% and 30% MPT in BA)droplet solidification was no longer dominated by the shrinking prop-erties of FAs. Visualisation of droplet solidification of a 30% MPT in BAsolution via high-speed imaging showed the creation of an expulsion atthe surface of the prills (Fig. 7). When the surface of this droplet slowlysolidified from the point of origin, the unsolidified core of the dropletdue to the inner pressure created by the liquid core in a solid outershell. The expulsion was formed at the location where the outer shellcrystallised the latest.
When analysing the final size and shape of API/FA suspension-basedprills (Table 3), no trends in function of drug load or FA chain lengthwere detected. MET and PAR prills had a mean Feret diameter of2.30mm (span 0.10) and 2.42mm (span 0.08), an average aspect ratio
of 0.905 ± 0.007 and 0.917 ± 0.012, and a sphericity of0.937 ± 0.004 and 0.921 ± 0.007, respectively. Hence, these sphe-rical prills had excellent flow properties.
3.3. Solid state characterisation
XRD patterns demonstrated that the crystallinity of MET, PAR andFAs did not change by thermal processing via prilling and during sto-rage. Characteristic peaks of MET for 2θ (e.g. 12.2° and 17.7°) and PAR(e.g. 23.5° and 26.5°) showed up in the physical mixture and prills evenafter 6months of storage while no additional peaks were observed,confirming that MET and PAR remained in their original crystallineform (Fig. S4). Stability of the FA crystallinity was in agreement withthe observation of Kobayashi, who stated that molten FAs exclusivelycrystallized into the thermodynamically stable C-form (Kobayashi,1988; Singleton et al., 1950). The absence of specific interactions be-tween the components and the preservation of crystallinity during6months storage was confirmed via Raman spectroscopy: no changes inthe characteristic Raman bands of MET, PAR and FAs were observed(Fig. S5).
Fig. 6. Time needed to reach the BA crystallization peak maximum during isothermal crystallization in RHC as a measure for the droplet solidification rate. Both API/BA suspensions and solutions with varying drug loads were analysed at different crystallization temperatures.
Fig. 7. Formation of an expulsion at the surface of a 30% MPT in BA prill during fast solidification in liquid nitrogen. Time after the droplet made first contact withliquid nitrogen is indicated on the images.
E. De Coninck, et al. International Journal of Pharmaceutics 572 (2019) 118756
8
3.4. In vitro drug release
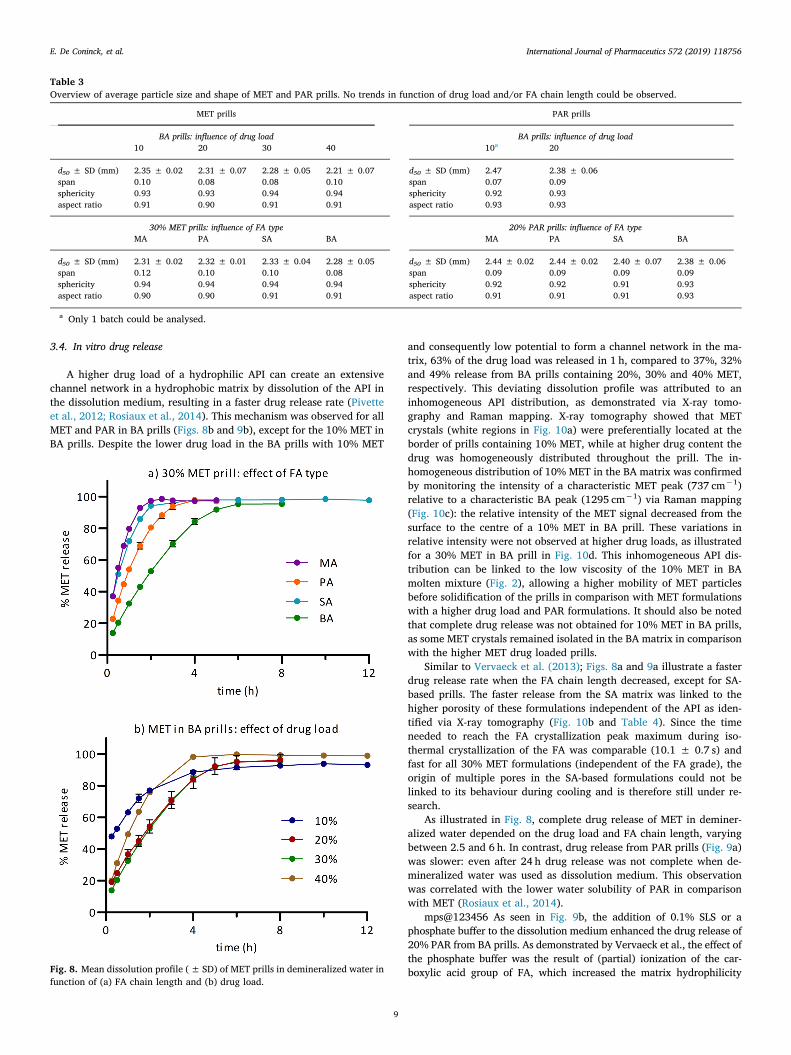
A higher drug load of a hydrophilic API can create an extensivechannel network in a hydrophobic matrix by dissolution of the API inthe dissolution medium, resulting in a faster drug release rate (Pivetteet al., 2012; Rosiaux et al., 2014). This mechanism was observed for allMET and PAR in BA prills (Figs. 8b and 9b), except for the 10% MET inBA prills. Despite the lower drug load in the BA prills with 10% MET
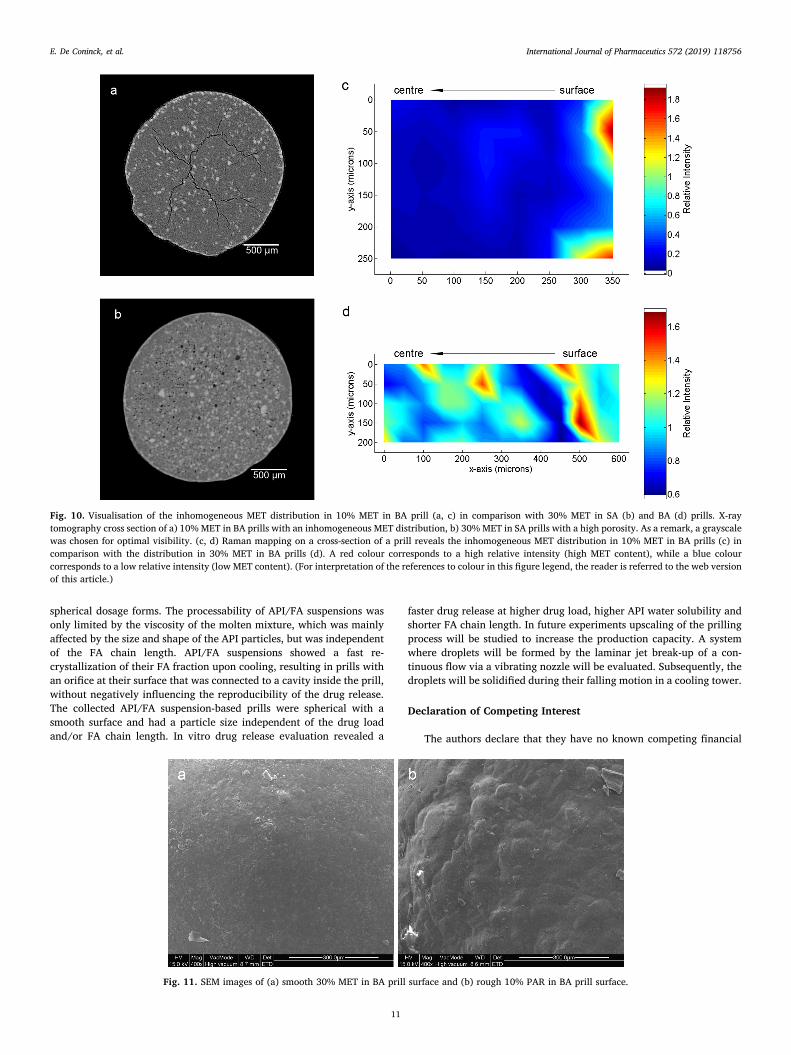
and consequently low potential to form a channel network in the ma-trix, 63% of the drug load was released in 1 h, compared to 37%, 32%and 49% release from BA prills containing 20%, 30% and 40% MET,respectively. This deviating dissolution profile was attributed to aninhomogeneous API distribution, as demonstrated via X-ray tomo-graphy and Raman mapping. X-ray tomography showed that METcrystals (white regions in Fig. 10a) were preferentially located at theborder of prills containing 10% MET, while at higher drug content thedrug was homogeneously distributed throughout the prill. The in-homogeneous distribution of 10% MET in the BA matrix was confirmedby monitoring the intensity of a characteristic MET peak (737 cm−1)relative to a characteristic BA peak (1295 cm−1) via Raman mapping(Fig. 10c): the relative intensity of the MET signal decreased from thesurface to the centre of a 10% MET in BA prill. These variations inrelative intensity were not observed at higher drug loads, as illustratedfor a 30% MET in BA prill in Fig. 10d. This inhomogeneous API dis-tribution can be linked to the low viscosity of the 10% MET in BAmolten mixture (Fig. 2), allowing a higher mobility of MET particlesbefore solidification of the prills in comparison with MET formulationswith a higher drug load and PAR formulations. It should also be notedthat complete drug release was not obtained for 10% MET in BA prills,as some MET crystals remained isolated in the BA matrix in comparisonwith the higher MET drug loaded prills.
Similar to Vervaeck et al. (2013); Figs. 8a and 9a illustrate a fasterdrug release rate when the FA chain length decreased, except for SA-based prills. The faster release from the SA matrix was linked to thehigher porosity of these formulations independent of the API as iden-tified via X-ray tomography (Fig. 10b and Table 4). Since the timeneeded to reach the FA crystallization peak maximum during iso-thermal crystallization of the FA was comparable (10.1 ± 0.7 s) andfast for all 30% MET formulations (independent of the FA grade), theorigin of multiple pores in the SA-based formulations could not belinked to its behaviour during cooling and is therefore still under re-search.
As illustrated in Fig. 8, complete drug release of MET in deminer-alized water depended on the drug load and FA chain length, varyingbetween 2.5 and 6 h. In contrast, drug release from PAR prills (Fig. 9a)was slower: even after 24 h drug release was not complete when de-mineralized water was used as dissolution medium. This observationwas correlated with the lower water solubility of PAR in comparisonwith MET (Rosiaux et al., 2014).
mps@123456 As seen in Fig. 9b, the addition of 0.1% SLS or aphosphate buffer to the dissolution medium enhanced the drug release of20% PAR from BA prills. As demonstrated by Vervaeck et al., the effect ofthe phosphate buffer was the result of (partial) ionization of the car-boxylic acid group of FA, which increased the matrix hydrophilicity
Table 3Overview of average particle size and shape of MET and PAR prills. No trends in function of drug load and/or FA chain length could be observed.
MET prills PAR prills
BA prills: influence of drug load BA prills: influence of drug load10 20 30 40 10a 20
d50 ± SD (mm) 2.35 ± 0.02 2.31 ± 0.07 2.28 ± 0.05 2.21 ± 0.07 d50 ± SD (mm) 2.47 2.38 ± 0.06span 0.10 0.08 0.08 0.10 span 0.07 0.09sphericity 0.93 0.93 0.94 0.94 sphericity 0.92 0.93aspect ratio 0.91 0.90 0.91 0.91 aspect ratio 0.93 0.93
30% MET prills: influence of FA type 20% PAR prills: influence of FA typeMA PA SA BA MA PA SA BA
d50 ± SD (mm) 2.31 ± 0.02 2.32 ± 0.01 2.33 ± 0.04 2.28 ± 0.05 d50 ± SD (mm) 2.44 ± 0.02 2.44 ± 0.02 2.40 ± 0.07 2.38 ± 0.06span 0.12 0.10 0.10 0.08 span 0.09 0.09 0.09 0.09sphericity 0.94 0.94 0.94 0.94 sphericity 0.92 0.92 0.91 0.93aspect ratio 0.90 0.90 0.91 0.91 aspect ratio 0.91 0.91 0.91 0.93
a Only 1 batch could be analysed.
Fig. 8. Mean dissolution profile (± SD) of MET prills in demineralized water infunction of (a) FA chain length and (b) drug load.
E. De Coninck, et al. International Journal of Pharmaceutics 572 (2019) 118756
9
(Vervaeck et al., 2013). Since this (partial) ionization was not achieved atpH 1 (0.1M HCl), the release profile was similar (f2=85) with theprofile obtained in demineralized water (pH 5.4). Although the SLSconcentration was below the critical micellar concentration, the surfac-tant improved the wettability of the prills and as a result the release rateof PAR in the dissolution medium (Pivette et al., 2012). In a phosphatebuffer or 0.1% SLS solution as dissolution medium drug release fromshort chain FA prills was complete within 12 h and 16 h (Fig. 9c). Nosignificant effect of the dissolution medium on the release rate of METformulations was observed during preliminary experiments, due to thehigh water solubility.
No significant differences (f2 > 50) in drug release profile wereobserved after storing MET and PAR prills during 6months at 25 °C and40 °C. This is in accordance with the solid state analysis that did notreveal transformations.
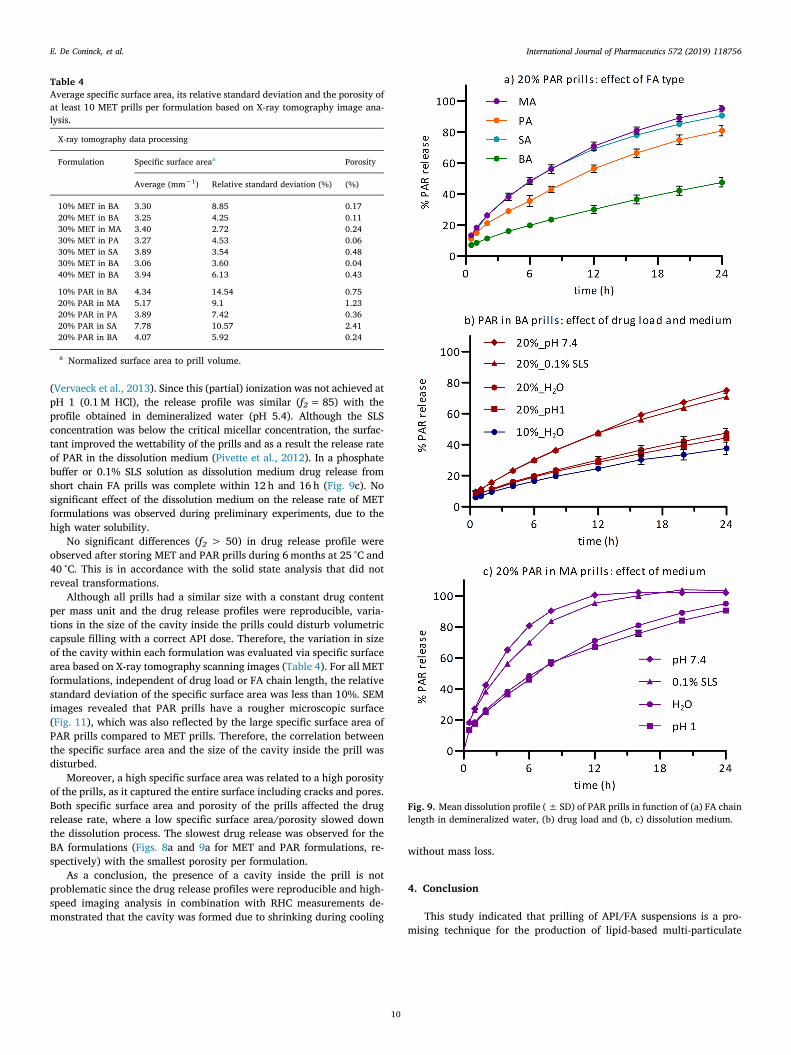
Although all prills had a similar size with a constant drug contentper mass unit and the drug release profiles were reproducible, varia-tions in the size of the cavity inside the prills could disturb volumetriccapsule filling with a correct API dose. Therefore, the variation in sizeof the cavity within each formulation was evaluated via specific surfacearea based on X-ray tomography scanning images (Table 4). For all METformulations, independent of drug load or FA chain length, the relativestandard deviation of the specific surface area was less than 10%. SEMimages revealed that PAR prills have a rougher microscopic surface(Fig. 11), which was also reflected by the large specific surface area ofPAR prills compared to MET prills. Therefore, the correlation betweenthe specific surface area and the size of the cavity inside the prill wasdisturbed.
Moreover, a high specific surface area was related to a high porosityof the prills, as it captured the entire surface including cracks and pores.Both specific surface area and porosity of the prills affected the drugrelease rate, where a low specific surface area/porosity slowed downthe dissolution process. The slowest drug release was observed for theBA formulations (Figs. 8a and 9a for MET and PAR formulations, re-spectively) with the smallest porosity per formulation.
As a conclusion, the presence of a cavity inside the prill is notproblematic since the drug release profiles were reproducible and high-speed imaging analysis in combination with RHC measurements de-monstrated that the cavity was formed due to shrinking during cooling
without mass loss.
4. Conclusion
This study indicated that prilling of API/FA suspensions is a pro-mising technique for the production of lipid-based multi-particulate
Table 4Average specific surface area, its relative standard deviation and the porosity ofat least 10 MET prills per formulation based on X-ray tomography image ana-lysis.
X-ray tomography data processing
Formulation Specific surface areaa Porosity
Average (mm−1) Relative standard deviation (%) (%)
10% MET in BA 3.30 8.85 0.1720% MET in BA 3.25 4.25 0.1130% MET in MA 3.40 2.72 0.2430% MET in PA 3.27 4.53 0.0630% MET in SA 3.89 3.54 0.4830% MET in BA 3.06 3.60 0.0440% MET in BA 3.94 6.13 0.43
10% PAR in BA 4.34 14.54 0.7520% PAR in MA 5.17 9.1 1.2320% PAR in PA 3.89 7.42 0.3620% PAR in SA 7.78 10.57 2.4120% PAR in BA 4.07 5.92 0.24
a Normalized surface area to prill volume.
Fig. 9. Mean dissolution profile (± SD) of PAR prills in function of (a) FA chainlength in demineralized water, (b) drug load and (b, c) dissolution medium.
E. De Coninck, et al. International Journal of Pharmaceutics 572 (2019) 118756
10
spherical dosage forms. The processability of API/FA suspensions wasonly limited by the viscosity of the molten mixture, which was mainlyaffected by the size and shape of the API particles, but was independentof the FA chain length. API/FA suspensions showed a fast re-crystallization of their FA fraction upon cooling, resulting in prills withan orifice at their surface that was connected to a cavity inside the prill,without negatively influencing the reproducibility of the drug release.The collected API/FA suspension-based prills were spherical with asmooth surface and had a particle size independent of the drug loadand/or FA chain length. In vitro drug release evaluation revealed a
faster drug release at higher drug load, higher API water solubility andshorter FA chain length. In future experiments upscaling of the prillingprocess will be studied to increase the production capacity. A systemwhere droplets will be formed by the laminar jet break-up of a con-tinuous flow via a vibrating nozzle will be evaluated. Subsequently, thedroplets will be solidified during their falling motion in a cooling tower.
Declaration of Competing Interest
The authors declare that they have no known competing financial
Fig. 10. Visualisation of the inhomogeneous MET distribution in 10% MET in BA prill (a, c) in comparison with 30% MET in SA (b) and BA (d) prills. X-raytomography cross section of a) 10%MET in BA prills with an inhomogeneous MET distribution, b) 30%MET in SA prills with a high porosity. As a remark, a grayscalewas chosen for optimal visibility. (c, d) Raman mapping on a cross-section of a prill reveals the inhomogeneous MET distribution in 10% MET in BA prills (c) incomparison with the distribution in 30% MET in BA prills (d). A red colour corresponds to a high relative intensity (high MET content), while a blue colourcorresponds to a low relative intensity (low MET content). (For interpretation of the references to colour in this figure legend, the reader is referred to the web versionof this article.)
Fig. 11. SEM images of (a) smooth 30% MET in BA prill surface and (b) rough 10% PAR in BA prill surface.
E. De Coninck, et al. International Journal of Pharmaceutics 572 (2019) 118756
11
interests or personal relationships that could have appeared to influ-ence the work reported in this paper.
Acknowledgements
E. De Coninck acknowledges the Special Research Fund of GhentUniversity for a PhD scholarship.
Appendix A. Supplementary material
Supplementary data to this article can be found online at https://doi.org/10.1016/j.ijpharm.2019.118756.
References
Aleksovski, A., Van Bockstal, P.J., Roskar, R., Sovany, T., Regdon Jr., G., De Beer, T.,et al., 2016. Comparison of metoprolol tartrate multiple-unit lipid matrix systemsproduced by different technologies. Eur. J. Pharm. Sci. 88, 233–245.
Aleksovski, A., Vervaet, C., Dreu, R., 2016. Hot-melt extrusion and prilling as con-temporary and promising techniques in the solvent free production of solid oraldosage forms, based on solid dispersions. Macedonian Pharm. Bull. 62, 3–24.
Barnes, H.A., 1995. A review of the slip (wall depletion) of polymer solutions, emulsionsand particle suspensions in viscometers: its cause, character, and cure. J. Non-NewtonFluid. 56 (3), 221–251.
Becker, K., Salar-Behzadi, S., Zimmer, A., 2015. Solvent-free melting techniques for thepreparation of lipid-based solid oral formulations. Pharm. Res. 32 (5), 1519–1545.
Bhagwat, D.D., Kawtikwar, P., Sakarkar, M.D., 2008. Sustained release matrices of ver-apamil HCl using glyceryl monosterate and stearic acid. Res. J. Pharm. Tech. 1,405–409.
Brockmann, R., Demmering, G., Kreutzer, U., Lindemann, M., Plachenka, J., Steinberner,U., 2000. Fatty Acids. Ullmann's encyclopedia of industrial chemistry. 40, 6th ed.Wiley-VCH Verlag GmbH & Co, Weinheim, Germany, pp. 73–116.
Del Gaudio, P., Russo, P., Rosaria Lauro, M., Colombo, P., Aquino, R.P., 2009.Encapsulation of ketoprofen and ketoprofen lysinate by prilling for controlled drugrelease. AAPS PharmSciTech 10 (4), 1178–1185.
Garti, N., Sato, K., 1988. Crystallization and Polymorphism of Fats and Fatty Acids.Marcel Dekker, Inc., New York.
Genovese, D.B., 2012. Shear rheology of hard-sphere, dispersed, and aggregated sus-pensions, and filler-matrix composites. Adv. Colloid Interface Sci. 171, 1–16.
Jannin, V., Cuppok, Y., 2013. Hot-melt coating with lipid excipients. Int. J. Pharm. 457(2), 480–487.
Jannin, V., Musakhanian, J., Marchaud, D., 2008. Approaches for the development ofsolid and semi-solid lipid-based formulations. Adv. Drug Deliv. Rev. 60 (6), 734–746.
Kobayashi, M., 1988. Vibrational spectroscopic aspects of polymorphism and phasetransition of fats and fatty acids. In: In: Garti, N., Sato, K. (Eds.), Crystallization andpolymorphism of fats and fatty acids 31. Marcel Dekker, Inc., New York, pp. 139–187.
Kulah, G., Kaya, O., 2011. Investigation and scale-up of hot-melt coating of pharma-ceuticals in fluidized beds. Powder Technol. 208 (1), 175–184.
Maejima, T., Osawa, T., Nakajima, K., Kobayashi, M., 1997. Preparation of sphericalbeads without any use of solvents by a novel tumbling melt granulation (TMG)method. Chem. Pharm. Bull. (Tokyo). 45 (3), 518–524.
Marchesini, F., Naccache, M., Abdu, A., Alicke, A., Mendes, P.R.D., 2015. Rheologicalcharacterization of yield-stress materials: Flow pattern and apparent wall slip. Appl.Rheol. 25, 32–41.
Martins, R.M., Siqueira, S., Machado, M.O., Freitas, L.A., 2013. The effect of homo-genization method on the properties of carbamazepine microparticles prepared byspray congealing. J. Microencapsul. 30 (7), 692–700.
Masschaele, B., Dierick, M., Van Loo, D., Boone, M.N., Brabant, L., Pauwels, E., et al.,2013. HECTOR: a 240kV micro-CT setup optimized for research. In: Xu, H., Wu, Z.,Tai, R. (Eds.), 11th International Conference on X-Ray Microscopy. Iop PublishingLtd, Bristol.
Mastropietro, D.J., Nimroozi, R., Omidian, H., 2013. Rheology in pharmaceutical for-mulations - a perspective. J. Dev. Drugs 02, 6.
Mehrez, A., Ookawara, S., Ali, A.H.H., Suzuki, M., 2014. A numerical study on cooling-solidification process of urea particles in prilling tower. J. Chem. Eng. Jpn. 47 (8),
628–634.Mendes, P.R.D., Alicke, A.A., Thompson, R.L., 2014. Parallel-plate geometry correction
for transient rheometric experiments. Appl. Rheol. 24 (5), 1–10.Mueller, S., Llewellin, E.W., Mader, H.M., 2010. The rheology of suspensions of solid
particles. Proc. Royal Soc. A 466 (2116), 1201–1228.Nutan, M.T.H., Reddy, I.K., 2010. General principles of suspensions. In: Kulshreshtha,
A.K., Singh, O.N., Wall, G.M. (Eds.), Pharmaceutical suspensions. Springer, pp.39–65.
Paganin, D., Mayo, S.C., Gureyev, T.E., Miller, P.R., Wilkins, S.W., 2002. Simultaneousphase and amplitude extraction from a single defocused image of a homogeneousobject. J. Microsc. 206, 33–40.
Passerini, N., Qi, S., Albertini, B., Grassi, M., Rodriguez, L., Craig, D.Q., 2010. Solid lipidmicroparticles produced by spray congealing: influence of the atomizer on micro-particle characteristics and mathematical modeling of the drug release. J. Pharm. Sci.99 (2), 916–931.
Patil, A.T., Khobragade, D.S., Chafle, S.A., Ujjainkar, A.P., Umathe, S.N., Lakhotia, C.L.,2012. Development and evaluation of a hot-melt coating technique for entericcoating. Braz. J. Pharm. Sci. 48 (1), 69–77.
Pivette, P., Faivre, V., Mancini, L., Gueutin, C., Daste, G., Ollivon, M., et al., 2012.Controlled release of a highly hydrophilic API from lipid microspheres obtained byprilling: analysis of drug and water diffusion processes with X-ray-based methods. J.Control. Release 158 (3), 393–402.
Qi, S., Deutsch, D., Craig, D.Q., 2006. An investigation into the interaction between tastemasking fatty acid microspheres and alkaline buffer using thermal and spectroscopicanalysis. J. Pharm. Sci. 95 (5), 1022–1028.
N. Rahamnian, M. Homayoonfard, (Eds.), 2012. A comparison of co-current and counter-current modes of operation in urea prilling tower. In: International conference onprocess engineering and advanced materials. Kuala Lumpur, Malaysia.
Rahmanian, N., Homayoonfard, M., Alamdari, A., 2013. Simulation of urea prillingprocess: an industrial case study. Chem. Eng. Commun. 200 (6), 764–782.
Rahmanian, N., Naderi, S., Supuk, E., Abbas, R., Hassanpour, A., 2015. Urea finishingprocess: prilling versus granulation. Procedia Eng. 102, 174–181.
Rawle, A.F., 2010. Analytical tools for suspension characterization. In: Kulshreshtha,A.K., Singh, O.N., Wall, G.M. (Eds.), Pharmaceutical suspensions: from formulationdevelopment to manufacturing. Springer New York, New York, Ny, pp. 177–230.
Reitz, C., Kleinebudde, P., 2007. Solid lipid extrusion of sustained release dosage forms.Eur. J. Pharm. Biopharm. 67 (2), 440–448.
Robson, H.J., Craig, D.Q., Deutsch, D., 1999. An investigation into the release of cefur-oxime axetil from taste-masked stearic acid microspheres. Part 1: the influence of thedissolution medium on the drug release profile and the physical integrity of themicrospheres. Int. J. Pharm. 190 (2), 183–192.
Rosiaux, Y., Jannin, V., Hughes, S., Marchaud, D., 2014. Solid lipid excipients - matrixagents for sustained drug delivery. J. Control. Release 188, 18–30.
Séquier, F., Faivre, V., Daste, G., Renouard, M., Lesieur, S., 2014. Critical parametersinvolved in producing microspheres by prilling of molten lipids: from theoreticalprediction of particle size to practice. Eur. J. Pharm. Biopharm. 87 (3), 530–540.
Shah, V.P., Tsong, Y., Sathe, P., Liu, J.P., 1998. In vitro dissolution profile comparison-statistics and analysis of the similarity factor, f2. Pharm. Res. 15 (6), 889–896.
Singleton, W.S., Ward, T.L., Dollear, F.G., 1950. Physical properties of fatty acids. I. Somedilatometric and thermal properties of stearic acid in two polymorphic forms. J. Am.Oil Chem. Soc. 27 (4), 143–146.
Vervaeck, A., 2015. Prilling of fatty acids as innovative technology for oral controlledrelease multiple-unit systems. Ghent University, Ghent, Belgium.
Vervaeck, A., Saerens, L., De Geest, B.G., De Beer, T., Carleer, R., Adriaensens, P., et al.,2013. Prilling of fatty acids as a continuous process for the development of controlledrelease multiparticulate dosage forms. Eur. J. Pharm. Biopharm. 85, 587–596.
Vervaeck, A., Monteyne, T., Saerens, L., De Beer, T., Remon, J.P., Vervaet, C., 2014.Prilling as manufacturing technique for multiparticulate lipid/PEG fixed-dose com-binations. Eur. J. Pharm. Biopharm. 88 (2), 472–482.
Vervaeck, A., Monteyne, T., Siepmann, F., Boone, M.N., Van Hoorebeke, L., De Beer, T.,et al., 2015. Fatty acids for controlled release applications: a comparison betweenprilling and solid lipid extrusion as manufacturing techniques. Eur. J. Pharm.Biopharm. 97, 173–184.
Voinovich, D., Moneghini, M., Perissutti, B., Filipovic-Grcic, J., Grabnar, I., 2000.Preparation in high-shear mixer of sustained-release pellets by melt pelletisation. Int.J. Pharm. 203 (1–2), 235–244.
Wu, Y., Bao, C., Zhou, Y., 2007. An innovated tower-fluidized bed prilling process. Chin.J. Chem. Eng. 15 (3), 424–428.
E. De Coninck, et al. International Journal of Pharmaceutics 572 (2019) 118756
12