Pricing Strategy and Technology Choices - Emory Goizueta
55
1 Pricing Strategy and Technology Choices: An Empirical Investigation of “Everyday Low Price” in the Domestic US Airline Sector Raymond G. Sin School of Business & Management Hong Kong University of Science and Technology, Hong Kong [email protected] Ramnath K. Chellappa Goizueta Business School, Emory University Atlanta, GA 30322-2710 [email protected] S. Siddarth Marshall School of Business, University of Southern California Los Angeles, CA 90089 [email protected] Abstract There is a rich literature in economics on factors that govern airline prices. With approximately 50% of airline tickets sold online, there is now a renewed interest in investigating airline pricing particularly amongst Information Systems (IS) researchers. While market transparency created by online travel agents (OTAs) is a motivation enough to re-examine airline pricing, one missing piece calls for a thorough empirical investigation: In all extant studies (economics, marketing and IS), pricing by two major airlines, Southwest and JetBlue, has been ignored. Of particular interest to IS researchers is the fact that these two airlines practice a unique form of pricing called Everyday Low Price (EDLP) and have made certain technology-related choices that are distinct and different from previously studied carriers. We test extant theories of price discrimination in the new online context with both posted and transacted prices, including those of the two EDLP airlines. We find that the EDLP airlines demonstrate distinctly different pricing choices — they are very particular about maintaining price consistency, while except in the case of advance purchase, they forgo other conventional opportunities to price discriminate. They also aggressively undercut competition when equipped with certain cost advantages. Further empirical investigation reveals why EDLP airlines forgo participation in OTAs that potentially offer a larger market. In particular, while promising a larger marketplace, OTAs have the ability to reveal the lowest prices in the market; we find that EDLP prices are lowest in the market only 26% of the time — in other words, consumers have 70% chances of obtaining a better deal from other “non-low price” airlines for any given ticket. We also show that EDLP prices, though not necessarily being the lowest in the market, do tend towards the lower end of the market spectrum. Keywords: Information technology, everyday low price (EDLP), airlines, pricing, hierarchical linear model
Transcript of Pricing Strategy and Technology Choices - Emory Goizueta
1
Pricing Strategy and Technology Choices: An Empirical Investigation of “Everyday Low Price” in the
Domestic US Airline Sector
Raymond G. Sin School of Business & Management Hong Kong University of Science
and Technology, Hong Kong
Ramnath K. ChellappaGoizueta Business School,
Emory University Atlanta, GA 30322-2710
S. Siddarth Marshall School of Business,
University of Southern California Los Angeles, CA 90089
Abstract There is a rich literature in economics on factors that govern airline prices. With
approximately 50% of airline tickets sold online, there is now a renewed interest in investigating airline pricing particularly amongst Information Systems (IS) researchers. While market transparency created by online travel agents (OTAs) is a motivation enough to re-examine airline pricing, one missing piece calls for a thorough empirical investigation: In all extant studies (economics, marketing and IS), pricing by two major airlines, Southwest and JetBlue, has been ignored. Of particular interest to IS researchers is the fact that these two airlines practice a unique form of pricing called Everyday Low Price (EDLP) and have made certain technology-related choices that are distinct and different from previously studied carriers.
We test extant theories of price discrimination in the new online context with both
posted and transacted prices, including those of the two EDLP airlines. We find that the EDLP airlines demonstrate distinctly different pricing choices — they are very particular about maintaining price consistency, while except in the case of advance purchase, they forgo other conventional opportunities to price discriminate. They also aggressively undercut competition when equipped with certain cost advantages. Further empirical investigation reveals why EDLP airlines forgo participation in OTAs that potentially offer a larger market. In particular, while promising a larger marketplace, OTAs have the ability to reveal the lowest prices in the market; we find that EDLP prices are lowest in the market only 26% of the time — in other words, consumers have 70% chances of obtaining a better deal from other “non-low price” airlines for any given ticket. We also show that EDLP prices, though not necessarily being the lowest in the market, do tend towards the lower end of the market spectrum.
Keywords: Information technology, everyday low price (EDLP), airlines, pricing, hierarchical linear model
2
1. Introduction
Many organizations are faced with the daunting task of revisiting/realigning their business
strategies with technological changes, perhaps more so in some industries than in others. One
industry that has been fundamentally altered by technology is the airline sector, where
computerized reservation systems (CRSs — later integrated and globalized, known as the “Global
Distribution Systems” or GDSs) have shaped airline operations from pricing to crew scheduling.
Extant research suggests that the U.S. domestic airlines have seized the opportunities created
by these technological innovations, and enjoyed proven gains in organizational efficiency and
economic benefits (Banker and Johnston 1993; Duliba et al. 2001). Similarly, the advent of the
Internet and the various online travel agents (OTAs) saw the airlines rushing to participate in
Orbitz, Expedia and Travelocity owing to a marketplace that promised to be larger than that
offered by brick-n-mortar travel agencies and the airlines’ own Web presence. The competitive
landscape of the U.S. domestic airline sector has always been of great interest to economists and
regulators alike, and more recently in information systems as well, thus providing us with a rich
literature base (Borenstein 1989; Chellappa et al. 2011). However, almost all existing research
on airline pricing, including the large body of airline literature in economics, has failed to
include in their analyses the pricing strategy of industry giant Southwest Airlines (an airline
that has been operational since the seventies) and later entrant JetBlue Airways. Southwest
and JetBlue stand out from the rest of their competitors not only in terms of their ability to
remain profitable but also in their steady expansion. In particular, Southwest’s market share
has increased by nearly 50% between 2004 and 2010, ranking as the second largest airline whose
dominance is only marginally behind Delta (even after Delta has merged with Northwest in
early 2010), while JetBlue’s share has more than doubled during the same period when all other
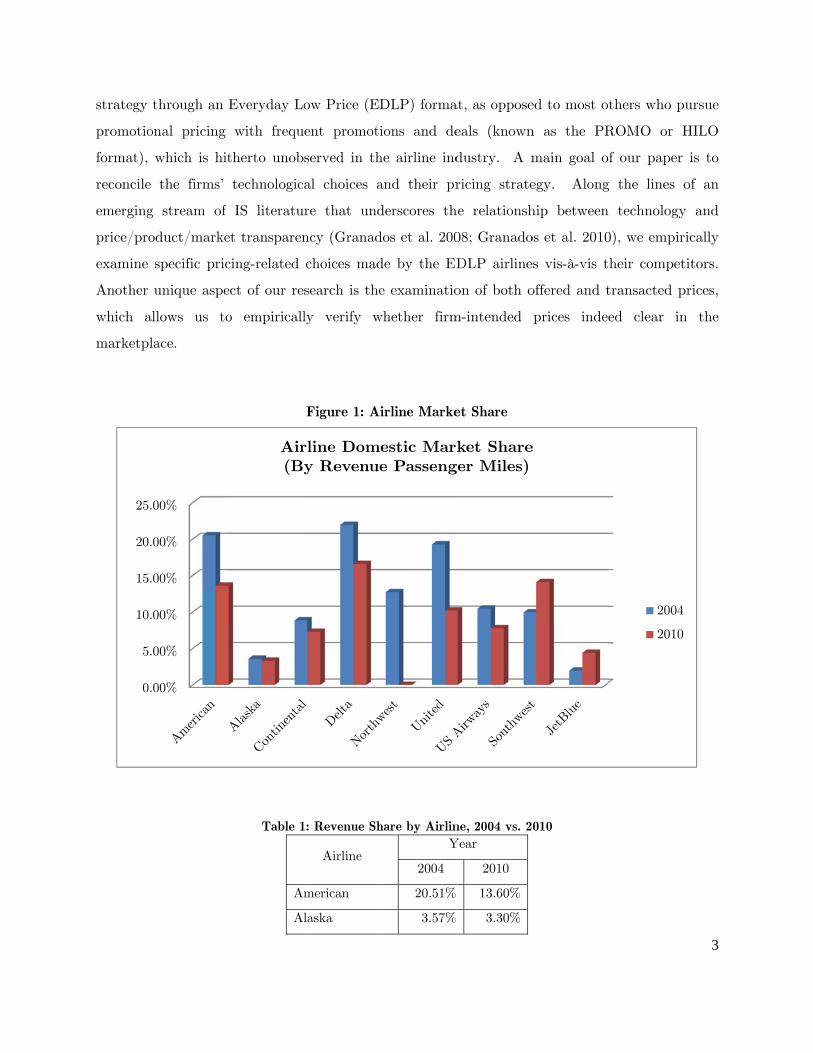
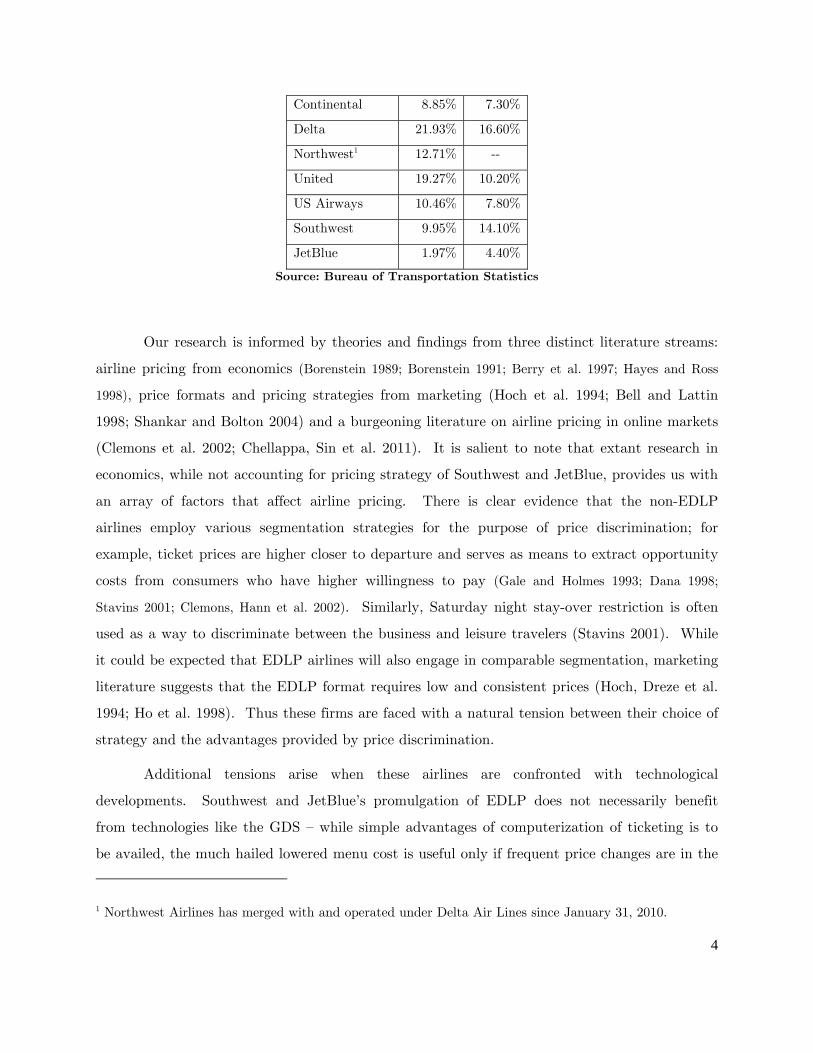
major carriers are confronted with major setback (see Figure 1 and Table 1 for detail). Today,
the combined share of Southwest and JetBlue is approaching 20% in the domestic air travel
market.
Apart from the fact that the strategies of these two airlines have not been empirically
examined, both Southwest and JetBlue are of particular interest to IS researchers for two
reasons. First, they appear to deviate from much of the airline industry’s conventional adoption
of technology; specifically, Southwest and JetBlue have been reluctant participants in the GDSs
and have opted out of offering their fares through OTAs. Second, they pursue a pricing
strategy
promotio
format),
reconcile
emerging
price/pro
examine
Another
which a
marketpl
0.
5.
10.
15.
20.
25.
through an
onal pricing
which is hit
the firms’
g stream of
oduct/marke
specific pric
unique aspe
llows us to
lace.
00%
00%
00%
00%
00%
00%
Everyday Lo
with frequ
therto unob
technologic
IS literatu
et transparen
cing-related
ect of our re
o empiricall
Table 1
Am
Al
Air(By
ow Price (ED
ent promoti
served in th
al choices a
re that und
ncy (Granad
choices mad
search is the
ly verify w
Figure 1: A
1: Revenue Sh
Airline
merican
laska
rline Domy Revenue
DLP) forma
ions and de
he airline ind
and their pr
derscores th
dos et al. 200
de by the ED
e examinatio
whether firm
irline Marke
hare by AirlinY
2004
20.51%
3.57%
estic Mare Passeng
at, as oppose
eals (known
dustry. A m
ricing strate
he relationsh
08; Granado
DLP airline
on of both o
m-intended
et Share
ne, 2004 vs. 2Year
2010
13.60%
3.30%
ket Shareger Miles)
ed to most o
n as the PR
main goal o
egy. Along
hip between
os et al. 2010
es vis-à-vis t
offered and t
prices indee
010
e
thers who p
ROMO or H
f our paper
g the lines o
n technology
0), we empir
heir compet
transacted p
ed clear in
2004
2010
3
ursue
HILO
is to
of an
y and
rically
titors.
prices,
n the
4
Continental 8.85% 7.30%
Delta 21.93% 16.60%
Northwest1 12.71% --
United 19.27% 10.20%
US Airways 10.46% 7.80%
Southwest 9.95% 14.10%
JetBlue 1.97% 4.40%
Source: Bureau of Transportation Statistics
Our research is informed by theories and findings from three distinct literature streams:
airline pricing from economics (Borenstein 1989; Borenstein 1991; Berry et al. 1997; Hayes and Ross
1998), price formats and pricing strategies from marketing (Hoch et al. 1994; Bell and Lattin
1998; Shankar and Bolton 2004) and a burgeoning literature on airline pricing in online markets
(Clemons et al. 2002; Chellappa, Sin et al. 2011). It is salient to note that extant research in
economics, while not accounting for pricing strategy of Southwest and JetBlue, provides us with
an array of factors that affect airline pricing. There is clear evidence that the non-EDLP
airlines employ various segmentation strategies for the purpose of price discrimination; for
example, ticket prices are higher closer to departure and serves as means to extract opportunity
costs from consumers who have higher willingness to pay (Gale and Holmes 1993; Dana 1998;
Stavins 2001; Clemons, Hann et al. 2002). Similarly, Saturday night stay-over restriction is often
used as a way to discriminate between the business and leisure travelers (Stavins 2001). While
it could be expected that EDLP airlines will also engage in comparable segmentation, marketing
literature suggests that the EDLP format requires low and consistent prices (Hoch, Dreze et al.
1994; Ho et al. 1998). Thus these firms are faced with a natural tension between their choice of
strategy and the advantages provided by price discrimination.
Additional tensions arise when these airlines are confronted with technological
developments. Southwest and JetBlue’s promulgation of EDLP does not necessarily benefit
from technologies like the GDS — while simple advantages of computerization of ticketing is to
be availed, the much hailed lowered menu cost is useful only if frequent price changes are in the
1 Northwest Airlines has merged with and operated under Delta Air Lines since January 31, 2010.
5
offing. Furthermore, the long established Southwest Airlines had always eschewed
intermediaries well before the advent of the Internet by selling tickets through the phone, at the
airport or at their regional offices. In the post-Internet era, these two airlines appear not to be
enticed by the promise of a larger marketplace offered by OTAs but rather sell tickets directly
through their own Web sites. This technology-related choice requires further investigation in
that if these are indeed everyday “low price” airlines, they should benefit from price
transparency offered the OTAs. Thus in this research we shall empirically investigate the
specific strategic choices made by these airlines vis-à-vis their online prices.
As a first step, we decompose a firm’s pricing strategy into two dimensions, namely price
consistency and price magnitude. The former captures the frequency of promotions in tickets
for the HILO airlines and is a measure of the “everyday” aspect of their EDLP counterparts,
while the latter allows us to examine the “low price” element of the pricing strategy. We then
develop and estimate a hierarchical model that accounts for partial dependence among prices
due to market- and airline-specific factors, using pricing data for over 200,000 tickets offered
online by the 14 largest carriers in 268 U.S. domestic air travel markets. In constructing this
model, we carefully control for potential endogeneity that may arise from market share-related
measures. Further, since our model incorporates a number of dichotomous variables at various
levels (e.g. advance purchase and Saturday stay-over, hub operation, route distance), we
exercised extreme caution in interpreting related effects and drawing inferences from our
statistical analysis. We also repeat all of our analyses with the transacted price data from
DB1B (a 10% sample of all tickets sold by reporting carriers, provided by the Bureau of
Transportation Statistics) both as a robustness check of our original results and as a means to
verify the extent to which the pricing strategies of airlines are absorbed by the market. While
existing research typically investigates either offered prices or transacted prices, our work
examines firm-specific strategies (and hence the respective price setting behaviors) and conclude
with similar examination of prices at which tickets have actually been purchased.
The remainder of the paper is organized as follows. Section 2 presents the theoretical
framework for our analysis. Section 3 discusses the data and empirical method employed in this
study, which is followed by a discussion of results in Section 4. Section 5 concludes with
implications and directions for future research.

6
2. Airline pricing: Conceptual development
Pricing of airline tickets is a rather complex process, where an airline not only has to consider
its costs of operation but also demand-side characteristics and the competitive landscape
involving multiple competitors. Extant literature has identified a number of price co-variates in
the airline sector, which fall largely into the following categories: 1. Ticket category; which refers
to the use of ticket restrictions to differentiate between business and leisure travelers, such as
advance purchase and Saturday stay-over requirements (Gale and Holmes 1993; Dana 1998;
Stavins 2001; Clemons, Hann et al. 2002). 2. Airline and market characteristics; such as non-
stop distance between the endpoint airports, market share and the corresponding Herfindahl
Index (Borenstein 1989; Borenstein 1991; Borenstein and Rose 1994; Berry, Carnall et al. 1997;
Hayes and Ross 1998). 3. Cost and operational structures; such as aircraft size, direct cost
measure (cost per available seat-mile), flight frequency and hub-operations (Borenstein 1989;
Stavins 2001).
There is, however, one key missing aspect in extant research on airline pricing — it does
not account for a firm’s choice of its overall or portfolio-level pricing strategy. In this regard,
the marketing literature suggests that firms employ various price formats to instill a certain
price image in the minds of the consumers. Price formats generally exist on a continuum where
the extremes are “everyday low price” (EDLP) and the promotional (HILO) formats. Firms
strategically place themselves on this continuum so as to be attractive to different consumer
segments. The HILO format incentivizes consumers to shop with the firm by frequently offering
promotions and temporal price discounts (Lal and Rao 1997; Bell and Lattin 1998). The EDLP
format, on the other hand, appeals to consumers less prone to searching, i.e. these firms aim to
create a low-price image by maintaining relatively consistent prices and offering on-an-average
low prices. Extant literature has identified Southwest as a practitioner of this strategy, though
little is known about what EDLP means in the airline industry (Hoch, Dreze et al. 1994;
Chellappa, Sin et al. 2011). However, there is currently little or no understanding of how these
airlines execute their pricing strategy, e.g., if they will follow similar rules of price-discrimination
as other major carriers. Further, there is also no prior work that explains why these airlines
have made these other technology choices, e.g., not participating in online travel agencies such
as Orbitz, Expedia, etc.
7
2.1 Consumer segments and price discrimination in the airline sector
Economic theory posits that, whenever possible, firms would pursue some form of
discrimination to extract consumer surplus. While information asymmetry (the lack of full
knowledge of their customers’ willingness to pay) and competition prevents them from full-on
complete discrimination (Png 2001), the airline industry has identified a number of traveler
attributes along which firms engage in indirect segmentation.
Airline tickets are unique in that they are a perishable commodity; i.e. if a seat is not
occupied then the firm gets zero revenue from it with no opportunities of secondary/used
markets. When one considers such perishable commodities in daily products such as flowers or
produce, grocers typically offer discounts on products that are approaching the end of their life
to salvage the residual values before they become unfit for consumption. On the other hand,
prices of airline tickets generally increase as the departure date approaches, so that consumers
with a higher opportunity cost of time are charged higher prices (Dana 1998; Stavins 2001).
Similarly, tickets that include a Saturday night stay-over are typically cheaper than those
without this requirement. The general rationale is that business travelers place higher values on
flexibility and are reluctant to spend the weekend away from home, while leisure travelers will
be willing to bear some inconvenience, such as purchasing tickets well in advance and staying
for the weekend, for a cheaper price. By artificially differentiating the otherwise identical
products, airlines can price tickets differently to target different consumer segments based on
their relative opportunity costs (Gale and Holmes 1993; Dana 1998; Stavins 2001; Clemons,
Hann et al. 2002). Note that while there is currently no analysis on the role of Saturday-
restriction in airlines’ Internet prices, we have no a priori reason to believe that extant airlines
would employ such segmentation differently. Hence we expect ticket prices offered by the major
carriers to exhibit evidence of discrimination along this dimension even in the online
environment, though what remains unknown is whether the EDLP carriers will also discriminate
along the same dimensions.
2.2 Consumer segments and everyday low price
There has been no prior research that examines whether EDLP airlines will also price
discriminate along the natural consumer segments that exist in the air travel market, because
doing so implies implementing price changes that may detract from their price image. One
could argue that discriminating on the basis of advance purchase poses relatively lower risks to

8
these airlines, as it requires consumers to keep track of price changes across a large number of
offers over time in order to detect such a discrimination practice. On the other hand, the
“Saturday night stay” rule is an artifact invented by yield managers who, after adopting the
CRS technology, discovered that business travelers have strong preferences of returning home
for the weekend (Associates 2002). While the Saturday restriction has become a key marketing
tactic employed by non-EDLP airlines to attain higher profits through effectively segmenting
business travelers from leisure ones, EDLP carriers may refrain from employing such
segmentation as it requires them to discriminate business passengers even within a given
particular advance purchase period, which is easily observable by the consumers. In fact, there
is anecdotal evidence that Southwest and JetBlue both disregard Saturday-restriction as means
of product differentiation; not only do both airlines emphasize a fixed one-way fare for a sizable
number of origin-destination pairs in their marketing messages, but their “round-trip” ticket is
also simply a composition of two one-way tickets. For example, the cheapest round-trip fare
between Los Angele and San Francisco on Southwest with two-week advance purchase is $108 —
a combination of the fares for two one-way tickets (LAX-SFO, at $49; plus SFO-LAX, at $59);
the price does not change with regards to whether the return trip is on weekday or weekend.
Indeed, by removing the return option, their price simply reduces to the one-way fare from Los
Angeles to San Francisco, which is $49. Given the lack of empirical understanding of the
pricing practice of Southwest and JetBlue, whether and how they may practice discrimination
along the various consumer segments remain to be investigated.
2.3 Operational advantages and pricing in the airline sector
The operations side of the airline industry, such as in the form of hub-presence on a
route, can have a significant impact on prices since it can indirectly create both cost and
operational advantages for firms (Borenstein 1989). For example, a hub-and-spoke system
allows for more efficient use of aircrafts, and can provide additional values to consumers through
greater flight frequency and easier connections. Though airlines may enjoy cost savings from
hub operations due to economies of scale, prior research shows that these savings may not
necessarily be passed on to consumers; because through their control over scarce resources such
as gates and runways at hub airports, airlines can deliver greater values and convenience to
travelers and command a premium (Borenstein 1989; Berry, Carnall et al. 1997). On the other
9
hand, some studies find evidence that airlines lower prices in hub markets to create barriers to
entry (Borenstein and Rose 1994; Hayes and Ross 1998; Stavins 2001). While empirical
observations on the pricing effects of hub operation are mixed, the general conceptual
understanding in this literature favors the premium-based view.
Airplanes vary both in sizes and types; a firm’s choice of equipment is intrinsically
connected with the geographical distances of routes in which it operates. Extant literature
suggests that while larger aircrafts have lower per-seat-mile cost on flights of more than 500
miles, smaller aircrafts are more fuel efficient on short-haul routes. (Borenstein 1989; Berry
1990; Hayes and Ross 1998; Stavins 2001). On long-haul routes, such as from New York (JFK)
to West Palm Beach in Florida (PBI), the average plane size of non-EDLP carriers is 182; with
a significant variation in both types and sizes of equipments — Delta Airlines operates the 4
different types of planes ranging from 120 to 252 seats, while US Airways operates the 3 with
ranging from 120 to 150 seats2. On short-haul routes, such as from Boston (BOS) to New York
(LGA), the average plane size of non-EDLP carriers is 121 (number of passenger seats); where
Delta and US Airways both operate only two types of aircrafts with ranging from 120 to 150
seats.
In summary, non-EDLP airlines operate many different aircrafts to cater to the demands
in different markets. While operating different types of aircrafts to cater to the market demand
and flight distance on specific routes may allow these airlines to more efficiently utilize their
physical assets, the costs associated with maintaining equipment and complications in crew
scheduling may outweigh the benefits of doing so. Further, extant research has provided us
little understanding of the specific operational details of EDLP airlines, and how these choices
may impact their pricing.
2.4 Operational advantages and everyday low price
While Southwest and JetBlue do not follow the traditional hub-and-spoke system and
focus mainly on point-to-point operations (Morrison 2001), they do maintain hub-like operations
2 The four types of aircrafts operated by Delta are: Boeing 737-800, Boeing 737-300, Boeing 757-200, and Boeing 767-300/300er; the ones operated by US Airways are: Boeing 737-300, Airbus A320-100/200, and Airbus A319. Source: Form 41, Schedules T100 and T100(f) Air Carrier Data (BTS).

10
and route their flights through certain airports; which are often referred to as their “bases”,
“focus cities”, or simply “busiest airports”. Nonetheless, based on definition employed in extant
literature (a hub is where an airline has strong presence, along with outbound flights to a large
number of destinations) and for the sake of empirical consistency, we consider such airports as
their hubs. The major hubs for Southwest are Dallas Love Field (DAL), Chicago Midway
(MDW), Baltimore/Washington International (BWI), Houston (HOU), Las Vegas (LAS), and
Phoenix Sky Harbor (PHX); while those for JetBlue are Boston (BOS), Fort Lauderdale (FLL),
Long Beach (LGB), and New York John F. Kennedy (JFK), Orlando (MCO), and Washington
Dulles (IAD). Southwest and JetBlue can potentially benefit from control over resources at
these airports, and therefore face a unique dilemma: on one hand, by offering easy connections
and more frequent flights through their hub airports, they can leverage these advantages from
hub airports to command a premium on the corresponding routes; on the other, charging higher
prices on these routes implies creating greater variance in prices, and may hurt their very
fundamental pursuit of a low and consistent price image.
Further, as discussed in the previous subsection, an airline’s choice of aircrafts is closely
related to their choice of markets/routes in which they operate. Interestingly, both EDLP
airlines in the domestic U.S. market tend to operate mid-size planes that are most fuel efficient
for traveling non-stop distances of less than 500 miles. For example, Southwest operates only
Boeing 737 flights with sizes ranging from 122 to 137 seats; while JetBlue operates two types of
flights: the Airbus A320 with 156 seats, and the EMBRAER 190 with 100 seats3. Compared to
their non-EDLP counterparts, Southwest and JetBlue able to enjoy significant cost advantage
on short-haul routes from flying smaller planes. Further, not only are their recurring costs of
equipment maintenance lower, but they also benefit from improved efficiency of aircraft
turnaround operation (i.e. the preparation works that need to be carried out for an inbound
aircraft that is scheduled for a following outbound flight). Once again, the EDLP airlines face a
unique dilemma: should they keep prices consistent across markets regardless of whether the
routes are short-/long-haul? Or should they pass on the cost savings to their consumers to
undercut their competitors and create barrier to entry?
3 At the time of our data collection, JetBlue had not yet introduced the EMBRARER and was only operating the A320.
11
Therefore, while there is significant understanding on the usage of operational elements
in pricing by airlines such as American, Delta, etc., little is known with regards to how such
elements may affect the pricing strategy of Southwest and JetBlue. Since their operations are
more hub-like rather than true hub-n-spoke, this particular dimension is perhaps less relevant in
their consideration on price discrimination. On the other hand, given the types of aircrafts
operated by the EDLP carriers are much more suited for short-haul flights, these airlines might
undercut their competitors in short-haul markets where they enjoy substantial cost
advantages. In sum, a thorough empirical investigation that incorporates these operational
aspects into understanding airline’s pricing strategy is warranted.
2.5 Technology and price transparency in the airline industry
The first set of technology to arrive in the airline industry was the CRSs (Duliba,
Kauffman et al. 2001). Beginning with Sabre created by American Airlines, there are currently
four major consolidated Global Distribution Systems (GDSs) including the Amadeus, which
captures nearly half of U.S. domestic market share. While the primary purpose of these systems
was to reduce distribution costs (one of the airlines’ top controllable expenses) and improve
internal operating efficiency through automation (Banker and Johnston 1995; Duliba, Kauffman
et al. 2001), gradually they evolved into decision tools for strategic purposes. Not only were
such systems used to bias travel agents, but they were also helpful for forecasting and crew
scheduling on the supply-side. In fact, many other strategic bases for pricing and fare
promotions have essentially emerged from these sophisticated systems due to their ability to
account for routings, stop-overs, advance purchases, length of stay and a myriad of other
factors. Coupled with significantly reducing menu costs, these systems allow airlines to derive
and implement a complex mix of pricing strategies. The very restriction on Saturday stay-over
itself was indeed identified from this treasure-trove of information, as airlines figured that
business travelers were very resistant to spending the weekend away from home (Associates
2002).
While these technologies originated as independent reservation systems carrying only the
owner airline’s tickets, they later became networked central reservation systems with the ability
to act as a clearing house if other airlines participated/provided access to their own reservation
systems. The airlines considered in extant research have all adopted one or more of these
systems and have their tickets offered through them. Since the Congress introduced regulations
12
in mid-80s that required GDSs owners to share sales information and prohibited any kind of
information- or fee-based discriminations against competitors, participating airlines have had
complete and accurate price and product information on each other’s offers (Granados et al.
2006). In essence, GDSs have become a highly transparent trading platform in terms of both
price and product information. The advent of the Internet and OTAs have brought forth such
transparencies to the general public through aggregating, filtering and simplifying complex
information from the GDSs and presenting it in a user-friendly interface. While on one hand
increased market transparency can potentially lead to increased price competition, on the other
it may facilitate tacit collusion as competing firms can both signal price increases and deter each
other from deviating from a tacitly agreed market price through punitive price response
(Campbell et al. 2005; Granados, Gupta et al. 2010). In fact, a few recent studies confirm the
existence of tacit collusion among non-EDLP airlines, and observe higher prices in markets
where these airlines extensively overlap with each other (Evans and Kessides 1994; Gimeno and
Jeong 2001). Together with the added advantage of being able to reach a larger customer base,
offering tickets through the OTAs appears a natural extension of the technology choice for these
airlines.
2.6 Technology and price transparency: implications to EDLP airlines
Automation, and the efficiency that comes along with reservation systems, is certainly of
benefit and a competitive necessity to all firms; EDLP and otherwise. However, if consistency
in fares is truly an objective of EDLP firms, then perhaps the lowered menu cost aspect is not
as attractive to them as it is to their promotion-driven counterparts. Beyond complex fare
management, GDSs are also important for making one’s ticket amenable to part of other
bundles, e.g., for travel agencies that put together tour packages that include hotels, cars, etc.
To that extant it may be beneficial for these two airlines to also become part of the GDSs.
Participation in OTAs brings one key advantage to the airlines — increased market size
and reach to potential customers. Also, since many travelers consult the OTAs, there is a
potential for customers themselves to bundle hotel, car, etc. (at the GDS level only the agents
have the ability to do such bundling). However, GDSs and OTAs, which are essentially Web
front-ends to GDSs, are also platform that makes fares transparent for comparison. In these
regards, the pros and cons of being “transparent” in the market (i.e. from joining the OTAs) for
the EDLP airlines is not fully understood. Research points out that firms need to trade-off

13
between enjoying informational advantage through biased and opaque mechanisms and
increased revenues from transparent mechanism (Granados, Gupta et al. 2006); this is a
particular concern for EDLP airlines because a basic premise for the success of their strategy
hinges on information asymmetry — i.e. not all consumers are aware of all prices in the market.
Therefore, EDLP airlines need to weigh their decision to participate in OTAs on the benefits of
attracting buyers through a more transparent market versus the losses associated with releasing
private information that is visible not only to consumers but also to their competitors
(Granados, Gupta et al. 2010). While higher price transparency may facilitate tacit collusion,
the prospect of setting higher prices through tacit agreements with competitors may not be
relevant to EDLP airlines as it implies detraction from their price image. On the other hand, if
Southwest’s and JetBlue’s fares are indeed low as advertised, then participating should be a
win-win for them. While a cursory look at fares offered by the OTAs suggest otherwise, it is
important to conduct a thorough empirical examination to fully understand any choice in this
regard.
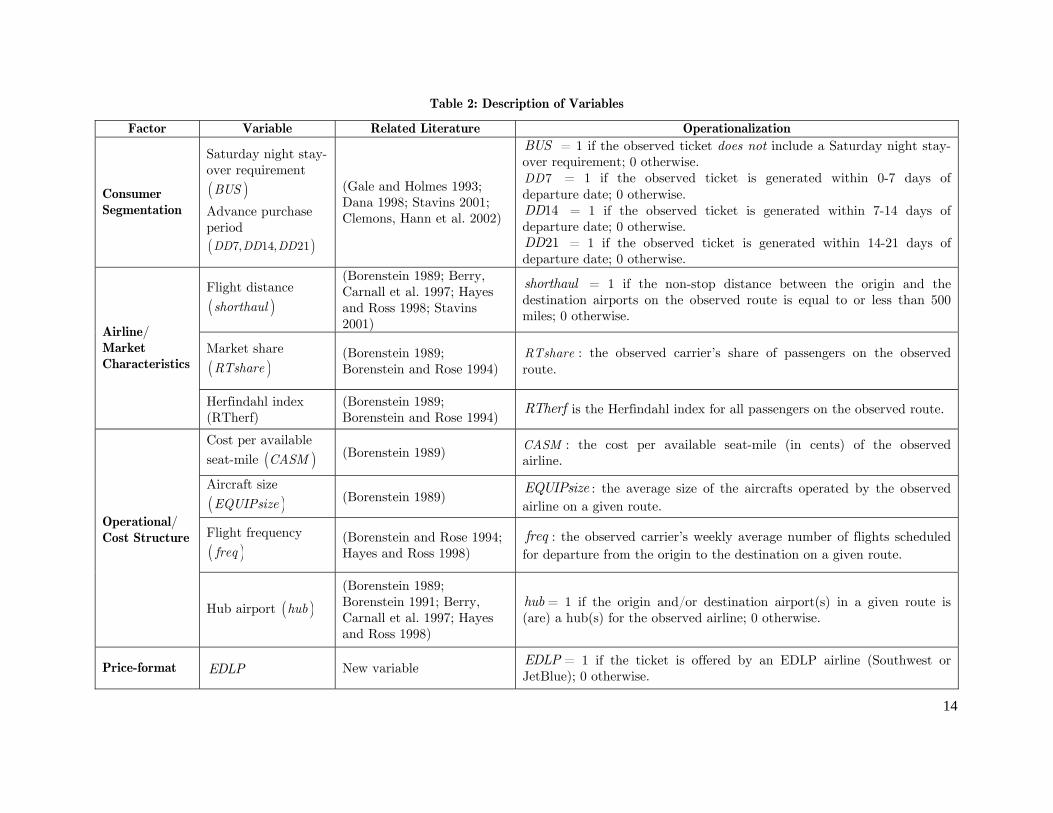
Table 2 summarizes the set of variables that are included in our empirical models.
These variables correspond to the various segmentations, market types, and operational
differences among airlines that have been discussed in this section.
14
Table 2: Description of Variables
Factor Variable Related Literature Operationalization
Consumer Segmentation
Saturday night stay-over requirement
( )BUS
Advance purchase period ( )7, 14, 21DD DD DD
(Gale and Holmes 1993; Dana 1998; Stavins 2001; Clemons, Hann et al. 2002)
BUS = 1 if the observed ticket does not include a Saturday night stay-over requirement; 0 otherwise.
7DD = 1 if the observed ticket is generated within 0-7 days of departure date; 0 otherwise.
14DD = 1 if the observed ticket is generated within 7-14 days of departure date; 0 otherwise.
21DD = 1 if the observed ticket is generated within 14-21 days of departure date; 0 otherwise.
Airline/ Market Characteristics
Flight distance
( )shorthaul
(Borenstein 1989; Berry, Carnall et al. 1997; Hayes and Ross 1998; Stavins 2001)
shorthaul = 1 if the non-stop distance between the origin and the destination airports on the observed route is equal to or less than 500 miles; 0 otherwise.
Market share
( )RTshare (Borenstein 1989; Borenstein and Rose 1994)
RTshare : the observed carrier’s share of passengers on the observed route.
Herfindahl index (RTherf)
(Borenstein 1989; Borenstein and Rose 1994)
RTherf is the Herfindahl index for all passengers on the observed route.
Operational/ Cost Structure
Cost per available seat-mile ( )CASM (Borenstein 1989) CASM : the cost per available seat-mile (in cents) of the observed
airline.
Aircraft size
( )EQUIPsize (Borenstein 1989) EQUIPsize : the average size of the aircrafts operated by the observed airline on a given route.
Flight frequency
( )freq (Borenstein and Rose 1994; Hayes and Ross 1998)
freq : the observed carrier’s weekly average number of flights scheduled for departure from the origin to the destination on a given route.
Hub airport ( )hub
(Borenstein 1989; Borenstein 1991; Berry, Carnall et al. 1997; Hayes and Ross 1998)
hub = 1 if the origin and/or destination airport(s) in a given route is (are) a hub(s) for the observed airline; 0 otherwise.
Price-format EDLP New variable EDLP = 1 if the ticket is offered by an EDLP airline (Southwest or JetBlue); 0 otherwise.

15
3. Data and Method
3.1 Data
Our data is collected from two primary sources. First, we obtained prices and detailed
descriptions of airline tickets from online travel agents and individual airlines’ websites in the
third quarter of 2004. This raw data was gathered using web-based spiders that we developed
using Curl, and later processed by a parser using Perl and other database scripting languages.
In addition to the set of fourteen major U.S. carriers4 and three online travel agents (Orbitz,
Travelociy, and Expedia), a list of the top 500 U.S. domestic routes was provided as input to
the spiders. These markets represent over 86% of total domestic passenger enplanements (i.e.
total number of travelers transported by air within the 50 states) in the U.S. as of 2004. The
spiders were sent out on a daily basis to collect prices and other attributes of tickets requiring
one- to four-week advance purchases, including weekday as well as weekend departures and
returns. Our agents operated in parallel and submitted identical reservation requests to all
online travel agents and airlines’ websites simultaneously in order to minimize price variations
that may arise from the timing of ticket requests.
Consistent with prior research on airline pricing, we consider only coach class, non-
refundable, round-trip tickets. Further, to control for any price difference that may be
attributed to differences in flight duration or the number of connections on any given route, we
restrict our attention to non-stop flights between an origin and a destination. Since non-stop
flights were not available in 28 routes, our data set is reduced to 472 markets with 272,362
unique tickets and final prices, including taxes and fees, offered by fourteen largest domestic
carriers5.
Second, we used the Origin and Destination Survey (DB1B) from the Bureau of
Transportation Statics (BTS) for the corresponding routes and carriers in the second and third
quarters of 2004 to collect prices on transacted tickets and compute the market shares of
individual airlines in each origin-destination pair. DB1B is a 10% sample of all tickets sold by
4 The fourteen major carriers are American, Alaska, Continental, Delta, United, US Airways, Southwest, JetBlue, Frontier, America West, AirTran, ATA, and Spirit. 5 Spirit Airlines had been dropped from our subsequent analysis due to insufficient number of observations.

16
reporting carriers, including origin, destination and other itinerary details of passengers
transported. This data contains sales from both online and offline channels, and is used in our
later analysis to check the robustness of our findings that are based on the online pricing data
we gathered from the Internet. In addition, we used the Air Carrier Statistics (Form 41 Traffic
and 298C Summary Data) and Air Carrier Financial Reports (Schedule P-12) provided by the
BTS to assemble data on airlines’ operational details (e.g. cost per available seat-mile, aircraft
types and sizes, frequency of flights, etc.), as well as information on the respective markets (e.g.
origin-destination distance, hub information, etc.).
By combining these various sets of data, we yielded a complete profile of all relevant
variables at the ticket level that allowed us to examine the effects of various market- and firm-
specific factors on airline pricing. We subsequently eliminated routes where the dominant
carrier has over 90% market share. Our final data set consists of 209,558 observations from 268
markets. Table 3 reports the descriptive statistics of our data.
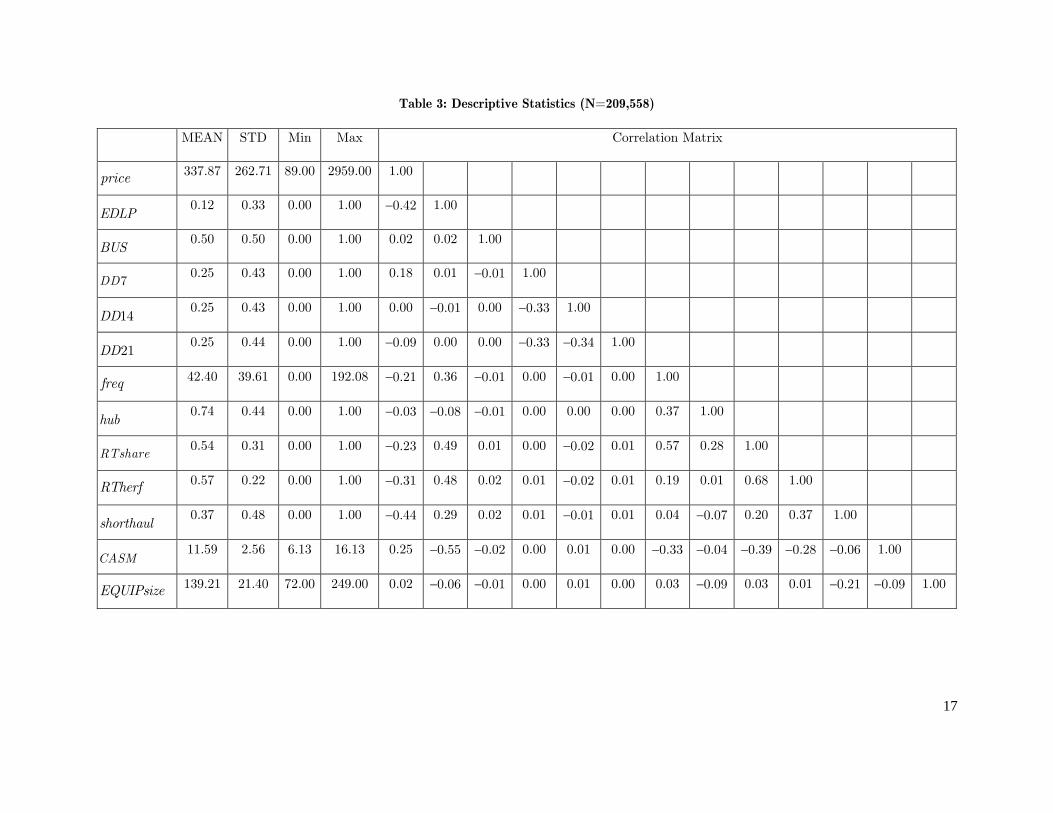
17
Table 3: Descriptive Statistics (N=209,558)
MEAN STD Min Max Correlation Matrix
price 337.87 262.71 89.00 2959.00 1.00
EDLP 0.12 0.33 0.00 1.00 −0.42 1.00
BUS 0.50 0.50 0.00 1.00 0.02 0.02 1.00
7DD 0.25 0.43 0.00 1.00 0.18 0.01 −0.01 1.00
14DD 0.25 0.43 0.00 1.00 0.00 −0.01 0.00 −0.33 1.00
21DD 0.25 0.44 0.00 1.00 −0.09 0.00 0.00 −0.33 −0.34 1.00
freq 42.40 39.61 0.00 192.08 −0.21 0.36 −0.01 0.00 −0.01 0.00 1.00
hub 0.74 0.44 0.00 1.00 −0.03 −0.08 −0.01 0.00 0.00 0.00 0.37 1.00
RTshare 0.54 0.31 0.00 1.00 −0.23 0.49 0.01 0.00 −0.02 0.01 0.57 0.28 1.00
RTherf 0.57 0.22 0.00 1.00 −0.31 0.48 0.02 0.01 −0.02 0.01 0.19 0.01 0.68 1.00
shorthaul 0.37 0.48 0.00 1.00 −0.44 0.29 0.02 0.01 −0.01 0.01 0.04 −0.07 0.20 0.37 1.00
CASM 11.59 2.56 6.13 16.13 0.25 −0.55 −0.02 0.00 0.01 0.00 −0.33 −0.04 −0.39 −0.28 −0.06 1.00
EQUIPsize 139.21 21.40 72.00 249.00 0.02 −0.06 −0.01 0.00 0.01 0.00 0.03 −0.09 0.03 0.01 −0.21 −0.09 1.00
18
3.2 Models
An important characteristic of our data is that prices of individual tickets (level 1) are clustered
within groups, defined by airline/route (level 2). Thus, prices of tickets written by a particular
carrier are likely to be correlated due to the underlying pricing strategy, or the cost and
operational structure of the airline. Similarly, ticket prices of different airlines in the same
market (defined as a directional origin-destination pair) may also be correlated because of the
common underlying demand characteristics, competitive forces and cost structure for that route.
When data are clustered in this fashion, the resulting unit-level random errors are correlated
(within group) and heteroscedastic (across groups), thus violating two critical assumptions of
the OLS.
Hierarchical linear models (HLM) provide a way to overcome these problems by
accounting for the partial dependence of individual observations within a group and for
heterogeneity across groups. This approach has been recommended for the analysis of airline
data by Borenstein and Rose (1994), as well as in two recent studies of price dispersion in the
area of information systems by Venkatesan, et al., (2006) and Chellappa, et al., (2011).
The fundamental idea behind HLM is that separate analyses are performed for each of
the units at the lowest level of a hierarchical structure, while both individual- and group-level
unit variances in the outcome measure are examined through simultaneous estimation of
between-group variances and the effects of independent variables at each level. The total
variance in the outcome is then divided into the parameter variance and error variance
components. Unlike OLS, hierarchical models estimate residuals from different levels separately
and account for the covariance structure among group-level regression estimates; not only does
this provide more accurate group effect estimates than traditional methods that systematically
underestimate them (Raudenbush and Bryk 1989), but it also allows one to model explicitly
both within- and between- group variances as well as their effects on the outcome while
maintaining the appropriate level of analysis (Griffin and Hofman 1997).
One additional advantage of the HLM approach is that it allows us to incorporate airline
and market characteristics into the model while still producing accurate estimates of the group-
level effects and valid tests of confidence intervals (Mendro et al. 1995) — which are typically
ignored by OLS (Bryk and Thum 1989). In addressing the multilevel nature of data, traditional
19
fixed effects models use dummy variables to “absorb” all heterogeneities across different group
units; as a result, level-two variables (airline and route characteristics) are excluded from the
model because they are confounded with the group fixed effects (airline and route dummies) and
result in multicollinearity problems. In our current context, this implies that airline- and
market-specific attributes cannot be explicitly accounted for in the model, thus largely limiting
our ability to draw inferences on the possible moderating effects of these characteristics on the
relationship between other explanatory variables (such as pricing strategy) and ticket prices.
While typically this can be resolved by incorporating interactions between the explanatory
variables and group-level dummies into the model, when the number of groups (such as origin-
destination pairs) is large, the interaction approach becomes impractical as it results in a large
number of parameters and over-identification of the model.
Our econometric estimation aims to provide an understanding of firms’ pricing strategies
through two distinct measures. The first is price — which is self-explanatory in its ability to
describe pricing strategy. In the price model, a positive (negative) coefficient for an independent
variable suggests that the variable is correlated with a higher (lower) ticket price. The second
dependent variable is “price variance” — commonly in IS literature this variable has only been
used for studying market level dispersion in prices across firms. However, the marketing
literature has shown how variance in prices of a single firm is in itself an execution of a
corresponding pricing strategy. For example, the work by Hoch et al. (1994), Ho et al. (Ho,
Tang et al.), and Shankar and Bolton (2004) use price variance at the firm-level to show some
firms vary prices frequently while others do not; the theoretical reasoning behind creating
multiple price points is that these different prices can appeal to different segments of consumers,
allowing the firm to extract more surplus. Thus an examination of this dependent variable is
critical to our understanding of the extent to which airlines like Southwest and JetBlue pursue
discrimination compared with the other major carriers.
In the subsequent discussions, we use subscript m to denote a market, subscript k to
denote a carrier, and subscript c to denote ticket category. Model 1 investigates ticket-level
prices (dependent variable: ikmcprice ), while Model 2 examines the variance in prices of individual
carriers within a given market, for each ticket category (dependent variable: kmcCV ). We treat
both airline and route effects as random in Model 1; this is because level-1 units (individual
tickets) are cross-classified by two separate level-2 units (airline and market). In Model 2,

20
however, the dependent variable is an aggregate measure at the carrier-route-ticket category
level. Following extant literature we treat only the route effect as random (Borenstein and Rose
1994).
Model 1: Price level
Consistent with extant literature on airline pricing, we employ log-transformation for most of
our explanatory variables to capture their declining marginal effects on prices. The variables
that are included in the model without any transformation are the dummy variables, market
share ( )RTshare , and the corresponding Herfindahl index( )RTherf (Borenstein 1989).
Level 1 (ticket-level) model:
( )
( )0 1 2 3 4
2
ln 7 14 21
~ 0,kmc kmc ikmc kmc ikmc kmc ikmc kmc ikmc ikmcikmc
ikmc
BUS DD DD DDprice
N
α α α α α ε
ε σ
= + + + + + (1)
In this model, the dependent variable ikmcprice denotes the price of ticket i offered by carrier k
in market (route) m in a given ticket category ( )c .
Level 2 (airline- and market-level) model:
( )( ) ( )
( ) ( )
( )( )
0 0 01 02 03 04
05 06 07 08
09 10 00 00 0
1 4 1 4 1 4
00
00
0
ln
ln ln
~ 0,
~ 0,
km k km kmkm
m m k km
k m k km k m km
km km km k
k
m
km
EDLP hub RTsharefreq
RTherf shorthaul CASM EQUIPsize
EDLP shorthaul EDLP hub u u u
EDLP
u N
u N
u
α β γ γ γ γγ γ γ γγ γ
α γ δϕτ
− − −
= + + + ++ + + +
+ × + × + + += +
( )~ 0,N ψ
(2)
The full model (after rearranging terms and renaming the coefficients):
( )( )
( ) ( )( ) ( ) ( )
1 2 3 4 5
6 7 8 9
10 11 12
13 14 15
ln 7 14 21
ln
ln ln
7 14
ikmc k ikmc ikmc ikmc ikmc
km km km m
m k km
k ikmc k ikmc k ikmc
price EDLP BUS DD DD DD
freq hub RTshare RTherf
shorthaul CASM EQUIPsize
EDLP BUS EDLP DD EDLP DD
α β β β β ββ β β ββ β ββ β ββ
= + + + + +
+ + + +
+ + +
+ × + × + ×
+ ( ) ( ) ( )16 17 1821k ikmc k m k km ikmEDLP DD EDLP shorthaul EDLP hubβ β ε× + × + × +
(3)
where
0 00 00 0k m kmu u uα β= + + + (4)

21
Equation (3) is the basic model to be estimated. Interactions between the EDLP
identifier and various ticket categories (Saturday night stay-over and advance purchase periods)
and market characteristics (short-haul and hub) are included to capture any potential
differences in the pricing approach of EDLP versus other major carriers due to differences in
their segmentation approach and operational/cost differences in various types of markets. 0β
represents the overall intercept; 00ku and 00mu are the random carrier and route effects,
respectively. 0kmu is the random interaction effect. Finally, ikmε is the white-noise error
particular to the individual observation.
The variable BUS identifies tickets without the Saturday night stay-over restriction, as
these tickets are typically geared towards business travelers who have higher willingness to pay
for a ticket (Gale and Holmes 1993; Dana 1998; Clemons, Hann et al. 2002). Consistent with
prior work, we shall refer to these tickets without weekend restriction as “business tickets”, while
those that are with such restriction as “leisure tickets” (Chellappa et al. 2011). Readers are
reminded that all tickets in our sample are restricted, coach class tickets.
Model 2: Price variance
Level 1 (airline-level) model:
( )
0 1 2 3 4 5
6 7 8 9 102
7 14 21
~ 0,
kmc m m k m kmc m kmc m kmc m kmc
m km m km m km m k m km km
km
CV EDLP BUS DD DD DD
freq hub RTshare CASM EQUIPsize
N
α α α α α αα α α α α ε
ε σ
= + + + + ++ + + + + + (5)
Level 2 (market-level) model:
( ) ( )
( )
0 0 11 12
13 14 0
1 1
2 5 2 5 2 5
5 10 5 10
0 ~ 0,
m m m
k m k km m
m m
m m m k
m m
m
RTherf shorthaul
EDLP shorthaul EDLP hub u
EDLP
u N
α β γ γγ γ
α γα γ δα γ
τ
− − −
− −
= + ++ × + × +== +=
(6)
The full model (after rearranging terms and renaming the coefficients):
22
( ) ( ) ( )( )
1 2 3 4 5
6 7 8 9
10 11 12
13 14 15
16 17
7 14 21
7 14
21
kmc k kmc kmc kmc kmc
km km km m
m k km
k km k km k km
k km
CV EDLP BUS DD DD DD
freq hub RTshare RTherf
shorthaul CASM EQUIPsize
EDLP BUS EDLP DD EDLP DD
EDLP DD EDLP
α β β β β ββ β β ββ β ββ β ββ β
= + + + + ++ + + ++ + +
+ × + × + ×
+ × + ( ) ( )18k m k km kmshorthaul EDLP hubβ ε× + × +
(7)
where
0 0muα β= + (8)
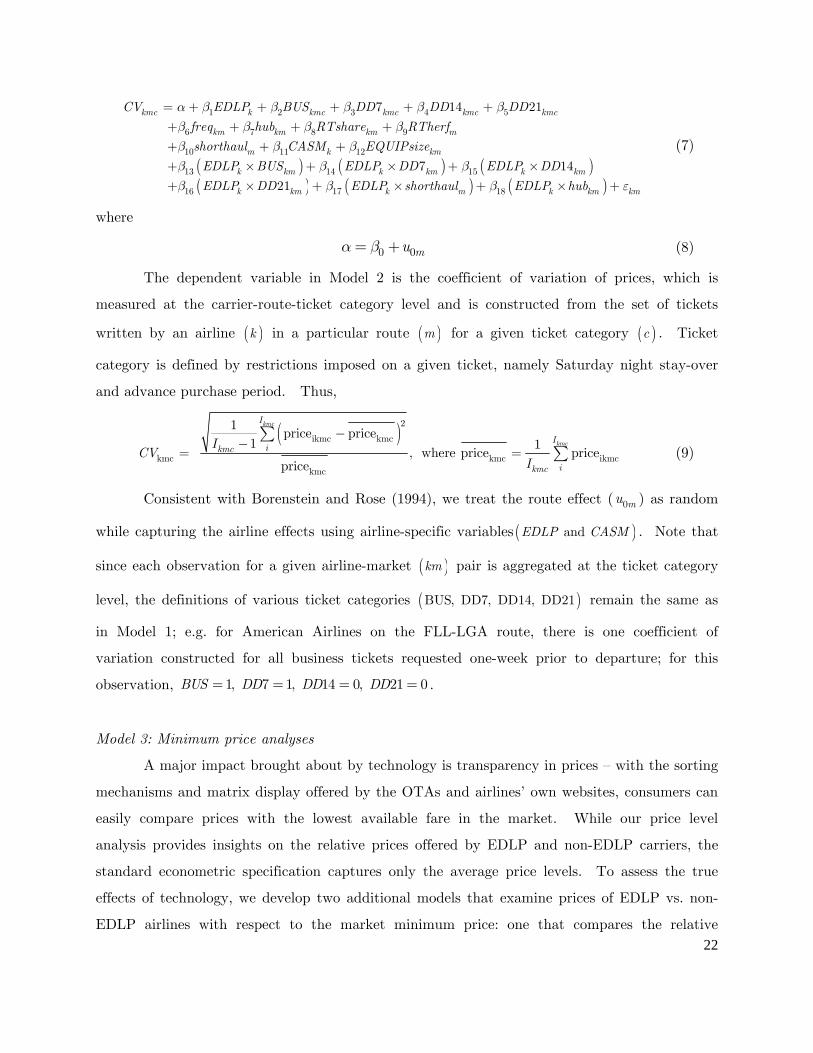
The dependent variable in Model 2 is the coefficient of variation of prices, which is
measured at the carrier-route-ticket category level and is constructed from the set of tickets
written by an airline ( )k in a particular route ( )m for a given ticket category ( )c . Ticket
category is defined by restrictions imposed on a given ticket, namely Saturday night stay-over
and advance purchase period. Thus,
( )2ikmc kmc
kmc kmc ikmckmc
1price price
1 1 , where price price
price
kmc
kmc
I
Iikmc
ikmc
ICV
I
−−
= =∑
∑ (9)
Consistent with Borenstein and Rose (1994), we treat the route effect ( 0mu ) as random
while capturing the airline effects using airline-specific variables( ) and EDLP CASM . Note that
since each observation for a given airline-market ( )km pair is aggregated at the ticket category
level, the definitions of various ticket categories ( )BUS, DD7, DD14, DD21 remain the same as
in Model 1; e.g. for American Airlines on the FLL-LGA route, there is one coefficient of
variation constructed for all business tickets requested one-week prior to departure; for this
observation, 1, 7 1, 14 0, 21 0BUS DD DD DD= = = = .
Model 3: Minimum price analyses
A major impact brought about by technology is transparency in prices — with the sorting
mechanisms and matrix display offered by the OTAs and airlines’ own websites, consumers can
easily compare prices with the lowest available fare in the market. While our price level
analysis provides insights on the relative prices offered by EDLP and non-EDLP carriers, the
standard econometric specification captures only the average price levels. To assess the true
effects of technology, we develop two additional models that examine prices of EDLP vs. non-
EDLP airlines with respect to the market minimum price: one that compares the relative

23
likelihood of the two types of carriers offering the lowest price in the market, while another
determines how far they usually stray from the market minimum.
Model 3a: Likelihood of prices being lowest in the market
( ) ( )0 1min minkm m kprob P P EDLPβ β= = Λ + (10)
where min kmP is the minimum price offered by carrier k in market m , and min mP is the lowest
fare available in the market. Λ is the logistic function, given by ( )( )0 1
0 1
exp
1 expk
k
EDLP
EDLP
β β
β β
+
+ + .
Model 3b: Distance between median price and market minimum
1 2 3 4
5 6 7
km k km km m
m k km km
Meddiff EDLP hub RTshare RTherf
shorthaul CASM EQUIPsize
α β β β ββ β β ε
= + + + ++ + + +
(11)
where
0 0muα β= + (12)
The dependent variable in Model 3b is the distance between the observed carrier’s
median ticket price and the lowest fare available in the market, formally defined as:
( ) { }km 11 21 median -minP , where minP min , ... km m m m m ikmMeddiff price p p p= = (13)
Note that for models 3a and 3b, we restrict our attention to only the markets where
EDLP carriers compete. Further, for these two analyses our primary interest is in the DB1B
data, where the observed prices are actual fares selected by the consumers.
We have taken great cautions in addressing potential endogeneity issues that might
occur at different levels in our models, and have performed additional robustness checks using
alternative model specifications. Interested readers may refer to Appendix A for details.

24
4. Discussion of Results
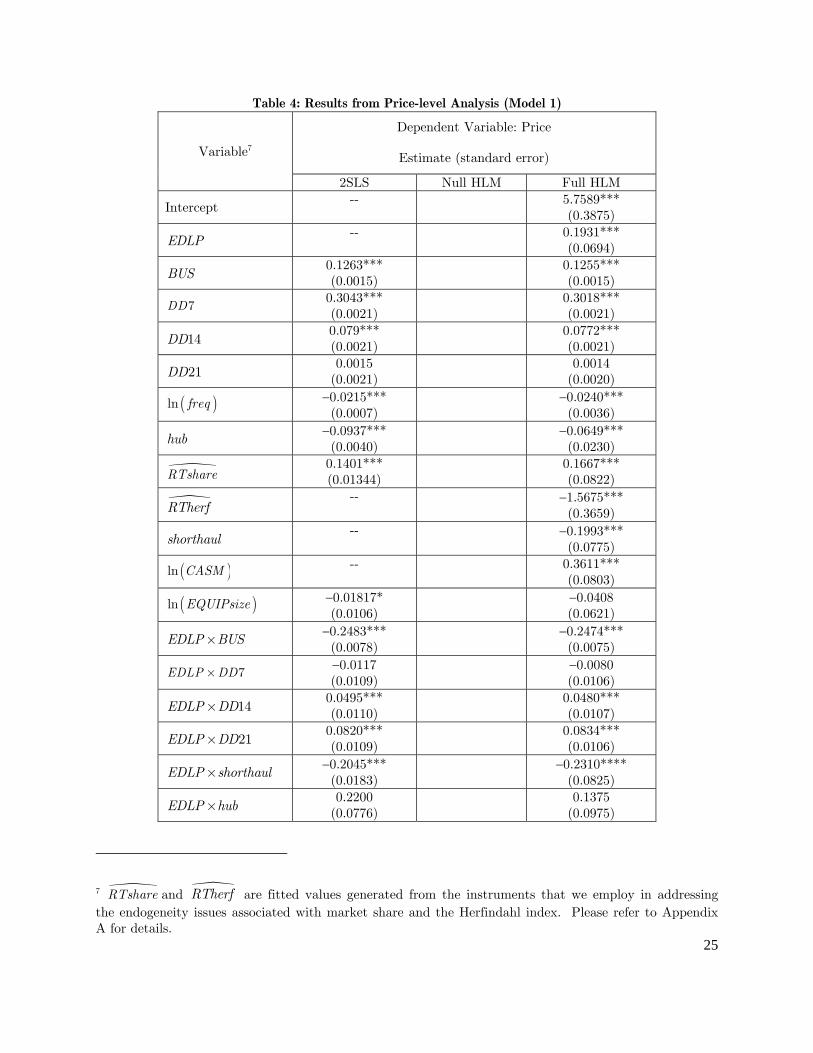
The raw coefficient estimates of model 1 are presented in Table 4. We have conducted
many tests on model specification and robustness, including standard tests for multicollinearity,
Hausman test, and robustness tests based on analysis on the residuals, as well as various
goodness of fit indices. The two highest VIF values in our models are 5.32 and 4.94, both fall
below the critical level of 10, which indicate that multicollinearity is not an issue. Further, we
performed Hausman tests for both route and airline random effects. The null hypothesis is
equality of fixed and random effects estimates. The resulting test statistic is 0.1673, which falls
well below the critical value of 29.14 at the 99 percent confidence level for a Chi-square with 14
degrees of freedom6. These statistics indicate that the coefficient estimates from the random
effects model are not significantly different from those that are obtained from the fixed effects
model, and that the random effects specification produces consistent estimates. Further, from
the second and third columns in Table 4 we can observe that the estimates of the airline- and
route-route random effects are highly significant in the hierarchical linear models. These
statistics suggest that ticket prices are clustered within both carrier and route; hence the results
obtained from the fixed effects model would likely be misleading. The last three rows in the
table compare the goodness of fit for three different specifications of Model 1: The two-stage
least square with fixed effects (2SLS), the null hierarchical model (Null HLM), and the full
cross-classified hierarchical model (Full HLM); the former two serve as baseline models for
comparison.
The Full HLM fits the data better than the fixed effects model (2SLS) based on both
BIC and the sum of residual-squared errors criteria; the sum of squared errors of the Full HLM
is lower than that of the fixed effects model by 5.95%. The amount of reduction in variance
components ϕ , τ , and ψ suggest that 72.05% of explainable variation in carrier means, 20.65%
of explainable variation in route means, and 24.69% of explainable variation in the carrier-route
means are explained by the variables incorporated in the Full HLM. In addition, the random
error is reduced by 14.90% compared to the null model. All statistics indicate that the chosen
variables provide excellent explanations for the pricing of airline tickets in the sample.
6 Variables that are perfectly collinear with either airline- or route-fixed effects are excluded.
25
Table 4: Results from Price-level Analysis (Model 1)
Variable7
Dependent Variable: Price
Estimate (standard error)
2SLS Null HLM Full HLM
Intercept -- 5.7589***
(0.3875)
EDLP -- 0.1931***
(0.0694)
BUS 0.1263*** (0.0015)
0.1255*** (0.0015)
7DD 0.3043*** (0.0021)
0.3018*** (0.0021)
14DD 0.079*** (0.0021)
0.0772*** (0.0021)
21DD 0.0015
(0.0021) 0.0014
(0.0020)
( )ln freq −0.0215*** (0.0007)
−0.0240*** (0.0036)
hub −0.0937*** (0.0040)
−0.0649*** (0.0230)
RTshare 0.1401*** (0.01344)
0.1667*** (0.0822)
RTherf -- −1.5675***
(0.3659)
shorthaul -- −0.1993***
(0.0775)
( )ln CASM -- 0.3611*** (0.0803)
( )ln EQUIPsize −0.01817* (0.0106)
−0.0408 (0.0621)
EDLP BUS× −0.2483*** (0.0078)
−0.2474*** (0.0075)
7EDLP DD× −0.0117 (0.0109)
−0.0080 (0.0106)
14EDLP DD× 0.0495*** (0.0110)
0.0480*** (0.0107)
21EDLP DD× 0.0820*** (0.0109)
0.0834*** (0.0106)
EDLP shorthaul× −0.2045*** (0.0183)
−0.2310**** (0.0825)
EDLP hub× 0.2200
(0.0776) 0.1375
(0.0975)
7 RTshare and RTherf are fitted values generated from the instruments that we employ in addressing the endogeneity issues associated with market share and the Herfindahl index. Please refer to Appendix A for details.

26
00ku (airline random effects)
-- 0.01145** (0.0053) 0.0032**
(0.002)
00mu
(route random effects)
-- 0.1705*** (0.0158) 0.1353***
(0.0125)
0kmu (random interaction effects)
-- 0.02045*** (0.0015) 0.0154***
(0.0012)
ikmε 0.1115*** (0.0003)
0.1235*** (0.0004)
0.1051*** (0.0003)
N 209558 209558 209558 2LL− 136716 159762 125875.8
BIC 136728 159762 125876 Sum of residual-squared 23332.43 25798.27 21944.30
In the following subsections, we shall interpret and discuss our results so as to i) extend
our understanding of airline pricing for major carriers in online markets and ii) to shed light on
the everyday low price strategy in the airline industry.
4.1 Consumer segmentation and pricing
In Section 2.1, based on prior research we had suggested that airlines will engage in
discrimination when the opportunity to segment consumers on some basis is available. Two key
possibilities were discrimination based on schedule flexibility (through advance purchase
requirement) and intended purpose of the trip (business/leisure, through Saturday stay-over
restriction). Data tells us that all airlines indeed create various ticket types to segment based
on advance purchase period. Our results show that both major carriers and EDLP airlines
employ similar segmentation strategy along this dimension, with ticket prices being consistently
higher closer to flight departure. In particular, for tickets offered by the major carriers, those
that are purchased within two weeks (coefficient = 0.0722; standard error = 0.0021) and one
week (coefficient = 0.3018; standard error = 0.0021) before departure are priced 8.03%8 and
over 35% higher than those purchased four weeks in advance, respectively. Similarly, prices of
8 This is calculated as a ( )( )100 * exp 0.0772 1− ; similar calculations are performed using the raw
coefficient estimates of the corresponding variables in interpreting their effects on non-EDLP prices.

27
tickets offered by Southwest and JetBlue increase as departure date approaches, from 8.84%9 for
three-week advance purchase (coefficient = 0.0847; standard error = 0.0104) to up to 34.15%
for one-week advance purchase (coefficient = 0.2938; standard error = 0.0104), compared to
those that are purchased four weeks in advance. Our results imply that even in the post
Internet-based search era, airlines retain the ability to differentiate travelers based on their
opportunity costs/willingness to pay via advance purchase requirements. They also suggest
that, despite their pursuit of EDLP, Southwest and JetBlue do not necessarily forgo the
discrimination opportunity associated with travelers’ opportunity cost of time.
Our findings with regards to Saturday stay-over ( )BUS are somewhat surprising and
counter to what is commonly understood about consumer segmentation in this industry; i.e.
airlines create different fare rules depending on whether the return trip occurs on a weekday or
weekend. Research has suggested that imposing a Saturday night restriction for low price
tickets is a key way to differentiate travelers on their intended purpose of the trip, as business
travelers have strong tendency to return home for the weekend (Associates 2002; Office of
Aviation and International Affairs 2003). While indeed American, Delta and other major
carriers follow this practice, Southwest and JetBlue appear to eschew such a form of
discrimination. For example, tickets offered by the major carriers that do not require a
Saturday stay-over (coefficient = 0.1255; standard error = 0.0015) are priced higher (by 13.37%)
compared to tickets with such a requirement. Our data shows that for tickets with the same
origin and departure date, American’s prices are on average $51.04 higher when the return trip
is on a weekday as opposed to weekend; the same is observed for all major carriers such as
Continental (higher by $44.29) and United (higher by $34.82), etc. Interestingly, this is true
even with OTAs and airlines’ own web sites presenting weekend and non-weekend fares side by
side for comparison. Although the use of Saturday stay-over restriction as a means for
discrimination is a generally understood concept, the actual effect of this restriction on ticket
9 Since our model includes several dichotomous variables that interact with the EDLP dummy, care must be taken when inferring the main and interaction effects and in deriving overall implications from the model. The effects of one-week advance purchase on EDLP prices can be derived from summing the coefficients of 7DD (0.3018) and 7EDLP DD× (−0.0080) = 0.2938. The percentage is derived as
( )( )100 * exp 0.2938 1− , while standard error is calculated using the corresponding elements in the
variance-covariance matrix of the Beta coefficients: ( ) ( ) ( )3 14 3 142 cov ,Var Varβ β β β+ + . Similar
calculations are performed when interpreting the effects of other variables on EDLP prices.

28
prices has not been formally established in empirical studies on airline pricing due to the lack of
time attribute in the data on transacted tickets widely used in extant literature.
On the other hand, Southwest and JetBlue tickets actually appear to be cheaper when
the return trip occurs on a weekday. In particular, their prices are lower (by 12%) for tickets
that do not involve a Saturday stay-over (coefficient = −0.1219; standard error = 0.0074) than
those that do. Our data shows that Southwest’s tickets are on average priced $31.87 lower
when the return trip occurs on a weekday instead of weekend, while JetBlue’s tickets are $41.93
lower for the same. While at one end this can be interpreted to mean that these two airlines
employ a discrimination of the reverse kind, caution must be exercised in interpreting this
result. This is because Southwest and JetBlue do NOT practice discrimination based on round
trip fares; hence the long-held notion of weekend-restriction may not be meaningful in
interpreting their prices. This is an important deviation from our extant understanding of
airline pricing.
Taken together, our findings suggest that schedule flexibility and the preference for
returning on weekday/weekend are intrinsic demand characteristics of travelers, ones that are
not likely to change as a result of the lowering of search cost and their ability to find better
deals on alternative flight schedules. Indeed, we find that the major carriers continue to
practice discrimination along both advance purchase and Saturday stay-over dimensions. On
the other hand, for the two EDLP airlines which seem to go out of their way to maintain
consistency in prices, it appears that the segmentation based on opportunity cost of time
warrants discrimination but one based on round-trip (and hence weekend-based restriction) is
apparently not. In digesting this result, we should also remember that the whole round-trip fare
was originated in the airline industry as a way to manage disproportional utilization of aircrafts.
Apparently this is not a problem for Southwest and JetBlue who manage their operations in a
much different fashion.
4.2 Operational differences and pricing
In section 2.3, we had discussed the relationship between operational/cost-advantages and
market characteristics (i.e. route distance and hub operation), and that they are also tightly
associated with the types of equipment that airlines have chosen to operate. In this section, we

29
examine how such factors come into play in the pricing decision of EDLP and HILO carriers
respectively.
Observe that ticket prices for HILO carriers are lower in both short-haul markets
(coefficient = −0.1993; standard error = 0.0775. This corresponds to a lower fare by 22%,
compared with long-haul markets) and on routes where they maintain a hub (coefficient =
−0.0649; standard error = 0.0230. This corresponds to a lower fare by 6.28%, compared with
non-hub routes). Hence even though that HILO carriers incur higher costs of maintaining a
larger variation of equipments and scheduling crews to operate different planes on different
routes, the savings from doing so seem to justify their choices. In particular, the fact that these
airlines charge lower prices on short-haul markets suggests that their equipment utilization is
efficient, despite having larger plane sizes that may not be fuel efficient on those routes.
Further, instead of leveraging their dominance at hub airports and charging a premium to
extract the higher willingness to pay by travelers who enjoy the convenience of more connection
choices and higher flight frequency, these airlines appear to pass on — at least part of — the cost
savings they enjoy from economies of scale at hub airports to consumers. This observation is
consistent with the theoretical speculation that airlines may use lower prices to create barriers
to entry on routes where they have a strong presence at the endpoint airports (Borenstein
1989). Our results suggest that the primary focus of the HILO carriers in both short-haul routes
and hub markets is to protect or gain market share through lowering prices.
Southwest and JetBlue, on the other hand, appear to differentiate themselves from their
HILO competitors along these dimensions. In particular, while similar to HILO airlines’ practice
in that their tickets are also cheaper in short-haul markets (coefficient = −0.4302; standard error
= 0.1073), the extent to which EDLP carriers lower prices in these markets (by 35%, compared
to prices they charge in long-haul markets) is nearly twice to that of their HILO counterparts
(22%). The fact that Southwest and JetBlue are able to leverage cost advantages on short-haul
routes to an extent that is unmatchable by their competitors is perhaps closely related to their
choice of equipments: both of these airlines operate smaller flights that are most fuel-efficient for
short-haul routes, and that they are also very particular in limiting the variation in plane sizes
to save cost on maintenance. Our findings suggest that the savings on operational costs enjoyed
by EDLP airlines in short-haul routes exceed those of their competitors, and that these airlines
undercut their competitors and to maintain their “low price” image through significantly
lowering prices in short-haul markets.

30
On the other hand, we do not observe any significant difference between the prices that
EDLP carriers charge in hub- vs. non-hub markets (coefficient = 0.0726; standard error =
0.0949). This finding suggests that perhaps these airlines do not benefit from the same scale
economies as their HILO counterparts do at hub airports, while at the same time they also
refrain from leveraging their airport dominance to command a premium on tickets.
4.3 Price variance analysis
Table 5 presents the results from our price variance analysis (Model 2). Observe from
the full model (last column) that the EDLP main effect is negative and significant, while most
of the interaction effects are either negative or non-significant. Note also that the major carriers
vary their price consistency for different ticket categories and market types. For example, the
negative and significant coefficient for BUS suggests that the prices on business tickets exhibit
a narrower distribution compared to leisure tickets. Combining this observation with our
finding from the price model, we can conclude that major carriers discriminate business travelers
by charging consistently higher prices on tickets that do not require a Saturday stay-over. The
positive and significant coefficients of 7DD and 14DD imply that prices of tickets offered by the
major carriers are increasingly volatile towards flight departure.
Table 5: Results from Price Variance Analysis (Model 2) 10
Variable
Dependent Variable: Coefficient of Variation
Estimate (standard error)
2SLS Null HLM Full HLM
Intercept --
0.0568
(0.0411)
EDLP --
−0.0847*** (0.0229)
BUS −0.0645*** (0.0036)
−0.0646*** (0.0036)
7DD 0.0654*** (0.051)
0.0654*** (0.0051)
14DD 0.0537*** (0.0051)
0.0537*** (0.0051)
10 Frequency in Model 2 is collinear with route-share (a carrier-route level variable) and hence is dropped.
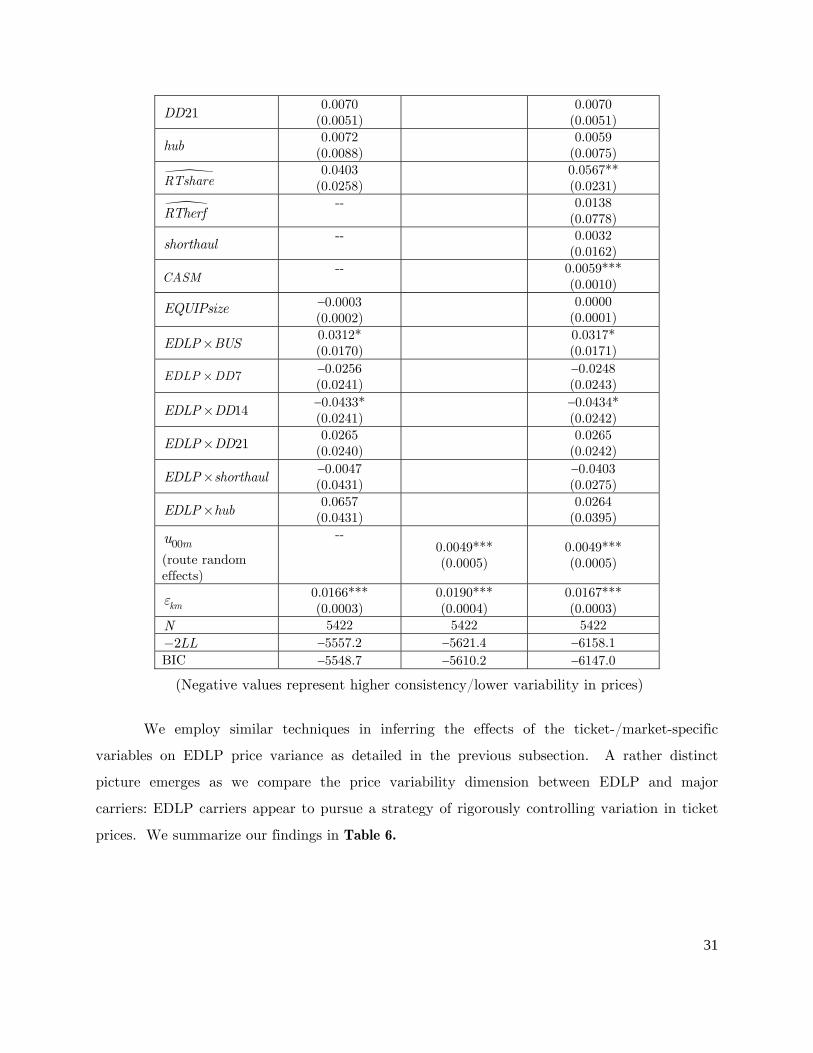
31
21DD 0.0070
(0.0051)
0.0070 (0.0051)
hub 0.0072
(0.0088)
0.0059 (0.0075)
RTshare 0.0403
(0.0258)
0.0567** (0.0231)
RTherf --
0.0138
(0.0778)
shorthaul --
0.0032
(0.0162)
CASM --
0.0059*** (0.0010)
EQUIPsize −0.0003 (0.0002)
0.0000
(0.0001)
EDLP BUS× 0.0312* (0.0170)
0.0317* (0.0171)
7EDLP DD× −0.0256 (0.0241)
−0.0248 (0.0243)
14EDLP DD× −0.0433* (0.0241)
−0.0434* (0.0242)
21EDLP DD× 0.0265
(0.0240) 0.0265
(0.0242)
EDLP shorthaul× −0.0047 (0.0431)
−0.0403 (0.0275)
EDLP hub× 0.0657
(0.0431) 0.0264
(0.0395)
00mu
(route random effects)
-- 0.0049*** (0.0005)
0.0049*** (0.0005)
kmε 0.0166*** (0.0003)
0.0190*** (0.0004)
0.0167*** (0.0003)
N 5422 5422 5422 2LL− −5557.2 −5621.4 −6158.1
BIC −5548.7 −5610.2 −6147.0
(Negative values represent higher consistency/lower variability in prices)
We employ similar techniques in inferring the effects of the ticket-/market-specific
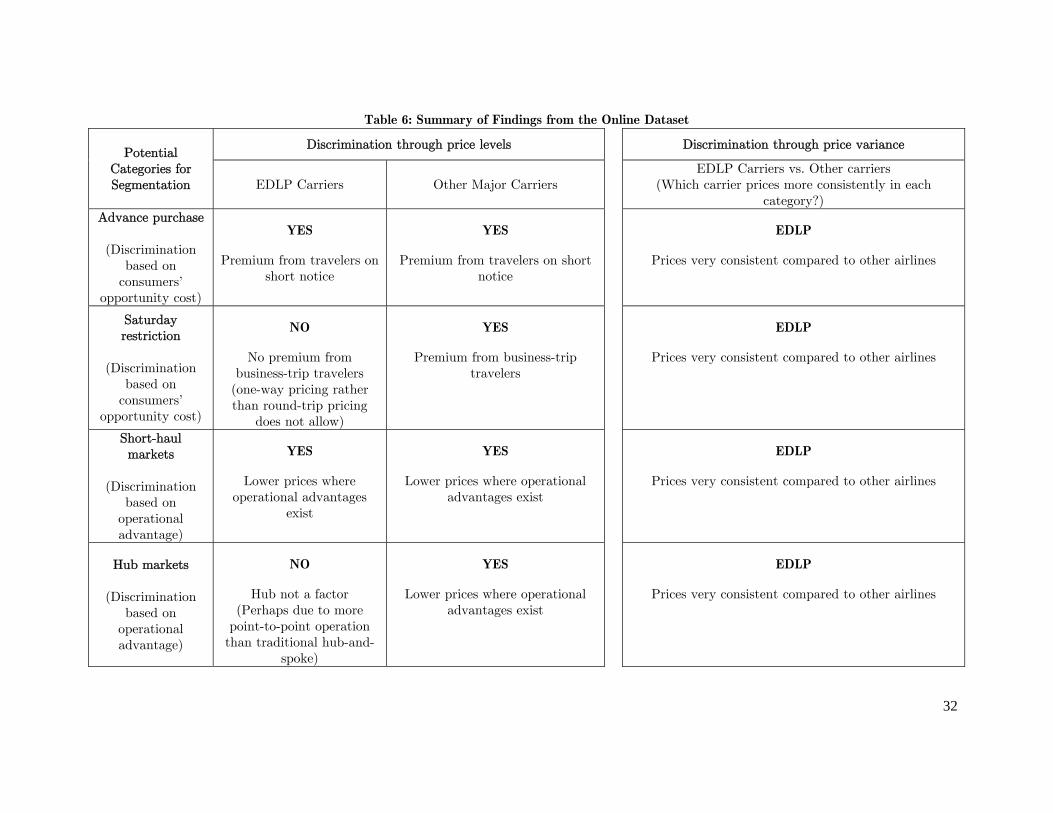
variables on EDLP price variance as detailed in the previous subsection. A rather distinct
picture emerges as we compare the price variability dimension between EDLP and major
carriers: EDLP carriers appear to pursue a strategy of rigorously controlling variation in ticket
prices. We summarize our findings in Table 6.
32
Table 6: Summary of Findings from the Online Dataset
Potential Categories for Segmentation
Discrimination through price levels Discrimination through price variance
EDLP Carriers Other Major Carriers EDLP Carriers vs. Other carriers
(Which carrier prices more consistently in each category?)
Advance purchase
(Discrimination based on
consumers’ opportunity cost)
YES
Premium from travelers on short notice
YES
Premium from travelers on short notice
EDLP
Prices very consistent compared to other airlines
Saturday restriction
(Discrimination
based on consumers’
opportunity cost)
NO
No premium from business-trip travelers
(one-way pricing rather than round-trip pricing
does not allow)
YES
Premium from business-trip travelers
EDLP
Prices very consistent compared to other airlines
Short-haul markets
(Discrimination
based on operational advantage)
YES
Lower prices where operational advantages
exist
YES
Lower prices where operational advantages exist
EDLP
Prices very consistent compared to other airlines
Hub markets
(Discrimination based on
operational advantage)
NO
Hub not a factor (Perhaps due to more
point-to-point operation than traditional hub-and-
spoke)
YES
Lower prices where operational advantages exist
EDLP
Prices very consistent compared to other airlines
33
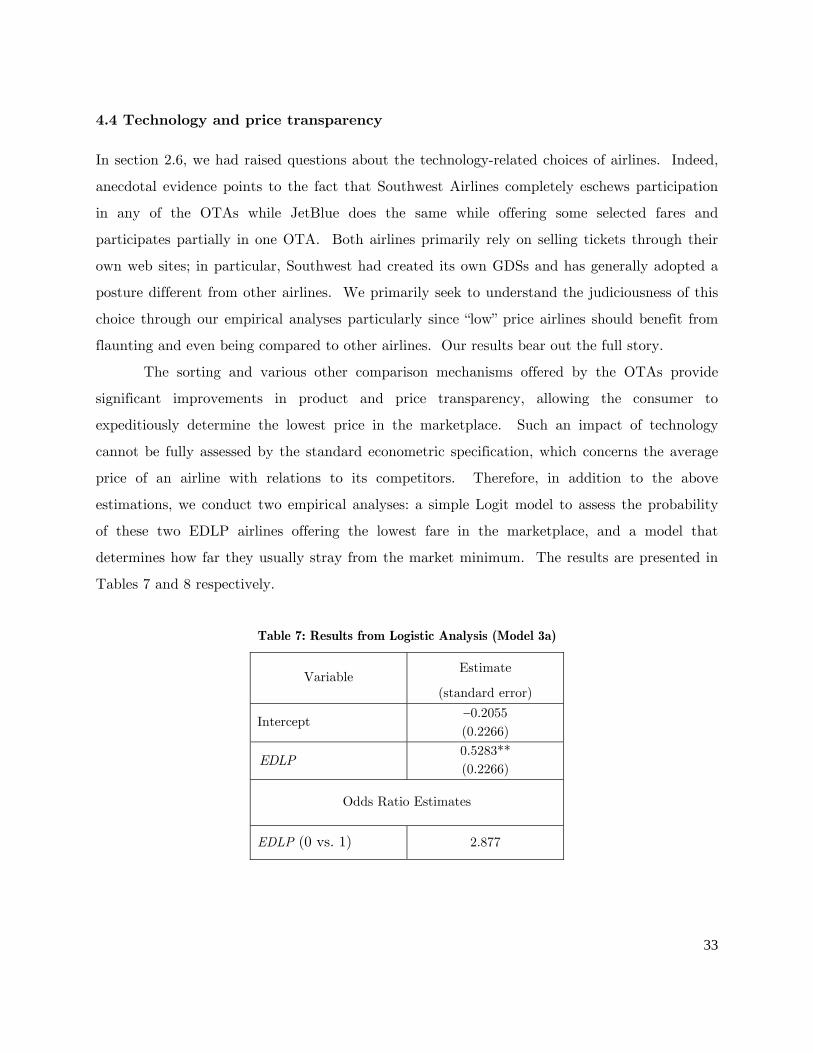
4.4 Technology and price transparency
In section 2.6, we had raised questions about the technology-related choices of airlines. Indeed,
anecdotal evidence points to the fact that Southwest Airlines completely eschews participation
in any of the OTAs while JetBlue does the same while offering some selected fares and
participates partially in one OTA. Both airlines primarily rely on selling tickets through their
own web sites; in particular, Southwest had created its own GDSs and has generally adopted a
posture different from other airlines. We primarily seek to understand the judiciousness of this
choice through our empirical analyses particularly since “low” price airlines should benefit from
flaunting and even being compared to other airlines. Our results bear out the full story.
The sorting and various other comparison mechanisms offered by the OTAs provide
significant improvements in product and price transparency, allowing the consumer to
expeditiously determine the lowest price in the marketplace. Such an impact of technology
cannot be fully assessed by the standard econometric specification, which concerns the average
price of an airline with relations to its competitors. Therefore, in addition to the above
estimations, we conduct two empirical analyses: a simple Logit model to assess the probability
of these two EDLP airlines offering the lowest fare in the marketplace, and a model that
determines how far they usually stray from the market minimum. The results are presented in
Tables 7 and 8 respectively.
Table 7: Results from Logistic Analysis (Model 3a)
Variable Estimate
(standard error)
Intercept −0.2055 (0.2266)
EDLP 0.5283** (0.2266)
Odds Ratio Estimates
EDLP (0 vs. 1) 2.877
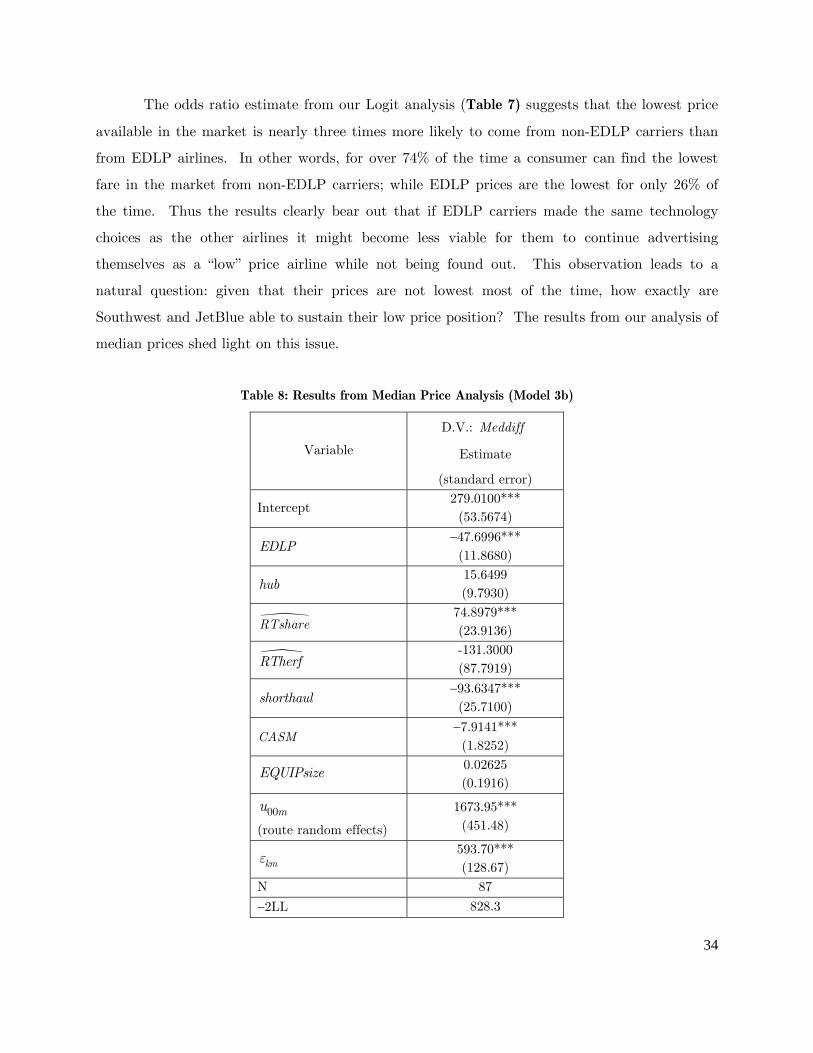
34
The odds ratio estimate from our Logit analysis (Table 7) suggests that the lowest price
available in the market is nearly three times more likely to come from non-EDLP carriers than
from EDLP airlines. In other words, for over 74% of the time a consumer can find the lowest
fare in the market from non-EDLP carriers; while EDLP prices are the lowest for only 26% of
the time. Thus the results clearly bear out that if EDLP carriers made the same technology
choices as the other airlines it might become less viable for them to continue advertising
themselves as a “low” price airline while not being found out. This observation leads to a
natural question: given that their prices are not lowest most of the time, how exactly are
Southwest and JetBlue able to sustain their low price position? The results from our analysis of
median prices shed light on this issue.
Table 8: Results from Median Price Analysis (Model 3b)
Variable
D.V.: Meddiff
Estimate
(standard error)
Intercept 279.0100*** (53.5674)
EDLP −47.6996*** (11.8680)
hub 15.6499 (9.7930)
RTshare 74.8979*** (23.9136)
RTherf -131.3000 (87.7919)
shorthaul −93.6347*** (25.7100)
CASM −7.9141*** (1.8252)
EQUIPsize 0.02625 (0.1916)
00mu
(route random effects)
1673.95*** (451.48)
kmε 593.70*** (128.67)
N 87 −2LL 828.3
35
BIC 835.7
The negative and significant coefficient of EDLP indicates that median fares of EDLP
carriers are closer to lowest available price in the marketplace compared to those of non-EDLP
airlines. In other words, a majority of EDLP tickets that get cleared correspond to those being
priced at the lower end of the market spectrum. Taking the results of the above two analyses
together, we can conclude that while EDLP prices are not necessarily the lowest in the market,
they do tend to be attractive enough to consumers who are price conscious yet do not always
hunt for the best deals.
It is also interesting to note at this point that American Airlines (AA) have made some
very curious moves regarding their participation at OTAs. AA opted out from Orbitz in late
2010, which resulted in Expedia to pull their American offers from their websites. Shortly
afterwards (in April 2011), American filed a lawsuit against Orbitz for “exclusionary and
anticompetitive business practices” while at the same time reaching an agreement with Expedia
to have their offers once again displayed by the OTA. While the industry suspected that AA
withdrew from OTAs primarily to cut distribution cost, and later staged a return because they
realized that the savings are not worth losing out large marketplaces, American seems to be
reformulating their pricing and technology choices. In fact, at the same time AA accused Orbitz
of anticompetitive conduct, they also announced the development of their own distribution
channel, known as the “Direct Connect”. Essentially, American is demanding OTAs to retrieve
flight information directly from this new system rather than through the GDSs. Such moves
perhaps indicate that American realizes both the potential offered by the OTAs and the threats
of transparency associated with such technologies; thus in response, they develop a new channel
that allow for the best of both worlds through selectively listing their most competitive offers on
OTAs while presenting a different set of choices to consumers who visit their own website.
4.5 Robustness check with DB1B data — How do EDLP prices clear?
Generally, most pricing research has dealt with either posted or transacted prices, except a
recent work by Chellappa et al. (2011) that considers both types of prices in their analysis of
price dispersion. While posted prices are appropriate for investigating the pricing behavior of a
firm, transacted prices are useful for drawing inferences with regards to the effectiveness, or
even viability, of its pricing strategy. The BTS database (DB1B) on transacted tickets, albeit

36
less granular, provides such an opportunity. We conduct the same analyses as discussed in the
previous sections on this dataset, and present the corresponding coefficient estimates in Table 9.
Table 9: Analysis on Transacted Tickets
Variable D.V.: Price
Estimate (standard error)
D.V.: Coefficient of Variation
Estimate (standard error)
Intercept 6.0704*** (0.3719)
0.3364*** (0.0716)
EDLP −0.1184 (0.0888)
−0.0894** (0.0471)
( )ln freq −0.0072 (0.0051)
--
hub 0.0023
(0.0206) 0.0759*** (0.0161)
RTshare 0.4225*** (0.0559)
0.1539*** (0.0393)
RTherf −1.0844*** (0.2331)
−0.4014** (0.1282)
shorthaul −0.1144** (0.0499)
0.0509* (0.0270)
( )ln CASM 0.0269 (0.0998) --
( )ln EQUIPsize −0.0122 (0.0527)
--
CASM -- 0.0100*** (0.0026)
EQUIPsize -- 0.0005* (0.0003)
EDLP shorthaul× −0.3270*** (0.0896)
−0.0762 (0.0620)
EDLP hub× 0.0787
(0.0610) −0.0601 (0.0537)
00ku (airline random effects)
0.0056** (0.0028)
--
00mu
(route random effects)
0.0467*** (0.0048)
0.0064*** (0.0013)
0kmu (random interaction effects)
0.0085*** (0.0010) --
ikmε 0.2232*** (0.0013)
--
kmε -- 0.0156*** (0.0012)
N 61655 615 −2LL 84014.5 −582.7

37
BIC 84014.5 −571.5
Though we are not able to make one-to-one comparisons with the estimates derived from
the online dataset (due to the lack of information on timing of ticket purchase on transacted
tickets) our results from the DB1B dataset are fully consistent with those reported earlier.
Specifically, from the first column in Table 9, we can observe that EDLP prices are lower in
short-haul markets than in long-haul markets by 35.69% (Coefficient = −0.4414; standard error
= 0.0968), while not being significantly different in hub versus non-hub markets (Coefficient =
0.0810; standard error = 0.0600). Further, our results also suggest that EDLP airlines do not
vary the consistency of their prices in the various markets. The coefficient estimates presented
in the second column suggest that the variances in EDLP prices are not statistically different in
short-haul versus long-haul markets (Coefficient = −0.0253; standard error = 0.0638) or in hub
versus non-hub markets (Coefficient = 0.0158; standard error = 0.0522). These results are
virtually identical to those derived from our analysis on the online dataset, both in terms of
price level and variability across various market segments.
5. Conclusion and implications for research and practice
Given nearly 50 percent of airline tickets are now sold over the Internet and in view of the fact
that Internet impacts search costs, price and product transparency and price dispersion, IS
research has shown renewed interest in airline pricing in the recent past. A relevant question is if
offline pricing strategies pursued for many decades translate well online and are indeed pursued.
Though much is known about airline pricing in general, as it has been studied extensively since
the deregulation in the 70s, in all extant studies (economics, management and IS) in the airline
industry, two major airlines have been left out (with the exception of Chellappa, et al (2011)).
One of them, Southwest Airlines, is today the second largest carrier (after the merged Delta &
Northwest) and accounts for over 14 percent of the market. In the absence of our study, one
could possibly presume that Southwest and JetBlue follow the basic tenets of airline pricing as
others before them. There are, however, two reasons to reexamine principles of airline pricing
that are of particular interest – first, the airlines advertise the practice of a pricing strategy
hitherto unobserved in the airline industry called everyday low price (EDLP); and second, certain
38
technological choices made by these two airlines appear distinct and different from their
competitors.
In this paper, we test extant theories of price discrimination in the airline industry while
including ticket prices from the two EDLP airlines. While we know from literature that the
major airlines significantly vary their prices based on advance purchase and Saturday night
restrictions, and engage in hub-based pricing, the choices of EDLP airlines in these regards are
not necessarily obvious. There exists a natural tension between varying prices when
opportunities for discrimination and segmentation present themselves and the need to preserve
their consistent low-price image.
Our empirical findings reveal a number of interesting aspects of airline pricing as
observed today in both their online and offline offerings through both their own Web sites and
through OTAs. Consistent with a recent literature on market transparency in airline prices
(Granados, Gupta et al. 2006) our research confirms that many elements of market segmentation
and price discrimination are quite alive in the pricing strategies of all non-EDLP carriers. We
continue to observe a significant variance in the range of prices they offered, and that they
discriminate against consumers with higher opportunity costs and business travelers who would
not like to be subjected to Saturday-night stays. Furthermore, they also vary their prices with
hub-operations. On the other hand, the EDLP airlines exhibit remarkable consistency in prices –
almost impervious to any changing market/consumer conditions. While opportunity costs of the
travelers appear too high a factor to pass over, the EDLP airlines generally do not vary their
prices with other factors. Though, with cost-based advantages of short-haul flights, they do
undercut their competition with significantly lower prices in these segments. Thus our research
demonstrates that alternative pricing strategies that are different and distinct from conventional
wisdom in this sector are indeed being practiced.
What is interesting and relevant to IS researchers, however, is the fact that successful
practice of these strategies requires judicious choices in accompanying technologies. Little has
been written about Southwest Airlines’ (one that has been in operation since the seventies)
choice of developing its own home-grown reservations systems in lieu of full-fledged
participation in a platform called Computerized Reservation Systems (CRSs, now called Global
Distribution Systems, GDSs and adopted by all other airlines). These CRSs provide the

39
fundamental platform for ticket creation and sales that are accessible by both physical and now
online travel agents. In addition to providing simple automation advantages (Banker and
Johnston 1995; Duliba, Kauffman et al. 2001), the CRSs are known to have played a crucial and
strategic role in market transparency of prices (Duliba, Kauffman et al. 2001; Granados,
Kauffman et al. 2008). Further, with regards to offering tickets through online travel agencies
(OTAs) like Orbitz, Expedia, Travelocity, etc., Southwest and JetBlue have again chosen to not
use these intermediary services on the Internet – instead they rely primarily on their own Web-
sites. Simply put, why would these airlines choose to forego the larger marketplace offered by
these OTAs?
Our empirical analysis sheds light on this question. First, we find that independent of
market segments, EDLP airlines are focused on maintaining price consistency; this suggests that
the lowered menu cost and complex price points made possible by the sophisticated CRSs are
not attractive to them. Second, we find that while EDLP tickets are “on an average” lower, at
any given point in time the probability of getting the lowest price ticket in a given market from
an EDLP airline is only 26 percent. That is over 70 out of 100 times a major carrier might offer
a cheaper ticket. This observation needs to be reconciled with the fact the EDLP prices appear
consistent and on an average lower than the market to consumers at large. A more granular
analysis of the distribution of prices, rather than just the average price-point (as a regular
regression will reveal) or the lowest prices in the market (as our Logit analysis reveals), bears the
answer. Our median price analysis suggests that the EDLP price distribution is to the left of the
distribution of market prices, suggesting that it leaves the upper and lower tail of the price
distribution to the others. Thus our work reveals a careful construction of prices and the full
cognizance of the impact of search tools which primarily serve the purpose of revealing the
lower tail to the consumers.
Implications for research and practice
The implication for academics is quite straight forward – it is important to incorporate firms’
overall pricing strategy (not just their product/market-specific prices) in competitive analysis of
prices. Furthermore, we also need to evaluate other tools to conduct these analyses particularly
when firms out a distribution of prices in the market. There are some recent works on functional

40
regressions that might be helpful in this regard, although these have largely been crafted for
time-series data.
From a practice point of view, it is clear that EDLP – which is about the imparting of a
low-price image in the minds of the consumer – is not about having the lowest prices in the
market. Interestingly, it is not also about basket-shopping alone although that is the context in
which it has been empirically studied in the marketing literature. Traditionally, groceries and
retail stores such as Wal-Mart have relied on basket-shopping (multi-unit demand), which
enforces the notion that even if individual products may be on sale elsewhere, a consumer
believes that on an average he is better off shopping at the EDLP store. Note that at its core,
EDLP relies on the fact that the consumer will not be able search for the lowest price for each
product in the basket AND it will be physically costly for him to collect the basket of goods in
this fashion. While the physical concept of a basket does not exist in the airline context, extant
research in marketing (Hoch et al. 1994) does identify Southwest Airlines as an early practitioner
of EDLP. Our research suggests that while physical basket is one manifestation, a temporal,
virtual basket is equally relevant since the core of EDLP success is not the basket, rather the
“unattractiveness” of search (through continuous conditioning of low-prices on the part of the
EDLP firm). Airline passengers usually buy multiple tickets over time, and Southwest and
JetBlue work towards the goal that in the absence of a significant search, their tickets appeal to
this segment.
A comparison of posted and transacted prices suggests that this works, i.e., EDLP firms
seem to set prices that are not the lowest but are geared towards the lower end in the market, and
the tickets that they offer are cleared in the market at these prices. This suggests that there is
indeed a consumer population even online, which is representative of the EDLP firms’ target set.
In other words, the expected cost of search for these consumers is still high compared to buying
from the EDLP airlines. This is indeed why we continue to observe dispersion of prices online.
In attempting to understand the transference of EDLP practice offline to online, one only
needs to observe Wal-Mart’s online strategy. It appears that this EDLP giant is cognizant of the
difficulty of this practice given the wide presence of price-bots and other search tools, and is
conscious of the need to align costs with the front-end practice, a fact that we have noted with
airlines as well – EDLP practice goes hand-in-hand with low equipment variance and low

41
operating costs. Wal-Mart views its online store largely as just another channel. Evidence
suggests that 90 percent of its online customers shop in its physical stores and that over 40
percent of its online sales are “Site to Store”. This latter strategy is primarily geared towards
taking advantage of its logistics capabilities and thus reducing cost. Indeed, Wal-Mart makes it
clear that its online prices can vary from the store prices which themselves vary store to store. In
other words, Wal-Mart considers its online strategy as a channel to divert traffic to its offline
store where it vigorously pursued its EDLP practice. Our research suggests clear possibilities
exist online as well, at least for some product markets.

42
References
Associates, H. 2002. The Internet Travel Industry: What Consumers Should Expect and Need to Know,
and Options for a Better Marketplace. Consumer Reports, available at:
http://www.consumerwebwatch.org/pdfs/internet-travel-industry.pdf.
Banker, R. D. and H. H. Johnston. 1993. An Empirical Study of Cost Drivers in the U.S. Airline Industry.
The Accounting Review 68(3)576-601.
Banker, R. D. and H. H. Johnston. 1995. An Empirical Study of the Business Value of the US Airlines’
Computerized Reservations Systems. Journal of Organizational Computing 5(3)255-275.
Bell, D. R. and J. M. Lattin. 1998. Shopping Behavior and Consumer Preference for Store Price Format:
Why "Large Basket" Shoppers Prefer EDLP. Marketing Science 17(1)66-88.
Berry, S. 1990. Airport Presence as Product Differentiation. The American Economic Review 80(2)394-
399.
Berry, S., M. Carnall and P. T. Spiller. 1997. Airline Hubs: Costs, Markups and the Implications of
Customer Heterogeneity. NBER Working Paper #5561.
Borenstein, S. 1989. Hubs and High Fares: Dominance and Market Power in the U.S. Airline Industry.
The RAND Journal of Economics 20(3)344-365.
Borenstein, S. 1991. The Dominant-Firm Advantage in Multi-Product Industries: Evidence from the U.S.
Airlines. Quarterly Journal of Economics 106(November).
Borenstein, S. and N. L. Rose. 1994. Competition and Price Dispersion in the U.S. Airline Industry. The
Journal of Political Economy 102(4)653-683.
Bryk, A. S. and Y. M. Thum. 1989. The Effects of High School Organization on Dropping Out: An
Exploratory Investigation. American Educational Research Journal 26353-383.
Campbell, C., G. Ray and W. A. Muhanna. 2005. Search and Collusion in Electronic Markets.
Management Science 51(3)563-585.

43
Chellappa, R. K., R. G. Sin and S. Siddarth. 2011. Price-Formats as a Source of Price Dispersion: A
Study of Online and Offline Prices in the Domestic US Airline Markets Information Systems
Research 22(1).
Clemons, E. K., I. Hann and L. M. Hitt. 2002. Price Dispersion and Differentiation in Online Travel: An
Empirical Investigation. Management Science 48(4)534-549.
Dana, J. D. 1998. Advance-Purchase Discounts and Price Discrimination in Competitive Markets. The
Journal of Political Economy 106(2)395-422.
Desiraju, R., H. Nair and P. Chintagunta. 2004. Diffusion of New Pharmaceutical Drugs in Developing
and Developed Nations. International Journal of Research in Marketing 21341-357.
Duliba, K. A., R. J. Kauffman and H. C. Lucas. 2001. Appropriating Value from Computerized
Reservation System Ownership in the Airline Industry. Organization Science 12(6)702-728.
Evans, W. N. and I. N. Kessides. 1994. Living by the "Golden Rule": Multimarket Contact in the U.S.
Airline Industry. The Quarterly Journal of Economics 109(2)341-366.
Gale, I. L. and T. J. Holmes. 1993. Advance-Purchase Discounts and Monopoly Allocation of Capacity.
The American Economic Review 83(1)135-146.
Gimeno, J. and E. Jeong. 2001. Multimarket Contact: Meaning and Measurement at Multiple Levels of
Analysis. Multiunit Organization and Multimarket Strategy. J. A. C. Baum and H. Greve. JAI
Press, London.
Granados, N., A. Gupta and R. J. Kauffman. 2006. The Impact of IT on Market Information and
Transparency: A Unified Theoretical Framework. Journal of the Association for Information
Systems March148-178.
Granados, N., A. Gupta and R. J. Kauffman. 2010. Information Transparency in Business-to-Consumer
Markets: Concepts, Framework, and Research Agenda. Information Systems Research 21(2)207-
226.

44
Granados, N., R. J. Kauffman and B. King. 2008. How Has Electronic Travel Distribution Been
Transformed? A Test of the Theory of Newly Vulnerable Markets. Journal of Management
Information Systems 25(2)73-95.
Griffin, M. A. and D. A. Hofman. 1997. Hierarchical Linear Models in Organizational Research: Cross-
Level Interactions. Reseach Methods Forum 21-3.
Hausman, J. A. and W. E. Taylor. 1981. Panel Data and Unobservable Individual Effects. Econometrica
49(6)1377-1398.
Hayes, K. J. and L. B. Ross. 1998. Is Airline Price Dispersion the Result of Careful Planning or
Competitive Forces? Review of Industrial Organization 13(5)523-541.
Ho, T.-H., C. S. Tang and D. R. Bell. 1998. Rational Shopping Behavior and the Option Value of
Variable Pricing. Management Science 44(December)145-160.
Hoch, S. J., X. Dreze and M. E. Purk. 1994. EDLP, Hi-Lo, and Margin Arithmetic. Journal of Marketing
58(October)16-27.
Lal, R. and R. C. Rao. 1997. Supermarket Competition: The Case of Every Day Low Pricing. Marketing
Science 16(1)60-80.
Mendro, R. L., W. J. Webster, K. L. Bembry and T. H. Orsak. 1995. An Application of Hierarchical
Linear Modeling in Determining School Effectiveness. Mimeo, Annual Meeting of the American
Educational Research Association, San Francisco, CA.
Morrison, S. A. 2001. Actual, Adjacent, and Potential Competition: Estimating the Full Effect of
Southwest Airlines. Journal of Transport Economics and Policy 32239-256.
Neels, K. 2000. Congestion Pricing and the Economic Regulation of Airports. Airports in the 21st
Century: Proceedings of a Conference. J. M. Rakas, G. W. Blomme and G. Gosling
Transportation Research Board, The National Academies. Washington, D.C. 60-66.
Nevo, A. 2001. Measuring Market Power in the Ready-to-eat Cereal Industry. Econometrica 69(2)307-
342.

45
Office of Aviation and International Affairs, A. A. 2003. Fare Structure Experimentation. Domestic
Aviation Competition Issue Brief Number 21, available online:
http://ostpxweb.dot.gov/aviation/domestic-competition/1Q03-AmericaWestpricingstructure.pdf.
Png, I. 2001. Managerial Economics. Wiley-Blackwell.
Raudenbush, S. W. and A. S. Bryk. 1989. Quantitative Models for Estimating Teacher and School
Effectiveness. Multilevel Analysis of Educational Data. R. D. Bock. Academic Press, San Diego,
CA: 205-232.
Shankar, V. and R. N. Bolton. 2004. An Empirical Analysis of Determinants of Retailer Pricing Strategy.
Marketing Science 23(1)28-49.
Stavins, J. 2001. Price Discrimination in the Airline Market: The Effect of Market Concentration. Review
of Economics and Statistics 83(1)200-202.
Venkatesan, R., K. Mehta and R. Bapna. 2006. Understanding the confluence of retailer characteristics,
market characteristics and online pricing strategies. Decision Support Systems 42(3)1759-1775.
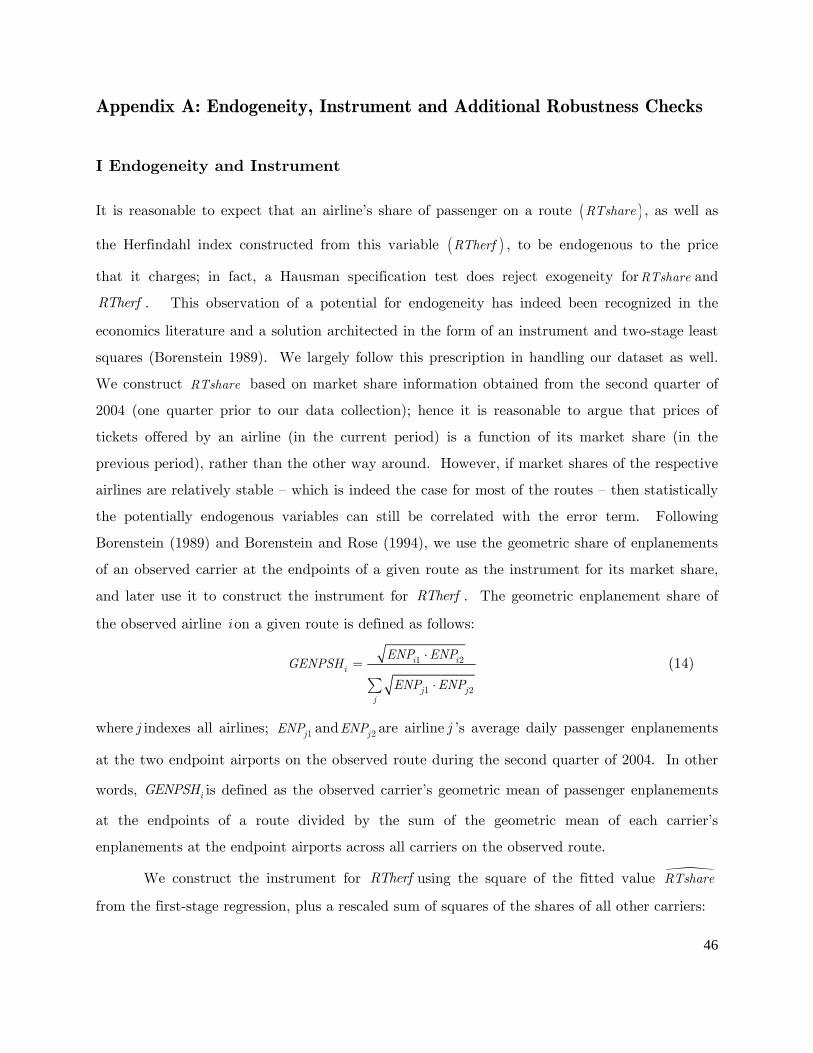
46
Appendix A: Endogeneity, Instrument and Additional Robustness Checks
I Endogeneity and Instrument
It is reasonable to expect that an airline’s share of passenger on a route ( )RTshare , as well as
the Herfindahl index constructed from this variable ( )RTherf , to be endogenous to the price
that it charges; in fact, a Hausman specification test does reject exogeneity forRTshare and
RTherf . This observation of a potential for endogeneity has indeed been recognized in the
economics literature and a solution architected in the form of an instrument and two-stage least
squares (Borenstein 1989). We largely follow this prescription in handling our dataset as well.
We construct RTshare based on market share information obtained from the second quarter of
2004 (one quarter prior to our data collection); hence it is reasonable to argue that prices of
tickets offered by an airline (in the current period) is a function of its market share (in the
previous period), rather than the other way around. However, if market shares of the respective
airlines are relatively stable — which is indeed the case for most of the routes — then statistically
the potentially endogenous variables can still be correlated with the error term. Following
Borenstein (1989) and Borenstein and Rose (1994), we use the geometric share of enplanements
of an observed carrier at the endpoints of a given route as the instrument for its market share,
and later use it to construct the instrument for RTherf . The geometric enplanement share of
the observed airline i on a given route is defined as follows:
1 2
1 2
i ii
j jj
ENP ENPGENPSH
ENP ENP
⋅=
⋅∑ (14)
where j indexes all airlines; 1jENP and 2jENP are airline j ’s average daily passenger enplanements
at the two endpoint airports on the observed route during the second quarter of 2004. In other
words, iGENPSH is defined as the observed carrier’s geometric mean of passenger enplanements
at the endpoints of a route divided by the sum of the geometric mean of each carrier’s
enplanements at the endpoint airports across all carriers on the observed route.
We construct the instrument for RTherf using the square of the fitted value RTshare
from the first-stage regression, plus a rescaled sum of squares of the shares of all other carriers:

47
( )
222
21
1
ii iRTherf RTshare
IRTherf RTshare RTshareRTshare
⎛ ⎞− ⎟⎜= + ⋅ − ⎟⎜ ⎟⎟⎜⎝ ⎠− (15)
where i indexes the observed airline. The rationale behind the second term in IRTherf is that
the concentration of traffic on a route that is not served by the observed airline is exogenous to
the price of the observed airline; for example, Delta’s price on the Boston—LaGuardia Airport
route does not affect the division of passengers between American and United. The rescaling
ensures that the part in a Herfindahl index that is calculated for passengers who do not travel
on the observed carrier remains unchanged. We then use IRTherf as the excluded exogenous
variable in the first-stage regression of RTherf that generates RTherf .
Careful readers may notice that in Model 1 RTshare is correlated not with the error at
the individual ticket level ( )ikmε but instead with the level-2 random interaction effect( )0kmu ; the
reason is that RTshare is defined at the carrier-route level, which is ticket-invariant. Standard
procedures in the instrumental variable approach ignore the level-1-invariant nature of the
latent effect, yielding an estimator that is biased at best and inconsistent at worst. We employ
a method that makes use of the information available from level-1 exogenous variables in
constructing the level-2 instrument based on Hausman and Taylor (1981). The basic idea
behind this approach is that the effects of each level-1 exogenous variable in a level-2 instrument
can be approximated by its mean at the corresponding level; hence the means of exogenous
ticket-varying variables (e.g. 7DD ), along with other ticket-invariant exogenous variables (e.g.
freq ), can be used as instruments for the endogenous ticket-invariant variables. Similar
approaches have been used in other studies of the cereal market (Nevo 2001) and the diffusion
of new pharmaceutical drugs (Desiraju et al. 2004).
II Additional robustness checks
Table A1 presents the coefficient estimates of our fixed effects models on both the “low
price” dimension (column 1) and “everyday” dimension (column 2). Note that while these
estimates cannot be directly compared to those presented in Tables 4 and 5, we can observe
from the airline fixed effects that ticket prices offered by the two EDLP carriers are generally
more consistent, though not necessary lowest in the market, compared to those offered by the
other airlines. Our findings are in line with the results that are presented in the paper.

48
Table A1: Robustness checks with airline and route fixed effects
Estimate (standard error)
Variable Dependent Variable:
Price Dependent Variable:
C.V.
BUS 0.1170*** (0.0015)
−0.0632*** (0.0035)
7DD 0.3039*** (0.0021)
0.0641*** (0.0050)
14DD 0.0799*** (0.0021)
0.0515*** (0.0050)
21DD 0.0045** (0.0021)
0.0081 (0.0050)
( )ln freq −0.0223*** (0.0007)
--
hub −0.0839*** (0.0040)
0.0086 (0.0087)
RTshare 0.1227*** (0.0134)
0.0359 (0.0256)
( )ln EQUIPsize −0.0244** (0.0106)
--
EQUIPsize -- −0.0003 (0.0002)
American 0.1032*** (0.0077)
0.0370** (0.0165)
Alaska 0.0307*** (0.0103)
−0.0034 (0.0205)
Continental 0.0941*** (0.0084)
0.0237 (0.0184)
Delta 0.0954*** (0.0077)
0.0552*** (0.0176)
Frontier† −0.0473*** (0.0158)
0.0719*** (0.0268)
America West† −0.0914*** (0.0140)
−0.0335 (0.0203)
Northwest 0.0523*** (0.0093)
0.0305 (0.0210)
ATA† −0.1458*** (0.0125)
0.0428 (0.0266)
United 0.1521*** (0.0079)
0.0291 (0.0169)
US Airways 0.1711*** (0.0077)
0.0478*** (0.0164)
Southwest†± −0.0828*** (0.0130)
−0.0968*** (0.0255)
JetBlue†± −0.0525*** (0.131)
−0.0485** (0.0210)
†Low-cost carriers ±EDLP carriers

49
Appendix B: A Primer on Airline Classifications
There is an abundance of terms when it comes to classifying U.S. Domestic carriers — airlines are
frequently referred to as legacy carriers, regional carriers, low-cost airlines, etc. While many of
these terms including no-frills, discount, budget, etc., are loosely used in the popular
press/media, there are more concrete origins for some of these terms. We can broadly see three
primary bases for classifications, operating business model based, revenue based and pricing
based. The first two have their origins in the Bureau of Transportation Statistics (BTS)
publications of the U.S. Department of Transportation (DOT), while the third is more recent
(Chellappa et al. 2011).
I. Operating business model-based
As a high fixed-cost industry, initial categorizations are largely based on geographical scope of
operations and the type of underlying operational infrastructure. DOT11 says that there are
“three carrier groupings: network, low cost, and regional. Network carriers use a traditional
hub-and-spoke system for scheduling flights. Low-cost carriers operate under a generally
recognized low-cost business model, which may include a single passenger class of service,
standardized aircraft utilization, limited in-flight services, use of smaller and less expensive
airports, and lower employee wages and benefits. Regional carriers provide service from small
cities and primarily use smaller jets. Regional carriers are also used to support larger network
carrier traffic into and out of smaller airports to the network carriers' hub airports.”
As of 2004, BTS classified the seven airlines Alaska Airlines, American Airlines,
Continental, Delta, Northwest, United, and US Airways as network carriers and the following
seven airlines, AirTran, America West, ATA, Frontier, JetBlue, Southwest, and Spirit as low-
cost carriers. It is important to note that while the general belief is that the low-cost carriers
charge relatively low prices, the term itself has its origin in operating costs. For example, Table
B1 shows the differences in aircraft types, equipment size, and cost per available-seat-mile
11 Available at:
http://www.bts.gov/publications/journal_of_transportation_and_statistics/volume_08_number_01/ht
ml/data_review/index.html

50
(CASM) — all of which are infrastructural elements that differentiate low-cost carriers from
network carriers. Operating and maintaining a small variety of airplanes has been reported as
an important cost-saving measure (Neels 2000). Readers will note that the low-cost carriers
have uniformly low CASM, low variance in aircraft types and plane sizes.
Table B1: Summary Statistics on Selected Operational Details (as of third quarter, 2004)
Airline Name (ID)*
(Number of) Types of Aircraft
Operated12 Equipment Size Load Factor CASM
Mean S.D. Mean S.D. Mean S.D. American (AA) 1.86 1.07 141.98 15.73 0.74 0.08 10.93 Alaska (AS) 1.50 0.55 138.31 5.31 0.78 0.03 10.05 JetBlue† (B6) 1.00 0.00 158.99 3.77 0.83 0.05 6.13
Continental (CO) 4.22 2.35 134.85 11.68 0.78 0.06 11.02
Delta (DL) 2.32 1.66 167.93 13.84 0.65 0.08 13.94 Frontier† (F9) 1.91 0.94 130.31 2.37 0.60 0.08 9.47 AirTran† (FL) 1.05 0.22 117.30 0.38 0.70 0.02 8.62 America West† (HP) 1.20 0.64 139.64 4.59 0.85 0.03 8.46
Spirit† (NK) 1.00 0.00 148.96 0.46 0.80 0.04 8.60
Northwest (NW) 3.46 2.18 130.70 8.45 0.65 0.05 13.91 ATA† (TZ) 2.10 0.82 185.77 5.74 0.73 0.04 7.26 United (UA) 3.54 1.85 138.83 11.27 0.79 0.04 12.25 US Airways (US) 2.70 1.74 126.86 6.25 0.60 0.08 16.13 Southwest† (WN) 1.00 0.00 134.36 3.63 0.66 0.11 7.60
*IATA Airline Designators †Low-cost carriers
II. Revenue-based
This is also a DOT classification and it consists of “three major categories: majors, nationals,
and regionals. Major carriers have annual operating revenues above $1 billion, national carriers
12 Different sub-models or configurations under the same model (e.g. Boeing 737-400 and Boeing 737-500)
are considered as the same type of aircraft.

51
have operating revenues between $100 million and $1 billion, and regional carriers have
operating revenues less than $100 million."
Also, note that in this classification, the “regional category may not include the same
carriers under the revenue size definition and the business model definition,” and the term
commuter airlines have often been used in place of regional airlines. While there were more than
140 such airlines in nineties, the top 50 is said to account for more than 97% of this group’s
revenue13
By this schema, today there are 4 major airlines: American Airlines, Delta and United
being the strongest and Southwest Airlines (previously a national airline), being the new
addition to this category. Also, note that the term “national” here does not refer to any
geographic boundaries.
III. Pricing-based
Literature in marketing first identified Southwest Airlines as practicing the EDLP format of
pricing (Hoch, Dreze et al. 1994). More recently Chellappa, et al., (2011) identified this
heterogeneity in price-format as both an important source of differentiation amongst the US
domestic carriers and a source of dispersion of prices in the market. As of 2004, Southwest and
JetBlue not only actively advertised their practice of Everyday Low Price (EDLP) price-format
(see Exhibits 1 and 2) but also exhibited prices that are distinctly more consistent than all other
airlines, including the so-called low-cost carriers. We can see from Table B2 that the weekly
price-consistency of Southwest and JetBlue to be higher (low value for the weighted Coefficient
of Variance measure) than all carriers and significantly higher than network carriers.
Table B2: Route-adjusted Price Statistics by Airline
Airline Name (ID) Price
Mean Weighted C.V. American (AA) 354.11 0.39 Alaska (AS) 490.50 6.94 JetBlue† (B6) 205.59 0.01 Continental (CO) 383.98 0.42 Delta (DL) 282.39 0.40 Frontier† (F9) 293.92 0.18
13 Please see http://business.highbeam.com/industry-reports/transportation/air-transportation-scheduled

52
AirTran† (FL) 219.80 0.02 America West† (HP) 334.89 0.03 Spirit† (NK) 186.54 0.02 Northwest (NW) 373.78 0.18 ATA† (TZ) 195.05 0.07 United (UA) 343.63 0.63 US Airways (US) 371.55 4.87 Southwest† (WN) 161.51 0.01
The ability to create, manage and change prices (components of economic menu costs)
has been greatly advanced with innovations and improvements in information technology. At
one end, it allows airlines to set prices by executing complex yield/revenue management
algorithms which allows firms to manage complex promotions, discounts and deals (called a
PROMO or HILO strategy in marketing) efficiently. On other hand, those that undertake a
more consistent approach to pricing prefer not be subject to price comparisons easily. These
airlines have employed technology and the Internet to directly reach their clientele typically
eschewing both online and offline travel agents.
Non-EDLP airlines sell their tickets through their own and Online Travel Agent’s
(Orbitz, Expedia, etc.) Web sites, the EDLP carriers sold tickets directly online only through
their own Web site (JetBlue has recently decided to offer some of its tickets through OTAs as
well). Currently over 26 percent of all tickets are purchased online (expected to exceed 41% by
201214) including those through OTAs, however the number for an EDLP carrier like Southwest
is staggering. Southwest’s own Web site (http://www.southwest.com/) accounts for over 75%
of its tickets purchased while an airline like Delta sells less than half this volume online (which
includes its own Web site and OTAs).
Note that more recently AirTran and Frontier also use the language “everyday low fares”
as do some international airlines including Malysian Airlines and United Airlines Canada.
Although, the latter advertises these fares as “Take advantage of our everyday low fares while
they last on united.ca.,” the phrase “while they last” is more consistent with temporal
promotions and somewhat contrarian to EDLP practice. In general caution should be exercised
in the adoption on any airline classification and the terms always have to be placed in context.
14 According to the Airline IT Trends Survey 2009 by SITA. Available at: www.sita.aero/content/airline-
it-trends-survey-2009 Last accessed on June 20, 2010.

53

54
Exhibit 1: Southwest Airlines — Advertising Message and Statement to Shareholders
SOUTHWEST AIRLINES CO. ¤ SIX STORIES OF FREEDOM
“We give People the freedom to keep fares low in every city we serve. These are not merely introductory fares, they are our everyday low fares – and they are low by philosophy, not expediency.”
Gary C. Kelly, CEO
“We, the People of Southwest Airlines, give our customers the freedom to fly. Every Customer is
entitled to three simple rights: Low fares, lots of flights, and the friendliest service in the sky.”
— Elizabeth P. Sartain, Vice President — People
Southwest Airlines stands for freedom and we are committed to providing our
customers something different in the airline industry: everyday low fares and
superior customer Service. That philosophy served us well again in 1998, as
we recorded our 26th consecutive year of profitability and our seventh
consecutive record profit.
Earnings for 1998 were up 36 percent with a net profit margin of 10.4 percent
and return on equity of 19.7 percent. This kind of financial performance is
tops in our industry, as is our Customer Service. Very different for an
airline. But then we are very different.
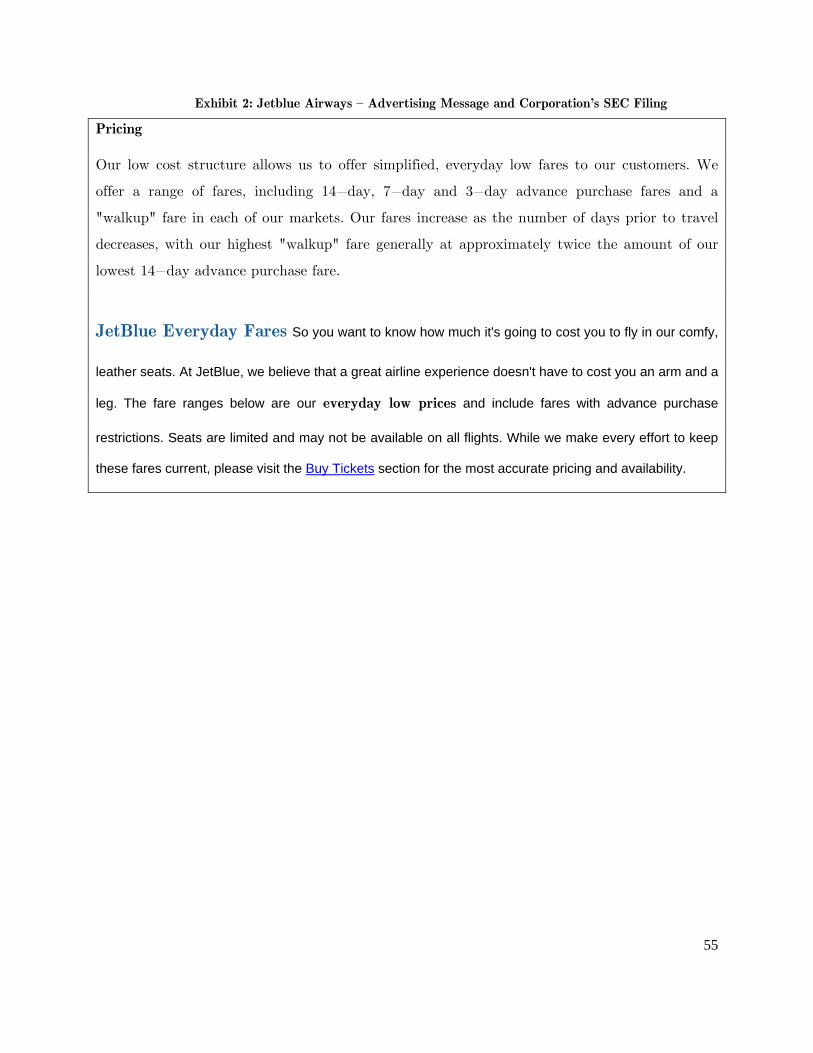
55
Exhibit 2: Jetblue Airways — Advertising Message and Corporation’s SEC Filing
Pricing
Our low cost structure allows us to offer simplified, everyday low fares to our customers. We
offer a range of fares, including 14−day, 7−day and 3−day advance purchase fares and a
"walkup" fare in each of our markets. Our fares increase as the number of days prior to travel
decreases, with our highest "walkup" fare generally at approximately twice the amount of our
lowest 14−day advance purchase fare.
JetBlue Everyday Fares So you want to know how much it's going to cost you to fly in our comfy,
leather seats. At JetBlue, we believe that a great airline experience doesn't have to cost you an arm and a
leg. The fare ranges below are our everyday low prices and include fares with advance purchase
restrictions. Seats are limited and may not be available on all flights. While we make every effort to keep
these fares current, please visit the Buy Tickets section for the most accurate pricing and availability.