Prices, Investment and Efficiency on the Railways · PDF filePrices, Investment and Efficiency...
158
1 TRADE AND INDUSTRY CHAMBER FUND FOR RESEARCH INTO INDUSTRIAL DEVELOPMENT, GROWTH AND EQUITY (FRIDGE) Prices, Investment and Efficiency on the Railways A Sectoral Review of Efficiencies in Administered Pricing in South Africa 20 June 2007 revised March 2008 Genesis Analytics (Pty) Ltd
Transcript of Prices, Investment and Efficiency on the Railways · PDF filePrices, Investment and Efficiency...

1
TRADE AND INDUSTRY CHAMBER
FUND FOR RESEARCH INTO INDUSTRIAL DEVELOPMENT, GROWTH AND EQUITY (FRIDGE)
Prices, Investment and Efficiency on the Railways A Sectoral Review of Efficiencies in Administered Pricing
in South Africa
20 June 2007
revised March 2008
Genesis Analytics (Pty) Ltd

Prices, Investment and Efficiency on the Railways
A Sectoral Review of Efficiencies in Administered Pricing in South Africa
2
Contents
EXECUTIVE SUMMARY................................................................................................. 5 1. INTRODUCTION.................................................................................................... 14 2. PRICING THEORY AND PRACTICE................................................................. 16
2.1. PRICING AND RAIL TECHNICAL CHARACTERISTICS ............................................. 16 2.2. KEY PRICE METHODS USED IN RAIL .................................................................... 22 2.3. PRICING IN STATE OWNED ENTERPRISES ........................................................... 28
3. THE SOUTH AFRICAN RAIL INDUSTRY ........................................................ 30 3.1. HISTORY AND BACKGROUND.............................................................................. 30 3.2. MARKET DESCRIPTION ....................................................................................... 32 3.3. SPOORNET PRICING............................................................................................. 44 3.4. STATUTORY AND POLICY ENVIRONMENT............................................................ 49
4. RAIL REFORM BENCHMARKS ......................................................................... 66 4.1. BENCHMARKING EXERCISE ................................................................................ 66
5. PRICE FORMATION IN BENCHMARK COUNTRIES.................................... 73 5.1. AUSTRALIA ........................................................................................................ 73 5.2. BRAZIL............................................................................................................... 76 5.3. MEXICO.............................................................................................................. 79 5.4. LESSONS FOR SOUTH AFRICA............................................................................. 80
6. FINDINGS AND RECOMMENDATIONS ........................................................... 82 BIBLIOGRAPHY ............................................................................................................. 85 APPENDIX 1 – PRICING THEORY.............................................................................. 91 APPENDIX 2 – COMPARISON COUNTRY SELECTION ........................................ 94 APPENDIX 3 – AUSTRALIA.......................................................................................... 98 APPENDIX 4 – AUSTRALIAN RAIL PRICING REGIMES.................................... 121 APPENDIX 5 – BRAZIL................................................................................................ 133 APPENDIX 6 – MEXICO .............................................................................................. 146 APPENDIX 7 – INDUSTRY FEEDBACK ................................................................... 156

Prices, Investment and Efficiency on the Railways
A Sectoral Review of Efficiencies in Administered Pricing in South Africa
3
Boxes Box 1 – Separation versus integration..................................................................................19 Box 2 – Ramsey efficiency illustrated...................................................................................26 Box 3 – Price limits example .................................................................................................27 Box 4 – Concessioning policy ...............................................................................................57 Box 5 – Economies of scale ..................................................................................................92 Box 6 – Australian rail pricing indicators ......................................................................... 115 Box 7 – Turkish rail restructuring...................................................................................... 118
Tables Table 1 – Spoornet infrastructure potential ..........................................................................7 Table 2 – Variation in ton-km per employee across Spoornet divisions..........................7 Table 4 – South African route density .................................................................................17 Table 5 – Ramsey pricing example .......................................................................................26 Table 6 – Effect of shift from Ramsey to FDC pricing....................................................26 Table 7 – SAC calculation ......................................................................................................27 Table 8 – Land freight transported by mode in 2004........................................................32 Table 9 – Spoornet freight volumes by division.................................................................34 Table 10 – Spoornet infrastructure potential ......................................................................36 Table 11 – Industry composition of GFB tonnage and revenues ...................................36 Table 12 – Variation in ton-km per employee across Spoornet divisions......................38 Table 13 – Average import throughput times, September 2005 - July 2006 .................40 Table 14 – Average freight rates ...........................................................................................44 Table 15 – Spoornet annual tariff increases ........................................................................48 Table 16 – Freight transport regulatory and operational environment ..........................53 Table 17 – Freight key performance indicators..................................................................55 Table 18 – Transnet key performance indicators...............................................................59 Table 19 - Planned components of total revenue increases in the 2006/07 financial
year at Transnet ..............................................................................................................59 Table 20 – Transnet divisional performance ......................................................................62 Table 21 – Benchmarks selected...........................................................................................66 Table 22 – Safety benchmarks...............................................................................................67 Table 23 – Capital efficiency benchmarks...........................................................................68 Table 24 – Price competitiveness benchmarks...................................................................69 Table 25 – Productivity benchmarks....................................................................................70 Table 26 – Commercial “success” benchmarks..................................................................71 Table 27 – Summary of benchmark performance .............................................................72 Table 28 – Length of rail networks in possible comparator countries ...........................94 Table 29 – Key metrics for the comparator countries ......................................................97 Table 30 – Percentage of selected commodities moved by rail: 1960s vs. 2000 ........ 103 Table 31 – Freight operators in Australia ......................................................................... 105 Table 32 – Separation versus integration and ownership of rail in Australia ............. 109 Table 33 – Degrees of commercialisation present in Australia..................................... 110 Table 34 – 2005 indicative prices for selected routes on the ARTC ($AUS) ............. 115 Table 35 – $/ton freight revenue in 1995 for selected commodities in Queensland 115 Table 36 – AUS cents/net ton-km for non-bulk freight, 1965 vs. 2001 in nominal and
real terms ...................................................................................................................... 117 Table 37 – Major players in the Brazilian rail industry (freight).................................... 136

Prices, Investment and Efficiency on the Railways
A Sectoral Review of Efficiencies in Administered Pricing in South Africa
4
Table 38 – Brazil freight railway concessions .................................................................. 140 Table 39 – Major players in the Mexican rail sector (freight)........................................ 148 Table 40 – Mexico freight railway concessions ............................................................... 152
Figures Figure 1 – Rail/road share of freight burden, tons..............................................................8 Figure 2 – Rail and maritime divisions financial performance compared......................10 Figure 3 – Freight costs in the US by mode........................................................................21 Figure 4 – Freight customer needs, weighted by importance ..........................................22 Figure 5 – The circular logic underlying FDC cost distribution models ........................23 Figure 6 – Historical and projected freight volumes .........................................................35 Figure 7 – Road/rail share of freight burden, tons............................................................39 Figure 8 – 2003 Spoornet rand/km container tariffs ........................................................47 Figure 9 – 2004 Spoornet rand/km container tariffs ........................................................47 Figure 10 – Rail and maritime divisions financial performance compared....................63 Figure 11 – Implications of divisional cross-subsidies ......................................................64 Figure 12 – Marginal cost curve with a single efficient production point......................92 Figure 13 – Stable range of least cost production ..............................................................92 Figure 14 – Continually decreasing marginal costs: natural monopoly ..........................92 Figure 15 – Australian rail network ......................................................................................98 Figure 16 – Modal share by freight type (% share of total ton-km of the specific
freight type) .................................................................................................................. 101 Figure 17 – Modal share by freight type (% share of total ton-km of the specific
freight type) .................................................................................................................. 102 Figure 18 – Rail access provision in Australia ................................................................. 108 Figure 19 – Major railway lines in Brazil........................................................................... 133 Figure 20 – Modal shares of the Brazilian freight market, 2000................................... 134 Figure 21 – Modal shares of the Brazilian freight market, 2005................................... 134 Figure 22 – Investments by concessionaires, 1996-2005 ............................................... 143 Figure 23 – Investments by concessionaires and government 1997-2005.................. 144 Figure 24 – Volumes transported by the Brazilian rail sector 1997-2005 ................... 145 Figure 25 – Mexican railway system .................................................................................. 146 Figure 26 – Evolution of cargo volumes transported by rail in Mexico...................... 147 Figure 27 – Evolution of cargo volumes transported by water in Mexico ................. 147 Figure 28 – Evolution of cargo volumes transported by road in Mexico ................... 147 Figure 29 – Share (%) of cargo transported by rail in Mexico ...................................... 148 Figure 30 – Rail modal share .............................................................................................. 151 Figure 31 – Rail labour force 1995-2005 .......................................................................... 153

Prices, Investment and Efficiency on the Railways
A Sectoral Review of Efficiencies in Administered Pricing in South Africa
5
Executive summary
There has been little change to the operational structure of the South African rail industry over the past century. Now, as then, it remains a state-owned monopoly, run as a division of the same entity that houses the South African ports. Despite attempts to introduce greater commercial discipline in the 1980s, the rail industry is still only intermittently profitable and seems to be cross-subsidised via the high returns achieved in Transnet’s ports division.
This research investigates the current approach to pricing of the South African rail sector, its impact on the productivity and competitiveness of the broader economy and benchmarks rail prices to global competitors. Because rail is owned and operated by government, prices in the sector can be regarded as ‘administered’, rather than as determined by market forces. It is thus important to ensure that price structures in rail are consistent with the wider macroeconomic policy goals of government.
Rail pricing
The provision of rail services requires a high fixed investment in track and rolling stock, with proportionally lower operating costs. Once the initial systems investment has been made, a wide range of services can be offered. This kind of cost structure complicates the process of setting prices – price must be sufficient to cover not only operating costs, but also to cover historical investments and/or make provision for future replacement costs. In addition, there is typically no rigorous or justifiable way of assigning a given infrastructure cost to a given service.
Despite these issues, some rail operators still try to set prices in accordance with cost, using fully distributed cost (‘FDC’) methodology. Some method is found of assigning fixed costs to given services and price is set as a mark-up on such cost, regardless of the price sensitivity of consumers. This seems to be the pricing methodology used by Spoornet1 in the recent past.
A central problem with FDC prices is that they do not take consumer demand characteristics into account. Customers who are very price sensitive and customers who could afford to pay more are treated in the same way, with the result that the volume of sales to price-sensitive customers is much lower than it could be, while the value of sales to price-insensitive customers is much lower than it could be.
Ramsey pricing methodology, on the other hand, is designed to maximise the volume of sales. Price-sensitive customers carry less of the burden of overhead costs and vice versa for price insensitive customers. Because the volume sold increases under Ramsey pricing, fixed costs can be spread more widely and the average cost of supplying services decreases.
1 The terms Spoornet and Transnet Freight Rail (‘TFR’) are used interchangeably in this report. Spoornet was rebranded to TFR in late 2007, during the editorial process of this report.

Prices, Investment and Efficiency on the Railways
A Sectoral Review of Efficiencies in Administered Pricing in South Africa
6
Market description
The South African land freight market shipped 329bn ton-km in 2004, with almost two-thirds of this volume shipped by road, rather than rail. The bulk of the rail network is owned by Spoornet, the rail division of Transnet, which has the following six operating divisions:2
GFB Commercial: the general freight business of Spoornet.
CoalLink: a specialist bulk export line, connecting the Mpumalanga coalfields with the Richards Bay coal terminal.
Orex: the second Spoornet specialist bulk export line, covering 861km of track and connecting iron ore operations at Sishen with the Saldanha harbour.
Luxrail: a luxury train operator. Luxrail operates the Blue Train and manages contracts on other luxury trains, such as the Spier and Rovos Rail. Spoornet is considering concessioning these operations.
Shosholoza Meyl: an inter-city budget commuter rail service. Discussions are underway to consolidate this division with the SARCC/Metrorail, which will place it under the supervision of the Department of Transport.
Spoornet International Joint Ventures: the division provides consulting services and operating stock to third parties and operates in twelve countries in Africa.
The Spoornet annual report does not itemise the profitability of each section of the rail freight business. However, commentators suggest that the Orex and CoalLink lines, which account for 48.8% of freight volume by ton-km, are highly profitable, even though they contribute only 31% of total Spoornet revenue. In contrast, the GFB business is suspected to only be profitable on the Durban-Gauteng line.3 In 2000, then Spoornet chief executive Zandile Jakavula stated that 13 000km of the network contributed half of the maintenance costs, but only 6% of the revenues, while the remaining 7 000km network contributed 94% of revenues at 50% of the cost.4
The ore export lines and the general freight business exhibit very different operational characteristics and thus very different economies of scale. A key operational difference is that the ore lines are heavy haul, running very long, heavy trains. They are also dedicated point-to-point trains – time does not need to be spent building trains and only one kind of wagon is needed on the train. Finally, the ore lines run at
2 Discussion follows the company description on the Transnet website, downloaded 23 November 2006, the Metrorail website, downloaded 23 November, the Transnet access to information manual and the Transnet 2005/06 annual report. 3 Van Holdt 2003, 2. 4 Business Report: “Spoornet must keep freight business on track,” August 23, 2000.

Prices, Investment and Efficiency on the Railways
A Sectoral Review of Efficiencies in Administered Pricing in South Africa
7
close to capacity and thus are able to reap density economies. As shown in Table 1, the Spoornet GFB network includes a large proportion of very light density lines.
Table 1 – Spoornet infrastructure potential
Route km % of total Sishen-Saldanha (Orex) 861 4.3 CoalLink 748 3.7 Core freight network (over 5mgt/year) 6 994 34.6 Viable light density lines 7 020 34.7 Light density lines – non-viable 2 468 12.2 Light density lines with no service 2 147 10.6 Total 20 238
Source: Composite estimate, Department of Transport 2006 and Spoornet 2004 divisional report
For a number of reasons, including wagon customisation, low capacity utilisation rates and the time needed to build trains comprised of a number of small loads, efficiency in GFB is much lower than in the rest of the network. As shown in Table 2, net ton-km per employee in GFB is almost 17 times lower than in Orex and net ton-km per wagon is almost 15 times lower.
Table 2 – Variation in ton-km per employee across Spoornet divisions
Net ton-km per employee
(millions)Net ton-km per wagon
(millions) 2003 2004 2003 2004
Coal export 14.06 13.86 5.80 5.79 Ore export 23.26 24.99 7.19 7.84 GFB 1.53 1.49 0.52 0.53 Spoornet as a whole 3.04 3.06 1.08 1.11
Source: 2004 Spoornet divisional report, 60
The ore export lines ship what Spoornet refers to as ‘rail-friendly’ freight. In fact, the freight moved by the ore lines is so ‘road-unfriendly’ that it would be extremely difficult for road to pose a real inter-modal challenge on these lines. The bulk of inter-modal competition is thus centred on the GFB network.
Data on how the modal share of rail has changed over time is fragmented and scarce, but it seems clear that rail has lost market share to road in recent years. Figure 1 illustrates the modal performance of rail from 1994 to 2003,5 in total tons moved. The share of rail has remained stagnant over the period, while road has shown quite steady growth, resulting in an increased modal share for road.
5 Unfortunately Statistics South Africa discontinued this time series in 2003, so more up to date data is not available.

Prices, Investment and Efficiency on the Railways
A Sectoral Review of Efficiencies in Administered Pricing in South Africa
8
Figure 1 – Rail/road share of freight burden, tons
100
200
300
400
500
600
1994 1995 1996 1997 1998 1999 2000 2001 2002 200364%
66%
68%
70%
72%
74%
Volume transported by the private sector (lhs)Volume transported by Transnet (lhs)Market share of the private sector (rhs)
Million tons Market share
Source: Statistics South Africa, Genesis calculations
Two key reasons why rail does not effectively compete for inter-modal GFB traffic can be identified – rail’s much longer average delivery times and the unpredictability of delivery by rail. For many potential Spoornet customers these issues are critical, as failure to receive critical inputs on time can stop a factory and failure to deliver final products on time can trigger penalty clauses (or demurrage fees from shipping lines, if ships are delayed at port).
International benchmark performance
South African rail performance was evaluated against international market structure and regulatory norms. Three comparison countries were selected, namely Australia, Brazil and Mexico. Performance across twelve performance metrics in five performance areas was then evaluated, with the results as per the summary in
Table 3 below. On most of the metrics, local performance is in line with the comparison group. Three results in particular stand out. The first two, namely high accident mortality rates and very low levels of on-time behaviour, may be caused by similar issues around operational efficiency and the backlog in rail equipment and infrastructure investment. The third significant result is on average price levels, where South African prices do not perform particularly well. Once purchasing power parity adjustments are made, it is clear that South Africa has the least affordable rail freight of the comparison group. When coupled with very low service levels, these price levels may be sufficient to drive significant shifts to other modes of freight transportation. In addition, average price levels may mask issues as regards the relative

Prices, Investment and Efficiency on the Railways
A Sectoral Review of Efficiencies in Administered Pricing in South Africa
9
structure of prices, and thus the inter-model competitiveness of rail freight may be further eroded.
Table 3 – Summary of benchmark performance
Area Benchmarks selected Safety High mortality rates Capital efficiency Upper end of comparison group
Price competitiveness Within the comparison range on a US$ basis, but most expensive on a PPP basis
Productivity Reasonable employee productivity but very poor % on-time behaviour
Commercial success Within the comparison range
Source: Genesis
Low on-time rates seem to reflect wider issues with rail service levels, particularly in the GFB business. Poor service increases the indirect cost of rail to customers and erodes the competitive position of rail as compared to other modes of transport.
The international experience of rail reform contains a number of lessons for South Africa:
All three of the comparison countries have chosen to undertake some form of rail restructuring and for all three of them that restructuring has included private participation in above-track operations. This is perhaps one of the strongest lessons for South Africa – the SOE model in rail, where the state monopolises the provision of services, is largely defunct in the international arena.
Despite the introduction of some competition in their rail sectors, all three countries have also introduced some price regulation. This price regulation has typically taken a form that strongly resembles Ramsey pricing – in Australia and Brazil in particular, the introduction of upper and lower bounds to price conforms to Ramsey principals of keeping within the boundaries of stand-alone cost and variable pricing.
A key driver of the need for price regulation seems to have been the recognition that there is potential for abuse of market power in an unregulated rail sector. Even when care is taken to construct markets that are conducive to price competition (as seen in Mexico), control over crucial parts of the network (such as the Mexico City terminal) can create market power. It is thus important to involve competition authorities in the restructuring process and to provide competitive safeguards, including price regulation, when introducing competitive forces into price setting.
In the comparison countries, there seems to be a slight bias towards vertical integration of track and above-track operations. Even where government keeps ownership of track, use of track seems to be made available on a lease basis, rather than on an access pricing basis. The operator which leases the track, then operates under an access-pricing obligation for third parties. This structure helps to ensure that the externalities of track abuse accrue to its principal user, but that control of track does not simultaneously become a major impediment to the introduction of competition.

Prices, Investment and Efficiency on the Railways
A Sectoral Review of Efficiencies in Administered Pricing in South Africa
10
All three of the comparison countries directly subsidised rail operations in the pre-restructuring period (and in the case of Australia, afterwards as well). None of them made use of cross-subsidies from non-rail operations to rail operations. The cross-subsidisation of rail by ports within the Transnet group is thus not best practice internationally.
South African rail may thus perform similarly to its international peers on a benchmark study, but in terms of regulatory and market structure, the local industry is out of line with best practice. The issue of the cross-subsidy between ports and rail is particularly problematic. As shown in Figure 2 below, Transnet’s maritime division has sustained a profit margin that in both absolute and percentage terms is many times higher than that in its rail division, for many years. The kind of profit margins seen in maritime, which usually fluctuate between 30% and 45% of revenue, would be unusually high in the private sector.
Figure 2 – Rail and maritime divisions financial performance compared
-15%
0%
15%
30%
45%
60%
2006 2005 2004 2003 2002 2001 2000 1999 1998 1997 1996
-1,000
-
1,000
2,000
3,000
4,000Rail profit margins Maritime profit margins
Rail operating profits Maritime operating profit
Rm% of revenue
Source: Transnet financials, Business Day reporting
Such cross-subsidisation has a negative impact on economic efficiency. Firstly, it removes the profit motive as discipline on Spoornet management. Secondly, by increasing ports services prices above optimal levels, it reduces the amount of ports services that will ultimately be supplied, which decreases allocative efficiency.
Ultimately, high prices in ports services act as a form of indirect taxation. Taxes set by the central government are open to public scrutiny, but the Transnet ‘ports levy’ is set at the discretion of Transnet management. It is not necessarily in accordance with wider policy objectives. Sustained economic growth in South Africa is dependent on a

Prices, Investment and Efficiency on the Railways
A Sectoral Review of Efficiencies in Administered Pricing in South Africa
11
number of factors, including export growth, and export growth is itself dependent on the ability of local producers to compete with the efficiency of international firms. A ports levy threatens these underpinnings of macroeconomic growth.
Imported goods account for 27% of producer price inflation6 - as the bulk of South African goods imports travel via ports, a ports levy implies that almost 27% of domestic producer costs are being artificially inflated by the levy. This must have an impact on the efficiency of local industry. Again, most goods exports travel through the ports, so the ports levy will impact on the competitiveness of South African exports on international markets. Many imports are also intermediate or capital goods, used by firms in the productive sector of the economy. Increasing the expense of these goods inflates producer costs in general and may result in under-investment. All of these trends – lower domestic efficiency, higher prices, reduced export competitiveness and reduced investment – are inconsistent with the program of higher growth and employment envisaged by ASGI-SA.
Findings and recommendations
The bulk of the evidence collected during the drafting of this report suggested that Transnet pricing moved away from a consideration of customer demand characteristics, during the early 2000s. The price data that was available to the team was consistent with centralized price-setting procedures, based more rigorously on cost estimates – in other words, a form of fully distributed cost pricing. However, when Transnet began to participate in the research process, their contention was that the form of pricing used by freight rail is Constrained Market Pricing (CMP), which does take customer demand characteristics into account. Given the conflicting evidence, we suggest that it is highly probable that the implementation of CMP is far from universal. Additional attention is needed on freight rail prices, in order to ensure that demand-based (Ramsey) pricing techniques are being adequately implemented.
Within a Ramsey pricing framework, it is not problematic if services produced off the same shared-cost platform do not carry the costs of that platform proportionally. This form of cross-subsidisation is thus not problematic (and indeed, can be efficiency enhancing). However, cross subsidisation from ports to rail within Transnet decreases technical efficiency incentives, increases the cost of importing and exporting and impacts on the ability of the economy to reach ASGI-SA goals. We regard the ‘ports levy’ as, in effect, a poorly designed piece of indirect taxation, which urgently needs to be lifted. If Spoornet requires subsidisation, we recommend that such subsidies flow directly from the budget of the National Treasury and be open to interrogation by the electorate.
Very little has been done to date to fine-tune the market structure of the domestic rail industry. All significant portions of the network are still incorporated in the vertically and horizontally integrated Spoornet structure, with internal restructuring efforts focused instead on improving the performance of Spoornet. However, there is as yet
6 Statistics South Africa.

Prices, Investment and Efficiency on the Railways
A Sectoral Review of Efficiencies in Administered Pricing in South Africa
12
little tangible evidence of an improvement in Spoornet performance – instead, interviews with market participants suggest that rail service quality has in fact decreased over the last few years, while prices have increased sharply. We therefore suggest that structural alternatives should be considered further in the rail market.
An appropriate structure for South African rail must suit the needs of industry and the broader South African economy. It is nevertheless a challenge to determine a clear and consistent set of policy goals. In a study of the Australian rail reform effort, Owens offers a three-step approach to rail reform:7
Identify the objectives of the reform: the key goals of a reform will differ according to the policy priorities identified. For example, the key goal may be to improve total transport efficiency, with rail efficiency being a secondary goal; alternatively, raising revenue from privatisation may be seen as important; or increasing the level of rail service availability. Understanding the end-objective informs how much reform is needed and in which areas.8
Understand the characteristics of the rail network in question: the choice of market structure depends heavily on the technical characteristics and market power of the firms involved. To that end, data on the type of goods transported, the level of inter-modal competition, current cost and profit levels, network complexity, traffic density and inter-network “interfacing” must inform the regulatory decision.9
Decide what type of competition is appropriate given the objectives of the reform and the characteristics of the rail network. For example, if the service offered is a natural monopoly, competition “for the market,” via an auction of franchise or concession rights, may be optimal. Alternatively, if competition is feasible from a technical efficiency perspective, competition “in the market” with several operators can be cost effective. Horizontal or vertical separation may then be optimal.10
A crucial component of the policy process should be the involvement of the competition authorities – rail policy at present does not thoroughly address the competitive nature of the market, which will be crucial if changes to market structure are to be considered (as a properly designed market structure will minimise the scope of anti-competitive action). Finally, if any private sector participation is introduced, regulation of access prices will become necessary and setting up such a regulator properly will require appropriate resourcing and a thorough legal framework.
It should be highlighted, however, that Spoornet has already been detrimentally affected by repeated restructurings and uncertainty. It is particularly difficult to retain
7 Owens 2003, 14. 8 Owens 2003, 14. 9 Owens 2003, 15-16. 10 Owens 2003, 16-17.

Prices, Investment and Efficiency on the Railways
A Sectoral Review of Efficiencies in Administered Pricing in South Africa
13
skilled staff in an atmosphere of impending change and the impact of this on quality of service has been substantial. We would therefore recommend extensive research and planning before moving to any implementation – the potential costs of restructuring are large and there must be a clear understanding of the costs and benefits involved before proceeding.
A key complication of this research process was the paucity of data on the sector. Transnet’s participation in the research process was essentially voluntary – despite early requests for cooperation from several government departments, including the Department of Public Enterprises (acting as the sole shareholder of Transnet), the company delayed cooperation for almost a full year, only participating after a final draft had been circulated. Access to basic information in respect of rail pricing is extremely opaque, and it does not seem that information on the sector is regularly and reliably available, even to government.
Many industries are characterised by information asymmetry – owners and/or regulators struggle to understand a business as thoroughly as does its management team, and thus also struggle to interpret and guide the performance of that management team. Good data is of particular importance if major initiatives are being contemplated. It is thus essential that more data on the operation of the sector be made available to the shareholder and regulator of Transnet at the very least – particular areas of focus should include the relative structure of prices, the basis on which line profitability is calculated, and customer service metrics. A good initial step would be to reintroduce a publicly available annual divisional report for Spoornet, which was discontinued in 2004.
The lack of information available to government, as well as clients and other stakeholders, inhibits the ability to ensure that rail services are run in the public interest and has significantly reduced government’s ability to ensure that Transnet is an effective policy instrument. Transnet’s current pro-active management may seem to make this a less pressing concern, but for long-run success a proper institutional, market and regulatory framework needs to be established for this critical part of the country’s infrastructure.

Prices, Investment and Efficiency on the Railways
A Sectoral Review of Efficiencies in Administered Pricing in South Africa
14
1. Introduction
One of the most durable legacies of the economic policies of twentieth century South Africa is the prevalence of state-owned enterprises (SOEs). In sectors such as water, electricity, rail, harbours, postal services, airways, telecommunications and so forth, a state owned enterprise has historically dominated the market and in many cases still does. Although this nominally gives the state wide-ranging power over the economy, which should be to the advantage of a development-focused economy such as South Africa; in practice there is much cause for concern.
The following report focuses on the rail industry, which is run almost exclusively by the Spoornet11 division of SOE Transnet. Spoornet is widely perceived to be one of the more troubled divisions of Transnet, as illustrated by the following anecdotes:
In 2005, Spoornet customer BHP Billiton claimed that potential South African coal exports of US$250m a year were not materialising, due to Spoornet’s failure to meet its volume targets on the coal export line.12
In 2004, Kumba claimed that delays in upgrading the Sishen-Saldanha iron export line were costing the company potential exports of R3bn annually.13
The South African granite industry estimated that, in 2002, poor service from rail cost it R500m, or almost a quarter of sales.14
This research was commissioned as part of a broader project, analysing the impact of administered pricing sectors on South Africa’s competitiveness and ability to attract direct investment. The terms of reference furthermore require a “focused review of opportunities for productivity enhancement, reducing the costs of certain of these factors and improving the quality of investment opportunities that will be undertaken”. Two companion reports examine the water and ports sectors respectively.
Transnet was not able to provide historical price data to the research team, which reduced the level of pricing detail available. In addition, it should be noted that Transnet’s participation in the research process was essentially voluntary – despite early requests for cooperation from several government departments, including the Department of Public Enterprises (acting as the sole shareholder of Transnet), the company delayed cooperation for almost a full year, only participating after a final draft had been circulated. Access to basic information in respect of rail pricing is extremely opaque, and severely limits the ability of government to ensure that Transnet is an effective policy instrument. The majority of data used in the report was gathered from public sources. Very little primary pricing data is publicly available:
11 The terms Spoornet and Transnet Freight Rail (‘TFR’) are used interchangeably in this report. Spoornet was rebranded to TFR in late 2007, during the editorial process of this report. 12 Business Day: “Spoornet snarl-ups ‘cost $250m a year’”, 2005/04/01. 13 Business Day: “Grand plans,” 2005/03/09. 14 Business Day: “Train to nowhere,” 2003/01/15.

Prices, Investment and Efficiency on the Railways
A Sectoral Review of Efficiencies in Administered Pricing in South Africa
15
attempts were made to obtain price data from the Spoornet client base, but individual confidentiality clauses are currently standard practice in the industry, and thus such data was not forthcoming. Container price data for 2003 and 2004 was supplied indirectly, and the initial source of the data was a logistics supplier. The industry feedback summarized in Appendix 7 is based on interviews with approximately ten Spoornet clients. Although the sample size is small, the average size of the client to Spoornet is substantial – together these clients represent a large proportion of Spoornet revenue, and a very large proportion of Spoornet profit.
Section 2 provides a brief rundown of applicable pricing theory, including a discussion of the technical characteristics of the rail production function, which influence how prices are set. The impact on efficiency of using fully distributed cost pricing methodology (which seems to be the method used in the recent past by Spoornet), versus Ramsey pricing (a form of which Spoornet states they now employ), is discussed. This fairly technical introduction is necessary to frame the pricing arguments which begin to be introduced in section 3, which provides a description of the history, policy and market participants in the South African rail industry.
Section 4 benchmarks South African rail against three international examples of rail reform – in Australia, Brazil and Mexico. Section 5 provides additional detail on how price formation takes place in the international benchmark industries. In order to keep this section at a readable length, much detail on the process of choosing suitable comparators and the historical and institutional background of the rail industry in each country has been relegated to the appendixes. Section 6 concludes and provides recommendations for the local industry going forward.

Prices, Investment and Efficiency on the Railways
A Sectoral Review of Efficiencies in Administered Pricing in South Africa
16
2. Pricing theory and practice
In perfectly competitive markets, price reflects both the level of demand for the product concerned and the cost of supplying it. The price level in these markets fulfils several functions:
It co-ordinates the demands of customers and the constraints under which suppliers operates
It signals changes in demand and supply – for example, by increasing when inputs get more expensive, or decreasing when customer demand drops
It ensures economic efficiency, by helping firms to produce the right amount of the good in question
In markets which are not competitive, however, these functions of pricing are often not realised. Firms find it difficult to discover when demand levels fluctuate and may systematically under- or over-produce the good in question, resulting in sustained decreases in economic efficiency. In some markets, it is possible for authorities to restore efficiency by improving competitive conditions – this is in large part the social welfare argument underlying the introduction of legislation like the Competition Act 1998. In many other markets (particularly those with natural monopoly characteristics), the problem is more deep-seated and market structure can not be sufficiently altered to ensure competition. In such natural monopolies, price must be set in profoundly different manners.
Additional detail on pricing theory is provided in Appendix 1. In this section, we discuss the technical characteristics of the rail production function, which affect pricing decisions, and briefly introduce some of the key pricing concepts which will inform the discussion in the body of the report. We also examine the incentive structure faced by state owned enterprises (SOEs), which can affect price outcomes.
2.1. PRICING AND RAIL TECHNICAL CHARACTERISTICS
When evaluating and benchmarking South African rail pricing performance, it is useful to frame the analysis in terms of the technical characteristics of the rail production function. The cost function faced by an industry plays a big role in the pricing decision, as price is typically determined as some form of mark-up on cost. Different industries display very different cost functions and thus very different price and efficiency dynamics. In rail, three kinds of efficiency dynamics are of importance, namely economies of scale, the density of each line and economies of scope. These are dealt with below.
2.1.1. Economies of scale
In most industries, a firm has to carry some kind of overhead fee, which does not vary in proportion as output varies. The higher the output of the firm is, the more able it is to spread these overhead costs out and thus the lower the per-unit cost of production

Prices, Investment and Efficiency on the Railways
A Sectoral Review of Efficiencies in Administered Pricing in South Africa
17
becomes. The way that overhead costs influence cost per unit as a firm scales up and thus the minimum efficient scale of production, is discussed in Appendix 1.
Some research has been conducted on the minimum efficient rail network size. The results of this research must be interpreted with some caution, as the operating and market conditions of any given rail network will impact on its actual achievable economies of scale. That said, however, it should be noted that research undertaken on Western European rail systems in 1996 suggested that the minimum efficient track network size was 3 000 to 4 000km, while US research conducted in 2000 suggested a minimum network size of around 7 000km.15 Given that the South African rail network has approximately 20 000km of track, this suggests quite strongly that it would be possible to sub-divide this market into more than one network and thus introduce operator competition as a form of price discipline.
2.1.2. Line density
The density of a given rail line relates to the amount of traffic seen on that line. As the investment in a given line is a sunk cost, which does not vary in proportion to the volume carried, it is critical to achieve density economies of production. A literature review of rail pricing provides several guidelines as to density characteristics. A 1981 study,16 for example, suggested that in the US, density economies on a given piece of track, running between two points, were achieved at 15.5m to 24.8m annual gross ton-km,17 depending on the mix of commodities transported. For tracks of very short length, the same study suggested that economies of scale could be achieved at around 1.2m net ton-km.18
Table 4 provides a rough estimate of density on the South African network. As can be seen, the commodity export lines are clearly achieving economies of scale, at very high-density levels. However, the rest of the network is on average operating at a tenth of the density of the export lines. Some parts of the network are thus likely to be well below optimal densities.
Table 4 – South African route density
2004 ton-km
(billion)Route length
(km)Implied density in
ton-km (m) Total SA rail network 127 20 399 6.2 Commodity export lines 62 1 609 38.5 Other 65 18 790 3.5
Source: CSIR 2005, 17; Spoornet annual divisional report 2004; Genesis calculations
15 Preston (1996); Preston (2001); and Bitzan (2000); as quoted in Pittman 2002, 17. 16 Levin 1981, quoted in Kessides & Willig 1995, 39. 17 A ton-kilometre is “the movement of one ton, over a distance of one kilometre,” and is typically used as a key base measure of rail freight efficiency (see: http://www.irtcanada.net/en_Terms.htm). 18 Kessides & Willig 1995, 40.

Prices, Investment and Efficiency on the Railways
A Sectoral Review of Efficiencies in Administered Pricing in South Africa
18
These results are supported by the conclusions of the Moving South Africa policy document, which suggested that:
While the bulk export lines operate at world-class standard costs with very high densities, the general freight network operates at substantially lower densities... While some core lines achieve density close to the bulk lines, even the highest volume branch line operates at only 6 gross ton-kilometres per kilometre.
2.1.3. Economies of scope
Economies of scope occur when it is more efficient to conduct a group of activities together than it is to do them apart. For example, a gold mine in which the ore is laced with uranium may find it most efficient to extract the uranium at the same time as the gold, rather than on-selling their tailings to a uranium producer. Alternatively, a manufacturer of sedan cars and a manufacturer of sports cars may find it more efficient to combine their activities than to produce separately.19
In the rail industry, a key economy of scope argument centres on whether or not to maintain vertical integration – in other words, will separating ownership of track for operation of rail services result in a significant deterioration of efficiency? Vertical separation is successfully used in other network industries. For example, in telecommunications the owner of the last mile of connectivity is often required to provide access to third parties on request. However, there are reasons to believe that rail does not have the type of technical characteristics that allow effective vertical separation. Most crucially, the rail car can damage the track and the track can damage the rail car if either the operator or the infrastructure owner chooses to under-invest in maintenance. As noted by one industry observer, “the point where steel wheel meets steel rail is about the size of a dime, but bad profiles on one or both can lead to millions of dollars worth of problems for railroad car and maintenance-of-way people.”20 Without vertical integration, neither the infrastructure owner nor the operator will realise the full benefit of their maintenance investment and both will have incentives to under-invest. There is some empirical evidence to support this argument. A key study based on US rail systems suggested that, “there would be a 20-40 percent loss of technical efficiency if railroad freight operations were separated from infrastructure”.21 The same source suggests that horizontal separation (into bulk and general freight operations) would result in an additional 70% decrease in operational efficiency.
19 Economies of scope exist when the production function of two or more activities display the quality of sub-additivity. As defined by Baumol (1977), sub-additivity exists “when the provision of services by a single firm is more efficient (in terms of a lower unit cost) than the same production carried out by two or more companies” (Campos & Cantos 1999, 4). 20 “Where Steel Meets Steel,” Railway Age, May 2002. Quoted in Pittman 2004, 5. 21 Ivaldi & McCullough 2004, 16.

Prices, Investment and Efficiency on the Railways
A Sectoral Review of Efficiencies in Administered Pricing in South Africa
19
Box 1 – Separation versus integration
A key market structure decision in rail is whether or not to separate or integrate the structural elements of a railway network into “discrete legal entities”, separated either vertically or horizontally.22 This decision often has major implications for both economic and technical efficiency.
In a vertically integrated rail system, the same entity runs both “above track” (the actual running of trains and selling freight and/or passenger services) and “below track” operations (track infrastructure – managing the rail tracks, signals, terminals and railyards, and selling access to train operators).23 Spoornet at present comprises such a vertically integrated enterprise. Typically, vertical separation is undertaken to allow competition on above track operations, while below track operations are run on a utility basis. The goal is thus to improve the price and quality of service through such increased competition, with potential benefits in terms of both allocative and technical efficiency.
However, vertical separation can result in a misalignment of the maintenance and investment incentives of operators and track managers. A central problem is the fact that the benefits of track maintenance expenditure often accrue to operators, and vice versa for rolling stock maintenance expenditure.24 Under vertical separation, the party which spends on maintenance is thus not the party that accrues the benefit of maintenance, which can result in systematic under-expenditure. In effect, therefore, vertical separation can lead to reduced technical efficiency outcomes.
Two types of horizontal separation are possible. The services offered on a railway can be split into different product classes (for example, a freight service and a passenger service),25 or geographical separation can be achieved. A railway network could be divided up horizontally by creating separate businesses for interstate lines, regional lines, urban lines and/or specialised lines (such as a source-to-port mining or sugar railways). Again, the goal of horizontal separation is to introduce competition, in order to improve technical and allocative efficiency outcomes. The success of such separation in achieving increased competition thus often depends to a large extent on the geographical characteristics of a region, and the extent to which operators in different areas can compete for the same freight or passenger customers. In either case—product or geography—the goal of horizontal separation is to “improve the effectiveness of policies and regulatory regimes relating to different rail businesses”.26
There are two opportunities for competition in horizontal separation. The first is competition for the market during the concessioning phase; the second competition in the market post-concessioning. The success of competition in the market can be limited if important parts of the network are shared and facilities leasing arrangements are inadequate. In some cases, horizontal separation may also reduce the ability of the concessionaire to realise scale economies, if the size of concessions is too small.27 However, if geographic conditions are appropriate, horizontal separation does have the potential to improve technical and allocative efficiency outcomes.
2.1.4. Modal competition
Another key aspect of the technical characteristics of rail is its ability to compete with other modes of transport. In South Africa, inter-modal competition in freight is principally between road and rail, the country has no navigable waterways and the
22 Owens 2003, 43. 23 Owens 2003, 43. 24 Pittman 2004, 5. 25 Owens 2003, 17. 26 Owens 2003, 17. 27 Owens 2003, 17.

Prices, Investment and Efficiency on the Railways
A Sectoral Review of Efficiencies in Administered Pricing in South Africa
20
bulk of freight either originates inland or has an inland destination (which rules out competition from coastal shipping). The choice between road and rail is influenced by a number of functional characteristics. Key competitive differences28 between the two modes include the following:
Distance: rail is typically cheaper than trucking over longer distances. The literature suggests that below 200km,29 truck is cheaper, and above 800km, rail is cheaper30 – there is thus some ambiguity as to exactly where the tipping point is.
Speed: trucking is faster than rail. Internationally, a range of 60-90km per hour is regarded as towards the higher end of what can be achieved by rail.31 In South Africa, freight trains are expected to average 50-60kmph on a trip, with a maximum speed of 80kmph.32 In contrast, trucks on major highways in South Africa face a maximum speed limit of 120kmph and can probably maintain 80-100kmph with relative ease.33
Volume: rail is better suited to transporting high volume cargos. Maximum road vehicle weight was prescribed in 1999 by the Department of Transport at 56 tons, whereas trains consist of multiple rail wagons, each operating at axle load capacities of 16-22 tons in the GFB business and 30 tons on the mineral export lines.34
Flexibility: rail typically operates according to a less flexible schedule than road and on a smaller network than road. Road transportation is thus more suited to supplying remote locations, at non-standard times.
Given these functional differences between rail and road, it is generally accepted that rail is the preferred mode for high-volume, low value cargo, which is time-insensitive and needs to be moved over long distances, and vice versa for road. This suggests that the two freight modes should be viewed as imperfect substitutes for each other, which can only partially discipline prices in the other mode. As shown in Figure 3 below,
28 It should be acknowledged that there are also differences in the social benefits of the rail/road modal choice, which include the following: • Pollution: heavy vehicles are estimated to produce eight times more air pollutants than diesel
operated rail (Jorgensen 2005, slide 28). • Noise pollution from road transport has been estimated at 1.5 to 2 times higher than that from rail
(Jorgensen 2005, slide 28; Australian Productivity Commission 2006, 191). • Safety: for transportation of hazardous materials, rail is estimated to be fifty times safer than road,
and rail is also subject to fewer accidents than road freight (Jorgensen 2005, slide 28; Australian Productivity Commission 2006, 184).
• In the South African situation, where the rail network is under-utilised and the road network is subject to congestion, a modal shift to rail would be congestion-reducing.
29 Trasporti e Territorio 2001, quoted in Cazzaniga Francesetti & Foschi 2002, 4. 30 Kwoka & White 1997, 9. 31 Campos & Cantos 1999, 54. 32 Jorgensen 2006, slide 14. 33 South African rail infrastructure is largely on the narrow Cape gauge, which tends to decrease its speed (Department of Transport 2006, 12). 34 However, it should be noted that narrow gauge South African rail systems do not have the same competitive advantage over road that wider gauge rail has, as the narrow Cape gauge makes the carrying capacity of local rail similar to truck hauliers (Department of Transport 2006, 12).

Prices, Investment and Efficiency on the Railways
A Sectoral Review of Efficiencies in Administered Pricing in South Africa
21
prices across the various transport modes do tend to diverge sharply, with truck freight rates in the US around 650% higher by weight than rail carload rates.
Figure 3 – Freight costs in the US by mode
7.5
3
1
0.75
0.5
0 5 10 15 20
Air cargo
Truck
Rail intermodal
Rail carload
Rail unit
Water
Cost per pound in US cents
150Fast, reliable, used for high-value low-volume cargo
Slow, limited reliability. Used for high-volume, low-value cargo with less time sensitivity
Fast and reliable, used for a mix of value/volume combinations. Most competitive on long
Source: CSIR 2005, 11
As shown in Figure 4, the cost of freight is not necessarily the most important driver of freight customer modal choices in South Africa. Reliability and transit time are instead identified as key. Reliability and transit time are likely to be important drivers of indirect cost for customers, as they will tend to affect stock wastage rates and inventory carrying costs. However, it should be noted that the importance of weightings given to the five factors sampled are very close, and a successful transport mode thus probably needs to deliver across a wide range of service characteristics to compete successfully.

Prices, Investment and Efficiency on the Railways
A Sectoral Review of Efficiencies in Administered Pricing in South Africa
22
Figure 4 – Freight customer needs, weighted by importance
78
80
82
84
86
Reliability and transittime
Tracking Staff helpfulness Loss and damage Rates
Importance rating out of 100
Source: Research International, Spoornet and MSA Analysis, quoted in National Department of Transport 1998, section 9
2.2. KEY PRICE METHODS USED IN RAIL
A number of potential pricing methods used in rail are discussed in Appendix 1. The two most important methods used, however, are fully distributed cost pricing (which seems to be the methodology used in the recent past in South Africa, as will be discussed later in the report), and Ramsey pricing (which is the principal influence on international best practice, and a form of which Transnet Freight Rail claims to use at present). These two methods are discussed below.
2.2.1. Fully distributed cost pricing
Fully distributed cost (FDC) prices are determined as some mark-up on the total cost of providing the service in question. Under FDC, therefore, some means must be found of calculating total costs. Although it is typically fairly simple to determine which marginal or operating cost is attributable to which service, overhead costs (which can also be referred to as shared or fixed costs) accrue to the company as a whole, rather than a particular service. FDC requires that a means must be found of distributing these shared costs across services.35 Three ways of distributing shared costs under FDC can be identified, as follows:
35 Kessides & Willig 1995, 7.

Prices, Investment and Efficiency on the Railways
A Sectoral Review of Efficiencies in Administered Pricing in South Africa
23
Attributable cost: shared costs are allocated in the same proportion as the direct costs attributable to each service. A section of the network which contributed 50% of marginal costs will thus also be allocated 50% of shared costs.
Relative output: shared costs are allocated in accordance with how output is generated. High volume sections of the network thus bear a greater proportion of fixed costs.
Gross revenue: shared costs are allocated in accordance with the pattern in which revenues are generated36 (this methodology is thus very close to the relative output methodology).
There are a number of problems with using FDC in practice.37 Much of the problem lies with the essentially arbitrary nature of shared cost allocation – economic theory is not able to provide a rigorous methodology for allocating these costs. The three methods of shared cost allocation proposed above do not resolve this issue. For example, gross revenue allocation is circular in nature – costs are allocated according to revenues, which are partially determined by the price structure, which is determined by how costs are allocated. The attributable cost methodology is also circular – costs are determined in accordance with marginal cost distribution, which is determined by how heavily a particular section of the network is used, which is determined by customer demand for that section, which is partially determined by the pricing on that section, which is determined by the cost allocation methodology.
Figure 5 – The circular logic underlying FDC cost distribution models
Source: Genesis Analytics
Under FDC pricing therefore, prices are ultimately based neither on accurate costing models, nor on customer demand conditions. To a large extent the FDC price must therefore be regarded as divorced from market realities. To the extent that the FDC price is used to guide management decisions on whether to extend or close down
36 Kessides & Willig 1995, 7 37 See for example the discussion in Kessides & Willig 1995, 8
Revenue distribution/
relative outputPrice structure
Cost allocation
Revenue distribution/
relative outputPrice structure
Cost allocation
Marginal cost distribution
Network use pattern
Customer demand pattern
Price structure

Prices, Investment and Efficiency on the Railways
A Sectoral Review of Efficiencies in Administered Pricing in South Africa
24
Ramsey price formula (Equation 1)
services, it will result in biased decisions. For example, a line which covers its marginal/operating costs, but does not cover its fully distributed cost, may appear unprofitable and prompt a management decision to suspend service.
Historical pricing errors may be magnified under FDC. For example, an operator may have a poor historical price regime, which has not allowed it to maximise traffic volumes. In this situation, each service will be carrying more fixed costs than it would under maximum volume conditions. This higher fixed cost per service will result in higher than optimal prices per service, which will tend to systematically reduce volumes (or keep them at their sub-optimal level).
Finally, FDC again does not allow the operator to address the structure of, or fluctuations in, consumer demand. Services which are highly price elastic must carry the same proportion of shared costs as price inelastic services, which will tend to result in systematic over-pricing, and thus under-provision, of price elastic services. FDC is also unable to deal with changes in demand patterns. If demand for a service dropped sharply, for example because of an improvement in the service offering of a major inter-modal competitor, FDC would not provide much leeway to discount the service in order to maintain volumes. Instead, FDC prices will remain largely static and the operator is unable to smooth the effects of the demand shift.
2.2.2. Ramsey pricing
The Ramsey pricing technique is of use in multi-product, high-fixed cost industries, where marginal costs are very low, and a simple MC=P pricing rule will fail to cover costs. Ramsey pricing allows an operator in these conditions to both cover costs and be responsive to demand conditions.
Formally stated, the Ramsey rule suggests that the operator should “raise prices in inverse proportion to demand elasticities”.38 The absolute structure of prices should be set so as to cover all costs and provide some profit, but the relative level of prices for the various services offered will depend on customer demand – where demand is inelastic, the service should bear a disproportionately large proportion of fixed costs, and vice versa if demand is inelastic. Expressed mathematically, the Ramsey pricing rule is as follows:
Where Pi is the price of good i; MCi is its marginal cost; η is its elasticity; and λ is a constant.
Source: Kessides & Willig 1995, 2
38 Viscusi et al 2001, 352.

Prices, Investment and Efficiency on the Railways
A Sectoral Review of Efficiencies in Administered Pricing in South Africa
25
Under Ramsey pricing, services that are highly elastic will attract lower prices than services that are inelastic, even if they have very similar cost structures. Sometimes this creates the impression that customers with inelastic demand are treated unfairly under Ramsey pricing. However, it should be remembered that, because Ramsey pricing allows the operator to maximise output, fixed costs are shared over a wider range of services, which may ultimately benefit all customers. This argument is illustrated in Box 2. Thus, although FDC pricing would result in a greater appearance of ‘fairness’ between customer groups, ultimately it causes major deadweight social losses – high prices in price elastic goods cause a large decrease in quantity demanded, and thus cause a large deadweight loss. The burden of producing revenues should therefore fall disproportionately on inelastic goods, where little change in quantity will occur and thus the deadweight loss is minimised.
Price limits
Although Ramsey pricing will result in maximum efficiency and thus net social welfare, it is commonly accepted that some protection from extremely high prices should be provided to customers with inelastic demand. An accepted way of calculating a maximum price is the stand-alone cost (‘SAC’). The SAC can be defined as the maximum price that a firm could charge, before the customer would switch to a hypothetical competitor39 (this can also be thought of as the price at which it would begin to pay the customer to begin self-providing).
There is likewise a lower price limit which should be enforced in Ramsey pricing, both because prices underneath this limit may constitute anti-competitive predatory pricing and because prices below this limit are unprofitable. The rule is that prices should at least cover marginal costs. If not, each unit sold results in an immediate loss, and profits can be increased by ceasing production.
The SAC and marginal cost should thus comprise the upper and lower limits of price that the operator can impose. Between these limits, the operator should be free to impose any profit-maximising price, in accordance with fluctuations in demand and supply conditions (although social goals may require exit barriers in some services). In addition, on services where the operator experiences substantial competition (for example from inter-modal operators), it may not be necessary to determine SAC, as competitors can be relied upon to constrain monopolistic pricing.
An example of price limits in practice is shown in Box 3.
39 Kessides & Willig 1995, 14-15

Prices, Investment and Efficiency on the Railways
A Sectoral Review of Efficiencies in Administered Pricing in South Africa
26
TTables 5 and 6: Genesis Analytics
Box 2 – Ramsey efficiency illustrated
Table 5 illustrates the kind of pricing structure that would be employed under Ramsey pricing. In the example, three services with identical marginal costs are offered and prices have been set so as to allow the operator to make a 10% profit margin. Service A is price inelastic, Service B has unit elasticity and Service C is price elastic. Accordingly, under Ramsey pricing the price of Service A is much higher than that of Service C. In fact, the price (3.5) of Service C only just covers its marginal cost (3) and fails to cover its FDC cost (which would come to 4.25 if total fixed costs of 30 were distributed equally across the 24 units of service sold). In contrast, inelastic Service A is being sold at a mark-up of 87% on its FDC. Now suppose the operator in this example has a change of management. The new team are concerned about ‘unfairness’ under Ramsey and decide to move to FDC. As shown in Table 6, because the fully distributed cost of each unit is 4.25, and to maintain the 10% profit margin, the new price of each service is 4.68. The price of Service A decreases by 41%, but because demand is inelastic, units sold increase only slightly, from 4 to 5. The price of Service C increases 33.6%, and because Service C is elastic, the volume sold almost halve, from 12 to 6.8. The FDC price regime thus decreases the total volume sold from 24 units to 20 units, which makes fixed cost per unit rise from 1.25 to 1.5. Lower revenues and higher per unit fixed costs push the operator’s profit margin from 10% to 4%. To try and restore profitability, the operator may now re-adjust FDC prices – cost per unit has now risen from 4.25 to 4.5, because of lower volumes sold, and thus the FDC price should rise to 4.95. The further price increase will exacerbate the decrease in volumes, until stability is reached at some much lower volume and revenue point.40
Table 5 – Ramsey pricing example
Service provided Marginal cost Price elasticity Units sold Ramsey price Service A 3 0.6 4 7.95 Service B 3 1 8 4.80 Service C 3 1.3 12 3.50 Fixed costs 30 Total units sold 24 Total cost 102 Total revenue 112 Profit margin (%) 10
Table 6 – Effect of shift from Ramsey to FDC pricing
Service provided Marginal cost Price elasticity Units sold FDC price % change in price41 Service A 3 0.6 5.0 4.68 -41.2 Service B 3 1 8.2 4.68 -2.6 Service C 3 1.3 6.8 4.68 33.6 Fixed costs 30 Total units sold 20 Total cost 89.88 Total revenue 93.31 Profit margin (%) 4
40 In this example, the operator will never reach a 10% net profit margin using a 10% mark-up on FDC – price increases (and thus volume decreases) will eventually start to decrease profits, from a high of around 9%. At this high point, the price charged is around 5.6 and total volume sold is 14 – although the price of Service A is 30% lower, the price of B and C rise by 16% and 60%, and volume drops 41.7%. 41 Price elasticity can be regarded as the proportional change in volume that will be produced by a change in price. Thus for Service A, 60% of the 41% decrease in price will feed through to volume demanded, whereas for Service C, the 33.6% increase in price will result in a 43.7% decrease in volume demanded (0.336 x 1.3 = 0.437).

Prices, Investment and Efficiency on the Railways
A Sectoral Review of Efficiencies in Administered Pricing in South Africa
27
Box 3 – Price limits example
The key component of calculating the SAC is that, under SAC, the fixed costs of the network are born by only one service. Using the example in Table 5, we extrapolate what the SAC would be for Service A in Table 7 below. We start by assuming that if only Service A was offered, the fixed costs associated with the network would decrease slightly, from 30 to 22. At the volumes sold in Table 5, the SAC per unit would be 8.5.42 This should then be regarded as the maximum limit on the price offered by the operator.
As the marginal cost of providing the service is 3, prices should likewise not fall below 3. If this service were regulated, the price limits a regulator would impose on it would be 8.5 and 3.
Table 7 – SAC calculation
Cost/price
Marginal cost 3 Total fixed cost 22 Units sold 4 Implied total cost 34 SAC per unit 8.5
Source: Genesis Analytics
Constrained Market Pricing
Constrained market pricing or CMP is a form of Ramsey pricing sometimes used by rail companies. It was introduced as a method of price regulation in the United States in 1985. The seminal document is Coal Rate Guidelines – Nationwide (1 ICC 2nd 520 (1985)), issued by the Interstate Commerce Commission (‘ICC’, now known as the Surface Transportation Board). Like Ramsey pricing, CMP is a method which relies on knowledge of customer demand characteristics to allocate shared costs. However, CMP explicitly takes into account the difficulties associated with calculating the demand elasticities of shippers. In the words of the ICC:
“As an alternative to Ramsey pricing, we proposed Constrained Market Pricing. Under CMP, the carriers are expected to use the market demand which they observed as the basis for their pricing, but they need not calculate the precise elasticity of demand for every movement. Indeed, where information on demand elasticity is required under the CMP methodology, we will consider qualitative (rather than necessarily quantitative) evidence on the relative demand elasticity of specific movements and/or commodities. We are satisfied that the constraints and incentives should lead to rates approximating Ramsey prices and protect captive coal
42 A regulator may also include a reasonable profit allowance when calculating the SAC – for example, a margin of 10% would take the maximum price to 9.35.

Prices, Investment and Efficiency on the Railways
A Sectoral Review of Efficiencies in Administered Pricing in South Africa
28
shippers from possible carrier abuse of pricing discretion.”
Four constraints are imposed on carriers under the CMP framework, as follows:
Revenue Adequacy Constraint: the railway’s total revenues are required to not exceed its total economic costs (in other words, including the cost of capital)
Management Efficiency Constraint: costs which are caused by management inefficiency must be excluded from the revenue adequacy constraint
Stand-Alone Cost Constraint: as discussed in section 2.2.2 above Phasing Constraint: an obligation to phase in price changes if such phasing is
in the public interest.
2.3. PRICING IN STATE OWNED ENTERPRISES
South African freight rail services are operated as a state-owned institution, with close to a market monopoly. This institutional framework was historically extremely widespread, but has been eroded by privatisation initiatives in many countries. SOEs are often kept under state control explicitly because it is felt that they are a useful instrument to meet the social welfare objectives of the state. Instead of running through time-consuming bureaucratic procedures, the state can simply direct the managers of the enterprise it owns to roll out the service or make the investment that is desired.
In practice, however, meeting such social welfare objectives may impose a very onerous burden on the SOE and the economy as a whole. The very lack of procedural checks and balances, which makes SOEs such an attractive instrument of policy, is part of the problem. Unreasonable demands may be made of the SOE, which then has little recourse to defend itself. As policy changes, the SOE may find itself subject to rapidly changing demands, which impose considerable commercial burdens.
Ultimately, the money to finance such initiatives must be found somewhere – the SOE may thus be forced to recover costs in other sections of its operations (and thus raise prices above their efficient level for some customers), or may simply run sustained losses in the hope that government will honour an implicit SOE guarantee. This process is very different from the checks and balances that surround the collection and distribution of taxes. The ‘taxes’ raised by an SOE to finance government programs are never approved by the electorate or the Treasury and may be highly damaging and distortive.
2.3.1. Efficiency
Economic theory distinguishes between allocative and technical efficiency. Both forms of efficiency are likely to be affected when rail is provided by an SOE.
Allocative efficiency has to do with how resources are distributed across an economy. In an allocatively efficient economy, the right kind of things are produced, in the right quantity, and using the right inputs. The allocatively efficient economy

Prices, Investment and Efficiency on the Railways
A Sectoral Review of Efficiencies in Administered Pricing in South Africa
29
resembles a well-run factory – the marketing department carefully monitors what customers want, and the logistics department makes sure that the cheapest inputs are used. The outcome is that the right kind and quantity of things are produced, using the right inputs. An allocatively inefficient economy, on the other hand, resembles a USSR-era supermarket: the consumer has a choice of several different kinds of caviar, but has to queue for bread.
In market economies, price is a critical signal for allocative efficiency, because it will rise sharply if too little of a good is produced, and vice versa if too much is produced. In the SOE environment, the price mechanism is often not affected by demand. There are thus no clear signals as to what the SOE should produce, and over- or under-production is common.
Technical efficiency is a more widely understood concept and is much closer to what most people mean by the term ‘efficiency’. A technically efficient firm is a firm that, for a given cost, produces the maximum possible amount of output. Such a firm uses the most cost-effective technology and deploys it effectively, with minimal wastage.
SOEs are unlikely to lead the market in technical efficiency. Weak managerial incentives at SOEs imply that managers are unlikely to expend the effort to master efficient production techniques, to maintain equipment in top condition, to curb shirking by staff and so forth. In addition, because SOEs tend to under-invest, it is unlikely that sufficient investments will be made in technological improvements. SOEs thus often use equipment that is a few years behind industry best practice.

Prices, Investment and Efficiency on the Railways
A Sectoral Review of Efficiencies in Administered Pricing in South Africa
30
3. The South African rail industry
Price formation processes in any industry are a reflection of the complex interaction of institutional and market structures. This section details the history, current market structure and regulatory characteristics of the South African rail market.
3.1. HISTORY AND BACKGROUND
South African rail originated in the 1850s, with the establishment of private lines in the Cape and Natal.43 By the 1870s, however, these lines had been placed under government control. Private rail lines in the Transvaal, developed in order to exploit the mineral discoveries of the late 1800s, survived into the 1900s, until the second South African war reduced their commercial viability.44 By the establishment of the Union of South Africa in 1910, therefore, all remaining rail lines had already been nationalised into the South African Railways and Harbours (SARH) administration.
In the early years of the Union, the nationalisation of rail seems to have been viewed as necessary for economic development. A South African Railways document from 1947 states:
In new countries like South Africa, railways are necessary to develop vast and thinly peopled areas even before they would pay for the purpose of commerce. Private enterprise naturally hesitates to come forward, and in the few instances where it might be inclined to do so, it would be deterred by the prospects of competition, because the volume of traffic available is too small to be shared between lines. Private lines could only be constructed on a monopolist basis. But in a vast country, entirely devoid of waterways, it would be intolerable to have one private corporation controlling the entire system of communications. In these circumstances the government has itself undertaken the responsibility of building and administering the railways in South Africa.45
In addition to the development needs of the transportation sector, rail was also increasingly used to help meet other social development goals. In particular, from the 1920s onwards a practice of using rail to provide sheltered employment for whites developed, in response to the ‘civilised labour’ concerns and the so-called ‘poor white’ problems of the era.46
The development focus of rail was somewhat diluted in 1981, with the passing of the South African Transport Services Act (Act 65 of 1981). This act required rail to be run on business principles, without providing a clear definition of such business
43 http://www.transnet.co.za/History.aspx, downloaded 23 February 2007. 44 Modubu 2003, 2. 45 Quoted in Modubu 2003, 2. 46 Yudelman 1983, 237.
Prices, Investment and Efficiency on the Railways
A Sectoral Review of Efficiencies in Administered Pricing in South Africa
31
principles. The SARH was transformed into African Transport Services (SATS). While SATS was now intended to at least break even, it was still under an obligation to service the economic and transport needs of the country.47 The inherent tension as regards the simultaneous achievement of both of these goals was not addressed.
In the late 1980s, the commercial viability of rail was further eroded by the promulgation of the Transport Deregulation Act (No. 80 of 1988). Prior to this act, rail had been granted a near-monopoly over freight,48 and thus had not been exposed to the disciplines of inter-modal competition.
Further structural changes to rail were implemented in 1989, when Transnet was formed in terms of the Legal Succession to the South African Transport Services Act, 9 of 1989. This act provided for the commercialisation of government transport assets, which had previously been held by SATS.49 At the time, the assets of SATS were divided between Transnet and the South African Rail Commuter Corporation Limited (“SARCC”). Commuter rail assets were transferred to the SARCC, while freight rail assets remained with Transnet, in its Spoornet division. In addition to owning rail commuter assets, SARCC was also given the responsibility for providing rail commuter services. These services were originally provided by Transnet via the Metrorail concession, which was consolidated back into the SARCC in 2006.
Transnet inherited a number of financial and operational issues upon its establishment in 1989. With rail having being used as sheltered employment for whites since the 1920s, and coupled with increasing unionisation among black workers, wage bills were well out of line with profitability. In 1993, for example, Spoornet had over 80 000 employees. By 1998, it had managed to substantially reduce that number, to just under 48 00050 – as at the 2005 annual report, the labour force had been further reduced to 32 516 employees.
In order to reduce labour disputes during the process of decreasing workforce numbers, voluntary retrenchment packages were used. Ultimately this had the effect of decreasing the number of skilled artisans on the shopfloor of Spoornet.51 This is not unsurprising, given the skills shortages which characterise the South African economy, which tend to increase the mobility of skilled labour. Skills shortages at Spoornet were further complicated by massive reductions in in-house apprenticeships and learnerships.52
Privatisation of Transnet or any of its divisions is not at present on the policy agenda. This represents a change in policy stance since the introduction of the GEAR macroeconomic policy in 1996, which was pro-privatisation.
47 Modubu 2003, 3. 48 The Road Transportation Act of 1977 limited truck carriers to distances of 80km or less. 49 With reference to page 16, Hoffmann v South African Airways (Constitutional Court of South Africa, Case CCT 17/00, 28 September 2000). 50 Transnet Annual Report 1998, 24. 51 Financial Mail “Neglect takes its toll”, March 9 2007. 52 Financial Mail “Neglect takes its toll”, March 9 2007.

Prices, Investment and Efficiency on the Railways
A Sectoral Review of Efficiencies in Administered Pricing in South Africa
32
The South African rail market has been undergoing one or other type of restructuring process for many years now, together with a steady loss of market share to road. There are few indicators that these restructurings have achieved much for the company or the industry to date. In fact, interviews with Spoornet customers suggest that the last three years or so have been particularly bad – Spoornet has aggressively increased prices, while service levels have simultaneously decreased sharply. In the wistful words of one client, the best that can be said is that “hopefully they’ll bottom out soon now.” Below we seek to analyse the source of the current problems.
3.2. MARKET DESCRIPTION
The South African land freight market shipped 329bn ton-km in 2004, as shown in Table 8. Almost two-thirds of this volume is shipped by road, rather than rail. Rail’s market share measured in ton-km is much higher than in tonnage – this is consistent with the international pattern of longer average rail trip lengths. Both the domestic rail and road infrastructures are substantial, with a network size of 23 00053 route kilometres and 362 099 route kilometres respectively.54
Table 8 – Land freight transported by mode in 2004
Tonnage
(ton million) % of total
Ton km (billion)
% of total
Road Metropolitan 595 48.0 45 13.7 Rural 271 21.9 52 15.8 Corridor 171 13.8 105 31.9 Total road 1 037 83.7 202 61.4 Rail Metropolitan 13 1.0 2 0.6 Rural 37 3.0 22 6.7 Corridor 56 4.5 41 12.5 Export lines 96 7.7 62 18.8 Total rail 202 16.3 127 38.6 Total 1 239 329
Source: CSIR 2005, 17
3.2.1. Operational structure
It is estimated that 12% of the rail network is privately owned.55 The remaining 88% is owned by Spoornet, the rail division of Transnet. Spoornet has six operating divisions, as follows:56
53 This number is a composite of the Spoornet network size estimate of 20 238kms (Department of Transport 2006, 65) and the RailRoad Association estimate that privately owned rail networks are 12% of the total (quoted in Department of Transport 2006, 24). 54 World Bank SIMA databases. 55 Thompson J and Jorgensens A. Preserving Existing Transport Infrastructure. Presentation. Restructuring Transport Infrastructure in Southern Africa, 15 March 2005. Quoted in Department of Transport 2006, 24. According to the Department of Transport, which is in turn quoting a Railroad

Prices, Investment and Efficiency on the Railways
A Sectoral Review of Efficiencies in Administered Pricing in South Africa
33
GFB Commercial: the general freight business of Spoornet. CoalLink: a specialist bulk export line, connecting the Mpumalanga coalfields
with the Richards Bay coal terminal. Orex: the second Spoornet specialist bulk export line, covering 861km of track
and connecting iron ore operations at Sishen with the Saldanha harbour. Luxrail: a luxury train operator. Luxrail operates the Blue Train and manages
contracts on other luxury trains, such as the Spier and Rovos Rail. Spoornet is considering concessioning these operations.
Shosholoza Meyl: an inter-city budget commuter rail service. Discussions are underway to consolidate this division with the SARCC/Metrorail, which will place it under the supervision of the Department of Transport.
Spoornet International Joint Ventures: the division provides consulting services and operating stock to third parties, and operates in twelve countries in Africa.
Once Shosholoza Meyl has been transferred to the SARCC and Luxrail has been concessioned, the operating divisions of Spoornet will be purely focused on the freight business. The Spoornet annual report does not break out the profitability of each section of the rail freight business. However, commentators suggest that the Orex and CoalLink lines, which account for 48.8% of freight volume by ton-km, are highly profitable, even though they contribute only 31% of total Spoornet revenue (although admittedly this is profitability as calculated on FDC costing measures). In contrast, the GFB business is suspected to only be profitable on the Durban-Gauteng line.57 In 2000, then Spoornet chief executive Zandile Jakavula stated that 13 000km of the network contributed half of the maintenance costs, but only 6% of the revenues, while the remaining 7 000km network contributed 94% of revenues at 50% of the cost.58
Association source, “there are 24 coal mines with 127 km of track, 17 gold mines with 173 kilometre of line and four platinum mines with 175 kilometres. Eight steel mills have about 150-km. In addition there are pulp mills, cement plants, iron and manganese ore and dolomite mines. Gold and platinum mines generally use their own railways for internal haulage of pre between mine shafts and mills. The Ekurhuleni Metro’s study revealed that there are about 750 private sidings in the metro area, but only 300 of these were serviceable and few were being used.” Department of Transport 2006, 40. 56 Discussion follows the company description on the Transnet website, downloaded 23 November 2006, the Metrorail website, downloaded 23 November, the Transnet access to information manual and the Transnet 2005/06 annual report. 57 Van Holdt 2003, 2. 58 Business Report: “Spoornet must keep freight business on track,” August 23, 2000.

Prices, Investment and Efficiency on the Railways
A Sectoral Review of Efficiencies in Administered Pricing in South Africa
34
Table 9 – Spoornet freight volumes by division
2006 volume by
weight (ton-million)
% of volume
by weight
2004 volume by
ton-km (billions)
% of volume by
ton-km
% of Spoornet revenue
Export coal 68.7 37.7 Export iron ore 29.6 16.3
62 48.8 31
General freight 83.8 46.0 65 51.2 66 Total volumes 182.1 127
Source: Transnet 2005/05 annual report; CSIR 2005, 17; Spoornet 2004 divisional report 46
Figure 6 overleaf illustrates how concentrated volumes on the rail network are. The Orex, CoalLink and Durban/Gauteng GFB lines account for the vast majority of rail freight traffic and are thus among the minority of routes which are able to realise line density economies, as described in section 2.1.2.
On the bulk of the network, Spoornet is both a horizontally and vertically integrated rail service provider, and there are thus little or no competition issues as regards network access. There are some exceptions to this rule of thumb, however. For example, in a few areas, freight and commuter rail use the same line and must coordinate their schedules to avoid conflicts.
3.2.2. The general freight business (GFB)
As shown in Table 9, the GFB service accounts for about half of Spoornet’s volumes and over half of its revenues. However, anecdotal evidence suggests that GFB contributes disproportionately to costs and is thus largely unprofitable. In addition, there is strong anecdotal evidence that GFB is losing market share to trucking. GFB can thus be seen as the ‘problem child’ of Spoornet.

Prices, Investment and Efficiency on the Railways
A Sectoral Review of Efficiencies in Administered Pricing in South Africa
35
Figure 6 – Historical and projected freight volumes
Source: National Freight Logistics Strategy 2005, 26. Adapted by Genesis to include Orex and CoalLink
Saldanha
SishenRichards
Bay
29.6*
68.7*
* 2006 volumes

Prices, Investment and Efficiency on the Railways
A Sectoral Review of Efficiencies in Administered Pricing in South Africa
Description of the General Freight Business
The ore export lines and the general freight business exhibit very different operational characteristics and thus very different economies of scale. A key operational difference is that the ore lines are heavy haul, running very long, heavy trains. They are also dedicated point-to-point trains – time does not need to be spent building trains and only one kind of wagon is needed on the train. Finally, the ore lines run at close to capacity and thus are able to reap density economies. As shown in Table 10, the Spoornet GFB network includes a large proportion of very light density lines.
Table 10 – Spoornet infrastructure potential
Route km % of total Sishen-Saldanha (Orex) 861 4.3 CoalLink 748 3.7 Core freight network (over 5mgt/year) 6 994 34.6 Viable light density lines 7 020 34.7 Light density lines - non-viable 2 468 12.2 Light density lines with no service 2 147 10.6 Total 20 238
Source: Composite estimate, Department of Transport 2006 and Spoornet 2004 divisional report
The high proportion of low-density lines in GFB to some extent reflects the original goals of rail network investment. As discussed in section 3.1, for large portions of the 20th century rail was seen as playing a strongly development-focused role, and thus investments in infrastructure were not always targeted towards economically viable routes.
As at 2004, the GFB business derived almost half of its revenue from the mining industry. Thus, there is some overlap between the operating characteristics of the GFB and ore export lines. The bulk of remaining GFB revenue is taken up by manufacturing – see Table 11.
Table 11 – Industry composition of GFB tonnage and revenues
Tonnage (%) Revenue (%) Mining 64 48 Agriculture 5 8 Manufacturing 31 44
Source: 2004 Spoornet divisional report, 45
Spoornet distinguishes between three kinds of GFB customer, namely megaRAIL, flexiRAIL and accessRAIL. Mega customers have sufficient and regular enough demand to merit their own dedicated trains. Flexi customers can’t provide enough volumes to merit a dedicated train at a regular time interval and are provided with maximum capacity agreements. Access customers provide small and irregular loads and are served on a first-come, first-served basis.59 A mega customer thus knows the
59 As per page 58 of the 2004 Spoornet divisional report.

Prices, Investment and Efficiency on the Railways
A Sectoral Review of Efficiencies in Administered Pricing in South Africa
37
timetable at which its train runs, whereas smaller customers face great uncertainty over the amount of time that Spoornet will take to move their goods. Customers on dedicated lines also typically have a dedicated fleet of specialised wagons available to them, whereas smaller customers may need to wait until a wagon which is suitable for their needs becomes available.
Even if the wagon is not specialised, it remains more difficult to use a rail wagon than a truck for multiple types of loads. The smaller size and easier movement of trucks makes turnaround time on cleaning much quicker – the cleaning of a rail car may in contrast take a number of days to process. These kinds of factors mean that the GFB fleet must be highly specialised, and that GFB wagons are likely to spend a significant amount of time travelling empty (as a truck used to carry chemicals into the interior, for example, cannot be easily processed to allow it to carry grain to harbour – it may be more efficient for it to return empty). For this reason, the GFB fleet is quite large and comprises 71% of the Spoornet locomotive fleet and 89.8% of its wagon fleet.60
Very small customers are increasingly not catered for by rail. For example, Spoornet no longer offers freight consolidation services for small customers. Building trains from a number of small loads is thus now a service that is only offered by external freight service providers, which increases the costs of small shippers and can substantially increase the journey time as well (as the process of building a train is itself time-consuming). Retaining such small GFB clients does not seem to be viewed as a strategic priority for Spoornet, which increasingly distinguishes between rail-friendly clients and rail-unfriendly clients – the distinction between the two types of client seems to hinge largely on lack of timing and volume standardisation, and thus on the amount of handling necessary for the product concerned.
The GFB network operates well below capacity on most lines. For example, the Durban-Gauteng GFB line is the most active part of the GFB network. The line has a capacity of 120 trains per day in each direction, but sees only 23-25 trains per day in each direction.61 In rural areas of the network, without a key ‘rail-friendly’ client, utilisation rates drop even lower. This low level of usage has implications for the ability of GFB to carry its infrastructure costs and achieve density economies.
For the reasons discussed above, therefore, efficiency in GFB is much lower than in the rest of the network. As shown in Table 12, net ton-km per employee in GFB is almost 17 times lower than in Orex and net ton-km per wagon almost 15 times lower.
60 Spoornet 2004 divisional report. Spoornet is apparently in the process of ordering 212 new locomotives for the GFB business (Engineering News, “Rail Recap” December 06/January 2007 issue). 61 Jorgensen 2006, slide 14.

Prices, Investment and Efficiency on the Railways
A Sectoral Review of Efficiencies in Administered Pricing in South Africa
38
Table 12 – Variation in ton-km per employee across Spoornet divisions
Net ton-km per employee
(millions)Net ton-km per wagon
(millions) 2003 2004 2003 2004
Coal export 14.06 13.86 5.80 5.79 Ore export 23.26 24.99 7.19 7.84 GFB 1.53 1.49 0.52 0.53 Spoornet as a whole 3.04 3.06 1.08 1.11
Source: 2004 Spoornet divisional report, 60
Spoornet has stated its intentions to invest R31bn over the five years from 2006 in rail infrastructure and fleet recapitalisation. R10.8bn of this amount has been set aside for upgrading the general freight business, R8.1bn is allocated across the whole network for general maintenance and the remainder is set aside for the coal and iron ore lines.62 Thus, despite comprising 93.3% of Spoornet’s track and using 71% of its locomotives and 89.8% of its wagons, GFB has been allocated only 34.8% of its planned investments. While new locomotives are being bought for the coal and iron ore lines, the focus of attention in GFB seems to be on upgrading existing locomotives.
Inter-modal competition
The ore export lines ship what Spoornet refers to as ‘rail-friendly’ freight. In fact, the freight moved by the ore lines is so ‘road-unfriendly’ that it would be extremely difficult for road to pose a real inter-modal challenge on these lines. The bulk of inter-modal competition is thus centred on the GFB network.
Data on how the modal share of rail has changed over time is fragmented and scarce, but it seems clear that rail has lost market share to road in recent years. Figure 7 illustrates the modal performance of rail from 1994 to 200363 – unfortunately ton-km, which is probably the best indicator of modal share, is not available in a time series, so total tons moved is shown instead. Tons moved by rail has remained stagnant over the period, while road has shown quite steady growth, resulting in an increased modal share for road.
62 Engineering News - Projects in Progress September 2006, 56. 63 Unfortunately Statistics South Africa discontinued this time series in 2003, so more up to date data is not available.
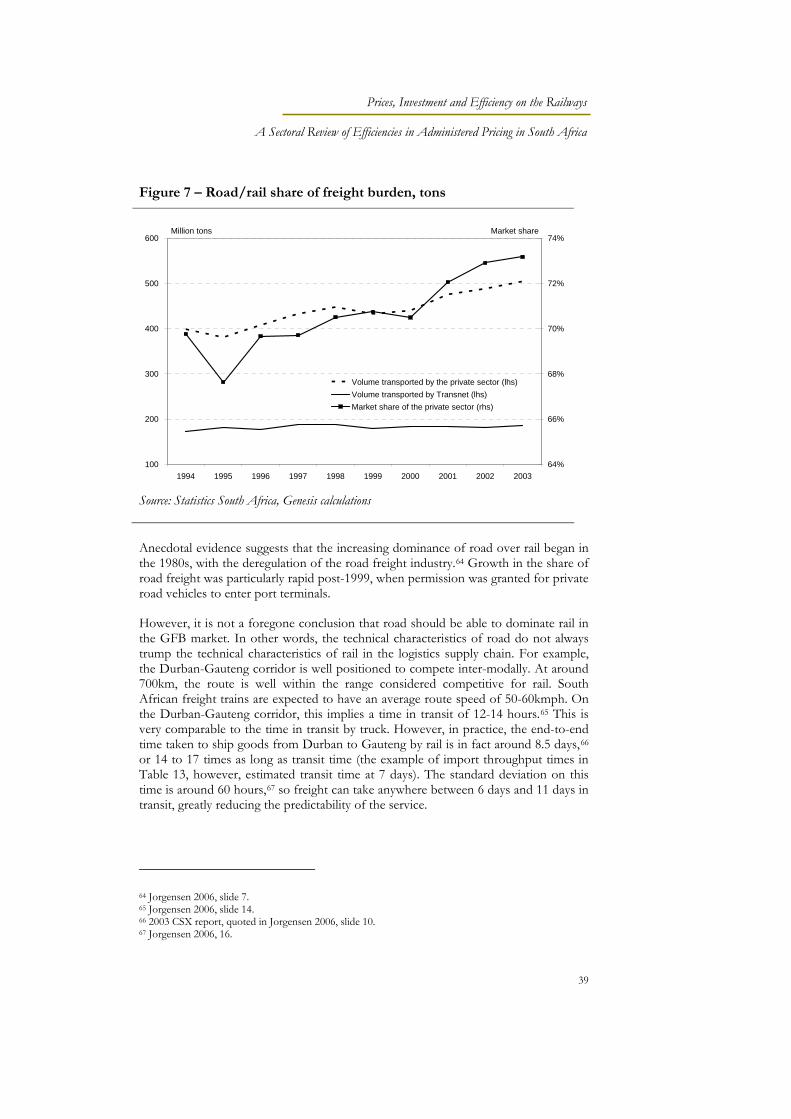
Prices, Investment and Efficiency on the Railways
A Sectoral Review of Efficiencies in Administered Pricing in South Africa
39
Figure 7 – Road/rail share of freight burden, tons
100
200
300
400
500
600
1994 1995 1996 1997 1998 1999 2000 2001 2002 200364%
66%
68%
70%
72%
74%
Volume transported by the private sector (lhs)Volume transported by Transnet (lhs)Market share of the private sector (rhs)
Million tons Market share
Source: Statistics South Africa, Genesis calculations
Anecdotal evidence suggests that the increasing dominance of road over rail began in the 1980s, with the deregulation of the road freight industry.64 Growth in the share of road freight was particularly rapid post-1999, when permission was granted for private road vehicles to enter port terminals.
However, it is not a foregone conclusion that road should be able to dominate rail in the GFB market. In other words, the technical characteristics of road do not always trump the technical characteristics of rail in the logistics supply chain. For example, the Durban-Gauteng corridor is well positioned to compete inter-modally. At around 700km, the route is well within the range considered competitive for rail. South African freight trains are expected to have an average route speed of 50-60kmph. On the Durban-Gauteng corridor, this implies a time in transit of 12-14 hours.65 This is very comparable to the time in transit by truck. However, in practice, the end-to-end time taken to ship goods from Durban to Gauteng by rail is in fact around 8.5 days,66 or 14 to 17 times as long as transit time (the example of import throughput times in Table 13, however, estimated transit time at 7 days). The standard deviation on this time is around 60 hours,67 so freight can take anywhere between 6 days and 11 days in transit, greatly reducing the predictability of the service.
64 Jorgensen 2006, slide 7. 65 Jorgensen 2006, slide 14. 66 2003 CSX report, quoted in Jorgensen 2006, slide 10. 67 Jorgensen 2006, 16.

Prices, Investment and Efficiency on the Railways
A Sectoral Review of Efficiencies in Administered Pricing in South Africa
40
Table 13 – Average import throughput times, September 2005 - July 2006
Hours Days Off vessel to train loaded 36.9 1.5 Train loaded to departure at King's Rest (Durban) 12.4 0.5 Departure Durban to arrival at Kaserne (south JHB) 19.4 0.8 Arrival Kaserne to arrival at City Deep (south JHB) 19.6 0.8 Arrival City Deep to gate ready 22.5 0.9 Gate ready to gate out 57.3 2.4 Total time 168.1 7.0
Standard deviation 63.7 2.7 Time in transit 19.4 0.8 Time in terminal or stationary 148.7 6.2
Source: ImEx, quoted in Jorgensen 2006, slide 16
These are two key reasons why rail fails to effectively compete for inter-modal traffic – the much longer average delivery times and the unpredictability of delivery. For many potential Spoornet customers these issues are critical, as failure to receive critical inputs on time can stop a factory, and failure to deliver final products on time can trigger penalty clauses (or demurrage fees from shipping lines, if ships are delayed at port). A number of operational factors contribute to this poor service, as follows:
No estimated arrival times for small clients: because shippers with small loads must wait for a train to be built, they are unable to determine how long a journey is likely to take.
Poor service ethic: discussions with market participants confirm that it is not unknown for a Spoornet train driver to abandon a train on the line, mid-journey, when their shift comes to an end.68
Theft and damage to loads is also frequent enough to be problematic (particularly when the train is abandoned mid-track at the end of a shift).
No freight consolidation by Spoornet: the ease and speed of freight consolidation services seems to be a key competitive advantage of the trucking industry. Freight consolidation is somewhat different technically in rail, as the process of constructing a train will always take longer than sending a single container by road. But Spoornet has reacted to this difficulty by closing its in-house consolidator, rather than attempting to minimise the competitive gap.
Systems management: even given low volumes, GFB still displays some of the characteristics of a congested system, because systems are not optimally managed. For example, customers may face delays in obtaining the kind of specialised wagon needed for their goods, GFB loads may be delayed by dedicated trains and so forth.
68 Discussions with market participants suggest that the problem is a union agreement, made some years ago, that Spoornet drivers would never be obligated to spend the night away from home. Because many rail freight routes in South Africa are long haul, this means that many trains have to be met mid-trip by an alternate driver. However, with scheduling efficiency levels not being particularly high, it is often difficult to organise the alternate driver, and many union members insist on keeping to the letter of the agreement – if they pass the midway point with no alternate driver appearing, they frequently will desert the train.

Prices, Investment and Efficiency on the Railways
A Sectoral Review of Efficiencies in Administered Pricing in South Africa
41
Poor inter-modal functionality: it is possible to increase the ability of customers to switch between road and rail, during the course of a journey. Thus for example, a truck service could provide load consolidation services and then the load could be transferred to rail via the trailer on flat-car system. Spoornet has failed to understand the customer service advantage that this offers and has under-invested in inter-modal functionality.
These service problems, it should be noted, are for the most part entirely separable from the pricing issues that will be discussed in section 3.3.1.69
Corridor competition
There is some potential for GFB customers, particularly exporters, to switch between rail corridors if service on one corridor becomes unacceptable. However, a number of factors can limit such switching – for example, the exporter may have made an investment in a specialised warehousing facility at one port, which would have to be abandoned, or a given port may not be deep enough to handle the kind of ship needed for the product. However, the largest problem with such corridor switching is that, ultimately, the client will remain locked into the Transnet transport network – even if rail is abandoned for road, Transnet ports must still be used.
The practical issues of this lack of competition can be illustrated by examining the potential that the Gauteng-Maputo corridor has to offer competition to the Gauteng-Durban corridor. Some of the Gauteng-based companies interviewed suggested that they would be prepared to consider switching to Maputo. However, at present, they would have to ship via road, as Spoornet has yet to make the necessary investments in the route to the border. This may reflect more widespread problems at Spoornet as regards the facilitation of timeous investment, but it should be noted that in this case, such investment would not serve the wider strategic interests of the Transnet group.
The current pattern of freight traffic keeps the Durban-Gauteng rail freight corridor at sufficient volumes to be profitable and keeps Durban harbour operating at capacity. If volume shifted to the Maputo corridor, line density economies on the Durban corridor would be adversely affected, the additional rail revenues from Maputo might be insufficient to offset this (given the additional costs also associated with such an increase in the network), and in addition, Transnet would lose port revenues. It would thus be strategically beneficial for Transnet to delay construction on this line.
69 An interview with an agricultural cooperative representative provided an anecdote which is very illustrative of the kind of service issues that can result in a switch to road. The representative recollected that in previous years, Spoornet would send a truck to farms to collect small loads from each farmer and would then consolidate those loads for the farmers. Approximately a decade ago, this service was discontinued and Spoornet began to insist on the use of mini-containers for smaller loads. Almost overnight, farmers in that district began using road instead – local truck operators were happy to collect and consolidate loads and could provide a more rapid and reliable service for a competitive price. Given that the load now had to start off its journey on a truck, it no longer made sense to switch to Spoornet to complete it.

Prices, Investment and Efficiency on the Railways
A Sectoral Review of Efficiencies in Administered Pricing in South Africa
42
3.2.3. The ore export lines
In order to preserve the confidentiality of the ore line customers interviewed, issues on both lines will be discussed together. We begin with a short description of operations on the two ore lines.
Orex
The Orex line runs between the Sishen iron ore mines in the Northern Cape and Saldanha Bay. It services only iron ore exporters, with two companies, namely Kumba and Assmang, dominating volumes carried. As discussed in the section on the GFB above, the ore export lines operate at greater levels of technical efficiency than the GFB lines. Thus, despite carrying 15% of Spoornet freight by tonnage, Orex uses only 3% of the Spoornet locomotive fleet and 3.1% of its wagon fleet.70
The bulk of iron ore mined is for export purposes and customers pay a free-on-board price when they pick the ore up at Saldanha Bay. The cost of railing the ore to Saldanha thus comes directly off the miner’s revenues.
Internationally, the importance of keeping freight costs down in the iron ore business is well recognised. In many cases, rail is regarded as such a critical part of the cost structure that the mine operator chooses to wholly own its rail line. The operational structure of the iron ore division of Rio Tinto, an Australian mining conglomerate, is illustrative. Rio has seven iron ore mining locations internationally, in five countries. Two of its Australian iron ore operations and its Canadian operations have their own rail line. Press coverage suggests that Kumba has indirectly offered to acquire an interest in Orex from Spoornet.71
Orex has, through most of its history, run at full capacity. In fact, capacity constraints on Orex have prompted concern from the companies which use the line, with Assmang, for example, publicly stating in 2002 that Spoornet’s infrastructure difficulties could have a negative impact on earnings.72 Industry commentators and the company itself have also repeatedly speculated that capacity constraints on Orex are limiting Kumba’s ability to cope with export demand.73
Substantial investments are underway to resolve capacity issues. Transnet plans total investment on the line upgrade of R4.4bn, to be completed by 2010. This should take capacity on the line to 47m tons annually.74 In conjunction with the rail project, a R921m upgrade of the Port of Saldanha bulk iron ore handling facility is planned, for
70 2004 Spoornet divisional report, Genesis calculations. 71 Business Day: “Spoornet snarl-ups ‘cost $250m a year’, 2005/04/01. 72 Business Day: “Assmang concerned at Spoornet service,” 2002/09/06. 73 Business Day: “Weaker rand helps lift Kumba’s profit,” 2002/10/29. Business Report: “Railway chaos stunts Kumba growth,” February 20, 2004. 74 Engineering News - Projects in Progress September 2006, 55.

Prices, Investment and Efficiency on the Railways
A Sectoral Review of Efficiencies in Administered Pricing in South Africa
43
completion 2012.75 Substantial investments in rolling stock are planned, with a contract for 38 new locomotives recently concluded.76
CoalLink
Like Orex, CoalLink is a specialised heavy haul line well placed to reap line density economies. Thus, in 2004 it comprised only 8% of the Spoornet locomotive fleet and 7.1% of its wagon fleet, but was responsible for approximately 36% of Spoornet freight by tonnage.77 CoalLink terminates at the Richards Bay Coal Terminal (‘RBCT’) and thus volume constraints at RBCT (which is the world’s largest coal terminal) can affect the rail line and vice versa. Like Orex, CoalLink has experienced ongoing capacity constraints.
Use of the terminal is limited to the owners of the terminal, which at present include Ingwe Collieries (RBCT exporting capacity of 26.96m tons per annum); Anglo Operations Ltd (19.78m tons); Xstrata SA (15.05m tons); Total Coal South Africa (4.09m tons); Sasol Mining (3.60m tons); Kangra Coal (1.65m tons); and Eyesizwe Coal (0.87m tons).78 The terminal owners have historically negotiated as a single entity with Spoornet, which has allowed them to maximise countervailing customer power.
A major increase in rolling stock on the coal line is planned, with 110 new locomotives purchased at a cost of R3.5bn over the five years from 2006. R8bn in total has been set aside for coal line investments.79
Ore line issues
One of the key characteristics of the ore export lines is that they are captive customers of Spoornet. Iron ore and coal are low-value, high-volume commodities that cannot be competitively exported via road. Because these commodities are priced on an international market, it is crucial for them to keep freight costs as low as possible, and the additional cost of road would change the competitive position of the ore exporters fundamentally. This natural monopoly does not however necessarily place Spoornet in an overly strong negotiating position. The ore clients are large and sophisticated companies, operating in strategically important industries, who are quite well-positioned in negotiations.
Both lines have experienced capacity constraints and both have also experienced substantial delays in the investments needed to supply demand. This is despite the fact that the strategic importance of these lines has placed them at the front of the queue for such investments.
Both lines experience high levels of on-time delivery and on one of the lines in particular, there have been sharp improvements in the percentage on time in recent
75 Engineering News - Projects in Progress September 2006, 53. 76 Engineering News - Projects in Progress September 2006, 57. 77 2004 Spoornet divisional report, Genesis calculations. 78 http://www.rbct.co.za/content/shareholders.htm, downloaded 26 February 2007. 79 Engineering News - Projects in Progress September 2006, 56.

Prices, Investment and Efficiency on the Railways
A Sectoral Review of Efficiencies in Administered Pricing in South Africa
44
years. This contrasts with falling service delivery on the GFB network. However, the ore export clients are not entirely in agreement that service delivery on the local network is world-class, as international experience suggests that service improvements are possible.
3.3. SPOORNET PRICING
3.3.1. Pricing policy
The discussion of pricing policy below is based on communications with Transnet representatives, data from public sources, discussions with industry experts and discussions with representatives of the Spoornet client base. The immediate result of pricing policy, namely the average price level of Spoornet freight, is indicated in Table 14 below.
Table 14 – Average freight rates
2007 2004 2003 2002 Average freight income cents per ton-km 19.2 10.3 10.2 8.5 Average total freight cost cents per ton km 8.6 6.9 6.4
Source: Spoornet 2004 divisional report, 11; 2007 Transnet communications (Genesis calculations)
Transnet has stated that it is currently using Constrained Market Pricing (‘CMP’), which it regards as being the most appropriate pricing methodology for freight rail. As discussed in section 2.2.2, CMP is a variant of Ramsey pricing, which relies on qualitative data on demand elasticities rather than econometric estimation techniques. CMP thus allows a company to avoid carrying out complex econometric estimates of customer demand curves, which may be very difficult to get right in a real world of limited data.
However, interviews with market participants suggested that in the recent past, the principal pricing model actually used by Spoornet is the SCAP (Spoornet Costing and Profitability) model. It is not clear that CMP pricing techniques have already been implemented across the business, and thus SCAP is likely to be the system which has had the greatest influence on the current price structure. SCAP seems to be a cost allocation system, close to fully distributed cost pricing as discussed in section 2.2.1.80 The model is fairly complex – discussions with industry experts suggest there are over 20 different ‘legs’ to the model, allowing client managers at Spoornet to take into account technical cost factors (such as the gradient of the line, for example) and assign overhead costs when calculating the SCAP price.
80 This conclusion is supported by van Holdt, when discussing the proposed restructuring initiative in 2000: “Management had drawn up a comprehensive plan for the concessioning or leasing of light density lines to the private sector. Its approach to lines, customers and tariffs appeared to labour to be informed by a rationale of "full cost recovery" and a drive for GFB to achieve financial break-even, ignoring the principle of cross-subsidisation” (van Holdt 2003, 9).

Prices, Investment and Efficiency on the Railways
A Sectoral Review of Efficiencies in Administered Pricing in South Africa
45
The complexity of the model has some problematic consequences. Firstly, client managers may end up quoting different prices on the same types of service, as data errors and differences in interpretation cause the model to generate different results. Secondly, as is often the case in FDC pricing models, there are disputes over the way that overhead costs are assigned.81 Such disputes are a major problem, as SCAP costing may be used to determine whether a given line is profitable or not, and thus whether or not it should be closed down.
However, SCAP is far from the only method that has been used by Spoornet to calculate prices. The various ways in which SCAP is reputedly supplemented or even supplanted at Spoornet include the following:
Pricing based on underlying commodity prices: the best-known example of this at Spoornet is on the iron ore line, where Spoornet had what is described in their annual report as an “embedded derivative liability arising from a US dollar-based iron ore contract between Spoornet and one of our major clients.”82 This derivative product was apparently designed to allow Spoornet to charge higher rail prices when iron ore prices rose and thus share in the commodity price upturn. Ultimately, however, the contract left Spoornet unacceptably exposed to the subsequent downturn in the ore price.
Volume based pricing: for example, in 2002 Spoornet contracted with Kumba that Orex volumes above and beyond 15m tons per year would attract a higher price.83
Managerial discretion: client managers seem to have some discretion to offer prices which deviate from SCAP.
Demand-based pricing: where the freight client is perceived to have highly inelastic demand, there are apparently occasions where Spoornet takes the opportunity to raise prices.
Historical prices: may be used to adjust SCAP prices Diesel levies: recent increases in fuel prices have led Spoornet to institute
diesel levies on clients Inter-modal comparisons: Spoornet management apparently monitors road
freight rates and may adjust rail rates in order to bring them in line with road prices.
The client has no formal means of recourse if they feel that prices are unreasonable. Relationship managers are apparently given performance incentives which are based on the revenue they raise and thus may be tempted to raise prices unreasonably. On lines and in product segments where the client is unable to shift to road transport, therefore, there is no guarantee against excessive pricing.
81 The type of disputes mentioned by market experts include over-use of averaging techniques, for example, or over-allocation of revenue to low volume lines which feed into high volume lines. 82 Transnet 2005 annual report, 12. See also Business Day: “Revisiting value of Kumba contract,” 2002/04/08. 83 Business Day: “Revisiting value of Kumba contract,” 2002/04/08.

Prices, Investment and Efficiency on the Railways
A Sectoral Review of Efficiencies in Administered Pricing in South Africa
46
In general, Spoornet is highly inflexible on contract terms. It is normal practice for even large customers to be notified of tariff increases, including substantial increases in tariffs, via an unannounced fax. Negotiating a discount on that rate is then sometimes possible, but seems to require heroic efforts from the customer.
Contracts seem to vary substantially in length. The longest contract discovered during the research process was for twenty years, but one to three years seem more typical. Many clients complained of highly inefficient contracting processes at Spoornet. For example, many contracts take so long to sign that 50% or more of the period of time covered by the contract has elapsed before signing. Any price negotiation seems to extend the contract signing time substantially.
One or two Spoornet clients also signalled that Spoornet was attempting to place an increasing proportion of the burden of operational risk on the client, via changes to contract terms. For example, a specific allegation was that Spoornet had attempted to include derailments under the contract definition of force majeure.
Some Spoornet customers have included clauses in their contracts which impose penalties for poor quality of service. Market participants have however found this to be an ineffective way of improving quality, as it is often difficult to prove that service levels have been inadequate. Contracts may also fail to protect Spoornet adequately. For example, historically some customers have deliberately used Spoornet wagons as a free storage facility, with no financial penalty (although some changes have been implemented here).
3.3.2. Recent pricing outcomes
News articles and interviews with market participants confirm that Spoornet has recently increased its tariffs substantially, while simultaneously making the price setting process more rigorous. The ability of customers to negotiate on price, for example, seems to have decreased over the last three to four years. In its 2004 divisional report, Spoornet discloses that a pricing study was commissioned in November 2003, which found that “the current pricing strategy lacks a cohesive framework.” 84 Discussions with market participants suggest that this study strongly recommended a shift to Ramsey pricing, but that these conclusions were ignored for unknown reasons.
Instead, Spoornet states that the report resulted in the adoption of discriminatory pricing principles, with two pricing models dependent on such principles. The first or collaborative model seems to involve shifting operational risk to the consumer, while the second or differentiated model takes greater cognisance of cost factors, such as “volumes moved and the level of complexity of the service… provided”.
Figure 8 and Figure 9 below show an example of the type of tariff changes that have resulted from these new principles in recent years. From 2003 to 2004, for the container rates shown, the average price increase was in the region of 14%. However,
84 Spoornet 2004 divisional report, 48.

Prices, Investment and Efficiency on the Railways
A Sectoral Review of Efficiencies in Administered Pricing in South Africa
47
this average increase disguised substantial variations across product lines, with some tariffs staying constant, while others increased as much as 139%.
Figure 8 – 2003 Spoornet rand/km container tariffs
Figure 9 – 2004 Spoornet rand/km container tariffs
R2 = 0.8471
-
1.0
2.0
3.0
4.0
5.0
6.0
500 700 900 1100 1300 1500 1700Distance in km
Rand per km (average for 12m container)
R2 = 0.9589
-
1.0
2.0
3.0
4.0
5.0
6.0
500 700 900 1100 1300 1500 1700
Distance in km
Rand per km (average for 12m container)
Source: Industry participant, Genesis calculations Source: Industry participant, Genesis calculations
The figures graph the rand per kilometre tariff against the actual distance travelled. As can be seen, in both years the distance travelled explains the bulk of the variation in tariff. This is consistent with FDC pricing – each trip includes the cost of loading and unloading, which makes up a smaller component of the cost on longer trips, so we would expect to see attributable per kilometre costs decline over longer distances.
FDC pricing is even more strongly indicated by the change in the pricing structure from 2003 to 2004. In 2003, the length of the trip explains only 84.7% of the variation in the per-km tariff, but by 2004, it has risen to 95.9%. In 2003, Spoornet offered a small discount on loads going to the coast (around 15%), as compared to loads heading inland, on links to the ports of Cape Town and Port Elizabeth. This is consistent with Ramsey pricing – on these routes, the bulk of freight is imports, so wagons often travel empty to the coast. In comparison, exports heading for harbour are more important on the Durban route, so the export route was charged at a small premium to the import route (around 3%). However, in 2004 tariffs on the import

Prices, Investment and Efficiency on the Railways
A Sectoral Review of Efficiencies in Administered Pricing in South Africa
48
and export routes between Gauteng and Durban, and Gauteng and Port Elisabeth, were equalised. This is despite the fact that the route to the bay is two-thirds full, versus one-thirds full for the trip to Gauteng.85 This suggests a move by Spoornet towards more rigorous FDC pricing methodologies, which disregard customer demand characteristics.
An emphasis on cost based pricing at Spoornet is supported by what is publicly known of management thinking at the time. For example, in 2002, then-CEO Zandile Jakavula argued that GFB’s losses (it was losing around R500m a year) were due to cross-subsidisation of unprofitable clients by profitable clients. As “50 of Spoornet’s general freight business’s 1 300 customers brought in 80% of its revenue,”86 management attention should focus on only these clients. This reasoning misses the importance of boosting volumes in a high-fixed cost business, even if those volumes can only be gained by servicing marginally profitable clients.
Discussions with market participants suggest that on many GFB product lines, rail freight costs are now comparable to road freight, and in some cases higher than road freight. In Table 15 we summarise what is known about recent tariff increases at Spoornet. As can be seen, Spoornet imposed substantial tariff increases over the years 2002 to 2004. In fact, from 2002 to 2006, Spoornet tariff increases have increased rail prices by a cumulative 57%, compared to a 30% cumulative increase in producer prices and a 32% increase in consumer prices.
Table 15 – Spoornet annual tariff increases
GFB tariff
increase (%) PPI increase (%)
CPIX increase (%) 2001 8.5 6.6 2002 15.087 14.2 9.3 2003 11.388 1.7 6.8 2004 14.489 0.7 4.3 2005 3.090 3.1 3.9 2006 4.091 7.6 4.6
Sources: Statistics SA, Genesis calculations, various (see footnotes)
Again, it should be borne in mind that the burden of price increases has not been evenly spread among rail customers. For example, the 14.4% tariff increase in 2004 included product-specific increases of as much as 40%.92 In 2002, agriculture was particularly strongly affected by tariff increases, with Spoornet’s initial price proposal
85 NFLS 2005, 27. 86 Business Day: “Wide-ranging strategy needed to put Spoornet back on track,” 2004/03/03. 87 Business Day: “Rail utility woes far from over as the firm gets another lifeline,“ 2002/04/15. 88 Calculated from company financials – 10.4% growth in revenue, accompanied by a 0.8% decline in tons transported, implies 11.3% growth in tariffs. 89 Spoornet 2004 divisional report, 40. 90 Business Day: “SA’s creaking rail network laid bare in new survey,” 2005/02/08. 91 Calculated from company financials – 4.5% growth in revenue, accompanied by a 0.5% increase in tons transported, implies 4.0% growth in tariffs. 92 Business Day: “Wide-ranging strategy needed to put Spoornet back on track,” 2004/03/03.

Prices, Investment and Efficiency on the Railways
A Sectoral Review of Efficiencies in Administered Pricing in South Africa
49
ranging from a 12% increase in the molasses tariff, to a 67% tariff increase for freighting sunflower seeds.93 Over the period 2002 to 2006, the overall rail tariff increased at an average rate of 3% annually, whereas the compound annual rate of growth in the GFB business averaged 8%.
3.4. STATUTORY AND POLICY ENVIRONMENT
At present, Transnet is the owner-operator of South Africa’s principal transport infrastructures, with its Spoornet division owning and operating the South African freight rail network. Transnet itself is a statutory body, fully owned by government. In terms of s2(3) of the Legal Succession to the South African Transport Services Act, 1989 (‘the Act’) the Minister of Public Enterprises “shall exercise the rights of the State as member and shareholder” of Transnet, whereas the SARCC is administered as an agency of the Department of Transport.
The network used by Metrorail is contiguous with the Spoornet network. As the network owner is Spoornet, it can be argued that South Africa has already instituted a degree of vertical separation in rail. Access agreements govern the relationship between Metrorail and the Spoornet infrastructure.
The de facto monopoly
Spoornet has a de facto monopoly over the domestic rail network. Although private rail networks are not expressly outlawed by legislation, there is no enabling legislation for such private investment either. For example, Schedule 1 of the Act details the legal rights and obligations of Transnet in a number of practical areas, such as expropriation,94 the ability to remove obstructions from neighbouring property,95 and how and when to use a siren as a warning at level crossings.96 These rights and obligations are only of application to Transnet and do not extend to private operators. A private operator would thus be entering a legislative vacuum, which would create a substantial competitive disadvantage in comparison to Spoornet.
93 Business Day: “Spoornet’s spike,” 2002/03/27. 94 “7. (1) The Company shall be entitled to expropriate movable and immovable property.” 95 “4. (1)(b) (b) should a tree, bush, growth, fence, embankment or other obstruction on land adjoining
the railway reserve, in the opinion of the Company, constitute a potential danger or hindrance to the safe and proper exploitation of the railway line or pipeline or the telegraph or telephone services established in connection therewith, to remove, after reasonable notice to the owner or occupier of such land, as much of such tree, bush, growth, fence, embankment or other obstruction as, in the opinion of the Company, could endanger or hinder such safe and proper exploitation; provided that should such obstruction, in the opinion of the Company, actually endanger or hinder such safe and proper exploitation, the Company may undertake the work that is immediately necessary to eliminate the danger or hindrance without such notice.”
96 “3. (1) The use of a whistle, siren or hooter of a train for at least three seconds as a warning while approaching a level crossing discharges the Company and its employees of the legal obligation to give users of the crossing audible warning of the train.”

Prices, Investment and Efficiency on the Railways
A Sectoral Review of Efficiencies in Administered Pricing in South Africa
50
In addition, Spoornet has a historical advantage against potential market entrants, in that it already has a rail network connecting major cities and ports. On some of this infrastructure, scarcity of suitable land would make it prohibitively difficult for a new entrant to provide a network of comparable functionality to the pre-existing Spoornet network. The only commercially feasible entry point for new competitors, particularly in the GFB business, would thus be to allow access to the Spoornet network.
Government influence and control
The Act does not provide detail as to how the prices of Transnet services should be determined. It does however provide substantial discretion to various government bodies to exert influence on Transnet. For example, s15(1)97 requires Transnet to provide services which are in the public interest on the request of either the SARCC or any transport authority (which includes any Department of State and designated local government bodies). If Transnet is unable to contract for mutually acceptable terms on such a requested service, terms must be stipulated by an arbitration panel, appointed in terms of s15 of the Act.
Such an arbitration panel would have substantial discretion to determine contract conditions, as shown in s15(6) below. However, arbitration procedures are limited to exceptional circumstances and do not affect day-to-day pricing decisions.
15(6) The terms stipulated by the arbitration tribunal shall include such terms as would normally be included in a contract for the provision of the relevant service, including terms which—
(a) oblige the Company to provide the service required;
(b) present the Company with an opportunity to earn a reasonable profit;
(c) provide for the granting by the Corporation or the transport authority of adequate security for payment for the service;
(d) provide for a reasonable cash flow to the Company n respect of the provision of the service; and
(e) stipulate the period during which the service shall be provided.
Section S 17 of the Act also allows the Minister of Public Enterprises to intervene in the operations of Transnet if they behave in a manner which is contrary to the economic interests of the country.98 This would again allow the Minister to set price policy, but only in exceptional circumstances.
97 “s15. Provision of service at request of Corporation or transport authority.— (1) Subject to the provisions of this section, the Company shall provide, at the request of
the Corporation or a transport authority, a service that is in the public interest.” 98 “17. Strategic or Economic Interests of Republic –
Without in any way derogating from the provisions of section 15, should the Company act in a manner contrary to the strategic or economic interests of the Republic of South Africa, the

Prices, Investment and Efficiency on the Railways
A Sectoral Review of Efficiencies in Administered Pricing in South Africa
51
Safety regulation
The National Railway Safety Regulator Act, 2002 introduced limited regulation of South African rail. It specifically addresses safety in both freight and passenger rail. The regulator has been in operation as the Railway Safety Inspectorate (RSI) since March 2006.99 To the extent that the RSI can affect operating conditions and costs at Spoornet, it can also indirectly impact on prices.
3.4.1. Policy framework
Over most of its history, the South Africa transport sector has operated without an explicit, over-arching policy framework.100 In the words of the 1998 Moving SA policy document, this caused “components of the system… (to) maximise against an unintegrated set of constraints and towards an unintegrated set of objectives”. Steps have been taken to remedy the policy deficit over the last decade, and the current transport policy environment will be dealt with in some depth in the sections on the National Freight Logistics Strategy and the National Land Transport Strategic Framework below. However, we argue that there are still inconsistencies and gaps in the current policy framework.
It is likely that the policy framework on transport would exhibit more development, if initial work had not been overtaken by changes in government thinking in the privatisation debate. Where the Department of Public Enterprises had initially been willing to privatise entities such as Telkom and South African Airways, for example, by 2004, the Minister of Public Enterprises had adopted a strongly anti-privatisation stance:
“the private sector is inexorably impelled toward appropriating value for itself – that is why it is impelled with a feverish and oft-times self-consuming dynamism. This has a number of effects when the private sector gets into the terrain of public goods. They will tend to ‘cherry-pick’ the most profitable opportunities, maximise the rate of return and seek to shorten the payback period – all sensible practice for a private corporation. However, this can create many public problems. It can mean that the overall infrastructure or delivery system can be weak and badly integrated or that important communities are underserviced or poorer people are impoverished further because the cost of necessities is rising.”101
Minister may direct the Company, by means of a written notice or by any other means that he may deem desirable, to discontinue such activity within a reasonable period, which shall be stipulated in the notice or other means of communication employed.”
99 Downloaded from http://www.engineeringnews.co.za/eng/sector/transport/?show=95065 on 24 November 2006. 100 Department of Transport 2006, 25. 101 Alec Irwin’s 2004 budget address, as quoted in the Financial Mail: “Hard to Let Go,” 9 March 2007.

Prices, Investment and Efficiency on the Railways
A Sectoral Review of Efficiencies in Administered Pricing in South Africa
52
Below we set out the policy thinking embodied in the National Freight Logistics Strategy (NFLS) and the National Land Transport Strategic Framework (NLTSF), which together comprise the bulk of current policy on the sector.
National Freight Logistics Strategy (‘NFLS’)
The NLFS was released in September 2005. The document begins with a diagnosis of the issues in the freight logistics sector as a whole. In full, its problem statement is as follows:
“The freight system in South African is fraught with inefficiencies at system and firm levels. There are infrastructure shortfalls and mismatches; the institutional structure of the freight sector is inappropriate, and there is a lack of integrated planning. Information gaps and asymmetries abound; the skills base is deficient, and the regulatory frameworks are incapable of resolving problems in the industry.”102
Causes of inefficiency
A number of causes of inefficiencies in freight are discussed. For example, the issue of under-investment in infrastructure and equipment, which is well recognised in the public debate on rail in particular, is mentioned. The NFLS expresses concern over both the general underinvestment in the sector and also on reduced investment in services to under-developed areas, which it says “has resulted from commercial discipline being imposed on some entities across the entire network, rather than more sophisticated measures of performance that allow objective assessment of economic value-add on a broader base than just balance sheet performance”.103
Specific attention is also paid to the confusing nature of freight regulation, which is characterised by fragmented and overlapping regulation, with little enforcement capability. The complexity of the ports and rail regulatory environment is shown in Table 16 below.
102 NFLS 2005, 4. 103 NFLS 2005, 6

Prices, Investment and Efficiency on the Railways
A Sectoral Review of Efficiencies in Administered Pricing in South Africa
53
Table 16 – Freight transport regulatory and operational environment
Function Organisation Responsibilities DoT Transport policy? Policy Transnet Investment; Structure; Price DPE Shareholder DTI Factor conditions SARS Border posts Transnet Port landlord; Pricing; Infrastructure
Economic regulation
Competition Commission Industry structure
RSR Rail SAMSA Maritime
Safety & environmental regulation DEAT IEM as part of Environment Conservation Act
Rail Owned and managed by Transnet Infrastructure Ports Owned and managed by Transnet Rail Transnet Operations Ports Transnet and private operators
Source: Adapted from NFLS 2005, 10
Effectively, regulation in freight is characterised as so weak that “monopolies with embedded regulatory power, or where regulation is absent, are able to operate without effective regulatory government oversight.”104 This can be illustrated by examining the multiple roles played by Transnet in the sector. Not only does it provide rail and ports operations and infrastructure, but it also sets policy and acts as an economic regulator. What the NFLS does not acknowledge is the relatively weak control government exercises over Transnet as shareholder, which further entrenches the SOE’s independence of action (see further discussion in section Error! Reference source not found.).
On pricing in transportation, two issues in particular are addressed, as follows:
Cross-subsidisation: unregulated cross-subsidies are described as “transferring the incidental costs of inefficiencies to cargo users of unrelated infrastructures”.105
Cost-based pricing techniques: cost based pricing is described as an overly rigid system, which does not allow for customisation by customer and contributes towards higher prices.106 The freight system as a whole is seen as dominated by rigid, supply driven management practices and strategies.
The NFLS does not suggest that cross-subsidies should be removed, but that the structure of cross-subsidisation should be formalised. In particular, the document proposes the establishment of a transparent ‘developmental pool’ of funds, which could be “cross subsidise infrastructure and operations that are not commercially
104 NFLS 2005, 10 105 NFLS 2005, 5 106 NFLS 2005, 4-5
Prices, Investment and Efficiency on the Railways
A Sectoral Review of Efficiencies in Administered Pricing in South Africa
54
viable but are identified as in the national interest.”107 This pool could potentially be topped-up by direct contributions from government, as well as collections from freight operators. Unfortunately, no specific recommendation is made on an alternative to cost based pricing.
Market structure alternatives
The policy document does not give much credence to the potential disciplining power of market action in the transport markets. In fact, in the very first page, the NFLS refers to the argument that the private sector is typically more efficient than the public sector as an “unproven contention.” Inefficiency in rail and ports in particular is blamed on the monopoly structure of these markets, rather than on state ownership.
Privatisation is explicitly ruled out as a strategic alternative for the bulk of the network: “the vision is for the Government to retain the majority of ownership of critical infrastructure and to remain responsible for network development and management”.108 Where private firms are to be allowed to participate in these markets, they should principally be restricted to operator status, while infrastructure should be “held and managed by a state agency that operates on a utility basis under a long-term network sustainability rather than a commercial mandate. Other infrastructure components should be held in commercialised SOEs that retain certain socio-economic and strategic obligations.”109
Specific rail initiatives
The NFLS uses rail as an illustrative example of the kind of regulatory changes envisaged under the new strategy. A major increase in the number of regulatory agencies operating in the sector is planned, resulting in the following three regulators:
“the Economic Regulator would regulate the economic efficiency of industries and the management of monopoly power, and ensure equal access to the infrastructure network;
the Safety and Environment Regulator would regulate institutional and human capacity, standards and vehicular technology and operations, and also deal with issues of noise pollution, vehicle emissions, land development and usage, hazardous waste disposal and the internalisation of environmental cost on the ‘user pays’ principle; and
the Security Regulator would regulate institutional and human capacity, standards, operations and general compliance with international safety requirements.”110
The first set of regulatory changes planned will be implemented on the secondary rail network, which is defined as lines which do not connect major metropolitan areas or
107 NFLS 2005, 39 108 NFLS 2005, 38 109 NFLS 2005, 38 110 NFLS 2005, 41-42.
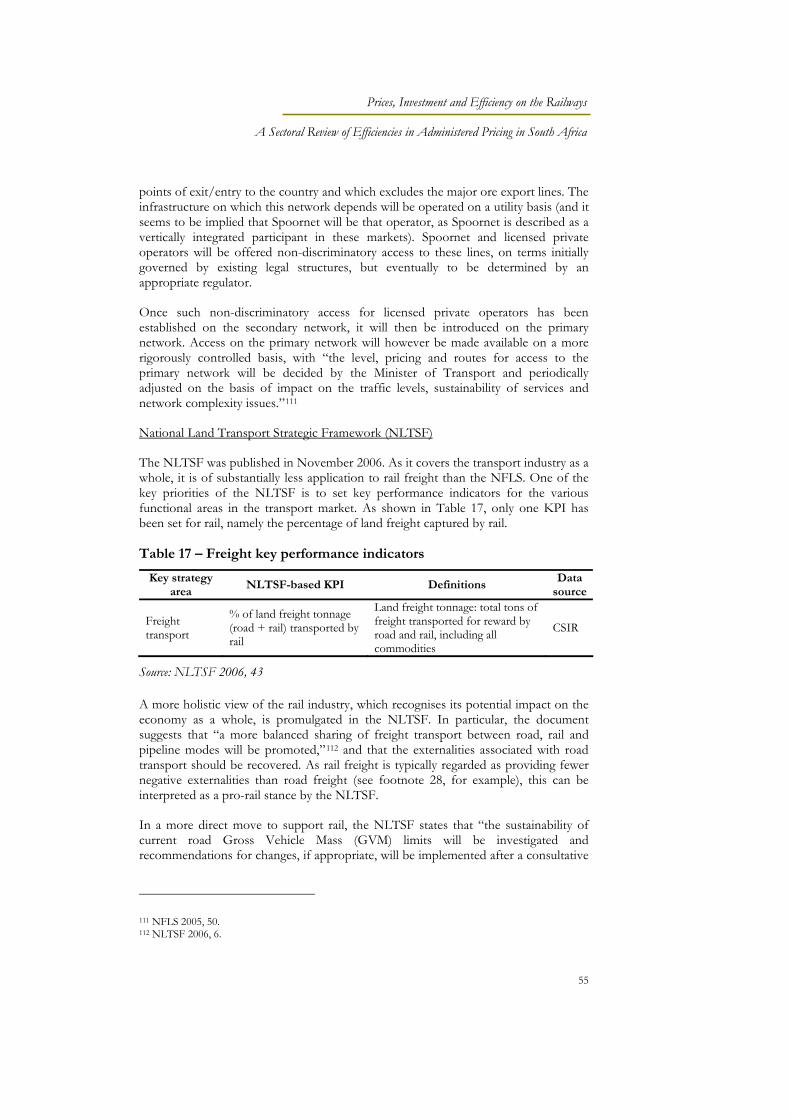
Prices, Investment and Efficiency on the Railways
A Sectoral Review of Efficiencies in Administered Pricing in South Africa
55
points of exit/entry to the country and which excludes the major ore export lines. The infrastructure on which this network depends will be operated on a utility basis (and it seems to be implied that Spoornet will be that operator, as Spoornet is described as a vertically integrated participant in these markets). Spoornet and licensed private operators will be offered non-discriminatory access to these lines, on terms initially governed by existing legal structures, but eventually to be determined by an appropriate regulator.
Once such non-discriminatory access for licensed private operators has been established on the secondary network, it will then be introduced on the primary network. Access on the primary network will however be made available on a more rigorously controlled basis, with “the level, pricing and routes for access to the primary network will be decided by the Minister of Transport and periodically adjusted on the basis of impact on the traffic levels, sustainability of services and network complexity issues.”111
National Land Transport Strategic Framework (NLTSF)
The NLTSF was published in November 2006. As it covers the transport industry as a whole, it is of substantially less application to rail freight than the NFLS. One of the key priorities of the NLTSF is to set key performance indicators for the various functional areas in the transport market. As shown in Table 17, only one KPI has been set for rail, namely the percentage of land freight captured by rail.
Table 17 – Freight key performance indicators
Key strategy area
NLTSF-based KPI Definitions Data
source
Freight transport
% of land freight tonnage (road + rail) transported by rail
Land freight tonnage: total tons of freight transported for reward by road and rail, including all commodities
CSIR
Source: NLTSF 2006, 43
A more holistic view of the rail industry, which recognises its potential impact on the economy as a whole, is promulgated in the NLTSF. In particular, the document suggests that “a more balanced sharing of freight transport between road, rail and pipeline modes will be promoted,”112 and that the externalities associated with road transport should be recovered. As rail freight is typically regarded as providing fewer negative externalities than road freight (see footnote 28, for example), this can be interpreted as a pro-rail stance by the NLTSF.
In a more direct move to support rail, the NLTSF states that “the sustainability of current road Gross Vehicle Mass (GVM) limits will be investigated and recommendations for changes, if appropriate, will be implemented after a consultative
111 NFLS 2005, 50. 112 NLTSF 2006, 6.

Prices, Investment and Efficiency on the Railways
A Sectoral Review of Efficiencies in Administered Pricing in South Africa
56
process”.113 It is not clear whether the chief concern of policy in this regard would be to decrease damage to road infrastructure associated with heavy vehicles, or to artificially increase demand for rail freight.
Assessment of policy
In the context of this report, we offer some reflections on the policy framework outlined above.
It is welcome that the rigidity of the cost-based pricing approach is accurately noted as a cause for concern. There would now be merit in identifying an alternative to this pricing approach. Our recommendation in this report involves a shift towards demand-based pricing.
More recognition of the crucial importance of getting the competitive structure of the market right is needed. For example, the market power that Spoornet will have as a vertically integrated owner/operator, as compared to new operator entrants should be addressed.
Getting independent economic regulation right is an extremely difficult and vitally important component of utility regulation. This particular aspect of the policy framework requires strengthening. For example, the policy position that access to the primary network should only be regulated directly by the Minister of Transport does not acknowledge the importance of regulatory independence. The argument that access to the secondary rail network can be made available on a non-discriminatory basis, using only current legislation, does not sufficiently recognise the difficulty of this change.
Transnet faces a double mandate, of making profits and meeting social goals. Although the difficulties of reconciling these goals are acknowledged in policy, the approach to reconciling them is inadequate. For example, it is peculiar that the secondary network, which is often not profitable, is seen as the first choice for entry of private rail operators – this is the arena where state support is most critical, because it is possible that it cannot be done on a commercial basis.
We recommend more investigation into the approach taken to cross-subsidisation. As already discussed, Ramsey prices often result in one good carrying proportionally more of fixed cost burden than another – this kind of cross-subsidisation can be efficiency-enhancing, as long as the two goods share the same fixed cost structure. However, if the goods are produced off different cost structures, cross-subsidisation between them will distort prices. Price distortions mean that producers get the wrong signals about how much of a good to produce, which reduces allocative efficiency (see section 2.3.1). The policy documents implicitly assume that cross-subsidisation between various elements of the transport market is acceptable, as long as it does not cause technical inefficiency: this critically neglects allocative efficiency.
113 NLTSF 2006, 24.

Prices, Investment and Efficiency on the Railways
A Sectoral Review of Efficiencies in Administered Pricing in South Africa
57
More attention to competition issues is needed in the debate over the virtues of vertical as opposed to horizontal integration in rail. For example, horizontal separation has the potential to produce more than one operator, potentially competing for some of the same traffic on price (eg a Johannesburg-Maputo route, competing with a Johannesburg-Durban route). Because the various types of separation and/or integration profoundly affect the competitive nature of the market, this aspect of the separation or integration debate should be addressed.
Box 4 – Concessioning policy
In 1999, Mercer, a consultant hired by Spoornet, suggested that 17 000 additional employees (around a third of the labour force at the time) should be retrenched.114 At the time, Spoornet was sustaining a R1.8bn annual loss in the general freight business via a combination of a R1.8bn profit in the CoalLink and Orex lines, and extremely low maintenance and investment expenditure levels.115 Government rejected the initial Mercer proposal and hired its own restructuring consultant, British merchant bank Rothschild. The Rothschild proposal contained the following elements:116
Splitting Spoornet into six separate companies.
Concessioning the lines which were either highly profitable already (CoalLink and Orex), or potentially highly profitable (the Blue Train), immediately.
Concessioning Shosholoza Meyl with an ongoing government subsidy.
Splitting out the light density and branch lines in the general freight business, concessioning those lines which seemed to have commercial potential and closing those that did not.
Implementing a three-year turnaround strategy at the restructured GFB, before concessioning it.
A principal goal of this policy was to stop internal cross-subsidisation of unprofitable lines by profitable operations. Government accepted the proposals and announced these plans in 2000.
One of the key drivers of efficiency in a concessioning regime is the fact that concessionaires have wide discretion to adapt to competitive realities. This includes the discretion to close down marginal lines, for example, and to shed superfluous staff. The possibility of retrenchments in a concessioning regime prompted union resistance, which, coupled with growing ambiguity within government over the desirability of privatisation, led to a substantial change in plans. Ultimately, only the Blue Train was concessioned.
A key component of the success of labour was the technical rigour of its arguments. When labour resistance to privatisation initially arose, the ministers of transport and public enterprises had set up a joint labour/government task team to investigate the restructuring, which had in turn organised a technical working group, comprised mainly of Spoornet management. The technical working group then projected profitability levels for four scenarios, of varying freight volumes and network sizes. On each scenario, GFB was found to be unsustainable as a stand-alone business. The scenario assumptions were tested by government representatives, who were unable to disprove the findings, and concessioning was thus largely abandoned.117 Together with a more general move away from privatisation as a policy goal, this experience seems to have taken rail privatisation off the policy agenda at the Department of Public Enterprises.
114 Van Holdt 2003, 3 115 Rothschilds 1999, 2000, quoted in van Holdt 2003, 2 116 Van Holdt 2003, 3 117 Van Holdt 2003, 8

Prices, Investment and Efficiency on the Railways
A Sectoral Review of Efficiencies in Administered Pricing in South Africa
58
3.4.2. Shareholder control
As a State Owned Enterprise, Transnet has only one shareholder, namely the government of the Republic of South Africa. The Minister of Public Enterprises undertakes the role of government as shareholder in the relationship with Transnet. For the 2006/07 financial year, Transnet and government entered into a shareholder’s compact, which formalises what government expects from Transnet management over the year. This is consistent with analytical thinking on how to achieve commercialisation of SOEs using the five objectives:118
Clarity and consistency of objectives; Management authority; Performance monitoring; Effective rewards and sanctions; and Competitive neutrality.
The shareholder’s compact mandates Transnet “to assist in lowering the cost of business in South Africa and enabling economic growth through providing appropriate ports, rail and pipeline infrastructure and operations in a cost effective and efficient manner and within acceptable benchmark standards.” To this end, four strategic objectives are specified, as follows:
Capital and financial efficiency: metrics covered include gearing levels, cost effective funding and an appropriate return on investment. Key performance indicators (‘KPIs’) are shown in Table 18.
Operational efficiency and effectiveness: no KPIs are specified for operational efficiency, but Transnet is committed to increasing GFB volumes at Spoornet, as well as net operating margin improvement in key business units. The compact further specifies that Transnet shall deliver competitively priced services, as part of an overall contribution towards lower logistics and transport costs (but again, no KPIs are specified).
Infrastructure investments: KPIs are as specified in Table 18.
Developmental objectives: three sets of development objectives are specified, namely skills development, black economic empowerment and contribution to reaching ASGI-SA objectives.
118 Adapted from op. cit., Owens, Helen. Pg. 11.

Prices, Investment and Efficiency on the Railways
A Sectoral Review of Efficiencies in Administered Pricing in South Africa
59
Table 18 – Transnet key performance indicators
Performance area KPI/Measure Benchmark 2005/06
baseline * 2006/07 target
EBITDA margin Over 35% *** 40.2% * 34.8%
Cash interest cover Over 5 times *** 3.7 times 5.3 times
Gearing ratio 40-50% *** 47.1% 47.9%
Capital/financial efficiency (group, excl. discontinued units) ** Cash flow return on investment Over 6% *** 5.8% * 5.8%
% of actual capital expenditure, compared to budgeted expenditure
Over 90% R6 601m R11 847m Infrastructure investments % of total maintenance spent
compared to budget: Spoornet Over 90% R1 906m R3 890m
Source: Shareholder’s compact between government and Transnet, 2006/07 * including sale of shares, profit on disposal of PPE ** Discontinued businesses are SAA, freightdynamics, Viamax and Autopax *** these benchmarks are the target of performance in the medium term (next 3 years)
Although the shareholder’s compact allows for KPIs in all strategic objectives, the only ones that have been determined so far are as shown in Table 18. These are then supplemented with the revenue growth objectives shown in Table 19 below.
Table 19 - Planned components of total revenue increases in the 2006/07 financial year at Transnet
Total core businesses
(%)
Spoornet (%)
NPA (%)
SAPO (%)
Petronet (%)
Transwerk (%)
Tariff contribution to increase in revenue 3.3 3.1 2.9 3.9 2.0 4.3
Volume contribution to increase in revenue 11.5 10.9 3.7 8.8 6.8 28.6
Total planned increase in revenue (internal + external revenue)
15.2 14.3 6.7 13.0 8.9 34.1
Source: Shareholder’s compact between government and Transnet, 2006/07
Much is missing from the shareholder’s compact. For example, the revenue targets are a useful way of preventing Transnet from achieving revenue growth simply through massive price increases, but should ideally be accompanied by cost reduction targets, to ensure that revenue growth actually translates into profitability. Ultimately, however, the usefulness of KPIs in the shareholder’s compact is largely determined by the ability of government to enforce these goals and penalise managers who do meet such goals.
The relationship between the owner of a firm and the management of a firm is often characterised by conflicting interest, as suggested by principal-agent theory. The owner of a firm tries to incentivise managers to behave in ways that are beneficial to

Prices, Investment and Efficiency on the Railways
A Sectoral Review of Efficiencies in Administered Pricing in South Africa
60
the owner, both via positive incentives such as performance linked bonuses, for example, and via negative incentives, such as the threat of being fired.
In the private sector, the goals of management are usually fairly simple – all that is required is profit maximisation. However, Transnet is being asked to maximise a number of potentially conflicting goals simultaneously – for example, profitable revenue growth, while helping to keep prices in the sector at reasonable levels. Transnet’s managers are also exposed to changes in political strategies, which mean that the goals they are asked to meet can change from year to year.
These factors can make managers at SOEs resistant to shareholder influence. In particular, if policy goals have changed enormously over time and have sometimes been internally inconsistent or contradictory, the best strategy for management may become passive resistance, in order to prevent too much damage to the underlying business from destructive political objectives.
There is no clear evidence that the shareholder relationship between government and Transnet has deteriorated to this level as yet. However, it should be noted that this research process has received wide support from government, including the Departments of Transport and Public Enterprises and the Office of the Presidency. Despite this support, Transnet took eleven months to cooperate with the research process. Essentially, despite the various requests for cooperation, the company’s response was voluntary.
3.4.3. Cross-subsidisation at Transnet
As discussed in section 3.4, there is concern that the policy of cross-subsidisation in transport may affect efficiency outcomes. Cross-subsidisation, however, can take many forms. We analyse the efficiency implications of the following forms of cross-subsidisation:
Different levels of profitability on activities produced using the same infrastructure.
Use of profits on a profitable activity to subsidise losses on another, entirely separate activity.
Both of these kinds of cross-subsidisation have been alleged at Transnet. Losses in the GFB business are sustained by profits on the ore export lines (activities with a shared cost structure), and profits in ports sustain losses in rail (activities which do not share costs or infrastructure to any considerable degree). Both are thus worth discussing. It is also important to distinguish between technical and allocative efficiency issues in cross-subsidisation arguments (see the discussion in section 2.3).
Activities which use the same infrastructure
Ramsey pricing has already been discussed in section 2.2.2. Under the Ramsey pricing methodology, fixed and shared costs are not attributed to particular activities. Any activity that at least covers its variable costs is thus seen as contributing to overall profitability.

Prices, Investment and Efficiency on the Railways
A Sectoral Review of Efficiencies in Administered Pricing in South Africa
61
In a Ramsey world, prices should ideally be subject to upper and lower bounds. The lower bound is the criteria that marginal costs should be covered, while the upper bound is stand-alone cost and is designed to prevent the abuse of the customer base by excessive pricing. If a Ramsey-pricing company was required to provide some of its goods below marginal cost, it would need to compensate by increasing the prices of the rest of the bundle of goods offered, and this might require a loosening of the upper bound to price – in other words, in order to provide some customers with below cost services, it might be necessary to abuse other customers with excessive prices. This raises concerns as to fairness and equity, rather than efficiency concerns per se.
However, as a rule, as long as each service covers its marginal costs, and those services share the same fixed cost structure, it is not problematic if some of those services carry a disproportionate share of the fixed cost burden. In fact, Ramsey pricing would define this kind of strategy as profit-maximising rather than as cross-subsidisation. Because Ramsey prices are set in inverse proportion to price elasticities, they provide minimal distortion to demand patterns – they are therefore consistent with a minimum loss in allocative efficiency.
Activities which are completely separable
It has long been alleged that Transnet to some extent cross-subsidises between its various divisions. In order to cross-subsidise from one operation to another, Transnet would need to be able to sustain abnormally high margins in one division (which would only be possible in an imperfectly competitive market). It is difficult to discover the validity of these arguments without better divisional reporting at Transnet. However, the financial statements are certainly suggestive of such cross-subsidisation.
As shown in Table 20, profit metrics vary substantially between Transnet’s operating divisions. The maritime division substantially outperforms the rest of the company as regards return on assets and has the second highest ratio of headline earnings to revenue. Rail, in contrast, outperforms only the property division.

Prices, Investment and Efficiency on the Railways
A Sectoral Review of Efficiencies in Administered Pricing in South Africa
62
Table 20 – Transnet divisional performance
2006 financial year Headline return on assets
(%) Headline net profit margin
(%)
Group 5.4 15.7 Rail 1.2 1.5 Maritime 12.0 29.8 Pipeline 5.1 18.1 Aviation 1.1 17.1 Road 0.5 34.6 Property -0.4 -2.4 Other operations 8.9 -31.7
Source: Transnet 2006 annual report, Genesis calculations
This disparity between the performance of rail and ports has been sustained for many years. As shown in Figure 10, not only is the margin on the maritime division substantially higher than the margin on the rail division, but the actual size of those profits is also many times higher than in rail.
These findings by no means confirm that the rail division is being cross-subsidised by maritime, but they are certainly suggestive of such cross-subsidisation. In particular, it should be noted that the kind of profit margins seen in maritime, which usually fluctuate between 30% and 45% of revenue, are unusually high in the private sector.
Such cross-subsidisation, sustained over long periods of time, may have a negative impact on both technical and allocative efficiency. Firstly, it removes the profit motive as discipline on Spoornet. Potentially, if Spoornet management know that there is no real penalty for financial under-performance, because losses can be recovered from the South African Ports Operations (‘SAPO’), much of the pressure to expend effort on efficiency improvements is removed. Technical efficiency is unlikely to be optimised under these conditions.

Prices, Investment and Efficiency on the Railways
A Sectoral Review of Efficiencies in Administered Pricing in South Africa
63
Figure 10 – Rail and maritime divisions financial performance compared
-15%
0%
15%
30%
45%
60%
2006 2005 2004 2003 2002 2001 2000 1999 1998 1997 1996
-1,000
-
1,000
2,000
3,000
4,000Rail profit margins Maritime profit margins
Rail operating profits Maritime operating profit
Rm% of revenue
Source: Transnet financials, Business Day reporting
However, lost technical efficiency is not the only concern. In Figure 11, we show two pricing scenarios for Transnet. In Scenario 1, Transnet operates both Spoornet and the maritime division using Ramsey pricing methodology, with price structures set so as just to cover total costs (plus some small profit margin). Because Ramsey pricing is used, there is very little distortion to the quantity of services provided in both divisions, which means that allocative efficiency is being maximised. Where socially desirable services cannot be provided on a commercial basis (which in a Ramsey scenario, means that pricing on these services has to be set below operating cost), government provides an explicit subsidy. We assume that such subsidies are only needed at Spoornet, which is consistent with the international rail regulation experience.

Prices, Investment and Efficiency on the Railways
A Sectoral Review of Efficiencies in Administered Pricing in South Africa
64
Figure 11 – Implications of divisional cross-subsidies
Source: Genesis Analytics
In Scenario 2, government removes its explicit subsidy, but still requires Transnet to provide socially desirable, but commercially unsustainable services at Spoornet. Transnet must now finance these rail operations using cross-subsidies from the maritime division. To keep the company as a whole financially sustainable despite the absence of subsidies, prices in the maritime division must be raised above the levels seen in Scenario 1. For the sake of simplicity, we assume that the structure of prices at both the maritime and rail divisions continues to be consistent with Ramsey methodology.
These two scenarios are superficially similar, but produce quite different outcomes from an allocative efficiency point of view. The key change is the increase in ports prices in Scenario 2, which decreases the amount of ports services that will ultimately be supplied (on the key economic precept that quantity demanded decreases as price increases). This distortion reduces allocative efficiency.
In Scenario 1, the money needed to pay for socially desirable but commercially unviable rail services is raised via tax revenues, while in Scenario 2, it is raised via increased prices in ports. Because Transnet is government owned, these increased prices are very similar to a sector specific form of taxation. However, where direct taxes are transparently set forth and must be justified by the National Treasury, these are indirect taxes that can be changed according to the whim of Transnet
Spoornet divisionRamsey system 1; some
state subsidies
Maritime divisionRamsey system 2
TransnetSOE with social
obligations
• Both divisions managed to just cover costs • Where activities are not economically viable,
government provides a subsidy• Minimal distortion to quantity supplied
Spoornet divisionRamsey system 1; cross subsidy from maritime
Maritime divisionRamsey system 2;
managed to produce abnormal profits
TransnetSOE with social
obligations
• Maritime produces abnormal profit, replaces state subsidies in rail with cross subsidies
• Minimal distortion to quantity supplied in rail, but quantity supplied in maritime is reduced
Scenario 1
Scenario 2

Prices, Investment and Efficiency on the Railways
A Sectoral Review of Efficiencies in Administered Pricing in South Africa
65
management. There is thus no guarantee that these taxes will be set in a way that is consistent with wider tax policy objectives.
The following tax objectives are normally considered by policy-makers:
Reduce quantity distortions: like Ramsey pricing theory, tax policy theory suggests that taxes should be higher on inelastic goods, so as to reduce the distortions in quantity supplied that tax can induce, by changing the cost of goods to the consumer. Thus, although taxes almost always reduce allocative efficiency, by moving prices away from marginal cost, care should be taken to reduce this distortion as much as possible.
Equity: most tax systems are designed to meet equity objectives. In particular, they are designed so as to ensure that the greatest proportional tax burden falls on the wealthy, rather than on the poor (the theory refers to progressive rather regressive taxation). This is of particular importance in an economy which displays high levels of income inequality, such as South Africa
Wider social objectives: well-crafted taxes do not run contrary to broader social objectives. For example, it would be counter-productive to tax a sector with greater growth potential more heavily than a sector with low growth potential, in an economy where economic growth is of great importance.
High prices in Transnet’s maritime division (which we will henceforth refer to as the ports levy) do not meet all these criteria of a well-designed tax. Ports services are certainly highly inelastic, as South Africa is a long haul destination with limited overland freight infrastructure. The ports levy will thus cause little distortion of quantity supplied. However, in terms of equity, a ports levy may be problematic. It is not clear that the bulk of consumer goods imported via ports into South Africa are consumed by the wealthy – a ports levy may thus be a regressive tax.
The impact of a ports levy on wider social objectives is the most troubling implication of this policy. Sustained economic growth in South Africa is dependent on a number of factors, including export growth, and export growth is itself dependent on the ability of local producers to compete with the efficiency of international firms. A ports levy threatens these underpinnings of macroeconomic growth.
Imported goods account for 27% of producer price inflation119 – as the bulk of South African goods imports travel via ports, a ports levy implies that almost 27% of domestic producer costs are being artificially inflated by the levy. This must have an impact on the efficiency of local industry. Again, most goods exports travel through the ports, so the ports levy will impact on the competitiveness of South African exports on international markets. Many imports are also intermediate or capital goods, used by firms in the productive sector of the economy. Increasing the expense of these goods inflates producer costs in general and may result in under-investment. All of these trends – lower domestic efficiency, higher prices, reduced export competitiveness and reduced investment – are inconsistent with the programme of higher growth and employment envisaged by ASGI-SA.
119 Statistics South Africa

Prices, Investment and Efficiency on the Railways
A Sectoral Review of Efficiencies in Administered Pricing in South Africa
66
4. Rail reform benchmarks
International benchmarks are often a useful way of testing domestic industry performance. Although country specific cost factors will make any comparison imperfect, it is often still informative to discover whether local outcomes differ markedly from the international norm. The process of selecting the three comparison countries chosen, namely Australia, Brazil and Mexico, is detailed in Appendix 2. In this section, we discuss the results of the benchmarking exercise.
4.1. BENCHMARKING EXERCISE
We benchmark South Africa’s rail performance against Australia, Brazil and Mexico by looking at twelve different metrics in five different benchmarking areas, namely safety, capital efficiency, price competitiveness, productivity and commercial “success.” These metrics are shown in Table 21 below.
Table 21 – Benchmarks selected
Area Benchmarks selected
Safety • Number of accidents per million train kilometres • Railway accident deaths per 100,000 population
Capital efficiency • Ton-km of freight transported by rail (million ton-km) • Million ton-km of freight transported by route km of network • Return on assets
Price competitiveness • Freight price (per net ton-km, local currency units) • Freight price (per net ton-km, US$)
Productivity • % of on-time behaviour of freight movements • Million ton-km per employee
Commercial success • Modal share of the total freight task – tons • Modal share of the total freight task – ton-km • Return on equity
Source: Genesis Analytics
4.1.1. Safety benchmarks
Rail safety is a crucial component of benchmarking, as it reflects whether or not cost and efficiency achievements are taking place against a background of deteriorating safety of service. Alternatively, very high safety standards could artificially inflate cost and thus price. Although the number of South African accidents per million train kilometres is not particularly high, South African railway death statistics are well above the peer group. This is consistent with market reports of underinvestment in the rail network, as poorly maintained infrastructure is also likely to be dangerous infrastructure (although it should be acknowledged that there may be inconsistencies in safety data collection procedures).

Prices, Investment and Efficiency on the Railways
A Sectoral Review of Efficiencies in Administered Pricing in South Africa
67
Table 22 – Safety benchmarks
Australia Brazil Mexico South Africa Number of accidents per million train kilometres
2.3 (1999)120
29.8 (2006)121 Not available 17
(2007)122 Railway accident deaths per 100,000 population
0.15 (2002)123
0.15 (2005)124
0.05 (2005)125
0.42 (2007)126
Source: Various (see footnotes) Note: Year in parentheses indicates year of data. All data is from most recently available year.
4.1.2. Capital efficiency benchmarks
In a high fixed cost industry such as rail, it is important to ensure that the volume of production off a given capital base is high, so as to decrease the per-unit cost of maintaining infrastructure. The first metric we examine is thus the actual volume of production, measured in ton kilometres (ton-km). This is a better measure than the total tons moved, because it incorporates the length of the trip into the measure. As can be seen in Table 23, South Africa’s rail freight task is of a similar size to its comparators. A better measure of capital efficiency is, however, how much freight is moved in proportion to the size of the network. This is illustrated by the second metric in Table 23 (million ton-km of freight transported by route km of network). South Africa compares well to the group, with the second highest utilisation rate.
The third metric, return on assets (ROA), reflects the financial utilisation of capital, and is calculated as net income over total assets. A high ROA is typically seen as a good outcome, as it implies the company is earning more on less investment.127 Again, South Africa’s performance is towards the top end of the comparison group, although the 2006 results are a massive improvement on an ROA of -1.0% in 2005. As price levels affect revenues and profitability, the 2006 result provides some reassurance that price levels are not massively inappropriate.
Measures of return on assets in rail can be corrupted by factors such as once-off injections of subsidies – this is the case in Australia, for example. Further, how one values assets is a highly contested subject in rail, as a range of different methodologies can be employed, each yielding different results. For example, when valuing return on assets for the nationally-owned track in Australia (ARTC) in 2000-01, the Australian Productivity Commission found that if one used book value, ROA was 6.7%, but if one used depreciated optimised replacement cost (DORC) methodology (a more
120 DOTARS. “Rail Accident Costs in Australia.” Pg. 1. 121 ANTT, 2006. 122 Transnet 123 Australian Government 2005, 23. 124 Frieght rail only. ANNT, 2006 and Genesis calculations. 125 North American Transportation Statistics, 2007; Genesis calculations. 126 Transnet 127 For more on ROA , see: http://www.investopedia.com/terms/r/returnonassets.asp

Prices, Investment and Efficiency on the Railways
A Sectoral Review of Efficiencies in Administered Pricing in South Africa
68
complex asset valuation technique typically used by regulators), ROA dropped to 0.92%.128 Thus, ROA is a subjective measure.
Table 23 – Capital efficiency benchmarks
Australia Brazil Mexico South Africa Ton-km of freight transported by rail (million ton-km)
164 436 (2005)129
221 600 (2005)130
54 054 (2005)131
127 000 (2004)132
Million ton-km of freight transported by route km of network
3.44 7.56 2.03 6.34
Return on assets 2.9% (2004-05)133
9.7% (2005)134
4.3% (2005)135
10.1% (2007)136
Source: Various (see footnotes) Note: Year in parentheses indicates year of data. All data is from most recently available year.
The Australian Productivity Commission argues that such low values for ROA could be seen as an implicit subsidy if they “are tolerated by [owners] for long periods of time”.137 This is because the expectation of future subsidies (causing once-off large improvements in ROA) could be factored by owners in their asset investment decisions, and as such, adversely affect efficient performance. As an example of this, the ARTC had a once-off injection of AU$450 million by the Australian government in 2003-04, leading to an ROA of 82.7%.138 The following year, the injection was only AU$100 million in 2004-05 and led to an ROA of 14.2% (and, as seen above, in 2000-01 there was no subsidy, and the ROA was only 6.7%).139
4.1.3. Price competitiveness
Price benchmarking exercises in complex multi-product industries tend to be difficult to execute. Comparing aggregate prices can obscure important differences in the composition of the product mix, whereas comparing prices across separate products can be very time-consuming and ultimately confusing. The South African prices shown below are calculated from a dataset provided by Transnet, and the price metric for the comparison is freight rates per ton-km, a metric which allows the length of the freight journey to be taken into account. Freight prices for items like motor vehicles
128 Australian Productivity Commission 2006, 5.19-5.20. 129 From the Australian Bureau of Statistics website. 130 From the Union Internationale Chemins des Fer database. 131 Anuario Estadistico Ferroviario 2005, Secretaria de Comunicaciones y Transportes 132 CSIR 2005, 17. 133 Australian Productivity Commission 2006, 5.19. 134 Genesis calculations (average value) from MRS Logística S.A. and ALL América Latina Logística S.A. 2005 annual reports. 135 ROA is for Mexican operator Kansas City Southern de Mexico, calculated by Genesis from its SEC Annual Report Form 10-K. 136 2007 Transnet annual report, return on net assets in the rail freight division only 137 Op cit. Australian Productivity Commission 2006, 5.20. 138 Ibid., pg. 5.19. 139 Ibid.

Prices, Investment and Efficiency on the Railways
A Sectoral Review of Efficiencies in Administered Pricing in South Africa
69
and containers, which are not quoted on a per-ton basis, are excluded from the calculation. The calculation thus includes a disproportionate quantity of relatively cheap freight items, such as iron ore, and may thus somewhat understate the true average price.
As shown in Table 24, at 2006 exchange rates South Africa has the second most expensive freight rates of the comparison group. If prices are adjusted for purchasing power parity (‘PPP’) factors,140 South Africa becomes the most expensive rail freight provider in the group. (It should be noted that there is some debate in Australia as to whether their rail freight prices are too low.)
Table 24 – Price competitiveness benchmarks
Australia Brazil Mexico South Africa Freight price (per ton-km, local currency units)
AU$0.0275 (2000-01)141
R$0.0545 (2007)142
MXP0.430143 (2005)
R0.192 (2007)144
US$ freight price (2006 exchange rates, per ton-km)145
US$0.021 US$0.025 US$0.039 US$0.028
PPP-adjusted US$ freight price per ton-km146
US$0.019 US$0.044 US$0.057 US$0.066
Source: Various (see footnotes) Note: Year in parentheses indicates year of data. All data is from most recently available year.
As discussed in section 2.2, pricing structure plays an important role in ensuring that volumes are maximised, and thus average price is not the sole indicator of a good price outcome. The absolute price of South African rail freight is thus not the only consideration which should be taken into account, as there may be problems as regards the relative price structure of underlying products and services.
4.1.4. Productivity benchmarks
To measure productivity, we consider two different benchmarks, namely the percentage of on time behaviour of freight movements and ton-kilometres per
140 Purchasing power parity exchange rates reflect the real purchasing power of a currency, which is influenced by the relative prices of domestic goods, rather than the value attributed to the currency in financial markets. It can thus be argued that PPP values are a more stable and comparable way of evaluating prices from a range of countries. 141 Non-bulk freight only. BTRE. “Freight Measurement and Modelling in Australia.” (2006). Pg. 152. 142 Calculated as the arithmetic average of operator America Latina’s commodity rates, which are quoted in ton-km, over the distance 401-800km. Excludes general cargo and container prices. Downloaded from the ANTT website on 23 March 2007. 143 A numerical average of ton-km tariffs of Kansas City Southern de Mexico. S.A. de C.V., from the SCT website. 144 Genesis calculations, based on a data set supplied by Transnet for 2007, and excluding motor vehicles, petroleum liquids and containers. 145 Exchange rates are from Oando.com. Calculated using 2006 average exchange rates. 146 2005 PPP factors, from World Bank databases.
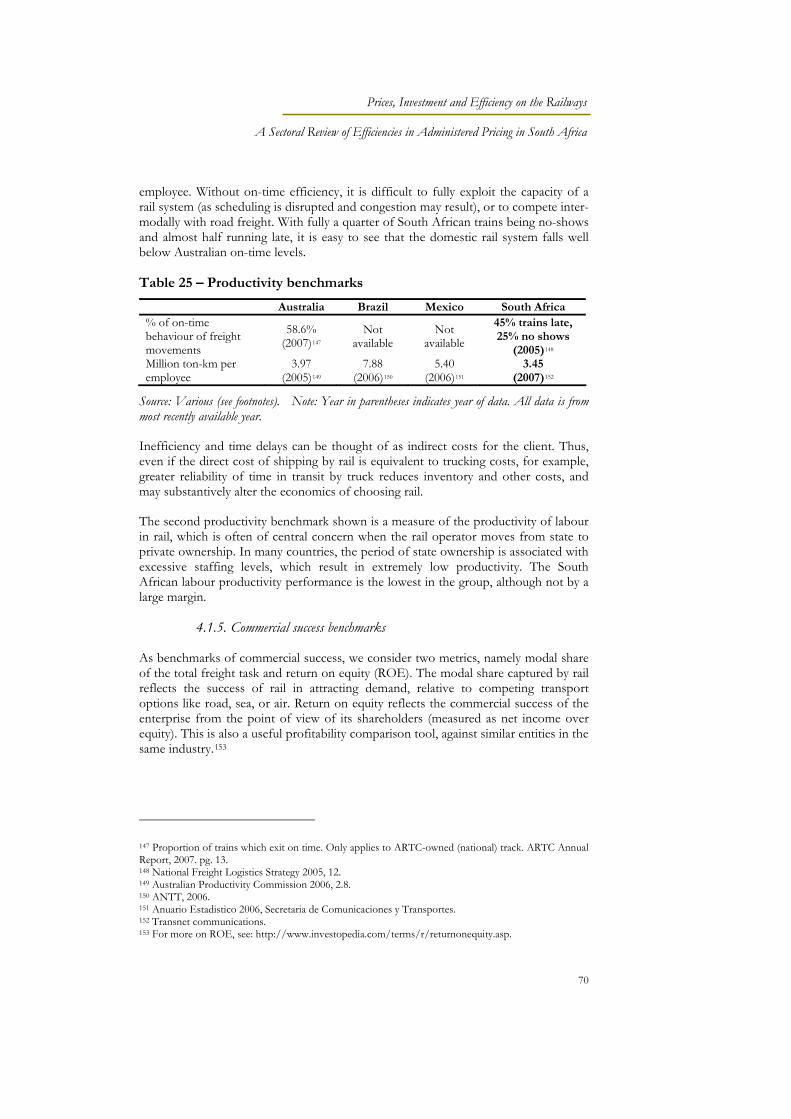
Prices, Investment and Efficiency on the Railways
A Sectoral Review of Efficiencies in Administered Pricing in South Africa
70
employee. Without on-time efficiency, it is difficult to fully exploit the capacity of a rail system (as scheduling is disrupted and congestion may result), or to compete inter-modally with road freight. With fully a quarter of South African trains being no-shows and almost half running late, it is easy to see that the domestic rail system falls well below Australian on-time levels.
Table 25 – Productivity benchmarks
Australia Brazil Mexico South Africa % of on-time behaviour of freight movements
58.6% (2007)147
Not available
Not available
45% trains late, 25% no shows
(2005)148 Million ton-km per employee
3.97 (2005)149
7.88 (2006)150
5.40 (2006)151
3.45 (2007)152
Source: Various (see footnotes). Note: Year in parentheses indicates year of data. All data is from most recently available year.
Inefficiency and time delays can be thought of as indirect costs for the client. Thus, even if the direct cost of shipping by rail is equivalent to trucking costs, for example, greater reliability of time in transit by truck reduces inventory and other costs, and may substantively alter the economics of choosing rail.
The second productivity benchmark shown is a measure of the productivity of labour in rail, which is often of central concern when the rail operator moves from state to private ownership. In many countries, the period of state ownership is associated with excessive staffing levels, which result in extremely low productivity. The South African labour productivity performance is the lowest in the group, although not by a large margin.
4.1.5. Commercial success benchmarks
As benchmarks of commercial success, we consider two metrics, namely modal share of the total freight task and return on equity (ROE). The modal share captured by rail reflects the success of rail in attracting demand, relative to competing transport options like road, sea, or air. Return on equity reflects the commercial success of the enterprise from the point of view of its shareholders (measured as net income over equity). This is also a useful profitability comparison tool, against similar entities in the same industry.153
147 Proportion of trains which exit on time. Only applies to ARTC-owned (national) track. ARTC Annual Report, 2007. pg. 13. 148 National Freight Logistics Strategy 2005, 12. 149 Australian Productivity Commission 2006, 2.8. 150 ANTT, 2006. 151 Anuario Estadistico 2006, Secretaria de Comunicaciones y Transportes. 152 Transnet communications. 153 For more on ROE, see: http://www.investopedia.com/terms/r/returnonequity.asp.
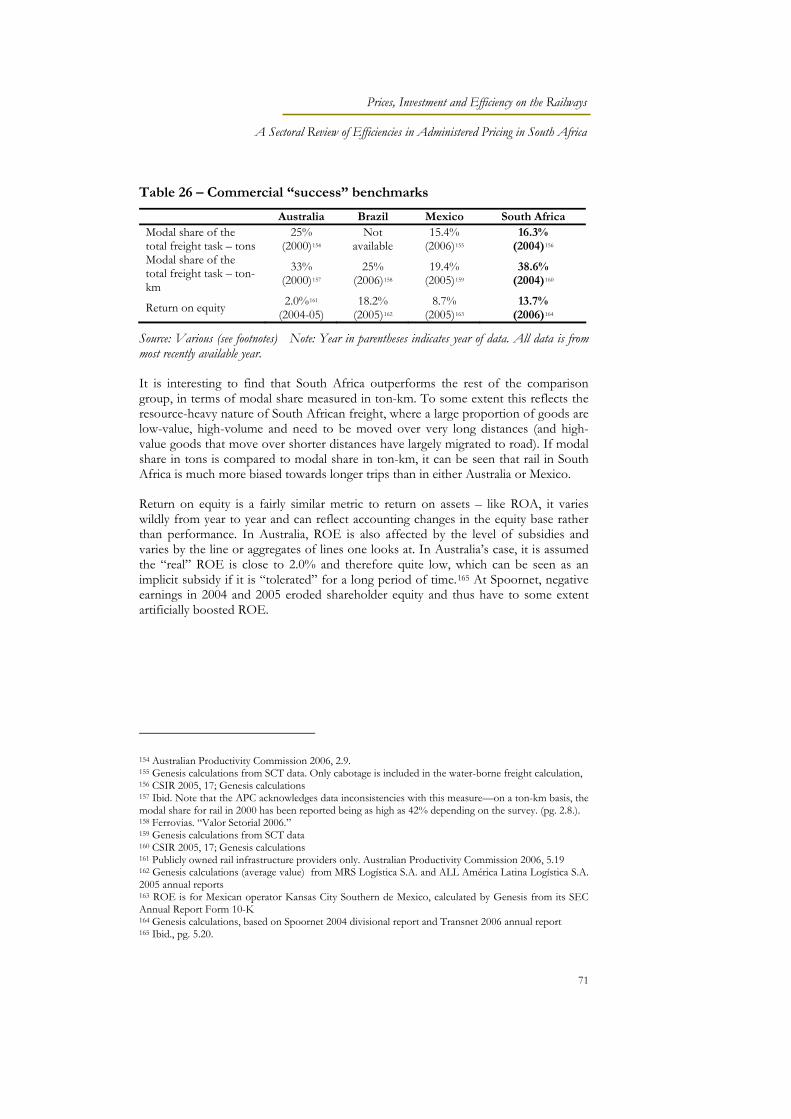
Prices, Investment and Efficiency on the Railways
A Sectoral Review of Efficiencies in Administered Pricing in South Africa
71
Table 26 – Commercial “success” benchmarks
Australia Brazil Mexico South Africa Modal share of the total freight task – tons
25% (2000)154
Not available
15.4% (2006)155
16.3% (2004)156
Modal share of the total freight task – ton-km
33% (2000)157
25% (2006)158
19.4% (2005)159
38.6% (2004)160
Return on equity 2.0%161 (2004-05)
18.2% (2005)162
8.7% (2005)163
13.7% (2006)164
Source: Various (see footnotes) Note: Year in parentheses indicates year of data. All data is from most recently available year.
It is interesting to find that South Africa outperforms the rest of the comparison group, in terms of modal share measured in ton-km. To some extent this reflects the resource-heavy nature of South African freight, where a large proportion of goods are low-value, high-volume and need to be moved over very long distances (and high-value goods that move over shorter distances have largely migrated to road). If modal share in tons is compared to modal share in ton-km, it can be seen that rail in South Africa is much more biased towards longer trips than in either Australia or Mexico.
Return on equity is a fairly similar metric to return on assets – like ROA, it varies wildly from year to year and can reflect accounting changes in the equity base rather than performance. In Australia, ROE is also affected by the level of subsidies and varies by the line or aggregates of lines one looks at. In Australia’s case, it is assumed the “real” ROE is close to 2.0% and therefore quite low, which can be seen as an implicit subsidy if it is “tolerated” for a long period of time.165 At Spoornet, negative earnings in 2004 and 2005 eroded shareholder equity and thus have to some extent artificially boosted ROE.
154 Australian Productivity Commission 2006, 2.9. 155 Genesis calculations from SCT data. Only cabotage is included in the water-borne freight calculation, 156 CSIR 2005, 17; Genesis calculations 157 Ibid. Note that the APC acknowledges data inconsistencies with this measure—on a ton-km basis, the modal share for rail in 2000 has been reported being as high as 42% depending on the survey. (pg. 2.8.). 158 Ferrovias. “Valor Setorial 2006.” 159 Genesis calculations from SCT data 160 CSIR 2005, 17; Genesis calculations 161 Publicly owned rail infrastructure providers only. Australian Productivity Commission 2006, 5.19 162 Genesis calculations (average value) from MRS Logística S.A. and ALL América Latina Logística S.A. 2005 annual reports 163 ROE is for Mexican operator Kansas City Southern de Mexico, calculated by Genesis from its SEC Annual Report Form 10-K 164 Genesis calculations, based on Spoornet 2004 divisional report and Transnet 2006 annual report 165 Ibid., pg. 5.20.

Prices, Investment and Efficiency on the Railways
A Sectoral Review of Efficiencies in Administered Pricing in South Africa
72
4.1.6. Overall benchmark performance
South African rail performance is summarised in Table 27 below. Three results in particular stand out, and warrant further investigation. The first two, namely high accident mortality rates and very low levels of on-time behaviour, may be caused by similar issues around operational efficiency and the backlog in rail equipment and infrastructure investment. Anecdotal evidence on the issues with rail service levels, which include poor on-time performance, is presented in Appendix 7. Poor service increases the indirect cost of rail to customers and erodes the competitive position of rail as compared to other modes of transport.
Table 27 – Summary of benchmark performance
Area Benchmarks selected Safety High mortality rates Capital efficiency Upper end of comparison group
Price competitiveness Within the comparison range on a US$ basis, but most expensive on a PPP basis
Productivity Reasonable employee productivity, but very poor % on-time behaviour
Commercial success Within the comparison range
Source: Genesis Analytics
The third significant result is on average price levels. As discussed, despite the fact that the price shown may be an under-estimation of true average rail freight prices, South African prices do not perform particularly well. Once purchasing power parity adjustments are made, it is clear that South Africa has the least affordable rail freight of the comparison group. When coupled with very low service levels, these price levels may be sufficient to drive significant shifts to other modes of freight transportation. In addition, average price levels may mask issues as regards the relative structure of prices, and thus the inter-model competitiveness of rail freight may be further eroded.

Prices, Investment and Efficiency on the Railways
A Sectoral Review of Efficiencies in Administered Pricing in South Africa
73
5. Price formation in benchmark countries
Market structures, and thus price formation processes, are quite different in the three comparison countries. The history and market structure of Australia, Brazil and Mexico are detailed in Appendix 3 through Appendix 6. This chapter draws out the key differences in price formation processes in each market and highlights the lessons for South Africa.
5.1. AUSTRALIA
The Australian rail network was designed to link key coastal towns to the surrounding region and thus is essentially a series of state-focused networks. Sector restructuring undertaken in the 1990s did not substantially reduce the state-specific nature of the system. The modern Australian rail system thus exhibits a wide range of operational and structural characteristics, and includes vertically separated, vertically integrated, horizontally separated, horizontally integrated, fully privatized, commercialised and non-commercialised entities.
Price formation processes differ by region, in line with these operational differences. In some states, a number of competing operators are in existence and some commercial price discipline is possible, while in others, the operator is a monopoly and faces only inter-modal price discipline. If the operator is publicly owned, prices may also be influenced by policy objectives.
Track access is coordinated in a heterogeneous way. In Victoria, Western Australia, New South Wales and Queensland, there is a state body which owns track infrastructure in the state. That body then leases track out to operators, who may be government or privately owned and may offer only below-track services (that is, they only offer access to above-track operators and do nothing more), or may provide vertically integrated below- and above-track services.
Despite this heterogeneity, a number of common themes can be identified. With the exception of Tasmania, rail track infrastructure is owned by the government, and with the exception of Queensland, above-track operations involve some form of private sector participation. Within-state horizontal separation is preferred over horizontal integration, while vertical integration is preferred to vertical separation.
In all cases, the state provides an access pricing regime so that above-track operators can (in theory) also compete for access to public lines. Such access regimes both allow competitors into the market and help to facilitate network inter-connections. Where government entities remain in operation, effort has been made to impose commercial discipline, either via commercialisation or privatisation. It should be noted, however,
Prices, Investment and Efficiency on the Railways
A Sectoral Review of Efficiencies in Administered Pricing in South Africa
74
that even where entities are commercialised or privatised, they may still receive subsidies.166
5.1.1. Access regulation
Except for Tasmania and the Northern Territory, each state in Australia has at least one specified body charged with the duties of a rail infrastructure access regulator. There is also a commonwealth-wide regulator for those states where the access regulator has no jurisdiction on interstate traffic. The wide array of regulators leads to inconsistencies “in relation to rules for negotiation, arbitration, pricing and the scope of the infrastructure to which it applies”.167
Access pricing principles
The 1974 Trade Practices Act obligates public and private infrastructure access providers to offer competitive rates, under a “negotiate/arbitrate” system. The Act does not however set out guidelines on how to determine pricing levels.168 Most rail access pricing regimes follow a “floor-ceiling” model, where negotiations on price take place in a band between the floor price (equal to incremental cost, or the cost of providing access) and the stand-alone cost (“the cost if the system delivered only the service sought by the access seeker”).169 However, how these two prices are exactly calculated varies from state to state.
“Subject to reasonable conditions,” the Trade Practices Act “establishes a legally enforceable right for any person to share access to the services provided by rail infrastructure,” and sets down three “pathways” for those “seeking access”:170
Declaration: any party needing interstate service can negotiate “terms and conditions of access” with the service provider. If the negotiations fail, the Australian Competition and Consumer Commission (ACCC) will arbitrate.
State-based regimes: the “Declaration” option typically fails because of the presence of State-based access regimes, which trump declarations so long as there is an “effective” access regime in the state.
Voluntary undertaking: the Australian Competition and Consumer Commission can also approve the terms and conditions for access set by the “voluntary undertakings” of access providers.
An operator needing track access normally uses the relevant state or commonwealth access regime, while interstate access is governed by voluntary undertakings.
166 Australian Productivity Commission 2006, 7.7. 167 Affleck Consulting 2003, 18. 168 Affleck Consulting 2003, 25; and Australian Productivity Commission 2001, 321. 169 Australian Productivity Commission 2001, 321. 170 Affleck Consulting 2003, 25.

Prices, Investment and Efficiency on the Railways
A Sectoral Review of Efficiencies in Administered Pricing in South Africa
75
Summary of access pricing regimes in Australia
A number of commonalities between the various state and national regimes can be identified. With the exception of Victoria, rail regulators mandate that access negotiations can only take place once floor and ceiling prices have been set and that the final price decided on must fall between these bounds. The ceiling price is typically defined as the stand-alone cost of providing the service, while the floor price is some form of variable cost calculation. This is very much in line with the Ramsey pricing price boundaries discussed in the section on price limits above (see section 2).
Within the price boundaries, the operators and track owners often have substantial room to set prices in accordance with demand conditions. For example, in Queensland, operators which are able to carry higher prices, because of the demand conditions in the markets they service, are required to carry a higher proportion of common costs. This is seen as efficiency enhancing. Again, this is in line with Ramsey theory.
In Victoria, the pricing framework is slightly different, in that reference prices are explicitly designed so that total revenue raised is “consistent with the full recovery of efficient costs”. This provides far less leeway for price negotiation and discrimination. This is thus the region in which Australian rail pricing methodology differs most from Ramsey techniques.
Australian rail access pricing in reality
Much of the Australian rail system fails to make economic returns and is sustained by subsidisation. Despite rail commercialisation, research suggests that rail “prices fall well short of the economic costs as assessed by regulators… in practice, there appear to be substantial injections of public funds to major rail corridors and some regional lines, with no expectation of recovery”.171 There is concern that “government financial contributions allow access charges to be set below the economic costs of providing freight services on major corridors”.172
Part of the problem is that while “rail infrastructure regulatory regimes require that infrastructure charges relate to the costs incurred… there remains a need to establish the relationship between the level and nature of the infrastructure use and the costs directly incurred as a result”.173 For example, there is no consensus on how to value assets, what rates of return to use and how to properly allocate costs incurred via measures such as gross ton-kms and train length. An EU study found that such differing methodologies (at least on the EU rail system) can lead to variations in marginal cost by as much as a factor of 20,174 which can substantially affect the accuracy of profit calculations.
171 Australian Productivity Commission 2006, xxxv. 172 Australian Productivity Commission 2006, xxxvi. 173 Australian Productivity Commission 2006, 5.3. 174 Australian Productivity Commission 2006, 5.4.

Prices, Investment and Efficiency on the Railways
A Sectoral Review of Efficiencies in Administered Pricing in South Africa
76
Non-bulk freight rates in Australia have dropped substantially over time. Since 1984 in particular, rail freight rates have approximately halved, while road rates remain essentially flat; nonetheless, non-bulk freight remains dominated by road, so the impact of these subsidies on the non-bulk freight market’s competitive environment is questionable.175 When road rates have risen, rail has responded not by increasing its own tariffs, but by expanding output – which may reflect the manner in which volume based subsidies can damage commercial incentives.
Access pricing regimes can also worsen pricing outcomes. Access prices are offered in order to allow third parties to offer rail services and thus introduce competition into the market. However, many non-bulk freight lines already experience tough inter-modal competition from road. As demand for non-bulk rail freight may be very low when road is available, the availability of subsidies may trigger a race to the bottom by rail operators, which ultimately may hurt the long-term viability of operators on these non-bulk rail lines. Indeed, the Productivity Commission has gone so far as to say that “there is scope to wind back access regulations where vertically separated below-rail operators face strong competition from road”.176
Low prices are typically not a problem on intrastate rail carrying bulk commodities, such as coal; in Queensland, for example, 90% of the freight carried is coal, and the ceiling price is often attained.177 This bifurcation has led to some cross-subsidisation where horizontal separation has not been achieved (such as might be occurring in horizontally and vertically integrated Queensland).178
5.2. BRAZIL
The Brazilian rail system is concentrated in only three states.179 As a result, long distance rail services are extremely limited. About 85% of the goods handled by the system are destined for export. The Brazilian rail model is vertically integrated and horizontally separated, with the three largest concessionaires controlling just over 69% of concessioned track in Brazil (a further nine concessionaires control the remaining network). The operational structure of the industry thus allows some commercial discipline on prices.
The current Brazilian market structure was largely determined during a restructuring period in the 1990s. The objectives of the restructuring were as follows:180
Administrative decentralisation from the federal to the state level, and from the states to the municipalities.
Reduction in the participation of the public sector in productive activities and basic infrastructure investments, and a corresponding increase in private participation.
175 Australian Productivity Commission 2006, xxxvii-xxxviii. 176 Australian Productivity Commission 2006, xlvi. 177 Australian Productivity Commission 2006, 5.16. 178 Australian Productivity Commission 2006, 5.17. 179 Datamonitor (2006) pg 12. 180 De Castro 2004, pg 2.

Prices, Investment and Efficiency on the Railways
A Sectoral Review of Efficiencies in Administered Pricing in South Africa
77
Restructuring of economic regulation, in order to open markets to service competition.
Several options were considered for restructuring the rail sector before policy makers settled on horizontal separation by geography. Operational separation was accomplished between 1996 and 1998; and six vertically integrated regional monopolies were created. Concessions on these monopolies were then auctioned off to private operators through public competitive bidding. The auction process thus allowed the government to create competition for the market. Vertical integration was accomplished by giving concessionaires rights to operate and manage infrastructure, while the state retained ownership of infrastructure. Operating assets were simultaneously leased to concessionaires. Two specialised mining railroads were privatised as part of conglomerate CVRD – they operate as internal departments of CVRD, specialising in iron ore traffic, and have an obligation to carry traffic for other shippers as requested.
There were no pre-qualification requirements for candidates bidding for concessions. There were also no restrictions imposed for cross participation in different concessions, or on the participation of major rail users, clients or suppliers as shareholders in concessions. In practice, this failure to restrict concession ownership proved problematic: in particular, captive shipper behaviour has been observed at some concessionaires, who have charged associated companies (i.e. affiliates and shareholders), lower rates than unaffiliated shippers. As a rail regulator was only introduced five years subsequent to the restructuring, there was initially no mechanism for inhibiting these kinds of behaviours at concessionaires. There was thus inadequate recognition of the fact that a concession gives an operator a monopolistic power that needs to be controlled.
Cross-participation between concessions was also allowed. A number of vertically integrated structures arose, with propensities to carry out strategic behaviours in terms of price discrimination, blocked access, or limitation of services to other users. Currently, the majority of the rail concessions are held by three groups, and thus concentration levels are higher than may originally have been expected.
5.2.1. Regulation and pricing
In the first five years after the restructuring process, the Brazilian rail sector operated without a regulator. However, since June 2001 the regulation of the rail sector has been under the responsibility of Agência Nacioanal de Transportes Terrestres (ANTT). ANTT is a separate regulatory entity whose main goal is to supervise the concessionaires’ performance. ANTT’s broad mandate is to regulate the services offered by the concessionaires and to regulate the use of railway infrastructure concessioned to private operators. Authority to limit anti-competitive behaviours is shared with separate competition authorities. Where price discrimination is alleged, but the allegation does not involve tariffs regulated by ANTT, Conselho Administrativo

Prices, Investment and Efficiency on the Railways
A Sectoral Review of Efficiencies in Administered Pricing in South Africa
78
de Defesa Econômica (CADE), the competition authority under the Ministry of Justice, has prime jurisdiction.181
The concessionaires are allowed to set their own prices, in terms of pricing guidelines outlined on the concession contracts. The concession contracts stipulate that tariffs may be distance related and may include payments for extra services such as loading and unloading. The contracts also set maximum prices (cap prices) that can be charged for transport services, which vary according to the length182 of the haul, type of product and the geographic region served. The initial cap prices were based on the prices in force during the pre-restructuring period. The cap prices are adjusted periodically for inflation, to enable the concessionaires to make a profit, or to maintain an economic equilibrium.
The adjustment of cap prices is done by ANTT in consultation with the concessionaires. ANTT carries out economic studies on the risk profile, cost structure and profitability of each concessionaire. The concession contracts further stipulate that tariffs should always be above long run variable cost. However, no methodology is provided in the concession contract for the calculation of long run variable costs.
With regards to third party access, the contracts include fairly brief provisions on access rules to other networks, which do not define access pricing mechanisms. This was in part due to the fact that there was little cross-concession traffic in the pre-restructuring network, due to differences in distances and gauges of regional networks. Furthermore, traditional cargoes were only transported in the east-west direction i.e. from inland to the ports.
As it currently stands, interested parties are expected to independently reach agreement on third party access issues. If consensus cannot be reached, the government, through the Ministry of Transport, will review the problem and has the power to enforce compulsory rates. The concessionaires are also expected to carry joint traffic or, if joint traffic is not feasible, to allow the connecting railway access to their tracks so that the movement of goods can be completed. The tariffs for joint traffic again are to be set by negotiation, with the government to step in if negotiations fail. This mechanism does not recognise the potential for abuses of market power.
The later experience of Brazilian rail suggests that third party access issues and cross-concession traffic were not adequately addressed at concessioning. In particular, initial regulatory arrangements were not adequate to deal with changes in freight movement patterns. The east-west traffic pattern shifted, as new products and in particular final goods and semi-processed commodities created more north-south traffic, and the ability to ship goods across several concession areas became increasingly important. The existing contract provisions proved unequal to the task, and by 1999, complaints about access tariffs were common among the carriers.183 However, as a whole the
181 OECD 2005, pg. 89. 182 There are four distance bands i.e. 0-400km, 401-800km, 801-1600km and 1601km and above. 183 Campos 2001, pg. 89.

Prices, Investment and Efficiency on the Railways
A Sectoral Review of Efficiencies in Administered Pricing in South Africa
79
privatisation process is viewed as successful – for example, the Treasury currently receives R$400m per year in tax collections and licence fees from the concessionaires,184 which contrasts strongly with the annual R$350m subsidy burden of the rails prior to restructuring.
5.3. MEXICO
Approximately 85% of the Mexican railway system has been concessioned to private operators. The two largest freight operators control just over 73% of concessioned rail track – the system thus displays levels of concentration sufficient to inhibit competitive discipline on price levels. Container cargo is a much more important component of Mexican rail traffic than in South Africa, or indeed the other comparison countries selected. Another key difference in Mexico is the existence of an important neighbouring trade partner, namely the USA, with road and rail-based export and import routes.
Restructuring of the Mexican rail SOE began in the 1990s, when constitutional provisions that declared railway transport as an activity exclusive to the State were amended and a railway regulation law setting out the terms for concessioning was passed. The scheme chosen for privatisation in Mexico involved geographical separation of rail assets and operations, so as to set up a number of competing route-based companies.185
Each of the concession companies was awarded a 50 year concession title, with the option to extend up to an additional 50 years. The concessionaires were allowed to operate, exploit and if required, build new lines, with the aim of providing public railway transportation and ancillary services in their respective titles. The Mexico City Rail Terminal, Terminal Ferroviaria Valle de México, is a key component of rail infrastructure, as Mexico City is a very important freight destination, and the terminal is a shared piece of infrastructure for the various competing rail systems servicing the capital. The terminal was privatised in 1996 and started operations in March 1998. It is currently a jointly operated switch area and each of the main rail operators owns 25% of the shares, with the government retaining the remaining 25%.
5.3.1. Regulation and pricing
The regulatory body in the Mexican rail sector, the Dirección General de Tarifas (‘DGT’) is responsible for supervising the activities of the concessions, devising industry policy, regulating prices and acting as an arbiter in case of conflict among concessionaires. Unlike in Brazil, in Mexico the regulatory body does not set maximum prices. However, concessionaires are required by law to register a maximum price with DGT ten days before it goes into effect.186
184 ANTT (2006). Op.cit., p.g. 3. 185 Sharp, op cit, p.g. 23. 186 Allen 2001.

Prices, Investment and Efficiency on the Railways
A Sectoral Review of Efficiencies in Administered Pricing in South Africa
80
The concession titles allow the concessionaires to set their own prices in recognition of the extensive competition they face from trucks and the potential for competition among the concessions. The DGT, after consultation with the competition agency, can intervene if no effective competition exists between concessionaires. It can also intervene if shippers complain of market abuse by the concessionaires.
To avoid market power abuses that could arise from this monopoly, concession titles included mandatory access and connecting rights between concessionaires. The prices of these rights were to be bilaterally negotiated between private operators, and DGT would intervene if no agreement could be reached between concerned parties.
Unlike Brazil, Mexico paid considerable attention to protecting competition in designing its concessions. The competition commission participated actively in the restructuring process and the development of the regulatory framework, to prevent potential competition issues. Comision Federal de Competencia (CFC), the competition agency, screened bidders for issues potentially harmful to competition. In contrast to Brazil, particular care was taken to avoid cross holding and cross-subsidisation between the new owners of regional lines. CFC in conjunction with the sectoral authorities decided that main line concessionaires would not be able to hold more than 5% of any other main line company.187
5.4. LESSONS FOR SOUTH AFRICA
All three of the comparison countries have chosen to undertake some form of rail restructuring, and for all three of them, that restructuring has included private participation in above-track operations. This is perhaps one of the strongest lessons for South Africa – the SOE model in rail, where the state monopolises the provision of services, is largely defunct in the international arena.
Despite the introduction of some competition in their rail sectors, all three countries have also introduced some price regulation. This price regulation has typically taken a form that strongly resembles Ramsey pricing – in Australia and Brazil in particular, the introduction of upper and lower bounds to price conforms to Ramsey principals of keeping within the boundaries of stand-alone cost and variable pricing.
A key driver of the need for price regulation seems to have been the recognition that there is potential for abuse of market power in an unregulated rail sector. Even when care is taken to construct markets that are conducive to price competition (as seen in Mexico), control over crucial parts of the network (such as the Mexico City terminal) can create market power. It is thus important to involve competition authorities in the restructuring process and to provide competitive safeguards, including price regulation, when introducing competitive forces into price setting.
In the comparison countries, there seems to be a slight bias towards vertical integration of track and above-track operations. Even where government keeps ownership of track, use of track seems to be made available on a lease basis, rather than on an access pricing
187 Campos 2002. pg 16.

Prices, Investment and Efficiency on the Railways
A Sectoral Review of Efficiencies in Administered Pricing in South Africa
81
basis. The operator which leases the track then operates under an access pricing obligation for third parties – this structure helps to ensure that the externalities of track abuse accrue to its principal user, but that control of track does not simultaneously become a major impediment to the introduction of competition.
All three of the comparison countries directly subsidised rail operations in the pre-restructuring period (and in the case of Australia, afterwards as well). None of them made use of cross-subsidies from non-rail operations to rail operations. The cross-subsidisation of rail by ports within the Transnet group is thus not best practice internationally.

Prices, Investment and Efficiency on the Railways
A Sectoral Review of Efficiencies in Administered Pricing in South Africa
82
6. Findings and recommendations
The bulk of the evidence collected during the drafting of this report suggested that Transnet pricing moved away from a consideration of customer demand characteristics, during the early 2000s. The price data that was available to the team was consistent with centralized price-setting procedures, based more rigorously on cost estimates – in other words, a form of fully distributed cost pricing. However, when Transnet began to participate in the research process, their contention was that the form of pricing used by freight rail is CMP, which does take customer demand characteristics into account. Given the conflicting evidence, we suggest that it is highly probable that the implementation of CMP is far from universal. Additional attention is needed on freight rail prices, in order to ensure that demand-based (Ramsey) pricing techniques are being adequately implemented.
Within a Ramsey pricing framework, it is not problematic if services produced off the same shared-cost platform do not carry the costs of that platform proportionally. This form of cross-subsidisation is thus not problematic (and indeed, can be efficiency enhancing). However, cross subsidisation from ports to rail within Transnet decreases technical efficiency incentives, increases the cost of importing and exporting and impacts on the ability of the economy to reach ASGI-SA goals. We regard the ‘ports levy’ as, in effect, a poorly designed piece of indirect taxation, which urgently needs to be lifted. If Spoornet requires subsidisation, we recommend that such subsidies flow directly from the budget of the National Treasury and be open to interrogation by the electorate.
Very little has been done to date to fine-tune the market structure of the domestic rail industry. All significant portions of the network are still incorporated in the vertically and horizontally integrated Spoornet structure, with internal restructuring efforts focused instead on improving the performance of Spoornet. However, there is as yet little tangible evidence of an improvement in Spoornet performance – instead, interviews with market participants suggest that rail service quality has in fact decreased over the last few years, while prices have increased sharply. We therefore suggest that structural alternatives should be considered further in the rail market.
An appropriate structure for South African rail must suit the needs of industry and the broader South African economy. It is nevertheless a challenge to determine a clear and consistent set of policy goals. In a study of the Australian rail reform effort, Owens offers a three-step approach to rail reform:188
Identify the objectives of the reform: the key goals of a reform will differ according to the policy priorities identified. For example, the key goal may be to improve total transport efficiency, with rail efficiency being a secondary goal; alternatively, raising revenue from privatisation may be seen as important; or
188 Owens 2003, 14.

Prices, Investment and Efficiency on the Railways
A Sectoral Review of Efficiencies in Administered Pricing in South Africa
83
increasing the level of rail service availability. Understanding the end-objective informs how much reform is needed and in which areas.189
Understand the characteristics of the rail network in question: the choice of market structure depends heavily on the technical characteristics and market power of the firms involved. To that end, data on the type of goods transported, the level of inter-modal competition, current cost and profit levels, network complexity, traffic density and inter-network “interfacing” must inform the regulatory decision.190
Decide what type of competition is appropriate given the objectives of the reform and the characteristics of the rail network. For example, if the service offered is a natural monopoly, competition “for the market,” via an auction of franchise or concession rights, may be optimal. Alternatively, if competition is feasible from a technical efficiency perspective, competition “in the market” with several operators can be cost effective. Horizontal or vertical separation may then be optimal.191
A crucial component of the policy process should be the involvement of the competition authorities – rail policy at present does not thoroughly address the competitive nature of the market, which will be crucial if changes to market structure are to be considered (as a properly designed market structure will minimise the scope of anti-competitive action). Finally, if any private sector participation is introduced, regulation of access prices will become necessary and setting up such a regulator properly will require appropriate resourcing and a thorough legal framework.
It should be highlighted, however, that Spoornet has already been detrimentally affected by repeated restructurings and uncertainty. It is particularly difficult to retain skilled staff in an atmosphere of impending change and the impact of this on quality of service has been substantial. We would therefore recommend extensive research and planning before moving to any implementation – the potential costs of restructuring are large and there must be a clear understanding of the costs and benefits involved before proceeding.
A key complication of this research process was the paucity of data on the sector. Transnet’s participation in the research process was essentially voluntary – despite early requests for cooperation from several government departments, including the Department of Public Enterprises (acting as the sole shareholder of Transnet), the company delayed cooperation for almost a full year, only participating after a final draft had been circulated. Access to basic information in respect of rail pricing is extremely opaque, and it does not seem that information on the sector is regularly and reliably available, even to government.
Many industries are characterised by information asymmetry – owners and/or regulators struggle to understand a business as thoroughly as does its management team, and thus also struggle to interpret and guide the performance of that
189 Owens 2003, 14. 190 Owens 2003, 15-16. 191 Owens 2003, 16-17.

Prices, Investment and Efficiency on the Railways
A Sectoral Review of Efficiencies in Administered Pricing in South Africa
84
management team. Good data is of particular importance if major initiatives are being contemplated. It is thus essential that more data on the operation of the sector be made available to the shareholder and regulator of Transnet at the very least – particular areas of focus should include the relative structure of prices, the basis on which line profitability is calculated, and customer service metrics. A good initial step would be to reintroduce a publicly available annual divisional report for Spoornet, which was discontinued in 2004.
The lack of information available to government, as well as clients and other stakeholders, inhibits the ability to ensure that rail services are run in the public interest and has significantly reduced government’s ability to ensure that Transnet is an effective policy instrument. Transnet’s current pro-active management may seem to make this a less pressing concern, but for long-run success a proper institutional, market and regulatory framework needs to be established for this critical part of the country’s infrastructure.

Prices, Investment and Efficiency on the Railways
A Sectoral Review of Efficiencies in Administered Pricing in South Africa
85
Bibliography
Affleck Consulting Pty Ltd. January 2003. The Australian Rail Industry: Overview and Issues. Available from the Australian National Road Transport Commission, www.nrtc.gov.au
Allen, R.A. 2001. The Structure and Regulation of the Mexican Railroad Industry at the beginning of the 21st century. Paper Presented at the 34th Transportation Law Institute, San Antonio, Texas, October 22.
Audige, M. 2006. Turkish Railway Restructuring Program. Presentation for the ‘Transport Forum and Learning Week’ symposium at the World Bank.
Australian Government Bureau of Transport and Regional Economics, June 2005. Australian Transport Statistics.
Australian Productivity Commission. 1999. Progress in Rail Reform, Inquiry report no. 6. AusInfo, Canberra.
Australian Productivity Commission. 2001. Review of the National Access Regime. Report no. 17, AusInfo, Canberra.
Australian Productivity Commission. 2006. Road and Rail Freight Infrastructure Pricing. Discussion draft, available at www.pc.gov.au.
Australian Rail Track Corporation Limited (ARTC). May 2002. Access Undertaking in favour of the Australian Competition and Consumer Commission.
Australian Rail Track Corporation Limited (ARTC). 2007. Annual Report 2006/07. Available from http://www.artc.com.au
Australian Transport Safety Bureau, February 2004. Railway Accident Fatalities: Australia Compared with other OECD Countries, 1980-1999. Available from http://www.atsb.gov.au/publications/2004/pdf/Rail_Fat_1.pdf
Banks, R.L. and Associates, Inc. 2001. North American Rail Restructuring and Implications for Merger Policy. A Paper Prepared for the Canada Transportation Act Review Rail Symposium, Winnipeg, February 27.
Bolat, S. September 2006. Presentation on the TCDD. Presentation to the Ministry of Transport (Turkey).
Böllhoff, D. May 2005. Developments in Regulatory Regimes – An Anglo-German Comparison on Telecommunications, Energy and Rail. Gemeinschaftsgüter: Recht, Politik und Ökonomie, Preprints aus der Max-Planck-Projektgruppe Recht der Gemeinschaftsgüter, Bonn.

Prices, Investment and Efficiency on the Railways
A Sectoral Review of Efficiencies in Administered Pricing in South Africa
86
Botes, FJ. December 2005. Impact of Transport Pricing practices in South Africa on Freight Transport Costs. Second draft, available from the HSRC.
Briginshaw, D. 2005. Rail revival in Brazil. International Railway Journal
Bureau of Transport and Regional Economics (BTRE). 2006. Freight Measurement and Modelling in Australia. Report 112, available from http://www.btre.gov.au.
Bureau of Transport and Regional Economics (BTRE). 2007. Australian rail freight performance indicators 2005–06. Information Paper 59, available from http://www.btre.gov.au.
Campos, J. & Cantos, P. 1999. Rail Transport Regulation. World Bank Working Paper 2064.
Campos, J. 2001. Lessons from Railway Reforms in Brazil and Mexico. Transport Policy (8): 85-95.
Campos, J. 2002. Competition Issues in Network Industries: The Latin American Railway Experience. Brazilian Electronic Journal of Economics Vol. 5(1).
Campos, J. & Jimenez, J. 2003. Evaluating Rail Reform in Latin America: Competition and Investment Effects. 1st Conference on Railroad Industry Structure, Competition and Investment, Toulouse 7-8 November.
Cazzaniga Francesetti, D. & Foschi, A. D. November 2002. Mediterranean versus Northern Range Ports. Why do Italian containers still prefer routing via the Northern Range Ports? Advice for a new policy. IAME 2002 - Annual Congress – Panama. Available from http://papers.ssrn.com/sol3/papers.cfm?abstract_id=385142
Chong, A. & De Silanes, F.L. 2004. Privatisation in Mexico. Inter-American Development Bank, Washington D.C.
Correa, P.G. February 14-15 2005. Brazil Programmatic Loan for Sustainable and Equitable Growth. Development Policy Lending (DPL) Course, Results Focus in DPL, Washington DC.
Council of Australian Governments. 1995. Competition Principles Agreement between the Commonwealth of Australia; the State of New South Wales; the State of Victoria; the State of Queensland; the State of Western Australia; the State of South Australia; the State of Tasmania; the Australian Capital Territory; and the Northern Territory of Australia.
CSIR. 2004. First Annual State of Logistics Survey for South Africa. Available from http://www.csir.co.za/be/SOL2004.pdf
CSIR. 2005. Second Annual State of Logistics Survey for South Africa. Available from http://www.csir.co.za/be/SOL2005.pdf
Datamonitor, 2006. Rail and Road in Brazil: Industry Profile. Available from www.datamonitor.com

Prices, Investment and Efficiency on the Railways
A Sectoral Review of Efficiencies in Administered Pricing in South Africa
87
De Castro, N. 1999. Privatisation of the transportation sector in Brazil. Available from http://www.brasilemb.org/trade_investment/Ensa10.pdf
De Castro, N. 2002. Estratura, Desempenho e Prespectivas do Transporte Ferroviário de Carga. Available from http://ssrn.com/abstract=614162
de Castro, N. August 2004. Logistic Costs and Brazilian Regional Development. Nucleo de Estudos e Modelos Espaciais Sistemicos Working Paper No. NXXL. Available from http://papers.ssrn.com/sol3/papers.cfm?abstract_id=614162
Department of Transport. 1998. Moving South Africa. Available from http://www.transport.gov.za/projects/msa/msareport/msa_final_report.zip
Department of Transport. 2006. From Cape Gauge To International Gauge - A Policy Heritage for Our National Future and Our Children. A Discussion Document of the Department of Transport, forming a component of the National Transport Master Plan.
Essential Services Commission of South Australia. October 2006. South Australian Rail Access Regime. www.escosa.sa.gov.au.
Essential Services Commission of South Australia. May 2006. Ministerial Review of the Australasia Railway (Third Party Access) Code. Final Report. www.escosa.sa.gov.au.
Essential Services Commission. January 2006. Victorian Rail Access Regime – Rail Access Pricing Guideline. Version 1.0. www.esc.vic.gov.au.
Estache, A. 2006. Africa’s infrastructure: challenges and opportunities. Paper presented at the high-level seminar: Realizing the Potential for Profitable Investment in Africa Organized by the IMF Institute and the Joint Africa Institute Tunis, Tunisia, February 28 – March 1, 2006.
Estache, A., Carbajo, J. C. & de Rus, G. November 1999. Argentina’s Transport Privatization and Re-Regulation: Ups and Downs of a Daring Decade-Long Experience. World Bank Policy Research Working Paper Series number 2249.
Estache, A., De Azevedo, J. & Sydenstricker, E. 2000. Labour Redundancy, Retraining and Outplacement during Privatisation: The Experience of Brazil’s Federal Railway. World Bank Policy Research Working Paper No. 2460.
Estache, A., Goldstein, A. & Pittman, R. 2001. Privatization and Regulatory Reform in Brazil: The Case of Freight Railways. Available from http://www1.oecd.org/dev/ENGLISH/NEW/documents/Goldstein-Railways.pdf
Estache, A. González, M. & Trujillo, L. 2002. What does “privatisation” do for efficiency? Evidence from Argentina’s and Brazil’s railways. World Development, Vol. 30 (11).
Estache, A., Perelman, S. & Trujillo, L. February 2005. Infrastructure Performance and Reform in Developing and Transition Economies: Evidence from a Survey of Productivity Measures. World Bank Policy Research Working Paper 3514.

Prices, Investment and Efficiency on the Railways
A Sectoral Review of Efficiencies in Administered Pricing in South Africa
88
Fay, M. November 1999. Financing the Future: Infrastructure Needs in Latin America, 2000-05. World Bank Policy Research Working Paper No. 2545.
Flicker, D.W. 2000. Canada-United States Railway Economic Regulation Comparison. Research conducted for the Canada Transportation Act Review, available from http://www.reviewcta-examenltc.gc.ca/CTAReview/CTAReview/english/reports/flicker.pdf
Héritier, A. October 2002. Public Interest Services Revisited. Gemeinschaftsgüter: Recht, Politik und Ökonomie, Preprints aus der Max-Planck-Projektgruppe Recht der Gemeinschaftsgüter, Bonn. Available from http://ssrn.com/abstract_id=324281
Independent Pricing and Regulatory Tribunal of New South Wales. 28 April 1999. Aspects of the NSW Rail Access Regime. Final Report. Review Report No 99-4
Independent Pricing and Regulatory Tribunal of New South Wales. November 2006. NSW Rail Access Undertaking Annual Review of Compliance – IPART Guidelines. Version 1.0.
Ivaldi, M. & McCullough, G.J. 2004. Subadditivity Tests for Network Separation with an Application to U.S. Railroads. Available at SSRN: http://ssrn.com/abstract=528542
Jorgensen, A. A. 2005. Developing cost-effective transportation policies in South Africa using rail freight. Presentation to the Rail Freight 2005 Conference, London. Available from http://www.rra.co.za
Jorgensen, A. A. 2006. Strategies for Combating Congestion and Building Capacity on South African Railway Lines. Presentation, Container Logistics 2006. Available from http://www.rra.co.za
Kessides, I.N. & Willig, R.D. 1995. Restructuring Regulation of the Rail Industry for the Public Interest. World Bank Policy Research Working Paper 1506.
Kwoka, J.E. & White, L.J., October 1997. Manifest Destiny? The Union Pacific-Southern Pacific Merger. New York University, Center for Law and Business, Working Paper No. 98-012. Available at SSRN: http://ssrn.com/abstract=164496 or DOI: 10.2139/ssrn.164496
Modubu, R. J. November 2003. Concessioning of the South African Commuter Rail Subsystem. Thesis submitted in fulfilment of the requirements for the degree of Master of Commerce, Transport Economics, University of South Africa.
National Competition Council. December 2002. The National Access Regime: A Guide to Part IIIA of the Trade Practices Act 1974. Part B: Declaration. Available from www.ncc.gov.au.
Newbery, D. M. February 2004. Privatising Network Industries. CESifo Working Paper No. 1132.

Prices, Investment and Efficiency on the Railways
A Sectoral Review of Efficiencies in Administered Pricing in South Africa
89
Organisation for Economic Co-operation and Development. February 1998. Railways: Structure, Regulation and Competition Policy. DAFFE/CLP(98)1.
Organisation for Economic Co-operation and Development. 2005. Competition Law and Policy in Brazil: A Peer Review, Paris, France.
Owens, H. 2003. Rail Reform Strategies: The Australian Experience.” NBER Working Paper 9592.
Pittman, R. March 2002. Chinese Railway Reform and Competition: Vertical or Horizontal Restructuring? US Department of Justice, Antitrust Division, Economic Analysis Group Working Paper No. 02-2. Available from http://papers.ssrn.com/sol3/papers.cfm?abstract_id=308588
Pittman, R. October 2004. Structural Separation and Access Pricing in the Railways Sector: Sauce for the Goose Only? U.S. Department of Justice – Economic Analysis Group. Available from http://papers.ssrn.com/sol3/papers.cfm?abstract_id=605621
Prentice, Barry E., Wade Derkson, and Arnold Maltz. "Rail Harmonization in Mexico and North America: Implications for Agriculture." In Policy Harmonization and Adjustment in North American Agricultural and Food Industry, pp. 128-141. Edited by R.M.A. Loyns, Ronald D. Knutson, Karl Meilke, and Antonio Yunez-Naude. University of Guelph, February 2000.
Queensland Rail. 30 June 2006. QR Access Undertaking (2005). Further details available from [email protected]
Roop, S.S., Warner, J.E., Zambrano, F., Ismailova, R. & Kang, D. February 2001. The Impact of Mexican Rail Privatisation on the Texas transportation system. Sponsored by the Texas Department of Transportation In Cooperation with the U.S. Department of Transportation Federal Highway Administration. Report 2128-2; Project Number 0-2128.
Secretaría de Comunicaciones y Transportes (2006). Programa de Trabajo.
Sharp, R. 2005. Results of Railway Privatization in Latin America, Transport Paper No. 6, The World Bank Group, Washington, D.C.
Thompson, L. & Budin, K. 1997. Global Trend to Railway Concessions Delivering Positive Results. Public Policy for the Private Sector, Note No. 134, The World Bank.
Thompson, L. & Budin, K. 2001. Directions of Rail Reform. World Bank Group.
Van Holdt, K. June 2003. "Saving government from itself": Trade union engagement with the restructuring of Spoornet. Paper produced for the NALEDI/SWOP Seminar on workplace transition.
Viscusi, W.K., Vernon, J.M. & Harrington, J.E. 2001. Economics of Regulation and Antitrust. Third edition. The MIT Press, Cambridge.

Prices, Investment and Efficiency on the Railways
A Sectoral Review of Efficiencies in Administered Pricing in South Africa
90
WestNet Rail Pty Limited. December 2005. Costing Principles
Yudelman, D. 1983. The Emergence of Modern South Africa – State, Cpital and the Incorporation of Organized Labor on the South African Gold Fields, 1902-1939. Contributions in Comparative Colonial Studies, Number 13. Greenwood Press, London.

Prices, Investment and Efficiency on the Railways
A Sectoral Review of Efficiencies in Administered Pricing in South Africa
91
Appendix 1 – Pricing theory
Economic theory suggests that efficiency is best served when prices (P) are set at a level equal to marginal costs (MC). When this condition is met, the amount that consumers are prepared to spend on a good is exactly equal to the amount it costs to produce that good (including some reasonable return on capital). If more of the good was produced, marginal costs would increase and the amount that consumers were prepared to spend would fall, signalling that production levels were higher than socially optimal (and vice versa for a decrease in production). Thus when MC=P, the good is neither over- nor under-produced, and resources are used with maximum possible efficiency.
However, in most industries, marginal costs are not the only component of cost which is significant. The marginal cost of production is the additional cost that needs to be incurred to produce an additional unit of the good in question. For example, in the garment industry, the cost of the cloth, buttons and thread needed to produce an additional garment would all be counted as marginal costs. However, the cost of the sewing machine remains constant and is thus regarded as a fixed cost of production. If the price of the garment covers only marginal costs, revenues will be insufficient to cover the cost of investment in fixed costs. However, if prices deviate from marginal cost, the ability of prices to maximise economic efficiency is damaged.
In industries with very high proportions of fixed cost as opposed to marginal cost, this problem becomes extremely acute. Rail is one of these industries: the expense of maintaining the investment in the track network and machinery must be borne by customers, and the potential distortion to the MC=P efficiency condition of doing so can be very large.

Prices, Investment and Efficiency on the Railways
A Sectoral Review of Efficiencies in Administered Pricing in South Africa
92
Box 5 – Economies of scale
The three graphs below briefly illustrate the three classic forms of scale economies seen in industry. In Figure 12, the marginal cost curve of the firm turns sharply as production increases, and there is only one quantity at which economies of scale are fully realised. As long as the market is much larger than the volume at which economies of scale are achieved, it would be optimal for efficiency to see a large number of similarly sized firms in this industry. In Figure 13, the marginal cost curve flattens out and produces a range of production volumes over which the firm can realise economies of scale. Competitor firms can be of many different sizes and still all produce at the same level of efficiency. Figure 14 illustrates the cost conditions of a natural monopoly – marginal cost continues to decrease indefinitely as production volumes increase and the incumbent firm will always have a lower cost of production than a new entrant with lower volumes. The best efficiency outcome in this kind of industry is to have only a single operator.
Figure 12 – Marginal cost curve with a single efficient production point
Figure 13 – Stable range of least cost production
Figure 14 – Continually decreasing marginal costs: natural monopoly
Source: Genesis Analytics Source: Genesis Analytics Source: Genesis Analytics
The level at which economies of scale are achieved thus has a big impact on the number of firms which can be viable in any given market. The shape of the cost curve influences the desirable size of the firm – if marginal costs are continually decreasing, it is optimal to grow volumes as much as possible to decrease per-unit costs as much as possible. In addition, the smaller the minimum efficient size is, the lower entry barriers to the industry are, and vice versa.
A number of other methodologies are used to price rail services, in addition to the Ramsey pricing and FDC techniques detailed in section 2.2. Three of them are discussed below.
Equalising discrimination
Under the equalising discrimination model, the cost of providing a service does not play a proportional role in the price charged for that service. Instead, pricing is set on the principle that all shippers should be more-or-less charged equally, regardless of the underlying cost differences associated with factors such as the length of the trip in question or the size of the load. The way in which prices differ between customers is

Prices, Investment and Efficiency on the Railways
A Sectoral Review of Efficiencies in Administered Pricing in South Africa
93
thus largely divorced from the way costs vary between customers, and cross-subsidisation of services must result.192
Under equalising discrimination, the ability of the operator to respond to market and cost realities may be inadequate. For example, if a particular set of customers are particularly price-sensitive and have a good ability to switch to truck freight, equalising discrimination would not allow the rail operator to compete on price for this service. Similarly, the rail operator would not be able to charge more for services which are more expensive to provide and where the customer would be willing to bear the higher cost with minimal decrease in volumes demanded. Profitability across the operator’s network is thus likely to be affected by low price flexibility associated with equalising discrimination.
Value-of-service pricing
Under value-of-service pricing, higher prices are charged for higher value products and vice versa. Pricing structures do not reflect the underlying cost of transporting the various types of goods by value.193 Again, this pricing methodology does not provide the operator with enough flexibility to deal with real market conditions. For example, many high value goods are also low volume and are thus well suited to other transportation modes, such as road or air freight. Under value-of-service pricing, the operator will place its highest prices on these highly elastic goods and as a result is likely to lose these customers.
Multi-part pricing
In some services, a multi-part tariff can be a useful way of increasing economic efficiency, as potential distortions to the buying decision are minimised.194 In rail, an example of a two-part tariff would be in vertically separated markets, where the track owner charges operators a fixed flag-fall tariff per train running, plus a linear fee per ton km actually carried by that train.195 However, while a two-part tariff may be a useful means of supporting efficiency in some areas of the rail market, it is not clear that it would be an appropriate charging structure for all rail customers, as not all services can be adapted to suit the two-part tariff structure. Two-part tariffs should thus probably be seen as a useful addendum to an existing pricing methodology.
192 Viscusi et al 2001, 535 193 Viscusi et al 2001, 535 194 The theoretical argument is as follows: the most important condition for ensuring that deadweight losses are not incurred is to set marginal cost equal to price. However, if fixed costs are high, covering marginal costs alone will lead to sustained losses. Under a two-part tariff, the customer is charged a fixed rate sufficient to cover fixed costs and a linear rate equal to marginal cost. Thus, quantity demanded still depends on MC=P, but losses are avoided. The only deadweight loss incurred is on customers whose quantity demanded is so low that they will not pay the fixed fee – these customers drop out of the market. 195 Australian Productivity Commission 2006, 60

Prices, Investment and Efficiency on the Railways
A Sectoral Review of Efficiencies in Administered Pricing in South Africa
94
Appendix 2 – Comparison country selection
South Africa displays a number of distinctive characteristics, both in terms of its overall macroeconomy and in terms of its rail network. We felt that the international comparison would be strengthened by attempting to ensure a reasonably good match with these characteristics. The first step in country selection was thus to assemble a database of relevant indicators, including agricultural, business environment, industrial, infrastructure, macroeconomic, service, social and trade variables for twenty five countries that represented good comparators to South Africa in terms of economic size and similarity.
South Africa has an unusually large rail network in terms of kilometres of track. Table 28 ranks our 25 countries by size of rail network – South Africa is eleventh largest in the group.
Table 28 – Length of rail networks in possible comparator countries
Country Length of rail network (km) United States 193 182 Russia 85 542 India 63 221 China 61 015 Canada 49 422 Australia 47 738 Argentina 35 754 Brazil 30 403 Mexico 26 662 Japan 20 060 South Africa 20 047 Poland 19 576 Turkey 10 984 Indonesia 5 324 Thailand 4 044 New Zealand 3 898 Colombia 3 154 Vietnam 2 600 Peru 2 123 Chile 2 035 Morocco 1 907 Malaysia 1 667 Ghana 977 Venezuela 433 Singapore N/A
Source: World Bank and various Transport Ministry websites
In addition, there is a large gap between South African network size and the countries which follow it (after Poland, Turkey, at 10 984km). As such, it was evident that many of the countries further down the size scale could be eliminated as potential comparison countries to South Africa.

Prices, Investment and Efficiency on the Railways
A Sectoral Review of Efficiencies in Administered Pricing in South Africa
95
Of the larger network countries, a high proportion fell into the developed nation group, which provides a poor macroeconomic comparison to South Africa. We therefore decided to include only one developed nation. The United States sits as a rather extreme example given its size and scope, while the western European countries represented networks that were much more advanced technically, had very different economic activity mixes than South Africa, were far more devoted to passenger services (rather than freight) and were small in terms of geography and distance to market. That essentially left Australia, Canada, or New Zealand as options. We eliminated New Zealand given its rail network’s small size at 3 898km. Both Australia and Canada represented strong potential case studies given their sheer size and relative importance placed on using rail for transporting freight – especially minerals. As such, their comparability to South Africa was strong.
Ultimately, we settled on Australia as it bears a closer comparability to South Africa than Canada. It too is very far from most of its markets—as opposed to Canada, which is very linked to the United States. Similarly, Australia and South Africa do not have large inland navigable waterways, whereas Canada does (with the Great Lakes and Saint Lawrence Seaway). Further, Australia is much closer to South Africa in terms of the importance of minerals to its economy. Ores and metal exports comprise only 5% of Canada’s merchandise exports, whilst they comprise 16% of Australia’s and 22% of South Africa’s.196 As such, Australia was finally chosen as the best developed country case study comparator.
The next step was to determine which two countries would make the best developing country examples. Given their massive scale, very different histories, very different political contexts and linguistic difficulty in ascertaining and interpreting any available data, Russia and China were eliminated as possible comparators. India was considered, but as its rail is dominated by passenger services and its demographic and economic mix is quite different from South Africa’s, it was not considered an appropriate comparator.
In contrast, Brazil has a similar network size at 30 403km, has a preponderance of freight over passenger services (1 263 million passenger kilometres, versus 221 600 million ton-kilometres).197 Brazil also provides a strong example of a country very comparable to South Africa in terms of level of development and economic mix. We can see this comparability borne out in the data: 9% of Brazil’s merchandise exports are in minerals and ores (compared to South Africa’s 22%), both South Africa and Brazil have similar levels of inequality (Gini coefficients are both 58), and PPP per capita GDP is $11 000 for South Africa and nearly $8 000 for Brazil.198 Further, Brazil has a similar economic transport mix to South Africa, in that there is significant mining activity in the interior that needs to be brought to ports on the coast. While Brazil does have a large navigable inland waterway (the Amazon), it is specific only to one isolated section of the country. In sum, Brazil was chosen as an appropriate case study comparator given its economic and infrastructural similarity to South Africa,
196 World Bank Development Indicators Database. 197 Ibid. 198 Ibid.

Prices, Investment and Efficiency on the Railways
A Sectoral Review of Efficiencies in Administered Pricing in South Africa
96
and for providing a developing country benchmark experiencing relative success at this point in time.
For the third case study comparator, four countries remained with a comparable scale in terms of rail network, namely Argentina (at 35 754km), Mexico (at 26 662km), Poland (at 19 576km) and Turkey (10 984km). Turkey provides a case study that has a regulatory environment similar to South Africa’s (a Transnet-like parastatal which controls all of the ports and rail in the country). However, its financial performance has been abysmal until very recently, and it is currently experiencing substantial upgrading on the passenger side as it integrates with the EU. As such, Turkey provides a sub-optimal case study.
Poland, while having a substantial network, has a network that is very dense, as well as very well connected to western Europe. Further, it has an economic activity mix which is quite different from South Africa’s, and a geographic/demographic mix which is also quite different from South Africa’s (as evidenced, for example, in that the population density is 124.6 people/square kilometre in Poland, versus 37.2 in South Africa).199
Next, despite Argentina being a pioneer in rail reform, it was eliminated because its demographics are quite different from South Africa (14 people per square kilometre and nearly 90% of the population is urban, compared to 59% for South Africa), and very little of its economic mix is mineral- or ore-related (22% for South Africa versus 4% for Argentina).200 Most importantly, there was a dearth of up-to-date information available for Argentina.
This left Mexico, which was chosen for several important reasons. First, Mexico has key similarities to South Africa, in that its rail network connects coastal ports to a substantial urban centre high on a plateau in the middle of the country (for example, Cape Town, PE and Durban lines running to Johannesburg, compared to Acapulco, Veracruz and Tampico running to Mexico City). Mexico also provides an interesting case-study of rail reform, given that it concessioned its rail network by geography (similar to Brazil), but also involved its competition commission in market structure decisions. Further, Mexico’s rail services are dominated by freight, PPP per capita GDP is close to South Africa’s at $9 132 and its income inequality level is close to South Africa’s with a Gini coefficient of 50.201 Nonetheless, no comparator is perfect—population density is 54 people/square kilometre (compared to 37 in South Africa), 76% of the population is urban (compared to 59% in South Africa), and mineral- and ore-related exports are only 2% of Mexico’s total merchandise exports. However, given the alternatives, Mexico provides the best third comparator case study.
In summary, we provide the following table that directly compares the key overarching metrics between South Africa and Australia, Brazil and Mexico:
199 Op. cit., World Bank Development Indicators. 200 Ibid. 201 Ibid.

Prices, Investment and Efficiency on the Railways
A Sectoral Review of Efficiencies in Administered Pricing in South Africa
97
Table 29 – Key metrics for the comparator countries
Australia Brazil Mexico South Africa Length of rail network (km) 47 738 29 314 26 662 20 047 Goods transported by rail (million ton-km) 164 436 221 600 54 387 127 000202
Population density (people/km2) 3 22 54 37
Population (% urban) 88% 84% 76% 59% Income inequality (Gini coefficient) 35 58 50 58
GDP per capita (PPP) $28 306 $7 808 $9 132 $11 044 Ores and minerals as a % of merchandise exports 16% 9% 2% 22%
Source: World Bank Development Indicators, UIC and Transport Ministries
202 CSIR 2005, 17

Prices, Investment and Efficiency on the Railways
A Sectoral Review of Efficiencies in Administered Pricing in South Africa
98
Appendix 3 – Australia
Railroad construction in Australia began in the 1850s, before Australia became a federation of states. As such, most of the rail network was designed to link key coastal towns to the surrounding region. Thus, rail in Australia is essentially a series of state-focused networks. Figure 15 below illustrates the resulting physical characteristics of the Australian rail network.
Figure 15 – Australian rail network
Source: Australasian Railway Association, 2003 ARA Yearbook, as shown in Australian Government 2005, 1
Furthermore, the 1901 Australian constitution is heavily focused on the rights of the individual states and enshrined state-level legislatures to have jurisdiction over their own state’s rail network. Nonetheless, the constitution does provide for the Commonwealth to acquire and/or construct any railway in any state so long as it has

Prices, Investment and Efficiency on the Railways
A Sectoral Review of Efficiencies in Administered Pricing in South Africa
99
that state’s consent. This came to the fore when the Commonwealth built and bought interconnections between the states, especially during the construction of the trans-Australian railway from 1912 to 1917.203 This lead to the founding of the Australian National Railways Commission, which, in 1997, became the Australian Rail Track Corporation (ARTC), which is described in detail below. Today, ARTC is the below-track operator for interstate rail service across the states of New South Wales, Victoria, South Australia and eastern Western Australia.204
Rail track in Australia is either public – in that it is a regulated track open to the public for access – or it is private – meaning it is a privately owned network not open to third-party access, such as a private iron or coal track. Any accredited “access seeker” can negotiate for access to public track, as discussed in Appendix 4. An “access seeker” is defined as “an [accredited] rail operator or a potential rail operator who, in the opinion of the rail infrastructure owner, has the capacity to provide the rail services for which access is sought.”205
Initial investments in rail in Australia during the mid-nineteenth century were in many cases made by the private sector, but the various states had assumed ownership by the turn of the century. A few rail networks were also built for special purposes under special legislation – such as the ore lines; these became the private mining lines existing alongside public lines today.206
In the end, this fragmented development of rail has led to a number of challenges, including having multiple types of gauges across the country. Indeed, even the main trans-Australian line did not have a uniform gauge until 1995.207 Nonetheless, despite the fragmented building of rail, Australia today has a very sizeable network. The entire Australian railway network comprises 47 738 kilometres of track,208 of which 8% is electrified.209
By 1990, rail in Australia could be described as “integrated, state-owned railways providing freight and passenger services in their respective jurisdictions,” with a Commonwealth-owned operator (Australian National) providing interstate passenger and freight service.210 This system imposed an unsustainable fiscal burden on both the state and Commonwealth governments: total explicit subsidies to finance railway deficits were over AU$2.3bn per year in the late 1990s, or about 4-5% of government outlays (most of which was at the state level). A key driver of losses was deregulation of road trucking – prior to deregulation, some loads had been restricted to rail, 211 so rail freight rates had been artificially supported.
203 Affleck Consulting 2003, 18. 204 Affleck Consulting 2003, 40. 205 Independent Pricing and Regulatory Tribunal of New South Wales 2006, 5. 206 Affleck Consulting 2003, 19. 207 Owens 2003, 6. 208 See: https://www.cia.gov/cia/publications/factbook/geos/as.html#Trans. 209 Ibid. 210 Owens 2003, 5-6. 211 Owens 2003, 7.

Prices, Investment and Efficiency on the Railways
A Sectoral Review of Efficiencies in Administered Pricing in South Africa
100
With the increasing fiscal burden and the introduction of a National Competition Policy, by the mid-1990s most of state- and commonwealth-based rail was transformed into various “structural, ownership, and access arrangements,” most with at least some degree of commercialisation or privatisation.212 Access regimes were also created and/or strengthened.213 Thus, with the history of rail development in Australia being state-based and the restructuring of the sector in the 1990s lacking any sort of overall national strategy or specific national guidance other than the broad Competition Principles of 1995 (outlined below), rail today in Australia is exceedingly heterodox. Today, vertically separated, vertically integrated, horizontally separated, horizontally integrated, fully privatised, commercialised and non-commercialised rail all exist in the country. As will become clear, this has created a very complex environment, with fragmentation in some areas and some degree of harmonisation in other areas. Reform remains ongoing, and as such the regulatory regime may change over the next few years.
Market description
The Australian freight transport market as a whole is expected to experience rapid growth over the next twenty years.214 Since the mid-1980s, road and rail have carried around the same proportion of the total freight task (about 150bn ton-kilometres in the 2000s), and both have been equally aggressive in eroding the share of the total freight task carried by sea.215
Like most rail systems, the Australian rail system focuses primarily on freight that is regular, high volume and/or containerised long-haul—especially heavy bulk commodities like coal or ore.216 As such, in 2003 just under half of the total Australian bulk freight task was carried by rail.217 As a whole, rail transport contributes about 0.54% of GDP (compared to 2.42% for road transport) and employs 41 400 people (compared to 152 900 for road transport).218
Where road dominates is in carrying non-bulk freight, especially freight which is perishable, fragile, or time sensitive; this, for better or for worse, is the growth area in the freight market, as industry moves more and more towards just-in-time, low-inventory management.219 Per annum through 2020, it is estimated that the non-bulk freight task (in ton-kilometres) will grow at 5% for road, 2.5% for rail, 1.4% for shipping and 3% for air.220 Thus, in some sense, there are really two separated freight markets: (1) bulk and long-distance non-bulk dominated by rail and (2) non-bulk,
212 Owens 2003, 7-8. 213 Australian Productivity Commission 2006, 2.27. 214 Bulk freight (in ton-kilometres) is expected to grow at 2.3% per year through 2020 and non-bulk at 3.6%. (BTRE 2006, xxiii). 215 Australian Productivity Commission 2006, xxviii. 216 Australian Productivity Commission 2006, xxviii. 217 Australian Productivity Commission 2006, xxix. 218 Australian Productivity Commission 2006, 2.8. 219 Australian Productivity Commission 2006, xxix. 220 BTRE 2006, xxv.

Prices, Investment and Efficiency on the Railways
A Sectoral Review of Efficiencies in Administered Pricing in South Africa
101
short-haul dominated by road. 221 It is in the latter market where competitive concerns between road and rail are an issue - especially as government subsidies and vertical separation may skew the competitive environment. It is argued that the former market is a natural monopoly, which needs an economic regulator.
Figure 16 – Modal share by freight type (% share of total ton-km of the specific freight type)
0
15
30
45
60
75
90
Bulk Containers Non-Bulk
Road Rail Sea
Source: Australian Productivity Commission 2006, 2.9
Rail restructuring during the 1990s increased productivity by nearly 10% per year, mainly as a result of improved technical and labour efficiency.222 This increased efficiency made a decrease in rail freight rates possible, while road freight rates stayed more-or-less flat. Despite this change in relative prices, road has still taken market share from rail in non-bulk freight, which strongly suggests that price is not the only factor of importance in non-bulk freight. In fact, in Australia price seems to have little impact at all in customer decision-making; service characteristics are more important.223
Private railways perform 42% of the total rail freight task, while public railways perform the remaining 58%. 85% of rail tonnage is bulk.224 Half of the public rail freight task (in ton-kilometres and excluding private mining lines, such as iron ore)
221 Australian Productivity Commission 2006, xxix & 2.10. 222 Australian Productivity Commission 2006, 2.19. 223 Australian Productivity Commission 2006, 2.19. 224 BTRE 2006, 4.

Prices, Investment and Efficiency on the Railways
A Sectoral Review of Efficiencies in Administered Pricing in South Africa
102
occurs in Queensland, of which 80% is coal. Almost three-quarters of the total freight task is Queensland and New South Wales.225
Figure 17 illustrates how the 2001 total rail freight task (of 136 387m ton-km) was split among the various state-level public rail networks and the private lines. “Other” includes various non-iron-ore private rail lines (such as sugar railways), while the ARTC refers to the interstate Commonwealth-owned track. The private iron ore lines are entirely in Western Australia, but are not under the jurisdiction of the public rail network in that state. Distinction is also made for Queensland to show the proportion held by Queensland’s vast coal movements by rail versus other freight types in the state.
Figure 17 – Modal share by freight type (% share of total ton-km of the specific freight type)
Source: BTRE 2006, 45
As mentioned earlier, between 1983 and 2003 (during which time both road deregulation and rail reform were effected) road’s share of the interstate non-bulk freight task (measured in ton-km) rose from 53% to 66%, while rail’s share of the
225 BTRE 2006, 43.
NSW10.3%
Pvt Iron38.0%
Other4.3%
ARTC12.5%
QLD Coal22.6%
QLD Non-Bulk5.6%
VIC1.1%
WA4.0%
SA1.2%TAS
0.3%

Prices, Investment and Efficiency on the Railways
A Sectoral Review of Efficiencies in Administered Pricing in South Africa
103
non-bulk freight task dropped from 38% to 25%. Coastal shipping’s share held steady at 9% over the same period.226
Table 30 shows that for most commodities, rail’s share of the freight task has dropped over time, with the exception of coal and other minerals. This largely reflects the rising importance of road in non-bulk commodity movement and the continuing importance of rail in bulk movement, especially coal. Iron ore is not included in this table as it is almost entirely moved by private rail lines in Western Australia.
Table 30 – Percentage of selected commodities moved by rail: 1960s vs. 2000
Commodity % carried by rail in the
1960s % carried by rail in 2000
Grain 80 65 Other agriculture 70 20 Livestock 70 10 Fertiliser 80 5 Coal 65 80 Other minerals 37 50 Cement 50 20 Timber 55 10
Source: BTRE 2006, 112
Market participants
The mix of rail players in Australia is extremely heterogeneous and includes government and private operators, in various combinations of vertical and horizontal separation, varying by state. Five specific categories of market participants can be identified, as follows:227
Operators: both horizontally integrated and separated operators (by product) are in evidence. Rail operators are conducted on both a public and private basis, and some operators furthermore contract with other train operators for locomotives and “management of train movement” (so-called ‘hook-and-pull’ services).228
Track access providers: provide track access, communications and manage train movements –“below-track” operations. They may either own or lease the track and are generally government-owned.
Safety regulators: exist at the state-level in Australia and accredit train operators and the various types of service providers.
Access regulators: these de legis entities exist at the Commonwealth- and state-level in Australia to regulate the terms, conditions and prices negotiated
226 BTRE 2006, 53. 227 Affleck Consulting 2003, 2. 228 Affleck Consulting 2003, 2.

Prices, Investment and Efficiency on the Railways
A Sectoral Review of Efficiencies in Administered Pricing in South Africa
104
between rail access providers and train operators, and provide meditation in case of price disputes.
Maintenance providers: provide maintenance services and may lease or rent rolling stock, generally on a subcontractor basis.
Operators and track access providers can be either integrated with each other, or operate as separate companies.
Operators
There are nineteen entities that can be considered freight operators, five of whom carry almost 98% of total tonnage (as of 2001), namely Queensland Rail (146m tons), Pacific National (104m tons), BHP Iron Ore Rail (66m tons), Australian Railroad Group (40m tons) and Pilbara Railway (98m tons). BHP Iron Ore and Pilbara are both private mining railways.229
229 Affleck Consulting 2003, 33-35.

Prices, Investment and Efficiency on the Railways
A Sectoral Review of Efficiencies in Administered Pricing in South Africa
105
Table 31 – Freight operators in Australia
Name Ownership Nature Operating locations Size Australian Railroad Group Private Vertically integrated, freight;
some hook-and-pull West Australia and South Australia 40mt
ATN Access Private Above-track Victoria and New South Wales 300,000t BHP Billiton Iron Ore Rail Private Vertically integrated, private
mining rail line West Australia 66mt
Comalco Railway Private Vertically integrated, private mining rail line Queensland N/A
Freight Australia Private Vertically integrated Victoria and New South Wales 7.1mt
FreightLink Private Vertically Integrated South Australia & Northern Territory N/A
FreightRail Government Above-track New South Wales N/A
Great Northern Rail Private Above-track; some hook-and-pull Victoria 270,000t
Interail Government Above-track New South Wales & Queensland N/A
Lachlan Valley Rail Private Above-track New South Wales 200,000t
Pacific National Private
Generally above-track only; some hook-and-pull and vertical integration (as in Tasmania)
New South Wales, Victoria, Queensland and Tasmania 104mt
Pilbara Railway Private Vertically integrated, private mining rail line West Australia 98mt
Queensland Railways Government Vertically integrated Queensland 146mt
Silverton Rail Private Above-track; some hook-and-pull
New South Wales, Victoria and South Australia. 600,000t
Southern Shorthaul Private Above Track New South Wales and Victoria N/A
South Spur Rail Private Above-track; some hook-and-pull West Australia N/A
Specialised Container Transport Private Above-track Victoria, South Australia &
West Australia N/A
Tasrail Private Vertically integrated—owned by Pacific National Tasmania 2mt
Whyalla Steel Railway Private Above-track South Australia N/A
Source: Affleck Consulting 2003, 33-35
The number of operators competing for rail freight within any given state varies widely. For example, in Tasmania the only operator is Tasrail, a subsidiary of Pacific National, and in Queensland, aside from private mining lines, essentially all operations are under the control of the integrated Queensland Rail government entity and its subsidiaries. Pacific National is the only private operator that has been able to run rail freight operations in Queensland.230 In contrast, a number of operators offer services in New South Wales, South Australia, West Australia and Victoria. Some of these specialize by service offering (such as short-haul), while others focus on certain regions. In all cases, gaining accreditation can be a key hindrance to allowing an
230 See: http://en.wikipedia.org/wiki/Queensland_Rail.

Prices, Investment and Efficiency on the Railways
A Sectoral Review of Efficiencies in Administered Pricing in South Africa
106
operator to offer services across several states; while accreditation in one state should be mutually recognised in principle, local red-tape in other regions and states has been cited as a serious barrier to entry in reality.231
Track access providers
Track access is coordinated in a heterogeneous way. In Victoria, Western Australia, New South Wales and Queensland, there is a state body which owns track infrastructure in the state. That body then leases track out to operators, who may be government or privately owned and may offer only below-track services (that is, they only offer access to above-track operators and do nothing more), or may provide vertically integrated below- and above-track services. In Queensland, Western Australia and New South Wales, the state entity provides such vertically integrated, above- and below-track services. The state-level entities are as follows:
Queensland Rail: is a state-owned, vertically integrated entity that controls and operates essentially all public rail track and operations in Queensland, including interstate track. Access is granted to third-parties, but to date only Pacific National runs third-party freight in Queensland.232
RailCorp: a New South Wales state-owned company, which owns all track in its state and leases interstate track to operators such as the Australian Rail Track Corporation (described below). It is vertically integrated, with inter-urban and urban rail operators, and also provides access to the various private freight operators accredited in the state.
VicTrack: a Victoria state-owned company, which owns all of track in the state and indirectly leases interstate track, via the Director of Public Transport, to the Australian Rail Track Corporation. Non-urban and urban track are also leased to other operators.
Western Australia Government Railways: similar to VicTrack, this is a government entity which owns track in Western Australia. It leases interstate track to the Australian Railway Group’s subsidiary WestNet (described below), while also providing its own above-track passenger operations on the inter-urban/urban routes in the state.
The following companies lease track from the above state-owned entities. This group include companies which only provide below-track operations to above-track operators, as well as companies which provide a fully vertically integrated above- and below-track service, which is potentially open to above-track competition.
Australian Rail Track Corporation: the ARTC is owned by national government and provides only below-track services, primarily for interstate services between South Australia, Victoria, New South Wales and Western Australia. It leases track in Victoria and New South Wales from the state track-owning entities and owns track in the other states.
231 Affleck Consulting 2003, 17 232 See: http://en.wikipedia.org/wiki/Queensland_Rail
Prices, Investment and Efficiency on the Railways
A Sectoral Review of Efficiencies in Administered Pricing in South Africa
107
Australian Railroad Group: a vertically integrated private company, which owns interstate track in South Australia (through subsidiary Australia Southern Railway) and leases interstate track in Western Australia (through subsidiary WestNet Rail).
Pacific National: a private company which leases non-urban track in Victoria from VicTrack and owns the Tasmanian rail track through subsidiary TasRail. Pacific National also offers above-track services across Australia, via negotiated access with below-track operators, and leases its own track in Victoria to the local inter-urban passenger line.
FreightLink: a public-private partnership between the Commonwealth government, the South Australia state government and a consortium of private rail companies, which built and now operates a railway running from South Australia, across the Northern Territory, to the north coast at Darwin.
M>Train and Connex: vertically integrated, primarily passenger railways offering below- and above-track operations in the Melbourne metropolitan area, leasing the infrastructure from VicTrack. M>Train is government-owned, while Connex is private.
The descriptions above do not include the vertically integrated, horizontally separate private mining lines, such as the Pilbara Railway and BHP Billiton Iron Ore Railway. This is because these private lines are essentially disconnected from the overall Australian rail network and public access is not granted to these lines. Figure 18 below summarises the rail access environment in Australia. Freight and passenger operators who only offer above-track services must negotiate access to track with any of the players listed above, or shown in Figure 18, who themselves may also provide freight and passenger services.

Prices, Investment and Efficiency on the Railways
A Sectoral Review of Efficiencies in Administered Pricing in South Africa
108
Figure 18 – Rail access provision in Australia
Source: Derived from Affleck Consulting, 2003
In the current Australian rail environment, it can be extremely complex to offer cross-country rail services. For example, an above-track service provider which wants to offer a service from Brisbane to Perth has to negotiate through four access regimes: Queensland Rail; the ARTC using New South Wales’ access regime; the ARTC’s commonwealth-level access regime as it crosses south-central Australia; and ARG in Western Australia. Each of these states has its own above-track standards which the operator must conform to, which increases the regulatory burden further. These issues impede flexibility and timeliness for cross-country freight traffic.233 The mix of outright ownership versus leasing from below-track operators, together with the fact that many below-track operators also offer above-track operations, adds to complexity.
233 Affleck Consulting 2003, 18
Queensland Government(Queensland Rail)-Owns and operates all above-and below-track operations inthe state
New South Wales Government(RailCorp)-Owns and operates urbanand inter-urban above-and below-track operations inthe state.-Leases interstate track to ARTC
Victoria Government(VicTrack)-Leases urban track to ConnexAnd M>Train-Leases non-urban track to Pacific National-Leases interstate track to ARTC
Western Australia Government(WA Government Railways)-Owns and operates inter-urbanabove- and below-track operationsin the state.-Leases interstate track to the ARG
Pacific National-Provides above and belowtrack operations in Victoriaand Tasmania-Above-track only in other states-Owns the Tasmanian track,leases the Victoria track
Australian Railroad Group (ARG)-Provides above- and below-trackServices in South Australia and Western Australia-Leases its track in WA from WA Gov’tRailways, and owns its track in South Australia
Australian Rail Track Corporation (ARTC)-Provides interstate below-track operationsBetween New South Wales, Victoria, SouthAustralia, and eastern Western Australia-Owns track in SA and WA, leases track fromNSW and Victoria
FreightLink-A PPP which owns and operates the above and below track operations on the new Darwin to Tarcoola railway Connex and M>Train
-Providers of above-and below-track servicesin metro Melbourne-Leases its track from VicTrack

Prices, Investment and Efficiency on the Railways
A Sectoral Review of Efficiencies in Administered Pricing in South Africa
109
Segmentation and commercial discipline
Table 32 illustrates the wide range of vertical and horizontal integration in evidence in Australia, as well as the range of government and private ownership.
Table 32 – Separation versus integration and ownership of rail in Australia
Within state separation
versus integration Ownership of operations State Vertical Horizontal Above-track Below-track
National network Separation Separation Government and
private Government
New South Wales Separation Separation Government and
private Government
Victoria Integration Separation Private Government, but mostly leased to private sector.
Queensland Integration Integration Government Government
Western Australia Integration Separation Government and
private
Government, but mostly leased to private sector.
South Australia Integration Separation Government and
private
Government, but mostly leased to private sector.
Tasmania Integration Integration Private Private
Source: Owens 2003, Table 2; and Australian Productivity Commission 2006, 2.28
With the exception of Tasmania, rail track infrastructure is owned by the government and with the exception of Queensland, above-track operations involve some form of private sector participation. Within-state horizontal separation is preferred over horizontal integration, while vertical integration is preferred to vertical separation. Thus, while Australia certainly exhibits a heterogeneous approach to rail reform, there is a clear preference for the concession method of division, whereby a specific region or purpose rail network (horizontal separation) is managed as a vertically integrated distinct rail entity. The vertically integrated, horizontally separate entity may be managed either by a government or private entity. Private entities achieve vertical integration despite government ownership of track, by leasing track from government.234
In all cases, the state provides an access pricing regime so that above-track operators can (in theory) also compete for access to public lines. Such access regimes both allow competitors into the market and help to facilitate network inter-connections. Where government entities remain in operation, effort has been made to impose commercial discipline, either via commercialisation or privatisation. It should be noted, however,
234 Owens 2003, 5.

Prices, Investment and Efficiency on the Railways
A Sectoral Review of Efficiencies in Administered Pricing in South Africa
110
that even where entities are commercialised or privatised, they may still receive subsidies.235
Table 33 – Degrees of commercialisation present in Australia
State Degree of commercial discipline Queensland Commercialised
New South Wales Four entities created (passenger, freight, track infrastructure, track maintenance), three of which are commercialised
Victoria Freight and urban passenger services fully privatised; the rest, commercialised
Western Australia Freight fully privatised; the rest, commercialised South Australia Commercialised Tasmania Privatised National Commercialised
Source: Owens 2003, 7-8
Regulation and pricing in Australian rail
Safety regulation
Each state in Australia has its own rail accreditation authority, which is handled either by state-level transport departments or state-level infrastructure departments.236 There are also several additional bodies which inform the rail policy process in Australia, including the Queensland rail, ports and freight division and the department of infrastructure in Victoria.237
Concern has been voiced that the safety regulatory set-up is too fragmented. For example, accreditation, while mutually recognised across states, is still a very time consuming process to fully complete, as each state’s bureaucracy must sign-off and local requirements may be added. This has been cited as a major barrier to entry for new interstate operators.238 It is argued that there are inconsistencies in the ways the states approach accident investigations, leading to coordination problems and weakened risk management.239 Operator cost may also be increased by “non-uniform operating rules, practices and technical standards” across states.240
Access regulation
Except for Tasmania and the Northern Territory, each state in Australia has at least one specified body charged with the duties of a rail infrastructure access regulator; some have jurisdiction on both interstate and intrastate traffic running through the state, while others only have jurisdiction on intrastate traffic. There is also a
235 Australian Productivity Commission 2006, 7.7. 236 Affleck Consulting 2003, 43. 237 Affleck Consulting 2003, 45-47. 238 Affleck Consulting 2003, 17. 239 Affleck Consulting 2003, 17. 240 Affleck Consulting 2003, 17.

Prices, Investment and Efficiency on the Railways
A Sectoral Review of Efficiencies in Administered Pricing in South Africa
111
commonwealth-wide regulator for those states where the access regulator has no jurisdiction on interstate traffic. The scope of each state’s access regulator is as follows:241
Commonwealth: there are two Commonwealth bodies with some jurisdiction, namely the Australian Competition and Consumer Commission, which approves voluntary undertakings and arbitrates disputes, and the National Competition Council, which assesses and recommends certifications and declarations. The Commission thus plays a role in approving the terms and conditions of the ARTC’s “voluntary undertaking” to provide access to its track, in states without a regulator with authority over interstate traffic.
New South Wales: the Independent Pricing and Regulatory Commission of New South Wales sets the rules for costing and pricing of both interstate and intrastate track within the state, as well as providing arbitration as needed.
Queensland: the Queensland Competition Authority sets the rules for negotiation and conduct of access, approves voluntary undertakings and provides arbitration as needed. Its scope is strictly intrastate, but since the ARTC does not own any track in Queensland, a cross-country freight train leaving Brisbane will still need to negotiate for access from Brisbane to the state line, as all track in Queensland is essentially “intrastate.”
Victoria: the Essential Services Commission of Victoria sets rules for negotiation and conduct of access, and provides arbitration as needed. Its scope is strictly intrastate; as such, cross-country track access is subject to the commonwealth’s access regime.
Western Australia: the Western Australia Independent Rail Access Regulator sets rules for costing, pricing and ring-fencing both intrastate and interstate rail within the state, and provides arbitration services when needed.
South Australia: there are two bodies with jurisdiction in South Australia, namely the Essential Services Commission of South Australia (which sets rules for negotiation and conduct of access on the AustralAsia Railway), and the Executive Director of Transport of South Australia (which sets rules for negotiation and access to the regular intrastate track within the state, as well as providing arbitration when needed).
Northern Territory: there is no rail access regulator in this state, as the only line in the state is the Tarcoola-Darwin line, which is administered by South Australia.
Tasmania: there is no rail access regulator.
This wide array of regulators leads to inconsistencies “in relation to rules for negotiation, arbitration, pricing and the scope of the infrastructure to which it applies.”242 We now examine these regimes in depth, to illustrate the complexities of implementing access pricing.
Access pricing principles
241 List adapted from Affleck Consulting 2003, 44. 242 Affleck Consulting 2003, 18.

Prices, Investment and Efficiency on the Railways
A Sectoral Review of Efficiencies in Administered Pricing in South Africa
112
The 1974 Trade Practices Act obligates public and private infrastructure access providers to offer competitive rates, under a “negotiate/arbitrate” system. The Act does not however set out guidelines on how to determine pricing levels, though this was a recommended when the Act was reviewed in 2001.243 Nonetheless, most rail access pricing regimes follow a “floor-ceiling” model, where negotiations on price take place in a band between the floor price (equal to incremental cost, or the cost of providing access) and the stand-alone cost (“the cost if the system delivered only the service sought by the access seeker”).244 However, how these two prices are exactly calculated varies from state to state and will be explained in detail in the coming sub-sections.
This common approach was adopted in the 1990s when all states in Australia agreed to the Competition Principles Agreement, which “required all governments to implement third-party access regimes for access to services provided by the use of significant infrastructure facilities to permit effective competition in downstream markets.”245 As all rail was government-owned at the time (except for private, dedicated mining lines), all public rail became subject to state-designed access regimes.
“Subject to reasonable conditions,” the Trade Practices Act “establishes a legally enforceable right for any person to share access to the services provided by rail infrastructure,” and sets down three “pathways” for those “seeking access”:246
Declaration. Any party needing interstate service can negotiate “terms and conditions of access” with the service provider. If the negotiations fail, the Australian Competition and Consumer Commission (ACCC) will arbitrate. In practice, few declarations have succeeded as States do not want to “override their [own] State regimes”.247
State-based regimes. Because of how the state-based Australian legal system works, the “Declaration” option mentioned above typically fails because of the presence of State-based access regimes, which trump declarations so long as there is an “effective” access regime in the state. Official “effectiveness” has only been granted to the new Tarcoola-Darwin line running from South Australia to the north coast in the Northern Territory at Darwin, but “a state or territory access regime may constitute an effective access regime even if it has not been the subject of a Commonwealth minister decision regarding its effectiveness…an effective access regime could be a regime established under other commonwealth legislation.”248 This is the case in rail, as all states have signed onto the Competition Principles Agreement, which effectively mandates third-party access pricing for rail based on the same set of broad principles (largely related to owner-access seeker negotiations, rights to recourse and
243 Affleck Consulting 2003, 25; and Australian Productivity Commission 2001, 321. 244 Australian Productivity Commission 2001, 321. 245 Independent Pricing and Regulatory Tribunal of New South Wales 1999, 5. 246 Affleck Consulting 2003, 25. 247 Affleck Consulting 2003, 25. 248 National Competition Council 2006, 105.

Prices, Investment and Efficiency on the Railways
A Sectoral Review of Efficiencies in Administered Pricing in South Africa
113
similar points).249 If an access seeker makes a declaration, the ACCC first will determine whether or not the state’s regime is effective.
Voluntary undertaking. The Australian Competition and Consumer Commission can also approve the terms and conditions for access set by the “voluntary undertakings” of access providers. This is how the ARTC and Queensland provide access and thus how most operators will gain access to the national interstate network.250 Voluntary undertakings are not subject to the Competition Principles set out in description of the state-based regimes, but rather are subject to Section 44ZA(3) of the Trade Practices Act, which is considered to be more flexible.251 For example, commercial negotiation for access is not a requirement; as such, voluntary undertakings set out the explicit terms and conditions of access, while a state-based regime will simply describe how rail access is to be regulated.252 The end result may be the same in either case, but the voluntary undertaking allows, for example, Queensland to remain completely integrated with almost no private above-rail players and the ARTC to function in certain state environments whereby it owns the track and the state does not.253 Thus, in some sense, voluntary undertakings are a special case for the two more unique regimes found in Australia.
Hence, what typically happens is that an operator needing track access will simply use the relevant state or commonwealth access regime. In Queensland and on the commonwealth-owned track (ARTC), voluntary undertakings by the operator on price are binding; everywhere else, it is less clear. As the New South Wales regime notes, “all track in Australia [not declared effective as a state-based regime or as a voluntary undertaking] can be the subject of an application for access under the national access regime.”254 This simply means that, if accepted, an operator gains the right to negotiate with the access provider. However, under the national access regime, no declarations have been approved, only Queensland and ARTC undertakings have been effectively certified and only the Tarcoola-Darwin line has been certified as an effective state-based regime.255 As such, the current state-based access pricing regimes are the de facto ways by which rail access prices are set in each state (except for the national level ARTC and Queensland track networks, which use their approved voluntary undertakings) and there seems to have been little movement away from this. The spectre of recourse to the national access regime remains, but as until now, it seems to exist primarily as a last resort if the state regimes are unacceptable to access-seekers.
Thus, for access to the main national interstate network (east-west), an operator will be subject to the “Voluntary Undertaking” terms and conditions set out by the ARTC’s and Queensland’s undertakings, which have been approved by the national Competition Commission. In New South Wales and Western Australia, the state-
249 Council of Australian Governments 1995. 250 Ibid. 251 National Competition Council 2002, 11. 252 Ibid. 253 Ibid., pg. 10. 254 Independent Pricing and Regulatory Tribunal of New South Wales 1999, 6. 255 Australian Productivity Commission 2001, xvi; and Affleck Consulting 2003, 25.

Prices, Investment and Efficiency on the Railways
A Sectoral Review of Efficiencies in Administered Pricing in South Africa
114
based regime is what is used, as ARTC’s track is not owned, and thus it is (in a sense) an intrastate issue. As such, if the operator only needs access within a state (intrastate networks), they are subject instead to the relevant state-based regime. However, the state regimes must be “in line” with the Trade Practices Act.
Summary of access pricing regimes in Australia
A number of commonalities between the various state and national regimes can be identified. With the exception of Victoria, rail regulators mandate that access negotiations can only take place once floor and ceiling prices have been set and that the final price decided on must fall between these bounds. The ceiling price is typically defined as the stand-alone cost of providing the service, while the floor price is some form of variable cost calculation. This is very much in line with the Ramsey pricing price boundaries discussed in the section on price limits (see section 2).
Within the price boundaries, the operators and track owners often have substantial room to set prices in accordance with demand conditions. For example, in Queensland, operators which are able to carry higher prices, because of the demand conditions in the markets they service, are required to carry a higher proportion of common costs. This is seen as efficiency enhancing. Again, this is in line with Ramsey theory.
In Victoria, the pricing framework is slightly different, in that reference prices are explicitly designed so that total revenue raised is “consistent with the full recovery of efficient costs”. This provides far less leeway for price negotiation and discrimination. This is thus the region in which Australian rail pricing methodology differs most from Ramsey techniques.
Methods for asset valuation, the relationship between “infrastructure use and cost,” and “treatment of common costs” each differ from regime to regime, and thus so does the method used to calculate floor and ceiling costs.256 Thus, it becomes quite hard to see if, in reality, economic costs are being recovered, as there is much room for manoeuvre.
256 Australian Productivity Commission 2006, 5.8.

Prices, Investment and Efficiency on the Railways
A Sectoral Review of Efficiencies in Administered Pricing in South Africa
115
Box 6 – Australian rail pricing indicators
ARTC publishes a number of reference tariffs for certain routes, which fall between the floor and ceiling prices for the given service, and are indicative of for a non-bulk service, which is the more typical service to be found on an ARTC train.257 Table 34 shows the components of these prices. Per kilometre total charges for a 1 000 gross ton-km operation are also indicated (variable plus flagfall components). Price variation, even on a per kilometre basis, depends on the nature of route – for example, demand and occupancy on the route, and other concerns.
Table 34 – 2005 indicative prices for selected routes on the ARTC ($AUS)
Adelaide to Parkeston
Crystal Brook to Broken
Hill
Tarcoola to Alice Springs
Port Augusta to
Whyalla
Adelaide to Melbourne
Melbourne to Albury
Average
Distance (kms) 1 992.5 372 6.35 73 847.5 307.1 Variable component: Per thousand gross ton-km 2.256 2.550 4.225 3.547 2.594 2.270 2.907
Flagfall component: Premium 6 565.57 772.92 26.61 151.36 1 741.22 562.52 High 5 688.52 669.87 23.32 132.04 1 575.09 493.80 Standard 4 812.55 565.74 18.89 11.65 1 427.77 383.25 Low 4 376.70 514.22 17.75 100.91 1 378.40 383.25 Per-km prices for a 1000 GTK shipment Prem/km 3.3 2.1 4.2 2.1 23.9 1.8 6.2 High/km 2.9 1.8 3.7 1.9 21.6 1.6 5.6 Std/km 2.4 1.5 3.0 0.2 19.6 1.3 4.7 Low/km 2.2 1.4 2.9 1.4 18.9 1.3 4.7 Average/km 2.7 1.7 3.4 1.4 21.0 1.5
Source: Australian Productivity Commission 2006, 5.14; Genesis calculations Flagfall component options: Premium: Max train speed of 115km/h and axle load of 20 tons High: Max train speed of 110 km/h and axle load of 21 tons Standard: Max train speed of 80 km/h and axle load of 23 tons Low: Off-peak
Some more detail on how prices vary by bulk commodity type is provided by Queensland. Table 35 shows bulk prices from 1995, which is the last year such information was publicly available – even to a government entity like the Australia Bureau of Transport and Regional Economics.
Table 35 – $/ton freight revenue in 1995 for selected commodities in Queensland
1995 $/ton
Coal and coke 11.73 Other minerals 13.99 Non-minerals 23.45 Average 12.71
Source: BTRE 2006, 296
257 Australian Productivity Commission 2006, 5.14.

Prices, Investment and Efficiency on the Railways
A Sectoral Review of Efficiencies in Administered Pricing in South Africa
116
Australian rail access pricing in reality
According to the Australian Productivity Commission’s October 2006 report entitled “Road and Rail Infrastructure Pricing,” “despite commercialisation [of most rail lines], prices fall well short of the economic costs as assessed by regulators…in practice, there appear to be substantial injections of public funds to major rail corridors and some regional lines, with no expectation of recovery.”258 In 2006 alone, various states and the Commonwealth government have injected over AU$1.5bn into various rail infrastructure projects.259 Another AU$1.4bn is expected from the Commonwealth government through 2009 strictly for rail projects, and of that, AU$820m will be in the form of grants.260 Thus, the worry is that “government financial contributions allow access charges to be set below the economic costs of providing freight services on major corridors.”261
Part of the problem is that while “rail infrastructure regulatory regimes require that infrastructure charges relate to the costs incurred…there remains a need to establish the relationship between the level and nature of the infrastructure use and the costs directly incurred as a result.”262 For example, there is no consensus on how to value assets, what rates of return to use, and how to properly allocate costs incurred via measures such as gross ton-kms and train length. An EU study found that such differing methodologies (at least on the EU rail system) can lead to variations in marginal cost by as much as a factor of 20,263 which can substantially affect the accuracy of profit calculations.
Subsidies can come in three forms: tolerance of low rates of return, direct subsidies, and funds from government for Community Service Obligations (serving underserved areas).264 All three occur at present in Australia.
Low rates of return: the Australian Productivity Commission estimates that the return on assets of the rail industry is only 2.9%, and that return on equity across the network amounts to only 2%.265 If such low returns “are tolerated for a long period of time,” this is essentially an implicit subsidy, especially in relation to what might be found in road freight.266
Direct subsidies: we have already mentioned the hundreds of millions of Australian dollars being directly provided (sometimes even in grant form) for infrastructure development.
Community Service Obligations (CSOs): under a CSO, the operator receives “compensatory payments” for serving underserved areas. Such CSO payments totalled AU$2.7bn in 2004-06; however, it is hard to know for sure if such
258 Australian Productivity Commission 2006, xxxv. 259 Australian Productivity Commission 2006, xxxvi. 260 Australian Productivity Commission 2006, 2.28. 261 Australian Productivity Commission 2006, xxxvi. 262 Australian Productivity Commission 2006, 5.3. 263 Australian Productivity Commission 2006, 5.4. 264 Australian Productivity Commission 2006, 5.18. 265 Australian Productivity Commission 2006, 5.19. 266 Australian Productivity Commission 2006, 5.20.

Prices, Investment and Efficiency on the Railways
A Sectoral Review of Efficiencies in Administered Pricing in South Africa
117
payments are a real subsidy hurting competition. Greater transparency is needed in budgeting to show what the funds are actually going towards, and what the impact is on pricing.267 Obviously it varies from line to line, but as an example, one grain line in New South Wales (a typical freight beneficiary of CSO payments) was charging access prices covering barely 3% of annualised infrastructure costs.268
Non-bulk freight rates in Australia have dropped substantially over time, as shown in Table 36. Since 1984 in particular, rail freight rates have approximately halved, while road rates remain essentially flat; nonetheless, non-bulk freight remains dominated by road, so the impact of these subsidies on the non-bulk freight market’s competitive environment is questionable.269 When road rates have risen, rail has responded not by increasing its own tariffs, but by expanding output – which may reflect the manner in which volume based subsidies can damage commercial incentives. Thus, the Productivity Commission suggests that it might be appropriate for rail prices to increase when road prices increase, so as to keep modal shares the same, and assist the long-term fiscal health of the railroads by lessening their reliance on subsidies.270
Table 36 – AUS cents/net ton-km for non-bulk freight, 1965 vs. 2001 in nominal and real terms
Air Road Rail Coastal ship Nominal 1965 (AUS cents) 14.36 1.17 0.93 0.88 Real 1965 (AUS cents; 1985=100) 84.5 168.20 127.40 41.83
Nominal 2001 (AUS cents) 111.73 5.66 2.75 12.54 Real 2001 (AUS cents; 1985=100) 73.7 91.47 42.01 66.94
Source: BTRE 2006, 152
Access pricing regimes can also worsen pricing outcomes. Access prices are offered in order to allow third parties to offer rail services, and thus introduce competition into the market. However, many non-bulk freight lines already experience tough inter-modal competition from road. As demand for non-bulk rail freight may be very low when road is available, the availability of subsidies may trigger a race to the bottom by rail operators, which ultimately may hurt the long-term viability of operators on these non-bulk rail lines. Indeed, the Productivity Commission has gone so far as to say that “there is scope to wind back access regulations where vertically separated below-rail operators face strong competition from road”.271 Related to this, the Productivity Commission strongly advocates “stricter application of the corporatisation model” to improve incentives and “industry performance.”272 This is particularly a problem on
267 Australian Productivity Commission 2006, 5.22. 268 Australian Productivity Commission 2006, 5.22. 269 Australian Productivity Commission 2006, xxxvii-xxxviii. 270 Australian Productivity Commission 2006, xxxvii. 271 Australian Productivity Commission 2006, xlvi. 272 Australian Productivity Commission 2006, xlvi.

Prices, Investment and Efficiency on the Railways
A Sectoral Review of Efficiencies in Administered Pricing in South Africa
118
the ARTC interstate rail, where “pricing is constrained more by intermodal competition than by regulatory pricing limits.”273
Low prices are typically not as problem on intrastate rail carrying bulk commodities, such as coal; in Queensland, for example, 90% of the freight carried is coal, and the ceiling price is often attained.274 This bifurcation has led to some cross-subsidisation where horizontal separation has not been achieved (such as might be occurring in horizontally and vertically integrated Queensland).275
In summary, the combination of subsidies and opaque cost measurement has probably contributed to sub-optimal pricing regimes, with the result that most rail track owners would no longer be viable in the absence of subsidies. This is especially the case on regional lines where inter-modal competition is tough, and a race-to-the-bottom with prices has occurred. As such, the Productivity Commission argues for the introduction of substantial changes to market structure, including a move back towards full vertical integration on lines where the race-to-the-bottom phenomenon is observed, fewer or at least more transparent subsidies, truer commercialisation, and a restriction of price regulation to lines where a real natural monopoly exists – which would include public access bulk commodity lines, such as coal lines.276
Box 7 – Turkish rail restructuring
Turkey’s rail sector is controlled by a state-owned, vertically and horizontally integrated rail and port company (the TCDD), much like Transnet in South Africa. Prior to its recent restructuring, the TCDD was also a good example of what can happen if rail systems are not adequately exposed to commercial discipline. In order to operate trains and maintain the track network, TCDD required nearly $9 billion in financial support from the state between 1993 and 2004 (which translates to about $75,000 per kilometre of track in the entire Turkish network, per year). And yet despite this support, the TCDD still remained in a financial deficit of $584 million in 2004.277 Before the current restructuring (which involves a shift to greater commercialisation), employment stood at nearly 60 000 persons in the 1990s; by 2006, in the middle of the restructuring, that number had been cut to 37 000.278
At present, Turkey is in the middle of a restructuring process, which may provide a useful regulatory example when completed. New legislation will commercialise the TCDD, and separate it into two distinct business units (infrastructure and operations). A new regulatory body will be created in order to ensure “free and non-discriminatory” access to rail infrastructure, and thus introduce some commercial discipline on operators. The World Bank and the European Union are providing substantial financial assistance in support of systems and infrastructural modernisation, and in order to mitigate the social costs of the restructuring.
273 Australian Productivity Commission 2006, 5.15. 274 Australian Productivity Commission 2006, 5.16. 275 Australian Productivity Commission 2006, 5.17. 276 Australian Productivity Commission 2006, 10.23. 277 Audige 2006. 278 Bolat 2006.

Prices, Investment and Efficiency on the Railways
A Sectoral Review of Efficiencies in Administered Pricing in South Africa
119
Implications for rail in Australia going forward
The implications of Australian railway system performance are explored below, grouped by the three different types of networks operational in Australia, namely regional freight lines; coal lines; and the interstate network.279
Regional freight rail networks
Regional freight lines run from the country’s ports and large cities out to regional areas, and from that, to the interstate network. These lines are “dominated by the transport of general freight and grain,” and there is “strong inter-modal competition, especially from road”.280 Some regional rail networks have performed very well, while others have not. Underperforming lines have often been required by state governments to perform “a range of conflicting objectives,” including serving unprofitable areas.281 These regional lines compete head-on with a fully deregulated road-trucking industry, and cannot offer competitive prices or invest in maintaining their rail infrastructure without substantial financial support from government. Owens argues that in this category, full privatisation or at least “truer” commercialisation would help to drastically improve the performance of these types of networks.282
The Australian model of allowing vertical separation on all lines may also not be optimal. Although vertical separation allows greater competition, this is not particularly useful when competition from road is already intense, and the largest problem of rail operators is an “inability to meet the existing competitive challenges” posed by road transport.283 However, access regimes are still crucial given that access to regional networks is often key to provide interstate services. Horizontal separation of regional rail networks is useful if each horizontal operator serves a distinct region, as it allows government to determine which regions need assistance, and which do not, and therefore better target any subsidies.284
Coal line networks
Coal is an extremely ‘rail-friendly’ commodity – it is high bulk, low value, sensitive to logistics costs, and not excessively time sensitive. There is thus little inter-modal competition for coal transportation, and rail probably has a natural monopoly in this market. 285 Coal lines in Australia are known for carrying very high volumes of goods, as well as being highly profitable. Natural monopoly status allows operators to charge high prices and still run operations rather inefficiently.286 At present, some of the coal
279 Owens 2003, 17 280 Owens 2003, 21 281 Owens 2003, 21 282 Owens 2003, 22 283 Owens 2003, 23 284 Owens 2003, 23 285 Owens 2003, 24 286 Owens 2003, 24

Prices, Investment and Efficiency on the Railways
A Sectoral Review of Efficiencies in Administered Pricing in South Africa
120
lines are horizontally integrated with state networks, while others are horizontally separated as stand-alone entities.287
Two different approaches could be used to increase competition and thus drive price and efficiency improvements in these markets. Vertical separation could be used to introduce competing operators, although access price regulation would be needed to ensure that competition was protected.288 The second option would be to “franchise a vertically integrated network” (by leasing track and rolling stock) and thereby induce competition “for the market.”289 The winners of the contract or the franchise would be chosen based on the lowest cost for providing the service, and the franchise competition could be repeated every few years to ensure dynamic optimisation. However, horizontal separation of the coal lines from other networks is critical in order to design such a “package”.290
The interstate network
The interstate network in Australia is roughly defined as the network connecting all of Australia’s main cities, and offering both freight and passenger services.291 The network has not been known for its strong financial performance, primarily as a result of strong inter-modal competition both from sea and road shippers.292 Offering interstate services is contractually very complex, as the interstate network is vertically separated, and contains several competing operators and track owners. This market segmentation is a result of historical factors, as rail lines in Australia were established independently by the various states. The interstate network in Australia is thus essentially horizontally separated by geography, even though it would seem that by default, an interstate network would have to be horizontally integrated. This introduces substantial inefficiencies for interstate above-track operators, who may face as many as four different state-level access regimes across the network.
287 Owens 2003, 29. 288 Owens 2003, 24. 289 Owens 2003, 24. 290 Owens 2003, 26. 291 Owens 2003, 26. 292 Owens 2003, 26.

Prices, Investment and Efficiency on the Railways
A Sectoral Review of Efficiencies in Administered Pricing in South Africa
121
Appendix 4 – Australian rail pricing regimes
Commonwealth-level access pricing
Pricing conditions in national access can be illustrated by looking at the ARTC, which is the main provider for national (interstate) rail. The ARTC roots all its pricing decisions in its corporate and social objective of “stimulating customer confidence and market growth in the rail industry”.293 It also states that it has a “legitimate business interest in recovering all of its reasonable costs associating with granting access, and obtaining a fair and reasonable return on investment in the network”.294
The ARTC discloses a large amount of data on relevant cost and supply characteristics to its negotiating counter-party (such as path length availability, available capacity, load limitations, allowable speeds, characteristics of infrastructure, safety requirements, and costs for the segment in question).295 Costs are generally interpreted as the “depreciated optimised replacement cost” or DORC, and this asset valuation procedure is used by most states in Australia at the state-level as well. It “refers to the replacement cost of an ‘optimised’ rail system less depreciation,” thereby providing a value to the segment of the rail minus assets that would not be replaced,” and “any cost reductions that would have occurred had service provision been technologically optimal”.296 Thus, the party looking for access has a sense of what the cost or value is to the ARTC for the segment of rail infrastructure it wants access to. The ARTC will also provide information on the incremental and economic costs for providing the access.297 An application from the operator to the ARTC is then submitted, and negotiations begin, along with provisions for dispute resolution.298
Differential charges can be based on (1) “the characteristics of the relevant service, including differences between load, speed, wheel diameter, length, origin, destination, and arrival/departure times;” (2) the “commercial impact on the ARTC” including term length of the agreement, potential for growth, opportunity costs, “consumption of ARTC resources,” credit risks of the operator seeking access, the value of the particular segment and train path; (3) logistical impacts on the ARTC, including reduced capacity, flexibility, and impact on other operators seeking access; (4) capital contributions by the operator to cover the ARTC’s costs; and (5) any costs of additional capacity.299
The actual access charges have a “variable” component and a “flagfall” (fixed) component. The idea is that the variable component reflects the “the distance
293 ARTC 2002, 2. 294 ARTC 2002, 17. 295 ARTC 2002, 6. 296 Australian Productivity Commission 2006, 5.7. 297 ARTC 2002, 6. 298 ARTC 2002, 8-9. 299 ARTC 2002, 17.

Prices, Investment and Efficiency on the Railways
A Sectoral Review of Efficiencies in Administered Pricing in South Africa
122
travelled and load carried for a particular service,” and the flagfall component reflects “the cost of occupying capacity.”300 The variable component is “a function of distance and gross mass ($/gross ton kilometre), while the flagfall component is “fixed and specific to each train service type and segment ($/kilometre).301 Thus, the total access charge will be the sum of the variable and flagfall components. This will increase annually at CPI less 2% or at 2/3rds of CPI.302 However, both the variable and flagfall components are open to negotiation.303
Any revenue generated by the ARTC for providing access to a segment is subject to a ‘floor limit’ and a ‘ceiling limit.’ The ‘floor limit’ requires that for a particular segment, the total revenue generated from access provision must cover the costs incurred by (1) track, signalling, and communication maintenance; (2) maintenance contract and project management; (3) train control and communications; (4) train planning and operations administration; and (5) system management and administration.304 The ‘ceiling limit’ requires that revenues from access provision will not exceed that segment’s economic costs. Calculating the ceiling limit requires estimating the segment’s asset value, which is done using DORC methodology.
DORC requires taking the following factors into account: (1) segment-specific costs; (2) depreciation of segment-specific assets; (3) a rate of return on the value of segment-specific assets; (4) an allocation of non-segment-specific costs; (5) an allocation of non-segment-specific-depreciation; (6) an allocation of a rate of return on the value of non-segment-specific assets; and (7) costs for any additional capacity. Non-segment-specific costs, depreciation, and rate of return are allocated to segments in proportion to:305
Gross ton kilometres. 60% of non-segment-specific asset costs, depreciation, and rate of return related to track maintenance.
Track kilometres. 40% of non-segment-specific asset costs, depreciation, and rate of return related to track maintenance.
Train kilometres. Non-segment-specific costs, depreciation, and rate of return related to anything other than track maintenance.
In all cases, the rate of return is calculated using the weighted average cost of capital.
The ARTC manages capacity on its system – it undertakes capacity analysis to inform its dealings with operators, allocates capacity to the first customer it can negotiate an agreement with, and will transfer or cancel under-utilised capacity granted to an operator.306 ARTC plans to invest nearly AU$1bn in its network over the next five years, funded entirely by the revenue it has gained from its access regime. This highlights an important point: “because of commercialisation, rail infrastructure
300 Australian Productivity Commission 2006, 5.14. 301 ARTC 2002, 19. 302 ARTC 2002, 20. 303 ARTC 2002, 20. 304 ARTC 2002, 18. 305 ARTC 2002, 19. 306 ARTC 2002, 22.

Prices, Investment and Efficiency on the Railways
A Sectoral Review of Efficiencies in Administered Pricing in South Africa
123
pricing, maintenance, and investment decisions are more directly linked than road infrastructure pricing”.307
New South Wales access pricing
New South Wales has a 12 000km rail network. The freight task in the state is nearly 31% coal (in gross ton-km), 25% interstate freight, and 5% internal general freight.308 With the exception of several privately-operated mine railroads, the track is owned by the state through RailCorp, which then leases out interstate track to ARTC, and its subsidiaries.309 Thus, rail in New South Wales is both vertically and horizontally separated, meaning there are distinct lines of rail track owned and operated as unique concessions. Access regimes are needed to ensure freight flows between the various entities, and to facilitate third-party competition.
Like the Commonwealth regulatory regime, New South Wales employs a negotiation/arbitration approach to rail infrastructure access. Again, although prices are negotiated, they are constrained within a ‘floor’ and a ‘ceiling.’ The goal is to ensure “access revenues derived from every access seeker should at least meet the direct cost imposed by that access seeker” and that “revenue…should meet the full incremental costs”; conversely, “revenue must not exceed the full economic costs”.310 In effect, the ‘ceiling’ “aims to prevent the firm from extracting monopoly profits,” while the “floor” is “based on avoidable costs, and aims to ensure that prices are not set so low that some rail operators do not pay for the costs of the services they use”.311 As with the Commonwealth regulatory regime, total revenue from a group of operators is not allowed to be higher than the economic costs of providing services to them.
“Incremental costs” are defined as “all costs which could be avoided if a sector was removed from the system,” and “full economic costs” mean “sector specific costs including a permitted rate of return, depreciation, and an allocation of non-sector-specific costs”.312 The Independent Pricing and Regulatory Tribunal approves cost calculation compliance with these guidelines.313
DORC is again used in valuing assets. This is done as a “test,” whereby “various combinations of customers against the relevant costs on the segments used” are examined to see if total revenues are more than full economic costs. In the end, “total access revenues must not exceed the stand-alone full economic costs of the entire New South Wales rail network.”314 Because of intense inter-modal competition in non-coal freight, non-coal customers can often negotiate a price closer to the floor of
307 Australian Productivity Commission 2006, 2.28. 308 Independent Pricing and Regulatory Tribunal of New South Wales 1999, 3-4. 309 Australian Productivity Commission 2006, E4. 310 Australian Productivity Commission 2006, E4. 311 Independent Pricing and Regulatory Tribunal of New South Wales 1999, 6. 312 Australian Productivity Commission 2006, E4. 313 Australian Productivity Commission 2006, E5. 314 Independent Pricing and Regulatory Tribunal of New South Wales 1999, 9.
Prices, Investment and Efficiency on the Railways
A Sectoral Review of Efficiencies in Administered Pricing in South Africa
124
the band, while those customers shipping coal pay a set price close to the ceiling level.315
The “floor” is set at the level where the operator seeking access pays just enough to cover the direct costs caused by track usage. Direct costs include additional costs of maintenance incurred by track usage, and provisions for “renewing” the rail on the segment after use.316 Subsidies paid as Community Service Obligations (CSOs—described in the next subsection, and used to subsidise rail operators so that they service isolated areas), are also included as revenue when calculating whether floor costs have been met.317
Rail network costs in New South Wales are estimated to be 80% fixed, and 20% variable, with that differential moving towards 50-50 as tonnage increases (with busy coal lines being essentially 50-50).318 Costs are allocated using an Infrastructure Cost Model made up of fifteen different cost categories. The choice of which asset valuation technique to use continues to be contentious, as does how to calculate depreciation and identify the proper rate of return.319 Nonetheless, allocation of overhead costs to operators is similar to the Commonwealth regime, being based on a particular operator’s gross ton-kms. As few lines in New South Wales are used by more than one operator, such calculations are fairly simple. Finally, and again as found in the Commonwealth regime, these costs are all presented to the access seeking operator before negotiations begin, so as to equalise any information asymmetries; further, if the operator wants to contribute to track improvements, this can also help lower his price.320
Queensland access pricing
In June 2006, the state of Queensland (via Queensland Rail) moved to set out a new “voluntary undertaking” in order to achieve the following:
Provide access to its rail network in a “competitively neutral environment,” with “negotiations conducted expeditiously”.
Design a “mechanism for exchange of information between access seekers and Queensland Rail to facilitate negotiations”.
Lay out pricing principles to guide negotiations, as well as negotiated agreement principles.
Outline how Queensland Rail will manage utilisation and interface issues. Provide for a “binding dispute resolution process”. Ensure the “voluntary undertaking” is Trade Act compliant. “Encourage efficient use of rail infrastructure... thereby facilitating
competition”.321
315 Independent Pricing and Regulatory Tribunal of New South Wales 1999, 9-10 316 Independent Pricing and Regulatory Tribunal of New South Wales 1999, 21 317 Independent Pricing and Regulatory Tribunal of New South Wales 1999, 7-8 318 Independent Pricing and Regulatory Tribunal of New South Wales 1999, 13 319 Australian Productivity Commission 2006 320 Independent Pricing and Regulatory Tribunal of New South Wales 1999, 13-14, 17 321 Queensland Rail 2006, 4

Prices, Investment and Efficiency on the Railways
A Sectoral Review of Efficiencies in Administered Pricing in South Africa
125
Queensland Rail, while vertically and horizontally integrated in toto, nonetheless has ring-fencing mechanisms in place to effectively separate rail infrastructure from train services within the body corporate. The Queensland Rail Network Access unit stands by itself, reporting directly to the CEO of Queensland Rail, and solely engaging in below-track operations. These include negotiating access agreements; maintaining the track; managing capacity; scheduling; and implementing yard controls.322
Negotiations for access begin with an application for such access. Within two weeks, Queensland Rail will provide “preliminary information” about the segment the operator wants access to, and may request additional data from them. Within thirty days, Queensland Rail must provide an “Indicative Access Proposal,” which sets out the following:
Rolling stock needs. A summary of operations, including frequency, transit time, and commodities
to be carried. An assessment of available capacity, and the costs needed to provide additional
capacity if necessary. Data on which other operators seek access to that segment. An estimate of the access charge, and an explanation of any deviations from the
usual pricing principles employed.323
The access proposal gives the access seeker a ninety-day deadline to respond. During negotiations, a number of issues are addressed, including a risk assessment on any inter-face issues, an environmental assessment, access charges, and so forth.324 If disputes arise during the negotiations, they are first referred to the CEO of Queensland Rail; if that fails, they are then referred to a third-party expert, who may refer the issue to the Queensland Competition Authority if a determination is needed.325 To date, Pacific National is the only private operator operating in Queensland—the rest are all subsidiaries of the Queensland Rail government entity; whether this will change with the new undertaking remains to be seen.326
Queensland Rail has a very structured way of constructing pricing principles. It does not differentiate access charges between operators seeking or having access if they are in the same market. Any variance in tariffs can be attributed to differences in cost or risk, and may, over time, reflect changes in available capacity, changes in “market circumstances,” or commercial viability-related managerial decisions on the part of Queensland Rail.327
As in the other cases, prices are set within a band with an upper and lower limit for each type of service, designed to prevent cross-subsidisation. For an individual train service or train service combinations, the price will not be so low that it “will not
322 Queensland Rail 2006, 12. 323 Queensland Rail 2006, 28-29. 324 Queensland Rail 2006, 30. 325 Queensland Rail 2006, 36. 326 See: http://en.wikipedia.org/wiki/Queensland_Rail. 327 Queensland Rail 2006, 45-46.

Prices, Investment and Efficiency on the Railways
A Sectoral Review of Efficiencies in Administered Pricing in South Africa
126
recover the expected incremental cost of providing access,” and it also will not “exceed the level that will recover the stand-alone cost of providing access.” Therefore, there are revenue limits for individual train services, meaning, “a maximum amount of service revenue that may be earned from access charges, and any transport services payments”. Further, the “net present value of the cash-flows associated with providing access over the [expected duration of the access agreement] [should be] zero”.328 As such, the traffic task for the operator must be forecast, and assets must be valued (once again, using DORC).329
Access charges differ between operators if they serve different markets. Operators in markets whose demand conditions allow them to pay more than incremental cost – and thereby contribute towards the “common costs” of providing rail infrastructure – are charged higher prices so as to “maximise the commercially viable use of capacity… while meeting… the common costs”.330
Because of the very large range that can develop between the floor and ceiling prices, Queensland Rail also develops “reference tariffs” in order to ensure “an efficient negotiation process,” and generally only applies them to coal lines.331 These are unique to specific train services (like coal), and do not bind Queensland Rail to ultimately charge that tariff – the negotiations themselves, as well as cost and risk considerations, can move the actual price even if the service is of the same type as the reference tariff covers. Reference tariffs must be “cost-reflective,” and are constructed by looking at incremental maintenance and electricity charges on a gross ton-km basis, an incremental capacity charge on how many train services are used, “an allocated component of the reference tariff levied on a net ton/kilometre basis,” and “an allocated component of the reference tariff levied on a dollar per net ton basis”.332
If no reference tariff exists, any other structure agreed upon by Queensland Rail and the access seeker will be used to indicatively arrive at a tariff, including an upfront component, an ongoing periodic fixed component independent of usage, ongoing variable components, and so forth. Additional “access conditions,” such as charges associated with building or upgrading infrastructure as necessary, may further increase costs.333
The 2006 Queensland Rail Access Undertaking goes on to list capacity management principles, including mandating capacity analyses, service specifications and train scheduling transparency, delineations of methodologies for allocating access, and relinquishing or transferring capacity between operators.334 It then goes on to outline
328 Queensland Rail 2006, 48 329 Queensland Rail 2006, 49-50 330 Queensland Rail 2006, 50 331 Australian Productivity Commission 2006, E.6 332 Australian Productivity Commission 2006, E.7 333 Queensland Rail 2006, 58 334 Queensland Rail 2006, 62-73

Prices, Investment and Efficiency on the Railways
A Sectoral Review of Efficiencies in Administered Pricing in South Africa
127
risk management procedures at network interfaces and environmental risk processes.335
Western Australia access pricing
Western Australia operates vertically integrated, but horizontally separate rail entities. The government owns the track and runs the services on the urban and inter-urban passenger railways, while ARG, via its subsidiary WestNet, leases the freight track from the government, and also runs a freight service. Thus, there are effectively two entities horizontally separated by product (passenger versus freight), and vertically integrated via owning or leasing the track upon which they provide their service.
Western Australia’s access pricing regime is similar to the other states. The Economic Regulator Authority of Western Australia provides guidance on the price formation process, which conforms in principle to what is found in the Commonwealth, New South Wales, and Queensland methodologies:336
Operators seeking access must submit an application, which the rail track owner has fourteen days to respond to.
After receiving the response from the track owner, the access-seeking operator must submit a proposal which “specif[ies] the route and associated railway infrastructure, the times when access is required, and the nature of rail operations.” The proposal must also “show that the proposed operations are within the capacity of the route, and that the access seeker has the managerial ability and financial resources available”.
After receiving the proposal, the track owner must provide ‘floor’ and ‘ceiling’ prices within seven days, as well as the costs upon which prices are based. An agreement must be drafted by the owner within twenty-three days.
If the request for access fully utilises the capacity on a given segment, the Economic Regulatory Authority of Western Authority must also approve the request after a public inquiry.
Assuming approvals are granted, negotiations begin, and have a ninety-day time frame. The Economic Regulatory Authority can be called in to assess if the price “is fair in relation to that which other parties are paying,” as well as provide arbitration services if a dispute arises. The ERA’s decision would then be binding.
WestNet is the track owner in western Western Australia, and is a subsidiary of ARG. It submits “costing principles” to the ERA every several years, in order to inform the public on how it arrives at its floor and ceiling prices. These costing principles identify three components of cost, as follows:
Capital costs are included to account for WestNet’s “establishing and replacing infrastructure capacity” over time. Capital costs primarily inform the calculation of the ceiling cost, which is based on an annuity formula
335 Queensland Rail 2006, 76-87 336 See: http://www.era.wa.gov.au/rail/railAccess.cfm

Prices, Investment and Efficiency on the Railways
A Sectoral Review of Efficiencies in Administered Pricing in South Africa
128
incorporating the gross replacement cost of the infrastructure, its expected life, and “an acceptable rate of return.”337 It is interesting to note that as opposed to most other states, asset valuation in Western Australia uses gross replacement value (“the lowest current cost to replace existing assets that have the capacity to provide the level of service that meets demand”) rather than DORC.338
Operating costs are also considered in calculating floor and ceiling prices. WestNet defines operating costs as those costs needed to maintain the track and signals. It directly allocates track and signal maintenance to specific segments by region and gross ton-kms. Network operating costs, related to access management issues like scheduling, are also included, and allocated based on train numbers required by the operator seeking access.
Overhead costs are considered separately. WestNet’s costing principles document lists those overhead costs in depth (they include access and accreditation costs, IT costs, and similar items). It then provides a methodology for how they are allocated: 50:50 with gross ton-kms used to allocate those costs associate with volumes moved, and train movements used to allocate those costs related to the amount of train movements.339
Finally, for a given segment, there “will only be one price ceiling for all access seekers,” based on the above capital, operating, and overhead costs.340 The floor, however, may differ from operator to operator, but it must not be less than the incremental costs of providing the service, and the sum of all of the individual operator price floors will not exceed the stand-alone cost floor for the entire segment itself. The percentage of incremental traffic added by the potential operator, the existing level of traffic, the specific requirements of the service (such as speed), the nature of the infrastructure itself (such as curvature, bridges, and so forth), and the complexity of the train operation itself (as it impacts overhead costs) are all considered in calculating the floor.341 Generally, capital costs are not included in calculating the price floor.342 In both cases, government and third-party assets are treated as revenue “so as to prevent cost over-recovery.”343
As with the ARTC and Victoria regimes, reference tariffs are published in Western Australia as a guide to negotiations. As with the ARTC, they are two-part tariffs comprising a “flagfall” charge and a variable charge. As opposed to the ARTC and Victoria, where the flagfall charge is “based on the cost of occupying capacity… on a per kilometre basis”, in Western Australia it is based on a fee per service.344
337 WestNet Rail 2005, 6-13 338 Australian Productivity Commission 2006, 5.8-5.9 339 WestNet Rail 2005, 22 340 WestNet Rail 2005, 18 341 WestNet Rail 2005, 18 342 WestNet Rail 2005, 19 343 Australian Productivity Commission 2006, E.8 344 Australian Productivity Commission 2006, 5.14-5.15

Prices, Investment and Efficiency on the Railways
A Sectoral Review of Efficiencies in Administered Pricing in South Africa
129
South Australia access pricing
As in Western Australia, rail in South Australia is vertically integrated, but horizontally separated. As such, there are essentially distinct and separate entities, each providing a particular service, and owning the track upon which they provide the service: TransAdelaide (metro Adelaide passenger rail), ARG (intra-state freight and passenger via ARG’s subsidiary, the Australian Southern Railroad), the FreightLink-operated AustralAsia Railway (the new line linking Tarcoola, SA to Darwin, NT), ARTC (interstate track owned by ARTC), and private coal and iron lines.345 The goal of access pricing is to ensure that the natural monopolies created by the model do experience some form of competition, by allowing above-track operators to also operate across the South Australia network, as well as ensure smooth flow of traffic across the entities.
Rail access in South Australia is defined to mean access to rail track, yards, stations, and services such as train control. It does not include rolling stock, maintenance services, or the actual passenger or freight services, 346 which are to be provided by the operator seeking access. The rail track owner has an obligation to be transparent, discreet, and non-discriminatory with access seekers, and access provision is regulated by the Essential Services Commission of South Australia.347
As in all other states, access is granted following commercial negotiations between the two parties, with recourse to arbitration facilitated by the Essential Services Commission of South Australia in the event the negotiations fail. Pricing principles for negotiation have been set by the Essential Services Commission, and follow the same line of logic found in other states:348
A “floor” price, which is to be “the lowest price at which the operator could provide service without making a loss.” This is determined by identifying the incremental cost of providing the service, and includes direct operating costs (maintenance and operations arising directly from the service being provided), overhead costs arising directly as a result of providing the service, and any capital costs that might be newly incurred as a result of providing the service. Thus, the “directly attributable” aspect is the key determinant in figuring out the incremental cost-based floor price. Asset valuations are calculated in the exact same manner as the commonwealth protocol, using DORC.349
A “ceiling price,” which is “the highest price that could be fairly asked.” This is determined by calculating the full economic cost of providing the service, and also includes assessing the operating, overhead, and capital costs incurred directly as a result of providing the service. This includes incorporating a return on investment that is in line with returns on investment found in other rail regulatory regimes.350
345 Essential Services Commission of South Australia October 2006, 1. 346 Essential Services Commission of South Australia October 2006, 5. 347 Essential Services Commission of South Australia October 2006, 5-7. 348 Essential Services Commission of South Australia October 2006, 7. 349 Essential Services Commission of South Australia October 2006, 9-10. 350 Essential Services Commission of South Australia October 2006, 11-12.

Prices, Investment and Efficiency on the Railways
A Sectoral Review of Efficiencies in Administered Pricing in South Africa
130
Nonetheless, a track owner can charge prices not reflecting the floor and ceiling price principles delineated in the bullets above, but if there is a dispute, the arbitrator will set a price within those limits.351
Within thirty days of receiving an application from an access-seeker, the rail track owner is obliged to provide an “Information Brochure” outlining the pricing principles, how they relate to the terms and conditions, and any other “reasonable” or “relevant” information. This is to be done on a non-discriminatory and transparent basis.352
The new AustralAsia Railway linking South Australia to Darwin in the Northern Territory is governed by a special AustralAsia Railway Code. There are floor and ceiling prices: the floor “must not be less than the avoidable below-rail cost of providing the service,” and the ceiling price “is to be set equal to the costs associated with providing the relevant service assuming the access seeker would be the sole user, less avoidable costs attributable to other users, and a reasonable contribution to fixed costs.”353 The Essential Services Commission of South Australia sets guidelines for achieving those prices based on “preferred methods of asset valuation (DORC), and appropriate rates of return,” as well as mandating reference prices, but only as an indicator to facilitate negotiations.354 The Commission also arbitrates disputes, and looks especially at the degree of competition for a particular segment or service in making its pricing decisions.355
Victoria access pricing
The Essential Services Commission of the State of Victoria determines the methodologies to be employed in rail access pricing within the state. Like South Australia, the Victoria system is primarily composed of vertically integrated entities operating horizontally separate lines by product—such as V/Train for inter-urban passenger lines, PacificNational for intrastate freight, and M>Train and Connex for urban Melbourne commuter rail. Thus, as in other states, access pricing is needed to improve the market through above-track competition, use of infrastructure, and to facilitate inter-network connectivity for smooth flow of traffic. The one exception is ARTC, which leases the interstate track, only provides below-track services, and is subject to the commonwealth access regime when in Victoria.
The pricing regime in Victoria is fairly different from other states. All freight and passenger services in Victoria are subject to revenue caps. The revenue cap is to “be consistent with the full recovery of efficient costs, excluding any capital costs associated with assets in place before 1999.” Therefore, prices must “be set with the objective of generating revenue such that… expected revenue is equal to a reasonable forecast of the access provider’s efficient cost”.356 Within the revenue cap, there is
351 Australian Productivity Commission 2006, E8-E9 352 Essential Services Commission of South Australia October 2006, B-1-B-11 353 Australian Productivity Commission 2006, E9 354 Australian Productivity Commission 2006, E9-E10 355 Australian Productivity Commission 2006, E9-E10 356 Essential Services Commission 2006, 82

Prices, Investment and Efficiency on the Railways
A Sectoral Review of Efficiencies in Administered Pricing in South Africa
131
room for “unders-and-overs” adjustments at the end of a particular access period, adjustments for efficiency carry-overs, adjustments for service and quality standards, and adjustments to allow for cost pass-through.357 Further, price discrimination on broad freight types is allowed so long as it improves efficiency, and any contributions by an access seeker towards capital or maintenance expenditure must be taken into account by the price.358
Most services will not be subject to a distinct pricing methodology, but will be given a “reference price” approved by the Commission. As with the ARTC, this typically includes two components – a per kilometre distance-based “flagfall” charge to “reflect the cost of occupying capacity,” and a variable charge to reflect distance and load.359 Further, the flagfall charge cannot exceed 30% of total charges due to fear that the high fixed cost nature of the network might induce exorbitant flagfall charges, and therefore “deter above-rail operators from entering the market.”360
Therefore, when forecasting the amount of revenue needed for an access period, the “building block” approach is used. This is used as a way to arrive at “the efficient cost of supplying regulated services.” Capital costs (including return on capital using the weighted average cost of capital and depreciation) and non-capital costs (operating and maintenance expenditure) are both used in the calculation. In valuing the asset base in order to make these calculations, Victoria uses depreciated actual cost (DAC) rather than the DORC methodology typically used in other states. This is because any assets older than 1999 are excluded from rail asset valuation in Victoria, which presents problems for the DORC approach. DAC is simply the value of the asset at its original cost, plus an inflation adjustment, and minus any depreciation, disposals, and capital contributions.361
Thus, having calculated the forecast revenue needed for an access period, reference prices must be set so that they meet forecast revenue; if there is a shortfall at the end of the access period, adjustments can be made to the price so that the shortfall is remedied in the next period.362 In the case of a surplus, the Essential Services Commission decides if an adjustment to the revenue cap is warranted. Further, if a rail access provider is a receiver of a government subsidy after constructing a revenue cap, the value of that subsidy must be deducted from the revenue cap and reference prices must be reconfigured. The “value of the [subsidy] must be fully offset in present value terms by rebates to the intended beneficiaries.”363 Finally, if any efficiency gains have been achieved during an access period, the Essential Services Commission will allow them to be carried over to the next access period after careful consideration using benchmark
357 Essential Services Commission 2006, 12. 358 Essential Services Commission 2006, 78. 359 Australian Productivity Commission 2006, 5.14-5.15. 360 Australian Productivity Commission 2006, 5.15. 361 Essential Services Commission 2006, 31-32. 362 Essential Services Commission 2006, 47. 363 Essential Services Commission 2006, 59.
Prices, Investment and Efficiency on the Railways
A Sectoral Review of Efficiencies in Administered Pricing in South Africa
132
In summary, Victoria’s regime is slightly different than the other states’ and the Commonwealth’s floor-ceiling band and negotiation model. Victoria instead constructs reference tariffs as points of reference for negotiations. The rail track owner must forecast his efficient cost for providing the service for the period, and this becomes the revenue cap; the reference tariff, therefore, must be set “at such a level that, across all declared transport services, the anticipated revenue is equal to [the] reasonable forecast”.364
Northern Territory and Tasmania access pricing
These last two states do not have specific state-level rail access regimes. This is because, in the Northern Territory, the only rail line is the northern portion of the new FreightLink-operated AustralAsia Tarcoola-to-Darwin line. As such, all access issues to the line fall under the jurisdiction of South Australia’s AustralAsia regime, which was described above.365 In Tasmania, the entire network is one vertically and horizontally integrated entity owned and operated by PacificNational. As Tasmania is an island, there is no interstate rail freight traffic that would need access, though the question of whether or not efficiency would be enhanced if more above-track operators were on Tasmania’s rail network remains valid.
364 Australian Productivity Commission 2006, 5.7 365 Essential Services Commission of South Australia, May 2006

Prices, Investment and Efficiency on the Railways
A Sectoral Review of Efficiencies in Administered Pricing in South Africa
133
Source: ANTT
Appendix 5 – Brazil
The Brazilian rail system is the largest in Latin America in terms of transported cargo in ton-km, and the seventh largest in the world in terms of cargo volumes. In 2005 the Brazilian railway system transported 221.6bn kilometre-tonnes of cargo.366 Brazil has about 29 706km of track, of which approximately 29 314km (98.7%) is concessioned to private entities. The 29 314km rail network has 82% standard gauge (1m), 17% broad gauge (1.6m) and 2% mixed gauge, i.e. standard and broad gauges (1/1.6 m). Only about 7% of the total rail line is electrified. About 1 089km (3.7%) of the 29 314km is urban passenger rail track.
Figure 19 – Major railway lines in Brazil
366 ANTT, www.antt.gov.br
Existing railway lineRailway line in constructionPlanned railway line
Existing railway lineRailway line in constructionPlanned railway line
Formatted: English(U.S.)

Prices, Investment and Efficiency on the Railways
A Sectoral Review of Efficiencies in Administered Pricing in South Africa
134
Most of the track is concentrated on the southern, south-eastern and north-eastern regions; a north-south rail linkage is non-existent (see Figure 19). The shape of the rail network is to a large extent influenced by the presence of substantial navigable waterways in the north, which provide freight functionality in that region. The railway system also services part of the mid-west and north of the country. A large part of the railway network in Brazil crosses west to east, linking the interior with the ports of Santos, Paranaguá, Rio de Janeiro, and Recife. The railway system is therefore concentrated in the three states; São Paulo, Minas Gerais and Rio Grande do Sul.367 As a result, long distance rail services are extremely limited, leaving haulage of agricultural products produced in Northern and Central Brazil to truck haulage firms.
Figure 20 and Figure 21 illustrate how modal shares of the freight task have changed in recent years in Brazil in ton-km. As can be seen, the bulk of freight in both 2000 and 2005 was transported by road. However, the share of road decreased from 60% of cargo to 58% of cargo over the five-year period, while rail’s share of the freight task has grown from 21% to 25%. Compared to rail’s modal share before restructuring took place, this performance is even more impressive – RFFSA carried only 17% of freight prior to restructuring.368
Figure 20 – Modal shares of the Brazilian freight market, 2000
Figure 21 – Modal shares of the Brazilian freight market, 2005
Water14%
Rail21%Road
60%
Air & Pipeline5%
Water13%
Rail25%
Road58%
Air & Pipeline4.0%
Source: Adapted from ANTT, 2000 Source: Adapted from ANTT, 2005
367 Datamonitor (2006) pg 12. 368 Valor setorial ferrovias, Setembro, 2006. www.valoronline.com.br.

Prices, Investment and Efficiency on the Railways
A Sectoral Review of Efficiencies in Administered Pricing in South Africa
135
According to the Associacão Nacional dos Transportadores Ferroviarios (ANTF), about 85% of the goods handled by the Brazilian railway system are destined for export. Despite the dominance of road transport over rail, analysts argue that in Brazil, rail transport is more economic or cheaper than road transport from a distance of 200km and above369. Rail transport is the second cheapest mode of transport after water transport in Brazil.
Major players in the Brazilian rail industry
The major players in the Brazilian rail sector are the concessionaires and the regulatory agency ANTT. Table 37 gives a breakdown of major players in the Brazilian rail sector (freight). The biggest railway companies in Brazil in terms of track length are Ferrovia Centro-Atlântica S.A., ALL-America Logistica do Brasil S.A. and Companhia Ferroviária do Nordeste S.A. Together these three companies control just over 69% of the concessioned track in Brazil, with the remaining 31% shared among nine concessionaires. The typical cargo transported by the Brazilian rail system comprises of steel, mineral products, grains and agricultural products, fertilisers, petroleum products and fuel, and construction materials.
369 Ibid, pg. 8.

Prices, Investment and Efficiency on the Railways
A Sectoral Review of Efficiencies in Administered Pricing in South Africa
136
Table 37 – Major players in the Brazilian rail industry (freight)
Concessionaire Track length (km)
Track (as % of
total)
Number of locomotives
(2005)
Number of wagons (2005)
Main cargo transported
Ferrovia Novoeste S.A. 1 942 6.88 180 3 440
Minerals, soybeans and by-products, fuel and general cargo
Ferrovia Centro- Atlântica S.A. 8 093 28.67 621 12 069
Steel, minerals, cement and construction material, soybeans, and fuel
MRS Logística S.A. 1 674 5.93 329 12 928 Minerals, soybeans and by-products, steel and coal
Ferrovia Tereza Cristina S.A. 164 0.58 10 429 Coal and by-products,
cement and ceramic productsALL-America Logistica do Brasil S.A.
7 225 25.60 463 12 806Agricultural products, soybeans and by-products, fuel, cement and fertilisers
Ferroeste/Ferropar 248 0.88 - -Agricultural products, soybeans and by-products, cement and fertiliser
Estrada de Ferro Vitória a Minas 905 3.21 348 19 857 Minerals, steel, agricultural
products, and coal Estrada de Ferro Carajás 892 3.16 119 8 316 Minerals, steel, soybeans, and
fuel Companhia Ferroviária do Nordeste S.A.
4 238 15.02 93 1 703Minerals, steel, agricultural products, coal, fuel and cement
Ferrovias Bandeirantes S.A. 2 029 7.19 54 11 255
Minerals, fertiliser, soybeans and by-products, sugar, fuel and agricultural products
Ferrovias Norte do Brasil 504 1.79 117 6 756 Soybeans and by-products,
fertiliser and fuel Estrada de Ferro Norte Sul 311 1.10 - - Not available
Total 28 225 100.00 2 394 90 119
Source: ANTT (2006)
A brief history of rail regulation in Brazil
The institutional evolution of the Brazilian rail sector can be divided into three phases. The first phase was initially characterised by private investments in rail – the very first rail line in Brazil, completed in 1854, was financed by British capital, for example, and in the São Paulo area, coffee growers began to finance their own railway lines. Railway development was concentrated in the eastern coastal regions/south-eastern states to aid transport in the agricultural regions not served by navigable rivers. The hinterland produced non-subsistence export products, and as a consequence the railway system was designed to connect the hinterland and the ports in the Atlantic Ocean.
However, government quickly began to play an important role in rail. Even in the 19th century, government acted to encourage private investments in the rail sector, by extending minimum rate-of-return guarantees to private investors. These guarantees

Prices, Investment and Efficiency on the Railways
A Sectoral Review of Efficiencies in Administered Pricing in South Africa
137
proved to be costly to Treasury, with government having to bail out a number of non-performing lines. By the beginning of the 20th century, government controlled one third of the network, and public intervention was increasingly important in the determination of freight tariffs. The direct role of the state grew rapidly, and by 1929, about 67% of railway companies in Brazil were owned by the state, which administered 41% of the rail network (about 10 000 km of rail)370.
However, increasing government participation in the sector did not prove to be benign. Lines under government control were often neglected or mismanaged, and the railways were seen as slow, unreliable and inefficient by customers371. When the road network and the competitive trucking sector began to take off in the late 1950s, rail was thus poorly positioned to compete, and lost substantial market share. The decline of the rail sector was further exacerbated by policies which favoured the road sector. In the 1950s, the government offered investment incentives to the road sector through the National Road Fund, financed by a special tax on the consumption of petroleum products, while investments in the rail sector were almost non-existent. These incentives biased inter-modal competition in favour of road.
The second phase of Brazilian rail development was characterised by the deliberate nationalisation of the rail sector. Nationalisation was seen as a potential solution for the fiscal burden imposed by the railways – loss of market share to road had eroded profits, and thus increased the rail subsidy burden on the Treasury. In 1957, the state owned Federal Rail Network Corporation or Rede Ferroviária Federal, Sociedade Anônima (RFFSA) was created through a federal law. RFFSA was incorporated under the Ministry of Transport, and was created through a merger of eighteen independent railways, built mostly by British and French concessionaires at the beginning of the nineteenth century, which government had bailed out in previous decades. The incorporation of RFFSA was part of a National Development Plan to promote efficiency through direct government intervention in the operation of the economy. RFFSA’s mandate was to stabilise the losses by the railway sector, which at the time, accounted for 90% of the public deficit.
The expected efficiency gains did not however materialise. Over time, the lack of an explicit business plan for the rail business, coupled with constant government intervention in RFFSA’s decision making process, and political interference with the company’s employment policy, led to years of insufficient earnings and inadequate capital investment.372 At its peak, RFSSA had 160 000 employees for a railway track of about 29 000 km. In addition, RFFSA was burdened by excess capacity and uneconomic rail lines, especially in the Northeast. A substantial portion of RFFSA’s tracks operated at well below minimum levels of efficiency, with revenues failing to cover even variable costs. The ability of rail to earn economic returns was impaired by government policy: until 1989, tariff levels and structure were set by government, and tariff policy was subordinated to the wider framework of anti-inflation policy.373 Rail
370 De Castro 2002, pg 3. 371 The Economist (1999). Trucks to trains. 372 Estache et. al.,(2000), pg.1. 373 Estache et. al.,(2001), pg.16.

Prices, Investment and Efficiency on the Railways
A Sectoral Review of Efficiencies in Administered Pricing in South Africa
138
pricing policies in Brazil were thus motivated principally by political considerations, in particular the need to subsidise tariffs to attain income distribution goals.
During this period, some attempts were made to achieve greater efficiency. For example, between 1975 and 1995 RFFSA reduced its staff by about 62%, from 110 000 employees in 1975 to 42 000 employees in 1995. This reduction was associated with a substantial increase in labour productivity, from 250 000 to almost 1m net ton-kms per employee.374
In 1971 another state operator was created in the form of São Paulo State Corporation, Ferrovias Paulistas, Sociedade Anônima (FEPASA). FEPASA was created through the consolidation of five bankrupt private rail lines375 operating in the state of São Paulo. RFFSA and FEPASA now had a network of over 27 000km of track, and provided rail transport services to about 95% of the country’s freight shippers.376 The third important player in the railway sector during this period was the huge state-owned industrial holding company, Companhia Vale de Rio Doce (CVRD). CVRD owned and controlled two freight lines; Estrada de Ferro Vitória a Minas (EFVM) and Estrada de Ferro Carajás (EFC). These freight rail lines transported minerals, mostly iron ore, from CVRD mining sites to the ports in the centre-north of the country for export.
The third phase of the institutional evolution of the Brazilian rail sector was characterised by the rail restructuring processes and privatisations of the 1990s. As discussed, prior to privatisation, Brazil had four principal railway systems – the national railway RFFSA, FEPASA in São Paulo State, and the two railways owned by CRVD. RFFSA was the largest, accounting for almost two thirds of the Brazilian rail system. Therefore the pre-restructuring period was characterised by vertical integration at each operator, and horizontal separation along geographic lines.
Rail restructuring was prompted by the unsatisfactory operational and financial performance of RFFSA, which had led to underinvestment, insufficient maintenance, and the deterioration of tracks, motive power, and rolling stock. Locomotive availability, a critical determinant of production capability, kept on decreasing, and by 1994, had fallen below 60%. Accidents were also on the rise: in the first eight months of 1995 more than 200 accidents occurred. Breakdowns were frequent and speeds were slow due to the bad state of the rail infrastructure. Moreover, labour productivity was low because of the over-large workforce. All these factors combined led to the loss of most of the rail sector’s cargo market share to trucking.
The National Privatisation Programme or Programa Nacional de Desestatilização (PND) began in 1992, with the inclusion of RFFSA in a wider Brazilian privatisation program. The PND was compelled largely by the need to reduce the subsidy burden of the freight rail sector, which had risen to about R$350m per year.377 The overall
374 Ibid, pg 3. 375 De Castro 1999, pg 4. 376 Campos 2002, pg 9. 377 ANTT (2006). Evolução Recente do Transporte Ferroviário

Prices, Investment and Efficiency on the Railways
A Sectoral Review of Efficiencies in Administered Pricing in South Africa
139
privatisation strategy, and subsequent concessioning of the rail system, was under the responsibility of Banco Nacional de Desenvolvimento Econômico e Social (BNDES), a public sector credit institution.
The PND aimed to achieve the following objectives at RFFSA378:
Administrative decentralisation from the federal to the state level, and from the states to the municipalities.
Reduction in the participation of the public sector in productive activities and basic infrastructure investments, and a corresponding increase in private participation.
Restructuring of economic regulation, in order to open markets to service competition.
FEPASA was transferred to the federal government in 1997, incorporated into RFFSA, and included in the privatisation programme in 1998.379 In 1997, CVRD was privatised and the two specialised railroads (EFV and EFC) were sold with it, but not concessioned in the same way as the RFFSA network. These railways now operate as internal departments of CVRD, specialising in iron ore traffic. However they operate under an obligation to carry traffic for other shippers as requested.
Several options were considered for restructuring the rail sector before policy makers settled on horizontal separation by geography. Operational separation was accomplished between 1996 and 1998; and six vertically integrated regional monopolies were created. Concessions on these monopolies were then auctioned off to private operators through public competitive bidding (see Table 38). The auction process thus allowed the government to create competition for the market. Vertical integration was accomplished by giving concessionaires rights to operate and manage infrastructure (for an initial 30 years, with extension possible for another 30 years), while the state retained ownership of infrastructure. Operating assets were simultaneously leased to the concessionaire by RFFSA for the same period, and small non-operational assets were sold off.
There were no pre-qualification requirements for candidates bidding for concessions. There were also no restrictions imposed for cross participation in different concessions, or on the participation of major rail users, clients or suppliers as shareholders in concessions. In practice, this failure to restrict concession ownership proved problematic: in particular, captive shipper behaviour has been observed at some concessionaires, who have charged associated companies (i.e. affiliates and shareholders), lower rates than unaffiliated shippers. As a rail regulator was only introduced five years subsequent to the restructuring, there was initially no mechanism for inhibiting these kinds of behaviours at concessionaires. There was thus inadequate recognition of the fact that a concession gives an operator a monopolistic power that needs to be controlled.
378 De Castro 2004, pg 2. 379 Estache Op. cit., pg. 19.

Prices, Investment and Efficiency on the Railways
A Sectoral Review of Efficiencies in Administered Pricing in South Africa
140
The one limit imposed on concession shareholding was a 20% share ownership limit, designed to avoid excessive concentration of ownership. However, the potential for indirect control was not effectively limited, and cross-participation between more than one concession was allowed. Excessive concentration or conflicts between different rail users was thus still possible. A number of vertically integrated structures arose, with propensities to carry out strategic behaviours in terms of price discrimination, blocked access, or limitation of services to other users. Currently, the majority of the rail concessions are held by three groups, and thus concentration levels are higher than may originally have been expected.
The concessions were won by the highest bidding consortium, above the minimum stipulated by the state. The contracts did not set out any investment obligations, but did specify specific targets on output and safety, in terms of minimum net ton-kilometres carried each year and maximum number of accidents per train-kilometre during the first five years. These targets were different for each concessionaire, based on the state of each concessionaire’s network, and they were to be reviewed during the third concession year. Some analysts380 argue that the compulsory achievement of annual output and safety targets specified in the contracts comprised indirect investment incentives, because in order to achieve the targets, the concessionaires would have to improve the state of infrastructure. Moreover, the contracts outlined a system of penalties to be imposed if targets were not met.
Table 38 below shows various rail segments which were previously under RFFSA (excluding CVRD lines), which were concessioned to private operators between 1996 and 1998. The process of privatisation ultimately resulted in the liquidation of RFFSA.
Table 38 – Brazil freight railway concessions
Segment Date of auction
Concessionaire Date of
operation Length of line
concessioned (km) Oeste 5 Mar 1996 Ferrovia Novoeste S.A. 1 July 1996 1 621 Centro-Leste 14 July 1996 Ferrovia Centro-Atlântica
S.A. 1 Sept 1996 7 080
Sudeste 20 Sept 1996 MRS Logística S.A. 1 Dec 1996 1 674
Sul 13 Dec 1996 ALL-America Logistica do Brasil S.A. 1 Mar 1997 6 586
Nordeste 18 July 1996 Companhia Ferroviária do Nordeste 1 Jan 1998 4 238
Paulista 10 Nov 1998 Ferrovias Bandeirantes S.A. 1 Jan 1999 4 236 Total 25 599
Source: Agência de Transportes Terrestres381 (ANTT)
The concessions were accompanied by massive job cuts. By 2001 concessionaires had a total labour force of 8 951, a 78.7% decrease on 1992’s workforce of 42 000 - a pre-privatisation period.382 To limit social problems arising from redundancies, the
380 Campos and Jimenez 2003, pg. 16. 381 Agency for Land Transport under the Ministry of Transport 382 Ibid, pg. 20.

Prices, Investment and Efficiency on the Railways
A Sectoral Review of Efficiencies in Administered Pricing in South Africa
141
government included an extremely generous redundancy package in the restructuring process, which corresponded to about twenty-one months of salary. The redundancy package included incentives for early retirement and voluntary separation, involuntary separation grants for the remaining redundant staff, retraining programmes aimed at regional employment opportunities, and job search and outplacement assistance.383
Regulation and pricing
Post-privatisation, before the introduction of ANTT, regulation of the rail system was not unproblematic. Regulatory responsibility, for example, was not particularly clear, as a number of institutions were involved in the supervision of railway contracts, including the Ministry of Transport. Moreover, the role of RFFSA was unclear, since it still owned all rail assets, was liable for its accumulated debts, and managed the information system that kept the trains running.384 In the first five year after the restructuring process, the Brazilian rail sector operated without a regulator. However, it should be noted that the concession contracts contained several regulatory clauses, which are discussed in more detail below.
Since June 2001 the regulation of the rail sector has been under the responsibility of Agência Nacioanal de Transportes Terrestres (ANTT). ANTT is a separate regulatory entity whose main goal is to supervise the concessionaire’s performance. ANTT’s broad mandate is to regulate the services offered by the concessionaires, and to regulate the use of railway infrastructure concessioned to private operators. Authority to limit anti-competitive behaviours is shared with separate competition authorities. Where price discrimination is alleged, but the allegation does not involve tariffs regulated by ANTT, Conselho Administrativo de Defesa Econômica (CADE), the competition authority under the Ministry of Justice, has prime jurisdiction.385
The concessionaires are allowed to set their own prices, in terms of pricing guidelines outlined on the concession contracts. The concession contracts stipulate that tariffs may be distance related, and may include payments for extra services such as loading and unloading. The contracts also set maximum prices (cap prices) that can be charged for transport services, which vary according to the length386 of the haul, type of product and the geographic region served. The initial cap prices were based on the prices that were applied by RFFSA during the pre-restructuring period. These prices took into consideration the fixed and variable costs of offering a service, plus a profit margin. The cap prices are adjusted periodically for inflation, to enable the concessionaires to make a profit, or to maintain an economic equilibrium.
The adjustment of cap prices is done by ANTT in consultation with the concessionaires. ANTT carries out economic studies on the risk profile, cost structure and profitability of each concessionaire. The studies also take into account the costs (both variable and fixed) incurred by each concessionaire to offer a particular service.
383 Thompson and Budin 1997, pg. 7. 384 Campos, J., opcit., pg. 21. 385 OECD 2005, pg. 89. 386 There are four distance bands i.e. 0-400km, 401-800km, 801-1600km and 1601km and above.

Prices, Investment and Efficiency on the Railways
A Sectoral Review of Efficiencies in Administered Pricing in South Africa
142
Concessionaires can charge any price that does not exceed the cap prices. The concessionaires are required by ANTT to submit monthly reports on price structures, disaggregated by product, origin, destination and client. If prices are found to be above the cap prices stipulated by ANTT, and the concessionaire cannot justify the discrepancy, ANTT imposes punitive fines for breach of contractual obligations by the concessionaire. The concession contracts further stipulate that tariffs should always be above long run variable cost. However, no methodology is provided in the concession contract for the calculation of long run variable costs.
With regards to third party access, the contracts include fairly brief provisions on access rules to other networks, which do not define access pricing mechanisms. This was in part due to the fact that there was little cross-concession traffic in the old RFFSA network, due to differences in distances and gauges of regional networks. Furthermore, traditional cargoes were only transported in the east-west direction i.e. from inland to the ports.
As it currently stands, interested parties are expected to independently reach agreement on third party access issues. If consensus cannot be reached, the government, through the Ministry of Transport, will review the problem and has the power to enforce compulsory rates. The concessionaires are also expected to carry joint traffic or, if joint traffic is not feasible, to allow the connecting railway access to their tracks so that the movement of goods can be completed. The tariffs for joint traffic again are to be set by negotiation, with the government to step in if negotiations fail. Thus, this mechanism favoured bilateral, market based solutions among concessionaires on issues of third party access, with the power of arbitrage residing at the MoT, with no recognition of potential abuses of market power.
The later experience of Brazilian rail suggests that third party access issues and cross-concession traffic were not adequately addressed at concessioning. In particular, initial regulatory arrangements were not adequate to deal with changes in freight movement patterns. The east-west traffic pattern shifted, as new products, and in particular final goods and semi-processed commodities created more north-south traffic, and the ability to ship goods across several concession areas became increasingly important. The existing contract provisions proved unequal to the task, and by 1999, complaints about access tariffs were common among the carriers.387
Outcome of rail privatisation in Brazil
Despite the competition and regulatory problems that later emerged, the evidence largely suggests that the restructuring process has overall been successful. The privatisation process in Brazil has significantly improved the performance of the rail industry, and contributed to substantial savings for Treasury. The Treasury currently receives R$400 million per year on tax collections and licence fees from the concessionaires,388 which contrasts strongly with the annual R$350m subsidy burden of the rails prior to restructuring. From 1997 to 2005, cargo transported by wagons
387 Campos 2001, pg. 89. 388 ANTT (2006). Op.cit., p.g. 3.

Prices, Investment and Efficiency on the Railways
A Sectoral Review of Efficiencies in Administered Pricing in South Africa
143
increased by 55% from 253m to 392m tonnes per km, and accidents decreased by 56%. The market share of rail traffic has increased from 21% to 24%, and wagon productivity has increased by 94%.389 As depicted in Figure 22, investments in the rail sector by concessionaires have been increasing since 1996. Investments by private operators between 1997 and 2005 were valued at R$9.5bn.
Figure 22 – Investments by concessionaires, 1996-2005
Source: Genesis calculations from ANTT data
Figure 23, on the other hand, indicates that the share of government investments in the Brazilian rail sector have been declining since 1997. According to Figure 23 investments by government in the rail sector have decreased from 28.9% in 1997 to 1.4% in 2005. Thus, government has successfully been able to shift the rail investment burden to the concessionaires, while total investment in rail has simultaneously grown strongly.
389 Briginshaw 2005.
0
500
1000
1500
2000
2500
3000
3500
4000
1996 1997 1998 1999 2000 2001 2002 2003 2004 2005
Year
$R M
illio
n

Prices, Investment and Efficiency on the Railways
A Sectoral Review of Efficiencies in Administered Pricing in South Africa
144
Figure 23 – Investments by concessionaires and government 1997-2005
Source: Adapted from Valor Economico S.A. (2006)
Since privatisation, rail traffic has increased by 60.2%, from 138.3 tonne-km in 1997 to 221.6 tonne-km in 2005, as shown in Figure 24. This equates to total growth for the period of 60.2%, or a compound annual growth rate of 6.1%.
However, despite an overall successful restructuring process, a few problems still persist. The average distance travelled by trains (freight) in Brazil has remained almost unchanged, at 545km compared to the average of 1 300km in the U.S. This is suggestive of an absence of investments in new rail lines. It may also suggest that the concessionaires have not been giving access rights to each other and/or they have not been transporting goods jointly. The speed on rail lines, which is indicative of the quality of infrastructure, has remained unchanged at around 29km per hour.
71.177.4
92.3 91.7 93 92.3 96.9 99.6 98.6
28.922.6
7.7 8.3 7 7.7 3.1 0.4 1.4
0
10
20
30
40
50
60
70
80
90
100
1997 1998 1999 2000 2001 2002 2003 2004 2005
Year
Perc
ent
Concessionaires Government

Prices, Investment and Efficiency on the Railways
A Sectoral Review of Efficiencies in Administered Pricing in South Africa
145
Figure 24 – Volumes transported by the Brazilian rail sector 1997-2005
Source: Genesis calculations from ANTT data
The Brazilian government has realised that concessioning cannot be the entire answer; significant public as well as private investment will be required.390 The government has financed the Ferrovia Norte-Sul, a 2 200km US$1.6bn federal project to link the agricultural areas of the interior to the coast, of which only 215km have been completed to date, due to funding limitations. The government, through BNDES, is currently seeking private sector investors to participate in the project. In May 2003 the Ministry of Transport announced a rail revitalisation plan, intended to stimulate increased private investment by modifications to the regulatory framework, and by restructuring concessions to permit government expenditure alongside private investment, in order to stimulate expansion.391
390 Sharp 2005, pg. 35. 391 Ibid, 22.
138300
162300170100
182700
205800221600
0
50000
100000
150000
200000
250000
1997 2001 2002 2003 2004 2005
Year
Mill
ion
tonn
e-km
Million tonne-km

Prices, Investment and Efficiency on the Railways
A Sectoral Review of Efficiencies in Administered Pricing in South Africa
146
Appendix 6 – Mexico
The Mexican railway system has a total of 26 662km of track length, of which 20 687km (77%) are principal lines, 4 419km (17%) are secondary lines and only 1 555 (6%) are private lines. About 84% (17 289km) of the principal lines are concessioned to private operators and about 16% (3 399km) are not concessioned. The track links major cities with the ports and Mexico City, the gateway for most cargo to the North American Free Trade Area (‘NAFTA’) (see Figure 25 below).
Figure 25 – Mexican railway system
Source: Adapted from Anuario Estadístico 2005, SCT
Within Latin America, Mexico has the second largest rail system after Brazil, in terms of volume transported by rail, and accounts for 20% of total regional ton-km. In 2004 the rail sector contributed about US$1bn to Mexican gross domestic product392
392 North American Transportation Statistics Database, 2007.
MEXICO CITY rail hubMEXICO CITY rail hubMEXICO CITY rail hubMEXICO CITY rail hub

Prices, Investment and Efficiency on the Railways
A Sectoral Review of Efficiencies in Administered Pricing in South Africa
147
(which is equivalent to about 0.16% of GDP), and in 2005 it transported 54.1 billion ton-kilometres of cargo. 393
Figure 26, Figure 27 and Figure 28 below illustrate the evolution of cargo modal shares in Mexico, in billion ton-km, between 1995 and 2005. As can be seen, the volumes transported by rail, water and road have all grown. While compound annual growth rates (CAGRs) have been about 2% for both water and road, rail has experienced more substantial growth of 3.7%.
Figure 26 – Evolution of cargo volumes transported by rail in Mexico
Figure 27 – Evolution of cargo volumes transported by water in Mexico
Figure 28 – Evolution of cargo volumes transported by road in Mexico
35
40
45
50
55
1995
1997
1999
2001
2003
2005
Billion ton-km Billion ton-km
15
17
19
21
23
25
27
1995
1996
1997
1998
1999
2000
2001
2002
2003
2004
2005
Billion ton-km
120
140
160
180
200
220
1995
1996
1997
1998
1999
2000
2001
2002
2003
2004
2005
Source: Genesis calculations from SCT data
Source: Genesis calculations from SCT data
Source: Genesis calculations from SCT data
Major players in the Mexican rail industry
As mentioned above, the bulk of the Mexican rail sector is composed of a number of rail concessionaires, as shown in Table 39 below. As illustrated in the table, the Mexican rail sector (freight) is dominated by Kansas City Southern de Mexico and Ferrocarril Mexicano, S.A. de CV, which together control just over 73% of concessioned rail track.
393 Anuario Estadistico Ferroviario 2005, Secretaria de Comunicaciones y Transportes

Prices, Investment and Efficiency on the Railways
A Sectoral Review of Efficiencies in Administered Pricing in South Africa
148
Table 39 – Major players in the Mexican rail sector (freight)
Concessionaire Concessioned lines Track
length (km)Track (as a % of total)
Kansas City Southern de Mexico Noreste 4 283 24.8
Ferrocarril Mexicano, S.A. de C.V.
Troncal Pacifico-Norte, Linea Corta Ojinaga-Topolobampo and Via Corta Nacorazi
8 428 48.7
Ferrosur, S.A. de C.V. Sureste 1 479 8.6 Linea Coahuila-Durango, S.A. de C.V. Coahuila-Durango 974 5.6
Compañia de Ferrocarriles Chiapas-Mayab, S.A. de C.V. Chiapas-Mayab 1550 9
Terminal y Ferrocarril del Valle de México, S.A. de C.V.
Terminal Ferroviaria del Valle de México 297 1.7
Ferrocarril del Istmo de Tehuantepec, S.A. de C.V.
Ferrocarril del Istmo de Tehuantepec 207 1.2
Administradora de la Via Corta Tijuana-Tecate Via Corta Tijuana-Tecate 71 0.4
Total 17 289 100
Source: Adapted from SCT, 2005
Industrial products (52%), agricultural products (23%) and minerals (14%) form the bulk of cargo transported by rail in Mexico in ton-km (see Figure 29). Container cargo is thus a much more important component of Mexican rail traffic than in South Africa, or indeed the other comparison countries selected. Another key difference in Mexico is the existence of an important neighbouring trade partner, namely the USA, with road and rail-based export and import routes.
Figure 29 – Share (%) of cargo transported by rail in Mexico
Source: Adapted from SCT
Agricultural Products
23%
Minerals14%
Petroleum Products7%
Inorganic Products4%
Industrial Products52%

Prices, Investment and Efficiency on the Railways
A Sectoral Review of Efficiencies in Administered Pricing in South Africa
149
A brief history of rail regulation in Mexico
As in the Brazilian case, railways in Mexico were financed and built by private interests in the late 19th century. US companies in particular used imported materials to build railway lines along Mexico’s Pacific coast. However, during the Mexican revolution (1910-17), 50% of rail infrastructure and equipment was destroyed,394 a major setback to initial progress. The sector flourished briefly during the Second World War before deteriorating rapidly in subsequent years.395
The largest rail company, Ferrocarriles de México (FDM), was transferred to Mexican ownership in 1908, and fully nationalised in 1937. The nationalisation of FDM seems to have been influenced by the economic policies that were adopted after the Mexican revolution. The 1917 constitution established the general jurisdictional framework under which the role of the state in the economy was defined.396 Central to government’s role in the economy, was the gradual take over (nationalisation) of firms in the Mexican economy.
In the 1980s FDM and other remaining lines were incorporated into Ferrocarriles Nacionales de México, SA de CV (FNM) -a state company controlled by the Ministry of Communications and Transport (Secretaría de Comunicaciones y Transportes, SCT). In 1983 the constitution was amended so as to reserve the ownership and operation of railway services to the federal government, based on the strategic importance of the industry.397
FNM operated as an integrated monopolistic railway company with a railway system divided into three main geographical regions, namely the Pacific-north, northeast and southeast. FNM provided local and international freight services and intercity passenger services. However, as with state owned railways elsewhere in Latin America, FNM’s performance was not satisfactory. FNM was running a deficit averaging around US$400m a year, which accounted for 5% of Mexico’s internal debt.398 Moreover, FNM was suffering from low productivity, underperforming assets and falling prices. Efficiency, service, reliability and competitiveness suffered from the absence of market discipline. FNM also faced railway rate policy constraints which required any tariff revisions to be ratified by government.399 The policy severely limited rail’s ability to compete with trucks, and significant market share was lost to the road sector.
In the late 1980s, the Mexican government began a privatisation process that would see the number of state-owned companies shrink from 1 155 in 1989 to 215 in 1994.400 Although rail did not form part of this initial privatisation process, a plan designed to begin the modernisation of the rail system was nevertheless launched in
394 Prentice et. al. 2000, pg 129. 395 Ibid, p.g. 129. 396 Chong and De Silanes, 2004, pg 6. 397 Roop et al 2001, 18 398 Sharp 2005, pg 23. 399 Banks and Associates, Inc. 2001,pg 15. 400 Roop et al 2001, 21

Prices, Investment and Efficiency on the Railways
A Sectoral Review of Efficiencies in Administered Pricing in South Africa
150
1988. Progress accelerated after the 1992 implementation of the 1992-1994 structural change program for FNM. At the inception of the program, FNM estimated that a US$2.3bn investment backlog would need to be remedied over the next five years.401 A decision was taken to ensure that half of financing would be derived from the private sector, and private participation in a number of areas was allowed, including “implementation of a reliable signal system, track maintenance, operation of intermodal facilities, and maintenance of locomotives and rolling stock.”402
A number of substantial changes were introduced during the 1992-1994 reform period, including the following:
A 41% decrease in staff numbers between 1990 and 1994 The replacement or reconditioning of 21% of locomotives and 13.5% of
railcars A 40% reduction in passenger services over the 1988-1994 period Substantial improvements in the quality of cargo handling, resulting in a 160%
increase in container volumes between 1990-1994403
Despite the rapid changes from 1992 onwards, rail continued to lose market share in the early 1990s. As shown in Figure 30, the major beneficiary of these changes was road freight.
401 Roop et al 2001, 18 402 Roop et al 2001, 18 403 Roop et al 2001, 19. On cargo handling services, specific improvements included “liberation of tariffs, increase of service quality, modernization of the operations technology, and the participation of the private sector in the construction and operation of intermodal terminal facilities.”

Prices, Investment and Efficiency on the Railways
A Sectoral Review of Efficiencies in Administered Pricing in South Africa
151
Figure 30 – Rail modal share
0%
5%
10%
15%
20%
25%
1990 1991 1992 1993 1994 1995 1996 1997 1998 1999 2000 2001 2002 2003 2004 200550%
55%
60%
65%
70%
75%
Rail (lhs) Water & air (lhs) Road (rhs)
Modal share Modal share
Source: Genesis calculations from SCT data
In 1995, a privatisation program for Mexican rail was implemented, under the Plan Nacional de Desarrollo 1995-2000. Constitutional provisions that declared railway transport as an activity exclusive to the State were amended, and a railway regulation law setting out the terms for concessioning was passed. Foreign investment laws were also amended to allow offshore investors to participate in the rail system. The goal of the privatisation program was to increase the efficiency of the rail system, intensify the focus on freight, and scale back unprofitable passenger services.404
The rail restructuring process occurred at about the same time as in Brazil, but stretched over somewhat a longer period than in Brazil, and SCT assumed a lead role in the concessioning process. The scheme chosen for privatisation in Mexico involved geographical separation of FNM’s assets and operations, so as to set up a number of competing route-based companies according to FNM’s pre-existing regional divisions. However, these regionally based divisions had historically operated less autonomously than those in Brazil, and separating them out in preparation for concessioning took longer than in Brazil.405 Due to national security and sovereignty concerns, the Mexican government maintained ownership of the track.406
404 Roop et al 2001, 20 405 Sharp, op cit, pg. 23. 406 Roop et al 2001, 20

Prices, Investment and Efficiency on the Railways
A Sectoral Review of Efficiencies in Administered Pricing in South Africa
152
Each of the concession companies was awarded a 50-year concession title, with the option to extend up to an additional 50 years. The concessionaires were allowed to operate, exploit and if required, build new lines, with the aim of providing public railway transportation and ancillary services in their respective titles. The granting of concessions and permits to private companies was governed by legislation passed in 1995, the Ley Reglamentaria del Servicio Ferroviario (Law Regulating Railway Services), and accompanying regulation passed in 1996, the Reglamento del Servicio Ferroviario (Regulation of the Railway Service).407
Table 40 below gives a breakdown of the results of the restructuring process. As seen in the table, the restructuring process took place between 1996 and 2000, with the two largest concessions granted in 1996 and 1997 respectively.
Table 40 – Mexico freight railway concessions
Segment Date of auction
Concessionaire Length of line concessioned
(km)
Noreste Dec 1996 Transportacion Ferroviaria Mexicana (TFM) 2 000
Troncal Pacifico-Norte, Linea Corta Ojinaga-Topolobampo and Via Corta Nacorazi
Jun 1997 Ferrocarril Mexicano (Ferromex) 8 000
Sureste Jun 1998 Ferrocarril del Sureste (Ferrosur) 1 500 Coahuila Durago Oct 1997 Linea de Coahuila Durago 1 000 Chiapas Mayab Jul 1999 Ferrocarrils Chiapas Mayab 1 500 Terminal Ferroviaria del Valle de México Dec 1996 Terminal Ferroviaria del Valle de
México 297
Nacorazi Apr 2000 Ferrovias Nordeste 71 Total 14 368
Source: Adapted from Allen (2001) and Sharp (2005).
As illustrated in Figure 31, rail privatisation was accompanied by massive job cuts, mainly through a programme of voluntary retrenchments. Between 1995 and 2005 the rail workforce was cut by about 70%. This downsizing has had tremendous effects in labour productivity improvements – from 812 700 ton-km/employee in 1995 to 4 041 700 ton-km/employee in 2005.408
407 Roop et al 2001, 21 408 Anuario Estadistico (2005). SCT.

Prices, Investment and Efficiency on the Railways
A Sectoral Review of Efficiencies in Administered Pricing in South Africa
153
Figure 31 – Rail labour force 1995-2005
Source: Genesis calculations from SCT data
The Mexico City Rail Terminal, Terminal Ferroviaria Valle de México, is a key component of rail infrastructure, as Mexico City is a very important freight destination, and the terminal is a shared piece of infrastructure for the various competing rail systems servicing the capital. The terminal was privatised in 1996, and started operations in March 1998. It is currently a jointly operated switch area and each of the main rail operators (TFM, Ferromex and Ferrosur) owns 25% of the shares, with the government retaining the remaining 25%. However, this ownership structure can be a source of potential access conflict among private operators given that the current owners are simultaneously customers of TFVM.
After the horizontal break up of FNM, the next stage of the privatisation process involved the sale of shares owned by the government in the concessionaire companies through a bidding process open to private investors. The government initially sold 80% of its shares of the capital stock of each company through a sealed bid auction to be won by the highest bidding consortium. The remaining 20% stake in each company was to be sold within 5 years of initial transfer.
Regulation and pricing
The regulatory body in the Mexican rail sector is the DGT, under SCT. The DGT is responsible for supervising the activities of the concessions, devising the general policy for the industry, regulating prices and acting as an arbiter in case of conflict
46283 45544
35583
23376
1746515184 14208 14006 13614 13405 13535
0
5000
10000
15000
20000
25000
30000
35000
40000
45000
50000
1995 1996 1997 1998 1999 2000 2001 2002 2003 2004 2005
Year
Empl
oyee
s

Prices, Investment and Efficiency on the Railways
A Sectoral Review of Efficiencies in Administered Pricing in South Africa
154
among concessionaires. Unlike in Brazil, in Mexico the regulatory body does not set maximum prices. However, concessionaires are required by law to register a maximum price with DGT ten days before they go into effect.409
The concession titles allow the concessionaires to set their own prices in recognition of the extensive competition they face from trucks, and the potential for competition among the concessions. The prices set have to take into consideration the maximum prices registered at DGT. The DGT, after consultation with the competition agency, can intervene if no effective competition exists between concessionaires. It can also intervene if shippers complain of market abuse by the concessionaires.
Concessionaires were given an exclusive right to operate services and infrastructures for 30 years in their lines, including the right to build new ones in areas within their right of way. To avoid market power abuses that could arise from this monopoly, concession titles included mandatory access and connecting rights between concessionaires. The prices of these rights were to be bilaterally negotiated between private operators, and DGT would intervene if no agreement could be reached between concerned parties.
Unlike Brazil, Mexico paid considerable attention to protecting competition in designing its concessions. The competition commission participated actively in the restructuring process and the development of the regulatory framework, to prevent potential competition issues. Comision Federal de Competencia (CFC), the competition agency, screened bidders for issues potentially harmful to competition. In contrast to Brazil, particular care was taken to avoid cross holding and cross-subsidisation between the new owners of regional lines. CFC in conjunction with the sectoral authorities decided that main line concessionaires would not be able to hold more than 5% of any other main line company.410
Outcome of rail privatisation in Mexico
The major outcome of the restructuring process has been the elimination of government’s subsidy burden, which was in the region of US$460m annually prior to the restructuring. The government received over US$2bn in revenue from the rail concession auctions alone.411 Private sector investments have also been substantial during the post-privatisation period. The investments have been driven largely by the growth in trade associated with the establishment of the North American Free Trade Area (NAFTA). Between 2001 and 2006, investments on infrastructure by private operators amounted to MXP$14 196.3m, and in 2006 alone investments of MXP$1 851m on infrastructure were made.412 These are huge investments compared to the pre-restructuring period, where investments were very limited. Moreover, the number of services offered or available in the rail sector has increased in the post-privatisation period, and the volume of freight carried by rail has stabilised.
409 Allen 2001. 410 Campos 2002. pg 16. 411 Thompson and Budin 2001, pg 7. 412 SCT 2006, pg 50.

Prices, Investment and Efficiency on the Railways
A Sectoral Review of Efficiencies in Administered Pricing in South Africa
155
The main lesson learnt from the Mexican experience is that it is important to use the competition agency to check that the concessioning process does not harm public interest. In Mexico the involvement of the competition authority from the beginning of the restructuring process was crucial in curbing anti-competitive behaviours that might have arisen from privatisation. Although potential conflicts still exist with regards to access issues at the Mexico City Terminal, the Mexican authorities have been able to address competition issues carefully during the restructuring period.
Prices, Investment and Efficiency on the Railways
A Sectoral Review of Efficiencies in Administered Pricing in South Africa
156
Appendix 7 – Industry feedback
A number of concerns about the rail industry were raised consistently by industry participants during the interview process. For interests’ sake, we include a précis of these themes below. In order to protect the confidentiality of interviewees, the anecdotes are unreferenced.
Logistics efficiency is increasingly recognised as a key component of overall productive efficiency. A good logistics chain allows inventory to be minimised, and allows a company to respond quickly to changes in demand conditions. This is embodied in the theory of ‘just-in-time’ delivery, which has dominated international developments in logistics solutions in recent years. However, a just-in-time producer is highly dependent on the underlying efficiency and responsiveness of their supply chain. At present, the evidence suggests that Spoornet is unable to provide this kind of supply chain support for most customers (although the ore lines may be an exception).
Staff turnover issues
Spoornet has spent much of the last decade in one or another restructuring process. Such restructurings typically have an impact on staff deployment and retention, and Spoornet has been no exception to this rule. However, because the restructuring processes have dragged on over such a long period of time, they have been particularly disruptive to the client base.
One of the most visible problems to the client base is the level of turnover in account managers. Staff tenure in this department seems to be so short at present that it is becoming atypical to negotiate with the same account manager on pricing terms two years in a row – the learning an account manager accumulates during the negotiating process is thus lost to the client, who needs to start educating the new manager from the beginning every year. Reduced security of tenure also reduces the willingness of account managers to take chances and make decisions.
The only exception to this rule uncovered by the research seemed to be on one of the two ore lines, where staff turnover was limited. Unsurprisingly, service levels on this line are much higher than on the rest of the network.
Slow response times
Changing line capacity in rail is a time-consuming process. Even if only the rolling stock needs to be replenished, it can easily take 18 months from commissioning to delivery to get new locomotives and wagons. When possible bottlenecks in the rail network are identified, it is thus critical to start planning for new investments sooner rather than later. Spoornet’s track record on expediting such new investments is, however, not good. To some extent this may be a symptom of high staff turnover levels, which can inhibit the willingness and ability of account managers to plan for the long term.

Prices, Investment and Efficiency on the Railways
A Sectoral Review of Efficiencies in Administered Pricing in South Africa
157
Scheduling
Train scheduling is a key part of rail network management. Good scheduling allows maximum capacity to be realised, and vice versa. Planning for seasonal peak periods is expedited by scheduling, and it is also vital if the network is shared, for example on those parts of the network where both freight and Metrorail’s commuter services run. Spoornet traditionally scheduled only seven days in advance, which was not adequate to realise the potential efficiency improvements embodied in appropriate scheduling.
Under the new scheduling regime, planning is done much further in advance at a national operations centre (NOC). However, there is still evidence that scheduling is not adequate to meet client needs. In particular, it is suggested that warehousing facilities at the ports are overly large in order to deal with the unreliability of supply on the overland route. GFB trains are still not fitted with tracking devices,413 and the NOC thus relies on the station manager, pen and paper in hand, to notify them of where their trains are. It is not unknown for wagons to be ‘misplaced’ in shunting yards, and clients often must resort to phoning contacts at each station on their route to confirm telephonically where their goods are.
Because train arrivals still vary so much, many GFB clients claimed that Spoornet effectively fails to address their volume requirements. For example, during peak harvest season, trains may be diverted to moving grain, and a factory which produces continuously may need to stockpile its goods, or move them via road. Conversely, when the seasonal rush ends, Spoornet may try to compensate by increasing the number of trains sent to the client. However, the client continues to produce at a constant rate, so eventually it must start turning trains away empty.
Good scheduling also impacts directly on Spoornet’s operating model. For example, some clients have historically used Spoornet wagons as storage facilities, which takes the wagon out of the fleet for inconvenient lengths of time, at some cost to Spoornet. Spoornet has tried to introduce a penalty fee for such clients, similar to the demurrage fee charged by shipping lines. However, it has had trouble with implementing such fees, as it cannot guarantee when the train will arrive and depart, which affects the client’s ability to offload quickly. Scheduling issues probably also affect the willingness of union members to do overnight trips – if Spoornet cannot assure the driver when and where he or she will be required to overnight, their quality of life may be unacceptably impaired.
Managerial concerns
Several of the large customers interviewed indicated that they were liaising closely with Spoornet in order to improve the quality of service from rail. The customer is thus often providing substantial amounts of technical and managerial assistance to
413 Industry participants suggest that a contract to fit trains with tracking devices is at present in the process of being finalised. In the interim, however, it is apparently not uncommon for a Spoornet client to be reassured by a station manager that a given train is not at their station, while it is in fact sitting a few metres outside.

Prices, Investment and Efficiency on the Railways
A Sectoral Review of Efficiencies in Administered Pricing in South Africa
158
Spoornet. It is normal to see quite a bit of give and take between customer and supplier in just-in-time logistics chains, but the domestic reliance on customer technical advice seems excessive – in particular, it seems that without such assistance, Spoornet is unable to react effectively to customer suggestions for process improvements. With some exceptions, particularly on the ore export lines, progress on efficiency improvements seems to be largely dependent on customer inputs.
Age of assets
The need for substantial investment in the rail network is well documented. Market commentators estimate that “the South African rail network is 35 years behind the state of art in railway technology and rail design.”414 The average age of the locomotive fleet is 25 years, as compared to a world benchmark average age of 15 years, for example, and the average age of wagons is 27 years, as compared to the North American average of 17 years (with GFB wagons averaging 35 years, and some operating Spoornet wagons older than 50 years).415 The estimated investment backlog for rail freight infrastructure is R12bn.416
Old assets affect efficiency in two ways. Firstly, technological change is often embodied in the assets used. It is thus often not possible for a system that uses old assets to use cutting edge operational techniques, and efficiency can only be raised to the levels expected when the equipment was designed.
Secondly, old equipment fails more frequently, particularly when maintenance expenditures are low. Equipment failure erodes the size of rolling stock inventory – in the interviews, one client claimed that inadequate maintenance had reduced the size of their dedicated fleet by almost a third. It also impairs the ability of Spoornet to keep to its schedules, and provide a logistics service that conforms to clients’ logistics needs.
In a related issue, on several of the client interviews concern was raised about the ability of Spoornet to maintain equipment at levels adequate to prevent environmental damage. Many Spoornet clients carry environmentally dangerous minerals, chemicals and fuels, using specialised wagons from the Spoornet fleet. Such equipment needs to be tested at defined intervals to ensure that it is still up to standard, but clients suggest that they have to chase Spoornet to ensure that this happens, and to deal with the checking backlogs that have already accumulated. When spills do happen, furthermore, it is not unknown to find that Spoornet cannot produce supporting documentation for environmental agencies – this can expose the Spoornet client to additional legal risk over the spill.
414 Department of Transport 2006, 7. 415 Spoornet 2004 divisional report, 51. 416 Department of Transport 2006, 42.