Price Policy and Fish Marketing System in...
17
Price Policy and Fish Marketing System in India R. SATHIADHAS AND R. NARAYANAKUMAR Central Marine Fisheries Research ltwitute. Cochin-6R2 014. F isheries fonn an important sector of the Indian economy. Both as a nutritive food item for internal consumption and as a commodity that can earn foreign exchange, its importance is well known. Fisheries contribute about three per cent of our GDP (1993). Surrounded by sea on the three sides of mainland, India has a vast potential of marine resources. The Exclusive Economic Zone (EEZ) of India which extends upto 200 nautical miles, covers an area of 2.02 million sq.km. against its land area of 3.29 million sq.km. In the marine sector, tish are procured from 2244 landing centres located all along the 8085 km of coast line. The supply from inland sector is also scattered which is obtained from 27,000 km of rivers, 1,13,000 km of canals, 1.75 million hectare of tanks, ponds and derelict water spread area. The total fish production during 1992-93 was estimated at 4.04 million tonnes, 2.24 million tonnes from marine sector against the estimated potential yield of 3.9 million tonnes and 1.8 million tonnes from he inland sector against the estimated potential of 4.0 million tonnes. The growth of fish production and development of fishery sector is highly dependent on an efficient fish marketing system. Further, the survival and sustenence of different harvesting techniques of capture fisheries soley depends on their profitability which is interlinked with the market demand and price of different varieties of fish. Harvesting and marketing of fish provides enonnous employment opportunities. The post har- vest operations of fish, provides more employment to labour than the production sector. Large number Biology Education/October-December, /994 of intermediaries are involved before fish reaches the hands of ultimate consumer. An efficient Price Policy of fish or any other commodity aims at to ensure the services of middlemen at minimum cost. In other words, the pricing efficiency is concerned with improving the operation of buying, selling and other connected aspects of marketing process so that it will remain responsive to consumer be- haviour. Further, modem fish marketing policy should envisage not only meeting the existing demand for fish but also tapping the potential demand. Production Trend and Supply Prospects The fish output comes from marine and inland resources. The total fish production during 1992-93 is 4.04 million ~onnes. The fish production has registered an annual growth rate of 5.2 per cent in the inland sector and 3.8 per cent in the marine sector over the year from 1950-51 to 1992-93. Both inland and marine fish marketing are more or less identical on many aspects. However, marine fish marketing is more complicated due to its high degree of uncertainity and other special features. Hence, more emphasis is given for marine fish marketing in the present analys!s. The present level of exploitation of marine fisheries is about 66.7 per cent of the total estimated potential of 3.9 million tonl)es. The details of the length of the coastal line, continental shelf area, number .of land- ing centres and number of fishing viIIages in various maritime states of India are given in Table 1. 225
Transcript of Price Policy and Fish Marketing System in...
Price Policy and Fish Marketing System in India
R. SATHIADHAS AND R. NARAYANAKUMARCentral Marine Fisheries Research ltwitute. Cochin-6R2 014.
Fisheries fonn an important sector of the Indianeconomy. Both as a nutritive food item for
internal consumption and as a commodity that canearn foreign exchange, its importance is wellknown. Fisheries contribute about three per cent ofour GDP (1993). Surrounded by sea on the threesides of mainland, India has a vast potential ofmarine resources. The Exclusive Economic Zone(EEZ) of India which extends upto 200 nauticalmiles, covers an area of 2.02 million sq.km. againstits land area of 3.29 million sq.km. In the marinesector, tish are procured from 2244 landing centreslocated all along the 8085 km of coast line. Thesupply from inland sector is also scattered which isobtained from 27,000 km of rivers, 1,13,000 km ofcanals, 1.75 million hectare of tanks, ponds andderelict water spread area. The total fish productionduring 1992-93 was estimated at 4.04 milliontonnes, 2.24 million tonnes from marine sectoragainst the estimated potential yield of 3.9 milliontonnes and 1.8 million tonnes from he inland sector
against the estimated potential of 4.0 milliontonnes. The growth of fish production anddevelopment of fishery sector is highly dependenton an efficient fish marketing system. Further, thesurvival and sustenence of different harvestingtechniques of capture fisheries soley depends ontheir profitability which is interlinked with themarket demand and price of different varieties offish.
Harvesting and marketing of fish providesenonnous employment opportunities. The post har-vest operations of fish, provides more employmentto labour than the production sector. Large number
Biology Education/October-December, /994
of intermediaries are involved before fish reachesthe hands of ultimate consumer. An efficient PricePolicy of fish or any other commodity aims at toensure the services of middlemen at minimum cost.In other words, the pricing efficiency is concernedwith improving the operation of buying, selling andother connected aspects of marketing process sothat it will remain responsive to consumer be-haviour. Further, modem fish marketing policyshould envisage not only meeting the existingdemand for fish but also tapping the potentialdemand.
Production Trend and Supply Prospects
The fish output comes from marine and inlandresources. The total fish production during 1992-93is 4.04 million ~onnes. The fish production hasregistered an annual growth rate of 5.2 per cent inthe inland sector and 3.8 per cent in the marinesector over the year from 1950-51 to 1992-93.
Both inland and marine fish marketing aremore or less identical on many aspects. However,marine fish marketing is more complicated due toits high degree of uncertainity and other specialfeatures. Hence, more emphasis is given for marinefish marketing in the present analys!s. The presentlevel of exploitation of marine fisheries is about66.7 per cent of the total estimated potential of 3.9million tonl)es. The details of the length of thecoastal line, continental shelf area, number .of land-ing centres and number of fishing viIIages invarious maritime states of India are given in Table1.
225

Table 1 : Details of statewise, coastline, continental shelf area, landing centres and fishing villages.
Total 8085
Source: I. Mar. Fish. (nfor. ServoT & E Ser., No. 30
2. Handbook on fisheries, P. 32,
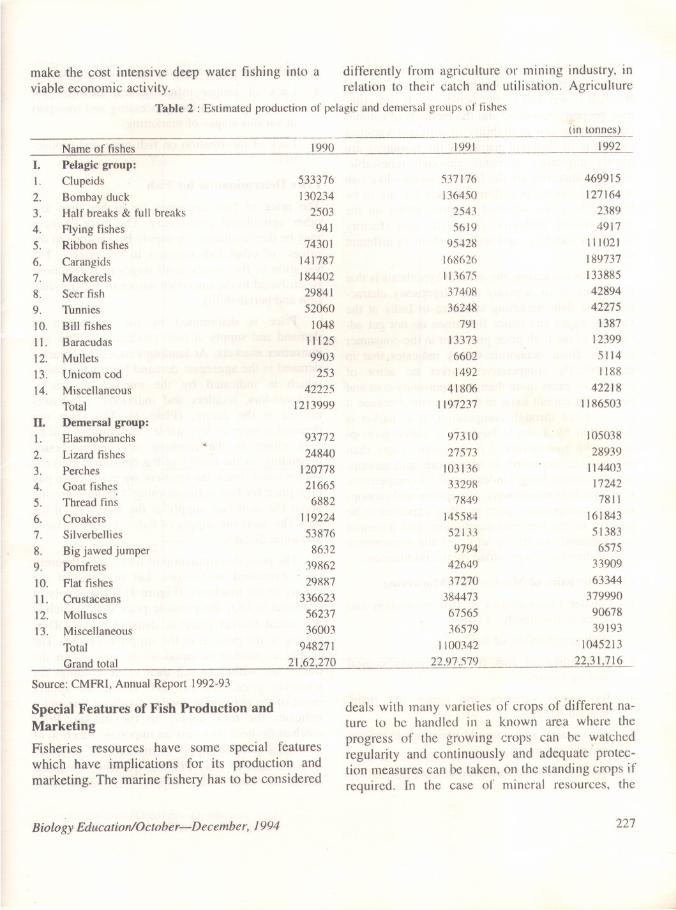
Marine fishery resources available in the nearshore areas extending upto 50m depth are almostfully exploited in India. The estimated landings ofdemersal and pelagic groups of marine fish ispresented in the Table 2. The unexploited andunder-exploited resource beyond 50m depth is es-timated to be 1.7 million tonnes. Among the ex-ploited pelagic resources, there is enormous scopeto increase the catch and supply of white baits,carangids, ribbon fishers and tunas. The totalpotential yield of white baits from the EEZ is es-timated to be 0.24 million tonnes as against thecurrent yield of 0,07 million tonnes. Carangidshave an estimated potential stock of 0.27 milliontonnes against the current yield of 0.1 million ton-nes. Ribbon fishes have an estimated potential of0.27 million tonnes and oceanic tuna 0.5 milliontonnes offering considerable scope for additionalcatch with the improvement of fish marketing sys-
I
1
226
Continental shelf Number of landingarea ('000 Sq. Km.) centres
No. of fishingvillages
409
91
204
771
222
386
329
442
652
45
10
45
3606
tern and development of consumer awareness andpreference.
The non conventional resources like "Bull'seye"(Priacanthus spp.), Indian drift fish (Psenesindicus) and "The black ruff' (CentroLophus niger)abundantly available in our deep sea are almostunexploited. "The Bull's eye" is having gooddemand in Singapore, Thailand, Taiwan andHongkong and' is caught in sizeable quantities byforeign vessels from our waters. The domesticmarket for this variety is yet to be established. Thenutritive quality of the black ruff equals any otherfamiliar table fish with protein (14.9%) and fat(5.8%) contents, there is ample scope for its accep-tance in local markets. At times some varieties arenot caught for fear of low prices due to glut andthose caught are thrown over board. Productdevelopment and sales promotion activities for nonconventional' fish varieties have to be geared up to
Biology Education/October-December, 1994
StateslUnion Territories Apprx. length ofcoastal line (Km)
I. Andhra Pradesh 947
2. Goa 87
3. Karnataka 300
4. Gujarat 1600
5. Kerala 590
6. Maharashtra 720
7. Orissa 480
8. Tamil Nadu 1000
9. West Bengal 157
10. Andaman & Nicobar Islands 2000
II. Lakshadweep 132
12. Pondicherry 45
3] 379
10 87
25 29
164 773
40 226
]12 184
32 62
41 362
]7 47
35 57
4 II
28
512 2244
make the cost intensive deep water fishing into aviable economic activity.
differently from agriculture or mining industry, inrelation to their catch and utilisation. Agriculture
Table 2 : Estimated production of pelagk and demersal groups of fishes
Name of fishes
I. Pelagic group:I. Clupeids2. Bombay duck3. Half breaks & full breaks
4. Flying fishes5. Ribbon fishes
6. Carangids7. Mackerels8. Seer fish9. Thnnies10. Bill fishes11. Baracudas12. Mullets13. Unicorn cod14. Miscellaneous
Total
IL Demersal group:1. Elasmobranchs2. Lizard fishes3. Perches4. Goat fishes5. Thread fins6. Croakers7. Silverbellies
8. Big jawed jumper9. Pomfrets10. Flat fishesII. Crustaceans12. Molluscs
13. MiscellaneousTotalGrand total
Source: CMFRI, Annual Report 1992-93
Special Features of Fish Production andMarketing
Fisheries resources have some special featureswhich have implications for its production andmarketing. The marine fishery has to be considered
533376130234
2503941
743011417871844022984152060
1048111259903
25342225
1213999
9377224840
120778216656882
11922453876
86323986229887
3366235623736003
94827]
2] .62,270
Biology Education/October-December. 1994
..--- (in tonnes)]9921990 ]991
537]76136450
25435619
954281686261136753740836248
791133736602]492
418061197237
469915]27164
23894917
111021]897371338854289442275
1387123995114] ]88
422181186503
973]0
27573
103136
33298
7849
145584
52133
9794
42649
37270
384473
67565
36579
] 100342
22.97.579
10503828939
114403172427811
16]8435]3836575
3390963344
3799909067839193
, 104521322,31.716
deals with many varieties of crops of different na-ture to be handled in a known area where theprogress of the growing crops can be watchedregularity and continuously and adequate protec-tion measures can be taken, on the standing crops ifrequired. In the case of mineral resources, the
227
]
j

production (mining) after the estimation will be aquestion of tapping the known and fixed resources.But fish is wet and highly perishable. It is a com-mon property resource, and the methods of estima-tion, capture and availability of different varietiesof fish is of different nature as. the resources are
mostly migrating, invisible although renewable.The raw materials are the living resources like fishwhich are caught in different waters but are to bebrought to a few selected centres, either on thecoast (fishing harbours) or on the seas (factoryships) for handling and utilising them in differentways.
In fish marketing, the general hypothesis is thatconditions of monopsony and oligopsony charac-terize the fish marketing structure in India at thevarious stages and hence fishermen do not get ad-vantage of the high price prevelant in the consumermarkets. Basic economic theory indicates that inthe perfectly competetive market no actor ofproduction earns more than its opportunity cost andpure profit cannot exist in the long run because itis eliminated through competition. If a market isdominated by a single buyer it is called monop-sony, with two buyers it is duopsony; more thantwo but not too many as oligopsony and monop-sonistic competition. Under imperfect competition,which include monopsony, oligopsony and monop-sonistic competition, pure profit is expected to bepositive in the long-run equilibrium and it cannotbe explained wholly in terms of the opportunitycost of the services provided by the middlemen.
Characteristics of Marine Fish Marketing
I. Greater Uncertainities in fish production andhence in the supply of fish.
2. High perishability of fish.
3. Assembling of fish from too many coastallanding centres.
4. Too many varieties and hence too manydemand patterns.
5. Wide spatial and temporal variations in marketarrivals and prices.
6. Dis-equilibrium of demand and supply.
228
7. Difficulty in maintainingthe quality of fish.
8. Lack of proper infrastructural facilities forstorage, preservation, processing and transportat various stages of marketing.
9. Lack of informationon fish price and produc-tion.
Price Determination for Fish
The price of fish fluctuates far higher than anyother agricultural commodity. The price changesmay be due to changes in supply besides due to theprices of other fish varieties in the market. Thevariation of fish prices at all stages of transactionsis attributed to the uncertain nature of fish produc-tion and perishability.
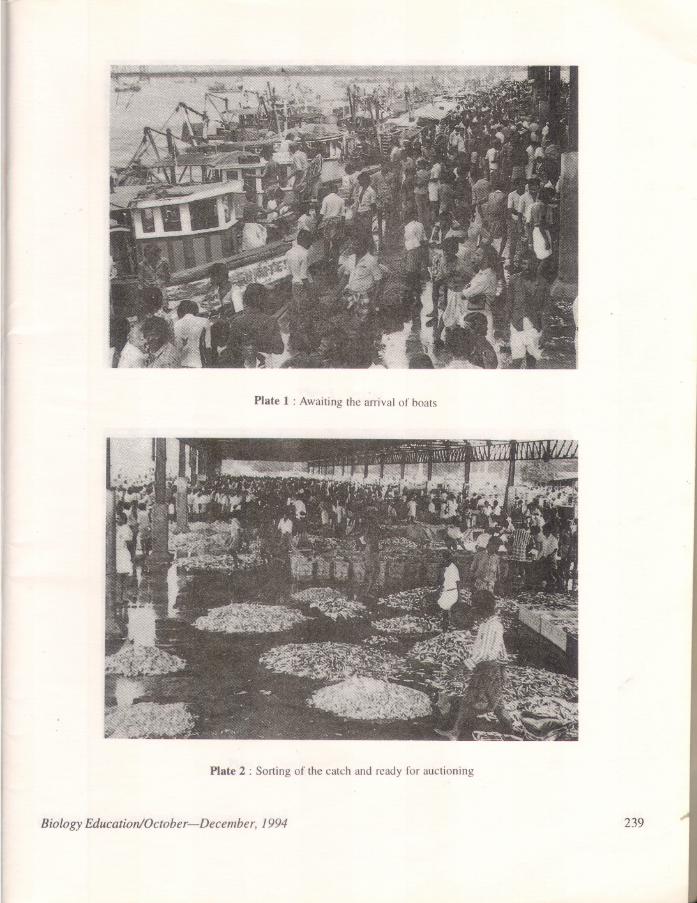
Price is determined by the interaction ofdemand and supply at both producing centres andconsumer markets. At landing centres, the marketdemand is the aggregate demand from wholesalerswhich is indicated by the number of trucks.cycle vendors, retailers and individual purchasersarrived at the centre. (Plate I). The short rundemand is more or less stable. The demand will behigh either in the morning or evening hours,depending on the timing of the consumer markets.Hence some times, the retailers are prepared to payhigh price for fish in the morning without worryingabout the increased supply at the later part of theday. The short run supply of fish is highly inelasticand unpredictable.
The price determination of fish can be theoreti-cally explained as follows. Let us consider thevariety to the mackerel. (Figure I) If the supply ofmackerel is OQI the possible price is PI which isthe actual market price as demand curve DD iscutting at the point E in the supply curve SS. Thesupply of market is equal to its atTival. So thetraders are willing to sell their entire holdings forwhatever price they can get. Hence the supplycurve of the perishable good is a vertical line and itindicates the total supply in the market. Pricemechanism here performs an important function ofallocating variable supply of mackerel. If the priceis lower than pI (Say PO) the quantity demandedwould be larger than supply. The shortage is
Biology Education/October-December. 1994
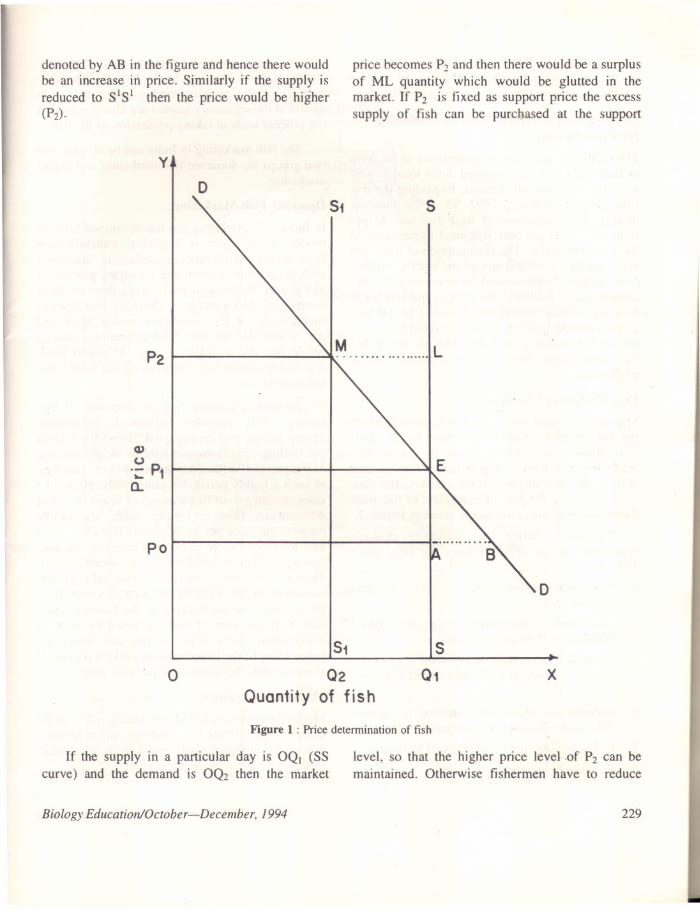
denoted by AB in the figure and hence there wouldbe an increase in price. Similarly if the supply isreduced to S1S1 then the price would be higher(P2)'
price becomes P2and then there would be a surplusof ML quantity which would be glutted in themarket. If P2 is fixed as support price the excesssupply of fish can be purchased at the support
y
D
Po
D
Q)(.)
.~ P,(l,
oS1
""""-
Q2
Quantity of fishx
Figure 1 : Price detennination of fish
If the supply in a particular day is OQ. (SScurve) and the demand is OQ2 then the market
level, so that the higher price level .of P2 can bemaintained. Otherwise fishermen have to reduce
Biology Education/October-December. 1994 229
the supply from OQI to OQ2 either by reducingproduction or diverting the product to the interiormarkets or for curing and processing plants.
Distribution Pattern of Fish and MarketingStructure in India
The supply of fish to the consumers are in the formof fresh frozen, dried or canned in the local as wellas in the international markets. Regarding the dis-tribution pattern. during 1992- 93. in the domesticmarket. the composition of fresh fish was 44 percent; dry fish 31 per cent, fish meal 13 per cent andthe rest canned fish. The consumption of fresh fishwas originally confined around the landing centres.Now with the improvement in transport and otherinfrastructural facilities. the interior markets awayfrom the landing centres are also covered. Of late.a considerable quantity of commercially less im-portant fish varieties and fish wastes are diverted tofish meal plants which are of immense use aspoultry feed.
Fish Marketing Channel
Marketing channel refers to the path through whichthe product passes from the producer to the handsof ultimate consumer. In case of marine fishmarketing. fish travels long distances from coastalareas to the interior parts of the country. The nowchart indicating the path of movement of fish fromthe producer to the consumer is given in Figure 2.
The usual marine fish marketing channelsprevailing can be obtained from the flow chart.They are,
I. Fishermen-Auctioneer-Agents of freezingplants-Exporters.
2. Fishermen-Auctioneer-Processor (Dry fish) -Wholesaler-Retailer-Consumer.
3. Fishermen-Auctioneer-Wholesaler (primarymarket) -Wholesaler (Retail market)-Retailers-Consumers.
4. Fishermen-Auctioneer-CommissionWholesaler-Retailer- Consumers.
5. Fishermen-Auctioneer--Retailer-Consumer.
6. Fishermen-Auctioneer-Consumer.
agents-
230
L..
The m~jor portion of the internal fish market-ing takes place through 3-6th channels. The auc-tioneers of the primary market and commissionagents of the secondary market are also involved inthe process without taking possession of the fish.
The fish marketing in India can be divided intotwo groups as, domestic fish marketing and exportmarketing.
Domestic. Fish Marketing
In rndia, fish marketing has not developed fully onmodern lines. There is a gradual transformationfrom traditional to modern method of marketingwith the advent of improved transport, processingand storage facilities. at micro level. there are largenumber of small merchants. There are four types offunctionaries at this level-commission agent andthe wholesaler at the landing centre, interiorwholesaler and a retai IeI' at last. At macro level,few organisations have undertaken the whole dis-trihution of tish.
At landing centres, fish are disposed by auc-tioning. This provides maximum competitionamong buyers and enable quick disposals. Fish atthe landing centres are not sold in weight becauseof the practical difficulties involved in the handlingof such a highly perishable commodity. Hence thesales are carried out by measures of heaps or lots ofdifferent sizc. However for exportable varieties likeprawns, the price per kg of fish is fixed by actionand weighted before delivery. Generally the auc-tioning is done by traditional auctioneer or mid-dlemen on commission basis who take up theresponsibility of realising the sale proceeds fromthe traders. The auctioneers at the landing centretake 5-10. per cent of fish auctioned by them ascommission. Since many of the auctioneers ad-vance loans to the fishermen. they take a portion ofshare towards the interest for the loan given.
Marketing Expenses
Marketing expenses in fish marketing refers to thecharges incurred for the handling. and transporta-tion of fish during its movement from the produc-tion point to the consumption point.
Biology Education/October-December, 1994

L ANDING CENTRE(Primary Market)
AQent..Of
l
freezinQ_l
proceuors
plants (curinQ)
Wholesalers
(Primarymarket)
Commission
aQent.Retailers
Bulk
purchasers
FreezinQplants
Whole Whole Wholesalers salers salers
(Dry fish (Retail (Interiormarket) market) market)
CONSUMER
Figure 2 : Flow chart showing the fish marketing channels
The fish passes through a number of handsbefore reaching the ultimate consumer. Due to itsperishable nature, proper preservation and handlingis vital. Bamboo baskets are mostly used to packthe fish which is around Rs. 25/- and one basketcan be used only for about a month. For transporta-
tion of fish, trucks, tempos, motorized cycle rick-shaws and bicycles are used generally. During1993-94, the freight charges for a truck load wasRs. 5-6 per km. In Madras region, the trarn;portoffish from landing centres to wholesale and retailmarkets is mostly through motorized.cycle rick-
Biology Education/October-December, J994 231

shaws. Some times, retailers with less quantity offish group together and engage a common vehiclefor transport. For packing, ice is used at the rate of20-25 kg to pack 20-30 kg of tish which can bepacked in a basket. The cost of ice during 1993-94was Rs. 25-30 for a 50 kg block. The labour chargefor loading and unloading worked out of Rs. 5 perbasket.
It was found that, marketing costs includinghandling and transportation of big size fishes likeseer fish, giant sea perch and barracudas was com-paratively higher than that of small varieties likcsardine, thread tin bream and lizard fish.
Marketing Margins and Efficiency
The gross marketing margin refers to the differencebetween the price paid by the consumer and theprice received by the producer. This includes allcosts of assembling, grading, packing, transporta-tion, processing and storage, wholesalers andretailers margin.
The marketing margin is an indicator of themarketing efficiency. In the absence 'of any valueadded process, higher the value of the marketingmargin, lower the efficiency of the system. On onehand, the producers deserve a legitimate share inthe consumer's rupee and on the other hand, theconsumer's rights have to be safeguarded againstexcessive prices. These twin objectives can beachieved by ensuring various marketing services atreasonable costs. i.e'., restricting margins at areasonable level. In a nutshell, if the movement ofgoods from producer to the consumer takes place atminimum cost, the marketing system is said to beefficient.
Price Beha,iour
The fluctuation in prices of fish is very high be-cause of the uncertain nature of production, perish-able nature and variation in short run supply.Because the supply of fish is highly inelastic, abumper catch on any day will slash down the tishprices and a small catch will boost the prices tovery high levels.
A study undertaken in Tamil Nadu has clearlypointed out that, despite a wide short-term tluctua-
232
tion in the tish prices. the average annual prices ofcommercially important tishes show an increasingtrend. The whole sale price behaviour of sell.?ctedvarieties of fish in Tamil Nadu for the years 1973-74, 1984-85. 1989-90 and 1993-94 are given inTable 3.
Table 3 : Wholesale price hehaviour of selected varietiesof marine fish in Tamil Nadu (1973-74 to 1993-94)
Source: Socio economic evaluation and technology trans-fer division. (SEETrD), CMFRI.
It is found from the table, that the prices of allvarieties havc recorded an increasing trend. Theprice rise in case of seer fish was nearly 16 timesbetween 1973-74 and 1993-94. The other varietieswhich recorded notable increase in these twodecades are. tunas (from' Rs. 2.00 to Rs. 30.00).barracudas (from Rs. 2.00 to Rs. 30.00) and sharks(from Rs. 1.50 to Rs. 26).
The avcrage retail price behaviour of selectedvarieties of marine fish during 1973-74, 1984-85,1989-90 and ]993-94 arc given in Table 4. In theretail price. seer fish recorded seven- fold increaseduring the period from .1973-74 to 1993-94. Theprices of other varicties also increased considerablythrough these years. The increase is higher than allother food articles.
Biology Education/Octoher-December, 1994
Average price Rs.lkg
1973-74 1984-85 1989-90 1993-94
I. Seer fish 4.00 19.00 28.90 58.00
2. Pomfrets 2.00 17.50 15.20 35.00
3. Baracudas 2.00 11.25 15.20 30.00
4. Tuna 2.00 10.00 13.45 30.00
5. Sharks 1.50 11.25 13.85 26.00
6. Catfish 1.00 7.75 13.00 20.00
7. Mackerel 2.00 6.25 9.00 23.00
8. Sardines 1.00 4.00 6.90 13.00
9. Ribbon fish 2.00 5.00 6.15 10.00
10. White baits 2.00 5.00 5.85 15.00
II. Rays UX) 6.00 6.40 12.00
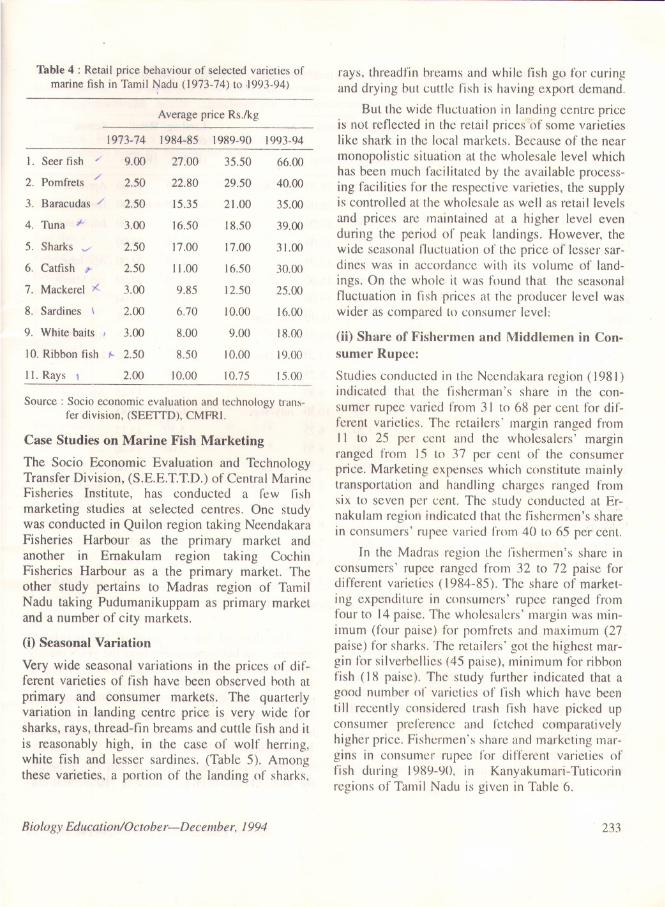
Table 4 : Retail price behaviour of selected varieties ofmarine fish in Tamil Nadu (1973-74) to .1993-94)
Source: Socioeconomicevaluationand technologytrans-fer division,(SEE1TD),CMFRI.
Case Studies on Marine Fish Marketing
The Socio Economic Evaluation and TechnologyTransfer Division, (S.E.E.T.T.D.) of Central MarineFisheries Institute, has conducted a few fishmarketing studies at selected centres. One studywas conducted in Quilon region taking NeendakaraFisheries Harbour as the primary market andanother in Emakulam region taking CochinFisheries Harbour as a the primary market. Theother study pertains to Madras region of TamilNadu taking Pudumanikuppam as primary marketand a number of city markets.
(i) Seasonal Variation
Very wide seasonal variations in the prices of dif-ferent varieties of fish have been observed hoth atprimary and consumer markets. The quarterlyvariation in landing centre price is very wide forsharks, rays, thread-fin breams and cuttle fish and itis reasonably high, in the case of wolf herring,white fish and lesser sardines. (Table 5). Amongthese varieties. a portion of the landing of sharks,
Biology Education/October-December. /994
rays, threadfin breams and while fish go for curingand drying but cuttle fish is having export demand.
But the wide tluctuation in landing centre priceis not retlected in the retail prices of some varietieslike shark in the local markets. Because of the nearmonopolistic situation at the wholesale level whichhas been much facilitated by the available process-ing facilities for the respective varieties, the supplyis controlled at the wholesale as well as retail levelsand prices are maintained at a higher level evenduring the period of peak landings. However. thewide seasonal fluctuation of the price of lesser sar-dines was in accordance with its volume of land-ings. On the whole it was found that the seasonalfluctuation in fish prices at the producer level waswider as compared to consumer level:
(ii) Share of Fishermen and Middlemen in Con-sumer Rupee:
Studies conducted in the Neendakara region (1981)indicated that the fisherman's share in the con-sumer rupee varied from 31 to 68 per cent for dif-ferent varieties. The retailers' margin ranged from11 to 25 per cent and the wholesalers' marginranged from 15 to 37 per cent of the consumerprice. Marketing expenses which constitute mainlytransportation and handling charges ranged fromsix to seven per cent. The study conducted at Er-nakulam region indicated that the fishermen's sharein consumers' rupee varied from 40 to 65 per' cent.
In the Madras region the fishermen's share inconsumers' rupee ranged from 32 to 72 paise fordifferent varieties (1984-85). The share of market-ing expenditure in consumers' rupee ranged fromfour to 14 paise. The wholesalers' margin was min-imum (four paise) for pornfrets and maximum (27paise) for sharks. The retailers' got the highest mar-gin for silverbellies (45 paise), minimum for ribbonfish (I R paise). The study further indicated that agood number of varieties of fish which have beentill recently considered trash fish have picked upconsumer preference and fctched comparativelyhigher price. Fishermen's share and marketing mar-gins in consumer rupce for different varieties offish during I989-1)(). in Kanyakumari- Tuticorinregions of Tamil Nadu is givcn in Table 6.
233
Average price RsJkg
1973-74 1984-85 1989-90 1993-94
L Seer fish 9.00 27.00 3550 66.00
2. Pomfrets ./2.50 22.80 29.50 40.00
3. Baracudas ./ 2.50 15.35 21.00 35.00
4. Tuna ;I- 3.00 16.50 1850 39.00
5. Sharks -./ 2.50 17.00 17.00 31.00
6. Cattish (I- 2.50 11.00 16.50 30.00
7. Mackerel 3.00 9.85 1250 25.00
8. Sardines \ 2.00 6.70 10.00 16.00
9. White baits , 3.00 8.00 9.00 18.00
10. Ribbon fish 1- 2.50 8.50 10.00 19.00
II. Rays t 2.00 10.00 10.75 15.00

Table 5 : Seasonal price variation in primary and retaillish markets for different varieties (1989-90)
Export Fish Marketing
The fishery sector has emerged as a potentialforeign exchange earner over the years. This couldbe observed from the facts that. marine productsexports has contributed 3.3 per cent of our totalexport and the export earnings has increased fromRs. 384.29 crores during 1983-84 to Rs. 2433crores during 1993-94. About 10 per cent of lhemarine fish production has been exported during1992-93.
234
The demand for sea food of the developedcountries has been increasing over the years mainlydue to the realisation of its high nutritive value andits utility in reducing the incidence of cardiac ar-rests and controlling some other common diseases.The present average annual per capital consump-tion of fish for the world as a whole is estimated at12.4 kg (live weight equivalent).
The world demand ror fish and fish productsby 2000 AD has been estimated at 110 million ton-
Bi%gy Education/October-December, 1994
Minimum Maximum
Variety Landing Retail Season Landing Retail Seasoncentre centre
(Rs/kg) (Rs/kg) (Rslkg) (Rslkg)
Seer Iish 21.60 28.30 Oct-Dec. 2X.00 45.00 Apr-JuneRainbow runner 19.00 26.00 .. 24.00 38.00 Jan-March
Pomfrets 18.00 27.00 .. 24.65 39.00 Jan-March
Pig-face breams 9.00 17.00 .. 17.00 28.00
Red snapper 7.()() 15.00.. 12.00 24.00 Apr-June
Barracudas 9.00 16.00 .. 17.00 27.00 Jan-March
Reef cod 7.00 15.00 .. 12.00 23.00
Tuna 8.40 16.40 July-Sept. 13.30 24.85
Sharks 10.40 14.95 .. 12.30 22.65 Apr-JuneCat fish 6.90 13.20 Oct-Dec. 10.55 20.55 Jan-June
Wolf herring 4.70 8.25 .. 8.90 16.25
Mackerel 5.80 9.90 .. 9.25 17.25 Apr-JuneScads 3.45 10.30 July-Sept.. 6.10 14.85
Goat fish 3.20 6.75 .. 5.30 15.15
Ribbon fish 4.00 8.50 .. 5.00 14.00
Threadfin breams 2.55 4.75 Oct-Dec. 6.00 15.00 Jan-March
Rays 4.30 8.15 July-Sept. 4.70 11.75 Apr-JuneLizard fish 1.35 3.85 Oct-Dec. 4.00 10.10 Apr-June
Indian pellona 3.()() 6.15 July-Sept. 5.20 11.60
Gold stripped sardine 3.55 7.60 .. 7.30 15.30
White baits 2.70 6.45 .. 5.75 14.65
Silver bellies 2.00 5.40 .. 3.05 6.80 Jan-March
Source: Socio economic evaluation and technology transfer division. CMFRI.

nes against a global supply of about 100 milliontonnes-the increase in demand is due to the grow-ing population and health consciousness of thepeople.
Table6: Fishermen'sshareand marketingmargininconsumer'srupeefordifferentvarieties(1989-90)
Variety
Percentage share to
Fishermen Handling & Whole- Retaillerstransport salers
I
I
I
I
I
I
Seer fish
Rainbow runner
Pomfrets
Pig-face breams
Red snapperBarracudas
Reef cod
Tuna
Sharks
Cat fish
Wolf herringMackerel
Scads
Goat fish
Ribbon fish
Threadfin breams
RaysLizard fish
Indian pellona
Gold strippedsardine
White baits
Silver beIlies
63
60
62
50
55
53
55
55
58
49
53
54
43
37
41
46
39
42
44
43
41
41
Source: SEETT Division, CMFRI
3
3
3
4
5
4
5
4
4
4
6
6
7
5
5
6
4
10
6
5
5
8
10
10
9
12
14
10
15
13
II
18
II
6
II
17
14
14
]]
18
14
14
14
13
International Trade on Sea Food
The global fish production has been estimated at96.9 million tonnes during 1991. China accountedfor 13.6 per cent of the world's production fol-lowed by Japan (9.6 per cent) and former un-divided USSR (9.5 per cent). The share of the
Biology Education/October-December, /994
24
27
26
34
26
33
25
28
27
29
30
34
39
41
40
34
46
30
36
38
developing countries in the world production wasstable around 52-54 per cent over the past fiveyears. The world marine products trade has goneup from US $ 17,III million during 1983 to US $48,000 million in 1992. But India's share in globalfish trade has declined from 2.06 per cent to 1.2 percent during this period.
The foreign exchange earnings of Indian seafood export during 1993-94 was at Rs. 2433.33crores through the sale of 2.24 lakh tonnes ofmarine products. registering a growth of 37.7 percent in value and 13.49 per cent in quantity respec-tively. The unit value realised per kg has increasedfrom Rs. 84.73 per kg in 1992-93 to Rs. 103.75 perkg in 1993-94, registering a growth of 22.4 percent. The growth of Indian marine products exportfrom 1983-84 to 1993-94 is given in Table 7. .
Table7 : Growthof Indianmarineproductsexport1983-84 to 1993-94
40
38
SI. Year Qty. in Average Growth rate Value inNo. tonnes unit Rs. crores
value .relation QuantltyValue(Rs/kg) (%) (%)
I. 1983-84 92187 40.24 + 18.87 +3.23 384.29
2. 1984-85 86187 44.59 - 7.02 +3.02 384.29
3. 1985-86 83651 47.58 - 2.94 +3.57 398.00
4. 1986-87 85843 53.66 + 2.62 ]5.75 460.67
5. ]987-88 97179 54.66 13.2] 15.31 531.20
6. 1988-89 99777 59.92 2.67 ]2.55 597.85
7. 1989-90 110843 57.29 11.09 6.21 634.99
8. 1990-91 139419 64.08 25.78 40.69 893.37
9. 1991-92171820 80.08 23.24 54.0] 1373.85
10. 1992-93208602 84.73 21.41 28.46 1767.43
II. 1993-94236678 103.75 +13.49 37.682433.33
Source: Marineproductsexportreview,MPEDA]992-93
Indian marine products arc exported to over 59countries. Japan was the leading importer of Indiansea food products accounting for 14.77 per cent ofour trade in terms of volume and 45.37 per cent invalue during 1992-93. This is followed by USA
235

with about 9.65 per cent on total volume and 10.78per cent of the gross earnings in 1992-93. Thedetails of other fish importing countries from Indiaare given in Table 8.
Table8 : CountrywisemarineproductexportfromIndiaduring 1992-93
Q: quantity in tonnesV: valuein Rs.crores
SI. CountryNo.
1992-1993
Quantity Percentage Value Percentageexported to total to total
19.77 801.90 45.37
32.39 511.52 28.94
Major Items of Export:
The Indian sea food export comprises frozenshrimps, fresh/frozen squid, cuttle fish, lobsters,dried products, live items and miscellaneous items.Frozen shrimp accounts for 3566 per cent of thevolume and 66.78 per cent of the value exportedduring 1992- 93. The quantity of shrimp exportedduring 1992-93 was 74.393 tonnes earning aforeign exchange of Rs. 118.26 crores. Out of this.Japan imported 34,600 tonnes. followed byWestern Europe- 20.749 tonnes and USA-14,045tonnes, India's share in the world's tuna market isonly five percent (20 lakh tonnes). The particularsof item wise exports of Indian marine products arepresented in Table 9.
The export of marine products from India.during 1992-93 was done through 13 ports. Theyare Cochin, Mangalore. Goa. Bombay. JNP (Bom-bay), Porhander, Kandla. Tuticorin. Madras, Vi zag,Calcutta, Haldia & Okoha. Bombay accounted for26.11 per cent of the volume of exports followedby Cochin 23.53 per cent. Marine products like livelobsters. crab. chilled fish. ornamental fish were airlifted thorough international airports.
Infra Structural Facilities
The infra structural facilities include freezingplants. canning plants. ice factories, fish meal
Table 8 : Country wise marine product export from India during 1992-93
Source: Marine products export review. MPEDA, 1992-93
Source: Marine products export review, MPEDA, 1992-93
236 Biology Education/October-December, /994
I. Japan 41240
2. Western 67582Europe
3. USA 20141
4. Singapore 15454
5. Hongkong 40593
6. UAE 5330
7. Sri Lanka 3482
8. Others 14780
Grand Total 208602
9.65 190.48 10.78
7.41 72.20 4.09
19.46 80.90 4.58
2.56 28.95 1.64
1.67 5.28 0.30
7.09 76.19 4.30
100.00 1767.43 100.00
Q: quantity in millionV: value in Rs. crores$: dollar in millions
SI. Item 1992-93No. Quantity Percentage to total Value Percentage to total Value in US Rs.I. Frozen shrimp 74393 35.66 1180.26 66.78 410.722. FreshfFrozen fish 75370 36.13 232.4 ] ]3.15 80.883. Frozen squid 30364 14.56 ]51.90 8.59 52.864. Cuttle fish 18981 9.10 ] ]8.88 6.73 41.375. Frozen lobsters 1613 0.77 43.34 2.45 15.09
6. Dried items 4233 2.03 ]!!.O2 1.02 6.277. Live items 573 0.23 3.49 0.20 1.228. Others 3075 1.47 19.13 1.08 6.66
Total 208602 100.00 1767.43 100.00 615.06

plants, peeling sheds, cold storages, conveyancesand processing plants. The sea food processingplants are mostly located around important fishlanding centres like Porbander, Veraval, Bombay,Ratnagiri, Panjim, Karwar, Mangalore, Calicut,Cochin, Quilon, Tuticorin, Mandapam, Cuddalore,Madras, Viskhapatnam, Puri and Calcutta. Thedevelopment of such infra structural facilities isvital for improving the quality of the marineproducts and is present level in our country is givenin Table 10.
Table10 : Infrastructurefor thesea foodprocessingindustry 1992
Capacitytonnes/day
2778.60
81.50
1894.00
375.50
2150.00
49775.00
209.30
Source: Marine products export review, MPEDA, 1992-93
The development of infrastructural facilitiessill go a long way to increase our contribution ofvalue added products which at present constitutesonly 12 per cent of the total marine food export.Upto 1986, India was mostly supplying rawmaterials to the importing countries by exportingfrozen shrimps. With the help of innovative tech-nologies and policy support, export of value addedproducts was initiated. As tirst step, IQF (individu-
Biology Education/October-December. 1994
ally Quick Frozen) units were established with aninstalled capacity of 210 tonnes per day producing15 per cent of shrimps in IQF. During 1992-93.8587 tonnes of IQF shrimps were exported earningRs. 127.8 crores with the unit value of Rs. 148.80
per kg. Italy was the leading importer of IQFshrimp from India, foIlowed by Japan and USA.The share of IQF shrimp in the total export ofshrimp from India during 1992-93 was 11.54 percent in volume and 10.83 per cent in value. Furtherimprovements in the export of value addedproducts will help India not only to become aglobal competitor but also create substantialdomestic employment.
Conclusion and Policy Implications
Fish marketing in India is gradually tranSformingfrom primitive to modern stage. The involvementof a number of middlemen in the marketing chainadversely affects the interests of both fishermenand consumers. The basic amenities are not presentin many of the markets to carry out the marketingactivities properly. No proper grading or weighingis done for fresh fish and there is no proper shedsfor auctioning or facilities for preservation at themarketing centres. Inefficient coIlection and dis-tribution of fish results in concomitance of surplusand deficit in the internal marketing system. Lackof marketing infrastructure is another factorresponsible for low returns to fishermen. It is notpossible to provide the ice plants or cooling plantsfor each and every fishing viIlage. Hence thegovernment can provide these facilities for acluster of closely located tishing villages, throughfishermen co-operatives. After successfuldemonstration, these units can be handed over tolocal fishermen on equity participation.
The government's intervention in the fishmarketing system through the state fisheriesdevelopment corporations has not been successfuldue to various administrative and management lap-ses. The involvement of local fishermen in FishMarketing Societies, may deliver the goods. Lackof proper institutional price support and exploita-tion by middlemen have discouraged the fishermenfrom increasing the fish production. Hence, the
237
Category Registered
I. Exporters 865
2. Vessels 12499
3. Freezing plants 248
4. Canning plants 23
5. Ice plants 129
6. Fish meal plants 21
7. Pre processing 921centres
8. Conveyances 483
9. Cold storage 321
10. Other storage 371
II. Agar agar plants 2
12. IQF plants 52

government can announce support prices for allcommercially important varieties. This can beachieved with the establishment of a public agencywhich can buy such surpluses. Such agenciesshould have well developed processing storage anddistribution facilities.
Now our marine products exports' perfor-mance mostly depends on shrimp. Adequate .en-tion should be given for product diversification and
238
increase the quantum of value added products inour sea food export. The possibility of exploitingthe tuna resources and its export potential shouldbe explored.
Considering the importance of sea food as apotential foreign exchange earner as well as a sup-plementary protein diet. more emphasis needs to begiven for the development of fishery sector inIndia.
Biology Education/October-December. /994
IFf ~~.,t~~._,~~~-,.<~,--~~~~~~..:,~''c'-~''
~
Plate 1: Awaiting the arrival of boats
Plate 2 : Sorting of the catch and ready for auctioning
Biology Education/October-December, 1994 239
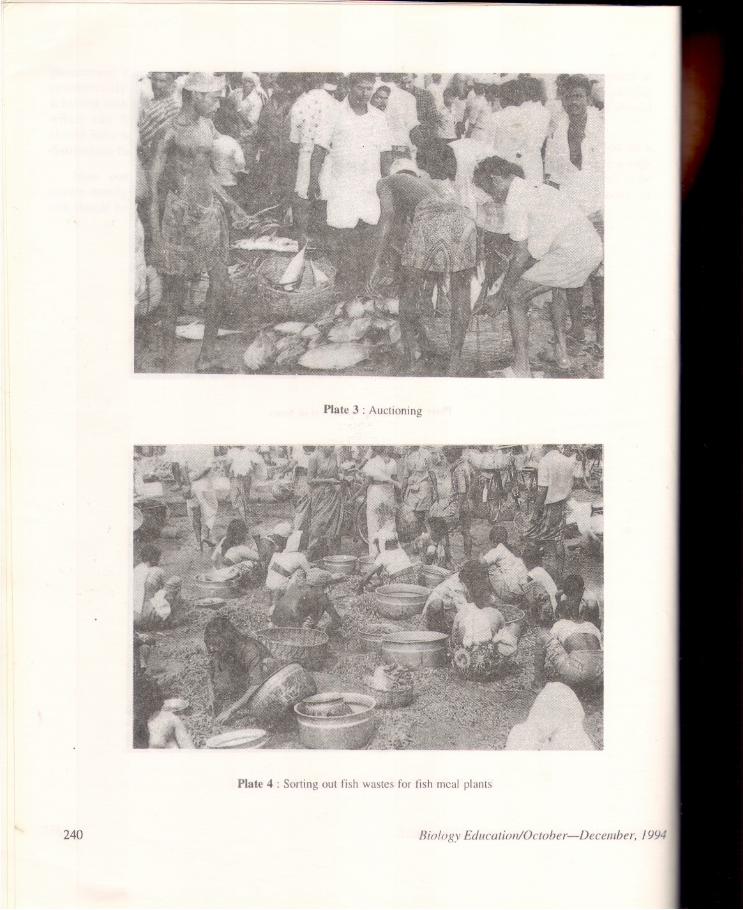
Plate 3 : Auctioning
Plate 4 : Sorting out fish wastes for fish meal plants
240 Biology Education/October-December. 1994

Plate 5 : Packing
Plate 6 : Distribution for long distance market
Biology Education/October-December, 1994 241