Previous Land Use Affects the Recovery of Soil Hydraulic...
16
water Article Previous Land Use Affects the Recovery of Soil Hydraulic Properties after Forest Restoration Sergio E. Lozano-Baez 1, * ID , Miguel Cooper 2 , Silvio F. B. Ferraz 3 , Ricardo Ribeiro Rodrigues 4 , Mario Pirastru 5 ID and Simone Di Prima 5 ID 1 Laboratory of Ecology and Forest Restoration (LERF), Department of Forest Sciences, “Luiz de Queiroz” College of Agriculture, University of São Paulo, Av. Pádua Dias 11, Piracicaba SP 13418-900, Brazil 2 Department of Soil Science, “Luiz de Queiroz” College of Agriculture, University of São Paulo, Piracicaba SP 13418-900, Brazil; [email protected] 3 Forest Hydrology Laboratory, “Luiz de Queiroz” College of Agriculture, University of São Paulo, Piracicaba SP 13418-900, Brazil; [email protected] 4 Department of Biological Sciences, “Luiz de Queiroz” College of Agriculture, University of São Paulo, Piracicaba SP 13418-900, Brazil; [email protected] 5 Agricultural Department, University of Sassari, Viale Italia, 39, 07100 Sassari, Italy; [email protected] (M.P.); [email protected] (S.D.P.) * Correspondence: [email protected]; Tel.: +55-19-3429-4100 Received: 27 February 2018; Accepted: 6 April 2018; Published: 9 April 2018 Abstract: Knowledge of soil hydraulic properties after forest restoration is essential for understanding the recovery of hydrological processes, such as water infiltration. An increase of forest cover may improve water infiltration and soil hydraulic properties, but little is known about the response and extent to which forest restoration can affect these properties. The purpose of this study was to investigate the effect of forest restoration on surface-saturated soil hydraulic conductivity (K s ), and to verify the K s recovery to the pre-disturbance soil conditions. We sampled field K s at the surface in Campinas municipality, São Paulo State, Brazil, at 18 plots under three land-cover types: (i) a pasture; (ii) a restored forest using a high-diversity mix of plantings (85 regional native species) of 9 years of age; and (iii) a remnant forest patch. We used the Beerkan method for soil hydraulic characterization. Bulk density (ρ b ), soil organic carbon content (OC), soil porosity and particle size data were also sampled. We found considerable differences in soil hydraulic properties between land-cover classes. The highest K s were observed in remnant forest sites and the lowest K s were associated with pasture sites. The K s recovery differs markedly between restored forests. Our results strongly suggest that soil attributes and K s recovery are influenced by the duration and intensity of land use prior to forest restoration. Attention needs to be given to management activities before, during and after forest restoration, especially where the soil is still compacted and K s is low. Keywords: soil properties; saturated soil hydraulic conductivity; soil infiltration; Beerkan method 1. Introduction The global forest restoration movement based on natural regeneration and tree plantations has increased tropical forest cover [1,2]. Nevertheless, soil hydraulic property responses in these restored forests are virtually unknown [3,4]. Soil water infiltration is a key hydrological process which, among others, influences groundwater recharge, soil erosion and surface runoff. Indeed, one of the best parameters for understanding and studying soil infiltration is the saturated soil hydraulic conductivity (K s )[4,5]. The K s is a soil property with the greatest spatial and temporal variability among soil properties. The K s variability depends on many factors, such as soil types, land uses, soil Water 2018, 10, 453; doi:10.3390/w10040453 www.mdpi.com/journal/water
Transcript of Previous Land Use Affects the Recovery of Soil Hydraulic...

water
Article
Previous Land Use Affects the Recovery of SoilHydraulic Properties after Forest Restoration
Sergio E Lozano-Baez 1 ID Miguel Cooper 2 Silvio F B Ferraz 3 Ricardo Ribeiro Rodrigues 4Mario Pirastru 5 ID and Simone Di Prima 5 ID
1 Laboratory of Ecology and Forest Restoration (LERF) Department of Forest Sciences ldquoLuiz de QueirozrdquoCollege of Agriculture University of Satildeo Paulo Av Paacutedua Dias 11 Piracicaba SP 13418-900 Brazil
2 Department of Soil Science ldquoLuiz de Queirozrdquo College of Agriculture University of Satildeo PauloPiracicaba SP 13418-900 Brazil mcooperuspbr
3 Forest Hydrology Laboratory ldquoLuiz de Queirozrdquo College of Agriculture University of Satildeo PauloPiracicaba SP 13418-900 Brazil silvioferrazuspbr
4 Department of Biological Sciences ldquoLuiz de Queirozrdquo College of Agriculture University of Satildeo PauloPiracicaba SP 13418-900 Brazil rrresalquspbr
5 Agricultural Department University of Sassari Viale Italia 39 07100 Sassari Italympirastruunissit (MP) sdiprimaunissit (SDP)
Correspondence sergiolozanouspbr Tel +55-19-3429-4100
Received 27 February 2018 Accepted 6 April 2018 Published 9 April 2018
Abstract Knowledge of soil hydraulic properties after forest restoration is essential for understandingthe recovery of hydrological processes such as water infiltration An increase of forest cover mayimprove water infiltration and soil hydraulic properties but little is known about the response andextent to which forest restoration can affect these properties The purpose of this study was toinvestigate the effect of forest restoration on surface-saturated soil hydraulic conductivity (Ks) and toverify the Ks recovery to the pre-disturbance soil conditions We sampled field Ks at the surface inCampinas municipality Satildeo Paulo State Brazil at 18 plots under three land-cover types (i) a pasture(ii) a restored forest using a high-diversity mix of plantings (85 regional native species) of 9 years ofage and (iii) a remnant forest patch We used the Beerkan method for soil hydraulic characterizationBulk density (ρb) soil organic carbon content (OC) soil porosity and particle size data were alsosampled We found considerable differences in soil hydraulic properties between land-cover classesThe highest Ks were observed in remnant forest sites and the lowest Ks were associated with pasturesites The Ks recovery differs markedly between restored forests Our results strongly suggest thatsoil attributes and Ks recovery are influenced by the duration and intensity of land use prior to forestrestoration Attention needs to be given to management activities before during and after forestrestoration especially where the soil is still compacted and Ks is low
Keywords soil properties saturated soil hydraulic conductivity soil infiltration Beerkan method
1 Introduction
The global forest restoration movement based on natural regeneration and tree plantationshas increased tropical forest cover [12] Nevertheless soil hydraulic property responses in theserestored forests are virtually unknown [34] Soil water infiltration is a key hydrological processwhich among others influences groundwater recharge soil erosion and surface runoff Indeed one ofthe best parameters for understanding and studying soil infiltration is the saturated soil hydraulicconductivity (Ks) [45] The Ks is a soil property with the greatest spatial and temporal variabilityamong soil properties The Ks variability depends on many factors such as soil types land uses soil
Water 2018 10 453 doi103390w10040453 wwwmdpicomjournalwater
Water 2018 10 453 2 of 16
depths landscape positions methods of measurement and physical and chemical soil attributes [6]Despite this variation the Ks is a useful and sensitive indicator of the effect of land-cover change onsoil hydro-physical dynamics [7] which exerts a dominating influence on the partitioning of rainfall invertical and lateral flow paths Therefore estimates of Ks are essential for describing and modellinghydrological processes [8]
The Atlantic Forest is one of the most important forest biomes of Brazil that has suffered intensepressure from human occupation with approximately 12 of the original area remaining [9] Recentlythe Atlantic Forest Restoration Pact has emerged to restore large areas of degraded land This is thelargest forest-restoration initiative in Latin America with a target of restoring 15 million hectares offorest by 2050 [10] These efforts have a substantial impact on soil hydraulic properties and can beexpected to affect the hydrological processes in the restored ecosystems However these hydrologicalimplications are rarely considered in studies of forest restoration [11] Current literature reviewsin tropical landscapes suggest that forest restoration can enhance surface Ks [1213] Howevermost studies on Ks recovery after forest restoration in tropical soils emphasize areas with naturalregeneration or secondary succession [4714ndash19]
Zimmerman et al [17] found non-significant Ks recovery at surface and near-surface (125 and20 cm soil depth) levels in Brazilian Amazocircnia during seven years of secondary succession afterpasture abandonment Recently Leite et al [19] by examining four sites of different ages in theBrazilian Caatingamdashan abandoned pasture a young forest (7 years) an intermediate forest (35 years)and an older forest (more than 55 years)mdashobserved that forest regrowth promotes surface Ks recoveryincreasing progressively over time On the other hand the effect of active restoration on Ks has beenmuch less studied [20] Zwartendijk et al [11] compared surface Ks recovery between degraded landssemi-mature forest 2ndash10-year-old naturally regenerating vegetation and fallows that were activelyreforested 6ndash9 years ago with 120 native species in Madagascar They found higher Ks values in thesemi-mature forest followed by the active reforested sites suggesting that active restoration maydecrease the time it takes for the soil to recover hydraulic properties Also the impact of afforestationon Ks has been studied in teak (Tectona grandis) plantations at surface and near-surface (125 and20 cm soil depth) levels in Brazilian Amazocircnia where after 10 years the teak plantation shows Ks
recovery from pasture conditions for all soil depths but Ks values are still distant from pre-disturbanceconditions [4] Similarly an increase in Ks after afforestation practices has been reported by severalother tropical studies [21ndash23]
Tree planting to restore degraded lands is conducted in the expectation that soil hydraulicproperties will be improved [13] In order to understand the effect of forest restoration on Kswe investigated the Ks recovery by field estimation under three land covers namely pasture 9-year-oldrestored forest and remnant forest To the best of our knowledge no studies have investigated the Ks
recovery after planting native mixed-species in the Brazilian Atlantic Forest and compared the resultswith pasture and remnant forest We hypothesized that forest restoration can recover the surfaceKs to the pre-disturbance soil conditions The following questions were addressed (1) Does forestrestoration recover top-soil Ks values that characterize the remnant forest (2) Are the measured soilattributes between the land covers similar
2 Materials and Methods
21 Field Site
This research was carried out in the county of Campinas Satildeo Paulo State Brazil (2254prime S 4654prime W)The area is located inside the sub-basin of Atibaia River (2800 km2) which belongs to the PiracicabaRiver basin This region has suffered over 200 years of historical landscape changes In the Atibaiasub-basin the main land covers are native vegetation (33) pasture lands (30) and crops (17)and the forest cover increased 57 in the last decade [24] The mean annual precipitation is 1700 mmand the mean annual temperature is 20 C with rainy months generally concentrated between October
Water 2018 10 453 3 of 16
and March The native vegetation in the area is classified as seasonal semi-deciduous forest [25]The two soil types found in the study sites are Ultisols and Entisols [26] related to the diversegeomorphology of the region which is located at the transition between the Atlantic Plateau andthe Peripheral Depression geomorphological provinces The rocks in the Atalntic Plateau are mainlycomposed of granites and gneises while the Peripheral Depression is characterized by sedimentaryrocks The elevation ranges from 600 m to 900 m with an undulating topography and the presence ofslopes higher than 20 [27]
22 Experimental Design
The sites were selected to capture variation in soil attributes Also the sitesrsquo accessibility wastaken into account in this selection We examined the following land-cover classes pasture restoredforest and remnant forest In each class we selected two sites or toposequences (Figure 1) underpasture (P1 and P2) under restored forest (R3 and R4) and under remnant forest (F5 and F6)
Figure 1 Pictures that represent the study sites in the seasonal semi-deciduous forest in CampinasBrazil Study sites are abbreviated with P1 and P2 for pasture R3 and R4 for restored forest and F5and F6 for remnant forest
The length of each toposequence was constrained by topography and varied between 100 mand 150 m Each site was divided into three landscape positions (upslope (U) midslope (M) anddownslope (D)) Within each landscape position we located one plot (7 times 7 m in size) resulting in18 plots altogether Detailed characteristcs of the three land-cover classes are as follows
The pasture site P1 (2249prime24rdquo S 4654prime39rdquo W) and P2 (2254prime38rdquo S 4653prime26rdquo W) was characterisedby a dense cover of grass The dominant grass species is Urochloa brizantha Information obtained fromlandholders revealed that the pasture sites have been heavily grazed for more than 20 years and havea stocking rate between 1 to 15 animal units haminus1 The measurements at these sites represent the Ks
and soil attributes before forest restoration actionsThe restored forest sites (R3 and R4) were 9 years old when sampled and located in Fazenda
Guariroba (2253prime48rdquo S 4654prime28rdquo W) The forest-restoration process of an area of 300 ha beganin 2007 The mixed plantation with a high-diversity mix of seedlings (85 regional native species)aimed to provide economical insurance and ensure successional processes for landowners [2829]
Water 2018 10 453 4 of 16
Site preparation included grass control through herbicide applications and control of leaf-cutter antsby the distribution of insecticide baits Direct seedling planting (3 times 2 m spacing) took place afterconventional tillage The mixed plantation also used fertilizer and irrigation at the time of plantingand during the first year [2830] Aerial photographs and interviews with local peoples showedthat land-use history differs between the restored forest sites Both restored forests were originallydeforested more than 100 years ago and planted with coffee (Coffea arabica) during the first decadesof the 20th century After the coffee plantation the restored forest R3 was planted with eucalyptus(Eucalyptus sp) this abandoned forest existed until 2006 without a commercial purpose althougha frequent grazing of cattle occurred then it was harvested and grazing continued one year before theforest restoration The eucalyptus harvest was made by motorndashmanual operations and a farm tractorforwarded the logs The vegetation in the restored forest R3 prior to restoration activities consistedof low shrub and grasses On the other hand the restored forest R4 after the coffee plantation wasused as pasture for livestock breeding until 1986 was subsequently planted again to coffee (C arabica)and agricultural terraces were created with heavy track machinery Then the coffee plantation wasreplaced by pasture in 1996 which was similar to the pastures sites (P1 and P2) dominated by thegrass species U brizantha and without natural regeneration
The forest sites (F5 and F6) used as a reference for soil attributes were located in RibeiratildeoCachoeira forest (2250prime13rdquo S 4655prime58rdquo W) the second largest natural remnant forest of 245 ha in thecounty of Campinas The forest presents a high tree species diversity with an average canopy statureof 15 m and emergent trees reaching up to 35 m tall [31]
23 Soil Sampling and Measurements
The first field campaign started in February and ended in March 2017 A total of four disturbedsoil samples were collected per plot to determine the soil particle size distribution (PSD) and the soilorganic carbon content (OC) The PSD was determined by the hydrometer method and soil texturewas classified according to the US Department of Agriculture (USDA) standards [32] The OC wasdetermined by the WalkleyndashBlack method [33] In addition four undisturbed soil cores (005 m inheight and 005 m in diameter) were also collected per plot at the depth of 0ndash005 m to determinesoil macroporosity (Mac) and microporosity (Mic) using the Richards pressure chamber with theapplication of 6 kPa suction [34]
Soil infiltration measurements were taken in a second field campaign during the month ofJune 2017 (dry season) We conducted a Ks characterization using the Beerkan method [35] referred toas BEST We chose the BEST test because it is a simple fast and inexpensive method [36ndash38] At eachplot we carried out seven infiltration runs using a steel ring with an inner diameter of 016 m insertedapproximately 001 m into the soil surface with a minimum distance between measurements of 2 mBefore the ringrsquos insertion the litter was removed and if necessary the grass and ground cover werecut in order to expose the soil surface Sampling-point selection was influenced by suitable groundconditions for measurment and constraints such as tree roots rocks and variations in microtopographyFor each infiltration run we collected one undisturbed soil core (005 m in height and 005 m indiameter) at the 0ndash005 m depth We used the undisturbed soil cores to determine the initial volumetricsoil water content (θi) the soil bulk density (ρb) and total soil porosity (Pt) assuming a particle densityof 265 g cmminus3 [39] In each measurement a known volume (150 mL) was repeatedly poured into thecylinder and the time needed for the complete infiltration of this volume was logged We repeatedthe procedure until the difference in infiltration time between two or three consecutives trials becamenegligible At the end of each infiltration test we collected a disturbed soil sample inside the ring areato determine the saturated gravimetric water content and thus the satured volumetric water content(θs) was calculated using the ρb A total of 126 experimental cumulative infiltrations I(t) (L) versustime t (T) were then deduced 42 for each land cover 21 for each site and 7 for each plot
Water 2018 10 453 5 of 16
24 Estimating and Selecting the BEST Algorithm
The BEST-steady algorithm by Bagarello et al [40] was used to obtain the Ks (KsB the subscript Bis used to indicate BEST-steady) This choice was made since it allows a higher success percentage ofthe infiltration runs to be obtained compared with other possible algorithms such as BEST-slope [41]and BEST-intercept [42] whose data require fitting to the transient stage of the infiltration run Anotherexpected advantage of the BEST-steady algorithm is that the possible problems associated with the useof the transient infiltration data are avoided The BEST-steady expresses the KsB with the followingequation [43]
KsB =Cis
Abs + C(1)
where is (L Tminus1) and bs (L) are respectively the slope and the intercept of the regression line fitted to thedata describing steady-state conditions on the cumulative infiltration I (L) versus t (T) plot Taking intoaccount that BEST focuses on the Brooks and Corey relationship for hydraulic conductivity [44]the A (Lminus1) and C constants are defined as follows [35]
A =γ
r(θs minus θi)(2)
C =1
2[1minus
(θiθs
)η](1minus β)
ln(
1β
)(3)
where γ and β are infiltration coefficients commonly set at 075 and 06 as explained byLassabatere et al [371619] r (L) is the radius of the disk source η is a shape parameter that isestimated from the capillary models [45] and θi and θs are the initial and final water contentsrespectively Note that θi should not exceed 025 θs however Di Prima et al [43] showed thatBEST-steady can be applied in initially wetter soil conditions (θi gt 025 θs) without an appreciableloss of accuracy in the predictions of Ks Therefore as suggested by Cullotta et al [46] the θi wasnot considered to affect the reliability of the predicted Ks On the other hand the BEST-steadyalgorithm failed in some sampling points providing negative Ks values and affecting the reliabilityof measured Ks For this reason we also estimated Ks for the whole data set by the near steady-statephase of a Beerkan infiltration run (SSBImdashKsS the subscript S is used to indicate steady-state) [47]This method is attractive for a simple soil hydraulic characterization but testing the ability of thisprocedure to estimate Ks is necessary Indeed in scientific literature there is no exhaustive testing ofthe performances of the SSBI method notwithstanding that this method has a noticeable practicalinterest This method estimates Ks through a simple Beerkan infiltration test and an estimate of theso-called sorptive parameter α (Lminus1) expressing the relative importance of gravity and capillaryforces during a ponding infiltration process [4849] With this method KsS is estimated by the followingequation [47]
KsS =is
γγwrαlowast + 1
(4)
where γw is a dimensionless constant related to the shape of the infiltration front and is set at 1818 [50]In this investigation we considered α as a constant and equal to 0012 mmminus1 since it was found to beusable in tropical soils [4751] The reasons for this choice was that we did not find in the literatureother specific support for using a different α value for tropical soils Following Bagarello et al [47]the BEST-steady algorithm was chosen to check the SSBI method by comparing KsB and KsS in termsof factors of difference (FoD) calculated as the highest value between KsB and KsS divided by thelowest value between KsB and KsS Differences between KsB and KsS not exceeding a factor of two wereconsidered indicative of similar estimates [49]
Water 2018 10 453 6 of 16
25 Data Analysis
Data sets were summarized by calculating the mean and the associated coefficient of variation(CV) Following similar investigations [3752] unique values of clay silt sand OC ρb total porositymacroporosity microporosity and θi were determined for each plot by averaging the measured valuesconsidering the small size of the sampled areas [52] The hypothesis of normal distribution of boththe untransformed and the log-transformed Ks data were tested by the Lilliefors test [53] The otherparameters were assumed to be normally distributed and thus no transformation was performedon these data before statistical analysis [5455] Treatment means were calculated according to thestatistical distribution of the data ie geometric means for Ks (log-normal distribution) and arithmeticmeans for all other parameters (normal distribution) [56] According to Lee et al [55] the appropriateCV expression for a log-normal distribution was calculated for the geometric means and the usualCV was calculated for the arithmetic means Statistical comparison was conducted using two-tailedt-tests whereas the Tukey honestly significant difference test was applied to compare the data setsThe ln-transformed KsS was used in the statistical comparison A probability level p = 005 was usedfor all statistical analyses All analyses were carried out in the statistical programming software R [57]
3 Results
31 Differences in Soil Attributes among Study Sites
The PSD showed considerable differences among the soils Most of the sampled plots presentedsandy loam (P1U P1M P1D R3U R3M RD F5U and F5D) and sandy clay loam textures (R4U R4MR4D and F5M) and the rest clay loam (P2M F6U and F6M) and loamy textures (P2U P2D and F6D)The OC ranged from 1476ndash3537 g Kgminus1 under pastures (P1 and P2) from 1046ndash2460 g Kgminus1 underrestored forests (R3 and R4) and from 1753ndash4859 g Kgminus1 under remnant forests (F5 and F6) The ρbvalues ranged between 112ndash140 g cmminus3 in the pastures for the restored forests the values rangedfrom 109ndash152 g cmminus3 while in the remnant forests the values ranged from 088ndash125 g cmminus3 The Ptvaried from 047ndash058 cm3 cmminus3 in the pastures from 043ndash059 cm3 cmminus3 in the restored forestsand from 053ndash067 cm3 cmminus3 in the remnant forests In general the highest soil Mac values wereobserved in the remnant forests the intermediate values in restored forests and the lowest valuesin the pastures In contrast the soil Mic was greater in the pastures intermediate in the restoredforests and lower in the remnant forests The mean θi at the time of the Beerkan infiltration run variedbetween 016ndash037 cm3 cmminus3 and the soil was significantly wetter in plots P2M R4U and R4M (Table 1)
32 Estimating and Selecting the BEST Algorithm
Overall the Beerkan method used in this study was found to be robust for measuring the Ks inthe field However the BEST-steady algorithm yielded physically plausible estimates (ie positiveKs values) in 108 of 126 infiltration runs (857 of the cases) The percentage of successful runs was952 (40 of 42 runs) both in the pasture sites and restored forest With reference to the remnantforest (F5 and F6) BEST-steady led to a failure rate value of 333 leading to a lack of estimates in14 of 42 infiltration runs In these cases convex cumulative infiltration-shaped data always produceda negative intercept of the straight line fitted to the data describing steady-state conditions whichyielded negative Ks values (Figure 2) On the other hand the SSBI method always yielded physicallyplausible estimates (ie positive Ks values) and small differences were found between the KsB and KsSestimates (Figure 3) The means of KsS differed from the corresponding values of KsB by a factor notexceeding 181 The individual determination (ie point by point) of the factors of difference FoDdid not exceed 237 (mean of FoD is equal to 151) and they were less than 2 and 15 in 90 and 53 ofthe cases respectively Therefore it can be argued that the BEST-steady and SSBI method led to similarestimates given that the individual FoD values were lower than two in almost all cases
Water 2018 10 453 7 of 16
Table 1 Comparison between the mean and coefficient of variation (CV) of the clay () silt () sand () soil organic carbon content (OC in g Kgminus1) soil bulkdensity (ρb in g cmminus3) total porosity (Pt in cm3 cmminus3) macroporosity (Mac in cm3 cmminus3) microporosity (Mic in cm3 cmminus3) and initial volumetric soil water content(θi in cm3 cmminus3) values for the 18 sampled plots in the landscape positions upslope (U) midslope (M) and downslope (D)
Variable Statistic
Plots
Pasture 1 Pasture 2 Restored Forest 3 Restored Forest 4 Remnant Forest 5 Remnant Forest 6
U M D U M D U M D U M D U M D U M D
Clay Mean 196a 102b 95b 250b 317a 216b 112b 121b 190a 261a 210b 219b 183b 233a 190b 302a 310a 244bCV 79 28 129 56 39 131 173 117 43 51 39 29 144 20 57 36 44 20
SiltMean 274a 202b 223b 307a 325a 299a 207b 212b 277a 227a 194b 199b 254a 263a 267a 343b 339b 397a
CV 66 68 65 71 64 116 146 128 68 21 25 65 102 85 86 58 25 12
SandMean 530a 696a 683a 444a 358a 485a 681b 668b 533a 512a 597b 583b 563b 504a 543b 356a 352a 359b
CV 41 17 38 35 25 130 68 46 49 33 21 20 80 51 62 83 17 23
OCMean 300a 201b 178b 321a 321a 256b 145a 173a 213a 220a 190a 174a 309a 348a 338a 311a 342a 278a
CV 59 24 186 117 49 127 226 337 98 122 148 170 414 185 126 123 110 254
ρbMean 127a 124a 122a 129a 118b 133a 123a 129a 122a 133a 134a 142a 105b 103b 115a 102a 105a 099a
CV 57 51 38 58 49 50 71 33 59 34 60 53 54 71 71 97 76 83
PtMean 053a 053a 054a 051a 055a 050a 054a 051a 054a 050a 050a 047a 060b 061b 057b 061b 060b 063b
CV 48 46 35 61 45 47 60 33 54 41 64 60 31 44 50 64 53 46
MacMean 012b 018a 021a 011a 007b 006b 020a 019a 016b 018a 014b 016a 024a 026a 015b 019b 022a 018b
CV 50 120 155 252 154 408 102 43 281 120 370 286 159 31 181 133 139 255
MicMean 036a 032b 032b 050a 051a 050a 028b 029b 034a 035a 033a 031b 031b 029b 037a 037a 035a 037a
CV 168 57 165 37 11 48 121 84 123 77 114 59 31 51 78 65 23 80
θiMean 032a 019b 016b 025b 037a 025b 019a 019a 019a 037ab 034a 023b 015a 017b 032a 021a 023a 017b
CV 128 293 284 232 52 236 149 170 112 159 140 141 128 90 269 99 45 147
For a given variable and site (ie P1 P2 R3 R4 F5 and F6) means that do not share a letter are significantly different according to the Tukey test (p = 005)
Water 2018 10 453 8 of 16
Figure 2 Illustrative examples of the influence of the shape of the cumulative infiltrations on thediscrepancies occurring between the Beerkan method (BEST-steady) and the steady-state phase of aBeerkan infiltration (SSBI) method (a) Concave-shaped cumulative infiltration curve in which theintercept bs (mm) of the straight line interpolating the last I vs t data points is positive and the FoDbetween the saturated soil hydraulic conductivity values estimated with BEST-steady (KsB) and theSSBI method (KsS) is small (b) Convex-shaped cumulative infiltration curve with a negative interceptyielding null KsB
Figure 3 Comparison between Ks estimated with BEST-steady KsB and the SSBI method KsS Studysites are abbreviated with P1 and P2 for pasture R3 and R4 for restored forest and F5 and F6 forremnant forest
The failure in the BEST-steady algorithm is reported by several studies in subtropical soils whereOC exceeds 5 This failure is normally related to the occurrence of hydrophobic conditions [434658]Nevertheless our soils showed lower OC values (less than 5) In addition the soil hydrophobicity isa complex property and poorly studied in tropical soils [5960] Other factors that probably contributedto the BEST-steady algorithm failure are the heterogeneous soil structure changes in soil structureduring measurement initial soil moisture and temperature [6162] For these reasons the failure of theBEST-steady algorithm should be addressed in detail by future studies considering detailed physicalchemical and mineralogical analyses Hereafter for the sake of reliable Ks values and comparisonacross study sites only the KsS values estimated using the SSBI method were considered This choicewas supported by the fact that the SSBI method allowed us to maintain the integrity of the dataset
Water 2018 10 453 9 of 16
In addition the KsS values ranged between 3 mm hminus1 and 934 mm hminus1 with a high variability insideall study sites
33 Saturated Soil Hydraulic Conductivity (Ks) Characterization
Evaluating the surface Ks values by soil texture greater Ks variation was found in soils withhigher clay content contrasting with lower variation in soils with higher sand content Also soilswith higher sand content did not show the higher Ks In general the lowest Ks values occurred inpasture plots for example in pasture P1 the Ks ranged from 10ndash320 mm hminus1 and in pasture P2 Ks
ranged from 4ndash37 mm hminus1 whereas the highest Ks values were observed in most remnant forest plotsThe sandy loam texture highlighted the large differences between Ks in the restored forest R3 andpasture plots (P1U and P1M) In this case the Ks in the restored forest R3 varied from 49ndash267 mm hminus1with the higher Ks evidenced at the restored forest plot R3D (average of 180 mm hminus1) moreover the Ks
was similar to the pasture plot P1D (average of 110 mm hminus1) and most remnant forest plots For theremnant forest F5 the Ks varied from 18ndash660 mm hminus1 showing the higher Ks at remnant forest plotF5U (average of 247 mm hminus1) which differs from pasture plots (P1U and P1M) but not from restoredforest R3 In contrast the Ks at remnant forest plot F5D (average of 68 mm hminus1) exhibited a similar Ks
in relation to pasture and restored forest plots For the sandy clay loam texture the Ks in the restoredforest R4 (from 6ndash256 mm hminus1) was significantly different from the remnant forest plot F5M (averageof 68 mm hminus1) furthermore all the plots in the restored forest R4 had low Ks variability similar tothe pasture land cover Finally clay loam and loam textures showed the same comparison amongland covers characterized by marked differences between lower Ks in pasture 2 and higher Ks inthe remnant forest F6 In particular the remnant forest F6 evidenced the higher Ks variability (from33ndash934 mm) in the study sites (Figure 4)
Figure 4 Ks estimated with SSBI method KsS per plots and grouping by soil texture (US Departmentof Agriculture (USDA) classification system) Study sites are abbreviated with P1 and P2 for pasture R3and R4 for restored forest and F5 and F6 for remnant forest The subscript letter refers to the landscapeposition (Upslope Middleslope and Downslope) in each site
Statistical comparision of KsS revealed no significant differences between the restored forest (R3)and the remnant forest (F5 and F6) However significant differences between the restored forest (R4)and remnant forest were detected indicating similarity with the pastures (P1 and P2) (Table 2)
Water 2018 10 453 10 of 16
Table 2 Results of the Tukey honestly significant difference test (p = 005) for the ln-transformed saturatedhydraulic conductivity values estimated with the SSBI method (KsS) The grouping information highlightsthe significant and not significant comparisons
Variable Grouping Information (Plots)
KsS
F6M F6U F5M F6D F5U R3D R3M R3U P1D F5D R4D R4U R4M P1U P1M P2U P2M P2Da a a a a a a a
b b b b bc c c c c c
d d d d d de e e e e e
f f f f f f f fg g g g g g g
4 Discussion
41 Effects of Land Use on Soil Attributes and Ks
Although the soils in the study area showed some variability this was overcome by choosing sitesand landscape positions within the different land uses that presented similar soil textural classes in thesurface horizon This approach allowed us to group and compare the soil attributes and Ks (Figure 4)In general important differences were observed in the soil attributes and Ks between land-cover classesThese differences could be related to many factors such as intensity of past land use [423] spatial andtopographic variations in soil types along the toposequences [6364] density and diversity of plantsroot system vegetation type canopy cover and soil faunal activity among others [19] Unfortunatelythe influence of these factors on soil attributes and Ks after forest restoration is poorly understood andneeds to be included in future studies
Pasture As expected Ks was significantly lower under pasture plots than restored forest andremnant forest plots This result was directly related to the highest ρb found in the study pastureswhich influences the higher soil Mic and lower soil Mac values [65] Similar findings have been reportedbe several authors [13ndash15] An exception to this was related to pasture plot P1D which showed similarKs values compared to the restored forest and remnant forest in the sandy loam texture suggestinglower soil compaction and consequently higher soil Mac Also the highest sand content found in thisplot could help to explain this result Moreover the present results illustrate the Ks spatial variabilityin two different pasture sites characterized by a low variation in Ks values This could be due tothe soil compaction [413] and the duration of pasture use in the land-use history which is one ofthe most important factors for Ks variability over time [1517] as well as the cattle-grazing intensitythat could have influenced the Ks variability in the pasture plots [7] Moreover the lower soil faunalactivity and organic matter in pasture land covers are important factors when analyzing the soilattributes [1556] Notably the pasture plots P1U P2U and P2M had OC similar to the remnant forestThese similarities are closely linked to carbon inputs in pastures sites where the root system of grassesthe animal-derived organic matter and the application of fertilizers might have increased the organicsubstrate [2065] In contrast pasture plots P1M P1D and P2D showed the lowest OC values in thepasture plots which could be attributed in part to the higher sand content in these plots
Restored forest The soil texture understory vegetation (Figure 1) and intensity of past landuse were different in the restored forest sites (R3 and R4) and these are the most likely reasonsfor the differences in soil attributes and Ks values between both restored forests [2366] Also it isimportant to underscore that this result could have been influenced by possible soil compaction duringmechanized soil preparation during the forest restoration [67] The most important soil attributes ofthe Ks differentiation between restored forest sites was the ρb and OC For example the higher Ks in therestored forest plot R3D was associated to the lowest ρb and higher OC values Overall the restoredforest R3 with higher sand content (sandy loam texture) exhibited lower OC lower soil Mic lowerρb higher soil Mac and higher Ks than restored forest R4 The higher Ks in restored forest 3 relative
Water 2018 10 453 11 of 16
to pasture plots with similar soil texture (P1U and P1M) is consistent with the results under teakplantation in Brazilian Amazocircnia [4] and pine plantation in Nepal [23] Furthermore plots in therestored forest R3 showed no significant differences in Ks from most remnant forest plots These resultscan be linked to the land-use history in the restored forest R3 where the presence of an abandonedeucalyptus forest with a canopy structure of more than 50 years influenced the low trampling pressureand machinery traffic intensities suggesting a litter accumulation that could have protected the soilsurface during this period [6869]
In the second situation the restored forest R4 with higher clay content (sandy clay loam texture)exhibited higher OC higher ρb and lower Ks than restored forest R3 In particular the lower Ks
compared to the remnant forest plot (F5M) with a similar soil texture clearly indicates that the fullreturn to pre-disturbance conditions is still far off [22] On the other hand the sandy clay loam texturedid not include pasture plots however pasture Ks in this soil texture could be assumed to be similarto the pasture sites (P1 and P2) considering the low spatial Ks variability observed in the pastureland cover Thus the restored forest R4 showed no significant differences in Ks with the pasture sitesThis result can be related to past land-use intensity in the restored forest R4 in which the combinationof coffee plantation and pastures led to greater soil exposure and also trampling pressure and theconstruction of agricultural terraces could have caused erosion and soil compaction before the forestrestoration The present results agree with several studies [41623] which suggest that Ks decreaseswith increasing land-use intensity and that Ks recovery will be longer in view of the intensive land useFiloso et al [13] argued that in some cases the recovery of soil infiltration after forest restoration maybe extremely difficult because of the absence of natural understory vegetation This research did notdirectly quantify the herbaceous cover but in the field we observed that natural regeneration in therestored forest R4 is impeded by the dominance of an invasive grass species (U brizantha) which is alsoassociated with the open canopy conditions Conversely restored forest R3 presented visually a canopystructure with greater understory vegetation Indeed the canopy cover determines the interceptionrainfall reducing raindrop impact and surface sealing which could enhance the Ks [19] Additionallythe higher ρb values in restored forest R4 are an indication of lower root and soil organism presence [70]this may reduce plant seed germination reduce root growth and decrease soil oxygen availabilitybecoming an ecological filter in the natural regeneration processes [7172] Zimmerman et al [17]reported that invasive species could delay the Ks recovery in Brazilian Amazocircnia after a decade ofpasture abandonment
Remnant forest Comparing remnant forest plots and pasture plots in the sandy loam clay loamand loam textures allowed the detection of significantly higher Ks in remnant forest plots In thecase of the sandy clay loam texture the remnant forest plot F5M showed significantly higher Ks thanplots in the restored forest R4 In contrast the sandy loam texture showed no significant differencesbetween plots of restored forest 3 and remnant forest plot F5U These results are related to thelowest ρb and higher Mac values that favor the Ks suggesting a higher soil pore connectivity In thespecific case of remnant forest plot F5D in the sandy loam texture no significant differences werefound in relation to pasture plots (P1U and P1M) This result can be associated with the high ρb anda consequent increase in the soil Mic that was noted in the remnant forest plot F5D The soil attributesand Ks values in remnant forest sites could be explained by the longer time that these forests haveremained undisturbed which allows a better soil structure to develop and the storage of more soilcarbon [1966] These findings are in agreement with those reported by several other studies in theAtlantic Forest [6365] Additionally the Ks spatial variability observed in both remnant forests isin line with previous work by Hassler et al [7] who attributed the Ks variability in Panama forestsoils to overland flows that result in erosion [19] Other factors that might have caused the Ks spatialvariability in remnant forest plots were the steepness of the sample plots and the soil distribution inthe landscape positions (U M D) influenced by contrasting slope and topography
Water 2018 10 453 12 of 16
42 Management Implications
The fact that restored forests R3 and R4 showed clear differences in Ks recovery and soil attributesmay provide evidence that in some cases simply planting trees is not in itself enough to recover thesoil attributes to the pre-disturbance soil conditions [23] Attention needs to be given to managementactivities before during and after forest restoration especially where the soil is still compacted and Ks
is low From this point of view it is therefore important that monitoring forest restoration programsincludes collection of soil compaction and Ks data to understand the initial compaction degree andsoil infiltration reinforcing the need to compare these values with the pre-disturbance soil conditionsAfter assessing soil compaction and soil infiltration at the restored forests management practicescould be implemented to alleviate soil compaction such as mechanical loosening techniques (ie deepripping and subsoiling) which may improve plant growth [7374] In addition some technicalmethods in forest restoration that have been shown to aid natural regeneration and soil recovery arethe suppression of weedy vegetation and maintenance and enrichment planting [28]
If the pasture sites (P1 and P2) presented here represent the planted pastures of the AtlanticForest we could observe that water infiltration is drastically affected in most cases regardless ofthe soil texture This result and the negative effects of pastures that have been heavily grazed arewell documented [41517] and have also been confirmed in the present research Indeed accordingto Martiacutenez and Zinck [15] pasture degradation can be improved by rotational grazing and theintroduction of silvopastoral systems during pasture management Moreover there is an increasingnumber of reports regarding different tropical land covers suggesting that lower Ks may lead toless groundwater recharge and increases in overland flow frequency [371619] Thus our resultsreinforce the need for better management practices in pastures and restored forests to avoid soilerosion conserve water and create opportunities to enhance water infiltration [75]
5 Conclusions
In this study the hypothesis that forest restoration can recover the surface Ks to the pre-disturbancesoil conditions was not supported for both restored forest sites (R3 and R4) We found two differentsituations with marked differences in soil attributes and Ks recovery between restored forest sitesOur results strongly suggest that soil attributes and surface Ks recovery are influenced by the durationand intensity of land use prior to forest restoration while the restored forest R3 with a previous lowerintensity of land use showed similar Ks to the remnant forest sites the Ks recovery in restored forest R4is still far-off from these remnant forest sites due to greater exposure of the soil and trampling pressureduring the land-use history
The present results further illustrate that the measured soil attributes were different betweenland-cover classes pasture restored forest and remnant forest They also bring out the inverserelationship between Ks and ρb where the Ks increases as a result of a decrease in ρb and consequentlythe dominance of macropores over micropores which facilitate soil water infiltration
Acknowledgments This research was supported by the Fundaccedilatildeo de Amparo agrave Pesquisa do Estado de Satildeo Paulo(BIOTAFAPESP Program 201350718-5 and 199909635-0) and Conselho Nacional de Desenvolvimento Cintiacuteficoe Tecnoloacutegico (CNPq 5618972010-7)
Author Contributions Sergio Esteban Lozano-Baez carried out the data collection and wrote the initial draftThe other authors revised modified and supplemented the ideas for the final draft
Conflicts of Interest The authors declare no conflict of interest
References
1 Suding K Higgs E Palmer M Callicott JB Anderson CB Baker M Gutrich JJ Hondula KLLaFevor MC Larson BM Committing to ecological restoration Science 2015 348 638ndash640 [CrossRef][PubMed]
Water 2018 10 453 13 of 16
2 Chazdon RL Brancalion PHS Lamb D Laestadius L Calmon M Kumar C A Policy-DrivenKnowledge Agenda for Global Forest and Landscape Restoration A policy-driven agenda for restorationConserv Lett 2017 10 125ndash132 [CrossRef]
3 Bruijnzeel LA Hydrological functions of tropical forests Not seeing the soil for the trees Agric Ecosyst Environ2004 104 185ndash228 [CrossRef]
4 Zimmermann B Elsenbeer H De Moraes JM The influence of land-use changes on soil hydraulicproperties Implications for runoff generation For Ecol Manag 2006 222 29ndash38 [CrossRef]
5 Neary DG Ice GG Jackson CR Linkages between forest soils and water quality and quantityFor Ecol Manag 2009 258 2269ndash2281 [CrossRef]
6 Deb SK Shukla MK Variability of hydraulic conductivity due to multiple factors Am J Environ Sci2012 8 489ndash502 [CrossRef]
7 Hassler SK Zimmermann B van Breugel M Hall JS Elsenbeer H Recovery of saturated hydraulicconductivity under secondary succession on former pasture in the humid tropics For Ecol Manag 2011261 1634ndash1642 [CrossRef]
8 Zimmermann A Schinn DS Francke T Elsenbeer H Zimmermann B Uncovering patterns ofnear-surface saturated hydraulic conductivity in an overland flow-controlled landscape Geoderma 2013195ndash196 1ndash11 [CrossRef]
9 Soares-Filho B Rajatildeo R Macedo M Carneiro A Costa W Coe M Rodrigues H Alencar A CrackingBrazilrsquos forest code Science 2014 344 363ndash364 [CrossRef] [PubMed]
10 Pinto S Melo F Tabarelli M Padovesi A Mesquita C de Mattos Scaramuzza C Castro PCarrascosa H Calmon M Rodrigues R et al Governing and Delivering a Biome-Wide RestorationInitiative The Case of Atlantic Forest Restoration Pact in Brazil Forests 2014 5 2212ndash2229 [CrossRef]
11 Zwartendijk BW van Meerveld HJ Ghimire CP Bruijnzeel LA Ravelona M Jones JPG Rebuildingsoil hydrological functioning after swidden agriculture in eastern Madagascar Agric Ecosyst Environ 2017239 101ndash111 [CrossRef]
12 Ilstedt U Malmer A Verbeeten E Murdiyarso D The effect of afforestation on water infiltration in thetropics A systematic review and meta-analysis For Ecol Manag 2007 251 45ndash51 [CrossRef]
13 Filoso S Bezerra MO Weiss KC Palmer MA Impacts of forest restoration on water yield A systematicreview PLoS ONE 2017 12 e0183210 [CrossRef] [PubMed]
14 Godsey S Elsenbeer H The soil hydrologic response to forest regrowth A case study from southwesternAmazonia Hydrol Process 2002 16 1519ndash1522 [CrossRef]
15 Martiacutenez L Zinck J Temporal variation of soil compaction and deterioration of soil quality in pastureareas of Colombian Amazonia Soil Tillage Res 2004 75 3ndash18 [CrossRef]
16 Ziegler AD Giambelluca TW Tran LT Vana TT Nullet MA Fox J Vien TD Pinthong JMaxwell J Evett S Hydrological consequences of landscape fragmentation in mountainous northernVietnam Evidence of accelerated overland flow generation J Hydrol 2004 287 124ndash146 [CrossRef]
17 Zimmermann B Papritz A Elsenbeer H Asymmetric response to disturbance and recovery Changes ofsoil permeability under forestndashpasturendashforest transitions Geoderma 2010 159 209ndash215 [CrossRef]
18 Nyberg G Bargueacutes Tobella A Kinyangi J Ilstedt U Soil property changes over a 120-yr chronosequencefrom forest to agriculture in western Kenya Hydrol Earth Syst Sci 2012 16 2085ndash2094 [CrossRef]
19 Leite PAM de Souza ES dos Santos ES Gomes RJ Cantalice JR Wilcox BP The influence offorest regrowth on soil hydraulic properties and erosion in a semiarid region of Brazil Ecohydrology 2017[CrossRef]
20 Paul M Catterall CP Pollard PC Kanowski J Recovery of soil properties and functions in differentrainforest restoration pathways For Ecol Manag 2010 259 2083ndash2092 [CrossRef]
21 Mapa RB Effect of reforestation using Tectona grandis on infiltration and soil water retention For Ecol Manag1995 77 119ndash125 [CrossRef]
22 Bonell M Purandara BK Venkatesh B Krishnaswamy J Acharya HAK Singh UV Jayakumar RChappell N The impact of forest use and reforestation on soil hydraulic conductivity in the Western Ghatsof India Implications for surface and sub-surface hydrology J Hydrol 2010 391 47ndash62 [CrossRef]
23 Ghimire CP Bruijnzeel LA Bonell M Coles N Lubczynski MW Gilmour DA The effects ofsustained forest use on hillslope soil hydraulic conductivity in the Middle Mountains of Central NepalSustained forest use and soil hydraulic conductivity Ecohydrology 2014 7 478ndash495 [CrossRef]
Water 2018 10 453 14 of 16
24 Molin PG Gergel SE Soares-Filho BS Ferraz SFB Spatial determinants of Atlantic Forest loss andrecovery in Brazil Landsc Ecol 2017 32 857ndash870 [CrossRef]
25 Mello MH Pedro Junior MJ Ortolani AA Alfonsi RR Chuva e Temperatura Cem Anos de Observaccedilotildeesem Campinas Boletim Tecnico IAC Campinas Brazil 1994
26 Soil Survey Staff Keys to Soil Taxonomy 12th ed USDA-Natural Resources Conservation Service WashingtonDC USA 2014
27 De Oliveira LHDS Valladares GS Coelho RM Criscuolo C Soil vulnerability to degradation atCampinas municipality SP Geogr Londrina 2014 22 65ndash79
28 Rodrigues RR Lima RAF Gandolfi S Nave AG On the restoration of high diversity forests 30 yearsof experience in the Brazilian Atlantic Forest Biol Conserv 2009 142 1242ndash1251 [CrossRef]
29 Rodrigues RR Gandolfi S Nave AG Aronson J Barreto TE Vidal CY Brancalion PHS Large-scaleecological restoration of high-diversity tropical forests in SE Brazil For Ecol Manag 2011 261 1605ndash1613[CrossRef]
30 Preiskorn GM Pimenta D Amazonas NT Nave AG Gandolfi S Rodrigues RR Belloto ACunha MCS Metodologia de restauraccedilatildeo para fins de aproveitamento econocircmico (reservas legais e aacutereasagriacutecolas) In Pacto Pela Restauraccedilatildeo da Mata AtlacircnticamdashReferencial dos Conceitos e Accedilotildees de Restauraccedilatildeo FlorestalRodrigues RR Brancalion PHS Eds LERFESALQ Instituto BioAtlacircntica Satildeo Paulo Brazil 2009pp 158ndash175 ISBN 978-85-60840-02-1
31 Santos KD Kinoshita LS Rezende AA Species composition of climbers in seasonal semideciduousforest fragments of Southeastern Brazil Biota Neotropica 2009 9 175ndash188 [CrossRef]
32 Gee G Or D Particle-size analysis In Methods of Soil Analysis Physical Methods Dane JH Topp C EdsSoil Science Society of America Madison WI USA 2002 pp 255ndash293 ISBN 978-0-89118-841-4
33 Walkley A Black IA An examination of the degtjareff method for determining soil organic matter anda proposed modification of the chromic acid titration method Soil Sci 1934 37 [CrossRef]
34 Dane JH Hopmans JW Pressure plate extractor In Methods of Soil Analysis Physical Methods Dane JTopp C Eds Soil Science Society of America Madison WI USA 2002 pp 688ndash690 ISBN 978-0-89118-841-4
35 Haverkamp R Ross PJ Smettem KRJ Parlange JY Three-dimensional analysis of infiltration from thedisc infiltrometer 2 Physically based infiltration equation Water Resour Res 1994 30 2931ndash2935 [CrossRef]
36 Alagna V Bagarello V Di Prima S Giordano G Iovino M A simple field method to measure thehydrodynamic properties of soil surface crust J Agric Eng 2013 44 74ndash79 [CrossRef]
37 Alagna V Bagarello V Di Prima S Iovino M Determining hydraulic properties of a loam soil byalternative infiltrometer techniques Hydraulic Properties of a Loam Soil by Infiltrometer TechniquesHydrol Process 2016 30 263ndash275 [CrossRef]
38 Castellini M Di Prima S Iovino M An assessment of the BEST procedure to estimate the soil waterretention curve A comparison with the evaporation method Geoderma 2018 320 82ndash94 [CrossRef]
39 Danielson RE Sutherland PL Porosity In Methods of Soil Analysis Part I Physical and Mineralogical MethodsAgronomy Monograph No 9 Klute A Ed American Society of Agronomy Soil Science Society of AmericaMadison WI USA 1986 pp 443ndash461
40 Bagarello V Di Prima S Iovino M Comparing Alternative Algorithms to Analyze the Beerkan InfiltrationExperiment Soil Sci Soc Am J 2014 78 724ndash726 [CrossRef]
41 Lassabatere L Angulo-Jaramillo R Soria Ugalde JM Cuenca R Braud I Haverkamp R Beerkanestimation of soil transfer parameters through infiltration experimentsmdashBEST Soil Sci Soc Am J 2006 70521ndash532 [CrossRef]
42 Yilmaz D Lassabatere L Angulo-Jaramillo R Deneele D Legret M Hydrodynamic Characterization ofBasic Oxygen Furnace Slag through an Adapted BEST Method Vadose Zone J 2010 9 107ndash116 [CrossRef]
43 Di Prima S Lassabatere L Bagarello V Iovino M Angulo-Jaramillo R Testing a new automated singlering infiltrometer for Beerkan infiltration experiments Geoderma 2016 262 20ndash34 [CrossRef]
44 Brooks R Corey T Hydraulic Properties of Porous Media Colorado State University Fort Collins CO USA1964 Volume 24
45 Haverkamp R Debionne S Angulo-Jaramillo R Condappa D Soil Properties and Moisture Movementin the Unsaturated Zone In Groundwater Engineering Cushman JH Tartakovsky DM Eds CRS PressBoca Raton FL USA 1999
Water 2018 10 453 15 of 16
46 Cullotta S Bagarello V Baiamonte G Gugliuzza G Iovino M La Mela Veca DS Maetzke FPalmeri V Sferlazza S Comparing Different Methods to Determine Soil Physical Quality in a MediterraneanForest and Pasture Land Soil Sci Soc Am J 2016 80 1038ndash1056 [CrossRef]
47 Bagarello V Di Prima S Iovino M Estimating saturated soil hydraulic conductivity by the near steady-statephase of a Beerkan infiltration test Geoderma 2017 303 70ndash77 [CrossRef]
48 Reynolds WD Elrick DE Ponded infiltration from a single ring I Analysis of steady flow Soil Sci Soc Am J1990 54 1233ndash1241 [CrossRef]
49 Elrick DE Reynolds WD Methods for analyzing constant-head well permeameter data Soil Sci Soc Am J1992 56 320ndash323 [CrossRef]
50 Reynolds WD Elrick DE Pressure infiltrometer In Methods of Soil Analysis Part 4 Dane JH Topp GC EdsSoil Science Society of America Madison WI USA 2002 pp 826ndash836
51 Bagarello V Di Prima S Iovino M Provenzano G Estimating field-saturated soil hydraulic conductivityby a simplified Beerkan infiltration experiment Simplified determination of soil hydraulic conductivityHydrol Process 2014 28 1095ndash1103 [CrossRef]
52 Castellini M Iovino M Pirastru M Niedda M Bagarello V Use of BEST Procedure to Assess SoilPhysical Quality in the Baratz Lake Catchment (Sardinia Italy) Soil Sci Soc Am J 2016 80 742ndash755[CrossRef]
53 Lilliefors HW On the Kolmogorov-Smirnov test for normality with mean and variance unknownJ Am Stat Assoc 1967 62 399ndash402 [CrossRef]
54 Warrick AW Spatial variability In Environmental Soil Physics Hillel D Ed Academic Press San DiegoCA USA 1998 pp 655ndash675
55 Lee DM Elrick DE Reynolds WD Clothier BE A comparison of three field methods for measuringsaturated hydraulic conductivity Can J Soil Sci 1985 65 563ndash573 [CrossRef]
56 Reynolds WD Drury CF Yang XM Tan CS Optimal soil physical quality inferred through structuralregression and parameter interactions Geoderma 2008 146 466ndash474 [CrossRef]
57 R Core Team R A Language and Environment for Statistical Computing R Foundation for Statistical ComputingViena Austria 2014
58 Lichner L Hallett PD Drongovaacute Z Czachor H Kovacik L Mataix-Solera J Homolaacutek M Algaeinfluence the hydrophysical parameters of a sandy soil Catena 2013 108 58ndash68 [CrossRef]
59 Doerr SH Shakesby RA Walsh RPD Soil water repellency Its causes characteristics andhydro-geomorphological significance Earth-Sci Rev 2000 51 33ndash65 [CrossRef]
60 Muumlller K Deurer M Review of the remediation strategies for soil water repellency Agric Ecosyst Environ2011 144 208ndash221 [CrossRef]
61 Logsdon SD Transient variation in the infiltration rate during measurement with tension infiltrometersSoil Sci 1997 162 233ndash241 [CrossRef]
62 Kacimov AR Al-Ismaily S Al-Maktoumi A Green-Ampt one-dimensional infiltration from a pondedsurface into a heterogeneous soil J Irrig Drain Eng 2009 136 68ndash72 [CrossRef]
63 Cooper M Medeiros JC Rosa JD Soria JE Toma RS Soil functioning in a toposequence underrainforest in Satildeo Paulo Brazil Rev Bras Cienc Solo 2013 37 392ndash399 [CrossRef]
64 Zenero MDO Silva LFSD Castilho SCDP Vidal A Grimaldi M Cooper M Characterizationand Classification of Soils under Forest and Pasture in an Agroextractivist Project in Eastern AmazoniaRev Bras Cienc Solo 2016 40 [CrossRef]
65 Nogueira LR Silva CFD Pereira MG Gaia-Gomes JH Silva EMRD Biological Properties andOrganic Matter Dynamics of Soil in Pasture and Natural Regeneration Areas in the Atlantic Forest BiomeRev Bras Cienc Solo 2016 40 [CrossRef]
66 Cooper M Rosa JD Medeiros JC Oliveira TCD Toma RS Juhaacutesz CEP Hydro-physicalcharacterization of soils under tropical semi-deciduous forest Sci Agric 2012 69 152ndash159 [CrossRef]
67 Loumlf M Dey DC Navarro RM Jacobs DF Mechanical site preparation for forest restoration New For2012 43 825ndash848 [CrossRef]
68 Ferraz SFB Lima WDP Rodrigues CB Managing forest plantation landscapes for water conservationFor Ecol Manag 2013 301 58ndash66 [CrossRef]
Water 2018 10 453 16 of 16
69 Brockerhoff EG Jactel H Parrotta JA Ferraz SFB Role of eucalypt and other planted forests inbiodiversity conservation and the provision of biodiversity-related ecosystem services For Ecol Manag2013 301 43ndash50 [CrossRef]
70 Gageler R Bonner M Kirchhof G Amos M Robinson N Schmidt S Shoo LP Early Response ofSoil Properties and Function to Riparian Rainforest Restoration PLoS ONE 2014 9 e104198 [CrossRef][PubMed]
71 Holl KD Factors Limiting Tropical Rain Forest Regeneration in Abandoned Pasture Seed Rain SeedGermination Microclimate and Soil Biotropica 1999 31 229ndash242 [CrossRef]
72 Zahawi RA Augspurger CK Tropical forest restoration Tree islands as recruitment foci in degradedlands of Honduras Ecol Appl 2006 16 464ndash478 [CrossRef]
73 Bassett IE Simcock RC Mitchell ND Consequences of soil compaction for seedling establishmentImplications for natural regeneration and restoration Austral Ecol 2005 30 827ndash833 [CrossRef]
74 Hamza MA Anderson WK Soil compaction in cropping systems Soil Tillage Res 2005 82 121ndash145[CrossRef]
75 Latawiec AE Strassburg BB Brancalion PH Rodrigues RR Gardner T Creating space for large-scalerestoration in tropical agricultural landscapes Front Ecol Environ 2015 13 211ndash218 [CrossRef]
copy 2018 by the authors Licensee MDPI Basel Switzerland This article is an open accessarticle distributed under the terms and conditions of the Creative Commons Attribution(CC BY) license (httpcreativecommonsorglicensesby40)
- Introduction
- Materials and Methods
-
- Field Site
- Experimental Design
- Soil Sampling and Measurements
- Estimating and Selecting the BEST Algorithm
- Data Analysis
-
- Results
-
- Differences in Soil Attributes among Study Sites
- Estimating and Selecting the BEST Algorithm
- Saturated Soil Hydraulic Conductivity (Ks) Characterization
-
- Discussion
-
- Effects of Land Use on Soil Attributes and Ks
- Management Implications
-
- Conclusions
- References
-
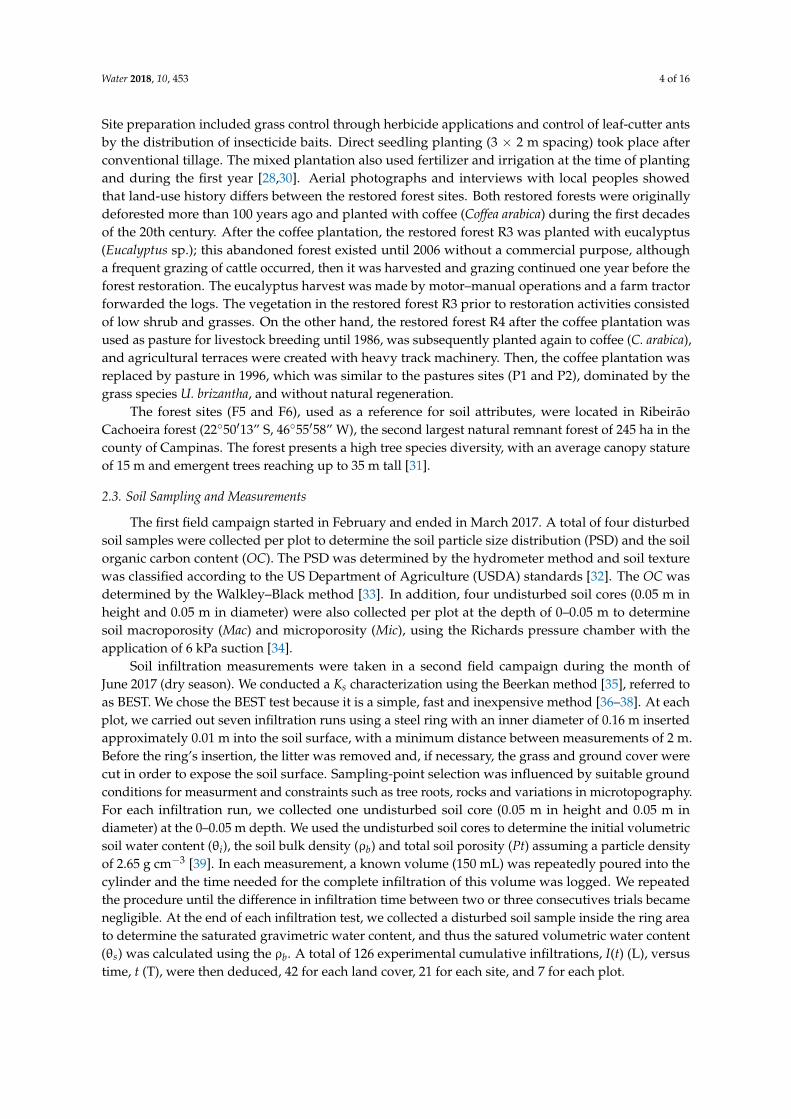
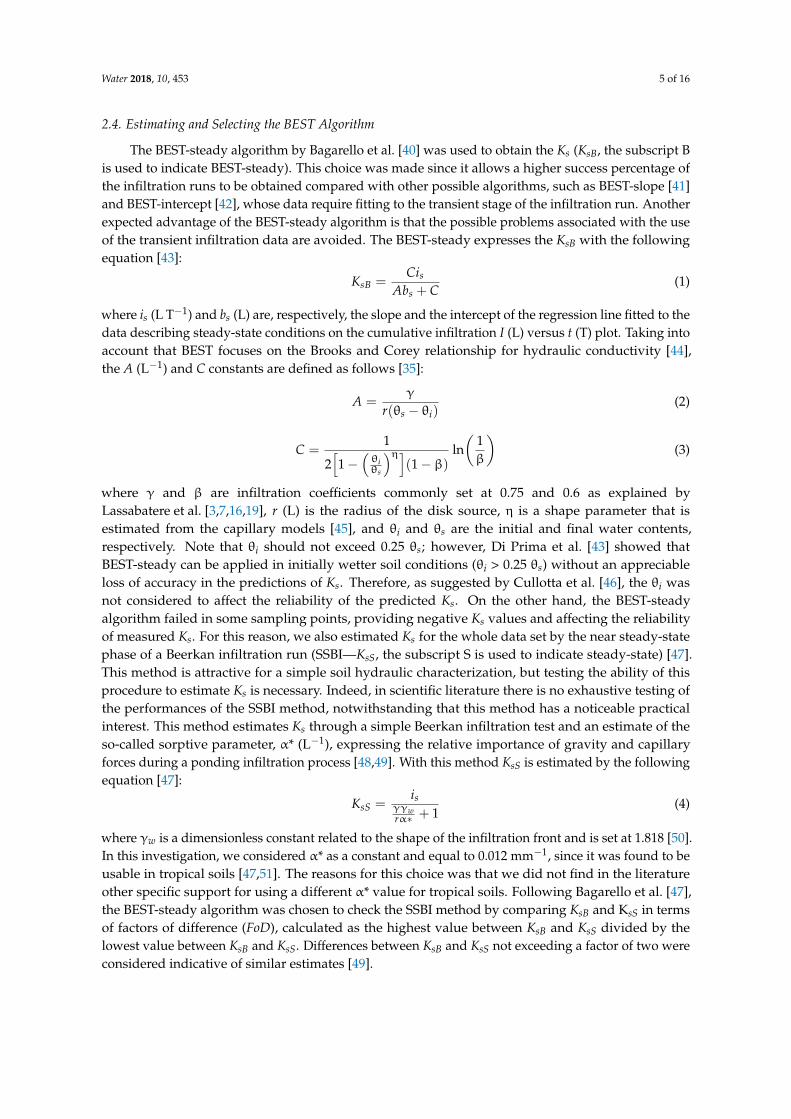