Preventing Drug-Impaired Driving and Overdoses: Lessons from Alcohol-Impaired Driving July 11, 2014...
31
Preventing Drug-Impaired Driving and Overdoses: Lessons from Alcohol- Impaired Driving July 11, 2014 Ralph Hingson, Sc.D., M.P.H. Director, Division of Epidemiology and Prevention Research National Institute on Alcohol Abuse and Alcoholism RADD-ONDCP Columbus, OH
-
Upload
myrtle-sims -
Category
Documents
-
view
218 -
download
1
Transcript of Preventing Drug-Impaired Driving and Overdoses: Lessons from Alcohol-Impaired Driving July 11, 2014...
Preventing Drug-Impaired Driving and Overdoses: Lessons from Alcohol-Impaired
Driving
July 11, 2014
Ralph Hingson, Sc.D., M.P.H.Director, Division of Epidemiology and Prevention Research
National Institute on Alcohol Abuse and Alcoholism
RADD-ONDCP
Columbus, OH
Nat
ion
al In
stit
ute
on
Alc
oh
ol A
bu
se a
nd
Alc
oh
olis
mN
atio
nal
Inst
itu
te o
n A
lco
ho
l Ab
use
an
d A
lco
ho
lism
1982
1984
1986
1988
1990
1992
1994
1996
1998
2000
2002
2004
2006
2008
2010
0.00
2.00
4.00
6.00
8.00
10.00
12.00
Alcohol-Related ↓ 62%
Non-Alcohol-Related ↓ 16%
4.32 (n= 13,364)
6.42 (n= 19,521)
11.3 (n=26,173)
7.67 (n= 17,772)
Alcohol- vs. Non-Alcohol-Related Traffic Fatalities, Rate Per 100,000, All Ages, United States, 1982-2010
Sources: National Highway Traffic Safety Administration, 2012; U.S. Census Bureau, 2012

Reductions in driving after drinking have prevented over 300,000 deaths, more than the combined effects of increases in use of:– Seat belts– Airbags– Motor cycle helmets– Bicycle helmets
Source: Cummings & Rivara, Injury Prevention, 2006; Fell & Voas, Traffic Injury Prev, 2006
1982
1983
1984
1985
1986
1987
1988
1989
1990
1991
1992
1993
1994
1995
1996
1997
1998
1999
2000
2001
2002
2003
2004
2005
2006
2007
2008
2009
2010
0
5
10
15
20
25
30
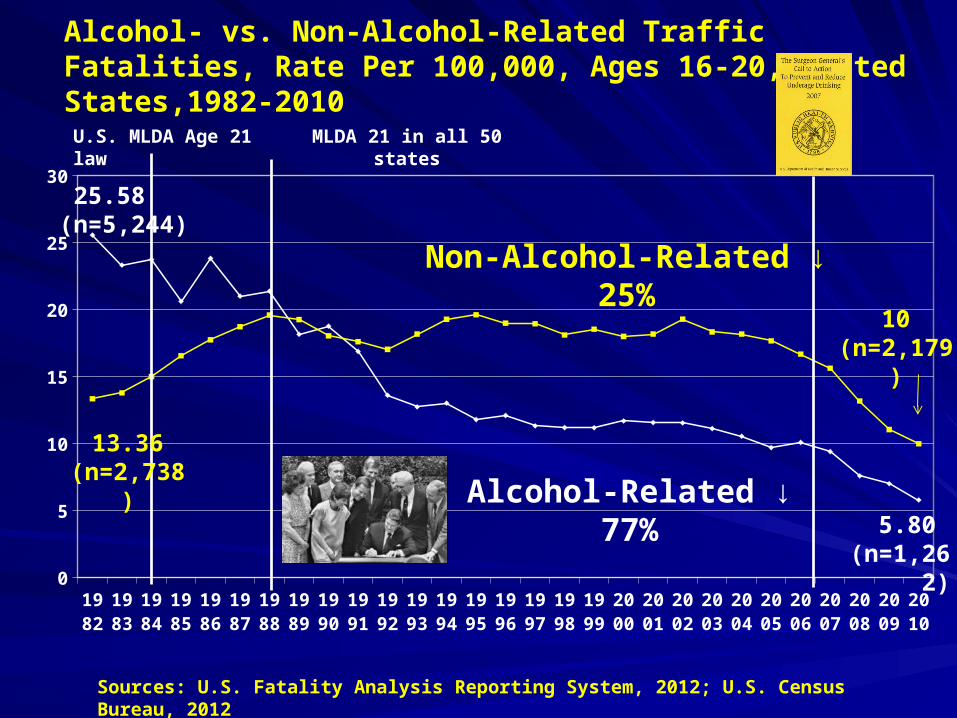
Alcohol-Related ↓ 77%
Non-Alcohol-Related ↓ 25%
Alcohol- vs. Non-Alcohol-Related Traffic Fatalities, Rate Per 100,000, Ages 16-20, United States,1982-2010
25.58 (n=5,244)
5.80 (n=1,26
2)
10 (n=2,179
)
U.S. MLDA Age 21 law
MLDA 21 in all 50 states
Sources: U.S. Fatality Analysis Reporting System, 2012; U.S. Census Bureau, 2012
13.36 (n=2,738
)
One reason for this dramatic progress is that most fatally injured drivers are tested for alcohol, and alcohol involvement is reported by community and state on an annual basis.
In states where not all drivers are tested for alcohol, the National Highway Traffic Safety Administration (NHTSA) uses an “imputation formula” and multiple imputation methods to estimate which fatal crashes involved alcohol.
5
Source: NHTSA, Transforming to Multiple Imputation: A New Method to Estimate Missing Blood Alcohol Concentration (BAC) Values in FARS, NHTSA Technical Report, DOT 809403, 2002.
This permits evaluation of laws aimed at reducing drinking and driving, by comparing fatal crash trends in states that pass such laws with states that do not (e.g. per se laws, ALR, minimum legal drinking ages, & illegal blood alcohol limits).
Community programs to reduce drunken driving, e.g.:– Saving Lives Program– Communities Mobilizing for Change– Community Trials– Fighting Back
7
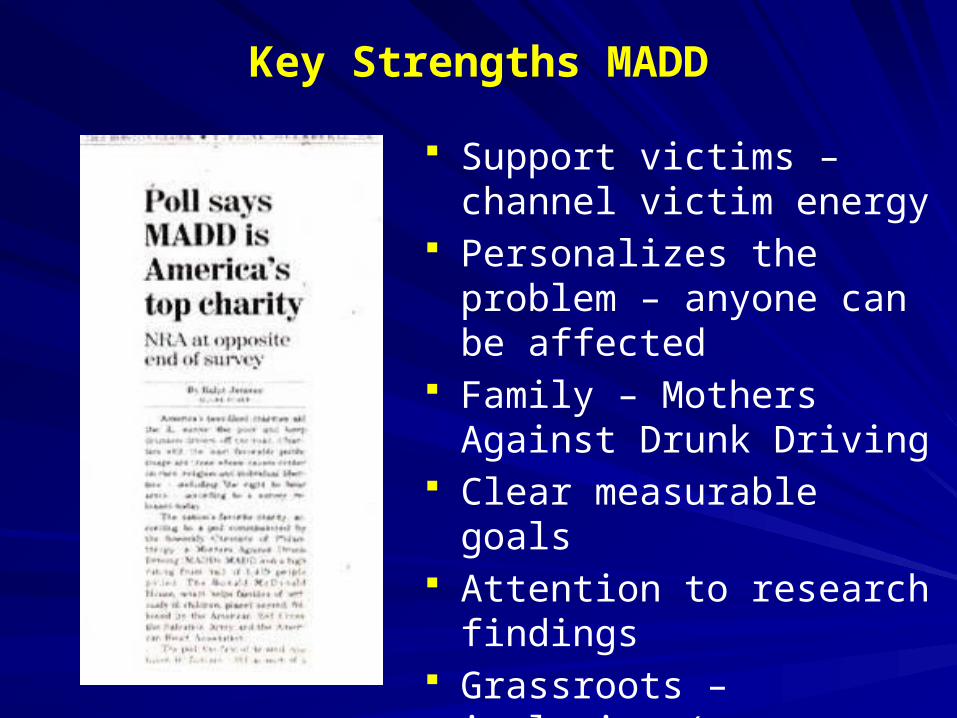
Key Strengths MADD
Support victims – channel victim energy
Personalizes the problem – anyone can be affected
Family – Mothers Against Drunk Driving
Clear measurable goals Attention to research findings Grassroots – inclusive
(everyone can be part of the solution)
Nat
ion
al In
stit
ute
on
Alc
oh
ol A
bu
se a
nd
Alc
oh
olis
mN
atio
nal
Inst
itu
te o
n A
lco
ho
l Ab
use
an
d A
lco
ho
lism
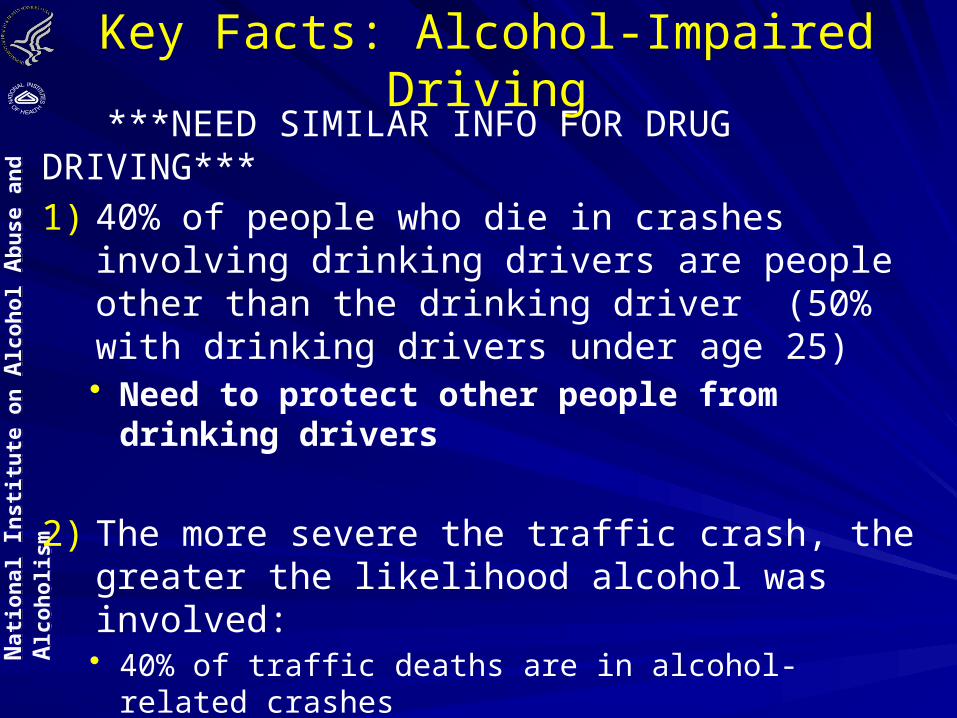
Key Facts: Alcohol-Impaired Driving ***NEED SIMILAR INFO FOR DRUG DRIVING***
1) 40% of people who die in crashes involving drinking drivers are people other than the drinking driver (50% with drinking drivers under age 25)• Need to protect other people from drinking drivers
2) The more severe the traffic crash, the greater the likelihood alcohol was involved:• 40% of traffic deaths are in alcohol-related crashes• 9% of people injured were in alcohol-related crashes• 5% of vehicle damage only • Important to focus attention on traffic deaths
Nat
ion
al In
stit
ute
on
Alc
oh
ol A
bu
se a
nd
Alc
oh
olis
mN
atio
nal
Inst
itu
te o
n A
lco
ho
l Ab
use
an
d A
lco
ho
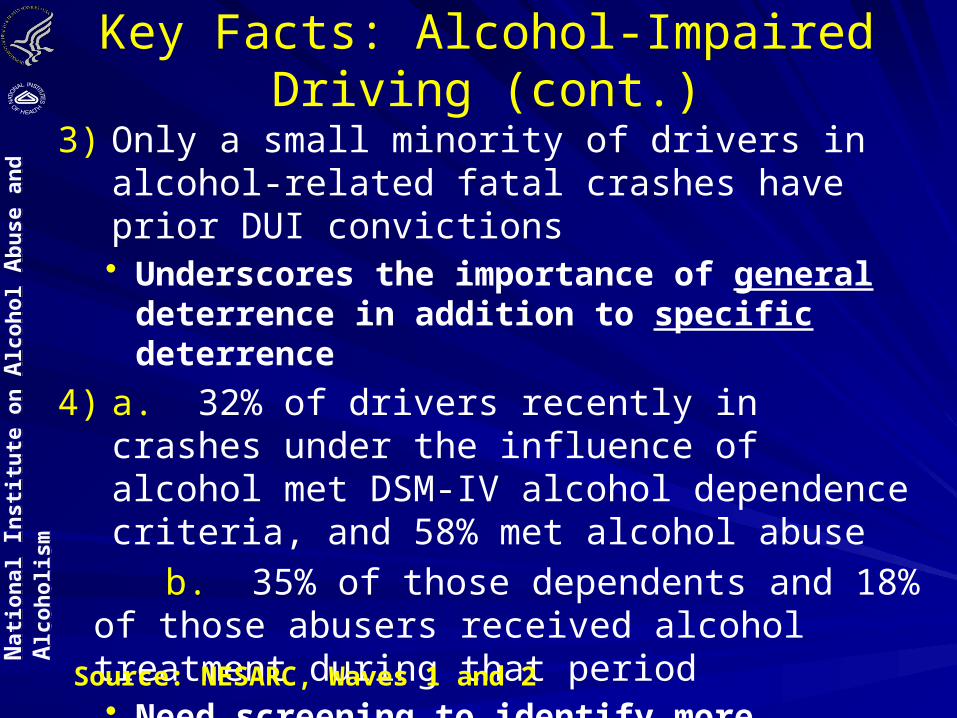
lism 3) Only a small minority of drivers in alcohol-related
fatal crashes have prior DUI convictions• Underscores the importance of general
deterrence in addition to specific deterrence
4) a. 32% of drivers recently in crashes under the influence of alcohol met DSM-IV alcohol dependence criteria, and 58% met alcohol abuse
b. 35% of those dependents and 18% of those abusers received alcohol treatment during that period• Need screening to identify more drinking drivers
with alcohol dependence
Key Facts: Alcohol-Impaired Driving (cont.)
Source: NESARC, Waves 1 and 2
Nat
ion
al In
stit
ute
on
Alc
oh
ol A
bu
se a
nd
Alc
oh
olis
mN
atio
nal
Inst
itu
te o
n A
lco
ho
l Ab
use
an
d A
lco
ho
lism
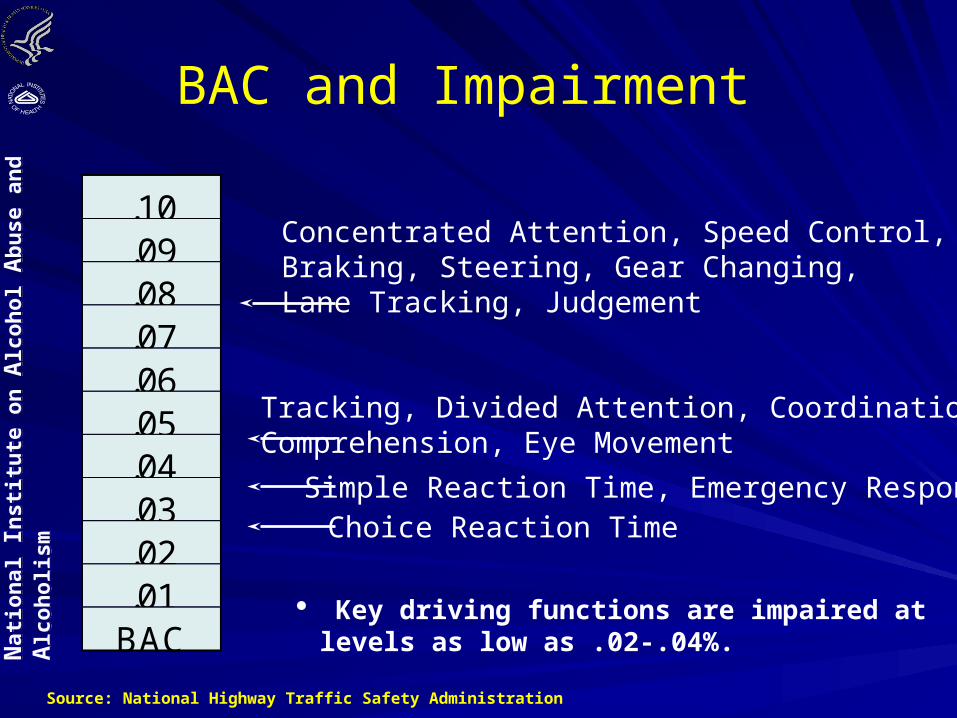
BAC and Impairment
.10
.09
.08
.07
.06
.05
.04
.03
.02
.01BAC
Concentrated Attention, Speed Control,Braking, Steering, Gear Changing, Lane Tracking, Judgement
Tracking, Divided Attention, Coordination,Comprehension, Eye Movement
Simple Reaction Time, Emergency ResponseChoice Reaction Time
Source: National Highway Traffic Safety Administration
· Key driving functions are impaired at levels as low as .02-.04%.
Nat
ion
al In
stit
ute
on
Alc
oh
ol A
bu
se a
nd
Alc
oh
olis
mN
atio
nal
Inst
itu
te o
n A
lco
ho
l Ab
use
an
d A
lco
ho
lism
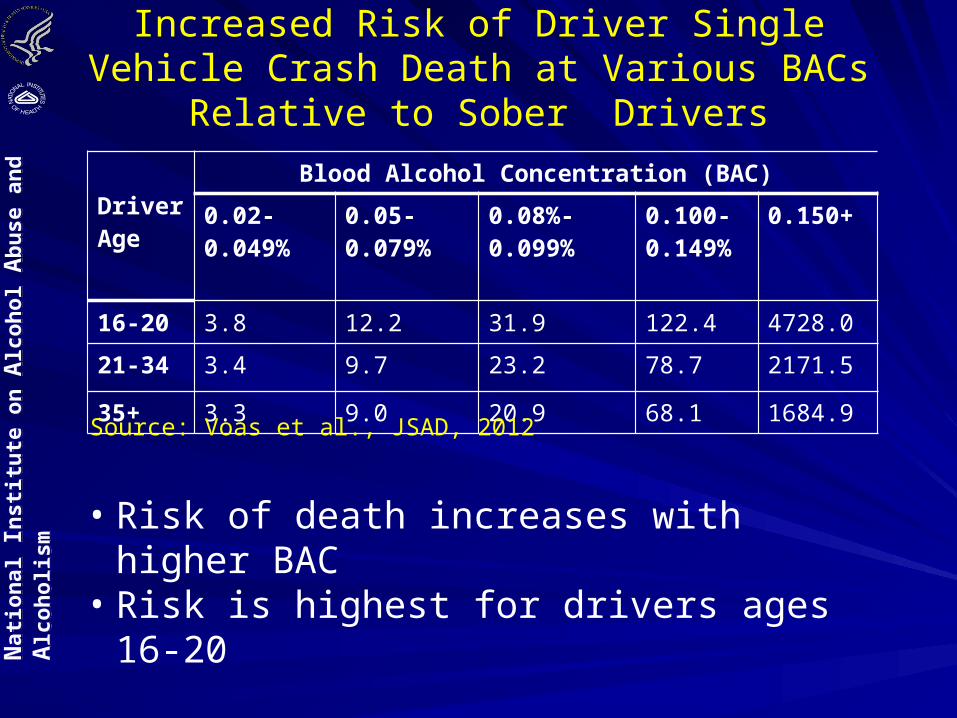
Increased Risk of Driver Single Vehicle Crash Death at Various BACs Relative to Sober Drivers
Driver Age
Blood Alcohol Concentration (BAC)
0.02-0.049%
0.05-0.079%
0.08%-0.099%
0.100-0.149%
0.150+
16-20 3.8 12.2 31.9 122.4 4728.0
21-34 3.4 9.7 23.2 78.7 2171.5
35+ 3.3 9.0 20.9 68.1 1684.9
Source: Voas et al., JSAD, 2012
• Risk of death increases with higher BAC• Risk is highest for drivers ages 16-20
Nat
ion
al In
stit
ute
on
Alc
oh
ol A
bu
se a
nd
Alc
oh
olis
mN
atio
nal
Inst
itu
te o
n A
lco
ho
l Ab
use
an
d A
lco
ho
lism
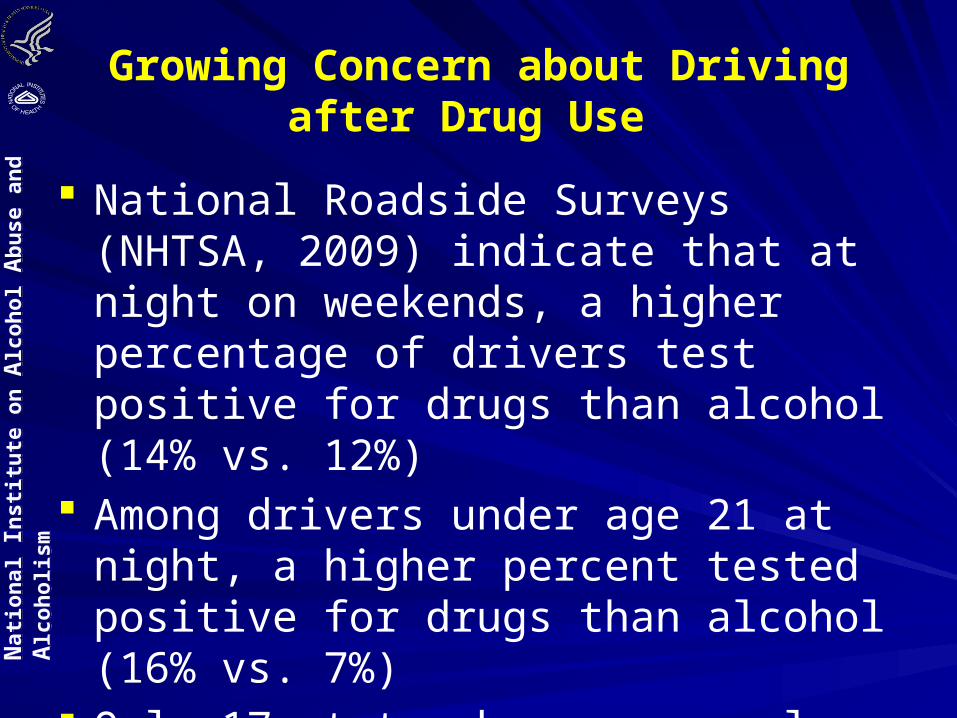
National Roadside Surveys (NHTSA, 2009) indicate that at night on weekends, a higher percentage of drivers test positive for drugs than alcohol (14% vs. 12%)
Among drivers under age 21 at night, a higher percent tested positive for drugs than alcohol (16% vs. 7%)
Only 17 states have per se laws making it illegal to drive with positive drug blood levels
Growing Concern about Driving after Drug Use
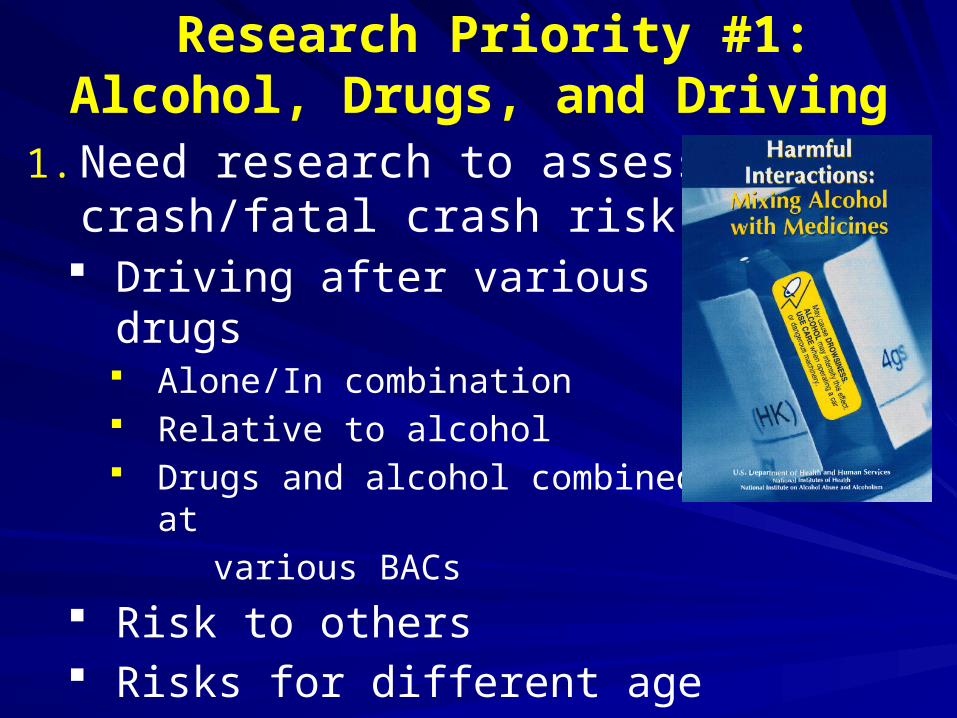
Research Priority #1: Alcohol, Drugs, and Driving
1. Need research to assess crash/fatal crash risk Driving after various drugs
Alone/In combination Relative to alcohol Drugs and alcohol combined at
various BACs
Risk to others Risks for different age groups
Possible Types of Studies
Experimental laboratory– Effect on cognitive tasks needed to safely
operate a vehicle (e.g., simple reaction time, divided attention, tracking, recovery from glare, etc.)
Road Course strudies Epidemiologic studies
– Culpability studies– Case/control studies– Cohort studies

Drugs found to increase traffic crash risk:
Medicinal opioids Amphetamines Multiple drugs Alcohol and drugs combined
Marijuana Benzodiazepines Cocaine Illicit opiates
Sources: Driving Under the Influence of Drugs, Alcohol, and Medicines (DRUID): Risk of
Injury by Driving with Alcohol and Other Drugs (2011) Ashbridge et al., Acute cannabis consumption and motor vehicle collision risk,
British Medical Journal, 2012. Elvik. Risk of raod accident and associated with use of drugs, Accident Analysis
and Prevention, 2012 Li et al., Marijuana use and motor vehicle crashes, Epidemiologic Reviews, 2012 National Highway Traffic Safety Administration is supporting a case/control study

Method: ◦ Case-control study based on:
Data from seriously injured/killed drivers (cases) Data from road side surveys (controls)
◦ Assessment of the risk for drivers of passenger cars and vans: Alcohol Illicit and medicinal drugs Alcohol combined with drugs Multiple drug use
◦ Risk of serious injury: BE, DK, FI, IT, LT and NL
◦ Risk of fatality: FI, NO, PT and SE
European Risk Studies: Risk of Injury by Driving with Alcohol and Other Drugs -DRUID Project
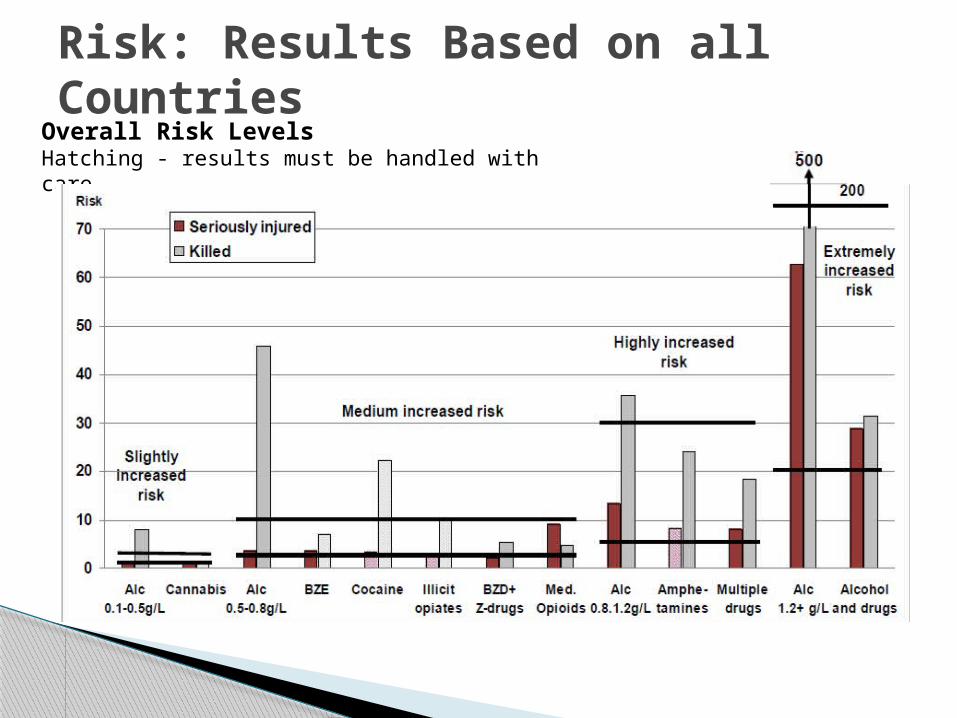
Risk: Results Based on all Countries
Overall Risk LevelsHatching - results must be handled with care
Research Prioity #2
Increase drug testing of drivers in fatal crashes In 2012:
–18 states tested 70% or more of fatally-injured drivers for both alcohol and drugs (36 for alcohol)
Ohio tested 64% of fatally-injured drivers for alcohol and drugs after testing over 80% for several consecutive years
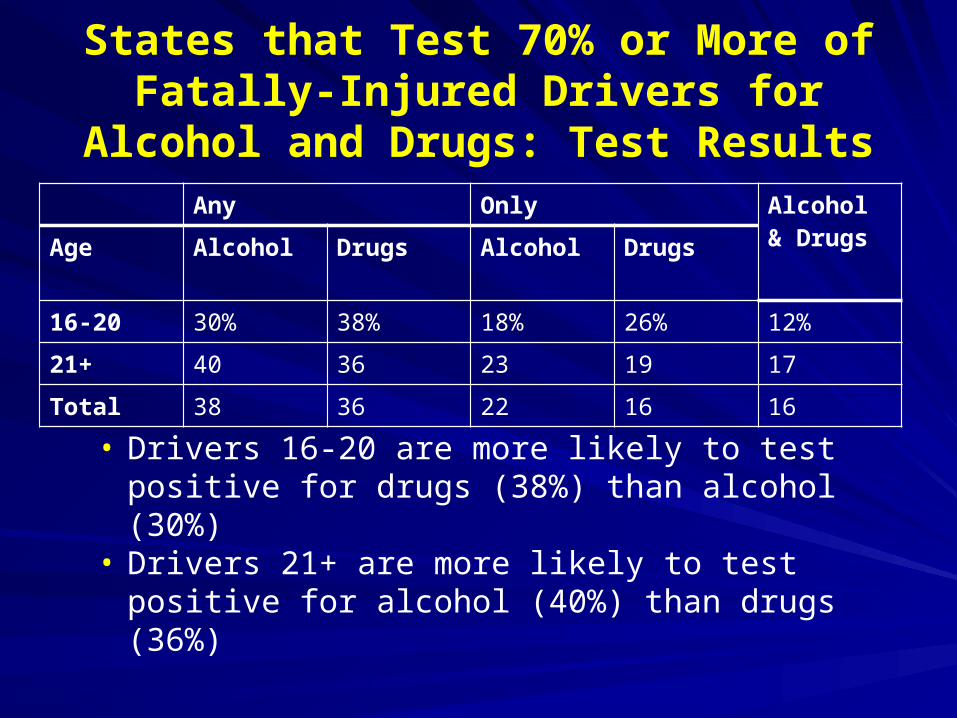
States that Test 70% or More of Fatally-Injured Drivers for Alcohol and Drugs:
Test ResultsAny Only Alcohol &
DrugsAge Alcohol Drugs Alcohol Drugs
16-20 30% 38% 18% 26% 12%
21+ 40 36 23 19 17
Total 38 36 22 16 16
• Drivers 16-20 are more likely to test positive for drugs (38%) than alcohol (30%)
• Drivers 21+ are more likely to test positive for alcohol (40%) than drugs (36%)
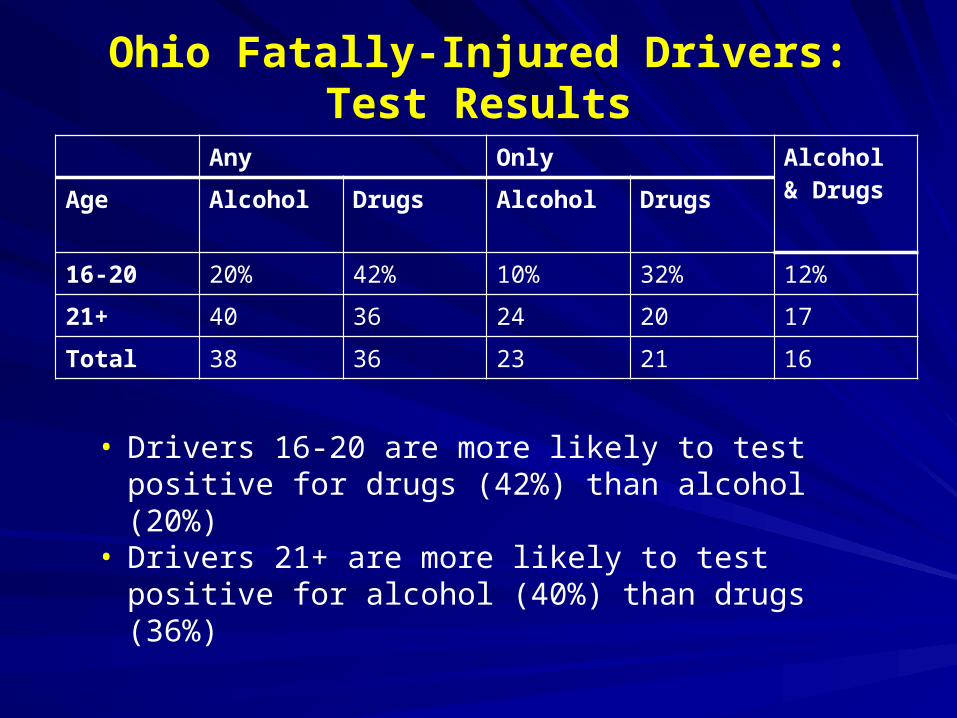
Ohio Fatally-Injured Drivers: Test Results
Any Only Alcohol & DrugsAge Alcohol Drugs Alcohol Drugs
16-20 20% 42% 10% 32% 12%
21+ 40 36 24 20 17
Total 38 36 23 21 16
• Drivers 16-20 are more likely to test positive for drugs (42%) than alcohol (20%)
• Drivers 21+ are more likely to test positive for alcohol (40%) than drugs (36%)
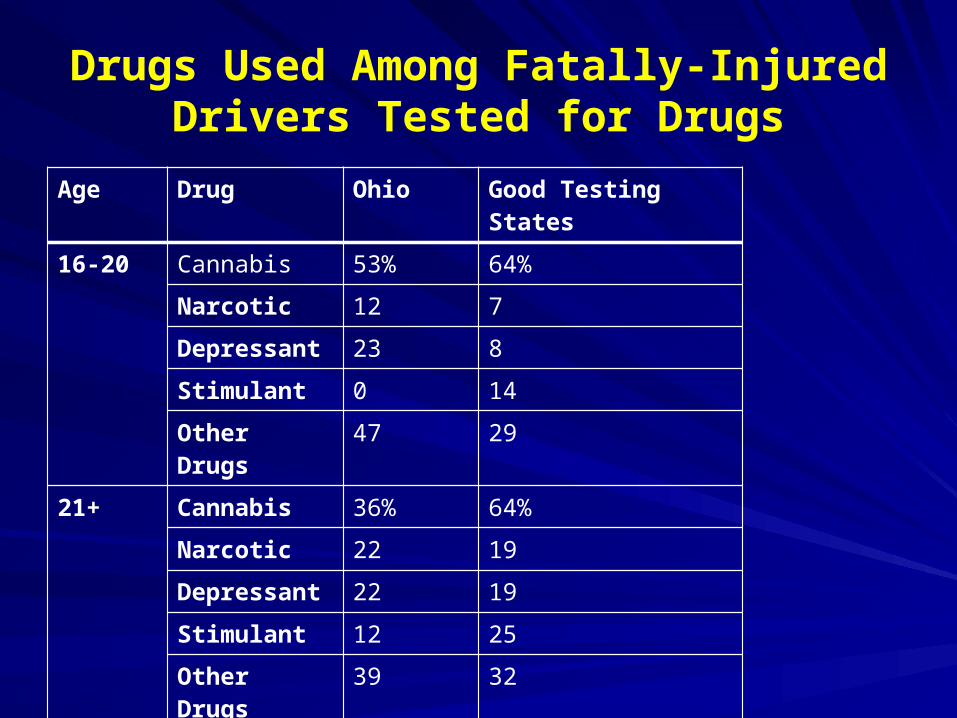
Drugs Used Among Fatally-Injured Drivers Tested for Drugs
Age Drug Ohio Good Testing States
16-20 Cannabis 53% 64%
Narcotic 12 7
Depressant 23 8
Stimulant 0 14
Other Drugs 47 29
21+ Cannabis 36% 64%
Narcotic 22 19
Depressant 22 19
Stimulant 12 25
Other Drugs 39 32

Research Priority #3
Develop Imputation for various drugs
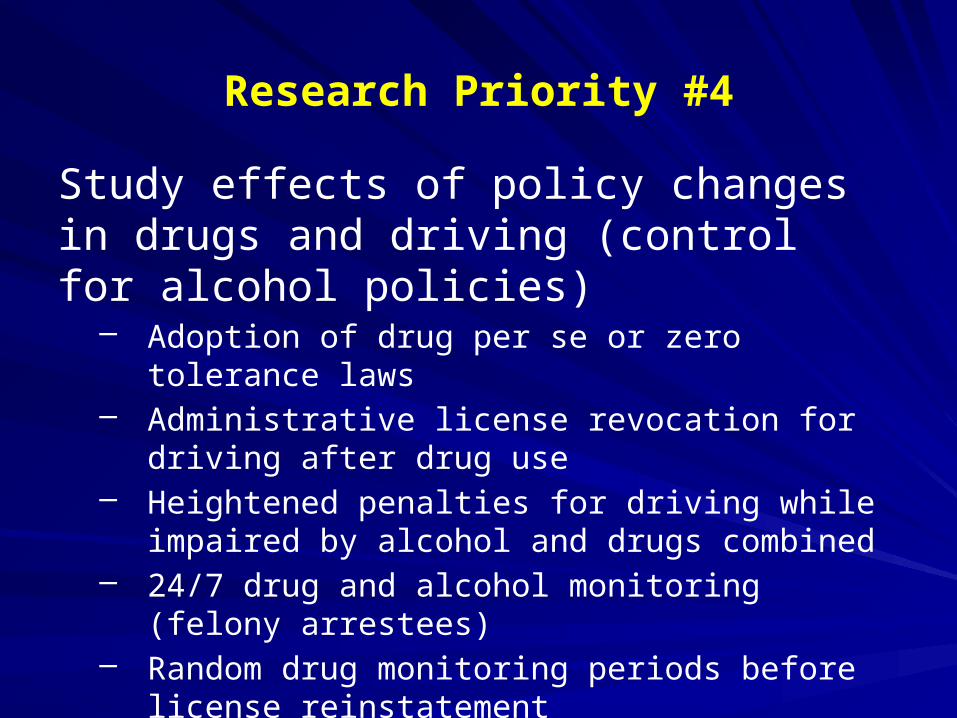
Study effects of policy changes in drugs and driving (control for alcohol policies)
– Adoption of drug per se or zero tolerance laws– Administrative license revocation for driving after
drug use– Heightened penalties for driving while impaired by
alcohol and drugs combined – 24/7 drug and alcohol monitoring (felony arrestees)– Random drug monitoring periods before license
reinstatement– Mandatory assessment and treatment of convicted
offenders for both alcohol and drugs
Research Priority #4

25
Alcohol Policy Information System(http://www.alcoholpolicy.niaaa.nih.gov/)
Alcohol control systems Alcohol beverage taxes DWI laws BAC limits
(adults, youths) Health insurance parity Insurers’ liability for losses
due to intoxication (UPPL) Vehicular insurance
exclusions Open container laws
Underage drinking policies
Keg registration Beverage server training Hours/Days sale Alcohol and pregnancy
35 Policy Topics, 1998-present:
Will add: Medical marijuana Legalized/Recreational
marijuana Drug driving laws
26
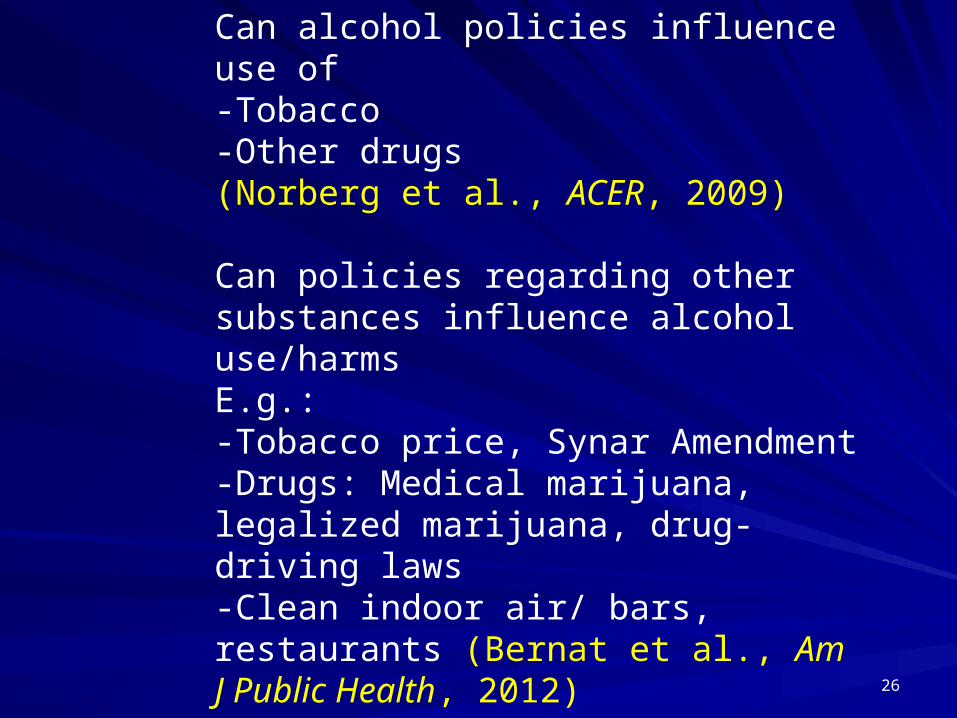
Can alcohol policies influence use of -Tobacco-Other drugs (Norberg et al., ACER, 2009)
Can policies regarding other substances influence alcohol use/harmsE.g.:-Tobacco price, Synar Amendment-Drugs: Medical marijuana, legalized marijuana, drug-driving laws-Clean indoor air/ bars, restaurants (Bernat et al., Am J Public Health, 2012)
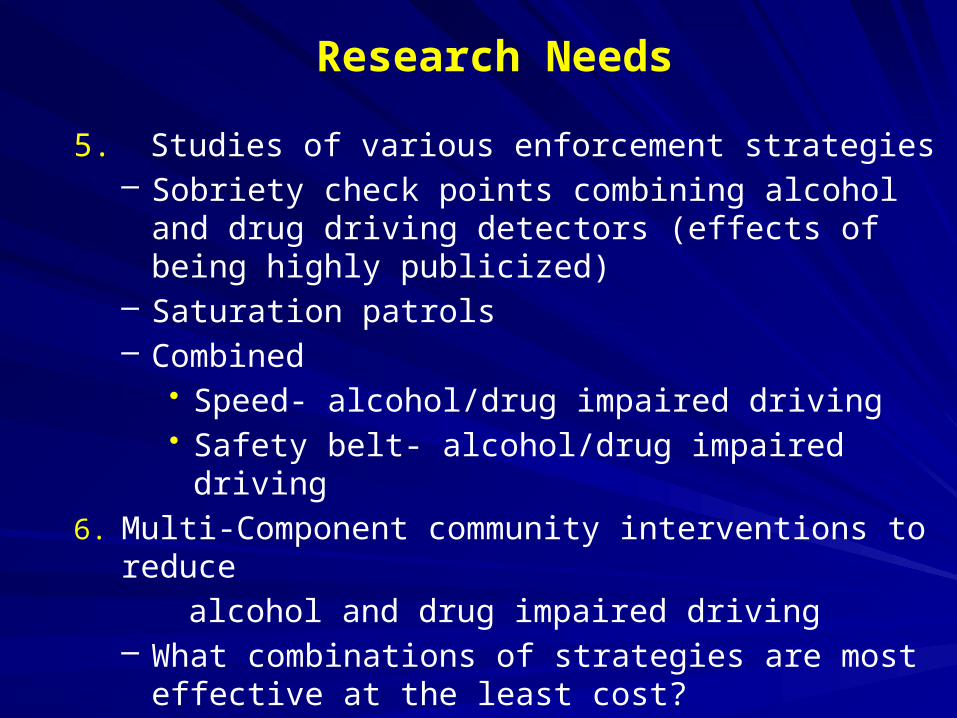
Research Needs
5. Studies of various enforcement strategies– Sobriety check points combining alcohol and drug
driving detectors (effects of being highly publicized)– Saturation patrols– Combined
• Speed- alcohol/drug impaired driving• Safety belt- alcohol/drug impaired driving
6. Multi-Component community interventions to reduce
alcohol and drug impaired driving– What combinations of strategies are most effective at
the least cost?
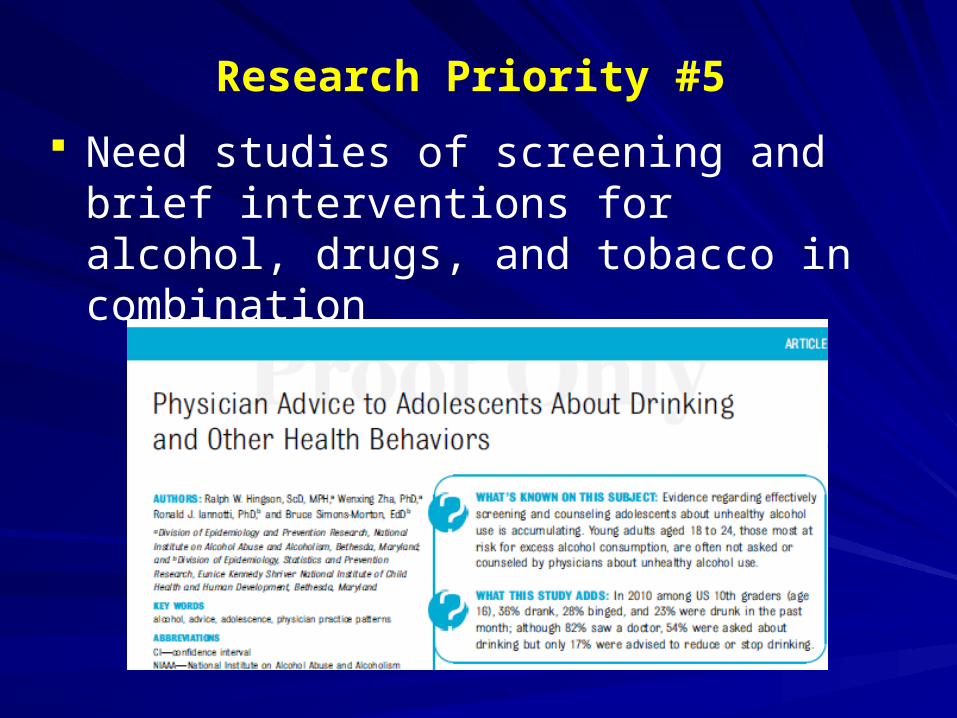
Research Priority #5
Need studies of screening and brief interventions for alcohol, drugs, and tobacco in combination
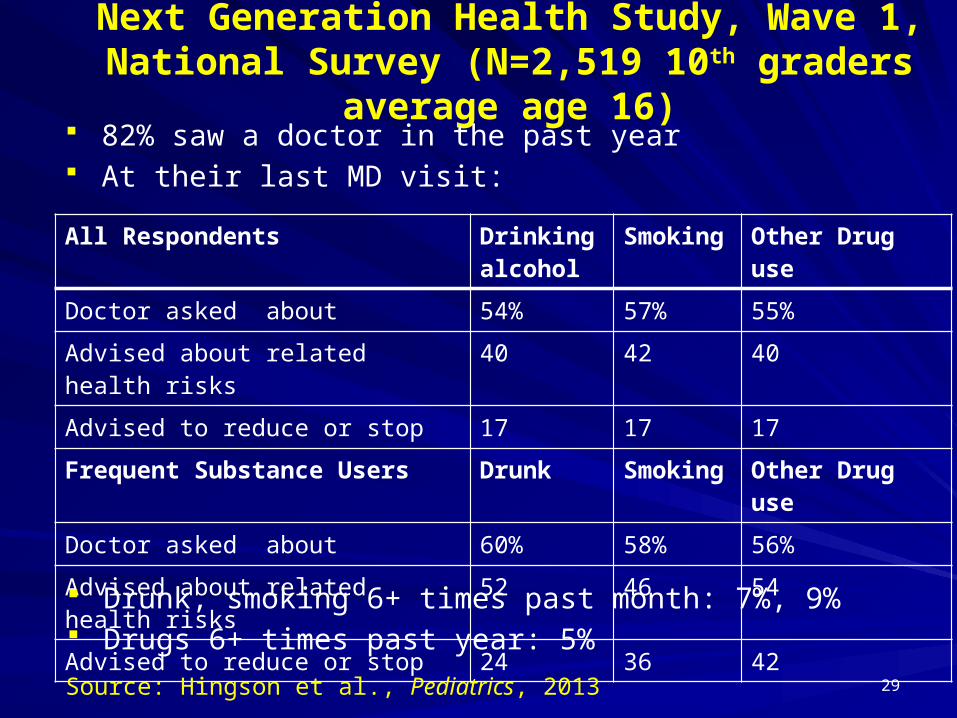
Next Generation Health Study, Wave 1, National Survey (N=2,519 10th graders average age 16)
82% saw a doctor in the past year At their last MD visit:
29
All Respondents Drinking alcohol
Smoking Other Drug use
Doctor asked about 54% 57% 55%
Advised about related health risks 40 42 40
Advised to reduce or stop 17 17 17
Frequent Substance Users Drunk Smoking Other Drug use
Doctor asked about 60% 58% 56%
Advised about related health risks 52 46 54
Advised to reduce or stop 24 36 42
Source: Hingson et al., Pediatrics, 2013
Drunk, smoking 6+ times past month: 7%, 9% Drugs 6+ times past year: 5%
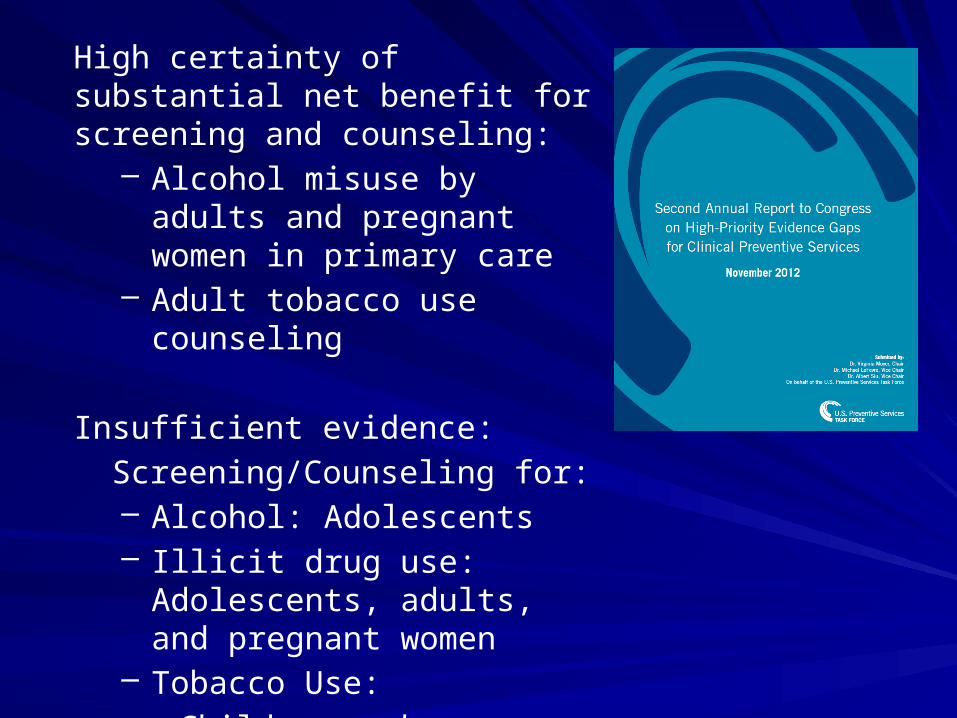
High certainty of substantial net benefit for screening and counseling:
– Alcohol misuse by adults and pregnant women in primary care
– Adult tobacco use counseling
Insufficient evidence:
Screening/Counseling for:– Alcohol: Adolescents– Illicit drug use: Adolescents,
adults, and pregnant women– Tobacco Use:
Children and adolescents
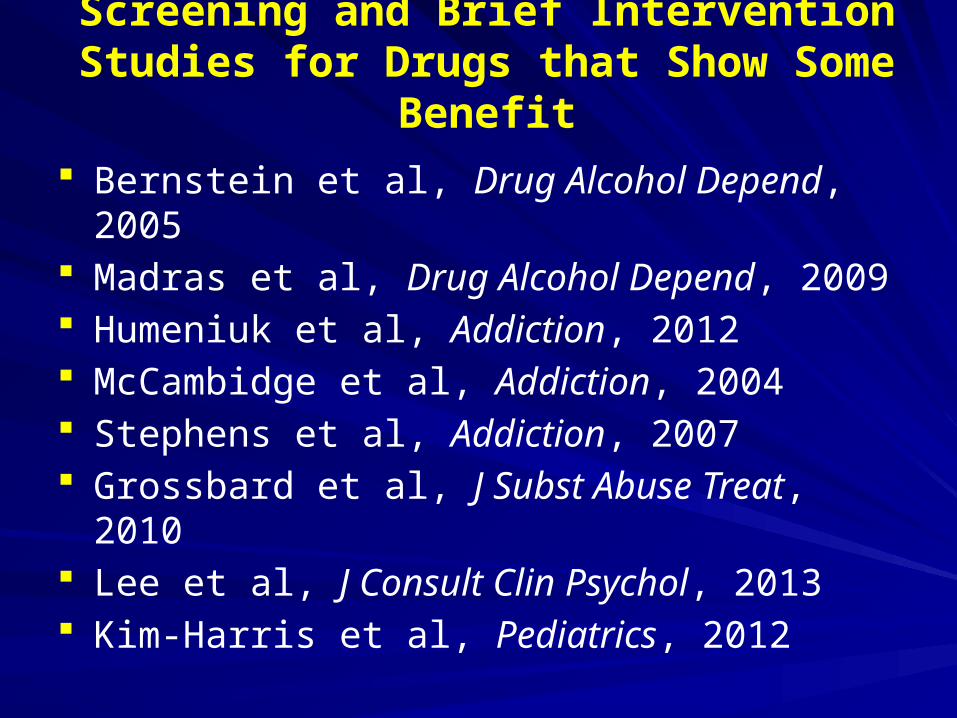
Screening and Brief Intervention Studies for Drugs that Show Some Benefit
Bernstein et al, Drug Alcohol Depend, 2005 Madras et al, Drug Alcohol Depend, 2009 Humeniuk et al, Addiction, 2012 McCambidge et al, Addiction, 2004 Stephens et al, Addiction, 2007 Grossbard et al, J Subst Abuse Treat, 2010 Lee et al, J Consult Clin Psychol, 2013 Kim-Harris et al, Pediatrics, 2012