PREVALENCE OF AND RISK FACTORS FOR FATTY … · Background •Fatty liver (FL), the most common...
66
PREVALENCE OF AND RISK FACTORS FOR FATTY LIVER IN THE GENERAL POPULATION: THE BAGNACAVALLO STUDY Giorgio Bedogni www.giorgiobedogni.it PREVALENCE OF AND RISK FACTORS FOR FATTY LIVER IN THE GENERAL POPULATION: THE BAGNACAVALLO STUDY Giorgio Bedogni www.giorgiobedogni.it
-
Upload
trannguyet -
Category
Documents
-
view
214 -
download
0
Transcript of PREVALENCE OF AND RISK FACTORS FOR FATTY … · Background •Fatty liver (FL), the most common...

PREVALENCE OF AND RISK FACTORS FOR FATTY LIVER IN THE GENERAL POPULATION:
THE BAGNACAVALLO STUDY
Giorgio Bedogni
www.giorgiobedogni.it
PREVALENCE OF AND RISK FACTORS FOR FATTYLIVER IN THE GENERAL POPULATION:
THE BAGNACAVALLO STUDY
Giorgio Bedogni
www.giorgiobedogni.it

Note
• The present talk is based on version 0.0 of the MS
“PREVALENCE OF AND RISK FACTORS FOR FATTY LIVER IN THE GENERAL POPULATION OF NORTHERN ITALY: THE BAGNACAVALLO STUDY”
Note
• The present talk is based on version 0.0 of the MS
"PREVALENCE OF AND RISK FACTORS FOR FATTYLIVER IN THE GENERAL POPULATION OF NORTHERNITALY: THE BAG NACAVALLO STUDY"

Outline
• Background• Aim• Subjects and methods• Results• Discussion
Outline
• Background• Aim• Subjects and methods• Results• Discussion

Outline
• Background• Aim• Subjects and methods• Results• Discussion
Outline
• Background• Aim• Subjects and methods• Results• Discussion

Background
• Fatty liver (FL), the most common liver disease worldwide, is usually classified into non-alcoholic fatty liver disease (NAFLD) and alcoholic fatty liver disease (AFLD) (1, 2).
Background
• Fatty liver (FL), the most common liver diseaseworldwide, is usually classified into non-alcoholicfatty liver disease (NAFLD) and alcoholic fatty liverdisease (AFLD) (1, 2).

Background
EASL-EASD-EASO J Hepatol 2016;64:1388
Background
Fatty liver(liver fat > 5%)
i
(1HBV-HCV-
Steatogenic drugs-
rEthanol 530 g/day
+2
NAFLD
TEthanol 520 g/day
EASL-EASD-EASO J Hepatol 2016;64:1388

Background
EASL-EASD-EASO J Hepatol 2016;64:1388
Background
NALFD
OP'
NAFL
NASH
:Pure steatosis
Steatosis &mild lobular
inflammation
Early (FO-F1fibrosis)
Fibrotic (F2-F3 fibrosis)
Cirrhosis (F4fibrosis)
EASL-EASD-EASO J Hepatol 2016;64:1388

Background
Singh S Clin Gastroenterol Hepatol 2015;13:643 (systematic review & metanalysis)
Background
N Studies Fibrosis progression(years to progress 1 stage,mean [95%CI])
NAFLD 366 11 7.7 [5.5 to 14.8]NAFL 133 6 14.3[9.1 to 50.0]NASH 116 7 7.1 [4.8 to 14.3]
Singh S Clin Gastroenterol Hepatol 2015;13:643(systematic review & metanalysis)

Background
• The NAFLD vs. AFLD dichotomization is useful in clinical practice because ethanol is unlikely to be toxic at quantities ≤ 30 g/day but hides the important fact that ethanol and obesity do interact to determine the burden of liver disease in the general population (2–4).
Background
• The NAFLD vs. AFLD dichotomization is useful inclinical practice because ethanol is unlikely to betoxic at quantities 3 0 g/day but hides theimportant fact that ethanol and obesity do interactto determine the burden of liver disease in thegeneral population (2-4).
Background
• In the early 2000s, the Dionysos Study reported the first data on the prevalence and incidence of FL in the general population (5, 6).
Background
• In the early 2000s, the Dionysos Study reported thefirst data on the prevalence and incidence of FL inthe general population (5, 6).
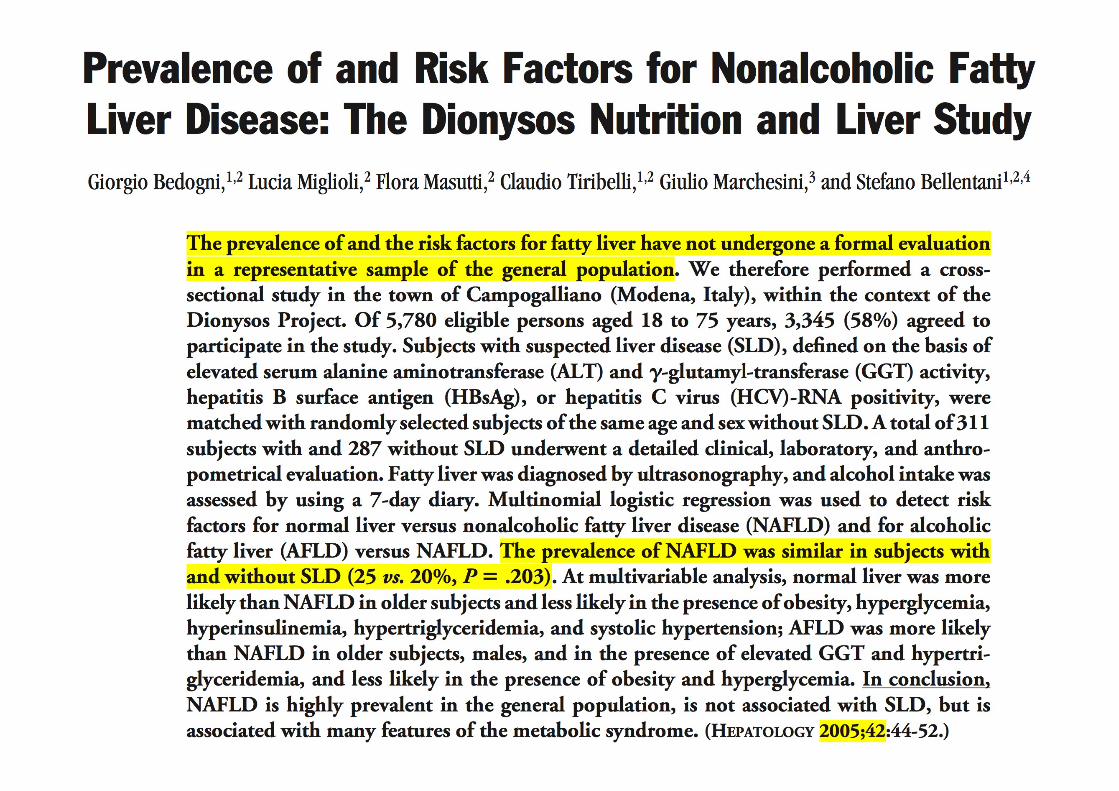
Prevalence of and Risk Factors for Nonalcoholic FattyLiver Disease: The Dionysos Nutrition and Liver StudyGiorgio Bedogni,1'2 Lucia Miglioli,2 Flora Masutti,2 Claudio Tiribelli,1,2 Giulio Marchesini,3 and Stefano Bellentani1,2,4
The prevalence of and the risk factors for fatty liver have not undergone a formal evaluationin a representative sample of the general population. We therefore performed a cross-sectional study in the town of Campogalliano (Modena, Italy), within the context of theDionysos Project. Of 5,780 eligible persons aged 18 to 75 years, 3,345 (58%) agreed toparticipate in the study. Subjects with suspected liver disease (SLD), defined on the basis ofelevated serum alanine aminotransferase (ALT) and y-glutamyl-transferase (GGT) activity,hepatitis B surface antigen (HBsAg), or hepatitis C virus (HCV)-RNA positivity, werematched with randomly selected subjects of the same age and sex without SLD. A total of 311subjects with and 287 without SLD underwent a detailed clinical, laboratory, and anthro-pometrical evaluation. Fatty liver was diagnosed by ultrasonography, and alcohol intake wasassessed by using a 7-day diary. Multinomial logistic regression was used to detect riskfactors for normal liver versus nonalcoholic fatty liver disease (NAFLD) and for alcoholicfatty liver (AFLD) versus NAFLD. The prevalence of NAFLD was similar in subjects withand without SLD (25 vs. 20%, P = .203). At multivariable analysis, normal liver was morelikely than NAFLD in older subjects and less likely in the presence of obesity, hyperglycemia,hyperinsulinemia, hypertriglyceridemia, and systolic hypertension; AFLD was more likelythan NAFLD in older subjects, males, and in the presence of elevated GGT and hypertri-glyceridemia, and less likely in the presence of obesity and hyperglycemia. In conclusion,NAFLD is highly prevalent in the general population, is not associated with SLD, but isassociated with many features of the metabolic syndrome. (HEPATOLOGY 2005;42:44-52.)

Background
• Many epidemiological studies on FL have been published since the Dionysos Study findings were made available (7).
Background
• Many epidemiological studies on FL have beenpublished since the Dionysos Study findings weremade available (7).

Background
• The worldwide prevalence of NAFLD was estimated
to be 25% (95%CI 22 to 28%) by a recent meta-
analysis of 45 studies (7).
Background
• The worldwide prevalence of NAFLD was estimatedto be 25% (95%Cl 22 to 28%) by a recent meta-analysis of 45 studies (7).

Background
• 11 of these 45 studies were performed in Europe and
yielded an estimate of 24% (95%CI 16 to 33%) for the
prevalence of NAFLD.
• 5 of these 11 studies used imaging techniques to
diagnose FL and were performed in the general
population (3, 5, 8–10), one being a nested case-
control study (3).
Background
• 11 of these 45 studies were performed in Europe andyielded an estimate of 24% (95%CI 16 to 33%) for theprevalence of NAFLD.
• 5 of these 11 studies used imaging techniques todiagnose FL and were performed in the generalpopulation (3, 5, 8-10), one being a nested case-control study (3).

Background
• The so-called “ecology of medical care” model provides a strong rationale to expect that the estimates of illness made in the general population will differ from those obtained in other contexts and this has indeed been repeatedly shown in practice (11, 12).
Background
• The so-called "ecology of medical care" modelprovides a strong rationale to expect that theestimates of illness made in the general populationwill differ from those obtained in other contexts andthis has indeed been repeatedly shown in practice(11, 12).

Background
Goldberg W et al. N Engl J Med. 2001;345:1211
Background
Figure 2. Results of a Reanalysis of the Monthly PrevalenceHealth Care.Each box represents a subgroup of the largest box, which comprises 1000 persons. Data are for persons of all ages.
1000 persons
800 report symptoms
327 consider seeking medical care
217 visit a physician's officej ( 1 1 3 visit a primary care
physician's office)65 visit a complementary or
alternative medical care provider
21 visit a hospital outpatient clinic14 receive home health care
___-- 13 visit an emergency department_ - - - 8 are hospitalized
— <1 is hospitalized in an academicmedical center
of Illness in the Community and the Roles of Various Sources of
Goldberg Wet al. N Engl J Med. 2001;345:1211

Background
• The inescapable conclusion is that the real burden attributable to a given disease cannot be estimated without epidemiological data obtained from the general population (11).
Background
• The inescapable conclusion is that the real burdenattributable to a given disease cannot be estimatedwithout epidemiological data obtained from thegeneral population (11).

Background
• There is also mounting evidence that within a given level of the ecology of medical care model (12), the individuals actually studied are often notrepresentative of the persons making up that level.
• For instance, the patients enrolled in trials of NAFLD drugs are not representative of those treated in everyday practice (13).
Background
• There is also mounting evidence that within a givenlevel of the ecology of medical care model (12), theindividuals actually studied are often notrepresentative of the persons making up that level.
• For instance, the patients enrolled in trials of NAFLDdrugs are not representative of those treated ineveryday practice (13).

Outline
• Background• Aim• Subjects and methods• Results• Discussion
Outline
• Background• Aim• Subjects and methods• Results• Discussion

Aim
• It was with the aim of providing data on the epidemiology of FL in the general population that we performed the Bagnacavallo Study of liver disease (BCV Study).
Aim
• I t was with the aim of providing data on theepidemiology of FL in the general population that weperformed the Bagnacavallo Study of liver disease(BCV Study).

Aim #1
• 1) to evaluate the prevalence of and the risk factors for FL in a cross-section of the general population of a Northern Italy town;
Aim #1
• 1) to evaluate the prevalence of and the risk factors forFL in a cross-section of the general population of aNorthern Italy town;

Aim #2
• 2) to develop a cohort of subjects from the general population where the association between FL and incident health outcomes could be studied;
Aim #2
• 2 ) to develop a cohort of subjects from the generalpopulation where the association between FL andincident health outcomes could be studied;

Aim #3
• 3) to develop a cohort of subjects from the general population where nested case-control studies of potential risk factors for FL could be performed (taking the advantage of a purposely built serum bank)
Aim #3
• 3) to develop a cohort of subjects from the generalpopulation where nested case-control studies ofpotential risk factors for FL could be performed(taking the advantage of a purposely built serumbank)

Aim
• The present talk deals with the first aim, that is the estimation of the prevalence of and the risk factors for FL in a general population.
Aim
• The present talk deals with the first aim, that is theestimation of the prevalence of and the risk factorsfor FL in a general population.

AimAim
PREVALENCE OF AND RISK FACTORS FOR FATTY LIVER IN THEGENERAL POPULATION OF NORTHERN ITALY: THE BAGNACAVALLOSTUDY
Francesco Giuseppe FOSCHI 1 *, Giorgio BEDOGNI 2*, Marco DOMENICALI 3,Pierluigi GIACOMONI 4, Anna Chiara DALL'AGLIO, Francesca DAZZANI,Arianna LANZI, Fabio CONTI, Sara SAVINI, Gaia SAINI, Mauro BERNARDI,Pietro ANDREONE, Amalia GASTALDELLI, Andrea CASADEI GARDINI,Claudio TIRIBELLI 2 *, Stefano BELLENTANI, Giuseppe Francesco STEFANINI
* These Authors contributed equally to the present work.

Outline
• Background• Aim• Subjects and methods• Results• Discussion
Outline
• Background• Aim• Subjects and methods• Results• Discussion

Study design
• Cross-sectional study performed between October 2005 and March 2009.
• All the citizens of Bagnacavallo (Ravenna, Emilia-Romagna, Italy) aged 30 to 60 years as of January 2005 were eligible and were invited by written letter to participate to the study.
• Public encounters were also held in order to promote participation into the study.
Study design
• Cross-sectional study performed between October2005 and March 2009.
• Al l the citizens of Bagnacavallo (Ravenna, Emilia-Romagna, Italy) aged 30 to 60 years as of January2005 were eligible and were invited by written letterto participate to the study.
• Public encounters were also held in order to promoteparticipation into the study.

Study design
• Altered liver enzymes (ALE) were defined as alanine transaminase (ALT) > 40 U/l and/or AST > 37 U/l.
• The study protocol specified that all ALE+ and at least 50% of ALE- citizens had to undergo liver ultrasonography (LUS).
• The study was approved by the Local Ethical Committee and all citizens gave written informed consent.
Study design
• Altered liver enzymes (ALE) were defined as alaninetransaminase (ALT) > 40 U/I and/or AST > 37 U/I.
• The study protocol specified that all ALE+ and at least50% of ALE- citizens had to undergo liverultrasonography (LUS).
• The study was approved by the Local EthicalCommittee and all citizens gave written informedconsent.

Clinical assessment
• All the citizens underwent a detailed clinical history and physical examination following the model of the Dionysos Study (5, 15).
Clinical assessment
• Al l the citizens underwent a detailed clinical historyand physical examination following the model of theDionysos Study (5, 15).
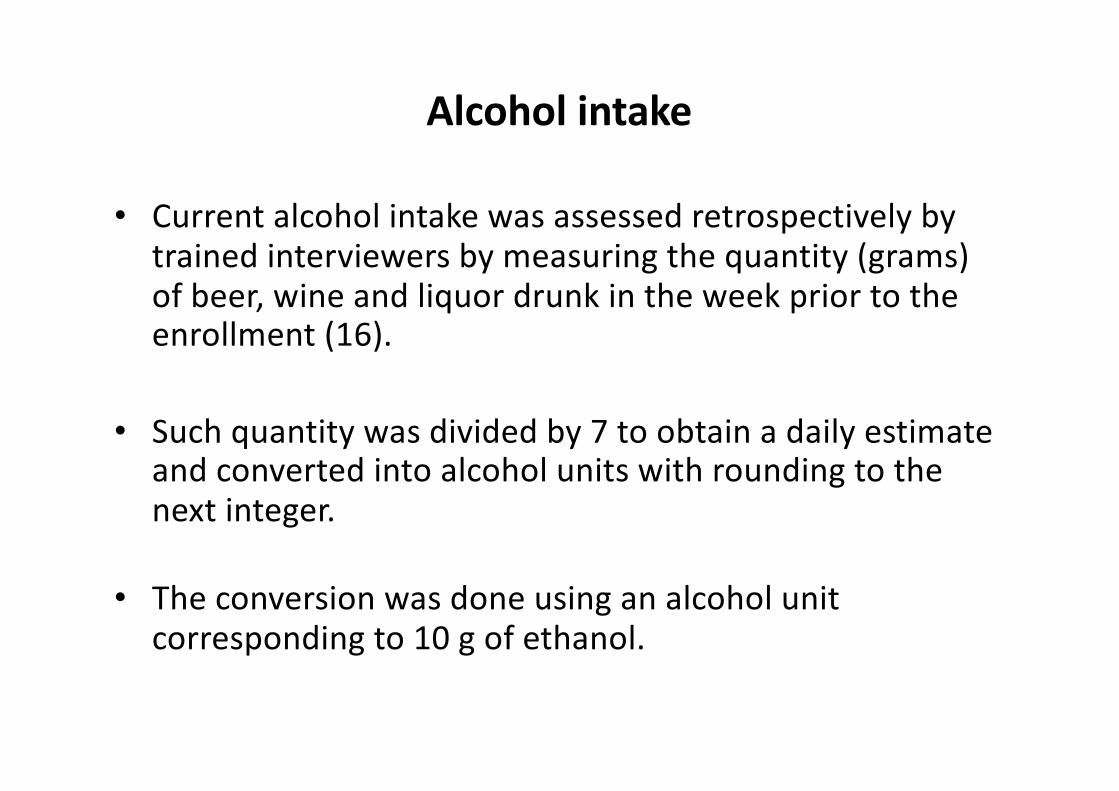
Alcohol intake
• Current alcohol intake was assessed retrospectively by trained interviewers by measuring the quantity (grams) of beer, wine and liquor drunk in the week prior to the enrollment (16).
• Such quantity was divided by 7 to obtain a daily estimate and converted into alcohol units with rounding to the next integer.
• The conversion was done using an alcohol unit corresponding to 10 g of ethanol.
Alcohol intake
• Current alcohol intake was assessed retrospectively bytrained interviewers by measuring the quantity (grams)of beer, wine and liquor drunk in the week prior to theenrollment (16).
• Such quantity was divided by 7 to obtain a daily estimateand converted into alcohol units with rounding to thenext integer.
• The conversion was done using an alcohol unitcorresponding to 10 g of ethanol.
Anthropometry
• Weight and height were measured following international guidelines (17).
• Body mass index (BMI) was calculated and classified following the NIH guidelines (18).
• Waist circumference (WC) was measured at the midpoint between the last rib and the iliac crest (19).
Anthropometry
• Weight and height were measured followinginternational guidelines (17).
• Body mass index (BMI) was calculated and classifiedfollowing the NIH guidelines (18).
• Waist circumference (WC) was measured at themidpoint between the last rib and the iliac crest (19).

Laboratory assessment
1) glucose; 2) triglycerides; 3) total cholesterol; 4) high-density lipoprotein (HDL) cholesterol; 5) low-density lipoprotein (LDL) cholesterol; 6) ALT; 7) AST; 8) gamma-glutamyl-transferase (GGT); 9) bilirubin; 10) hepatitis B surface antigen (HBsAg); 11) antibodies against hepatitis C virus.
Laboratory assessment
1) glucose;2) triglycerides;3) total cholesterol;4) high-density lipoprotein (HDL) cholesterol;5) low-density lipoprotein (LDL) cholesterol;6) ALT;7) AST;8) gamma-glutamyl-transferase (GGT);9) bilirubin;10) hepatitis B surface antigen (HBsAg);11) antibodies against hepatitis C virus.

Metabolic syndrome
• The metabolic syndrome (MS) was diagnosed using the harmonized international definition (20).
Metabolic syndrome
• The metabolic syndrome (MS) was diagnosed usingthe harmonized international definition (20).

Metabolic syndrome
• ≥ 3 of the following (20)– Large WC : WC ≥ 102 cm in men or ≥ 88 cm in women; – High triglycerides: triglycerides ≥ 150 mg/dl or use of
triglyceride-lowering drugs; – Low HDL: HDL < 40 mg/dl in men or < 50 mg/dl in women
or use of HDL-increasing drugs; – High blood pressure: systolic blood pressure ≥ 130 mm Hg
or diastolic blood pressure ≥ 85 mm Hg or use or blood pressure-lowering drugs;
– High glucose: glucose ≥ 100 mg/dl or use of glucose lowering drugs.
Metabolic syndrome
• > 3 of the following (20)— Large WC : WC 1 0 2 cm in men or 8 8 cm in women;— High triglycerides: triglycerides 1 5 0 mg/dl or use of
triglyceride-lowering drugs;— Low HDL: HDL < 40 mg/dl in men or < 50 mg/dl in women
or use of HDL-increasing drugs;— High blood pressure: systolic blood pressure 1 3 0 mm Hg
or diastolic blood pressure 8 5 mm Hg or use or bloodpressure-lowering drugs;
— High glucose: glucose 1 0 0 mg/dl or use of glucoselowering drugs.

Liver ultrasongraphy
• LUS was performed by five experienced physicians following international guidelines and using the same methodology of the Dionysos Nutrition and Liver Study (DNL) (21, 22).
• Normal liver / light FL / moderate FL / severe FL
Liver ultrasongraphy
• LUS was performed by five experienced physiciansfollowing international guidelines and using the samemethodology of the Dionysos Nutrition and LiverStudy (DNL) (21, 22).
• Normal liver / light FL / moderate FL / severe FL

Diagnosis of NAFLD
EASL-EASD-EASO J Hepatol 2016;64:1388
Diagnosis of NAFLD
Fatty liver(liver fat > 5%)
i
(1HBV-HCV-
Steatogenic drugs-
rEthanol 530 g/day
+2
NAFLD
TEthanol 520 g/day
EASL-EASD-EASO J Hepatol 2016;64:1388

Statistical analysis
• I will describe it succinctly while discussing the Results
Statistical analysis
• I will describe it succinctly while discussing theResults

Outline
• Background• Aim• Subjects and methods• Results• Discussion
Outline
• Background• Aim• Subjects and methods• Results• Discussion

n = 6920invited
n = 4033accepted
n = 3933 withcomplete data
n = 393 ALE+ n = 3540 ALE-
n = 16 HBV+or HCV+
n = 377 HBV-and HCV-
n = 38 HBV+or HCV+
n = 3502 HBV-and HCV-
n = 28 LUSNA
n = 349 LUSAV
n = 1692 LUSNA
n = 1810 LUSAV
n = 90 FL- n = 259 FL+ n = 1173 FL- n = 637 FL+
n = 6920
n = 28 LUS n= 349 LUS n = 1692 LUS n = 1810 LUSNA AV NA AV
invited
an = 4033
4n = 3933 withcomplete data
n = 393 ALE+
n = 16 HBV+or HCV+
n = 377 HBV-and HCV-
n = 3540 ALE-
n = 38 HBV+or HCV+
n = 3502 HBV-and HCV-
t *
*n = 90 FL-
*n= 259 FL+
*n = 1173 FL-
tn = 637 FL+

n = 6920invited
n = 4033accepted
n = 3933 withcomplete data
n = 393 ALE+ n = 3540 ALE-
n = 16 HBV+or HCV+
n = 377 HBV-and HCV-
n = 38 HBV+or HCV+
n = 3502 HBV-and HCV-
n = 28 LUSNA
n = 349 LUSAV
n = 1692 LUSNA
n = 1810 LUSAV
n = 90 FL- n = 259 FL+ n = 1173 FL- n = 637 FL+
n = 6920
n = 28 LUS n= 349 LUS n = 1692 LUS n = 1810 LUSNA AV NA AV
invited
an = 4033
4n = 3933 withcomplete data
n = 393 ALE+
n = 16 HBV+or HCV+
n = 377 HBV-and HCV-
* t
n = 3540 ALE-
n = 38 HBV+or HCV+
n = 3502 HBV-and HCV-
i
*n = 90 FL-
*n= 259 FL+
*n = 1173 FL-
tn = 637 FL+

Values are given as median (interquartile range) for continuous variables and as number(proportion) for discrete variables.
ALE+LUS available
n = 349
ALE+LUS not available
n = 28p-value*
Male sexAge (years)Weight (kg)Height (m)BM I (kg/m2)
267 (76.5%)47 (40-55)
84.0 (74.0-95.0)1.73 (1.67-1.79)27.9 (25.4-30.9)
25 (89.3%)45 (40-52)
83.0 (75.5-95.0)1.73 (1.70-1.78)27.4 (24.2-29.6)
0.120.411.001.000.79
Waist circumference (cm) 105.0 (100.0-113.0) 104.0 (97.5-111.5) 0.63Glucose (mg/dl) 93 (87-102) 93 (89-99) 1.00Triglycerides (mg/dl) 138 (98-206) 103 (77-166) 0.03Total cholesterol (mg/dl) 215 (192-240) 216 (182-228) 1.00HDL cholesterol (mg/dl) 50 (44-61) 53 (46-60) 0.21LDL cholesterol (mg/dl) 138 (117-159) 125 (106-152) 0.41Systolic blood pressure (mm Hg) 130 (120-140) 130 (122-140) 1.00Diastolic blood pressure (mm Hg) 85 (80-90) 82 (80-90) 1.00ALT (U/I) 50 (44-63) 44 (41-58) 0.04AST (U/I) 33 (29-41) 32 (27-38) 0.66GGT (U/I) 42 (27-69) 57 (30-74) 0.02Total bilirubin (mg/dl) 0.62 (0.49-0.90) 0.60 (0.46-0.79) 0.72Alcohol intake (units/day) 3 (1-5) 4 (2-5) 1.00
Median regression for continuous variables and Pearson's Chi-square test for discretevariables.
Supplementary Table 1
Comparison of the subjects with and without liver ultrasonography among the citizens withaltered liver enzymes.
Abbreviations: ALE = altered liver enzymes; LUS = liver ultrasonography; BMI = bodymass index; HDL = high-density lipoprotein; LDL = low-density lipoprotein; ALT = alaninetransaminase; AST = aspartate transaminase; GGT = gamma-glutamyl transferase.

n = 6920invited
n = 4033accepted
n = 3933 withcomplete data
n = 393 ALE+ n = 3540 ALE-
n = 16 HBV+or HCV+
n = 377 HBV-and HCV-
n = 38 HBV+or HCV+
n = 3502 HBV-and HCV-
n = 28 LUSNA
n = 349 LUSAV
n = 1692 LUSNA
n = 1810 LUSAV
n = 90 FL- n = 259 FL+ n = 1173 FL- n = 637 FL+
n = 6920
n = 28 LUS n= 349 LUS n = 1692 LUS n = 1810 LUSNA AV NA AV
invited
an = 4033
4n = 3933 withcomplete data
n = 393 ALE+
n = 16 HBV+or HCV+
n = 377 HBV-and HCV-
n = 3540 ALE-
n = 38 HBV+or HCV+
n = 3502 HBV-and HCV-
* $
*n = 90 FL-
*n= 259 FL+
*n = 1173 FL-
tn = 637 FL+

Values are given as median (interquartile range) for continuous variables and as number(proportion) for discrete variables.
ALE-LUS available
n = 1810
ALE-LUS not available
n= 1692p-value*
Male sexAge (years)Weight (kg)Height (m)BMI (kg/m2)
812 (44.9%)49 (41-56)
72.0 (61.0-82.0)1.68 (1.60-1.74)25.1 (22.6-28.1)
701 (41.4%)47 (40-55)
69.0 (60.0-79.0)1.68 (1.60-1.74)24.4 (22.1-27.0)
0.04<0.001<0.001
1.00<0.001
Waist circumference (cm) 100.0 (93.0-107.0) 99.0 (92.0-104.0) 0.005Glucose (mg/dl) 89 (83-96) 87 (82-94) <0.001Triglycerides (mg/dl) 97 (68-139) 89 (65-129) <0.001Total cholesterol (mg/dl) 207 (184-234) 203 (179-226) <0.001HDL cholesterol (mg/dl) 61 (51-73) 62 (52-74) 0.15LDL cholesterol (mg/dl) 126 (104-150) 122 (101-144) 0.002Systolic blood pressure (mm Hg) 125 (120-140) 120 (120-130) <0.001Diastolic blood pressure (mm Hg) 80 (80-90) 80 (80-90) 1.00ALT (U/I) 20 (15-26) 19 (15-24) 0.004AST (U/I) 20 (18-24) 20 (17-23) 1.000GGT (U/I) 17 (12-26) 15 (11-22) <0.001Total bilirubin (mg/dl) 0.60 (0.40-0.81) 0.54 (0.40-0.70) <0.001Alcohol intake (units/day) 2 (0-4) 2 (0-4) 1.000
*Median regression for continuous variables and Pearson's Chi-square test for discretevariables.
Supplementary Table 2
Comparison of the subjects with and without liver ultrasonography among the citizens withnormal liver enzymes.
Abbreviations: ALE = altered liver enzymes; LUS = liver ultrasonography; BMI = bodymass index; HDL = high-density lipoprotein; LDL = low-density lipoprotein; ALT = alaninetransaminase; AST = aspartate transaminase; GGT = gamma-glutamyl transferase.

n = 6920invited
n = 4033accepted
n = 3933 withcomplete data
n = 393 ALE+ n = 3540 ALE-
n = 16 HBV+or HCV+
n = 377 HBV-and HCV-
n = 38 HBV+or HCV+
n = 3502 HBV-and HCV-
n = 28 LUSNA
n = 349 LUSAV
n = 1692 LUSNA
n = 1810 LUSAV
n = 90 FL- n = 259 FL+ n = 1173 FL- n = 637 FL+
n = 6920
n = 16 HBV+ n = 377 HBV- n = 38 HBV+ n = 3502 HBV-or HCV+ and HCV- or HCV+ and HCV-
n = 28 LUS n= 349 LUS n = 1692 LUS n = 1810 LUSNA AV NA AV
invited
an = 4033
4n = 3933 withcomplete data
*n = 393 ALE+ n = 3540 ALE-
* t
* $
*n = 90 FL-
*n= 259 FL+
*n = 1173 FL-
tn = 637 FL+

ALE- ALE+ p-value* n = 1810 n = 349 Age (years) 49 (41-56) 47 (40-55) 0.03 Male sex 812 (44.9%) 267 (76.5%) <0.001 Weight (kg) 72.0 (61.0-82.0) 84.0 (74.0-95.0) <0.001 Height (m) 1.68 (1.60-1.74) 1.73 (1.67-1.79) <0.001 BMI (kg/m2) 25.1 (22.6-28.1) 27.9 (25.4-30.9) <0.001 BMI class (NIH) <0.001 Underweight 19 (1.0%) 0 (0.0%) Normal 871 (48.1%) 66 (18.9%) Overweight 607 (33.5%) 170 (48.7%) Obesity class 1 230 (12.7%) 81 (23.2%) Obesity class 2 65 (3.6%) 28 (8.0%) Obesity class 3 18 (1.0%) 4 (1.1%) Fatty liver 637 (35.2%) 259 (74.2%) <0.001 Fatty liver degree <0.001 Light 428 (67.2%) 107 (41.3%) Moderate 151 (23.7%) 102 (39.4%) Severe 58 (9.1%) 50 (19.3%) Waist circumference (cm) 100.0 (93.0-107.0) 105.0 (100.0-113.0) <0.001 Large waist circumference 1236 (68.3%) 259 (74.2%) 0.028 Glucose (mg/dl) 89 (83-96) 93 (87-102) <0.001 High fasting glucose 307 (17.0%) 109 (31.2%) <0.001 Triglycerides (mg/dl) 97 (68-139) 138 (98-206) <0.001 High triglycerides 405 (22.4%) 159 (45.6%) <0.001 Total cholesterol (mg/dl) 207 (184-234) 215 (192-240) 0.005 HDL cholesterol (mg/dl) 61 (51-73) 50 (44-61) <0.001 Low HDL 219 (12.1%) 64 (18.3%) 0.002 LDL cholesterol (mg/dl) 126 (104-150) 138 (117-159) <0.001 Systolic blood pressure (mm Hg) 125 (120-140) 130 (120-140) <0.001 Diastolic blood pressure (mm Hg) 80 (80-90) 85 (80-90) <0.001 High blood pressure 1053 (58.2%) 270 (77.4%) <0.001 Metabolic syndrome 444 (24.5%) 171 (49.0%) <0.001 Metabolic syndrome score <0.001 0 216 (11.9%) 19 (5.4%) 1 595 (32.9%) 59 (16.9%) 2 555 (30.7%) 100 (28.7%) 3 294 (16.2%) 97 (27.8%) 4 117 (6.5%) 59 (16.9%) 5 33 (1.8%) 15 (4.3%) ALT (U/l) 20 (15-26) 50 (44-63) <0.001 AST (U/l) 20 (18-24) 33 (29-41) <0.001 GGT (U/l) 17 (12-26) 42 (27-69) <0.001 Total bilirubin (mg/dl) 0.60 (0.40-0.81) 0.62 (0.49-0.90) 0.003
Values are given as median (interquartile range) for continuous variables and number (proportion) for dichotomous variables; *Median regression for continuous variables and Pearson’s Chi-square test for binary categorical variables Table 1 - Comparison of citizens with and without altered liver enzymes Abbreviations: ALE = altered liver enzymes; BMI = body mass index; NAFLD = non-alcoholic fatty liver disease; AFLD = alcoholic fatty liver disease; NIH = National Institutes of Health; HDL = high-density lipoprotein; LDL = low-density lipoprotein; ALT = alanine transaminase; AST = aspartate transaminase; GGT = gamma-glutamyl transferase.
Values are given as median (interquartile range) for continuous variables and number(proportion) for dichotomous variables; *Median regression for continuous variables andPearson's Chi-square test for binary categorical variables
ALE-n = 1810
ALE+n=349
p-value*
Age (years) 49 (41-56) 47 (40-55) 0.03Male sex 812 (44.9%) 267 (76.5%) <0.001Weight (kg) 72.0 (61.0-82.0) 84.0 (74.0-95.0) <0.001Height (m) 1.68 (1.60-1.74) 1.73 (1.67-1.79) <0.001BMI (kg/m2) 25.1 (22.6-28.1) 27.9 (25.4-30.9) <0.001BMI class (NIH) <0.001
Underweight 19 (1.0%) 0 (0.0%)Normal 871 (48.1%) 66 (18.9%)Overweight 607 (33.5%) 170 (48.7%)Obesity class 1 230 (12.7%) 81 (23.2%)Obesity class 2 65 (3.6%) 28 (8.0%)Obesity class 3 18 (1.0%) 4 (1.1%)
Fatty liver 637 (35.2%) 259 (74.2%) <0.001Fatty liver degree <0.001
Light 428 (67.2%) 107 (41.3%)Moderate 151 (23.7%) 102 (39.4%)Severe 58 (9.1%) 50 (19.3%)
Waist circumference (cm) 100.0 (93.0-107.0) 105.0 (100.0-113.0) <0.001Large waist circumference 1236 (68.3%) 259 (74.2%) 0.028Glucose (mg/dl) 89 (83-96) 93 (87-102) <0.001High fasting glucose 307 (17.0%) 109 (31.2%) <0.001Triglycerides (mg/dl) 97 (68-139) 138 (98-206) <0.001High triglycerides 405 (22.4%) 159 (45.6%) <0.001Total cholesterol (mg/dl) 207 (184-234) 215 (192-240) 0.005HDL cholesterol (mg/dl) 61 (51-73) 50 (44-61) <0.001Low HDL 219 (12.1%) 64 (18.3%) 0.002LDL cholesterol (mg/di) 126 (104-150) 138 (117-159) <0.001Systolic blood pressure (mm Hg) 125 (120-140) 130 (120-140) <0.001Diastolic blood pressure (mm Hg) 80 (80-90) 85 (80-90) <0.001High blood pressure 1053 (58.2%) 270 (77.4%) <0.001Metabolic syndrome 444 (24.5%) 171 (49.0%) <0.001Metabolic syndrome score <0.001
0 216 (11.9%) 19 (5.4%)1 595 (32.9%) 59 (16.9%)2 555 (30.7%) 100 (28.7%)3 294 (16.2%) 97 (27.8%)4 117 (6.5%) 59 (16.9%)5 33 (1.8%) 15 (4.3%)
ALT (U/I) 20 (15-26) 50 (44-63) <0.001AST (U/I) 20 (18-24) 33 (29-41) <0.001GGT (U/I) 17 (12-26) 42 (27-69) <0.001Total bilirubin (mg/dl) 0.60 (0.40-0.81) 0.62 (0.49-0.90) 0.003
Table 1 - Comparison of citizens with and without altered liver enzymesAbbreviations: ALE = altered liver enzymes; BMI = body mass index; NAFLD = non-alcoholic fatty liver disease; AFLD = alcoholic fatty liver disease; NIH = National Institutesof Health; HDL = high-density lipoprotein; LDL = low-density lipoprotein; ALT = alaninetransaminase; AST = aspartate transaminase; GGT = gamma-glutamyl transferase.

Logistic regression models used to investigate the association between fatty liver and potential risk factors. Values are odds ratios and95% confidence intervals.
M1 M2 M3 M4 M5 M6ALE 5.3** [4.1 to 6.9] 5.1** [3.9 to 6.7] 3.9** [2.9 to 5.2] 4.0** [3.0 to 5.4] 4.2** [3.2 to 5.6] 3.7** [2.8 to 5.0]Male 2.1** [1.7 to 2.5] 2.0** [1.6 to 2.5] 2.1** [1.7 to 2.6] 2.0** [1.6 to 2.5] 2.4** [1.9 to 3.1]Age (years) / 10 1.8** [1.6 to 2.0] 1.6** [1.4 to 1.8] 1.5** [1.4 to 1.7] 1.5** [1.4 to 1.7] 1.4** [1.3 to 1.6]BMI (kg/m2) / 5 3.9** [3.3 to 4.5]Alcohol intake (units) 1.0 [0.9 to 1.0] 1.0 [1.0 to 1.1] 1.0 [0.9 to 1.0] 1.0 [0.9 to 1.0]Waist circumference (cm) / 10 2.5** [2.3 to 2.8]Metabolic syndrome 5.1** [4.1 to 6.3]Large waist circumference 2.9** [2.3 to 3.8]High triglycerides 3.1** [2.4 to 3.9]Low HDL 1.6* [1.2 to 2.2]High blood pressure 1.9** [1.5 to 2.3]High glucose 2.0** [1.5 to 2.6]n 2159 2159 2159 2159 2159 2159AIC 2750 2595 2131 2244 2376 2266BIC 2762 2618 2165 2278 2405 2317ROC-AUC 0.61 0.72 0.83 0.81 0.79 0.81Pseudo-R2 (Nagelkerke) 0.11 0.20 0.42 0.37 0.31 0.36*p< 0.01; ** p < 0.001
Table 2
Abbreviations: M# = model number; ALE = altered liver enzymes; BMI = body mass index; HDL = high-density lipoprotein; LDL = low-density lipoprotein; AIC = Akaike information criterion; BIC = Bayesian information criterion; ROC-AUC = area under the ROC curve;R2 = squared R for logistic regression.

0
.1
.2
.3
.4
.5
.6
.7
.8
.9
1
19.7 23 25.5 28.9 35.1 19.7 23 25.5 28.9 35.1
ALE- ALE+
34 yr 41 yr 49 yr 56 yr 61 yr
Prev
alen
ce o
f FL
BMI (kg/m2)
MenMenPrevalence of FL
1
.9 -
.8 -
.7
.6
.5
.4
.3 -
.2
0
ALE-
19.7 2 3 2 5 . 5 2 8 . 9
ALE+
•
I I35.1 19 .7 2 3 2 5 . 5 2 8 . 9
BMI (kg/m2)
0 3 4 yr - 0 - 41 yr - -0- • 4 9 yr - - A - 5 6 yr 6 1 yr
35.1

0
.1
.2
.3
.4
.5
.6
.7
.8
.9
1
19.7 23 25.5 28.9 35.1 19.7 23 25.5 28.9 35.1
ALE- ALE+
34 yr 41 yr 49 yr 56 yr 61 yr
Prev
alen
ce o
f FL
BMI (kg/m2)
WomenWomenPrevalence of FL ALE-
1
.9
.8
.7
.6
.5
.4
.3
.2 -
19.7 23 25.5
34 yr
28.9
41 y r
35.1 19 .7
BMI (kg/m2)
49 yr - A -
23
56 yr
25.5 28.9
61 yr
35.1

Prevalence of normal liver, NAFLD and AFLD. Values are proportionsand 95% confidence intervals.
ALE+ ALE-Normal liver 0.26 (0.21 to 0.31) 0.65 (0.63 to 0.67)NAFLD 0.46 (0.41 to 0.51) 0.22 (0.21 to 0.24)ALFD 0.28 (0.24 to 0.33) 0.13 (0.11 to 0.14)

Outline
• Background• Aim• Subjects and methods• Results• Discussion
Outline
• Background• Aim• Subjects and methods• Results• Discussion
Discussion
• 74% of ALE+ citizens had FL compared to 35% of ALE-citizens.
Discussion
• 74% of ALE+ citizens had FL compared to 35% of ALE-citizens.
DiscussionDiscussion
Reggio Emil ia Campogal l ianot i t r z i
Rubiera M o d e ,
606.. , N o n a a
San PietroIn Casale
Argelato
I Ea 1 h 31 min118 km
Albinea
Scandiano 5 5 7 2 4 CastelfrancoEmilia Funo
Formigine I a I
AnzolaViano Sassuolo deli Emilia
SolieraBomporto
CrevalcoreCento
Pieve di Cento
Baiso
Montefiorino
ssinoro
Maranello
MO
Serramazzoni
Polinago
LamaMocogno
Pavullo NelFrignano
l a 1 h 7 min110 km
MaranoSul Panaro
E35a ) Bologna
San kazzardi Savena
Sasso Marconi PianoroEZO
123Zocca M a r z a b o t t o
Tole M o n t e r e n z i o
EZZIVergato ?Ann, inn
•
Santa MariaCodifiume
Bancella
Molinella
Budrio
Medicina
E35
559Cas'-
Pietro Te
MO
Castel Guelfodi Bologna
SS9Dozza I m o l a
Portomaggiore •
- "'Argenta
Unigra
Conselice
MassaLombarda
E35
CastelBolognese
Ostellato
Longastrino
Fusignano
E1133Alfonsine
ECM
Lugo Q B a g n a c a v a l l o
Faenza
Russi

Discussion
• In the Dionysos Nutrition & Liver (DNL) Study,
performed in the same region of Northern Italy
during 2002/3, 44% of SLD+ citizens had FL
compared to 35% of SLD- citizens (5).
Discussion
• In the Dionysos Nutrition & Liver (DNL) Study,performed in the same region of Northern Italyduring 2002/3, 44% of SLD+ citizens had FLcompared to 35% of SLD- citizens (5).

Discussion
• The BCV study and DNL estimates are unfortunately notcomparable because of the different operational definitions of ALE and SLD.
• The SLD criteria did in fact include an altered GGT (> 35 U/l), did not consider AST, and did consider “altered” an ALT > 30 U/l (5).
• The BCV Study confirms nonetheless the DNL finding that FL is quite common (35%) among adults citizens with normal liver enzymes.
Discussion
• The BCV study and DNL estimates are unfortunately notcomparable because of the different operationaldefinitions of ALE and SLD.
• The SLD criteria did in fact include an altered GGT (> 35U/I), did not consider AST, and did consider "altered" anALT > 30 U/I (5).
• The BCV Study confirms nonetheless the DNL finding thatFL is quite common (35%) among adults citizens withnormal liver enzymes.

Discussion
• The prevalence of NAFLD was 46% among ALE+ and 22% among ALE- citizens.
• The corresponding figures for SLD+ and SLD- citizens in the DNL Study were 25% and 20% (5).
• The BCV and DNL estimates are unfortunately notcomparable not only because of the different operational definitions of ALE and SLD but also because the DNL study employed a different cut-point of alcohol intake to diagnose NAFLD in men (≤ 20 g/day) and used a 7-day prospective diary to measure ethanol intake (5).
Discussion
• The prevalence of NAFLD was 46% among ALE+ and 22%among ALE- citizens.
• The corresponding figures for SLD+ and SLD- citizens inthe DNL Study were 25% and 20% (5).
• The BCV and DNL estimates are unfortunately notcomparable not only because of the different operationaldefinitions of ALE and SLD but also because the DNLstudy employed a different cut-point of alcohol intake todiagnose NAFLD in men 2 0 g/day) and used a 7-dayprospective diary to measure ethanol intake (5).
Discussion
• We have previously shown that small errors in the estimation of ethanol intake may have a substantial impact on the estimated prevalence of NAFLD vs.AFLD (5, 31).
• This is one of the reasons why we choose to focus on FL instead of NAFLD vs. AFLD for the present analysis (5, 31).
Discussion
• We have previously shown that small errors in theestimation of ethanol intake may have a substantialimpact on the estimated prevalence of NAFLD vs.AFLD (5, 31).
• This is one of the reasons why we choose to focus onFL instead of NAFLD vs. AFLD for the present analysis(5, 31).

DiscussionDiscussion
Prevalence of NAFLD.4 -.375 -
.35.325
.3.275
.25.225
.2.175.15
.125.1
.075.05
.0250
0 5 1 0 1 5 2 0 2 5 3 0 3 5 4 0Females
5 1 0 1 5 2 0 2 5 3 0 3 5 4 0Males
Cut-point of ethanol intake ( g * d l )Calculated from Bedogni G. Hepatology. 2005;42:44

Discussion
• The analysis of the risk factors for FL yielded two very interesting findings.
Discussion
• The analysis of the risk factors for FL yielded two veryinteresting findings.

Discussion
• The first finding is that ethanol intake was not an independent predictor of FL in the general population.
• The DNL Study gave the same finding even if a direct comparison of the DNL and BCV studies is notpossible because of the different instruments used to measure alcohol intake (22).
Discussion
• The first finding is that ethanol intake was not anindependent predictor of FL in the generalpopulation.
• The DNL Study gave the same finding even if a directcomparison of the DNL and BCV studies is notpossible because of the different instruments used tomeasure alcohol intake (22).
Discussion
• The second finding is that all the components of the MS were associated to FL independently of ALE status, gender, age and alcohol intake.
• Moreover, the MS components together performed better than MS alone at identifying the presence of FL.
Discussion
• The second finding is that all the components of theMS were associated to FL independently of ALEstatus, gender, age and alcohol intake.
• Moreover, the MS components together performedbetter than MS alone at identifying the presence ofFL.

Discussion
• The dichotomization implicit in the concept of MS has been criticized by research methodologists on the basis of both clinical and statistical grounds (31).
• The findings of the present study offers a further empirical argument for preferring the use of the single components of the MS instead of the whole MS for the study of the association of FL with cardiometabolic risk factors.
Discussion
• The dichotomization implicit in the concept of MShas been criticized by research methodologists onthe basis of both clinical and statistical grounds (31).
• The findings of the present study offers a furtherempirical argument for preferring the use of thesingle components of the MS instead of the wholeMS for the study of the association of FL withcardiometabolic risk factors.

Strenghts
• The strengths of the present study are that it was performed in a representative sample of the general population, that it enrolled an high number of subjects, and that it built a serum bank that we plan to use in further studies.
Strenghts
• The strengths of the present study are that it wasperformed in a representative sample of the generalpopulation, that it enrolled an high number ofsubjects, and that it built a serum bank that we planto use in further studies.

Limitations
• The most important limitation of the present study is the suboptimal response rate (58%).
• Although this response rate is exactly the same of the DNL Study (31) and is higher than that reported by most studies (32), it is possible that the citizens who refused to participate to the BCV Study differed systematically from those who accepted with an ensuing selection bias.
Limitations
• The most important limitation of the present study isthe suboptimal response rate (58%).
• Although this response rate is exactly the same ofthe DNL Study (31) and is higher than that reportedby most studies (32), it is possible that the citizenswho refused to participate to the BCV Study differedsystematically from those who accepted with anensuing selection bias.

Conclusion
• FL was highly prevalent in a Northern Italy town in 2005/9 and was more common among ALE+ citizens.
• It was not associated with alcohol intake but was strongly associated with anthropometry and the MS components.
Conclusion
• FL was highly prevalent in a Northern Italy town in2005/9 and was more common among ALE+ citizens.
• I t was not associated with alcohol intake but wasstrongly associated with anthropometry and the MScomponents.

Looking ahead
• The cross-sectional data presented in this talk will inform the ongoing and future analyses of the BCV cohort, which we hope will offer new and relevant information on the burden of FL in the general population.
Looking ahead
• The cross-sectional data presented in this talk willinform the ongoing and future analyses of the BCVcohort, which we hope will offer new and relevantinformation on the burden of FL in the generalpopulation.


![Fatty liver disease with Diabetes Mellitus [BANGLADESH]](https://static.fdocuments.in/doc/165x107/587eb3901a28abbb688b57dd/fatty-liver-disease-with-diabetes-mellitus-bangladesh.jpg)