PRETREATMENT OF CHEMICAL WASTEWATER FOR TOXICITY REDUCTION Jurek
16
PRETREATMENT OF CHEMICAL WASTEWATER FOR TOXICITY REDUCTION Jurek Patoczka, Ph.D., P.E., and Russell K. Johnson, P.E., Killam Associates, 27 Bleeker St., Millburn, NJ 07041 Presented at 68 th Annual Water Environment Federation Conference & Exposition, 1995 ABSTRACT The objective of this study was to develop an economical method of reducing the toxicity of process wastewater from a facility formulating industrial and commercial cleaners. Since the wastewater was discharged to a sewer system and eventually treated in an activated sludge plant, influent toxicity as measured by the Microtox® test, was of concern to the recipient publicly owned treatment works (POTW). The major source of toxicity was suspected to be nonylphenol-based, ethoxylated surfactants. The pretreatment schemes investigated included powdered activated carbon (PAC) addition in batch tests and activated sludge treatment in continuous flow reactors, with and without activated carbon addition. The average carbon dose required for reduction of toxicity to the target value of EC of 30% in batch PAC treatment, was 31,000mg/l. Biological activated sludge treatment was not capable of reducing toxicity to the required level. High and variable fixed dissolved solids (22,000mg/l, on average) in the process wastewater contributed to the poor performance of the activated sludge. Addition of activated carbon to the biological reactors (PACT) was effective in stabilizing biological system performance. The carbon dose required to achieve the target effluent toxicity was 2,000mg/l. This is an order of magnitude less than powdered carbon alone thus, demonstrating the economic benefits of the combined biological and activated carbon treatments. KEYWORDS Activated carbon, activated sludge, toxicity, Microtox, PACT, surfactants, nonylphenol- based, ethoxylated surfactants
Transcript of PRETREATMENT OF CHEMICAL WASTEWATER FOR TOXICITY REDUCTION Jurek

PRETREATMENT OF CHEMICAL WASTEWATER FOR TOXICITY REDUCTION
Jurek Patoczka, Ph.D., P.E., and Russell K. Johnson, P.E.,
Killam Associates, 27 Bleeker St., Millburn, NJ 07041
Presented at 68th Annual Water Environment Federation Conference & Exposition, 1995
ABSTRACT
The objective of this study was to develop an economical method of reducing the toxicity of process wastewater from a facility formulating industrial and commercial cleaners. Since the wastewater was discharged to a sewer system and eventually treated in an activated sludge plant, influent toxicity as measured by the Microtox® test, was of concern to the recipient publicly owned treatment works (POTW). The major source of toxicity was suspected to be nonylphenol-based, ethoxylated surfactants. The pretreatment schemes investigated included powdered activated carbon (PAC) addition in batch tests and activated sludge treatment in continuous flow reactors, with and without activated carbon addition. The average carbon dose required for reduction of toxicity to the target value of EC of 30% in batch PAC treatment, was 31,000mg/l. Biological activated sludge treatment was not capable of reducing toxicity to the required level. High and variable fixed dissolved solids (22,000mg/l, on average) in the process wastewater contributed to the poor performance of the activated sludge. Addition of activated carbon to the biological reactors (PACT) was effective in stabilizing biological system performance. The carbon dose required to achieve the target effluent toxicity was 2,000mg/l. This is an order of magnitude less than powdered carbon alone thus, demonstrating the economic benefits of the combined biological and activated carbon treatments.
KEYWORDS
Activated carbon, activated sludge, toxicity, Microtox, PACT, surfactants, nonylphenol-based, ethoxylated surfactants

INTRODUCTION
The process wastewater in question was generated at a large facility formulating and packaging finished products, consisting mostly of industrial and commercial cleaners. Process wastewater resulted from the wash down of kettles, material handling equipment, storage facilities and floors. The process wastewater, along with stormwater and sanitary wastewater, was equalized and batch-neutralized prior to discharge to a large municipal collection system, where it was eventually treated at an activated sludge plant operating in a contact-stabilization mode.
The discharge was regulated by a state significant industrial user permit, as well as governed by the local pretreatment ordinance. With respect to these permits, the major pollutants of concern were petroleum hydrocarbons (PHC), oil and grease (O&G), TKN, as well as certain volatile organic compounds. While those concerns were being addressed by a variety of measures including waste minimization, pollution prevention and physical-chemical pretreatment, the recipient sewer authority expressed concern over the toxicity of the process wastewater to its activated sludge system, as measured by Microtox®. (Please note that any references to toxicity in this text are meant as toxicity as measured by Microtox, unless indicated otherwise).
The Microtox test measures toxicant-induced inhibition of light production of a specific luminescent bacteria species, Photobacterium phosphoreum. The results are expressed as effective concentration (EC , in percent), which identifies sample dilution that causes a 50% decrease in the light emission after a specific exposure time (typically 5 or 15 minutes). The test was developed in the late 70’s (Bullich, 1979) and commercialized in the early 80’s. A correlation between Microtox toxicity and heterogeneous biomass respiration inhibition has been demonstrated by Gaiek and Cole (1993). While respirometry and other methods for assessing toxicity thresholds to activated sludge are available (Patoczka et al., 1989), Microtox remains a surrogate method of choice for screening wastewater for potential toxicity, to a biological treatment process.
A general correlation between Microtox and bioassay (fathead minnow) toxicity had been established for more than 200 specific compounds (Kaiser and Palabrica, 1991). However, correlation between any specific, complex wastestream bioassay toxicity and Microtox, could vary from strong to non-existing (Lankford et al., 1987). In any case, the Microtox test is not an appropriate test for assessing treated, whole effluent toxicity (WET) to the aquatic environment. This is due to its relatively low sensitivity and lack of demonstrated correlation with aquatic toxicity tests for complex effluents at the range of marginal toxicity of interest in WET testing (Arbuckle and Alleman, 1992). Also, one available study found no correlation between influent Microtox toxicity, and trickling filter effluent acute toxicity to fathead minnows (Killam Associates, 1994).

Microtox EC values recorded in raw wastewater in seven Northern New Jersey municipal sewer systems varied widely from 2 to 50%, with typical values being in a range of 10 to 30% (Killam Associates, 1992). Besides diverse industrial and commercial contribution, the degree of septicity is likely to play a role in this variability. The recipient POTW in this study, based on their experience in correlating influent EC withperformance of their wastewater treatment plant, indicated their desire to keep influent EC above 30% in combined raw wastewater and consequently, in all contributing streams. These toxicity concerns were identified at a time when an onsite, pilot plant ultrafiltration (UF) study was being conducted at the industrial facility, which is the subject of this study. Microtox testing performed on the UF permeate indicated that UF was not effective in reducing toxicity.
The objective of the research detailed in this paper, was to develop a cost effective method of achieving the target EC value of 30%, or 3.3 Toxic Units (TU). Toxic Units are equal to 100/EC , and represent mass (or concentration) of a hypothetical toxicant present in wastewater. Consequently, TU are the preferred units for presenting toxicity data and for calculation of such statistics, as removal efficiency and average toxicity.
Since the process wastewater EC was in the range 0.003 to 0.25% at the time of the experimental work detailed here, a considerable toxicity reduction was needed to achieve the target value. It was recognized that surfactants, particularly nonylphenol-based ethoxylates (NPE), were a likely cause of the toxicity.
The wastewater was fairly concentrated, with average COD in the 10,000 to 15,000mg/l range. Based on the material mass balance, a significant part of its organic components were NPEs. NPEs biograde slower, as compared to alcohol-based ethoxylated surfactants (Mann and Reid, 1971; Stiff et al., 1973 Kravetz et al., 1983). Both the original compounds and byproducts of NPEs partial degradation are toxic to aquatic life (Yoshimura, 1986; Patoczka and Pulliam, 1990). Some possible NPE biodegradation pathways could actually generate byproducts that are more toxic than the original compound. Due to their lipophilic nature, (affinity to lipids, main constituent of cell membrane) they tend to absorb at the bacterial surface, disrupting membrane functions and causing toxicity to activated sludge microorganisms and luminescent bacteria, used for toxicity determination in the Microtox test. Indeed, a significant adsorption of NPEs on activated sludge was directly demonstrated (Patoczka and Pulliam, 1990). At the same time, activated sludge was demonstrated to substantially degrade NPE at concentrations up to 500mg/l (Patoczka and Pulliam, 1990; Figueroa and Miller, 1993). The former study demonstrated that aquatic toxicity of NPE-based feed, was significantly reduced by activated sludge, with 48hr LC to mysid shrimp reduced from 0.29 – 0.78% (for different types of NPE) to 17 – 58%.

Due to the nature of the production facility operation, NPEs were a major unavoidable component of the wastewater. Consequently, the investigation concentrated on end-of-the-pipe solutions. The following treatment processes were evaluated, primarily for their effectiveness in toxicity reduction.
1. Powdered activated carbon (PAC) addition in batch tests. 2. Activated sludge treatment in continuous flow, laboratory scale reactors. 3. Activated sludge with PAC addition treatment (PACT) in continuous flow,
laboratory reactors.
METHODOLOGY
Powdered Activated Carbon (PAC) Batch Tests Five jar tests were performed on equalized and neutralized process wastewater. For each test, PAC (Calgon WPX) was added at a range of doses from 0 to 30,000mg/l, into one (1) liter beakers. The test solutions were mixed at 75 rpm for two hours at room temperature, the samples were settled for one hour and the supernatant was analyzed.
Activated Sludge Treatment Initially, the seed sludge from a local treatment plant was acclimated for 3 weeks by feeding it in a batch mode, with gradually increased volumes of process wastewater. Subsequently, additional four (4) weeks of acclimation was provided in four separate completely mixed reactors, fed continuously at different loadings (feed rates).
The study was conducted in four continuously fed laboratory reactors, operating at different organic loadings and room temperature. Operating parameters of the reactors are listed in Table 1. The reactors were fed from a common influent container with volume of 90 1, corresponding to an equalization tank with a 7 day hydraulic retention time (HRT). Fresh process wastewater was collected daily and delivered weekly to the laboratory. The reactors 1 and 2 were operated in a semi-batch mode, with effluent removed from the reactors once a day, following a 30-minute settling period. Reactors 3 and 4 were equipped with an integral clarifier having a quiescent section separated from the aerated part of the reactor with a movable baffle with underflow. To compensate for evaporation in these high HRT reactors, tap water was added daily to the reactors, as needed. At times when the raw wastewater analysis indicated potential nitrogen deficiency, ammonium salt was added to the feed.
The reactors were attended to daily with comprehensive analysis of the influent and effluent quality performed once a week. The major parameters of concern were toxicity, BOD , COD, PHC and Oil & Grease. Additionally, parameters needed for operational control of the activated sludge process, such as MLSS/MLVSS, oxygen uptake rate, DO, pH and temperature, were routinely performed.

Activated Sludge with Powdered Activated Carbon Addition (PACT) During the subsequent PACT study, four identical reactors with volumes of 25 1 and HRT of 8.3 days were operated in semi-batch mode, as described for reactors 1 and 2 above. The design sludge was selected at 20 days, which corresponded to the calculated sludge age in the bioreactor with an HRT of 8.3 days and a design, MLVSS of 3,000mg/l. This would assure that a viable biological MLVSS would be sustained (in addition to MLVSS contributed by carbon). A sludge age of 20 days or more was also considered as desirable from the standpoint of priority pollutant removal in a PACT study by O’Brien et al. (1990). In an activated sludge study (Lankford and Tate, 1990), a sludge age of 20 days was found to be optimal from the standpoint of effluent toxicity reduction in NPE bearing, high salinity wastewater.
In order to speed up reaching of a steady state operation, the reactors were pre-charged with PAC, at concentrations calculated from the design sludge age (20 days), HRT and carbon dose. This initial load of PAC was in turn, first contacted with feed for partial exhaustion. During the initial six (6) weeks of operation, PAC was added once a day directly to the reactors at the following dosages (based on influent flow): reactor 1 – 0mg/l (control), 2 – 250, 3 – 500 and 4 – 1,000mg/l. Since the initial results indicated unsatisfactory toxicity reduction, the dosages were increased as given in Table 2, which also lists other operating parameters of the reactors. Reactors 1 and 2 operated in that mode (at PAC dosages of 0 and 500mg/l, respectively) for an additional four (4) weeks, while 3 and 4 were for an additional nine (9) weeks (at dosages of 1,500 and 4,500 mg/l).
The reactors were fed, maintained and tested in a manner similar to that practiced during the biostudy, with the exception that, in order to prevent large salinity variations in the feed, tap water was added to lower fixed dissolved solids (FDS) content to 20,000 mg/l, if needed. Evaporation in the reactors was compensated by tap water addition.
AnalyticalAll conventional analytical work reported in a study, was performed in accordance with Standard Methods in Killam Associates laboratory. Aqua Survey Inc. performed Microtox tests utilizing the Microbics model M500 analyzer. The reported EC valueswere obtained at 15-minute exposure.
RESULTS AND DISCUSSION
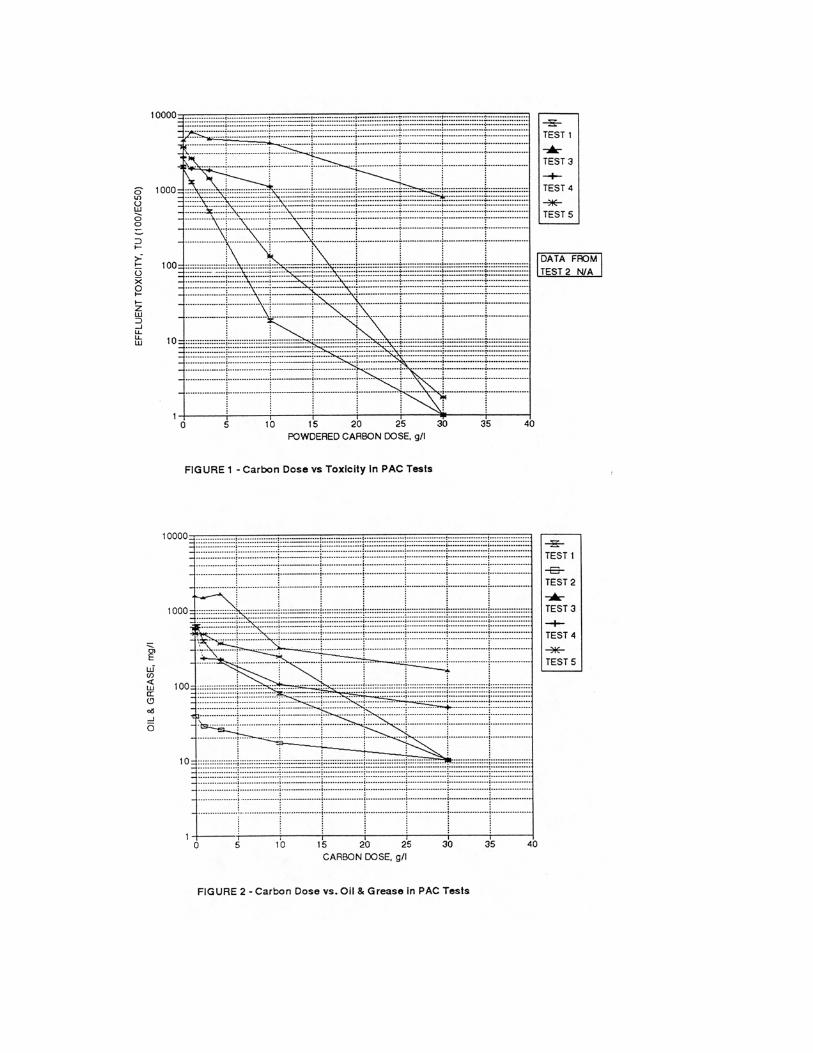
Powdered Activated Carbon The carbon dose required for achieving the desired toxicity reduction in batch treatment could be most readily determined from Figure 1. For 3 out of 4 wastewater samples tested, the carbon dose needed to reduce toxicity to 3.3 TU varied from 22,000 to 27,000mg/l, while for the fourth sample the required dose was substantially higher (extrapolation indicated a dose of 50,000 to 100,000mg/l). Other parameters of concern such as, petroleum hydrocarbons (PHC) and oil and grease (O&G), demonstrated a similar dose – concentration of relationship (Figures 2 and 3). Since the permit limits for PHC and O&G were 100 and 200mg/l respectively, the parameter controlling the carbon dose was toxicity, in all samples tested.

Since in batch treatment the carbon dose could be adjusted as needed, the average carbon dose required to obtain an EC of 30%, estimated at 31,000mg/l, was used as a design value for comparison with other treatment alternatives.
Activated Sludge System The average operating and performance data from the last four weeks of operation, which was preceded by a total of seven weeks of acclimation are presented in Table 1.
TABLE 1 – Average Operating and Performance Data from Activated Sludge Reactors
Parameter Influent ReactorAeration Basins 1 2 3 4HRT (design), days N/A 13.3 8.3 5.0 2.9MLSS, mg/l N/A 5,500 4,990 5,790 6,370MLVSS, mg/l N/A 3,420 2,990 3,320 3,580SVI, mg/l N/A 73 71 64 65F/M, gCOD/gMLVSS-day N/A 0.33 0.60 0.90 1.44Specific Oxygen Uptake Rate, mgO /gMLVSS-hr
N/A 9.6 13.0 22.0 34.9
EffluentsToxicity, TU 4545 13 36 53 67Soluble COD, mg/l 14,970 (1) 3,210 6,250 7,340 9,000COD Removal Efficiency, % N/A 79 58 51 40
Total BOD , mg/l (2) 337 1,278 2,565 3,076TSS, mg/l 1176 811 1,455 1,974 1,280VSS, mg/l 504 345 645 1,044 667gTSS generated/gCOD removed N/A 0.26 0.27 0.30 0.28
Oil & Grease, mg/l 407 55 181 244 303Phenols, mg/l 0.56 <0.08 0.21 0.37 0.96
1. Total COD 2. Measured value was 2,135mg/l, but considered unreliable
Toxicity reduction achieved by activated sludge, while greater than 98% (based on TU), was not satisfactory, as even the lowest loaded reactor effluent toxicity of 13 TU was considerably above the target value of 3.3 TU. Effluent toxicity was a strong function of the reactor organic loading (Figure 4).

For the conventional parameters of notice, is the relationship between reactor HRT and COD removal capability (Figure 5) suggesting that initially, (corresponding to HRT < 2days), part of the COD is removed rapidly, then the more difficult to degrade fraction degrades at a much lower rate. In batch aeration tests with activated sludge inhibited by 100mg/l Hg addition, no measurable COD reduction was observed up to 21-hour aeration (Figure 6). This demonstrated that non-biological mechanisms, such as volatilization or phase-separation, were not responsible for this rapid initial COD removal, substantiating extrapolation drawn on Figure 5.
BOD data (Table 1) illustrate why caution should be exercised in using this parameter in characterization of industrial wastewater, particularly in determining aeration requirements for activated sludge. The reported apparent influent BOD results were probably impacted by inhibition/lack of acclimation and if used at face value, could lead to a serious underestimation of the amount of oxygen demand actually exerted during the treatment.
Several other parameters of interest such as, O&G and phenols, demonstrated an expected trend of increasing removal efficiency at lower organic loadings (Table 1). Sludge SVI were quite low and effluent TSS very high, indicating poorly flocculating sludge and dispersed growth, as could be expected in toxic wastewater with high and variable salinity (average FDS was 22,000mg/l). Similar loss of flocculation in activated sludge treating NPEs was previously reported by Figueroa and Miller (1993) and Rzechowska (1976). Microscopic observations indicated lack of presence of higher organisms, such as protozoa. No particular efforts (such as polymer addition) were made to control effluent TSS, since high TSS was acceptable in this pretreatment scenario.
Results of the activated sludge study indicated that, in order to adequately remove toxicity, biological treatment must be supplemented by some additional treatment means. Activated carbon demonstrated its effectiveness in the tests reported above. Additionally, ethxylated nonylphenols are absorbable on activated carbon, as determined directly by Lankford and Tate (1990). Hence, some form of activated carbon treatment was deemed necessary as a part of the treatment train. Since the activated sludge study demonstrated that a significant part of the influent organics (as measured by COD) was amenable to biological degradation, the logical choice was PACT treatment, which combines biological and activated carbon treatment in one unit process.
Powdered Activated Carbon treatment (PACT) Table 2 provides a summary of PACT reactor performance for the four-week period, when all four reactors operated simultaneously.
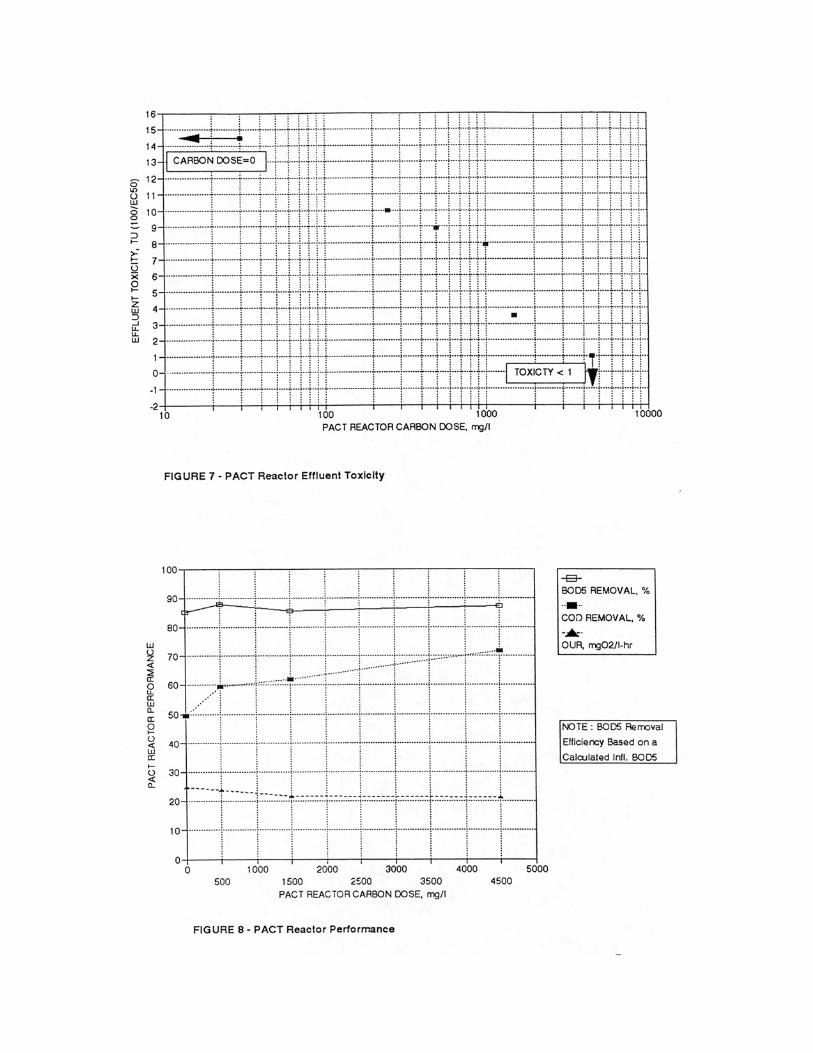
Figure 7 presents the relationship between average PACT reactor effluent toxicity and carbon dose applied in the corresponding time frame. On average, a PAC dose of approximately 2,000mg/l is required to meet the target of 3.3 TU, while a dose of 4,500 rendered the effluent nontoxic (EC >100%) at all times (eight tests). For operation of the full-scale facility (and comparison with other alternatives), a dose of 2,500mg/l was

recommended, with ability to supply 4,500mg/l, if necessary. This is an order of magnitude less required in batch PAC treatment, demonstrating economic benefits associated with PACT treatment.
Reactors’ performance in terms of oxygen demand-related parameters is illustrated in Figure 8. As expected, PAC addition improved COD removal efficiency. Effluent BODconcentrations in all four reactors were in a narrow range, (600 to 750mg/l) indicating that activated carbon does not significantly contribute to the removal of biodegradable organics in the range of carbon doses tested. Oxygen uptake rate data (Figure 8) similarity indicates that, only minor reduction in oxygen consumption occurred at higher PACT doses (all reactors operated at the same volumetric organic loading), confirming the activated carbon, primarily non-biodegradable COD.
From other parameters of interest, PAC addition significantly improved O&G removal, while residual phenols seemed not to be affected by carbon dose indicating that, biodegradation was the primary removal mechanism (Table 2).
Suspended solids in the effluent from the reactors were quite high (Table 2), similarly as observed during the activated sludge study. Probable causes as discussed previously, were high salinity and toxic nature of the wastewater. Since TSS of the discharge was of no concern in this pretreatment, no particular efforts were made to control TSS. In screening jar tests, alum at doses of above 1,000mg/l was required to obtain significant sludge settling from the supernatant (effluent), and only a dose as high as 6,000mg/l yielded fairly clear supernatant upon 30minutes of settling. Ferric chloride seemed to be slightly more effective. Several tested polymers at fairly high doses of up to 30mg/l, offered no improved solids capture.
As expected, the mixed liquor settled rapidly, reflecting the presence of heavy carbon particles. Very heavy PACT sludge, with MLSS concentration reaching approximately 10,000mg/l, at the design carbon dose of 2,500mg/l and SRT of 20days, will require a special attention in design of aeration basin mixing, secondary clarifier rake and return sludge lines and pumps.
Throughout the activated sludge and PACT study, foaming was observed in the aeration basins. Silicone based antifoaming emulsion AF 9020 (manufactured by General Electric) was successfully used to control foaming at a typical dose of 550mg/l (of feed). Toward the end of the study, the PACT reactor with a 4,500mg/l dose did not require antifoaming agent addition. Observations indicated foaming was limited by aeration type (coarse bubble better than fine), increasing PACT dose and progressing acclimation in that order. The other obvious factor is the composition of the feed.

TABLE 2: Average Operating and Performance Data from PACT Reactors (1)
Parameter Influent ReactorAeration Basins 1 2 3 4HRT, days N/A 8.3 8.3 8.3 8.3PACT dose, mg/l of influent N/A 0 500 1,500 4,500MLSS, mg/l N/A 3,650 5,720 7,240 15,810MLVSS, mg/l N/A 1,960 3,910 5,054 12,860Oxygen Uptake Rate,mg O /1-hr
N/A 24.7 23.7 21.5 21.2
SVI, mg/l N/A 29 15 11.1 5.8EffluentsToxicity, TU 943 15.9 10.0 4.0 (2) <1.0 (3)Soluble COD, mg/l 11,160 (4) 5,650 4,525 4,250 3,160COD Removal Efficiency, % N/A 49.4 59.5 61.9 71.7
Total BOD , mg/l (5) 749 609 723 638Oil & Grease, mg/l 300 114 117 88 77TSS, mg/l 304 1,600 1,280 1,595 3,520VSS, mg/l 129 693 659 790 1,660Phenols, mg/l (6) 3.5 0.44 0.25 0.35 0.59
1. Data from four-week period of simultaneous operation of all four reactors. 2. During the subsequent, additional 5weeks of operation, the average effluent
toxicity was 2.9 TU. 3. During the additional 5weeks of operation, toxicity remained at TU<1.0. 4. Total COD. 5. Measured value was 1770mg/l, but considered unreliable. 6. Data for phenols are from the initial period of reactors operation, at lower carbon
dose, as given in the Methodology Section.
COST COMPARISON
Information developed during the study was subsequently used to select the recommended pretreatment alternative. Two feasible pretreatment methods reported in this study were, PAC and PACT treatments. Additionally, for illustration purposes, the economic analysis included ultrafiltration, (UF) followed by adsorption on granular activated carbon (GAC) columns. Bases for design of UF + GAC treatment were developed in a separate study, not reported here. The limiting parameter for all options evaluated was toxicity. The average flow of the wastewater was 40 m³/d (10,700 gpd).
Table 3 summarizes capital and O&M costs, net present worth (NPW) and average annual equivalent cost (AAEC) at 15years and 9.5% interest. Other major assumptions were cost of PAC at $0.88/kg ($0.40/lb), cost of GAC at $2.20/kg ($1.00/lb) and cost of disposal of UF reject at $264/m³ ($1.00/gal).

TABLE 3: Summary of Cost Estimate for Treatment Options
Cost/Treatment UF/GAC PACT PACCapital Cost, $ 1,780,000 1,830,000 200,000O&M Costs, $/year 407,000 148,000 824,000Net Present Worth (1), $ 4,966,000 2,989,000 6,650,000Average Annual Equivalent Cost (1), $/year 634,000 382,000 850,000
1. At 15years and 9.5% interest rate
The estimates indicate that, the lowest capital expenditure would be required for PAC treatment and the largest for PACT. Conversely, PACT has the lowest O&M costs and PAC the highest, reflecting large difference in carbon use. When overall economics of the options are compared over a 15year period, the PACT system is the most cost effective pretreatment alternative and as such, was recommended for implementation.
CONCLUSIONS
1. Activated sludge alone was not effective in reducing Microtox toxicity of this strong (COD on order of 10,000mg/l) wastewater to the target level of EC of 30%. Large concentration of nonylphenol ethoxylate based surfactant (on order of 3,000mg/l) and relatively high salinity, (FDS on order of 20,000mg/l) were responsible for inadequate toxicity removal and poor flocculating characteristic of the activated sludge over the range of organic loading tested (0.33 to 1.44 gCOD/gMLVSS-day). Removal efficiency of toxicity and conventional parameters such as COD, BOD and O&G, expectedly increased with the decreasing organic loading of the reactors.
2. PACT was capable of complete toxicity removal, and achieved the target ECvalue of 30% at a PAC dosage of approximately 2,000mg/l. Reduction of toxicity, COD, and O&G, progressively improved with increasing carbon dose.
3. Both activated sludge and PACT reactors had a very high effluent TSS due to poorly flocculating sludge. While high TSS was acceptable in this pretreatment scenario, very high dosages of coagulants or flocculants (2,000mg/l alum) were required to bring TSS to typical secondary standards.
4. A major operational concern for the PACT facility recommended for implementation, was the need for supplemental mechanical mixing, needed to keep the heavy PACT sludge (design PAC dose of 2,500mg/l, MLSS of 10,000mg/l) in suspension. This would be addressed in the design phase.

5. In order to reduce foaming tendency of this surfactant-bearing wastewater, which was experienced in both the activated sludge and PACT reactors, coarse bubble diffusers were recommended. Tendency to foam decreased with increasing PAC dose. Silicone-based, antifoaming agent was effective in foam control.
6. For Microtox toxicity reduction in the wastewater tested, activated carbon use in combined treatment (PACT) was more than an order of magnitude less, as compared to PAC used in batch treatment.
7. While the PACT system required a larger capital expenditure, overall economics were substantially better for PACT as compared to batch PAC treatment, as well as compared to UF plus GAC treatment (not reported in this paper).
REFERENCES
Arbuckle, W. B., and Alleman, J. A., (1992) Effluent Toxicity Using Nitrifiers and Microtox™. Water Environ. Res. 64, 263.
Bullich, A. A. (1979) Use of the Luminescent Bacteria for Determing Toxicity in Aquatic Environments. Aquatic Toxicology, L. L. Markings and R. A. Kimerle, Eds., American Society for Testing and Materials, ASTM 667, 98.
Figueroa, L. A., and Miller, J. (1993) Biodegradation of Nonionic Surfactants. Proceedings of the Water Environment Federation 66th Annual Conference and Exposition, Anaheim, California.
Gaiek, R. L., and Cole, A. I. (1993) Influent Toxicity Testing at Wastewater Treatment Plants: Case Study. Proceedings of the Water Environment Federation 66th Annual Conference and Exposition, Anaheim, California.
Kaiser, K. L. E., and Palabrica, V. S. (1991) Photobacterium phosphoreum Toxicity Data Index. Water Poll. Res. J. Canada, 26, 261.
Killam Associates (1992) Unpublished survey of 8 New Jersey municipal sewer systems.
Killam Associates (1994) Unpublished report.
Kravetz, L., Chung, K. F., Guin, K. F., Shebs, W. T., and Smith, L. S. (1983) Primary and Ultimate Biodegradation of an Alcohol Ethoxylate and a Nonylphenol Ethoxylate Under Average Winter Conditions in the U.S. Presented at the American Oil Chemists’ Society 74th Annual Meeting, Chicago, Ill.
Lankford, P. W., and Tate, S. R. (1990) Surfactant Removal and Toxicity Reduction through Alternative Adsorption Processes. Presented at Stevens Institute of Technology Seminar, Hoboken, NJ.

Lankford, P. W., Eckenfelder, W. W., and Torrens, K. D. (1987) Technological Approaches to Toxicity Reduction in Municipal and Industrial Wastewaters, Presented at Annual Meeting of Virginia Water Pollution Control Association, Norfolk, Virginia.
Mann, A. H., and Reid, V. W. (1971) Biodegradation of Synthetic Detergents. Evaluation by Community Trials. Part II. Alcohol and Alkylphenol Ethoxylates, J. Am. Oil Chem. Soc. 48, 794.
O’Brien, G. J., Reich, R. A., Salata, L. S., Feibes, M. H., McManus, C. N., and Heath, H. W. (1990) Carbon Columns vs. the PACT Process for Priority-Pollutant Removal. WaterEnvironment & Technology, 2, 72.
Patoczka, J., Pulliam, G. W., and Chowing, G. L. (1989) Determination of Toxicity Thresholds of Industrial Wastestreams to Activated Sludge Process Using Fed Batch Reactor. 43rd Purdue Industrial Waste Conference Proceedings, 51.
Patoczka, J., and Pulliam, G. W. (1990) Biodegradation and Secondary Effluent Toxicity of Ethoxylated Surfactants. Wat. Res., 24, 965.
Stiff, M. J., Rootham, R. C., and Culley, G. E. (1973) The Effect of Temperature on the Removal of Non-Ionic Surfactants during Small-Scale Activated Sludge Sewage-I. Comparison of Alcohol Ethoxylates with a Branched-chain Alkylphenol Ethoxylate. Wat.Res., 7, 1003.
Yoshimura, K. (1986) Biodegradation and Fish Toxicity of Nonionic Surfactants. J. Am. Oil Chem. Soc. 63, 1590.