Pressrelease Duni Interim Q2 2015 eng - We supply ... | 2015 Interim Report for Duni AB (publ) 1...
28
____________________________________________________________________________________________________________________________________________ Duni is a leading supplier of attractive and convenient products for table setting and take‐away. The Duni brand is sold in more than 40 markets and enjoys a number one position in Central and Northern Europe. Duni has some 2,100 employees in 18 countries, headquarters in Malmö and production units in Sweden, Germany and Poland. Duni is listed on NASDAQ Stockholm under the ticker name “DUNI”. ISIN‐code is SE 0000616716. 1 Q2 | 2015 Interim Report for Duni AB (publ) 1 January – 30 June 2015 (compared with the same period of the previous year) 10 July 2015 Continued improved earnings 1 April – 30 June 2015 Net sales amounted to SEK 1 002 m (922). Adjusted for exchange rate changes, net sales increased by 4.2%. Earnings per share, for continuing operations, after dilution amounted to SEK 1.44 (1.40). Table Top reported earnings in parity with 2014, other operating business areas improved over the previous year. Decision to invest SEK 110 m in upgrading two paper machines in Skåpafors for increased capacity. Hygiene production in Skåpafors is now closed, and hygiene business and changeover work in the Materials & Services business area are reported as discontinued operations as from the second quarter 2015. This is reported on a line in the income statement before "Net income". The consolidated income statement has been recalculated from 2013 and reports only continuing operations. 1 January – 30 June 2015 Net sales amounted to SEK 1 987 m (1 739). Adjusted for exchange rate changes, net sales increased by 8.5%. Earnings per share, for continuing operations, after dilution amounted to SEK 2.94 (2.39). Net debt amounted to SEK 916 m, compared with SEK 1,164 m for the same period last year.
Transcript of Pressrelease Duni Interim Q2 2015 eng - We supply ... | 2015 Interim Report for Duni AB (publ) 1...

____________________________________________________________________________________________________________________________________________
Duni is a leading supplier of attractive and convenient products for table setting and take‐away. The Duni brand is sold in more than 40 markets and enjoys a number one position in Central and Northern Europe. Duni has some 2,100 employees in 18 countries, headquarters in Malmö and production units in Sweden, Germany and Poland. Duni is listed on NASDAQ Stockholm under the ticker name “DUNI”. ISIN‐code is SE 0000616716.
1
Q2 | 2015
Interim Report for Duni AB (publ) 1 January – 30 June 2015 (compared with the same period of the previous year)
10 July 2015
Continued improved earnings
1 April – 30 June 2015
Net sales amounted to SEK 1 002 m (922). Adjusted for exchange rate changes, net sales increased by 4.2%.
Earnings per share, for continuing operations, after dilution amounted to SEK 1.44 (1.40).
Table Top reported earnings in parity with 2014, other operating business areas improved over the previous year.
Decision to invest SEK 110 m in upgrading two paper machines in Skåpafors for increased capacity.
Hygiene production in Skåpafors is now closed, and hygiene business and changeover work in the Materials & Services business area are reported as discontinued operations as from the second quarter 2015. This is reported on a line in the income statement before "Net income". The consolidated income statement has been recalculated from 2013 and reports only continuing operations.
1 January – 30 June 2015
Net sales amounted to SEK 1 987 m (1 739). Adjusted for exchange rate changes, net sales increased by 8.5%.
Earnings per share, for continuing operations, after dilution amounted to SEK 2.94 (2.39).
Net debt amounted to SEK 916 m, compared with SEK 1,164 m for the same period last year.
Q2 | 2015
____________________________________________________________________________________________________________________________________________
Duni AB (publ) • P O Box 237 • SE‐201 22 Malmö • Sverige • Visiting address Östra Varvsgatan 9 A • Tel +46 40 106200 • Fax +46 40 396630 www.duni.com • Registration no: 556536‐7488
2
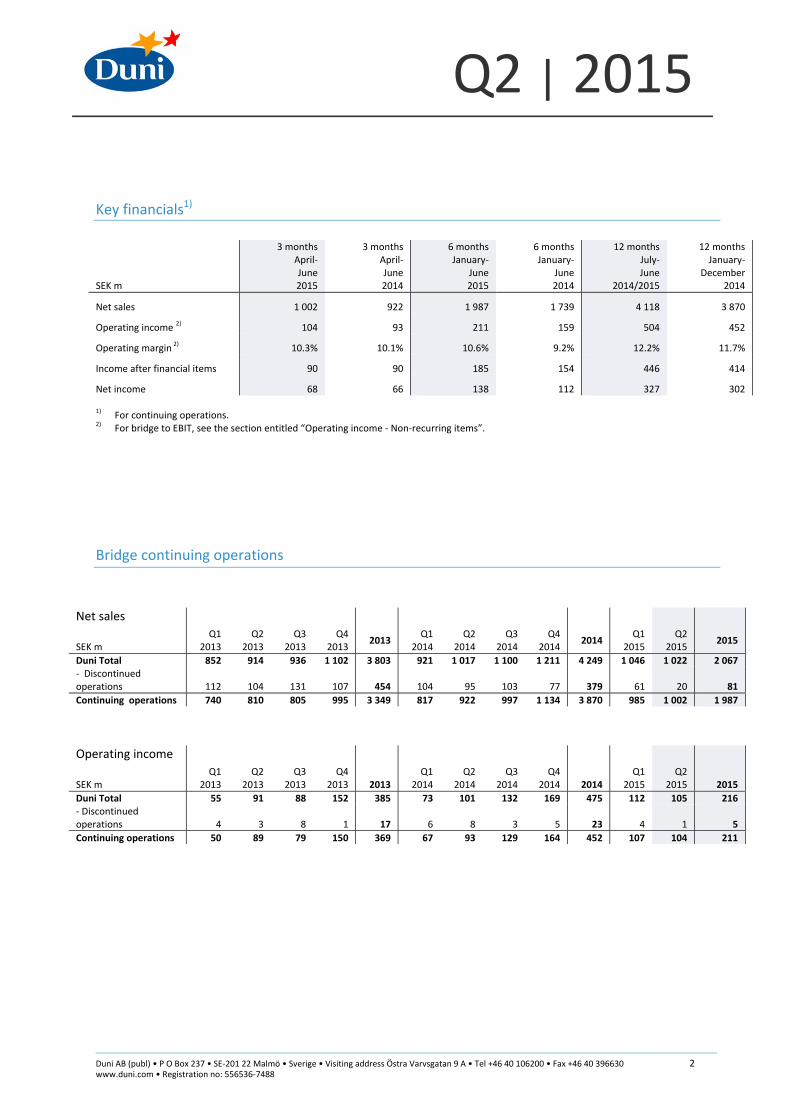
Key financials1)
SEK m
3 months April‐ June 2015
3 monthsApril‐June 2014
6 monthsJanuary‐
June 2015
6 months January‐
June 2014
12 monthsJuly‐June
2014/2015
12 monthsJanuary‐
December 2014
Net sales 1 002 922 1 987 1 739 4 118 3 870
Operating income 2) 104 93 211 159 504 452
Operating margin 2) 10.3% 10.1% 10.6% 9.2% 12.2% 11.7%
Income after financial items 90 90 185 154 446 414
Net income 68 66 138 112 327 302 1) For continuing operations.
2) For bridge to EBIT, see the section entitled “Operating income ‐ Non‐recurring items”.
Bridge continuing operations
Net sales SEK m
Q1 2013
Q2 2013
Q3 2013
Q4 2013
2013
Q12014
Q2 2014
Q3 2014
Q4 2014
2014 Q1
2015 Q2
2015
2015
Duni Total 852 914 936 1 102 3 803 921 1 017 1 100 1 211 4 249 1 046 1 022 2 067‐ Discontinued operations 112 104 131 107 454 104 95 103 77 379 61 20 81
Continuing operations 740 810 805 995 3 349 817 922 997 1 134 3 870 985 1 002 1 987
Operating income SEK m
Q1 2013
Q2 2013
Q3 2013
Q4 2013 2013
Q12014
Q2 2014
Q3 2014
Q4 2014 2014
Q1 2015
Q2 2015 2015
Duni Total 55 91 88 152 385 73 101 132 169 475 112 105 216‐ Discontinued operations 4 3 8 1 17 6 8 3 5 23 4 1 5
Continuing operations 50 89 79 150 369 67 93 129 164 452 107 104 211

Q2 | 2015
____________________________________________________________________________________________________________________________________________
Duni AB (publ) • P O Box 237 • SE‐201 22 Malmö • Sverige • Visiting address Östra Varvsgatan 9 A • Tel +46 40 106200 • Fax +46 40 396630 www.duni.com • Registration no: 556536‐7488
3
CEO’s comments “Despite a late and cold spring, with an unfavorable calendar effect, quarterly earnings improved by SEK 11 m as compared with last year. Hygiene production has now been completely closed and the previously announced production move from Dals Långed to Skåpafors is continuing according to plan. The project will be fully completed during the fourth quarter of 2015. In order to clarify the effects from the discontinued hygiene business, the accounts and reporting will from now distinguish between "continuing operations" and "discontinued operations". The Group’s overall structural effects in the second quarter are largely neutral due that the hygiene production is completed and Paper+Design, which was acquired on 11 June 2014, entails relatively small effects on earnings as the second quarter is the year’s weakest. Net invoicing for the second quarter amounted to SEK 1,002 m (922), corresponding to growth of 8.7% as compared with last year. Operating income for continuing operations is SEK 104 m (93) and the operating margin was strengthened to 10.3% (10.1%). Net debt at the end of the quarter amounted to SEK 916 m (1,164). Organic growth during the quarter is lower than the previous quarter. A disadvantageous calendar effect with an early Easter, together with a late and cold spring in central and northern Europe, led to demand during the period which was weaker than expected. A consequence of this is a lower leverage effect in terms of earnings within the supply of goods. During the quarter, the decision was taken to invest SEK 110 m in the paper mill in Skåpafors. The investment, with installation anticipated to be fully completed during the second quarter of 2016, yields an increase in capacity of approximately 15% and, in addition, creates a new platform for product development, not the least in the area of environmentally‐adapted material. The Table Top business area increased net invoicing to SEK 563 m (552) during the quarter; adjusting for currency sales for the business area fell by 2.6%. The decline is explained by calendar effects and worse spring weather in several of our main markets. Western and Southern Europe report continued good growth but this does not compensate for the decline in our more important business regions. The operating income for the quarter were SEK 87m (87) and the operating margin was 15.5% (15.7%). The Meal Service business area continues to grow at a stronger rate than the market. Net invoicing for the quarter increased to SEK 163 m (148) and the operating income increased to SEK 13 m (7). The business area reports positive growth throughout all markets and the consistent investment in innovation and environmentally‐adapted concepts continues to have a positive impact on both sales and earnings. The Consumer business area continues to contribute to a significant increase in sales as a result of the acquisition of Paper+Design. Net invoicing for the quarter increased to SEK 212 m (161) and the operating income improved to SEK ‐1 m (‐5). The operating margin was strengthened to ‐0.3% (‐3.2%). Seasonally, the second quarter is weak for this business area; few holidays and a mix of relatively simple products has resulted in the second quarter having the lowest percentage over the year in terms of earnings. In the New Markets business area, we are seeing a more stable currency situation in Russia while, at the same time, demand in the restaurant and hotel sector has declined heavily. We see satisfactory growth in other markets. Net invoicing during the quarter amounted to SEK 55 m (48) and the operating income increased to SEK 4 m (3). In the Materials & Service business area, hygiene business has been discontinued and are reported for the quarter as "discontinued operations" outside of Materials & Services. Net sales for the business area, i.e. "continuing operations" for the quarter amount to SEK 10 m (13), with an operating income of SEK 0 m (1). Although the weather was working against us, we experienced positive growth on most of our markets and our on‐going projects continue to contribute to better profitability in the continuing operations”, says Thomas Gustafsson, President and CEO, Duni.

Q2 | 2015
____________________________________________________________________________________________________________________________________________
Duni AB (publ) • P O Box 237 • SE‐201 22 Malmö • Sverige • Visiting address Östra Varvsgatan 9 A • Tel +46 40 106200 • Fax +46 40 396630 www.duni.com • Registration no: 556536‐7488
4
Net sales for the quarter amounted to SEK 1 002 m
1 April – 30 June
Net sales increased by SEK 80 m to SEK 1,002 m (922) compared with the same period last year. Adjusted for exchange rate changes, net sales increased by SEK 38 m, or 4.2%. Duni's increase in sales during the quarter is primarily explained by translation effects resulting from a continued weak Swedish krona and structural effects in Consumer. This is the last quarter with a positive structural effect from the acquisition of Paper+Design; corrected for this, Consumer is at the same level as last year. Table Top reports somewhat weaker growth. On the other hand, Meal Service and, in part, New Markets, report continued growth with positive developments on essentially all markets.
1 January – 30 June
Net sales increased by SEK 248 m to SEK 1,987 m (1,739) compared with the same period last year. Adjusted for
exchange rate changes, net sales increased by SEK 148 m, or 8.5%. The first half of the year was characterized by
reduced demand on the main markets. Sales, which after the first quarter were at satisfactory levels within Table
Top, are now back in parity with last year. This is on a level with the HoReCa market as a whole. However,
segments such as take‐away continue to show growth. Retail, which showed weak growth at the end of 2014, has
fallen back and shows only a marginal increase as compared with last year.
Net sales, currency effect1)
1) For continuing operations.
2) Reported net sales for 2015 recalculated at 2014 exchange rates.
SEK m
3 months April‐ June 2015
3 monthsApril‐ June
20152)
recalculated
3 monthsApril‐ June2014
Change in fixed
exchange rates
6 monthsJanuary‐
June2015
6 months January‐
June 2015
2)
recalculated
6 months January‐
June 2014
Change in fixed
exchange rates
Table Top 563 538 552 ‐2.6% 1 075 1 018 1 030 ‐1.1%
Meal Service 163 159 148 7.1% 299 290 271 6.9%
Consumer 212 203 161 25.9% 488 462 318 45.3%
New Markets 55 51 48 6.7% 102 95 91 4.2%
Materials & Services 10 10 13 ‐22.3% 23 23 29 ‐21.2%
Continuing operations 1 002 960 922 4.2% 1 987 1 887 1 739 8.5%

Q2 | 2015
____________________________________________________________________________________________________________________________________________
Duni AB (publ) • P O Box 237 • SE‐201 22 Malmö • Sverige • Visiting address Östra Varvsgatan 9 A • Tel +46 40 106200 • Fax +46 40 396630 www.duni.com • Registration no: 556536‐7488
5
Operating margin of 10.3% in the quarter
1 April – 30 June
The operating income for continuing operations amounted to SEK 104 m (93) with a gross margin of 28.4% (27.4%). The operating margin was 10.3% (10.1%). Adjusted for exchange rate changes, operating income increased by SEK 2 m compared with last year. The earnings for the second quarter are in line with growth in sales, and increased by slightly more than 10%. A feature common to those business areas which strengthened their earnings is that they succeeded in creating growth in the segments in which they operate. Pulp prices remain at a high level in Euros, driven by a strong US dollar. New Markets, which had a challenging start to the year with Russia in focus, stabilized during the second quarter. Income after financial items amounted to SEK 90 m (90). Income after tax amounted to SEK 68 m (66). 1 January – 30 June
The operating income for continuing operations amounted to SEK 211 m (159) with a gross margin of 28.8% (28.0%). The operating margin amounted to 10.6% (9.2%). Adjusted for exchange rate changes, operating income increased by SEK 32 m compared with last year. Growth in earnings was positive during the first half of the year, but demand on the mature markets has been somewhat weaker in recent months, above all in Table Top. Although most raw material costs were high during the year, particularly those with a strong correlation to the US dollar, gross margins continue to develop in a positive direction. Internal efficiency in the production chain continues to be a deciding factor for maintaining this trend. Income after financial items amounted to SEK 185 m (154). Income after tax amounted to SEK 138 m (112).
Operating income, currency effect1)
1) For continuing operations.
2) Reported net sales for 2015 recalculated at 2014 exchange rates.
Operating income – Non‐recurring items
Duni manages its operations based on what Duni refers to as operating income. ‘Operating income’ means
operating income before restructuring costs, non‐realized valuation effects of currency derivatives, fair value
allocations and amortization of intangible assets identified in connection with business acquisitions. See the table
below.
‘Operating income’ is a designation which is being used as from 1 January 2014 and corresponds to Duni's
previously communicated ‘underlying operating income’. For all periods up to and including 31 December 2013,
operating income corresponds to the previously communicated ‘underlying operating income’.
SEK m
3 months 3 months 3 months 6 months 6 months 6 months April‐ June 2015
April‐ June 2015
1)
recalculated
April‐ June 2014
January‐ June 2015
January‐ June
20151)
recalculated
January‐June
2014
Table Top 87 81 87 165 150 150
Meal Service 13 12 7 15 14 6
Consumer ‐1 ‐1 ‐5 23 20 1
New Markets 4 3 3 7 6 0
Materials & Services 0 0 1 1 1 2
Continuing operations 104 95 93 211 191 159

Q2 | 2015
____________________________________________________________________________________________________________________________________________
Duni AB (publ) • P O Box 237 • SE‐201 22 Malmö • Sverige • Visiting address Östra Varvsgatan 9 A • Tel +46 40 106200 • Fax +46 40 396630 www.duni.com • Registration no: 556536‐7488
6
In those cases where derivative instruments have a value, they are reported in the income statement under ‘Other
Income’ or ‘Other Expenses’. For details of restructuring costs, see Note 4.
Bridge between operating income and EBIT1)
SEK m
3 months 3 months 6 months 6 months 12 months 12 months April‐June 2015
April‐ June 2014
January‐June2015
January‐ June 2014
July‐ June 2015
January‐December
2014
Operating income 104 93 211 159 504 452
Restructuring costs 0 0 0 0 0 0 Unrealized value changes, derivative instruments ‐ 0 ‐ 0 0 0 Amortization of intangible assets identified in connection with business acquisitions ‐7 ‐1 ‐13 ‐1 ‐26 ‐14
Fair value allocation in connection with acquisitions ‐ ‐ ‐ ‐ ‐4 ‐4
EBIT 97 92 198 158 473 433
1) For continuing operations.
Reporting of operating segments
Duni's operations are divided into five operating segments, which are referred to by Duni as business areas. The Table Top business area offers Duni's concepts and products primarily to hotels, restaurants and the catering industry. Table Top primarily markets napkins, tablecoverings and candles for the set table. Duni is the market leader within the premium segment in Europe. The business area accounted for approximately 54% (59%) of Duni's net sales during the period 1 January – 30 June 2015. The Meal Service business area offers concepts for meal packaging and serving products for, e.g. take‐away, ready‐to‐eat meals, and various types of catering. Customers mainly comprise companies operating within the restaurant sector, catering or food production. As a niche player, Duni enjoys a leading position within this area in the Nordic region and has a clear growth agenda on identified markets in Europe. The business area accounted for approximately 15% (16%) of Duni's net sales during the period. The Consumer business area offers consumer products to, primarily, the retail trade in Europe. Customers mainly comprise grocery retail chains, but also other channels such as various types of specialty stores, for example garden centers, home furnishing stores, and DIY stores. The business area accounted for approximately 25% (18%) of Duni's net sales during the period. As from June 2014, the Paper+Design acquisition is included as part of the Consumer business area. The New Markets business area offers Duni's concepts regarding attractive quality products and table top concepts as well as packaging, with a focus on new markets outside Europe. In addition to customer segments such as hotels, restaurants and catering, the business area also aims its offering at the retail trade. The business area accounted for approximately 5% (5%) of Duni's net sales during the period.

Q2 | 2015
____________________________________________________________________________________________________________________________________________
Duni AB (publ) • P O Box 237 • SE‐201 22 Malmö • Sverige • Visiting address Östra Varvsgatan 9 A • Tel +46 40 106200 • Fax +46 40 396630 www.duni.com • Registration no: 556536‐7488
7
The Materials & Services business area comprises those parts which are not accommodated within the other business areas. Most of the business area comprises external sales of tissue. Production of hygiene products ceased at the end of March 2015 and is thus no longer included in the business area. Instead, hygiene business is reported as a discontinued operation. The income statement for the business area and the consolidated income statement from 2013 have been recalculated and contain only continuing operations. Hygiene business accounted for 88% of Materials & Services’ sales for 2014. The business area accounted for approximately 1% (2%) of Duni's net sales during the period. With the exception of Materials & Services, the business areas largely have a joint product range. However, design and packaging solutions are adapted to suit the different sales channels. Production and support functions are largely shared by these business areas. Group management, which is the highest executive and decision‐making body in Duni, decides on the allocation of resources within Duni and evaluates the results of the operations. The business areas are directed based on operating income after shared costs have been allocated between the business areas. For further information, see Note 4.
Split on net sales between business areas
54%
15%
25%
5%1%
Table Top Meal Service Consumer New Markets Materials & Services

Q2 | 2015
____________________________________________________________________________________________________________________________________________
Duni AB (publ) • P O Box 237 • SE‐201 22 Malmö • Sverige • Visiting address Östra Varvsgatan 9 A • Tel +46 40 106200 • Fax +46 40 396630 www.duni.com • Registration no: 556536‐7488
8
Table Top business area 1 April – 30 June
Net sales amounted to SEK 563 m (552). Adjusted for exchange rate changes, this corresponds to a drop in sales by 2.6%. Germany, which is the dominant market, had a weak quarter and declined somewhat compared with last year. Spring was very cold in much of northern Europe, which probably had a negative impact on demand. On the other hand, we see positive growth in Italy and Spain, which have recovered well since the crisis a few years ago; however they still constitute a small percentage of the business area as a whole. Operating income was SEK 87 m (87), and the operating margin was 15.5% (15.7%). Earnings for the quarter are in parity with last year and the absence of growth has not resulted in any operational leverage effects. Notwithstanding continued high raw material costs, the gross margin has been strengthened somewhat. Trends in the European currencies, particularly the strong British pound, have had a certain positive impact on earnings. 1 January – 30 June
Net sales amounted to SEK 1,075 m (1,030). Adjusted for exchange rate changes, this corresponds to a drop in sales by 1.1%. The market, and demand as a whole, continue to be weak with the exception of a small number of countries, including Sweden. The premium segment has strengthened its share of sales while the business segment faces a more challenging situation for standard products such as simpler napkins. Standard products often face stiff price pressure from competitors where Duni does not have the same competitive advantages. However, they are an important component to maintaining a favorable production volume and it is therefore important that this area is also successful. Operating income was SEK 165 m (150), and the operating margin was 15.3% (14.6%). Earnings were strengthened during the year through a combination of positive currency effects and a strong focus on internal efficiency. Despite increasing competition in several segments, Table Top has nevertheless defended its margin through, among other things, strict cost controls and increased internal efficiency. Despite a generally static market, there are possibilities using more customer‐adapted solutions and focused campaigns to take additional steps towards profitable growth. Net sales, Table Top
3 months 3 months 3 months 6 months 6 months 6 months 12 months 12 months
SEK m
April‐ June 2015
April‐June2015
1
recalculated
April‐ June 2014
January‐June 2015
January‐June
20151)
recalculated
January‐ June 2014
July‐June
2014/2015
January‐December
2014
Nordic region 85 85 86 161 161 163 350 352
Central Europe 373 351 366 734 684 696 1 516 1 478
South & East Europe 104 101 100 180 173 171 358 348
Total 563 538 552 1 075 1 018 1 030 2 224 2 179
1) Reported net sales for 2015 recalculated at 2014 exchange rates.
Q2 | 2015
____________________________________________________________________________________________________________________________________________
Duni AB (publ) • P O Box 237 • SE‐201 22 Malmö • Sverige • Visiting address Östra Varvsgatan 9 A • Tel +46 40 106200 • Fax +46 40 396630 www.duni.com • Registration no: 556536‐7488
9
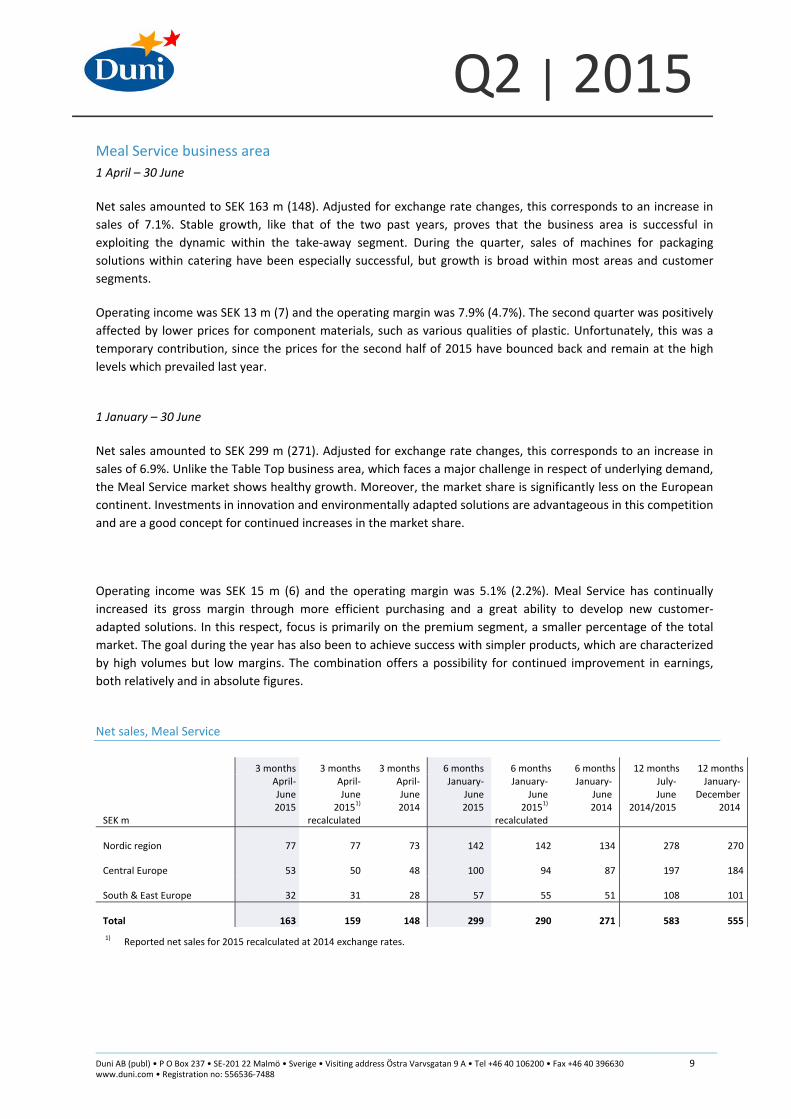
Meal Service business area
1 April – 30 June
Net sales amounted to SEK 163 m (148). Adjusted for exchange rate changes, this corresponds to an increase in
sales of 7.1%. Stable growth, like that of the two past years, proves that the business area is successful in
exploiting the dynamic within the take‐away segment. During the quarter, sales of machines for packaging
solutions within catering have been especially successful, but growth is broad within most areas and customer
segments.
Operating income was SEK 13 m (7) and the operating margin was 7.9% (4.7%). The second quarter was positively
affected by lower prices for component materials, such as various qualities of plastic. Unfortunately, this was a
temporary contribution, since the prices for the second half of 2015 have bounced back and remain at the high
levels which prevailed last year.
1 January – 30 June
Net sales amounted to SEK 299 m (271). Adjusted for exchange rate changes, this corresponds to an increase in
sales of 6.9%. Unlike the Table Top business area, which faces a major challenge in respect of underlying demand,
the Meal Service market shows healthy growth. Moreover, the market share is significantly less on the European
continent. Investments in innovation and environmentally adapted solutions are advantageous in this competition
and are a good concept for continued increases in the market share.
Operating income was SEK 15 m (6) and the operating margin was 5.1% (2.2%). Meal Service has continually
increased its gross margin through more efficient purchasing and a great ability to develop new customer‐
adapted solutions. In this respect, focus is primarily on the premium segment, a smaller percentage of the total
market. The goal during the year has also been to achieve success with simpler products, which are characterized
by high volumes but low margins. The combination offers a possibility for continued improvement in earnings,
both relatively and in absolute figures.
Net sales, Meal Service
3 months 3 months 3 months 6 months 6 months 6 months 12 months 12 months
SEK m
April‐ June 2015
April‐June
20151)
recalculated
April‐June 2014
January‐ June 2015
January‐June
20151)
recalculated
January‐ June 2014
July‐June
2014/2015
January‐December
2014
Nordic region 77 77 73 142 142 134 278 270
Central Europe 53 50 48 100 94 87 197 184
South & East Europe 32 31 28 57 55 51 108 101
Total 163 159 148 299 290 271 583 555
1) Reported net sales for 2015 recalculated at 2014 exchange rates.

Q2 | 2015
____________________________________________________________________________________________________________________________________________
Duni AB (publ) • P O Box 237 • SE‐201 22 Malmö • Sverige • Visiting address Östra Varvsgatan 9 A • Tel +46 40 106200 • Fax +46 40 396630 www.duni.com • Registration no: 556536‐7488
10
Consumer business area
1 April – 30 June
Net sales amounted to SEK 212 m (161). Adjusted for exchange rate changes, this corresponds to an increase in sales by 25.9%. The growth is explained by Paper+Design, which was acquired in June 2014 and, as from the next quarter, there will be no further structural effects resulting from the acquisition. Corrected for this, growth is stable as compared with last year. Napkins continue to be the dominant element in sales and it is also there that the increase in sales has been tangible during the quarter. There were fewer campaigns than last year, which benefited from occasions such as the football World Cup and a warm spring. Operating income was SEK ‐1 m (‐5) and the operating margin was ‐0.3% (‐3.2%). The second quarter is the seasonally least significant quarter for the business area, with few holidays and, in percentage terms, the lowest amount of sales. The improved result can be attributed to the acquisition of Paper+Design. Despite greater internal efficiency with, on the whole, a lower share of costs, the second quarter suffered from a disadvantageous product mix which primarily comprised simpler napkins, while the number of premium products within table coverings was lower. 1 January – 30 June
Net sales amounted to SEK 488 m (318). Adjusted for exchange rate changes, this corresponds to an increase in sales by 45.3%. The acquisition of Paper+Design is the most important explanation for the increase in sales. During the year, UK contributed most to the increase in sales as compared with comparable units. The Nordic region also initially had strong growth but, during the second quarter, encountered the transactions which were gradually secured during 2014. Like the Table Top business area, Germany shows a wavering trend during the year. The explanation is probably similar, that is to say a somewhat weaker market, but also includes greater competitive pressure. Operating income was SEK 23 m (1) and the operating margin was 4.7% (0.2%). Like the second quarter, the improvement during the year primarily reflects structural effects. For Consumer as well, it is important to balance the need for volume products with unique and high‐quality articles since these provide satisfactory coverage in production. Net sales, Consumer
3 months 3 months 3 months 6 months 6 months 6 months 12 months 12 months
SEK m
April‐ June 2015
April‐June
20151)
recalculated
April‐June 2014
January‐June 2015
January‐June
20151)
recalculated
January‐ June 2014
July‐June
2014/2015
January‐December
2014
Nordic region 33 32 32 73 72 59 161 147
Central Europe 145 138 113 343 322 234 739 630
South & East Europe 17 16 11 37 35 19 87 69
Rest of the World 17 17 5 34 33 6 72 43
Total 212 203 161 488 462 318 1 059 889
1) Reported net sales for 2015 recalculated at 2014 exchange rates.

Q2 | 2015
____________________________________________________________________________________________________________________________________________
Duni AB (publ) • P O Box 237 • SE‐201 22 Malmö • Sverige • Visiting address Östra Varvsgatan 9 A • Tel +46 40 106200 • Fax +46 40 396630 www.duni.com • Registration no: 556536‐7488
11
New Markets business area
1 April – 30 June
Net sales amounted to SEK 55 m (48). Adjusted for exchange rate changes, this corresponds to an increase in sales by 6.7%. The Russian market, which is one of the major markets in the business area, stabilized somewhat during the second quarter. Despite the fact that the restaurant market declined significantly in, above all, Moscow and in other major urban areas, Duni's sales as compared with last year are only marginally lower. Other markets, including Singapore, have had almost double digit growth during the quarter. Operating income was SEK 4 m (3) and the operating margin was 6.9% (5.6%). The program of measures which was instituted at the end of last year in order to respond to turbulence on the Russian market has had good results. The stabilization of the Russian ruble has also been an important factor since this is reflected in purchasing costs. The earnings for the business area have therefore increased at a rate consistent with general growth. 1 January – 30 June
Net sales amounted to SEK 102 m (91). Adjusted for exchange rate changes, this corresponds to an increase in sales by 4.2%. New Markets continues to be the business area (together with Meal Service) where high growth is expected and this has also been the case during the year. Asia continues to be a very important market outside of Europe, where Duni's concept regarding premium solutions for table setting is still in the initial stages. South America and the Middle East also continue to increase their shares, however from low levels. Operating income was SEK 7 m (0) and the operating margin was 6.9% (0.0%). For the full year, earnings are stronger as compared with last year. The above mentioned measures in Russia, including among other things price increases, have resulted in Russia stabilizing and having good prospects also in the medium‐long term. Other markets outside of Europe have had good growth during the first half of the year. Net sales, geographical split, New Markets
11%
51%
17%
6%
8%7%
Russia SingaporeMiddle East & North Africa South & Latin AmericaAsia & Oceania Other

Q2 | 2015
____________________________________________________________________________________________________________________________________________
Duni AB (publ) • P O Box 237 • SE‐201 22 Malmö • Sverige • Visiting address Östra Varvsgatan 9 A • Tel +46 40 106200 • Fax +46 40 396630 www.duni.com • Registration no: 556536‐7488
12
Materials & Services business area
1 April – 30 June
Net sales amounted to SEK 10 m (13). Adjusted for exchange rate changes, this corresponds to a decline in sales
by 22.3%. Hygiene business has been removed from this business area. In accordance with IFRS 5, the
discontinued operations are reported on a line below net income for the year. The continuing operations in the
business area comprise external sales of tissue and certain services.
Operating income was SEK 0 m (1) and the operating margin was 2.5% (10.1%). Earnings for the quarter are
somewhat lower than last year, and reflect the lower volumes.
1 January – 30 June
Net sales amounted to SEK 23 m (29). Adjusted for exchange rate changes, this corresponds to a decline in sales
by 21.2%. The customer base is significantly more limited when compared with the other business areas and the
somewhat lower sales partially reflect the fact that some of the sales during the first half of 2014 were delivered
to Paper+Design, which is now part of the Duni Group.
Operating income was SEK 1m (2) and the operating margin was 5.3% (8.5%).
Cash flow
The Group’s operating cash flow for the period 1 January – 30 June was SEK 208 m (122). Accounts receivable
amount to SEK 686 m (748); accounts payable amount to SEK 325 m (330); and inventory is valued at SEK 531 m
(531). Cash flow, including investing activities amounted to SEK 156 m (‐307). Last year includes the acquisition of
Paper+Design for SEK 397 m.
Net capital expenditures for the period for continuing operations amounted to SEK 47 m (32).
Amortization/depreciation for the period, for continuing operations was SEK 63 m (55). During the quarter, the
decision was taken to invest SEK 110 m in increased tissue capacity and new qualities. This investment has not,
however, encumbered the second quarter and the investment level for the period continues to be relatively low.
The Group’s interest‐bearing net debt as of 30 June 2015 was SEK 916 m, compared with SEK 1 164 on 30 June
2014. Net debt increased by SEK 80 m from last quarter, but declined by SEK 248 m from the same period last
year.
Financial net
The financial net for continuing operations for the period 1 January – 30 June was SEK ‐12 m (‐4). The translation
effects for the period were negative compared with positive effects last year.
Taxes
The total reported tax expense for the period 1 January – 30 June for continuing operations amounted to
SEK 47 m (41), yielding an effective tax rate of 25.4% (26.6%). The tax expense for the year includes adjustments
and non‐recurring effects from the previous year of SEK 0.2 m (‐4.3). The deferred tax asset relating to loss
carryforwards was utilized in the amount of SEK 19 m (19).
Earnings per share
The earnings per share for continuing operations before and after dilution amounted to SEK 2.94 (2.39).

Q2 | 2015
____________________________________________________________________________________________________________________________________________
Duni AB (publ) • P O Box 237 • SE‐201 22 Malmö • Sverige • Visiting address Östra Varvsgatan 9 A • Tel +46 40 106200 • Fax +46 40 396630 www.duni.com • Registration no: 556536‐7488
13
Duni’s share
As per 30 June 2015 the share capital amounted to SEK 58,748,790 divided into 46,999,032 shares, each with a
quotient value of SEK 1.25. Shareholders
Duni is listed on NASDAQ Stockholm under the ticker name "DUNI". Duni's three largest shareholders are Mellby
Gård Investerings AB (29.99%), Carnegie fonder (9.49%) and Polaris Capital Management, LLC (8.79%).
Personnel
On 30 June 2015 there were 2,094 (2,089) employees. 915 (903) of the employees were engaged in production.
Duni's production units are located in Bramsche and Wolkenstein in Germany, Poznan in Poland and Bengtsfors in
Sweden.
Acquisitions
No acquisitions were made during the period.
New establishment
No new establishments were carried out during the period.
Risk factors for Duni
A number of risk factors may affect Duni's operations in terms of both operational and financial risks. Operational
risks are normally handled by each operating unit and financial risks are managed by the Group's Treasury
department, which is included as a unit within the Parent Company. Operational risks
Duni is exposed to a number of operational risks which it is important to manage. The development of attractive
product ranges, particularly the Christmas collection, is extremely important in order for Duni to achieve good
sales and income growth. Duni addresses this issue by constantly developing its range. Approximately 25% of the
collection is replaced each year in response to, and to create new, trends. A weaker economy over an extended
period of time in Europe might lead to fewer restaurant visits, reduced consumption at consumer level and
increased price competition, which may affect volumes and gross margins. Fluctuations in prices of raw materials
and energy constitute an operational risk which may have a material impact on Duni's operating income. Financial risks
Duni’s finance management and its handling of financial risks are regulated by a finance policy adopted by the
Board of Directors. The Group divides its financial risks between currency risks, interest rate risks, credit risks,
financing and liquidity risks. These risks are controlled in an overall risk management policy which focuses on
unforeseen events on the financial markets and endeavors to minimize potential adverse effects on the Group’s
financial results. The risks for the Group are in all essential respects also related to the Parent Company. Duni's
management of financial risks is described in greater detail in the Annual Report as per 31 December 2014.
Duni's Contingent Liabilities have risen since the start of the year by SEK 26 m to SEK 82 m (56) due to a new
cashpool in Switzerland.
Transactions with related parties
No transactions with related parties took place during the second quarter of 2015.

Q2 | 2015
____________________________________________________________________________________________________________________________________________
Duni AB (publ) • P O Box 237 • SE‐201 22 Malmö • Sverige • Visiting address Östra Varvsgatan 9 A • Tel +46 40 106200 • Fax +46 40 396630 www.duni.com • Registration no: 556536‐7488
14
Major events during the period
A new three‐year loan agreement was signed on 15 April 2015.
On 17 June, a press release was issued announcing that Duni had decided to invest approximately SEK 110 m in an
upgrade of the two tissue machines in Skåpafors. The investment is being made in Duni's subsidiary, Rexcell
Tissue & Airlaid AB in Skåpafors, and will increase the capacity of the tissue machines by approximately 15% per
year. The plan is for the new technology to be installed during the second quarter of 2016.
Major events since 30 June
No significant events have occurred since the balance sheet date.
Interim reports
Quarter III 21 October, 2015
Quarter IV 12 February, 2016
Duni Board
All of the directors were reelected to Duni's Board of Directors at the Annual General Meeting held on 5 May.
Anders Bülow was reelected Chairman of the Board.
Parent Company
Net sales for the period 1 January – 30 June amounted to SEK 566 m (552). Income after financial items amounted
to SEK 0 m (‐2). The net debt was SEK ‐559 m (‐468), of which a net asset of SEK 1,385 m (1,569) is held by
subsidiaries. Net investments amounted to SEK 12 m (5).
Accounting principles
The interim report for the Group has been prepared in accordance with IAS 34 and the Swedish Annual Reports
Act. The parent company’ reporting is prepared in accordance with RFR 2, Reporting for Legal Entities, and the
Swedish Annual Reports Act. Accounting principles have been applied as reported for the Annual Report per 31
December 2014.
There is no holding without controlling influence in Duni.
Information in the report
The information is such that Duni AB (publ) is to publish in accordance with the Swedish Securities Markets Act
and/or the Financial Instruments Trading Act. The information will be submitted for publication on 10 July at 7.45
AM CET.
The interim report will be presented on Friday, 10 July at 10.00 AM CET at a telephone conference which also can
be followed via the web. To participate in the telephone conference, please dial +46 8 566 426 95. To follow the
presentation via the web, please visit this link:
http://event.onlineseminarsolutions.com/r.htm?e=1013382&s=1&k=D9CC3FB4F79D7DF4D6877E1D0EE2F10B
This report has been prepared in both a Swedish and an English version. In the event of any discrepancy between
the two, the Swedish version shall apply.
This report has not been the subject of an audit by the Company’s auditors.

Q2 | 2015
____________________________________________________________________________________________________________________________________________
Duni AB (publ) • P O Box 237 • SE‐201 22 Malmö • Sverige • Visiting address Östra Varvsgatan 9 A • Tel +46 40 106200 • Fax +46 40 396630 www.duni.com • Registration no: 556536‐7488
15
Report from the Board and the CEO
The Board and the CEO certify that this report provides a true and fair view of the Group’s financial position and results and describes the material risks and uncertainties facing the Group and the companies included in the Group.
Malmö, 9 July 2015
Anders Bülow, Chairman of the Board
Pauline Lindwall, Board Member Alex Myers, Board Member
Pia Rudengren, Board Member Magnus Yngen, Board Member
Per‐Åke Halvordsson, Employee representative PTK Henry Olsen, Employee representative LO
Thomas Gustafsson, President and CEO Additional information is provided by:
Thomas Gustafsson, President and CEO, +46 40 10 62 00 Mats Lindroth, CFO, +46 40 10 62 00 Tina Andersson, Corporate Marketing & Communication Director, +46 734 19 62 24
Duni AB (publ) Box 237 201 22 Malmö Tel.: +46 40 10 62 00 www.duni.com Registration no: 556536‐7488

Q2 | 2015
____________________________________________________________________________________________________________________________________________
Duni AB (publ) • P O Box 237 • SE‐201 22 Malmö • Sverige • Visiting address Östra Varvsgatan 9 A • Tel +46 40 106200 • Fax +46 40 396630 www.duni.com • Registration no: 556536‐7488
16
Consolidated Income Statements
3 months 3 months 6 months 6 months 12 months 12 months
April‐June
April‐June
January‐June
January‐ June
July‐June
January‐December
SEK m (Note 1) 2015 2014 2015 2014 2014/2015 2014
Net sales 1 002 922 1 987 1 739 4 118 3 870
Cost of goods sold ‐718 ‐669 ‐1 416 ‐1 252 ‐2 900 ‐2 736
Gross profit 284 253 571 487 1 219 1 134 Selling expenses ‐116 ‐112 ‐241 ‐225 ‐472 ‐456
Administrative expenses ‐60 ‐50 ‐117 ‐96 ‐232 ‐211
Research and development expenses ‐3 ‐2 ‐5 ‐5 ‐11 ‐11
Other operating incomes 0 8 7 5 6 4
Other operating expenses ‐9 ‐4 ‐17 ‐7 ‐37 ‐27
EBIT (Note 5) 97 92 198 158 473 433 Financial income 1 2 1 3 0 5
Financial expenses ‐8 ‐3 ‐13 ‐7 ‐27 ‐24
Net financial items ‐7 ‐1 ‐12 ‐4 ‐27 ‐19
Income after financial items 90 90 185 154 446 414
Income tax ‐22 ‐24 ‐47 ‐41 ‐119 ‐113
Net income for continuing operations 68 66 138 112 327 302
Net income for discontinued operations 1 7 4 11 11 18
Net income 69 73 142 124 338 319
Income attributable to:
Equity holders of the Parent Company 69 73 142 124 338 319
Earnings per share, continuing operations, SEK Before and after dilution 1.44 1.40 2.94 2.39 6.97 6.42
Earnings per share, discontinued operations, SEK Before and after dilution 0.02 0.14 0.09 0.24 0.22 0.38 Earnings per share, attributable to equity holders of the Parent Company, SEK
Before and after dilution 1.46 1.54 3.03 2.64 7.19 6.80
Average number of shares before and after dilution (´000) 46 999 46 999 46 999 46 999 46 999 46 999
Q2 | 2015
____________________________________________________________________________________________________________________________________________
Duni AB (publ) • P O Box 237 • SE‐201 22 Malmö • Sverige • Visiting address Östra Varvsgatan 9 A • Tel +46 40 106200 • Fax +46 40 396630 www.duni.com • Registration no: 556536‐7488
17
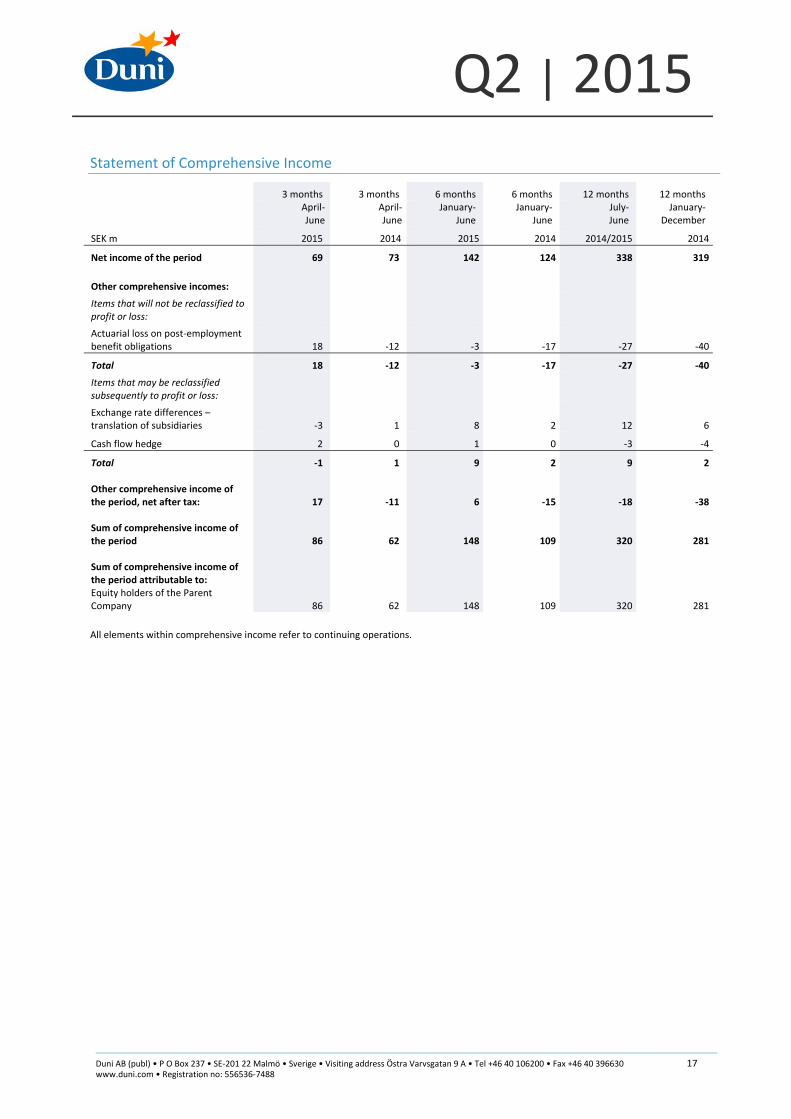
Statement of Comprehensive Income
3 months 3 months 6 months 6 months 12 months 12 months
April‐ June
April‐June
January‐June
January‐June
July‐ June
January‐December
SEK m 2015 2014 2015 2014 2014/2015 2014
Net income of the period 69 73 142 124 338 319
Other comprehensive incomes:
Items that will not be reclassified to profit or loss:
Actuarial loss on post‐employment benefit obligations 18 ‐12 ‐3 ‐17 ‐27 ‐40
Total 18 ‐12 ‐3 ‐17 ‐27 ‐40
Items that may be reclassified subsequently to profit or loss:
Exchange rate differences – translation of subsidiaries ‐3 1 8 2 12 6
Cash flow hedge 2 0 1 0 ‐3 ‐4
Total ‐1 1 9 2 9 2 Other comprehensive income of the period, net after tax: 17 ‐11 6 ‐15 ‐18 ‐38 Sum of comprehensive income of the period 86 62 148 109 320 281 Sum of comprehensive income of the period attributable to: Equity holders of the Parent Company 86 62 148 109 320 281
All elements within comprehensive income refer to continuing operations.
Q2 | 2015
____________________________________________________________________________________________________________________________________________
Duni AB (publ) • P O Box 237 • SE‐201 22 Malmö • Sverige • Visiting address Östra Varvsgatan 9 A • Tel +46 40 106200 • Fax +46 40 396630 www.duni.com • Registration no: 556536‐7488
18
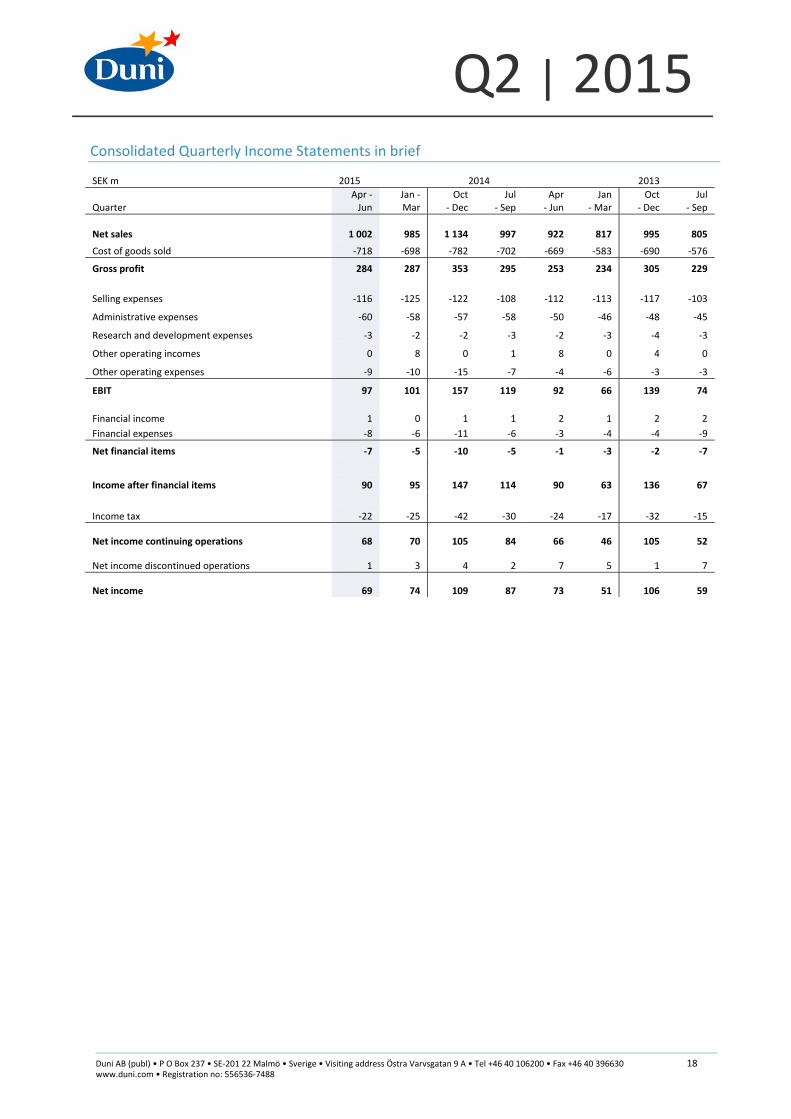
Consolidated Quarterly Income Statements in brief
SEK m 2015 2014 2013
Quarter Apr ‐Jun
Jan ‐Mar
Oct ‐ Dec
Jul‐ Sep
Apr ‐ Jun
Jan ‐ Mar
Oct‐ Dec
Jul‐ Sep
Net sales 1 002 985 1 134 997 922 817 995 805
Cost of goods sold ‐718 ‐698 ‐782 ‐702 ‐669 ‐583 ‐690 ‐576
Gross profit 284 287 353 295 253 234 305 229
Selling expenses ‐116 ‐125 ‐122 ‐108 ‐112 ‐113 ‐117 ‐103
Administrative expenses ‐60 ‐58 ‐57 ‐58 ‐50 ‐46 ‐48 ‐45
Research and development expenses ‐3 ‐2 ‐2 ‐3 ‐2 ‐3 ‐4 ‐3
Other operating incomes 0 8 0 1 8 0 4 0
Other operating expenses ‐9 ‐10 ‐15 ‐7 ‐4 ‐6 ‐3 ‐3
EBIT 97 101 157 119 92 66 139 74
Financial income 1 0 1 1 2 1 2 2
Financial expenses ‐8 ‐6 ‐11 ‐6 ‐3 ‐4 ‐4 ‐9
Net financial items ‐7 ‐5 ‐10 ‐5 ‐1 ‐3 ‐2 ‐7
Income after financial items 90 95 147 114 90 63 136 67
Income tax ‐22 ‐25 ‐42 ‐30 ‐24 ‐17 ‐32 ‐15
Net income continuing operations 68 70 105 84 66 46 105 52
Net income discontinued operations 1 3 4 2 7 5 1 7
Net income 69 74 109 87 73 51 106 59

Q2 | 2015
____________________________________________________________________________________________________________________________________________
Duni AB (publ) • P O Box 237 • SE‐201 22 Malmö • Sverige • Visiting address Östra Varvsgatan 9 A • Tel +46 40 106200 • Fax +46 40 396630 www.duni.com • Registration no: 556536‐7488
19
Consolidated Balance Sheet in brief
SEK m 30 June
2015 31 December
2014 30 June
2014
ASSETS
Goodwill 1 459 1 463 1 493
Other intangible fixed assets 289 311 273
Tangible fixed assets 825 851 835
Financial fixed assets 118 140 162
Total fixed assets 2 690 2 765 2 762
Inventories 531 503 531
Accounts receivables 686 743 748
Other operating receivables 93 112 108
Cash and cash equivalents 185 205 215
Total current assets 1 495 1 563 1 602
TOTAL ASSETS 4 185 4 328 4 364
SHAREHOLDERS’ EQUITY AND LIABILITIES
Shareholders’ equity 2 130 2 193 2 021
Long‐term loans 838 11 1 134
Other long‐term liabilities 384 388 345
Total long‐term liabilities 1 222 399 1 479
Accounts payable 325 341 330
Short‐term loans ‐ 818 ‐
Other short‐term liabilities 508 578 534
Total short‐term liabilities 833 1 737 864
TOTAL SHAREHOLDERS’ EQUITY AND LIABILITIES 4 185 4 328 4 364

Q2 | 2015
____________________________________________________________________________________________________________________________________________
Duni AB (publ) • P O Box 237 • SE‐201 22 Malmö • Sverige • Visiting address Östra Varvsgatan 9 A • Tel +46 40 106200 • Fax +46 40 396630 www.duni.com • Registration no: 556536‐7488
20
Change in the Group’s shareholders’ equity
Attributable to equity holders of the Parent Company
SEK m Share capital
Other injected capital Reserves
Cash flow reserves
Fair value reserve
1)
Profit carried forward incl. net income
for the period TOTAL EQUITY
Opening balance 1 January 2014 59 1 681 49 ‐1 13 298 2 099
Sum of comprehensive income of the period ‐ ‐ 2 0 ‐ 107 109
Dividend paid to shareholders ‐ ‐ ‐ ‐ ‐ ‐188 ‐188 Closing balance 30 June 2014 59 1 681 51 ‐1 13 217 2 020
Sum of comprehensive income of the period ‐ ‐ 4 ‐4 ‐ 172 172 Closing balance 31 December 2014 59 1 681 55 ‐5 13 389 2 193
Sum of comprehensive income of the period ‐ ‐ 8 1 ‐ 139 148
Dividend paid to shareholders ‐ ‐ ‐ ‐ ‐ ‐211 ‐211
Closing balance 30 June 2015 59 1 681 63 ‐4 13 318 2 130
1) Fair value reserve means a reappraisal of land in accordance with earlier accounting principles. The reappraised value is adopted as the acquisition value in accordance with the transition rules in IFRS 1.

Q2 | 2015
____________________________________________________________________________________________________________________________________________
Duni AB (publ) • P O Box 237 • SE‐201 22 Malmö • Sverige • Visiting address Östra Varvsgatan 9 A • Tel +46 40 106200 • Fax +46 40 396630 www.duni.com • Registration no: 556536‐7488
21
Consolidated Cash Flow Statement
1) Loans and amortizations, within the credit facility, are reported gross for duration above 3 months according to IAS 7.
*Acquisitions consist of payment of shares and repayment of shareholder loans.
SEK m 1 January – 30 June
2015 1 January – 30 June
2014
Current operation Operating income continuing operations 198 158
Adjusted for items not included in cash flow etc. 72 24
Paid interest and tax ‐29 4
Change in working capital ‐49 ‐77
Discontinued operations 16 14
Cash flow from operations 208 122
Investments
Acquisitions of fixed assets continuing operations ‐52 ‐32
Sales of fixed assets 0 0
Acquisitions* ‐ ‐397
Change in interest‐bearing receivables 0 0
Cash flow from investments ‐52 ‐429
Financing
Taken up loans1) 130 967
Amortization of debt1) ‐94 ‐492
Dividend paid ‐211 ‐188
Change in borrowing ‐1 8
Cash flow from financing ‐176 295
Cash flow from the period ‐20 ‐12
Liquid funds, operating balance 205 225
Exchange difference, cash and cash equivalents 0 2
Cash and cash equivalents, closing balance 185 215

Q2 | 2015
____________________________________________________________________________________________________________________________________________
Duni AB (publ) • P O Box 237 • SE‐201 22 Malmö • Sverige • Visiting address Östra Varvsgatan 9 A • Tel +46 40 106200 • Fax +46 40 396630 www.duni.com • Registration no: 556536‐7488
22
Key ratios in brief
1) Calculated based on operating income.
2) Calculated based on the last twelve months.
1 January –30 June
2015 Continuing operations
1 January –30 June
2015 Duni total
1 January ‐ 30 June
2014 Continuing operations
1 January ‐30 June
2014 Duni total
Net sales, SEK m 1 987 2 067 1 739 1 937
Gross profit, SEK m 571 577 487 502
Operating income, SEK m 1) 211 216 159 174
EBITDA, SEK m 1) 274 280 215 230
Net debt 916 916 1 164 1 164
Number of employees 2 094 2 094 2 089 2 089
Sales growth 14.3% 6.7% 12.2 % 9.7%
Gross margin 28.8% 27.9% 28.0 % 25.9%
Operating margin 2) 10.6% 10.5% 9.2 % 9.0%
EBITDA margin2) 13.8% 13.5% 12.3 % 11.9%
Return on capital employed1)2)
17.2% 17.7% 12.9 % 13.7%
Net debt / equity ratio 43.0% 43.0% 57.6 % 57.6%
Net debt / EBITDA1)2)
1.45 1.42 2.36 2.20

Q2 | 2015
____________________________________________________________________________________________________________________________________________
Duni AB (publ) • P O Box 237 • SE‐201 22 Malmö • Sverige • Visiting address Östra Varvsgatan 9 A • Tel +46 40 106200 • Fax +46 40 396630 www.duni.com • Registration no: 556536‐7488
23
Parent Company Income Statements in brief
SEK m (Note 1)
3 monthsApril‐ June
2015
3 monthsApril‐ June
2014
6 months January‐June
2015
6 monthsJanuary‐June
2014
Net sales 287 283 566 552
Cost of goods sold ‐250 ‐249 ‐498 ‐492
Gross profit 37 33 69 59
Selling expenses ‐32 ‐34 ‐63 ‐65
Administrative expenses ‐38 ‐35 ‐75 ‐67
Research and development expenses ‐1 ‐1 ‐3 ‐3
Other operating incomes 60 56 116 104
Other operating expenses ‐41 ‐40 ‐80 ‐79
EBIT ‐16 ‐22 ‐37 ‐51
Revenue from participations in Group Companies 30 40 30 40
Other interest revenue and similar income 9 8 18 15
Interest expenses and similar expenses ‐9 ‐1 ‐12 ‐6
Net financial items 31 47 37 49
Income after financial items 15 25 0 ‐2
Taxes on income for the period ‐2 ‐8 ‐5 ‐8
Net income for the period 13 17 ‐5 ‐9
Parent Company Statement of Comprehensive Income
SEK m
3 monthsApril‐ June
2015
3 monthsApril‐ June
2014
6 months January‐ June
2015
6 monthsJanuary‐ June
2014
Net income of the period 13 17 ‐5 ‐9
Other comprehensive income1):
Items that may be reclassified subsequently to profit or loss:
Exchange rate differences – translation of subsidiaries 1 ‐1 2 ‐1
Cash flow hedge 2 0 1 0
Total 3 ‐1 3 ‐1
Other comprehensive income of the period, net after tax: 3 ‐1 3 ‐1
Sum of comprehensive income of the period 16 16 ‐1 ‐10 Sum of comprehensive income of the period attributable to:
Equity holders of the Parent Company 16 16 ‐1 ‐10
1) The Parent company does not have any items that will “not be reclassified to profit or loss”.

Q2 | 2015
____________________________________________________________________________________________________________________________________________
Duni AB (publ) • P O Box 237 • SE‐201 22 Malmö • Sverige • Visiting address Östra Varvsgatan 9 A • Tel +46 40 106200 • Fax +46 40 396630 www.duni.com • Registration no: 556536‐7488
24
Parent Company Balance Sheet in Brief
SEK m 30 June
2015 31 December
2014 30 June
2014
ASSETS
Goodwill 150 200 250
Other intangible fixed assets 28 29 29
Total intangible fixed assets 178 229 279 Tangible fixed assets 34 31 33
Financial fixed assets 2 451 2 513 2 539
Total fixed assets 2 663 2 773 2 851
Inventories 83 93 94
Accounts receivable 110 96 111
Other operating receivables 155 186 218
Cash and bank 107 140 129
Total current assets 455 515 552
TOTAL ASSETS 3 118 3 288 3 403
SHAREHOLDERS’ EQUITY AND LIABILITIES
Total restricted shareholders’ equity 83 83 83
Total unrestricted shareholders’ equity 1 595 1 808 1 670
Shareholders’ equity 1 678 1 891 1 753
Provisions 106 107 109
Long‐term financial liabilities 828 ‐ 1 121
Other long‐term liabilities 4 ‐ ‐
Total long‐term liabilities 832 0 1 121
Accounts payable 53 64 58
Short‐term loans ‐ 818 ‐
Other short‐term liabilities 449 408 361
Total short‐term liabilities
502 1 290 419
TOTAL SHAREHOLDERS’ EQUITY, PROVISIONS AND LIABILITIES 3 118 3 288 3 403
Q2 | 2015
____________________________________________________________________________________________________________________________________________
Duni AB (publ) • P O Box 237 • SE‐201 22 Malmö • Sverige • Visiting address Östra Varvsgatan 9 A • Tel +46 40 106200 • Fax +46 40 396630 www.duni.com • Registration no: 556536‐7488
25
Definitions Cost of goods sold: Cost of goods sold including production and logistic costs. Gross margin: Gross profit as a percentage of net sales. Operating income: operating income adjusted for restructuring costs, non‐realized valuation effects of currency derivatives, fair value allocations and amortization of intangible assets identified in connection with business acquisitions. EBIT: Reported operating income. EBIT margin: EBIT as a percentage of net sales. EBITA: Operating income before amortization of intangible assets. EBITDA: Operating income before depreciation and impairment of fixed assets. EBITDA margin: EBITDA as a percentage of net sales. Capital employed: Non‐interest bearing fixed assets and current assets, excluding deferred tax assets, less non‐interest bearing liabilities. Return on capital employed: Operating income as a percentage of capital employed. Return on shareholders’ equity: Net income as a percentage of shareholders’ equity. Number of employees: The number of employees at end of period. Currency adjusted: Figures adjusted for changes in exchange rates related to consolidation. Figures for 2015 are calculated at exchange rates for 2014. Effects of translation of balance sheet items are not included. Earnings per share: Net income divided by the average number of shares. Net Interest‐bearing debt: Interest‐bearing liabilities and pensions less cash and cash equivalents and interest‐bearing receivables. HoReCa: Abbreviation for hotels, restaurants and catering. Private label: Products marketed under customer’s own label.

Q2 | 2015
____________________________________________________________________________________________________________________________________________
Duni AB (publ) • P O Box 237 • SE‐201 22 Malmö • Sverige • Visiting address Östra Varvsgatan 9 A • Tel +46 40 106200 • Fax +46 40 396630 www.duni.com • Registration no: 556536‐7488
26
Notes
Note 1 • Accounting and valuation principles
Since January 1, 2005, Duni applies International Financial Reporting Standards (IFRS) as adopted by the European Union. For transition effects see notes 45 and 46 in the Annual Report of 30 June 2007.
This interim report has been prepared in accordance with IAS 34, Interim Reporting. The consolidated financial statements have been prepared in accordance with IFRS as adopted by the EU and with the related reference to Chapter 9 of the Annual Accounts Act. The parent company’s financial statements are prepared in accordance with RFR 2, Reporting for Legal Entities, and the Annual Accounts Act. The accounting principles are the same as in the Annual Report as per 31 December 2014.
Note 2 • Financial assets and liabilities
Duni has derivative instruments valued at fair value and held for hedging purposes; all derivative instruments are classified on level 2. Level 2 derivative instruments consist of currency forward contracts and interest rate swaps, which are used for hedging purposes. Valuation of currency forward contracts at fair value is based on published futures prices on an active market. The valuation of interest rate swaps is based on futures interest rates produced based on observable yield curves. The discounting has no material impact on the valuation of derivative instruments on level 2. No financial assets or liabilities have been moved between the valuation categories. The valuation techniques are unchanged during the year.
As described in greater detail in the Annual Report per 31 December 2014, the financial assets and liabilities comprise items with short terms to maturity. Thus, the fair value is considered in all essential respects to correspond to the book value.
Note 3 • Discontinued operations
On 28 March 2015, production of hygiene products in Skåpafors ceased. The hygiene business which was previously reported in the Materials & Services business area are reported as from the second quarter of 2015 as discontinued operations. This affects only the income statement which has been recalculated from 2013 to show continued operations. Discontinued operations are reported on a separate line following net income for continuing operations.
Note 4 • Segment reporting, SEK m
April – June
2015‐04‐01 – 2015‐06‐30 Table Top Meal Service Consumer New Markets Materials & Services
Continuing operations
Total net sales 563 163 212 55 147 1 140
Net sales from other segments ‐ ‐ ‐ 0 137 137
Net sales from external customers 563 163 212 55 10 1 002
Operating income 87 13 ‐1 4 0 104
EBIT 97
Net financial items ‐7
Income after financial items 90

Q2 | 2015
____________________________________________________________________________________________________________________________________________
Duni AB (publ) • P O Box 237 • SE‐201 22 Malmö • Sverige • Visiting address Östra Varvsgatan 9 A • Tel +46 40 106200 • Fax +46 40 396630 www.duni.com • Registration no: 556536‐7488
27
2014‐04‐01 – 2014‐06‐30 Table Top Meal Service Consumer New Markets Materials & Services
Continuing operations
Total net sales 552 148 161 48 144 1 053
Net sales from other segments ‐ ‐ ‐ ‐ 131 131
Net sales from external customers 552 148 161 48 13 922
Operating income 87 7 ‐5 3 1 93
EBIT 92
Net financial items ‐1
Income after financial items 90
January – June
2015‐01‐01 – 2015‐06‐30 Table Top Meal Service Consumer New Markets Materials & Services
Continuing operations
Total net sales 1 075 299 488 102 303 2 267
Net sales from other segments ‐ ‐ ‐ 0 280 280
Net sales from external customers 1 075 299 488 102 23 1 987
Operating income 165 15 23 7 1 211
EBIT 198
Net financial items ‐12
Income after financial items 185
2014‐01‐01 – 2014‐06‐30 Table Top Meal Service Consumer New Markets Materials & Services
Continuing operations
Total net sales 1 030 271 318 91 300 2 010
Net sales from other segments ‐ ‐ ‐ ‐ 271 271
Net sales from external customers 1 030 271 318 91 29 1 739
Operating income 150 6 1 0 2 159
EBIT 158
Net financial items ‐4
Income after financial items 154
No material changes have taken place in the segments’ assets compared with the annual report of 31 December 2014.
Quarterly overview, by segment:
Net sales SEK m
Q2 2015
Q1 2015
Q4 2014
Q3 2014
Q2 2014
Q1 2014
Q4 2013
Q3 2013
Table Top 563 513 604 545 552 477 576 497
Meal Service 163 136 144 140 148 123 132 126
Consumer 212 276 322 249 161 157 220 123
New Markets 55 47 54 50 48 43 56 47
Materials & Services1) 10 13 10 13 13 16 12 11
Continuing operations 1 002 985 1 134 997 922 817 995 805
Discontinued operations 20 61 77 103 95 104 107 131
Duni total 1 022 1 046 1 211 1 100 1 017 921 1 102 936

Q2 | 2015
____________________________________________________________________________________________________________________________________________
Duni AB (publ) • P O Box 237 • SE‐201 22 Malmö • Sverige • Visiting address Östra Varvsgatan 9 A • Tel +46 40 106200 • Fax +46 40 396630 www.duni.com • Registration no: 556536‐7488
28
1) For continuing operations.
Note 5 • Reporting of restructuring costs
Presented below is a specification of the lines on which restructuring costs are reported in the income statement.
Restructuring costs SEK m
3 monthsApril‐June 2015
3 monthsApril‐June 2014
6 monthsJanuary‐
June 2015
6 months January‐
June 2014
12 months July‐ June
2014/2015
12 monthsJanuary‐
December 2014
Cost of goods sold ‐ ‐1 ‐ ‐1 ‐ ‐1
Selling expenses 0 ‐2 0 ‐2 0 ‐2
Administrative expenses ‐ ‐ ‐ ‐ ‐ ‐
Other operating expenses/income ‐ 2 ‐ 2 0 2
Total 0 0 0 0 0 0
All restructuring costs refer to continuing operations.
Operating income SEK m
Q2 2015
Q1 2015
Q4 2014
Q3 2014
Q2 2014
Q1 2014
Q4 2013
Q3 2013
Table Top 87 77 126 97 87 64 116 78
Meal Service 13 2 6 8 7 ‐1 4 3
Consumer ‐1 24 32 22 ‐5 6 27 ‐4
New Markets 4 3 0 1 3 ‐3 3 2
Materials & Services1) 0 1 1 1 1 1 0 1
Continuing operations 104 107 164 129 93 67 150 79
Discontinued operations 1 4 5 3 8 6 1 8
Duni total 105 112 169 132 101 73 152 88