Presentation3 First Quarter 2016 Financial Results Quarter 2016 Financial Results April 29, ... Q1...
22
[ C L I E N T N A M E ] Presentation3 Conference Call First Quarter 2016 Financial Results April 29, 2016
-
Upload
trinhxuyen -
Category
Documents
-
view
217 -
download
0
Transcript of Presentation3 First Quarter 2016 Financial Results Quarter 2016 Financial Results April 29, ... Q1...

[ C L I E N T N A M E ]
Presentation3
1237395-001.pptx
Conference Call First Quarter 2016 Financial Results
April 29, 2016

[ C L I E N T N A M E ]
Agenda

[ C L I E N T N A M E ]
Presentation3
1237395-001.pptx
Q1 2016 Milestones
Agenda 179.31.36
106.107.109
8.144.70
40.44.109
144.28.83
243.165.30
218.70.38
14.116.118
Q1 2016 Highlights 3
4
Financial Overview 6
Guidance 7
Business & Operating Review 5
Q&A 8
Where Are We In 2016? 1
Efficiency Management Division Kick-Off 2
Appendix 9
3

[ C L I E N T N A M E ]
Presentation3
1237395-001.pptx
Where Are We In 2016? 179.31.36
106.107.109
8.144.70
40.44.109
144.28.83
243.165.30
218.70.38
14.116.118
1
FOCUS ON EFFICIENCIES & STREAMLINING
OPERATIONS
Continuous cost-saving & expense-reduction programs across all businesses
Turnaround of Argentina operation
B
Kick-off of a new Efficiency Management Division reporting directly to the CEO
Argentina already yielding positive EBITDA
STRENGTHEN FINANCIAL METRICS
Decrease overall debt levels to maintain our “Investment Grade” status
Reduce interest expense and limit FX exposure and volatility to stabilize Net Income
Push for efficiencies in Working Capital to boost Free Cash Flow & pay down debt
A Net Debt/EBITDA Ratio reduced to
2.65x
USD-denominated Debt reduced to 13.3% of Total Debt
Net Margin totaled 3.9% during Q1 16’ (+2.6 p.p. YoY)
Reduction in Cash Conversion Cycle from 61.7 days in Q4 14’ to 55.1 days in Q1 16’
Objective Update Strategy
Proactive Implementation of our Corporate Strategy to Strengthen Alicorp’s Financial Standing
4

[ C L I E N T N A M E ]
Presentation3
1237395-001.pptx
Efficiency Management Division Kick-Off 179.31.36
106.107.109
8.144.70
40.44.109
144.28.83
243.165.30
218.70.38
14.116.118
2
5
“CONTINUOUS CHANGE
WORKSTREAM”
Achieve short-term and medium –term efficiencies via
o Promote efficiencies-driven culture through all organizational levels
o Right-Sizing of cost and SG&A structures across all business units
o Redesign of business process and cost optimization across all countries
A
“STRUCTURAL CHANGE
WORKSTREAM”
Achieve operational excellence and become a benchmark player for LatAm consumer companies
o Disciplined focus on capital allocation and ROIC
o Scale-down & divestiture of underperforming assets
B
“It’s not Short-Term Cost Cutting, it’s Changing the Company’s DNA on How We Think About Expenses and Investments to Achieve Smart Long-Term Growth”
“SMART LONG-TERM GROWTH”
Achieved savings will be directed to:
o Continuous investment in new and existing talent across all business units
o Increased investment in “high- growth / high- margin” assets and brands
o Increase overall quality and value proposition of our portfolio

[ C L I E N T N A M E ]
Presentation3
1237395-001.pptx
Q1 2016 Highlights 179.31.36
106.107.109
8.144.70
40.44.109
144.28.83
243.165.30
218.70.38
14.116.118
3
Revenues amounted to S/ 1,437.7 million in Q1 16‘, decreasing 4.7% YoY, due to lower Revenues from our Consumer Goods International division and our Aquaculture business
Nevertheless, our Peruvian operation remains strong with both our Consumer Goods Peru division and B2B Business achieving a 3.8% YoY and a 2.1% YoY Revenue growth, respectively
EBITDA amounted to S/ 163.3 million while EBITDA Margin reached 11.4% in Q1 16’, an increase of S/ 13.8 million YoY and 1.5 p.p. YoY, respectively
Net income reached S/ 56.6 million in Q1 16’, an increase of S/ 36.8 million YoY on the back of significant reductions in Interest Expense and FX hedging, in line with our debt reduction program. Net Margin resulted in 3.9% in Q1 16’, an increase of 2.6 p.p. YoY
We continued to reduce our overall leverage, achieving a Net Debt-to-EBITDA ratio of 2.65x
6
[ C L I E N T N A M E ]
Presentation3
1237395-001.pptx
Q1 2016 Milestones 179.31.36
106.107.109
8.144.70
40.44.109
144.28.83
243.165.30
218.70.38
14.116.118
4
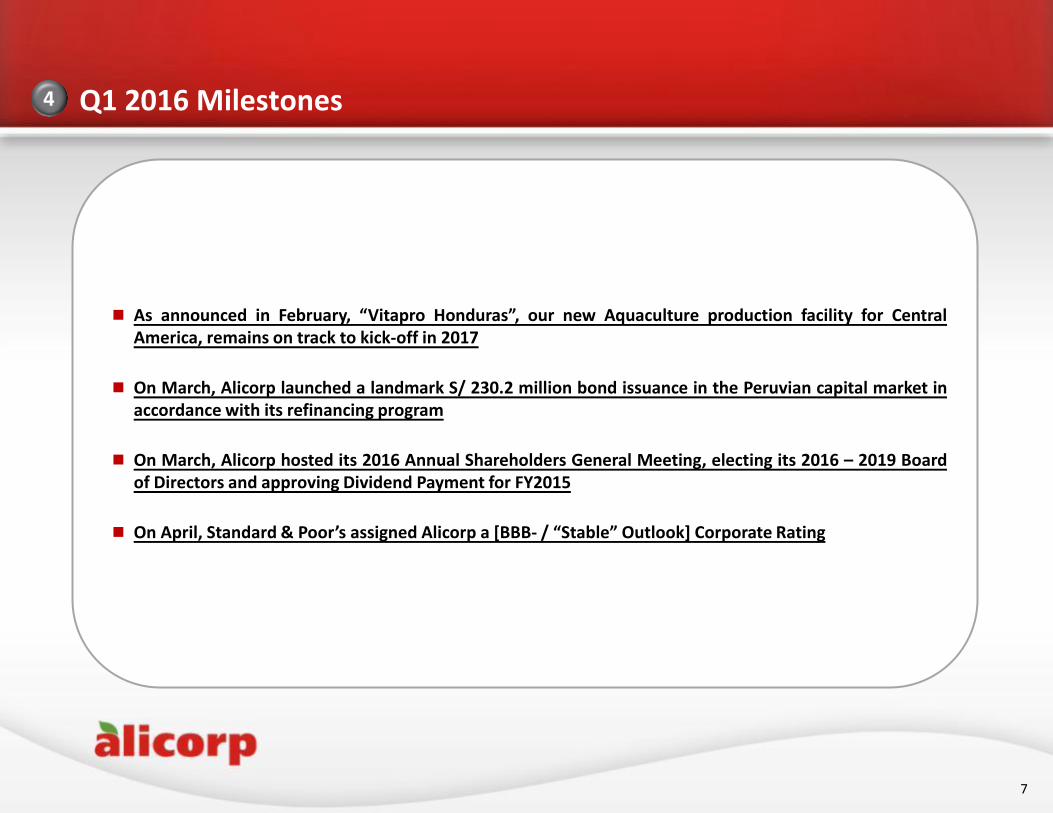
As announced in February, “Vitapro Honduras”, our new Aquaculture production facility for Central America, remains on track to kick-off in 2017
On March, Alicorp launched a landmark S/ 230.2 million bond issuance in the Peruvian capital market in accordance with its refinancing program
On March, Alicorp hosted its 2016 Annual Shareholders General Meeting, electing its 2016 – 2019 Board of Directors and approving Dividend Payment for FY2015
On April, Standard & Poor’s assigned Alicorp a [BBB- / “Stable” Outlook] Corporate Rating
7
[ C L I E N T N A M E ]
Presentation3
1237395-001.pptx
1,509 1,639 1,699 1,734
1,438
27.5% 28.0% 29.5%
28.4% 30.4%
Q1 15' Q2 15' Q3 15' Q4 15' Q1 16'
1,390 1,509 1,438
6,283 6,580 6,509
26.2% 27.5% 30.4% 27.2% 28.4% 29.0%
Q1 14' Q1 15' Q1 16' FY2014 FY2015 LTM
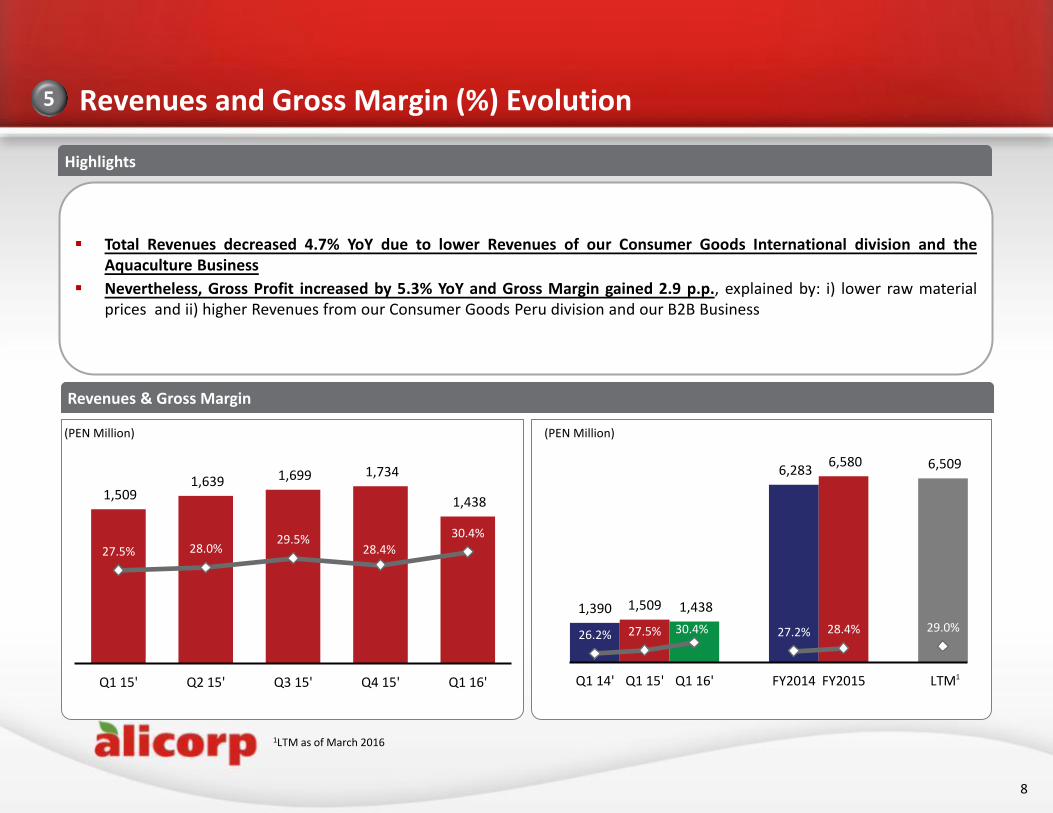
Revenues and Gross Margin (%) Evolution 5
Revenues & Gross Margin
(PEN Million) (PEN Million)
Total Revenues decreased 4.7% YoY due to lower Revenues of our Consumer Goods International division and the Aquaculture Business
Nevertheless, Gross Profit increased by 5.3% YoY and Gross Margin gained 2.9 p.p., explained by: i) lower raw material prices and ii) higher Revenues from our Consumer Goods Peru division and our B2B Business
1LTM as of March 2016
1
8
Highlights
[ C L I E N T N A M E ]
Presentation3
1237395-001.pptx
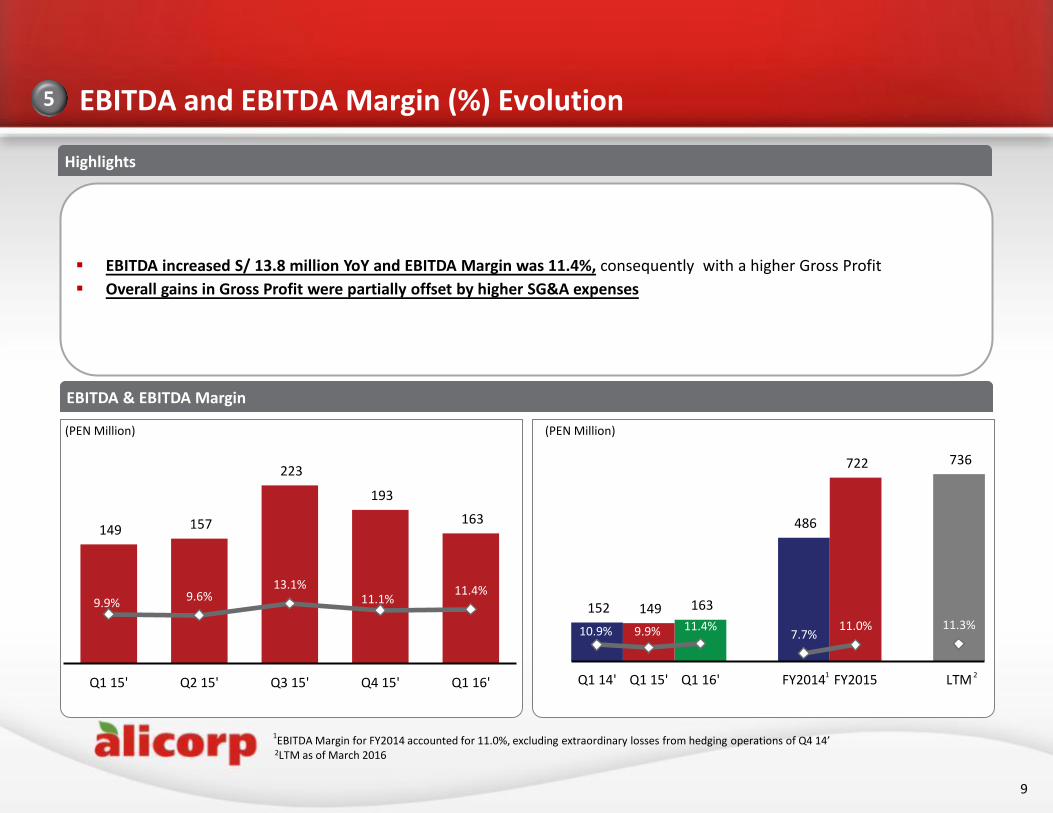
EBITDA and EBITDA Margin (%) Evolution 5
EBITDA & EBITDA Margin
1EBITDA Margin for FY2014 accounted for 11.0%, excluding extraordinary losses from hedging operations of Q4 14’
2LTM as of March 2016
1
EBITDA increased S/ 13.8 million YoY and EBITDA Margin was 11.4%, consequently with a higher Gross Profit
Overall gains in Gross Profit were partially offset by higher SG&A expenses
(PEN Million) (PEN Million)
2
152 149 163
486
722 736
10.9% 9.9% 11.4% 7.7%
11.0% 11.3%
Q1 14' Q1 15' Q1 16' FY2014 FY2015 LTM
9
149 157
223
193
163
9.9% 9.6% 13.1%
11.1% 11.4%
Q1 15' Q2 15' Q3 15' Q4 15' Q1 16'
Highlights

[ C L I E N T N A M E ]
Presentation3
1237395-001.pptx
Consumer Goods Peru 5
Revenues increased 3.8% YoY with Volume flat at -0.2% YoY underpinned by our brand positioning strategy which enabled us to increase our value share in key categories such as detergents and laundry soaps as well as high-growth categories such as red sauces
Consequently, Revenue growth coupled with gains in Gross Margin resulted in an EBITDA of S/ 92.6 million (+9.3% YoY) while EBITDA margin increased 2.2 p.p. YoY to 16.9%
Additionally, we launched and revamped 2 new products for our juice powder and softeners categories
Revenues and EBITDA Margin
(PEN Million) (PEN Million)
1
528 592
650 654
548
14.7% 15.3% 18.0% 16.5% 16.9%
Q1 15' Q2 15' Q3 15' Q4 15' Q1 16'
497 528 548
2,298 2,424 2,444
12.0% 14.7% 16.9% 14.9% 16.2% 16.7%
Q1 14' Q1 15' Q1 16' FY2014 FY2015 LTM 1
1LTM as of March 2016
10
Highlights

[ C L I E N T N A M E ]
Presentation3
1237395-001.pptx
Consumer Goods International 5
Results in Argentina and Brazil continued to be impacted by currency headwinds, with Revenues decreasing 17.7% YoY and Volume declining 8.0% YoY
EBITDA reached S/ 6.7 million with EBITDA margin decreasing 2.0 p.p. to 2.6%
Revenues in Argentina declined 19.9% YoY (Revenues increased 18.5% in ARS), while EBITDA increased S/ 8.2 million YoY
In Brazil, Revenues declined 20.7% YoY, while Volume decreased 7.4% YoY. Revenues in BRL decreased 4.5% YoY due to logistics issues following a new ERP software implementation
(PEN Million) (PEN Million)
2
312 333 317 317
257
4.6% 5.7%
5.2% 7.8%
2.6%
Q1 15' Q2 15' Q3 15' Q4 15' Q1 16'
298 312 257
1,264 1,280 1,225
3.1% 4.6% 2.6% 3.4% 5.8% 5.5%
Q1 14' Q1 15' Q1 16' FY2014 FY2015 LTM
1LTM as of March 2016
1
11
Highlights
Revenues and EBITDA Margin

[ C L I E N T N A M E ]
Presentation3
1237395-001.pptx
B2B Branded Products 5
Revenues increased 2.1% YoY and Volume increased 4.9% YoY
EBITDA increased S/ 6.0 million (20.7% YoY) and EBITDA margin reached 10.3%, mainly explained by lower raw material prices and additional Quinoa inventory adjustments1 to its net realizable value
Our Bakeries platform continued to increase Volume (+3.1% YoY), while Revenues decreased 2.9% YoY due to: i) lower prices, ii) higher competition and iii) the low-tier segment strengthening strategy in the industrial flour category
Revenues and Volume for our Food Service platform increased 8.4% YoY and 7.1% YoY, respectively, as we continue to increase our client base as well as strengthening our go-to-market strategy. EBITDA was S/20.2 million (+46.5% YoY), while EBITDA margin was 16.0%
Highlights
(PEN Million) (PEN Million)
329 331 338
1,471 1,459 1,466
10.7% 8.8% 10.3% 10.9%
7.3% 7.6%
Q1 14' Q1 15' Q1 16' FY2014 FY2015 LTM2
1Not considering this effect, EBITDA margin would have been 12.1% 2LTM as of March 2016
331 357
394 376 338
8.8% 8.3% 9.0%
3.2%
10.3%
Q1 15' Q2 15' Q3 15' Q4 15' Q1 16'
12
Revenues and EBITDA Margin

[ C L I E N T N A M E ]
Presentation3
1237395-001.pptx
Aquaculture 5
Revenues decreased 12.8% and Volume decreased 17.9% YoY explained by “El Niño” environmental phenomenon
In Ecuador, Revenues and Volume decreased as shrimp farmers lowered their production as a precaution to the negative effects of a more intense “El Niño”
In Chile, higher temperatures resulted in harmful algae bloom that affected the salmon production industry
EBITDA reached S/ 31.6 million and EBITDA margin was 10.7%, a decrease of 2.4 p.p. compared to Q1 15’, due to lower Volume and an allowance for accounts receivable in Chile1
Highlights
338 356 337
387
295
13.1% 13.7% 13.8% 13.2% 10.7%
Q1 15' Q2 15' Q3 15' Q4 15' Q1 16'
266 338 295
1,248
1,418 1,374
15.4%
13.1% 10.7% 13.7% 13.5% 13.0%
Q1 14' Q1 15' Q1 16' FY2014 FY2015 LTM
(PEN Million) (PEN million)
1EBITDA margin without this effect would have been 13.0% for the Aquaculture Business 2LTM as of March 2016
2
13
Revenues and EBITDA Margin

[ C L I E N T N A M E ]
Presentation3
1237395-001.pptx
6
Main Drivers of Cash Flow Evolution
Cash Flow Build Up as of March 2016
(PEN Million)
1Includes PP&E, acquisitions, software and other investment activities
2Includes FX Translation effect of S/2.1 million
112.5
175.9
64.1
-
-
81.5 0.9
11.9
2.2 29.9
39.1
Net Cashon Dec-15
Cash generatedfrom operations
Taxes Other expensesfrom operations
InvestmentActivities
Debt Interest Payment Other financialactivities
Net Cashon Mar-16
1
Cash Flow from Operations S/ 50.0
Cash Flow from Financing S/ 43.32 Cash Flow from Investing S/ -29.9
2
Cash Flow from Operations was S/ 50.0 million, S/ 278.7 million lower than Q1 15’ due to i) lower sales, and ii) a decrease in accounts payable days
Cash Flow from Investing disbursement was S/ 29.9 million, of which S/ 33.9 million were used for CAPEX, compared to S/ 39.8 million during the same period of 2015
Cash Flow from Financing was S/ 45.4 million, compared to S/ -280.9 million as of Q1 15’, due to an increase in debt, partly offset by lower interest expenses
Highlights
14
[ C L I E N T N A M E ]
Presentation3
1237395-001.pptx
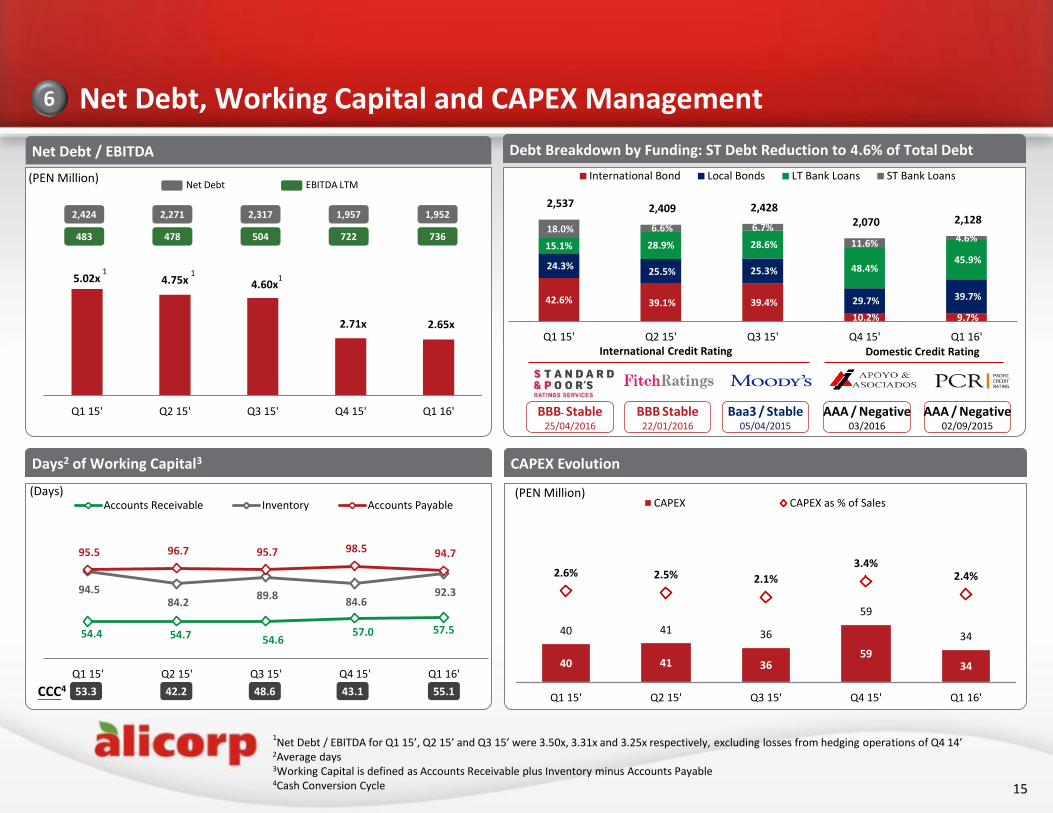
Net Debt, Working Capital and CAPEX Management 6
54.4 54.7 54.6 57.0 57.5
94.5 84.2
89.8 84.6
92.3
95.5 96.7 95.7 98.5 94.7
Q1 15' Q2 15' Q3 15' Q4 15' Q1 16'
Accounts Receivable Inventory Accounts Payable
Days2 of Working Capital3
(Days)
53.3 43.1 48.6 42.2 CCC4 55.1
CAPEX Evolution
40 41 36 59
34
40 41 36
59
34
2.6% 2.5% 2.1%
3.4% 2.4%
Q1 15' Q2 15' Q3 15' Q4 15' Q1 16'
CAPEX CAPEX as % of Sales(PEN Million)
Debt Breakdown by Funding: ST Debt Reduction to 4.6% of Total Debt
42.6% 39.1% 39.4%
10.2% 9.7%
24.3% 25.5% 25.3%
29.7% 39.7%
15.1% 28.9% 28.6%
48.4% 45.9%
18.0% 6.6% 6.7%
11.6% 4.6%
2,537 2,409 2,428 2,070 2,128
Q1 15' Q2 15' Q3 15' Q4 15' Q1 16'
International Bond Local Bonds LT Bank Loans ST Bank Loans
BBB Stable 22/01/2016
International Credit Rating
Baa3 / Stable 05/04/2015
AAA / Negative 03/2016
Domestic Credit Rating
AAA / Negative 02/09/2015
Net Debt / EBITDA
5.02x 4.75x 4.60x
2.71x 2.65x
Q1 15' Q2 15' Q3 15' Q4 15' Q1 16'
2,271
478
2,317
504
1,957
722
2,424
483
1
(PEN Million)
1
1
Net Debt EBITDA LTM
1,952
736
1Net Debt / EBITDA for Q1 15’, Q2 15’ and Q3 15’ were 3.50x, 3.31x and 3.25x respectively, excluding losses from hedging operations of Q4 14’
2Average days 3Working Capital is defined as Accounts Receivable plus Inventory minus Accounts Payable
4Cash Conversion Cycle
BBB- Stable 25/04/2016
15

[ C L I E N T N A M E ]
Presentation3
1237395-001.pptx
Alicorp’s Refinancing Program for 2016 6
1Debt after swap
2Only 2.2% of Total Debt has FX exposure to USDPEN depreciation
78 203 168 152
116 70
160 207
281 310 404 222
45
367 50 100 100 100 100 50
2016 2017 2018 2019 2020 2023 2025 2026 2027 2028 2029 2030
ST Loans LT Loans Local Bonds International Bond
240
274
174 116
514
290 405
104 45
212 50 100 100 100 100 50
2016 2017 2018 2019 2020 2023 2025 2026 2027 2028 2029 2030
11.6%
77.5%
7.1% 3.8%
USD
PEN
BRL
ARS
December 2015: Total Debt: S/ 2.1 billion (PEN million) December 2015
March 2016: Total Debt: S/ 2.2 billion
25% 10% 20% 2% 5% 14% 5% 5% 5% 2% 5% 2%
A
A
March 20162
We continued with our refinancing program with a successful public placement totaling S/ 230.2 million
Duration of total debt was 3.98 years at March 2016 compared to 3.67 at December 2015
• On march 2016, we accomplished the largest public placement in PEN for the year, by issuing a simultaneous 3-year S/ 70.3 million and a 7-year S/ 160.0 million bonds
• This operations allowed us to refinance more than S/ 200 million short-term debt to medium and long-term debt, accomplishing more than 50% of our refinancing plan for the year
• Our USD denominated debt increased from 11.6% in Q4 15’ to 13.3% in Q1 16’. Nevertheless, our real USD exposure decreased from 2.4% to 2.2% as of March 2016.
A
Debt breakdown by currency1
13% 17% 19% 2% 5% 15% 10% 5% 5% 2% 5% 2%
B
B
A
2
16
13.3%
75.6%
8.3% 2.8%
USD
PEN
BRL
ARS

[ C L I E N T N A M E ]
Presentation3
1237395-001.pptx
Guidance for FY 2016 179.31.36
106.107.109
8.144.70
40.44.109
144.28.83
243.165.30
218.70.38
14.116.118
7
FY 2015
4.7%
11.0%
S/ 175.9 MM
Revenues growth (PEN)
EBITDA Margin
CAPEX
2.71x Net Debt / EBITDA
Guidance 2016
5.0% - 7.0%
11.0% - 12.0%
S/ 200 - 220 MM
2.20x -2.40x
2.4% Net Margin 4.0% - 5.0%
17

[ C L I E N T N A M E ]
Q&A

[ C L I E N T N A M E ]
Appendix

[ C L I E N T N A M E ]
Presentation3
1237395-001.pptx
EBITDA Main Drivers (YoY)
149.5 163.3
26.8 7.2 5.8
EBITDA Q1 15' Gross Profit SG&A Other Net Operating Expenses EBITDA Q1 16'
Main Drivers of EBITDA (YoY)
3.3% 1.4% 9.9% 11.4%
SG&A / Marketing Expenses Evolution
(As % of Total Revenue)
EBITDA growth was aligned with the increase in Gross Profit of S/ 26.81 million
SG&A was affected by higher selling expenses mainly due to an allowance for accounts receivable in Chile
1Gross Profit not including industrial depreciation
2This allowance represents 0.5% of Total Revenues
3SG&A expenses not including depreciation & amortization
1 3
0.4%
2.3% 2.8% 3.1% 2.7% 2.9%
5.8% 5.7% 5.3% 5.9% 6.4%
11.1% 10.9% 11.0% 11.4% 12.1%
Q1 15' Q2 15' Q3 15' Q4 15' Q1 16'
Marketing Administrative Expenses Selling Expenses
19.2% 19.3% 19.3% 20.1% 21.4%
20
2

[ C L I E N T N A M E ]
Presentation3
1237395-001.pptx
Net Income Main Drivers (YoY)
Main Drivers of Net Income (YoY)
19.9
56.6 9.0
18.3
36.0
3.4 1.2 22.0
Net IncomeQ1 15'
Operating Profit Net FinancialExpenses
FX and RatesHedging Expenses
FX Exchange Losses Other Income Tax Net IncomeQ1 16'
1.3% 3.9% 1.0% 1.6% 1.1% 2.4% 1.3% 0.1%
74.0 51.4 61.5 65.1 CCC3 39.8
Financial Expenses Evolution
(As % of Total Revenue) Net income increased S/ 36.8 million and reached S/ 56.6 million in Q1 16’, explained by: i) a higher contribution from the Consumer Goods Peru division and the B2B Business, ii) lower financial expenses of S/ 18.3 million and iii) a decrease in losses from currency and interest rate hedging instruments of S/ 36.0 million; partly offset by an increase in currency exchange losses of S/ 3.4 million 3.0% 3.3% 2.8%
1.3% 1.8%
0.2% 0.8%
0.1%
0.8% 0.5%
2.4% 2.0%
2.0%
1.1%
0.0%
5.6% 6.1%
4.9%
3.1% 2.3%
Q1 15' Q2 15' Q3 15' Q4 15' Q1 16'
Net Financial Expenses FX Exchange Losses FX and Rates Hedging Expenses
0.2%
21

[ C L I E N T N A M E ]
Presentation3
1237395-001.pptx
528 548
312 257
840 805
Q1 15' Q1 16'
Peru International
4.6%
14.7%
2.6%
16.9%
8.8% 10.3%
CONSUMER GOODS B2B1 AQUACULTURE1
331 338
Q1 15' Q1 16'
10.9% 12.3%
EBIT
DA
Mar
gin
(%
) R
even
ues
(P
EN M
illio
n)
Q1 2016 Performance by Business Unit & Regions
-2.0p.p.
+2.2p.p.
+1.4p.p. +1.6p.p.
Q1 15’ Q1 16’ Var. Q1 15’ Q1 16’ Var.
-17.7%
+3.8%
-4.2%
+2.1% -12.8%
Revenue Mix Peru Ecuador Argentina Chile Brazil Others
(%) 62.7% 11.2% 8.3% 7.3% 6.8% 3.7%
1Financial figures of B2B and Aquaculture are consolidated
338 295
Q1 15' Q1 16'
13.1% 10.7% -2.4p.p.
Q1 15’ Q1 16’ Var.
22