Measure BB & Bond Oversight Committee Bond Oversight Committee April 30, 2012.
.
Merrill Lynch & Co. Market Risk Management
CONFIDENTIAL
Presentation to the Risk Oversight Committee
Market Risk Management Update
September 26, 2007
N .... o
"'" "'" o o o IT o c U
I
....I 2: U <C III
~ CI) CIl :::::I C" CIl
0:: -I: CIl E 10 ~ I-'iij '.;:::: I: CIl
"C ;;::::: I: o U

.
Merrill Lynch & Co, Market Risk Management
MRM Presentation to the Risk Oversight Committee VaR Backtesting
u
'" = 0 ,,.. --~ 0 rJl ~
300
200
100
0
(100)
(200)
(300)
Jan-01
Daily Backtesting P/L*
-I-day 99% specific risk VaK + add-on for specific issuer volatility
Jan- Jan- Feb- Feb- Mar- Mar-
15 29 12 26 12 26 Apr- Apr-
09 23
! :8/16 I
8/7 I 8/23
I
May- May- Jun- Jun- Jul- Jul- Jul- Aug- Aug- Sep-07 21 04 18 02 16 30 13 27 10
'Daily Backtesting PjL is intended to reflect profits or losses driven by market price changes on the day. The base PjL is Greensheets Principal Transactions, which excludes interest, dividends, fees and commissions. In some cases, Daily Backtesting PjL is also adjusted to eliminate material non-market driven accounting adjustments, new deal PjL, and in some cases intraday trading. The backtesting P&L does not include RPI and CD 0 Super Senior re-marking P&L due to the frequency of MTM.
CONFIDENTIAL
M .,... o
"'" "'" o o o IT o c U
I
....I 2: U <C III
~ CI) CIl :::::I C" CIl
0:: -I: CIl E 10 ~ I-'iij '.;:::: I: CIl
"C ;;::::: I: o U

.
Merrill Lynch & Co. Market Risk Management
ML & CO. VaR Backtesting VaR Backtesting (Cont'd)
n Highlight of PfL Movements ($Millions)
Aug-07 (144) Equity SRG
GSFI
Credit Trading
All Others
Aug-16 265 Currencies
Credit Trading
Global Rates
Aug-20 (112) Currencies
Credit Trading
All Others
Aug-23 (152) Credit Trading
Currencies
GSFI
Global Rates
CONFIDENTIAL
(53)
(39)
(19)
(33)
111
111
41
(71)
(17)
(24)
(51)
(48)
(35)
(20)
Proprietary trading losses in Statistical Arbitrage business
Losses on macro hedge due to tightening swap spreads and an equity market rally
Losses driven by CDX spread P / L and bond re-marks
Small losses in various businesses with $12mm from Principal Credit Group Americas
Gains driven by long volatility positions in JPY, CHF, NZD and MXN as well as from short positions in TRL and NZD and long positions in JPY.
Gains due to macro hedges in super-senior book, implemented by buying protection on monolines and through ABX index trades
Gains from long USD interest rate positions and long EUR and USD interest rate vega
Losses driven by lower volatility in JPY, AUD, NZD and TRY
Losses driven primarily by US proprietary trading
-$13mm from US. and Japan GELP
Losses in the super-senior book on ABX index hedges and long protection on monolines
Losses in options trading due to lower JPY, AUD and NZD volatilities
Losses due to adverse market movements causing losses in ABX positions
Drop in interest rate volatilities combined with are-mark ofFX volatilities in the Long Term Complex FX Option business
2
"'" .... o
"'" "'" o o o IT o c U
I
....I 2: U <C III
"C Qj -CI) Qj :::::I C" Qj
0:: -I: Qj
E -!II ~ I-'iij '.;:::: I: Qj
"C ;;::::: I: 0 U
.
Merrill Lynch & Co. Market Risk Management
ML & CO. VaR Backtesting VaR Backtesting (Cont'd)
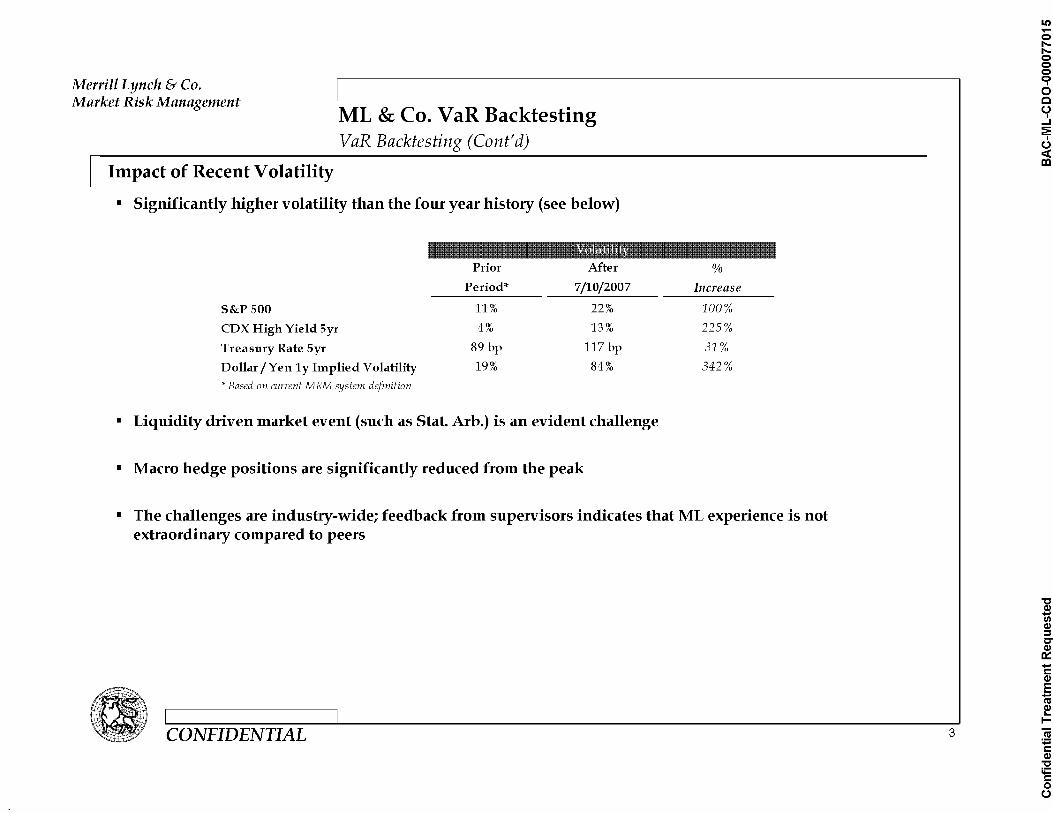
n Impact of Recent Volatility
• Significantly higher volatility than the four year history (see below)
Prior After
Period* 7/10/2007
S&P SOO 11% 22%
CDX High Yield Syr 4% 13%
Treasury Rate Syr 89 bp 117 bp
Dollar / Yen 1 y Implied Volatility 19% 84%
* Based on current MRM system definition
• Liquidity driven market event (such as Stat. Arb.) is an evident challenge
• Macro hedge positions are significantly reduced from the peak
%
Increase
100%
225%
31%
342%
• The challenges are industry-wide; feedback from supervisors indicates that ML experience is not extraordinary compared to peers
CONFIDENTIAL 3
II) .... o
"'" "'" o o o IT o c U
I
...I 2: U <C III
"C Qj -CI) Qj :::::I C" Qj
0:: -I: Qj
E -!II ~ I-'iij '.;:::: I: Qj
"C ;;::::: I: 0 U
.
Merrill Lynch & Co. Market Risk Management
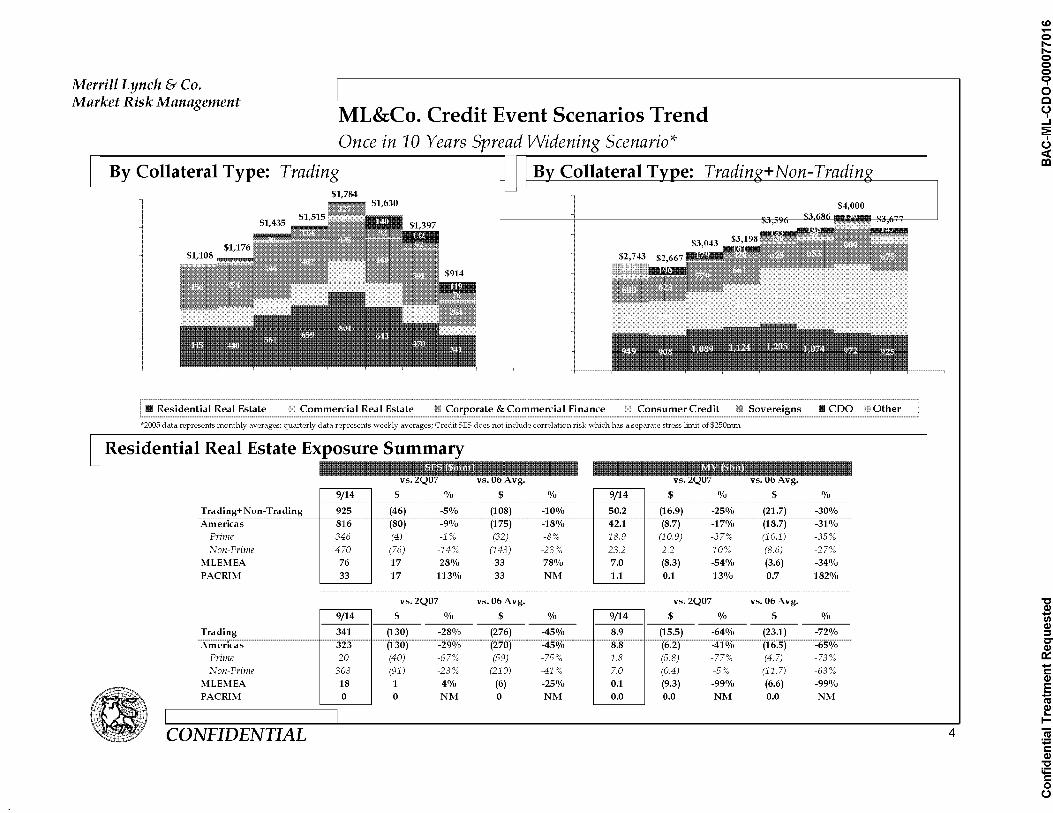
ML&Co. Credit Event Scenarios Trend Once in 10 Years Spread Widening Scenario*
By Collateral Type: T radin g f-=-.I-------"'C=--=o=l=la=t-=er=--=a=l---=-..~=-=---=-=--'-~_=_G_---'=--'-~--'=--'--~_'__=_G_--_
$4,000
Commercial Real Estate Corporate & Commercial Finance Consumer Credit Sovereigns • CDO Other
*2005 data represents monthly averages; quarterly data represents weekly averages; Credit SES does not include correlation risk which has a separate stress limit of $250mm
vs. vs. VS. VS.
9/14 $ % $ % 9/14 $ % $ %
Trading+ Non-Trading 925 (46) -5% (108) -10% 50.2 (16.9) -25% (21.7) -30% ~~~-~~~~~~~~-~~~~~~~~-~~~~~~~~-~~~~~~~~-~~~~~~~~
SI6 lso) ~~~~~~~:~9~o7o
('175) ~~~~~~~~~~::f8(Vo~~
42.1 (S:7) ~~~~~~-~~~~~~~~-~~~~~~~~-~~~~~~~~-~~~~~~~~-~~~~~~~~~~~~~~~~~~~
Americas -17% (18.7) -31% Prime 346 (4) -1% (32) -8% 18.9 (10.9) -37% (10.1) -35% Non~Prime 470 (76) -14% (143) -23% 23.2 2.2 10% (8.6) -27%
MLEMEA 76 17 28% 33 78% 7.0 (8.3) -54% (3.6) -34% PACRIM 33 17 113% 33 NM 1.1 0.1 13% 0.7 182%
vs.2Q07 vs.06Avg. vs.2Q07 vs.06Avg.
9/14 % % 9/14 % %
341 8.9 ~~~~~~323~~~~~~ ~~~~~S:S~~~~~~~
Prime 20 (40) -67% (59) -75% 1.8 (5.8) -77% (4.7) -73% Non~Prime 303 (91) -23% (210) -41% 7.0 (0.4) -5% (117) -63%
MLEMEA 18 1 4% (6) -25% 0.1 (9.3) -99% (6.6) -99% PACRIM 0 0 NM 0 NM 0.0 0.0 NM 0.0 NM
CONFIDENTIAL 4
CD .... o
"'" "'" o o o IT o c U
I
....I 2: U <C III
"C Qj -CI) Qj :::::I C" Qj
0:: -I: Qj
E -!II ~ I-'iij -.;:::: I: Qj
"C ;;::::: I: 0 U

.
Confidential Treatment Requested BAC-ML-CDO-000077017
.
Merrill Lynch & Co. Market Risk Management
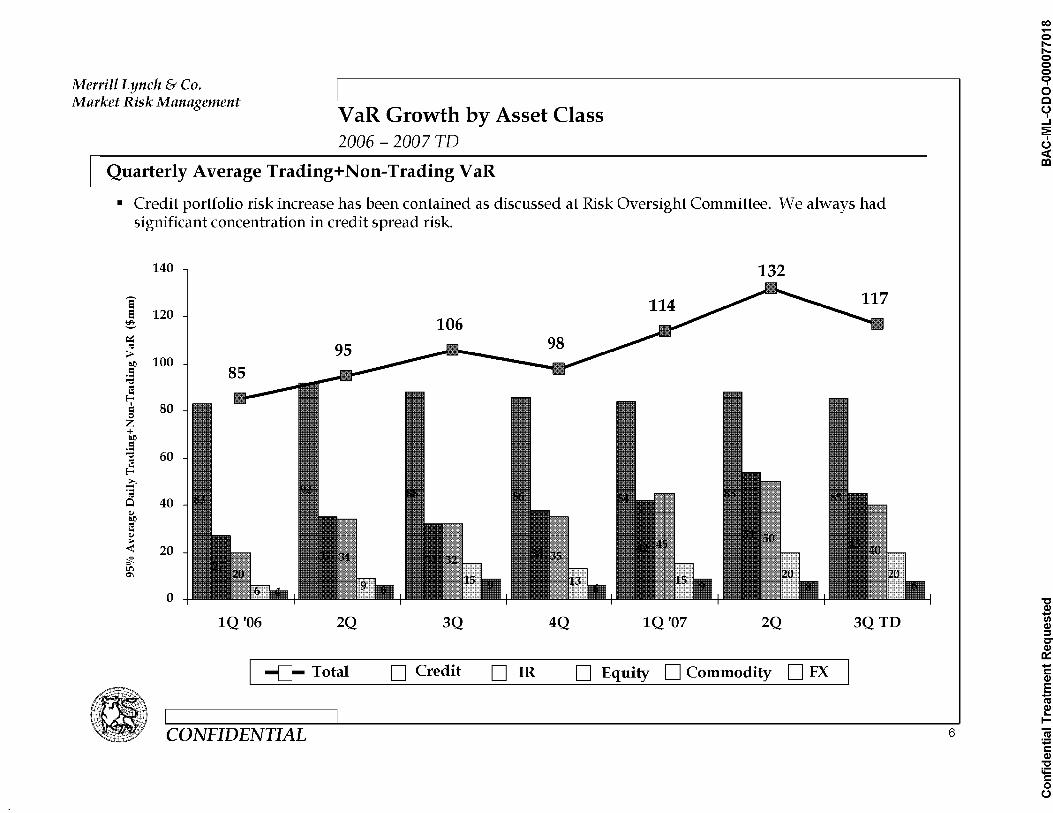
VaR Growth by Asset Class 2006 - 2007 TD
Quarterly Average Trading+ N on-Trading VaR
• Credit portfolio risk increase has been contained as discussed at Risk Oversight Committee. We always had significant concentration in credit spread risk.
140 132
'? IS 120 ~
~
" ~ 100 0.0
oS '"C is
E-< , 80 = 0 z
+ 0.0
oS '"C 60 " E!:: >. -or; 0 40
QJ 0.0
is QJ .. < 20 '2f-l!") C'I
0
lQ '06 2Q 3Q 4Q lQ '07 2Q 3QTD
-{]- Total D Credit D IR D Equity D Commodity D FX
CONFIDENTIAL 6
co .... e l"I"e e e IT o c U
I
....I 2: U <C III
"C .sl CI) CIl :::::I C" CIl
0:: -I: CIl E -1':1 ~ I-
~ -I: CIl
~ I: 0 U

.
Merrill Lynch & Co. Market Risk Management
ABS CDOs Risk Update
n · Issues • Until February 2007, we were able to buy protection to make the risk very far out-of-the-money, hence DV01
was modest. The real challenge started when monolines stopped selling protection on mezzanines.
• After the start of Subprime crisis, the first order focus was to reduce the junior tranche exposure.
• Underlying collateral analysis is extremely challenging due to the complexity of ABS asset combination
• The very low usage in Stress Event Scenario was due to the combination of the far out-of-the-money risk nature and the very low historical volatility of the Super AAA time series mapping.
• Desk-level DV01limits were set at a modest level for AAA risks.
• Current Status
• $5 billion reduction on 50%-100% High Grade risk, possibly more
• Business / Risk / Finance working on new valuation methodology based on fundamental analysis
• Infrastructure challenges in Credit Derivatives
• Exposure Update Retained Super Senior Spread DV01
($Millions) High Grade Mezzanines CD02 Total $ Limit
AUG-06 5,580 1,610 7,190 2.35 Stress $75mm
SEP-06 7,210 2,075 9,285 2.76 3.00
JAN-07 12,810 4,524 17,334 2.42 5.70
FEB 15,175 4,737 370 20,282 4.78 5.70
MAR 18,620 6,109 700 25,429 6.84 7.40
APR 23,220 6,192 1,340 30,752 6.01 7.40
MAY 22,310 6,117 440 28,867 5.98 7.40
JUN 22,310 6,423 1,620 30,353 6.79 7.40
JUL 24,120 6,438 1,505 32,158 6.60 7.40
AUG 18,286 6,228 1,201 25,715 5.40 7.40
SEP 18,158 6,173 1,201 25,532 5.30 7.40
CONFIDENTIAL 7
en .... o
"'" "'" o o o IT o c U
I
....I 2: U <C III
"C Qj -CI) Qj :::::I C" Qj
0:: -I: Qj
E -!II ~ I-'iij '.;:::: I: Qj
"C ;;::::: I: 0 U

.
Merrill Lynch & Co. Market Risk Management
U Follow-up for the Future
ABS CDOs Risk Update (Con t 'd)
• Revised methodology for Subprime stress scenarios based on fundamental analysis (see page on Real Estate Price Shock Scenario)
• Review of other large BjS or far out-of-the-money risk concentration with senior management
• Examples:
• GSFI lending ($40bn+)
• Investment Portfolio ($20bn+ and MLBUSA ABCP)
• Commercial Real Estate Lending ($25bn+ including ML Capital)
• Treasury Liquidity Portfolio ($20bn+ in CMO Floaters)
• Convertibility risk (Korea, India, Brazil, Turkey, etc.)
• GELP non-recourse financing and Hedge Fund derivatives
• OTM Derivative risk in GELP and CFXO (shorter Vega as markets sell off)
CONFIDENTIAL 8
o N o
"'" "'" o o o IT o c U
I
....I 2: U <C III
"C .sl CI) CIl :::::I C" CIl
0:: -I: CIl E -!II ~ I-
~ -I: CIl
~ I: 0 U

.
s;s; ;::, (t)
.... ~ ;:0;- ..... (t) -.... -~t:'""' ..... t..::: 'Jl ;:: ;:0;-('":>
n s;::::-;::, ~
0 ;:: n
~ ~ ?
(t)
~ s (t) ;::
~ ....
~ ~ ~
~ rc t-t t-t ~. --~
"<l = n
=-~ = r;rJ
s= t-t ~ = n rc CJ t-t 0 s= ~
CD
Confidential Treatment Requested BAC-ML-CDO-000077021
.
o
Confidential Treatment Requested BAC-ML-CDO-000077022
.
Confidential Treatment Requested BAC-ML-CDO-000077023

.
Merrill Lynch & Co. Market Risk Management
CONFIDENTIAL
Global Market Risk Management - Appendix Risk Profile Update
[12J
"'" N o
"'" "'" o o o IT o c U
I
....I 2: U <C III
"C Qj -CI) Qj :::::I C" Qj
0:: -I: Qj
E -!II ~ I-
~ -I: Qj
:'5! .... I: 0 U

.
Merrill Lynch & Co, Market Risk Management
MRM Presentation to the Risk Oversight Committee ABX HE 07-1
2007-to-Date Weekly Price Trend by Rating
4,000
3,500 l/ ~ ~ /'
3,000
2,500
~ QJ 2,000 <.I '': ~
1,500
1,000
500
0
/ I/' V ~ ""'-
/ VI /
II-""'"
/ J
L/ V - -
I' "--- /" '-V' , / /
VI' -I' V J ~ ~ ~ ../ ~ r--...
V ~l ~
I 1---+ I I I I I I I I I , I -1/26 2/9 2/23 3/9 3/23 4/6 4/20 5/4 5/18 6/1 6/15 6/29 7/13 7/27 8/10 8/24 9/7
-AAA AA A -BBB BBB-
CONFIDENTIAL
4,000
3,500
3,000
2,500
2,000
1,500
1,000
500
0
13
II) N o
"'" "'" o o o IT o c U
I
....I 2: U <C III
"C Qj -CI) Qj :::::I C" Qj
0:: -I: Qj
E -!II ~ I-'iij '.;:::: I: Qj
"C ;;::::: I: 0 U
.
Merrill Lynch & Co. Market Risk Management
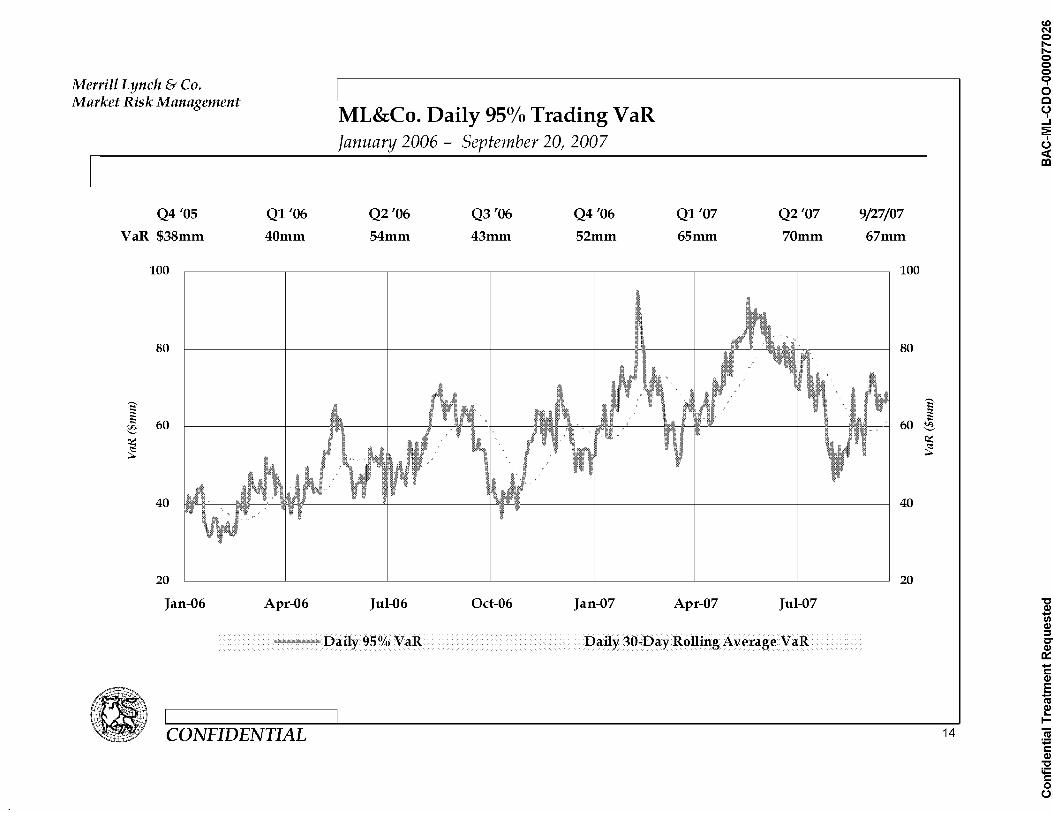
u Q4'05
VaR $38mm
E' ;: ~ ~
~
100
80
60
40
20
Jan-06
Ql '06
40mm
Apr-06
ML&Co. Daily 95% Trading VaR January 2006 - September 20, 2007
Q2'06
54mm
Jul-06
Q3'06
43mm
o ct-O 6
Q4'06
52mm
Jan-07
Ql '07
65mm
Apr-07
Q2'07
70mm
Jul-07
---Daily 95% VaR Daily 30-Day Rolling Average VaR
CONFIDENTIAL
9/27/07
67mm
100
80
60
40
20
E' ;: ~ ~ ~
14
CD N o
"'" "'" o o o IT o c U
I
....I 2: U <C III
"C .sl CI) CIl :::::I C" CIl
0:: -I: CIl E -!II ~ I-
~ -I: CIl
~ I: 0 U

.
Merrill Lynch & Co. Market Risk Management
u 100
80
60 1 !:: ~
~ 40
20
o Jan-06 Apr-06
ML&Co. Daily 95% Trading VaR Trend by Risk Factor January 2006 - September 20, 2007
Jul-06 Oct-06 Jan-07 Apr-07 Jul-07
I-TOTAL VAR -CREDIT COMMODITY EQUITY -IR FXI
Note: Credit Risk = Spread Volatility + Credit Product Spread + Credit Product Market Value
CONFIDENTIAL
100
80
60 1 !:: ~
40
~
~
20
0
15
"'" N o
"'" "'" o o o IT o c U
I
....I 2: U <C III
"C .sl CI) CIl :::::I C" CIl
0:: -I: CIl E -!II ~ I-
~ -I: CIl
:'5! .... I: 0 U

.
Merrill Lynch & Co. Market Risk Management
u 120
100
80
1 ::: ~ 60 ~
~
40
20
o
'\ I'" \~. ..
','
- "
ML&Co. Equity Specific Risk November 2006 - September 20, 2007
" ~' ..... .. ,;'~ .'~ ~ # :'.. ... ,.
" , ,~.l'\ '" I'
\ ,'.
'( ~# ~ •
g # ~ ~ \-
~
11/1/0611/26/0612/21/061/15/07 2/9/07 3/6/07 3/31/07 4/25/07 5/20/07 6/14/07 7/9/07 8/3/07 8/28/07
........ -Total VaR wi Eqty Sp. Risk Total VaR wi Gen. Mkt Risk
CONFIDENTIAL
- ........ -Equity VaR wi Eqty Sp. Risk - - - - - - - Equity VaR wi Gen. Mkt Risk
'.
16
co N o
"'" "'" o o o IT o c U
I
....I 2: U <C III
"C .sl CI) CIl :::::I C" CIl
0:: -I: CIl E -!II ~ I-
~ -I: CIl
~ I: 0 U

.
Merrill Lynch & Co. Market Risk Management
U By Risk Factor
180
160
140
120
1 100 !:: ~ ~ 80 ~
60
40
20
0
Jan-06 Apr-06
ML&Co. Daily 95% Stand-alone VaR: Trading+ N on-Trading January 2006 - September 20, 2007
180
160
140
120
100 1 !:: ~
80 ~
~
60
40
20
0
Jul-06 Oct-06 Jan-07 Apr-07 Jul-07
I-TOTAL VAR -CREDIT COMMODITY EQUITY -IR FXI
Note: Credit Risk = Spread Volatility + Credit Product Spread + Credit Product Market Value
CONFIDENTIAL 17
en N o
"'" "'" o o o IT o c U
I
....I 2: U <C III
"C .sl CI) CIl :::::I C" CIl
0:: -I: CIl E -!II ~ I-
~ -I: CIl
~ I: 0 U
.
Merrill Lynch & Co. Market Risk Management
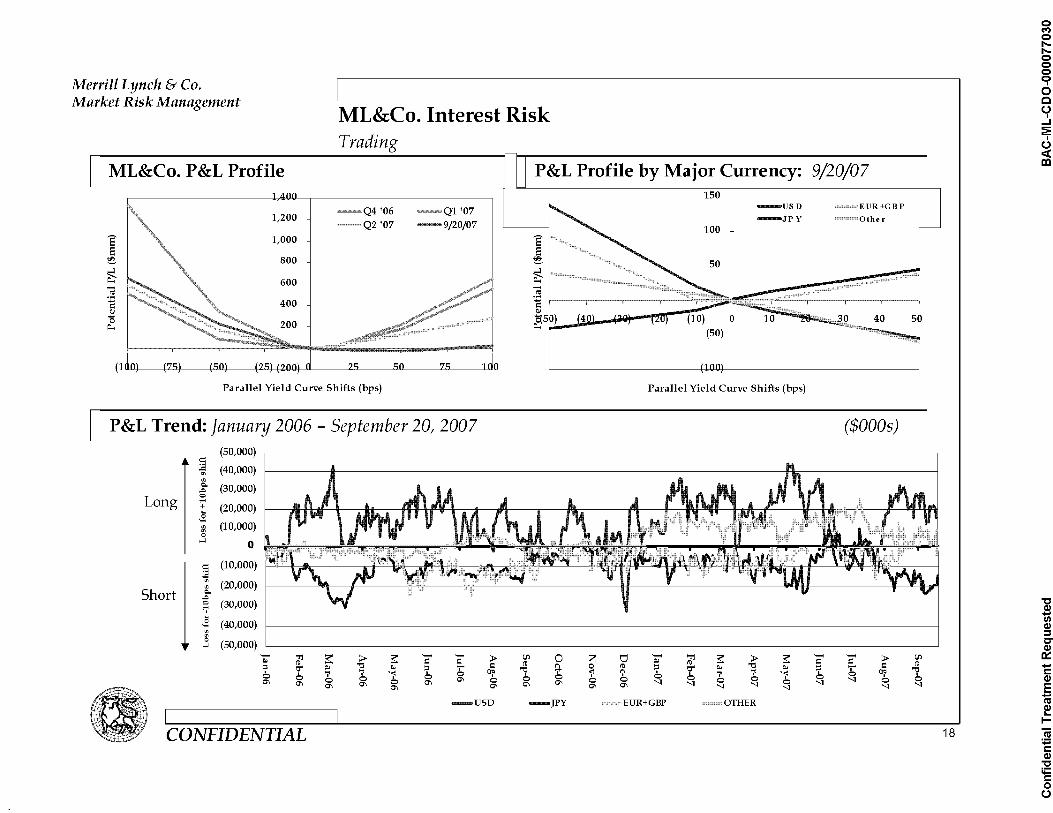
ML&Co. Interest Risk Trading
ML&Co. P&L Profile P&L Profile by Major Currency: 9/20/07
1 ~
~ r; .~ Q)
"0 Il.
1,200
1,000
800
600
-Q4'06 Q2 '07
'07 -9/20/07
(lUll) t"(')J t'JIIJ tl'JJ (2"11) II l'J "" "('1 I U
Parallel Yield Curve Shifts (bps)
U P&L Trend: January 2006 - September 20,2007
$: (50,000)
~ (40,000) '"
Long ::.. (30,000) ,.Q
<:> .... + (20,000) ~ '" (10,000) '" 0
""' 0
-USD
-JPY
100
II ~
50
Parallel Yield Curve Shifts (bps)
EUR+GBP
Other
($OOOs)
$: (10,000) ..= i (20,000)
Short
d' L~\7t'_1. .f'I.----... c- , rl~ , ....... • TI8'._/' r,"'"4.i.J .... , .. .... II
,.Q <:> (30,000) '-;' ~ (40,000) ""' '" ~
(50,000) ""' -~ ::s
6 0'>
'Tj a:: > a:: - - > CJl 0 Z tj - 'Tj a:: > a:: - - > CJl ro e e ro ~ ro e e ro OJ" ~ "0 ~ %, T' e
"9 " 0 ro ::s OJ" ~ "0 ~ %, T' e "9 6 7 7 b 0 Oil " -;: b 6 6 7 7 b 0 Oil
0 0 0'> 0 0 0 0 0 0 "I 0 0 0'> 0'> 0'> 0'> 0'> 0'> 0'> 0'> 0'> "I "I "I "I "I "I "I 0'> "I
-USD -JPY EUR+GBP OllIER
CONFIDENTIAL 18
o M o
"'" "'" o o o IT o c U
I
....I 2: U <C III
"C ,Sl CI) CIl :::::I C" CIl
0:: -I: CIl E -!II ~ I-
~ -I: CIl
~ I: 0 U

.
Merrill Lynch & Co. Market Risk Management
ML&Co. P&L Profile
e E ~
~ ";; .~
" "0 ~
-Q4'06 -Ql'07 Q2 '07 -9/20/07 800
600
400
200
(200)
Shift(%)
ML&Co. Equity Risk Trading
P&L Profile: 9/20/07
~ .........
";; '.0 I':
5 Ih ~ (T
U P&L Trend: January 2006 - September 20,2007
--;; (120)
" ] (90)
~ (60)
¢: (30) :a Vl
"if- 0 u;>
100; 30 ..e ~ 60
:3 "E 90
" "0 120 ~ -- ~ ~ ~ ~ -- -- ~
[JJ 0 Z tl -- ~ ~ ~ ~ = = i"t) ~
;: ~ ~ ~ ;: 7" "0 " ~ i"t) ;: ~ ~ , 'i' 'i' '1 0 iJj'I , 'i'" " , 'i' 'i' 0 0 0 , , 0
0"1 0 0 0 0 0"1 0"1 0 0 0"1 0 0 '1 0 0 0
0"1 0"1 0"1 0"1 0"1 0"1 0"1 0"1 '1 '1 '1
300
200
100
(100) (j 5
(200) ~ -AMR APR
Shifts (%)
~ -- -- ~ [JJ
= = i"t) ~ ;: 7" "0 '1 0 iJj'I ,
0 0 '1 '1 0 0 '1 '1 '1
- U.S. & Canada - EMEA APR Japan
CONFIDENTIAL
-EMEA Japan
(120) --;;
" (90) ~ (60) ~ (30)
¢:
:a Vl
0 "if-u;>
30 100;
..e 60 ~
";; 90 ~
" 120 "0 ~
1
19
.... M e l"I"e e e IT o c U
I
....I 2: U <C III
"C .sl CI) CIl :::::I C" CIl
0:: -I: CIl E -!II ~ I-
~ -I: CIl
~ I: 0 U

.
Merrill Lynch & Co. Market Risk Management
ML&Co. Currency Risk Trend Trading
n EUR 600 rn J~Y 1,000 I
1 ~
~ ~ (1W- (8) (6)
Q)
"0 Il.
(4)
-Q4'06 '07
400 Q2 '07 -9/20/07
200
(2)(200) 2
(400)
Shifts (%)
U Emerging Markets FX Loss for +/- 2% Shift Ql '06 Q2 '06 Q3 '06
(45)
'? " ~
Long <t: (30) :E [JJ
'if-";'
(15) '"' 0 ..... ill 0
,.J
'? 0
" ~ Short
<t: (15) :E [JJ
'if-N
(30) + '"' 0 .....
II II Asia IIEMEA II Latin America I 00 00 0
,.J (45)
CONFIDENTIAL
800 J E E 600 ~
~ I 400 ";; '.0 I': 200 Q)
"0 Il. r--
(8) (6) (4) (2)(200) g 2
Shifts (%)
Q4 '06 Ql '07 Q2 '07
-Q4 '06 -Ql '07
Q2 '07 -9/20/07
4 6 8
9/20/07
1
20
N M e l"I"e e e IT o c u , ....I 2: U <C III
"C .sl CI) CIl :::::I C" CIl
0:: -I: CIl E -1':1 ~ I-
~ -I: CIl :E .... I: 0 U

.
Merrill Lynch & Co. Market Risk Management
U Delta by Product
1,000
750
'? 500 E ~ 250 ~
I1J 0 0
(250)
(500)
Jan-06 Mar-06
ML&Co. Commodity Risk Analysis January 2006 - September 20, 2007
~-?-
J - I' .-r f"ti/' ~ ~ 'II .\ -.--- ----.-.----~ .•. -~~-~"'f-T.---.
\. "J'~~t+. l '\I'" v- " - V
May-06 Jul-06 Sep-06 Nov-06 Jan-07 Mar-07 May-07
Americas Power+Gas --EMEA Power+Gas Oil Coal
U Regional Delta by Product 2,000
1,500
1,000
1 500 .~ ..,..,."
~ 0 'If
~ (500) I1J 0
(1,000)
(1,500)
(2,000)
Jan-06 Mar-06 May-06 Jul-06 Sep-06 Nov-06 Jan-07 Mar-07 May-07
Jul-07
Jul-07
- Americas Power -- Americas Gas European Power -- European Gas
CONFIDENTIAL
Sep-07
Other
Sep-07
1,000
750
500 '? E
250 ~
~ 0 I1J
0
(250)
(500)
2,000
1,500
1,000
500 1 o ~
.a (500) Ql
o (1,000)
(1,500)
(2,000)
21
M M o
"'" "'" o o o IT o c U
I
....I 2: U <C III
~ CI) CIl :::::I C" CIl
0:: -I: CIl E 10 ~ I-'iij '.;:::: I: CIl
"C ;;::::: I: o U

.
Confidential Treatment Requested BAC-ML-CDO-000077034