Presentation to investors and analysts Result announcement for … · 2019-05-02 · This...
84
Presentation to investors and analysts 3 May 2019 Result announcement for the full year ended 31 March 2019 For personal use only
Transcript of Presentation to investors and analysts Result announcement for … · 2019-05-02 · This...
Presentation to investors and analysts
3 May 2019
Result announcement for the full year ended 31 March 2019
For
per
sona
l use
onl
y

2
Introduction Overview of Result Result Analysis and Financial Management Outlook AppendicesMacquarie I FY19 result announcement I macquarie.com
The material in this presentation has been prepared by Macquarie Group Limited ABN 94 122 169 279 (MGL) and is general background information about Macquarie’s (MGL and its subsidiaries) activities current as at the date of this presentation. This information is given in summary form and does not purport to be complete. The material contained in this presentation may include information derived from publicly available sources that have not been independently verified. Information in this presentation should not be considered as advice or a recommendation to investors or potential investors in relation to holding, purchasing or selling securities or other financial products or instruments and does not take into account your particular investment objectives, financial situation or needs. Before acting on any information you should consider the appropriateness of the information having regard to these matters, any relevant offer document and in particular, you should seek independent financial advice. No representation or warranty is made as to the accuracy, completeness or reliability of the information. All securities and financial product or instrument transactions involve risks, which include (among others) the risk of adverse or unanticipated market, financial or political developments and, in international transactions, currency risk.
This presentation may contain forward looking statements – that is, statements related to future, not past, events or other matters – including, without limitation, statements regarding our intent, belief or current expectations with respect to Macquarie’s businesses and operations, market conditions, results of operation and financial condition, capital adequacy, provisions for impairments and risk management practices. Readers are cautioned not to place undue reliance on these forward looking statements. Macquarie does not undertake any obligation to publicly release the result of any revisions to these forward looking statements or to otherwise update any forward looking statements, whether as a result of new information, future events or otherwise, after the date of this presentation. Actual results may vary in a materially positive or negative manner. Forward looking statements and hypothetical examples are subject to uncertainty and contingencies outside Macquarie’s control. Past performance is not a reliable indication of future performance.
Unless otherwise specified all information is for the year ended 31 March 2019.
Certain financial information in this presentation is prepared on a different basis to the Financial Report within the Macquarie Group Annual Financial Report (“the Financial Report”) for the year ended 31 March 2019, which is prepared in accordance with Australian Accounting Standards. Where financial information presented within this presentation does not comply with Australian Accounting Standards, a reconciliation to the statutory information is provided.
This presentation provides further detail in relation to key elements of Macquarie’s financial performance and financial position. It also provides an analysis of the funding profile of Macquarie because maintaining the structural integrity of Macquarie’s balance sheet requires active management of both asset and liability portfolios. Active management of the funded balance sheet enables the Group to strengthen its liquidity and funding position.
Any additional financial information in this presentation which is not included in the Financial Report was not subject to independent audit or review by PricewaterhouseCoopers. Numbers are subject to rounding and may not fully reconcile.
Disclaimer
For
per
sona
l use
onl
y

MACQUARIE 2019
Agenda01 Introduction
02 Overview of Result
03 Result Analysis and Financial Management
04 Outlook
05 Appendices
For
per
sona
l use
onl
y

MACQUARIE 2019
IntroductionSam DobsonHead of Investor Relations01
For
per
sona
l use
onl
y

MACQUARIE 2019
Overview of Result Shemara WikramanayakeManaging Director and Chief Executive Officer 02
For
per
sona
l use
onl
y

6
Introduction Overview of Result Result Analysis and Financial Management Outlook AppendicesMacquarie I FY19 result announcement I macquarie.com
About Macquarie
Since 1 December 2018, certain businesses were reorganised between Operating Groups to better align businesses with a shared focus on particular customer segments and geographies. This included the transfer of Macquarie’s Australian vehicle finance business from CAF into BFS, the MSIS business from MAM to CAF and Macquarie Capital’s global real estate business into MAM to merge with MIRA Real Estate. These changes were announced as part of Macquarie’s 1H19 results on 2 November 2018. Comparatives have been restated to reflect this reorganisation between Operating Groups. Net profit contribution is management accounting profit before unallocated corporate costs, profit share and income tax. Pie chart is based on FY19 net profit contribution from Operating Groups as reported on 3 May 19. 1. P&I Largest Money Managers 2018. 2. As at 31 Mar 19. 3. BFS deposits exclude corporate/wholesale deposits. 4. The Australian loan and lease portfolio comprises residential mortgages, loans to Australian businesses, vehicle finance, insurance premium funding and credit cards. 5. Funds on platform includes Macquarie Wrap and Vision.6. Includes general plant & equipment.
Annuity-style businesses
Macquarie Asset Management (MAM)• Top 501 global asset manager with $A542.7b2 of assets under
management, diversified across regions, products, asset classes and investor types
• Provides investment solutions to clients across a range of capabilities, including infrastructure, real estate, agriculture, equities, fixed income, private credit, liquid alternatives and multi-asset solutions
Corporate and Asset Finance (CAF)• Global provider of specialist finance and asset management
solutions, with a $A21.3b2 asset and loan portfolio• Asset Finance delivers a range of tailored finance solutions
globally across a variety of industries and asset classes• Principal Finance provides flexible primary financing solutions
and engages in secondary market investing, across the capital structure. It operates globally in the corporate, transportation and real estate sectors
Commodities and Global Markets (CGM)• Integrated, end-to-end offering across global markets including
equities, fixed income, foreign exchange and commodities• Provides clients with risk and capital solutions across physical
and financial markets• Diverse platform covering more than 25 market segments, with
more than 160 products• Growing presence in commodities (natural gas, LNG, NGLs,
power, oil, coal, base metals, iron ore, sugar and freight)• Global institutional securities house with strong Asia-Pacific
foundations covering sales, research, ECM, execution and derivatives and trading activities
Macquarie Capital (MacCap) Global capability in:• Advisory and capital raising services, providing clients with
specialist expertise, innovative advice and flexible capital solutions across a range of sectors and products including investing alongside partners and clients
• Infrastructure, green and conventional energy, focusing on utilising balance sheet to construct assets, build businesses and create platforms across development, construction and operational phases
Banking and Financial Services (BFS)• Macquarie’s retail banking and financial services business with
total BFS deposits3 of $A53.4b2, Australian loan and lease portfolio4 of $A62.5b2 and funds on platform5 of $A86.0b2
• Provides a diverse range of personal banking, wealth management, business banking and vehicle finance6 products and services to retail clients, advisers, brokers and business clients
Markets-facing businesses
FY19Net profit
contribution
For
per
sona
l use
onl
y

7
Introduction Overview of Result Result Analysis and Financial Management Outlook AppendicesMacquarie I FY19 result announcement I macquarie.com
2H19$Am
1H19$Am
2H19 v 1H19
Net operating income 6,924 5,830 19%
Total operating expenses (4,762) (4,125) 15%
Operating profit before income tax 2,162 1,705 27%
Income tax expense (505) (374) 35%Effective tax rate1 (%) 23.2 22.2
Loss/(profit) attributable to non-controlling interests 15 (21)
Profit attributable to MGL shareholders 1,672 1,310 28%
Annualised return on equity (%) 19.5 16.3 20%
Basic earnings per share $A4.95 $A3.88 28%
Dividend per ordinary share $A3.60 $A2.15 67%
2H19 result: $A1,672m up 28% on 1H19; up 28% on 2H18
1. Calculation of the effective tax rate is after adjusting for the impact of non-controlling interests.
For
per
sona
l use
onl
y
8
Introduction Overview of Result Result Analysis and Financial Management Outlook AppendicesMacquarie I FY19 result announcement I macquarie.com
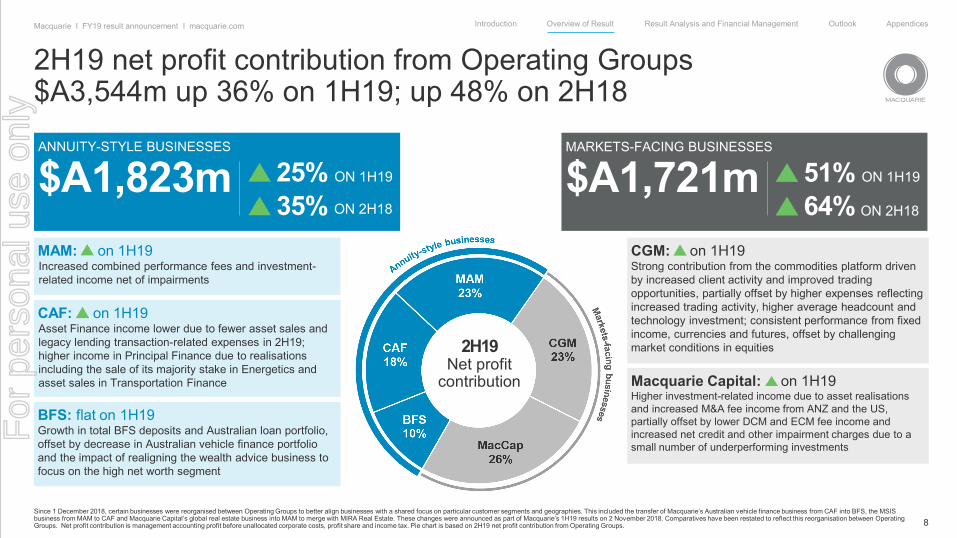
2H19 net profit contribution from Operating Groups$A3,544m up 36% on 1H19; up 48% on 2H18
Since 1 December 2018, certain businesses were reorganised between Operating Groups to better align businesses with a shared focus on particular customer segments and geographies. This included the transfer of Macquarie’s Australian vehicle finance business from CAF into BFS, the MSIS business from MAM to CAF and Macquarie Capital’s global real estate business into MAM to merge with MIRA Real Estate. These changes were announced as part of Macquarie’s 1H19 results on 2 November 2018. Comparatives have been restated to reflect this reorganisation between Operating Groups. Net profit contribution is management accounting profit before unallocated corporate costs, profit share and income tax. Pie chart is based on 2H19 net profit contribution from Operating Groups.
MAM: on 1H19Increased combined performance fees and investment-related income net of impairments
CAF: on 1H19Asset Finance income lower due to fewer asset sales and legacy lending transaction-related expenses in 2H19; higher income in Principal Finance due to realisations including the sale of its majority stake in Energetics and asset sales in Transportation Finance
BFS: flat on 1H19Growth in total BFS deposits and Australian loan portfolio, offset by decrease in Australian vehicle finance portfolio and the impact of realigning the wealth advice business to focus on the high net worth segment
CGM: on 1H19Strong contribution from the commodities platform driven by increased client activity and improved trading opportunities, partially offset by higher expenses reflecting increased trading activity, higher average headcount and technology investment; consistent performance from fixed income, currencies and futures, offset by challenging market conditions in equities
Macquarie Capital: on 1H19Higher investment-related income due to asset realisations and increased M&A fee income from ANZ and the US, partially offset by lower DCM and ECM fee income and increased net credit and other impairment charges due to a small number of underperforming investments
MARKETS-FACING BUSINESSES
$A1,721m 51% ON 1H19
64% ON 2H18
ANNUITY-STYLE BUSINESSES
$A1,823m 25% ON 1H19
35% ON 2H18
2H19Net profit
contribution
For
per
sona
l use
onl
y
9
Introduction Overview of Result Result Analysis and Financial Management Outlook AppendicesMacquarie I FY19 result announcement I macquarie.com
FY19$Am
FY18$Am
FY19 v FY18
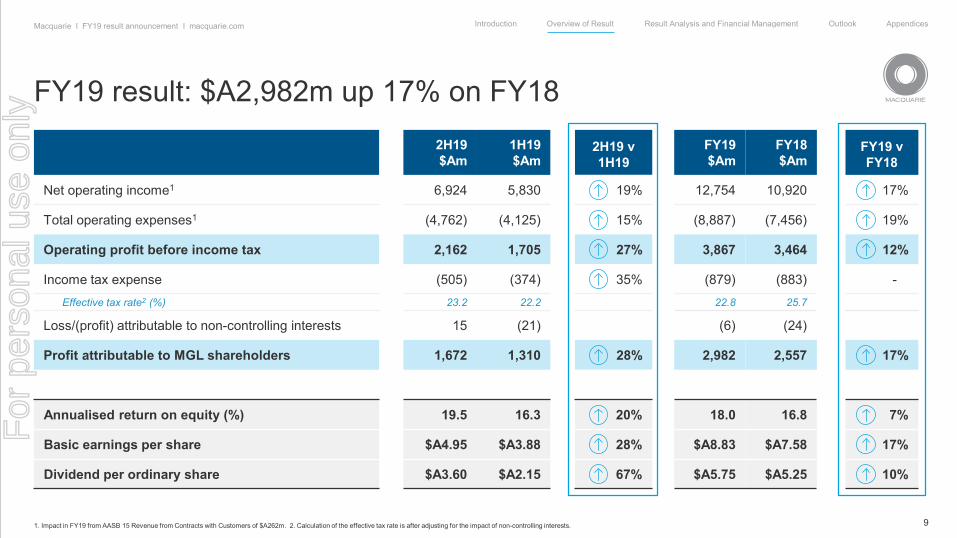
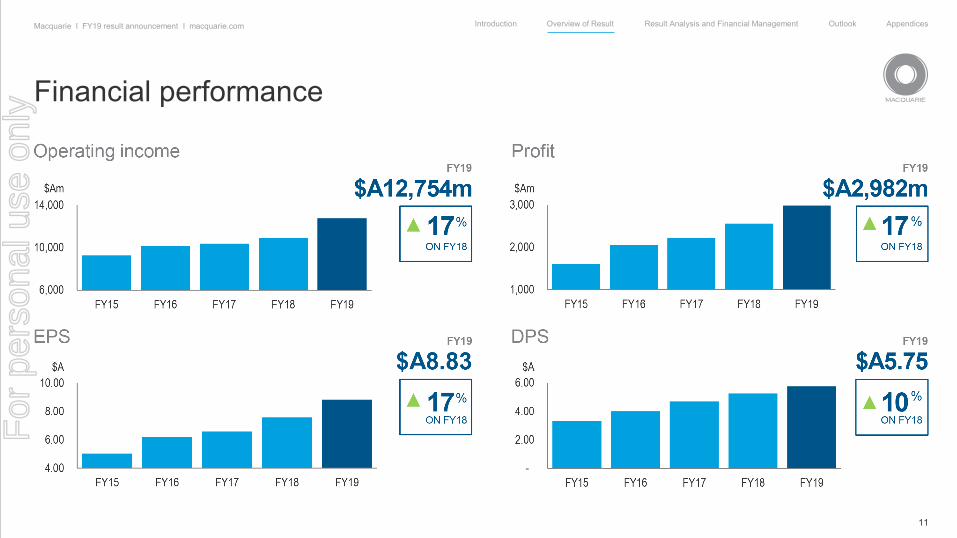
12,754 10,920 17%
(8,887) (7,456) 19%
3,867 3,464 12%
(879) (883) -22.8 25.7
(6) (24)
2,982 2,557 17%
18.0 16.8 7%
$A8.83 $A7.58 17%
$A5.75 $A5.25 10%
FY19 result: $A2,982m up 17% on FY18
1. Impact in FY19 from AASB 15 Revenue from Contracts with Customers of $A262m. 2. Calculation of the effective tax rate is after adjusting for the impact of non-controlling interests.
2H19$Am
1H19$Am
2H19 v 1H19
Net operating income1 6,924 5,830 19%
Total operating expenses1 (4,762) (4,125) 15%
Operating profit before income tax 2,162 1,705 27%
Income tax expense (505) (374) 35%Effective tax rate2 (%) 23.2 22.2
Loss/(profit) attributable to non-controlling interests 15 (21)
Profit attributable to MGL shareholders 1,672 1,310 28%
Annualised return on equity (%) 19.5 16.3 20%
Basic earnings per share $A4.95 $A3.88 28%
Dividend per ordinary share $A3.60 $A2.15 67%
For
per
sona
l use
onl
y

10
Introduction Overview of Result Result Analysis and Financial Management Outlook AppendicesMacquarie I FY19 result announcement I macquarie.com
FY19 net profit contribution from Operating Groups$A6,145m up 21% on FY18
Since 1 December 2018, certain businesses were reorganised between Operating Groups to better align businesses with a shared focus on particular customer segments and geographies. This included the transfer of Macquarie’s Australian vehicle finance business from CAF into BFS, the MSIS business from MAM to CAF and Macquarie Capital’s global real estate business into MAM to merge with MIRA Real Estate. These changes were announced as part of Macquarie’s 1H19 results on 2 November 2018. Comparatives have been restated to reflect this reorganisation between Operating Groups. Net profit contribution is management accounting profit before unallocated corporate costs, profit share and income tax. Pie chart is based on FY19 net profit contribution from Operating Groups.
CGM: on FY18Strong performance in commodities and improved results in foreign exchange, interest rates and credit, partially offset by challenging market conditions in Cash Equities, increased impairments and operating expenses
MAM: on FY18Increased base fees, offset by higher operating expenses and lower combined performance fees and investment-related income
CAF: on FY18Higher Asset Finance portfolio income more than offset by one-off investment-related income in the prior year and legacy lending transaction-related expenses; higher investment-related income in Principal Finance, offset by lower interest income from the loan portfolio; reduced provisions and impairments in the prior year
ANNUITY-STYLE BUSINESSES
$A3,287m 4% ON FY18
Macquarie Capital: on FY18Higher investment-related income due to asset realisations and increased fee and commission income, partially offset by higher net credit and other impairment charges and increased expenditure on green energy and other projects in the development phase
BFS: on FY18Growth in Australian loan portfolio, BFS deposits and funds on platform, partially offset by a decline in the Australian vehicle finance portfolio and increased costs associated with investment in technology
MARKETS-FACING BUSINESSES
$A2,858m 76% ON FY18
FY19Net profit
contribution
For
per
sona
l use
onl
y
11
Introduction Overview of Result Result Analysis and Financial Management Outlook AppendicesMacquarie I FY19 result announcement I macquarie.com
Financial performance
For
per
sona
l use
onl
y
12
Introduction Overview of Result Result Analysis and Financial Management Outlook AppendicesMacquarie I FY19 result announcement I macquarie.com
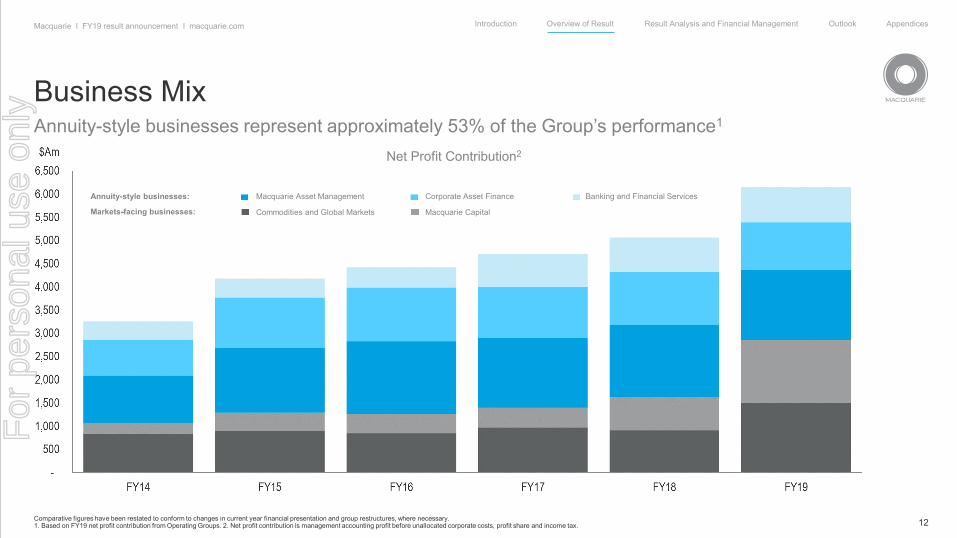
Business MixAnnuity-style businesses represent approximately 53% of the Group’s performance1
Comparative figures have been restated to conform to changes in current year financial presentation and group restructures, where necessary. 1. Based on FY19 net profit contribution from Operating Groups. 2. Net profit contribution is management accounting profit before unallocated corporate costs, profit share and income tax.
Markets-facing businesses:
Net Profit Contribution2
Annuity-style businesses:
Commodities and Global Markets
Macquarie Asset Management
Macquarie Capital
Corporate Asset Finance Banking and Financial Services
For
per
sona
l use
onl
y
13
Introduction Overview of Result Result Analysis and Financial Management Outlook AppendicesMacquarie I FY19 result announcement I macquarie.com
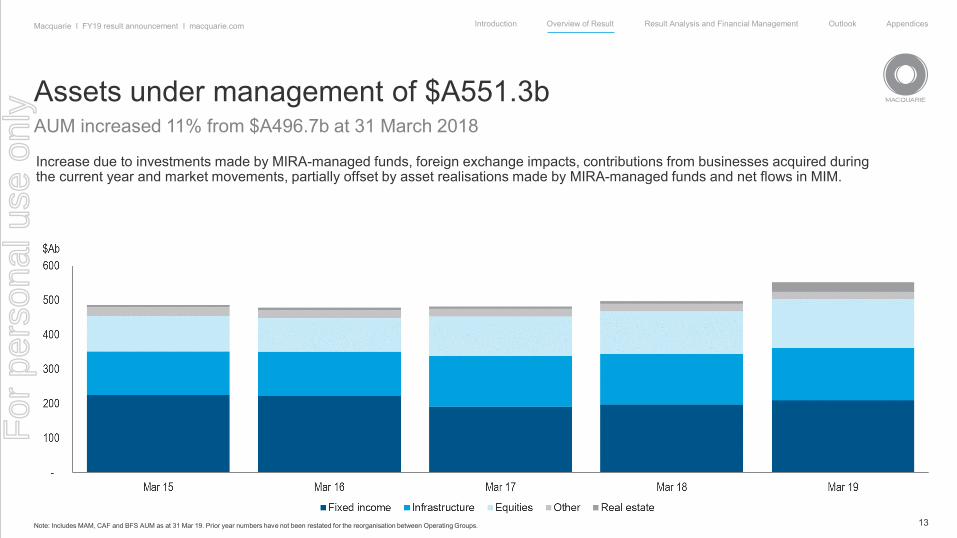
Assets under management of $A551.3bAUM increased 11% from $A496.7b at 31 March 2018
Note: Includes MAM, CAF and BFS AUM as at 31 Mar 19. Prior year numbers have not been restated for the reorganisation between Operating Groups.
Increase due to investments made by MIRA-managed funds, foreign exchange impacts, contributions from businesses acquired during the current year and market movements, partially offset by asset realisations made by MIRA-managed funds and net flows in MIM.
For
per
sona
l use
onl
y

14
Introduction Overview of Result Result Analysis and Financial Management Outlook AppendicesMacquarie I FY19 result announcement I macquarie.com
Diversification by regionInternational income 66% of total income1
Total staff2 15,715, International staff 58% of total
1. Net operating income excluding earnings on capital and other corporate items. 2. Includes staff employed in certain operationally segregated subsidiaries throughout the presentation 3. Includes New Zealand. 4. Includes staff employed at MIRA-managed fund assets and assets Macquarie Capital has invested in.
EUROPEAmsterdamBraintreeDublinEdinburghFrankfurtGenevaLondonLuxembourgMadridMunichParisReadingViennaZurich
MIDDLE EASTAbu DhabiDubai
SOUTH AFRICACape TownJohannesburg
CANADACalgaryMontrealTorontoVancouver
LATIN AMERICAMexico CitySao PauloSantiago
USAAustinBostonChicagoDenverHoustonJacksonvilleLos AngelesMinneapolis
NashvilleNew YorkOrlandoPhiladelphiaSan DiegoSan FranciscoSan Jose
29%of total income
Staff
2,889
Americas
Assets under management
$A275.5bemploying 32,000+ people4
of total income
Staff
2,407
EMEA
Assets under management
$A107.5b employing 50,000+ people4Income
$A3,707m
Income
$A3,472m
Staff
6,673
AUSTRALIAAdelaideBrisbaneCanberraGold CoastManlyMelbourne
Newcastle ParramattaPerthSydney
NEW ZEALANDAuckland
34%of total income
Australia3
Assets under management
$A108.1bemploying 8,000+ people4
Income
$A4,235m
ASIABangkokBeijingGurugramHong KongHsin-ChuJakartaKuala Lumpur
ManilaMumbaiSeoulShanghaiSingaporeTaipeiTokyo
Staff
3,746
Assets under management
$A60.2bemploying 39,000+ people4
Income
$A1,138m
9%of total income
Asia
28%
For
per
sona
l use
onl
y

15
Introduction Overview of Result Result Analysis and Financial Management Outlook AppendicesMacquarie I FY19 result announcement I macquarie.com
Total income
Diversification by region66% of total income1 in FY19 was generated offshoreA 10% movement2 in AUD is estimated to have approximately a 7% impact on NPAT
1. Excluding earnings on capital and other corporate items. 2. This represents an average movement against all major currencies.
For
per
sona
l use
onl
y
16
Introduction Overview of Result Result Analysis and Financial Management Outlook AppendicesMacquarie I FY19 result announcement I macquarie.com
MACQUARIE INFRASTRUCTUREAND REAL ASSETS (MIRA)
MACQUARIE INVESTMENT MANAGEMENT (MIM)
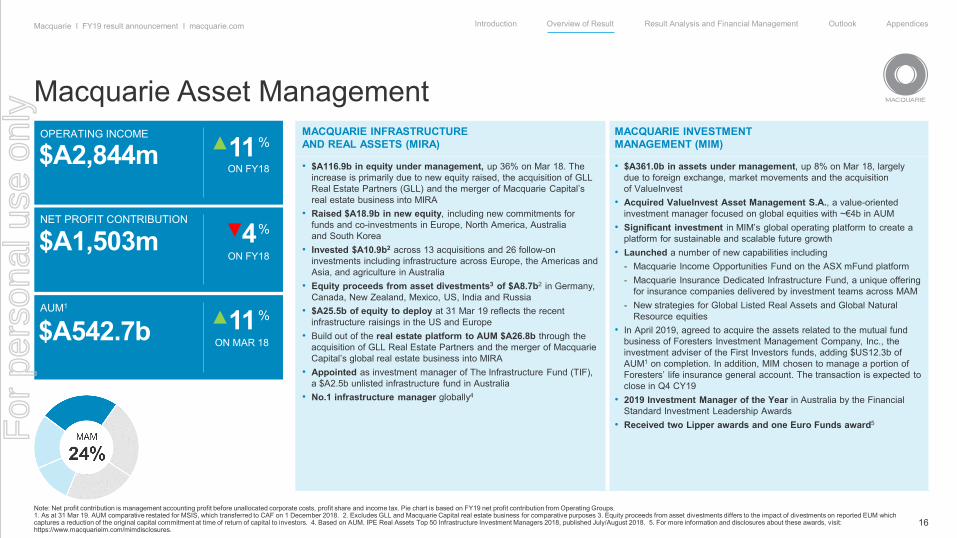
• $A116.9b in equity under management, up 36% on Mar 18. The increase is primarily due to new equity raised, the acquisition of GLL Real Estate Partners (GLL) and the merger of Macquarie Capital’s real estate business into MIRA
• Raised $A18.9b in new equity, including new commitments for funds and co-investments in Europe, North America, Australia and South Korea
• Invested $A10.9b2 across 13 acquisitions and 26 follow-on investments including infrastructure across Europe, the Americas and Asia, and agriculture in Australia
• Equity proceeds from asset divestments3 of $A8.7b2 in Germany, Canada, New Zealand, Mexico, US, India and Russia
• $A25.5b of equity to deploy at 31 Mar 19 reflects the recent infrastructure raisings in the US and Europe
• Build out of the real estate platform to AUM $A26.8b through the acquisition of GLL Real Estate Partners and the merger of Macquarie Capital’s global real estate business into MIRA
• Appointed as investment manager of The Infrastructure Fund (TIF), a $A2.5b unlisted infrastructure fund in Australia
• No.1 infrastructure manager globally4
• $A361.0b in assets under management, up 8% on Mar 18, largely due to foreign exchange, market movements and the acquisition of ValueInvest
• Acquired ValueInvest Asset Management S.A., a value-oriented investment manager focused on global equities with ~€4b in AUM
• Significant investment in MIM’s global operating platform to create a platform for sustainable and scalable future growth
• Launched a number of new capabilities including- Macquarie Income Opportunities Fund on the ASX mFund platform - Macquarie Insurance Dedicated Infrastructure Fund, a unique offering
for insurance companies delivered by investment teams across MAM - New strategies for Global Listed Real Assets and Global Natural
Resource equities• In April 2019, agreed to acquire the assets related to the mutual fund
business of Foresters Investment Management Company, Inc., the investment adviser of the First Investors funds, adding $US12.3b of AUM1 on completion. In addition, MIM chosen to manage a portion of Foresters’ life insurance general account. The transaction is expected to close in Q4 CY19
• 2019 Investment Manager of the Year in Australia by the Financial Standard Investment Leadership Awards
• Received two Lipper awards and one Euro Funds award5
Macquarie Asset Management
Note: Net profit contribution is management accounting profit before unallocated corporate costs, profit share and income tax. Pie chart is based on FY19 net profit contribution from Operating Groups. 1. As at 31 Mar 19. AUM comparative restated for MSIS, which transferred to CAF on 1 December 2018. 2. Excludes GLL and Macquarie Capital real estate business for comparative purposes 3. Equity proceeds from asset divestments differs to the impact of divestments on reported EUM which captures a reduction of the original capital commitment at time of return of capital to investors. 4. Based on AUM. IPE Real Assets Top 50 Infrastructure Investment Managers 2018, published July/August 2018. 5. For more information and disclosures about these awards, visit: https://www.macquarieim.com/mimdisclosures.
NET PROFIT CONTRIBUTION
$A1,503m
OPERATING INCOME
$A2,844m
AUM1
$A542.7b
4%
ON FY18
%11
11%
ON FY18
ON MAR 18
For
per
sona
l use
onl
y

17
Introduction Overview of Result Result Analysis and Financial Management Outlook AppendicesMacquarie I FY19 result announcement I macquarie.com
ASSET FINANCE PRINCIPAL FINANCE
• Asset Finance portfolio of $A8.0b, up 2% on Mar 18 due to growth in Technology, Energy and Ship Finance
• Notable deals- Worked with the UK’s largest energy supplier to enhance their
existing smart meter facility to better match their rollout program and extend the tenor of our existing financing
- Assisted in providing funding solutions for a major US telco to assist with its ongoing network deployment
- Arrangement and underwrite of €137.0m European airline facility financing
• Continued growth in mobile device finance programs with over 1.2m devices
• Continued opportunities in the ship financing market with new loans of more than $A400m being written during the year
• Continued to grow the Macquarie Infrastructure Debt Investment Solutions (MIDIS) business: - Closed 21 third party investor commitments totalling $A2.8b,
bringing total commitments on MIDIS platform to $A11.2b - Closed 21 investments totalling $A2.2b in US, UK, France, Spain
and Australia, bringing total AUM to $A8.2b- $A3.0b of capital to deploy as at 31 Mar 19
• Principal Finance’s portfolio of $A4.1b, down 12% on Mar 18 due to net repayments and realisations
• Transportation Finance’s portfolio of $A9.2b, up 5% on Mar 18 due to acquisition of rotorcraft assets in the portfolio offset by asset depreciation
• Notable deals- Acquisition of a 50% interest in a portfolio of multifamily rental
properties and development pipeline in the US- Acquisition of a 120 rotorcraft portfolio from Waypoint Leasing
(Ireland) Ltd- Sale of Principal Finance’s majority stake in Energetics, a
leading UK multi-utility network provider, to a European infrastructure investor
- In April 2019, Macquarie entered into a sales agreement with a third-party investor for 25% of Macquarie Air Finance (MAF). MAF will be deconsolidated and become a Macquarie-managed entity for which Macquarie will earn fees for management support and origination services
• Asset quality remains sound and the portfolio continues to generate strong overall returns
Corporate and Asset Finance
Note: Net profit contribution is management accounting profit before unallocated corporate costs, profit share and income tax. Pie chart is based on FY19 net profit contribution from Operating Groups.
NET PROFIT CONTRIBUTION
$A1,028m
OPERATING INCOME
$A1,631m
ASSET, LOAN & TRANSPORTATION PORTFOLIO
$A21.3b
10%
ON FY18
8%
ON FY18
FLATON MAR 18
For
per
sona
l use
onl
y

18
Introduction Overview of Result Result Analysis and Financial Management Outlook AppendicesMacquarie I FY19 result announcement I macquarie.com
Banking and Financial Services
Note: Net profit contribution is management accounting profit before unallocated corporate costs, profit share and income tax. Pie chart is based on FY19 net profit contribution from Operating Groups. 1. Canstar 5-Star Rating for Outstanding Value Transaction Account – High transactor and low transactor profiles. 2. Funds on platform includes Macquarie Wrap and Vision. 3. Includes general plant & equipment. 4. BFS deposits exclude corporate/wholesale deposits.
PERSONAL BANKING BUSINESS BANKING WEALTH MANAGEMENT
• Australian mortgage portfolio of $A38.5b, up 18% on Mar 18, representing approximately 2% of the Australian market
• Continued investment in the home loan origination process to improve customer experience
• Macquarie Transaction Account named as a winner in the 2019 Mozo Experts Choice Awards for Exceptional Everyday Account. Macquarie also awarded a Mozo Experts Choice Award for Internet Banking
• Macquarie Transaction Account maintained Canstar’s 5-Star Rating for Outstanding Value1
• Business banking deposit volumes up 8% on Mar 18
• Business banking loan portfolio of $A8.2b up 12% on Mar 18
• Total business banking clients up 4% on Mar 18
• Won Best Non Major Business Bank and Best Industry Specialisation awards at the 2018 Australian Business Banking Awards
• Sold stake in insurance funding business, Macquarie Pacific Funding, to Steadfast Group
• Ongoing focus on third party distribution with continued growth in SME and middle market cash flow lending and deposits
• Funds on platform2 of $A86.0b, up 4% on Mar 18
• Expanded Macquarie Wrap managed accounts offering, with assets under management of $A2.3b, up from $A1.1b in Mar 18
• Continued implementation of cloud-based investment and portfolio management platform as part of ongoing wealth platform transformation
• Awarded Outstanding Private Bank in Australia in the $A10m+ category at the 2018 Australian Business Banking Awards for the second year in a row
• Named Retail Superannuation Fund of the Year at the Roy Morgan Customer Satisfaction Awards 2019LEASING
• Australian vehicle finance portfolio3 of $A15.2b, down 5% on Mar 18 due to declining new car sales nationally, lower dealer finance and run off in previously acquired portfolio
• Macquarie Vehicle Leasing (Leasing) transferred into BFS from CAF on 1 Dec 18 and will be fully integrated into the Personal Banking and Business Banking channels for FY20
DEPOSITS• Total BFS deposits4 of $A53.4b, up 17% on Mar 18
− CMA deposits of $A27.2b, up 5% on Mar 18• Awarded Best Cash and Term Deposit Accounts at the 2018 SMSF Awards and Core Data SMSF Service Provider Awards for the third
consecutive year
NET PROFIT CONTRIBUTION
$A756m
OPERATING INCOME
$A2,103m
3%
ON FY18
4%
ON FY18
AUSTRALIAN CLIENT NUMBERS
1.5 millionMORE THAN
For
per
sona
l use
onl
y

19
Introduction Overview of Result Result Analysis and Financial Management Outlook AppendicesMacquarie I FY19 result announcement I macquarie.com
Commodity Markets(Physical & Financial) 83%1
Financial Markets(Primary & Secondary) 11%1
Futures6%1
COMMODITY MARKETSAND FINANCE
FIXED INCOME & CURRENCIES
CREDIT MARKETS
CASH EQUITIES AND EQUITY
DERIVATIVES & TRADING
FUTURES
• Strong results across the commodities platform, particularly from North American Gas and Power, Global Oil, and EMEA Gas and Power
• Significant contribution from the North American Gas and Power business driven by supply-demand imbalance across regional US centres
• Increased client hedging activity and improved trading opportunities
• Gains on physical and financial oil trading across Europe and North America
• Consistent contribution from Agriculture, Metals and Mining
• Increased average index volumes in investor products business
• Ranked No.1 North America Power Dealer of the Year3
• Strong result across the platform
• Increased sales and hedging activity in foreign exchange across all regions
• Improved client demand for UK securitisations
• Result up on FY18 due to continued growth from settlement financing activity with clients engaged in the US corporate direct lending market
• Result impacted by challenging market conditions and reduced opportunities
• Maintained platform strength in Australia
• Ongoing investment in technology
• Ranked 2nd overall for Research in 2018 Peter Lee survey of Australian institutional investors
• No.2 in Australian and New Zealand ECM4
• Strong overall result primarily driven by increased contribution from the US and continued strength in Australia due to client activity
• Ranked No.1 Futures broker on the ASX5
Commodities and Global Markets
Note: Net profit contribution is management accounting profit before unallocated corporate costs, profit share and income tax. Pie chart is based on FY19 net profit contribution from Operating Groups. 1. Percentages are based on net profit contribution before impairment charges. 2. Platts Q4 CY18. 3. 2019 Energy Risk Commodity Rankings. 4. Dealogic and Refinitiv 1 Apr 18 – 31 Mar 19. 5. Based on overall market share on ASX24 Futures volumes YTD as at 31 Mar 19.
NET PROFIT CONTRIBUTION
$A1,505m
OPERATING INCOME
$A3,883m
65%
ON FY18
34%
ON FY18
PHYSICAL GAS MARKETERin North America2No.2
For
per
sona
l use
onl
y
20
Introduction Overview of Result Result Analysis and Financial Management Outlook AppendicesMacquarie I FY19 result announcement I macquarie.com
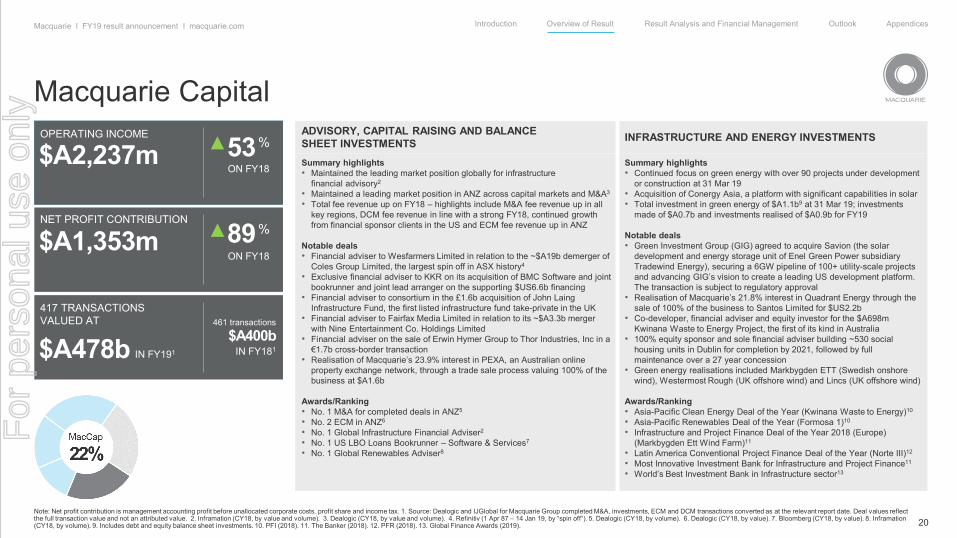
ADVISORY, CAPITAL RAISING AND BALANCE SHEET INVESTMENTS INFRASTRUCTURE AND ENERGY INVESTMENTS
Summary highlights• Maintained the leading market position globally for infrastructure
financial advisory2
• Maintained a leading market position in ANZ across capital markets and M&A3
• Total fee revenue up on FY18 – highlights include M&A fee revenue up in all key regions, DCM fee revenue in line with a strong FY18, continued growth from financial sponsor clients in the US and ECM fee revenue up in ANZ
Notable deals• Financial adviser to Wesfarmers Limited in relation to the ~$A19b demerger of
Coles Group Limited, the largest spin off in ASX history4
• Exclusive financial adviser to KKR on its acquisition of BMC Software and joint bookrunner and joint lead arranger on the supporting $US6.6b financing
• Financial adviser to consortium in the £1.6b acquisition of John Laing Infrastructure Fund, the first listed infrastructure fund take-private in the UK
• Financial adviser to Fairfax Media Limited in relation to its ~$A3.3b merger with Nine Entertainment Co. Holdings Limited
• Financial adviser on the sale of Erwin Hymer Group to Thor Industries, Inc in a €1.7b cross-border transaction
• Realisation of Macquarie’s 23.9% interest in PEXA, an Australian online property exchange network, through a trade sale process valuing 100% of the business at $A1.6b
Awards/Ranking• No. 1 M&A for completed deals in ANZ5
• No. 2 ECM in ANZ6
• No. 1 Global Infrastructure Financial Adviser2
• No. 1 US LBO Loans Bookrunner – Software & Services7
• No. 1 Global Renewables Adviser8
Summary highlights• Continued focus on green energy with over 90 projects under development
or construction at 31 Mar 19• Acquisition of Conergy Asia, a platform with significant capabilities in solar• Total investment in green energy of $A1.1b9 at 31 Mar 19; investments
made of $A0.7b and investments realised of $A0.9b for FY19
Notable deals• Green Investment Group (GIG) agreed to acquire Savion (the solar
development and energy storage unit of Enel Green Power subsidiary Tradewind Energy), securing a 6GW pipeline of 100+ utility-scale projects and advancing GIG’s vision to create a leading US development platform. The transaction is subject to regulatory approval
• Realisation of Macquarie’s 21.8% interest in Quadrant Energy through the sale of 100% of the business to Santos Limited for $US2.2b
• Co-developer, financial adviser and equity investor for the $A698m Kwinana Waste to Energy Project, the first of its kind in Australia
• 100% equity sponsor and sole financial adviser building ~530 social housing units in Dublin for completion by 2021, followed by full maintenance over a 27 year concession
• Green energy realisations included Markbygden ETT (Swedish onshore wind), Westermost Rough (UK offshore wind) and Lincs (UK offshore wind)
Awards/Ranking• Asia-Pacific Clean Energy Deal of the Year (Kwinana Waste to Energy)10
• Asia-Pacific Renewables Deal of the Year (Formosa 1)10
• Infrastructure and Project Finance Deal of the Year 2018 (Europe) (Markbygden Ett Wind Farm)11
• Latin America Conventional Project Finance Deal of the Year (Norte III)12
• Most Innovative Investment Bank for Infrastructure and Project Finance11
• World’s Best Investment Bank in Infrastructure sector13
Macquarie Capital
Note: Net profit contribution is management accounting profit before unallocated corporate costs, profit share and income tax. 1. Source: Dealogic and IJGlobal for Macquarie Group completed M&A, investments, ECM and DCM transactions converted as at the relevant report date. Deal values reflect the full transaction value and not an attributed value. 2. Inframation (CY18, by value and volume). 3. Dealogic (CY18, by value and volume). 4. Refinitiv (1 Apr 87 – 14 Jan 19, by “spin off”). 5. Dealogic (CY18, by volume). 6. Dealogic (CY18, by value). 7. Bloomberg (CY18, by value). 8. Inframation(CY18, by volume). 9. Includes debt and equity balance sheet investments. 10. PFI (2018). 11. The Banker (2018). 12. PFR (2018). 13. Global Finance Awards (2019).
MacCap
22%
NET PROFIT CONTRIBUTION
$A1,353m
OPERATING INCOME
$A2,237m
89%
ON FY18
53%
ON FY18
$A478b IN FY191
461 transactions
$A400bIN FY181
417 TRANSACTIONS VALUED AT
For
per
sona
l use
onl
y
21
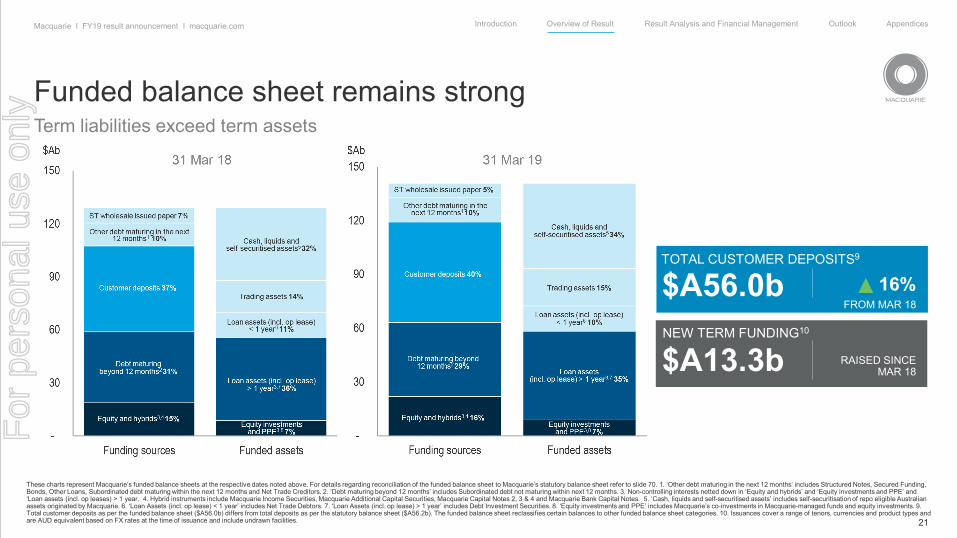
Introduction Overview of Result Result Analysis and Financial Management Outlook AppendicesMacquarie I FY19 result announcement I macquarie.com
Term liabilities exceed term assets
These charts represent Macquarie’s funded balance sheets at the respective dates noted above. For details regarding reconciliation of the funded balance sheet to Macquarie’s statutory balance sheet refer to slide 70. 1. ‘Other debt maturing in the next 12 months’ includes Structured Notes, Secured Funding, Bonds, Other Loans, Subordinated debt maturing within the next 12 months and Net Trade Creditors. 2. ‘Debt maturing beyond 12 months’ includes Subordinated debt not maturing within next 12 months. 3. Non-controlling interests netted down in ‘Equity and hybrids’ and ‘Equity investments and PPE’ and ‘Loan assets (incl. op leases) > 1 year. 4. Hybrid instruments include Macquarie Income Securities, Macquarie Additional Capital Securities, Macquarie Capital Notes 2, 3 & 4 and Macquarie Bank Capital Notes. 5. ‘Cash, liquids and self-securitised assets’ includes self-securitisation of repo eligible Australian assets originated by Macquarie. 6. ‘Loan Assets (incl. op lease) < 1 year’ includes Net Trade Debtors. 7. ‘Loan Assets (incl. op lease) > 1 year’ includes Debt Investment Securities. 8. ‘Equity investments and PPE’ includes Macquarie’s co-investments in Macquarie-managed funds and equity investments. 9. Total customer deposits as per the funded balance sheet ($A56.0b) differs from total deposits as per the statutory balance sheet ($A56.2b). The funded balance sheet reclassifies certain balances to other funded balance sheet categories. 10. Issuances cover a range of tenors, currencies and product types and are AUD equivalent based on FX rates at the time of issuance and include undrawn facilities.
TOTAL CUSTOMER DEPOSITS9
$A56.0b 16%FROM MAR 18
NEW TERM FUNDING10
$A13.3b RAISED SINCEMAR 18
Funded balance sheet remains strong
For
per
sona
l use
onl
y
22
Introduction Overview of Result Result Analysis and Financial Management Outlook AppendicesMacquarie I FY19 result announcement I macquarie.com
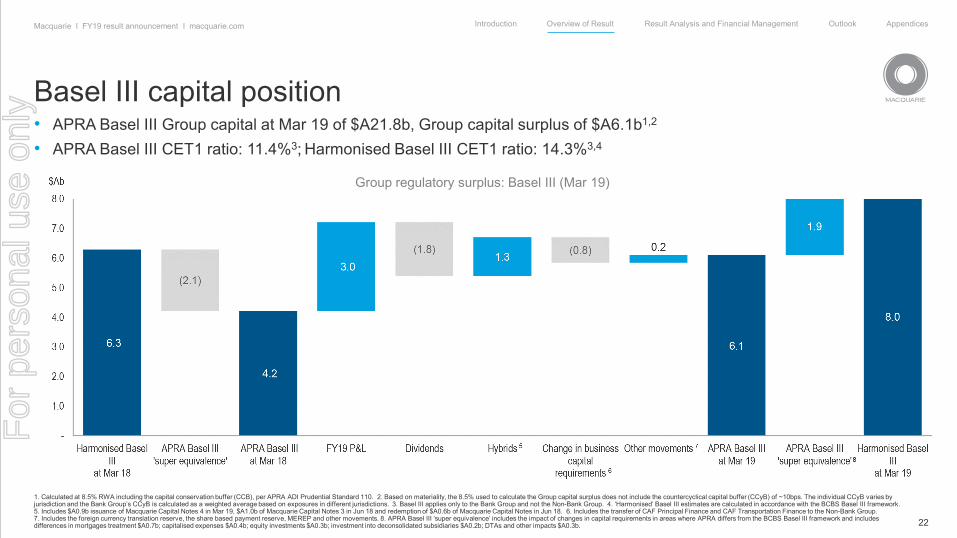
• APRA Basel III Group capital at Mar 19 of $A21.8b, Group capital surplus of $A6.1b1,2
• APRA Basel III CET1 ratio: 11.4%3; Harmonised Basel III CET1 ratio: 14.3%3,4
Basel III capital position
1. Calculated at 8.5% RWA including the capital conservation buffer (CCB), per APRA ADI Prudential Standard 110. 2. Based on materiality, the 8.5% used to calculate the Group capital surplus does not include the countercyclical capital buffer (CCyB) of ~10bps. The individual CCyB varies by jurisdiction and the Bank Group’s CCyB is calculated as a weighted average based on exposures in different jurisdictions. 3. Basel III applies only to the Bank Group and not the Non-Bank Group. 4. ‘Harmonised’ Basel III estimates are calculated in accordance with the BCBS Basel III framework. 5. Includes $A0.9b issuance of Macquarie Capital Notes 4 in Mar 19, $A1.0b of Macquarie Capital Notes 3 in Jun 18 and redemption of $A0.6b of Macquarie Capital Notes in Jun 18. 6. Includes the transfer of CAF Principal Finance and CAF Transportation Finance to the Non-Bank Group. 7. Includes the foreign currency translation reserve, the share based payment reserve, MEREP and other movements. 8. APRA Basel III ‘super equivalence’ includes the impact of changes in capital requirements in areas where APRA differs from the BCBS Basel III framework and includes differences in mortgages treatment $A0.7b; capitalised expenses $A0.4b; equity investments $A0.3b; investment into deconsolidated subsidiaries $A0.2b; DTAs and other impacts $A0.3b.
Group regulatory surplus: Basel III (Mar 19)
For
per
sona
l use
onl
y
23
Introduction Overview of Result Result Analysis and Financial Management Outlook AppendicesMacquarie I FY19 result announcement I macquarie.com
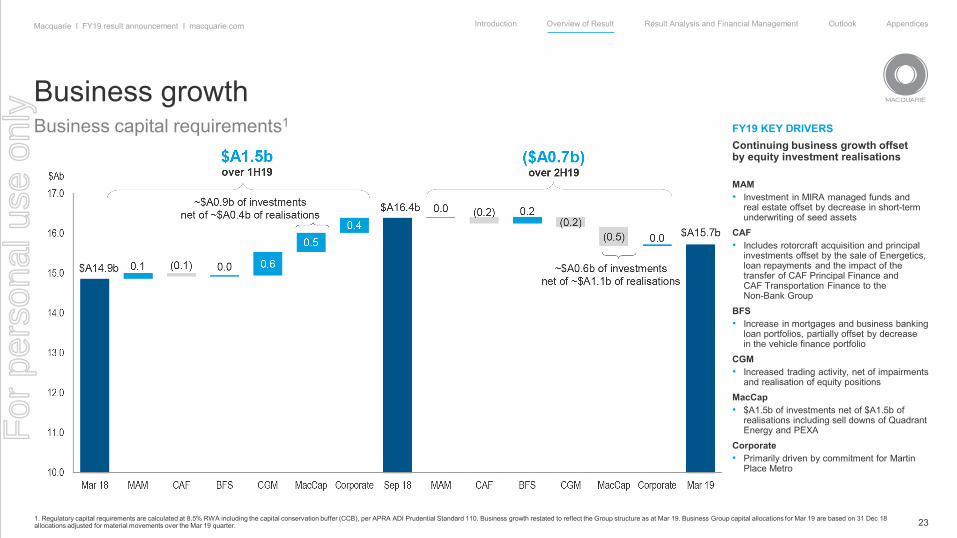
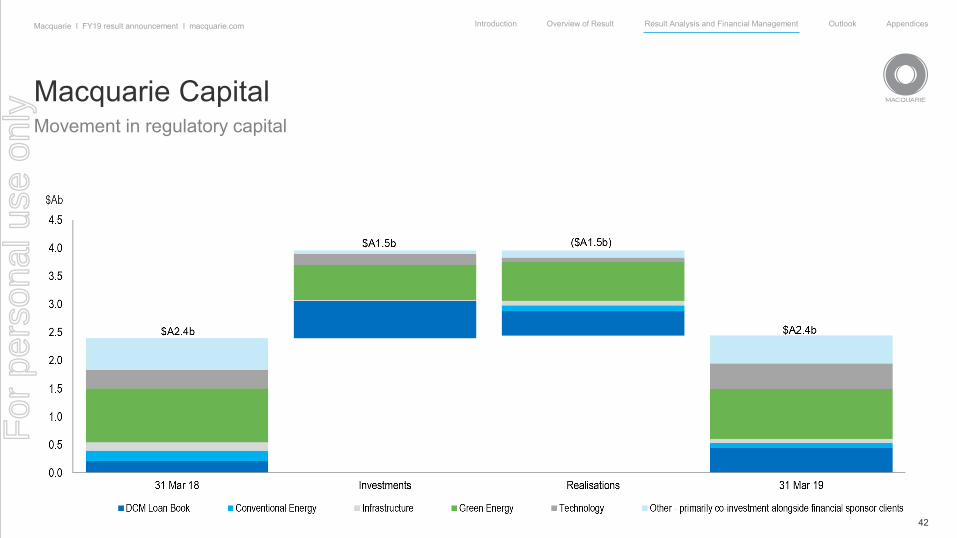
FY19 KEY DRIVERSContinuing business growth offset by equity investment realisations
MAM• Investment in MIRA managed funds and
real estate offset by decrease in short-term underwriting of seed assets
CAF• Includes rotorcraft acquisition and principal
investments offset by the sale of Energetics, loan repayments and the impact of the transfer of CAF Principal Finance and CAF Transportation Finance to the Non-Bank Group
BFS• Increase in mortgages and business banking
loan portfolios, partially offset by decrease in the vehicle finance portfolio
CGM• Increased trading activity, net of impairments
and realisation of equity positionsMacCap• $A1.5b of investments net of $A1.5b of
realisations including sell downs of Quadrant Energy and PEXA
Corporate• Primarily driven by commitment for Martin
Place Metro
1. Regulatory capital requirements are calculated at 8.5% RWA including the capital conservation buffer (CCB), per APRA ADI Prudential Standard 110. Business growth restated to reflect the Group structure as at Mar 19. Business Group capital allocations for Mar 19 are based on 31 Dec 18 allocations adjusted for material movements over the Mar 19 quarter.
Business capital requirements1
~$A0.6b of investments net of ~$A1.0b of realisations
~$A0.9b of investments net of ~$A0.5b of realisations
0.1-
0.0 0.6
0.50.4
0.0 0.2
0.0-
(0.1)
(0.2)(0.2)
(0.5)
10.0
11.0
12.0
13.0
14.0
15.0
16.0
17.0
Mar 18 MAM CAF BFS CGM MacCap Corporate Sep 18 MAM CAF BFS CGM MacCap Corporate Mar 19
$A15.7b
$A16.4b
$A14.9b
$A1.5bover 1H19
($A0.7b)over 2H19
~$A0.6b of investments net of ~$A1.1b of realisations
~$A0.9b of investments net of ~$A0.4b of realisations
$Ab
Business growth
For
per
sona
l use
onl
y

24
Introduction Overview of Result Result Analysis and Financial Management Outlook AppendicesMacquarie I FY19 result announcement I macquarie.com
Bank Group (Mar 19)
Strong regulatory ratios
1. ‘Harmonised’ Basel III estimates are calculated in accordance with the BCBS Basel III framework. 2. Average LCR for Mar 19 quarter is based on an average of daily observations. 3. Includes the capital conservation buffer in the minimum CET1 ratio requirement. In Nov 18, APRA released a draft update to 'Prudential Standard APS 110 Capital Adequacy' proposing a minimum requirement for the leverage ratio of 3.5% effective Jan 22.
2
For
per
sona
l use
onl
y
25
Introduction Overview of Result Result Analysis and Financial Management Outlook AppendicesMacquarie I FY19 result announcement I macquarie.com
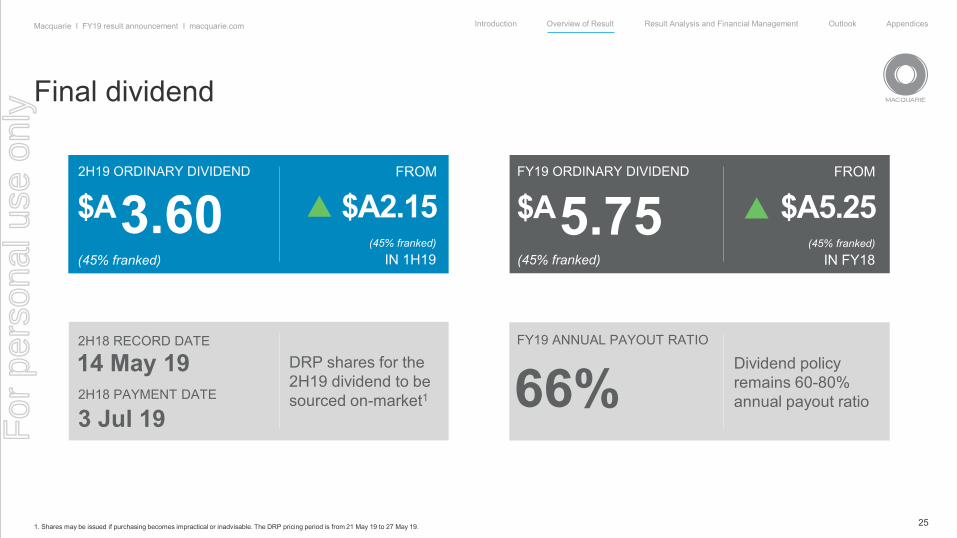
Final dividend
1. Shares may be issued if purchasing becomes impractical or inadvisable. The DRP pricing period is from 21 May 19 to 27 May 19.
FY19 ANNUAL PAYOUT RATIO
66%Dividend policy remains 60-80% annual payout ratio
2H18 RECORD DATE
14 May 19 DRP shares for the 2H19 dividend to be sourced on-market12H18 PAYMENT DATE
3 Jul 19
FY19 ORDINARY DIVIDEND
5.75 $A5.25IN FY18
FROM
(45% franked)(45% franked)
$A2H19 ORDINARY DIVIDEND
3.60 $A2.15IN 1H19
FROM
(45% franked)
(45% franked)
$A
For
per
sona
l use
onl
y

26
Introduction Overview of Result Result Analysis and Financial Management Outlook AppendicesMacquarie I FY19 result announcement I macquarie.com
Commodities and Global Markets (CGM)• Effective 31 March 2019, Andrew Downe stepped down as Group Head of CGM and from the
Executive Committee. He will continue to lead the Cash Equities business globally and retain regional leadership for CGM in Asia. Mr Downe has been with Macquarie for 37 years and on the Executive Committee for 22 years.
• Effective 1 April 2019, Nicholas O’Kane became Group Head of CGM, following two years of transition in anticipation of this change. Mr O’Kane has been with Macquarie for 24 years and on the Executive Committee since June 2017. He has extensive experience in global commodities and financial markets, leading CGM’s global energy markets business since 2007, which in 2017 was expanded to include all commodity financing, trading and client coverage activities across energy, metals and agriculture.
Macquarie Capital (MacCap)• Effective 31 May 2019, Tim Bishop will step down as Group Head of Macquarie Capital and from the
Executive Committee. He will become Chairman of Macquarie Capital to assist with transition. Mr Bishop has been with Macquarie for 20 years, on the Executive Committee for nine years and Head of Macquarie Capital for seven years.
• Effective 1 June 2019, Daniel Wong, currently Global Co-Head of the Infrastructure and Energy Group based in London, and Michael Silverton, currently Head of the Americas, Europe and Asia Group based in New York, will become Group Co-Heads of Macquarie Capital and join the Executive Committee. Both have been with Macquarie for 20 years, the majority of which has been spent building the Macquarie Capital business in international markets.
Management changes
Andrew Downe Nicholas O’Kane
Tim Bishop
Daniel Wong Michael Silverton
For
per
sona
l use
onl
y
MACQUARIE 2019
Result Analysis and Financial ManagementAlex HarveyChief Financial Officer
03
For
per
sona
l use
onl
y

28
Introduction Overview of Result Result Analysis and Financial Management Outlook AppendicesMacquarie I FY19 result announcement I macquarie.com
2H19 $Am
1H19 $Am
FY19 $Am
FY18 $Am
Net interest and trading income 2,322 2,229 4,551 3,943
Fee and commission income 2,865 2,661 5,526 4,670
Net operating lease income 489 461 950 935
Share of net (losses)/profits of associates and joint ventures (63) 7 (56) 241
Credit and Other impairment charges (476) (76) (552) (366)
Investment income 1,617 485 2,102 1,233
Other income 170 63 233 264
Net operating income 6,924 5,830 12,754 10,920
Employment expenses (2,763) (2,454) (5,217) (4,493)
Brokerage, commissions and trading-related expenses (561) (579) (1,140) (830)
Other operating expenses (1,438) (1,092) (2,530) (2,133)
Total operating expenses (4,762) (4,125) (8,887) (7,456)
Operating profit before tax and non-controlling interests 2,162 1,705 3,867 3,464
Income tax expense (505) (374) (879) (883)
Non-controlling interests 15 (21) (6) (24)
Profit attributable to MGL shareholders 1,672 1,310 2,982 2,557
• Net interest and trading income of $A4,551m, up 15% on FY18– Increased contribution across CGM’s commodities platform driven by client hedging activity
in Risk management and significant opportunities in North American Gas and Power due to supply-demand imbalances
– Partially offset by lower interest income from CAF’s Principal Finance loan portfolio• Fee and commission income of $A5,526m, up 18% on FY18
– Increase in base fees from investments made by MIRA-managed funds, favourable foreign exchange movements, and contributions from businesses acquired during the year, and higher performance fees from a broad range of MIRA-managed funds, managed accounts and co-investors in MAM
– Higher M&A and other fee income in Macquarie Capital– Increase in income following the adoption of AASB 15 ($A262m), offset by brokerage, commissions
and trading-related expenses• Share of net losses of associates and joint ventures of $A56m, significantly down on FY18, primarily
reflecting a change in the composition and performance of investments in Macquarie Capital’s portfolio, including increased expenditure on green energy and other projects in the development phase
• Higher credit and other impairment charges compared to FY18, mainly reflecting impairment charges related to a small number of underperforming investments in Macquarie Capital and specific commodity equity positions in CGM. FY18 included the write-down of MIRA’s investment in MIC
• Investment income of $A2,102m, up 70% on FY18, primarily due to higher revenue from asset realisations, particularly in the technology, green energy and conventional energy sectors in Macquarie Capital and investment realisations in CAF Principal Finance including Energetics, partially offset by the non-recurrence of gains on reclassification of certain investments in MAM and CAF
• Total operating expenses of $A8,887m, up 19% on FY18 mainly due to increased performance-related profit share and share-based payments expense, higher average headcount, an increase in business activity and investment in technology projects, the impact of AASB 15 adoption and unfavourable foreign exchange movements
Income statement key drivers
For
per
sona
l use
onl
y

29
Introduction Overview of Result Result Analysis and Financial Management Outlook AppendicesMacquarie I FY19 result announcement I macquarie.com
Operating expensesOperating expenses excluding the impact of FX and AASB 15 are up 12%
KEY DRIVERS• Following the adoption of AASB 15, $A262m of fee
expenses relating to stock borrowing activities and certain recoverable costs previously presented net of associated revenues have been reclassified to Brokerage, commission and trading-related expenses
• Employment expenses mainly reflect higher performance-related expenses, increased average headcount to support business growth and the impact of business acquisitions
• Other mainly includes the impact of increased business activity (such as professional fees, travel and brokerage and commission expense), higher technology spend, indirect tax expenses and other one-off and legacy lending transaction-related expenses
For
per
sona
l use
onl
y

30
Introduction Overview of Result Result Analysis and Financial Management Outlook AppendicesMacquarie I FY19 result announcement I macquarie.com
Income statement by operating group
( 55 ) ( 112 )
( 663 )
2,557
19
595
637
4
2,982
1,500
2,000
2,500
3,000
3,500
4,000
FY18 NPAT MAM CAF BFS CGM MacCap Corporate(excl. taxexpense)
Tax expense FY19 NPAT
KEY DRIVERS• MAM: Increased base and performance
fees along with reduced impairments, offset by higher operating expenses and lower investment-related income
• CAF: Prior year included higher Asset Finance investment-related income and reduced credit and other impairment charges
• BFS: Strong volume growth in Lending, Deposits and Platforms, partially offset by higher operating and technology expenses
• CGM: Strong performance in commodities, fixed income & currencies and futures, partially offset by lower equity trading income and higher operating expenses
• MacCap: Strong investment-related income and fee and commission income, partially offset by higher net credit and other impairment charges and increased expenditure on green energy and other projects in the development phase
• Corporate: includes higher performance-related expenses driven by the improved overall performance of the Operating Groups and other corporate expenses
$Am
For
per
sona
l use
onl
y
31
Introduction Overview of Result Result Analysis and Financial Management Outlook AppendicesMacquarie I FY19 result announcement I macquarie.com
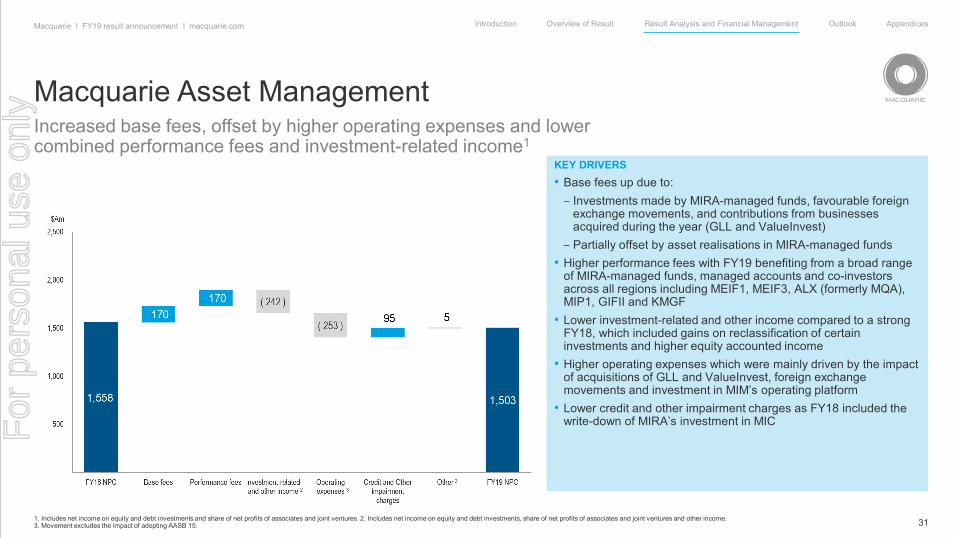
Macquarie Asset Management Increased base fees, offset by higher operating expenses and lower combined performance fees and investment-related income1
KEY DRIVERS• Base fees up due to:
– Investments made by MIRA-managed funds, favourable foreign exchange movements, and contributions from businesses acquired during the year (GLL and ValueInvest)
– Partially offset by asset realisations in MIRA-managed funds• Higher performance fees with FY19 benefiting from a broad range
of MIRA-managed funds, managed accounts and co-investors across all regions including MEIF1, MEIF3, ALX (formerly MQA), MIP1, GIFII and KMGF
• Lower investment-related and other income compared to a strong FY18, which included gains on reclassification of certain investments and higher equity accounted income
• Higher operating expenses which were mainly driven by the impact of acquisitions of GLL and ValueInvest, foreign exchange movements and investment in MIM’s operating platform
• Lower credit and other impairment charges as FY18 included the write-down of MIRA’s investment in MIC
1. Includes net income on equity and debt investments and share of net profits of associates and joint ventures. 2. Includes net income on equity and debt investments, share of net profits of associates and joint ventures and other income. 3. Movement excludes the impact of adopting AASB 15.
For
per
sona
l use
onl
y
32
Introduction Overview of Result Result Analysis and Financial Management Outlook AppendicesMacquarie I FY19 result announcement I macquarie.com
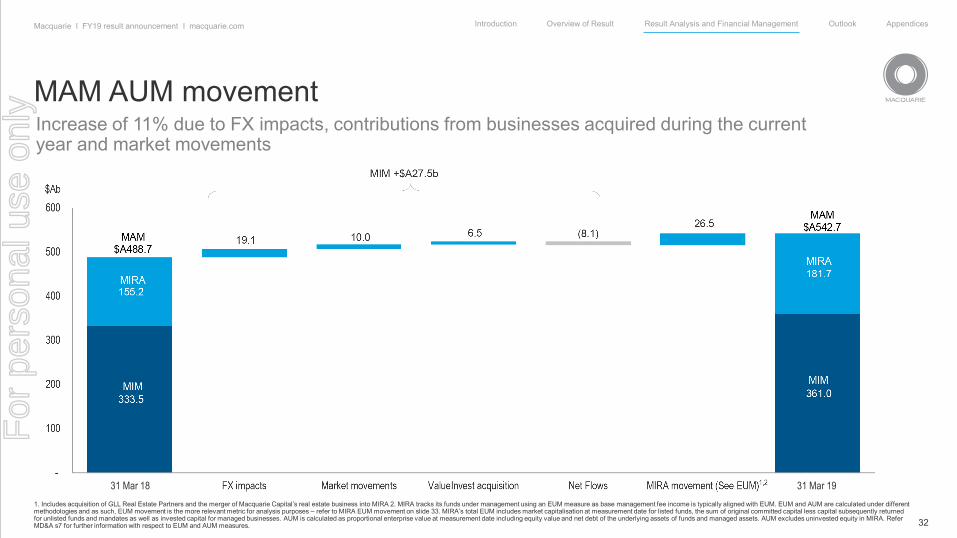
MAM AUM movement
1. Includes acquisition of GLL Real Estate Partners and the merger of Macquarie Capital’s real estate business into MIRA 2. MIRA tracks its funds under management using an EUM measure as base management fee income is typically aligned with EUM. EUM and AUM are calculated under different methodologies and as such, EUM movement is the more relevant metric for analysis purposes – refer to MIRA EUM movement on slide 33. MIRA’s total EUM includes market capitalisation at measurement date for listed funds, the sum of original committed capital less capital subsequently returned for unlisted funds and mandates as well as invested capital for managed businesses. AUM is calculated as proportional enterprise value at measurement date including equity value and net debt of the underlying assets of funds and managed assets. AUM excludes uninvested equity in MIRA. Refer MD&A s7 for further information with respect to EUM and AUM measures.
Increase of 11% due to FX impacts, contributions from businesses acquired during the current year and market movements
1,231 Mar 18 31 Mar 19
For
per
sona
l use
onl
y
33
Introduction Overview of Result Result Analysis and Financial Management Outlook AppendicesMacquarie I FY19 result announcement I macquarie.com
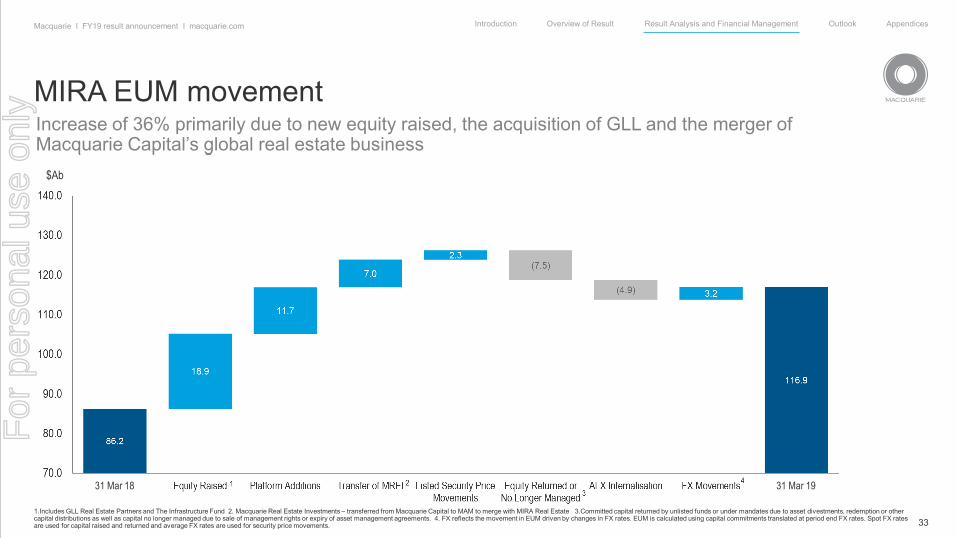
MIRA EUM movement
1.Includes GLL Real Estate Partners and The Infrastructure Fund 2. Macquarie Real Estate Investments – transferred from Macquarie Capital to MAM to merge with MIRA Real Estate 3.Committed capital returned by unlisted funds or under mandates due to asset divestments, redemption or other capital distributions as well as capital no longer managed due to sale of management rights or expiry of asset management agreements. 4. FX reflects the movement in EUM driven by changes in FX rates. EUM is calculated using capital commitments translated at period end FX rates. Spot FX rates are used for capital raised and returned and average FX rates are used for security price movements.
Increase of 36% primarily due to new equity raised, the acquisition of GLL and the merger of Macquarie Capital’s global real estate business
31 Mar 18 31 Mar 19
$Ab
For
per
sona
l use
onl
y

34
Introduction Overview of Result Result Analysis and Financial Management Outlook AppendicesMacquarie I FY19 result announcement I macquarie.com
Corporate and Asset FinancePrior year included reduced credit and other impairment charges and higher Asset Finance investment-related income1
KEY DRIVERS• Higher credit and other impairment charges largely reflecting a
partial reversal of collective provisions, driven by net loan repayments and the improved credit performance of underlying portfolios in the prior year
• Asset Finance contribution was down from the prior year driven by lower one-off investment-related income and legacy lending transaction-related expenses, partially offset by increased underlying income from the Energy, Resources and Technology portfolios and favourable foreign exchange movements
• Principal Finance and Transportation Finance contribution driven by higher investment-related income offset by decreased interest income from the loan portfolio, as well as lower underlying operating lease income
1. Investment-related income includes net income on equity and debt investments and share of net profits of associates and joint ventures.
For
per
sona
l use
onl
y
35
Introduction Overview of Result Result Analysis and Financial Management Outlook AppendicesMacquarie I FY19 result announcement I macquarie.com
1
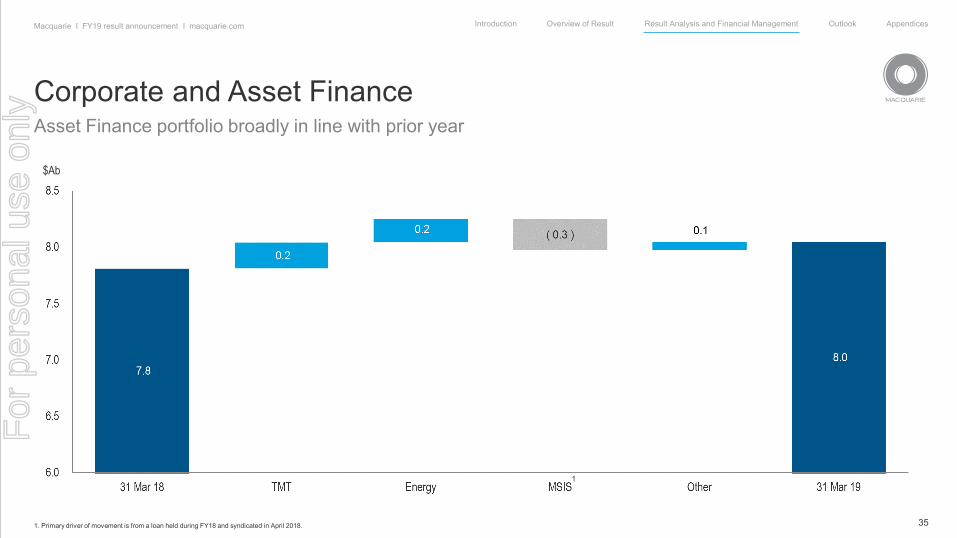
Corporate and Asset FinanceAsset Finance portfolio broadly in line with prior year
1. Primary driver of movement is from a loan held during FY18 and syndicated in April 2018.
$Ab
For
per
sona
l use
onl
y

36
Introduction Overview of Result Result Analysis and Financial Management Outlook AppendicesMacquarie I FY19 result announcement I macquarie.com
Corporate and Asset Finance
1. Acquisition of a 120 rotorcraft portfolio from Waypoint Leasing (Ireland) Ltd.
$Ab
1
Principal Finance movement in the portfolio Exposure by asset class
Mortgages
Corporate Real Estate
Infrastructure
Health & Education
Other
Rail
Rotorcraft
Aircraft
For
per
sona
l use
onl
y

37
Introduction Overview of Result Result Analysis and Financial Management Outlook AppendicesMacquarie I FY19 result announcement I macquarie.com
KEY DRIVERS• Higher Personal Banking income driven by 15% growth in
average mortgage volumes• Higher Business Banking income driven by a 12% growth
in average business banking loan volumes and a 7% growth in average business deposit volumes
• Lower Wealth Management income associated with realigning the wealth advice business to focus on the high net worth segment, partially offset by a 7% increase in average funds on platform
• Bank Levy incurred for 12 months versus 9 months in the prior year (effective 1 July 2017)
• An increase in technology expenses due to higher development activity
• Higher other operating expenses driven largely by increased professional fees, risk and regulatory costs
• Other includes lower vehicle finance income driven by a 4% fall in average vehicles volumes
( 18 )( 10 )
( 38 )
( 20 ) ( 3 )
737
44
64
-
756
600
650
700
750
800
850
900
FY18 NPC PersonalBankingincome
BusinessBankingincome
WealthManagement
income
Bank Levy Technologyexpenses
Otheroperatingexpenses
Other FY19 NPC
Strong volume growth in Lending, Deposits and PlatformsBanking and Financial Services
$Am
For
per
sona
l use
onl
y
38
Introduction Overview of Result Result Analysis and Financial Management Outlook AppendicesMacquarie I FY19 result announcement I macquarie.com
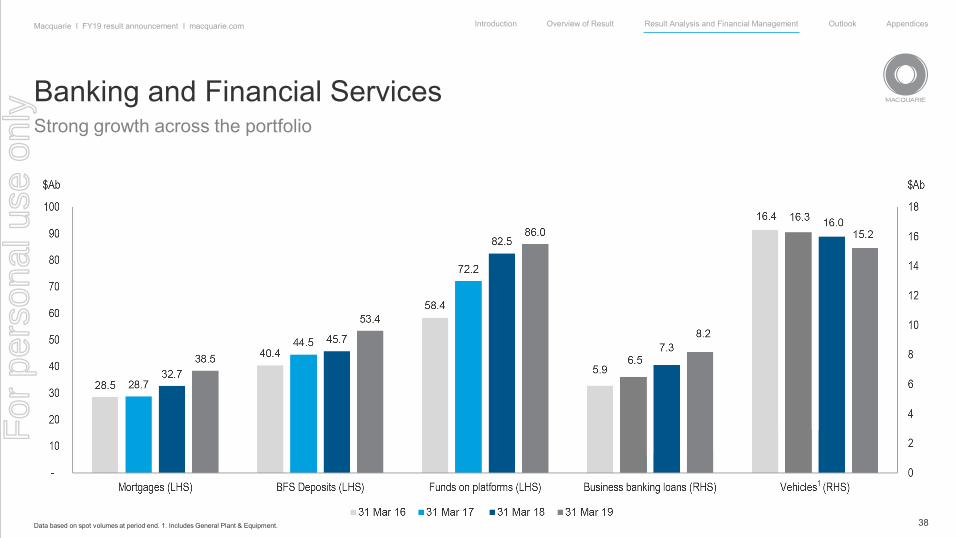
Banking and Financial ServicesStrong growth across the portfolio
Data based on spot volumes at period end. 1. Includes General Plant & Equipment.
1
For
per
sona
l use
onl
y

39
Introduction Overview of Result Result Analysis and Financial Management Outlook AppendicesMacquarie I FY19 result announcement I macquarie.com
Commodities and Global MarketsResults driven by strong performance in commodities
1. Excludes Brokerage, commission and trading-related expenses.
KEY DRIVERS• Increased net interest and trading income:
− Commodities− Strong results across the commodities platform from increased
client hedging activity particularly in North American Gas and Power, Global Oil and EMEA Gas and Power. Solid contribution from Agriculture, Metals and Mining
− Increased contribution from commodity lending activities in the Americas and ANZ
− Significant contribution from the North American Gas and Power business driven by supply-demand imbalances across regional US centres, in addition to an increased contribution from physical and financial oil trading activities in Europe and North America; partially offset by the timing of income recognition, which reduced revenue relating to transport and storage agreements
− Improved foreign exchange, interest rates and credit result driven by growth in client contributions from foreign exchange structured products across all regions
− Lower equity trading income reflecting challenging market conditions in specific Asian retail markets
• Increased credit and other impairment charges due to write-downs on underperforming financing facilities and impairment charges related to a small number of specific commodity equity positions
• Higher operating expenses driven by higher average headcount which included the full year impact of acquisitions completed in the prior year and the increased investment in technology platforms
For
per
sona
l use
onl
y
40
Introduction Overview of Result Result Analysis and Financial Management Outlook AppendicesMacquarie I FY19 result announcement I macquarie.com
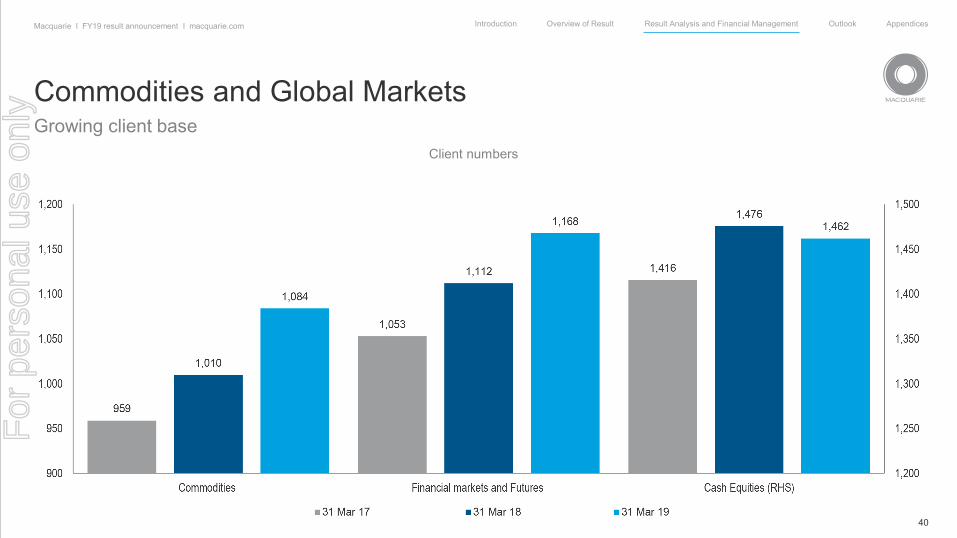
Growing client baseCommodities and Global Markets
Client numbers
For
per
sona
l use
onl
y

41
Introduction Overview of Result Result Analysis and Financial Management Outlook AppendicesMacquarie I FY19 result announcement I macquarie.com
Macquarie CapitalResult driven by strong investment-related income and fee and commission income, partially offset by higher expenses and credit and other impairment charges
1. Includes net income on equity and debt investments, share of net losses or profits of associates and joint ventures, net interest and trading expense (which represents the interest earned from debt investments and the funding costs associated with Macquarie Capital’s balance sheet positions), other income and non-controlling interests. 2. Excludes the impact of adopting AASB 15 on fee and commission income and expenses. 3. Includes non-controlling interests.
KEY DRIVERS• Higher investment-related income:
- Higher revenue from asset realisations in ANZ, Europe and the US, particularly in the technology, green energy and conventional energy sectors
- Partially offset by higher share of losses of associates and joint ventures reflecting a change in the composition and performance of investments in the portfolio, including increased expenditure on green energy and other projects in the development phase
• Increased fee and commission income:- M&A and other fee income: higher fee income across
ANZ, Europe and the US- Higher ECM fee income in ANZ- Includes the impact of foreign exchange movements
• Higher net credit and other impairment charges related to a small number of underperforming investments
• Other primarily reflects higher operating expenses from additional headcount, increased investing activity and foreign exchange movementsF
or p
erso
nal u
se o
nly
42
Introduction Overview of Result Result Analysis and Financial Management Outlook AppendicesMacquarie I FY19 result announcement I macquarie.com
Movement in regulatory capitalMacquarie Capital
For
per
sona
l use
onl
y

43
Introduction Overview of Result Result Analysis and Financial Management Outlook AppendicesMacquarie I FY19 result announcement I macquarie.com
Costs of compliance• The finance industry continues to see an increase in regulatory
initiatives, resulting in increased compliance requirements across all levels of the organisation
• Total compliance spend (excluding indirect costs) approx. $A496m in FY19, up 14% on FY18
• Regulatory project spend increased during FY19 as a result of new projects (eg. ASIC Flex commission, Royal Commission, Brexit) and a number of other technology projects
• Business as usual spend increased during FY19 from continuing spend on activities such as National Consumer Credit Protection and AML Compliance
Regulatory project spendFY19 FY18$Am $Am
IFRS 9 10 14MiFID II 10 24OTC Reform 7 8Royal Commission 6 1Brexit 11 0Other Regulatory Projects (e.g. Broker Trading Commission Ceilings, Enterprise Data Management, Counterparty Data Master) 98 63Total 142 110
Business as usual compliance spendFY19 FY18$Am $Am
Financial, Regulatory & Tax Reporting and Compliance 104 103Compliance Policy and Oversight 87 87AML Compliance 35 29Regulatory Capital Management 21 18National Consumer Credit Protection (NCCP) 15 7Regulator Levies 12 9Other Compliance functions (e.g. Business Resilience, APRA Resilience) 80 72Total 354 325
Total compliance spend 496 435
For
per
sona
l use
onl
y
44
Introduction Overview of Result Result Analysis and Financial Management Outlook AppendicesMacquarie I FY19 result announcement I macquarie.com
Balance sheet highlights
1. Total customer deposits as per the funded balance sheet ($A56.0b) differs from total deposits as per the statutory balance sheet ($A56.2b). The funded balance sheet reclassifies certain balances to other funded balance sheet categories. 2. Issuances cover a range of tenors, currencies and product types and are AUD equivalent based on FX rates at the time of issuance and include undrawn facilities. 3. Includes $A0.9b green financing.
• Balance sheet remains solid and conservative– Term assets covered by term funding, stable deposits and equity– Minimal reliance on short-term wholesale funding markets
• Total customer deposits1 continuing to grow, up 16% to $A56.0b as at Mar 19 from $A48.1b as at Mar 18• $A13.3b2 of term funding raised during FY19:
– $A6.5b of Syndicated loan facilities3
– $A3.0b of term wholesale paper issued– $A1.9b of Macquarie Capital Notes issuance– $A1.2b of Securitisations– $A0.7b refinance of secured trade finance facility
For
per
sona
l use
onl
y
45
Introduction Overview of Result Result Analysis and Financial Management Outlook AppendicesMacquarie I FY19 result announcement I macquarie.com
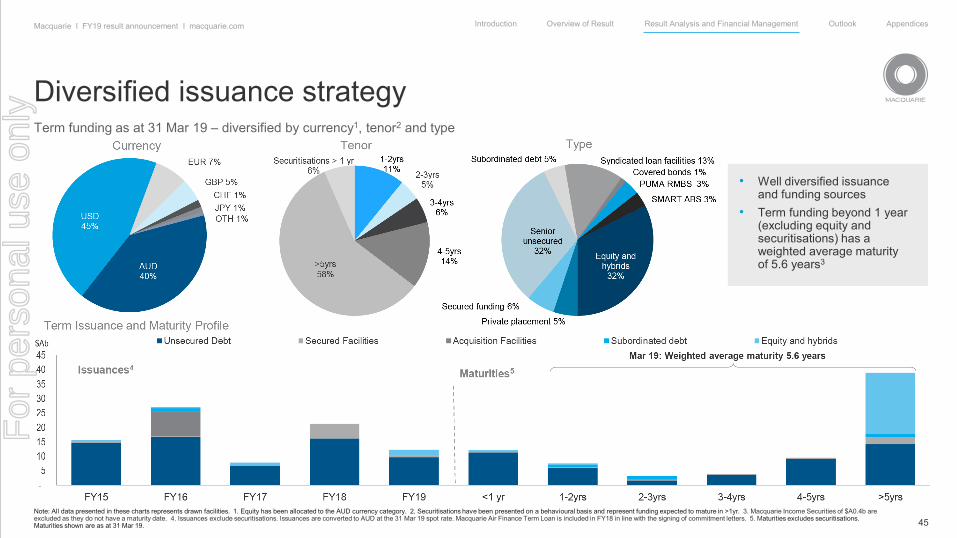
Term funding as at 31 Mar 19 – diversified by currency1, tenor2 and type
Diversified issuance strategy
Note: All data presented in these charts represents drawn facilities. 1. Equity has been allocated to the AUD currency category. 2. Securitisations have been presented on a behavioural basis and represent funding expected to mature in >1yr. 3. Macquarie Income Securities of $A0.4b are excluded as they do not have a maturity date. 4. Issuances exclude securitisations. Issuances are converted to AUD at the 31 Mar 19 spot rate. Macquarie Air Finance Term Loan is included in FY18 in line with the signing of commitment letters. 5. Maturities excludes securitisations. Maturities shown are as at 31 Mar 19.
• Well diversified issuance and funding sources
• Term funding beyond 1 year (excluding equity and securitisations) has a weighted average maturityof 5.6 years3
For
per
sona
l use
onl
y

46
Introduction Overview of Result Result Analysis and Financial Management Outlook AppendicesMacquarie I FY19 result announcement I macquarie.com
Macquarie has been successful in pursuing its strategy of diversifying its funding sources bygrowing its deposit base• Of more than 1.5 million BFS clients, circa 620,000 are depositors• Focus on the quality and composition of the deposit base• Continue to grow deposits, CMA product has an average account balance of circa $A41,000
Continued customer deposit growth
Note: Total customer deposits include total BFS deposits of $A53.4b and $A2.6b of Corporate/Wholesale deposits.
$Ab
For
per
sona
l use
onl
y
47
Introduction Overview of Result Result Analysis and Financial Management Outlook AppendicesMacquarie I FY19 result announcement I macquarie.com
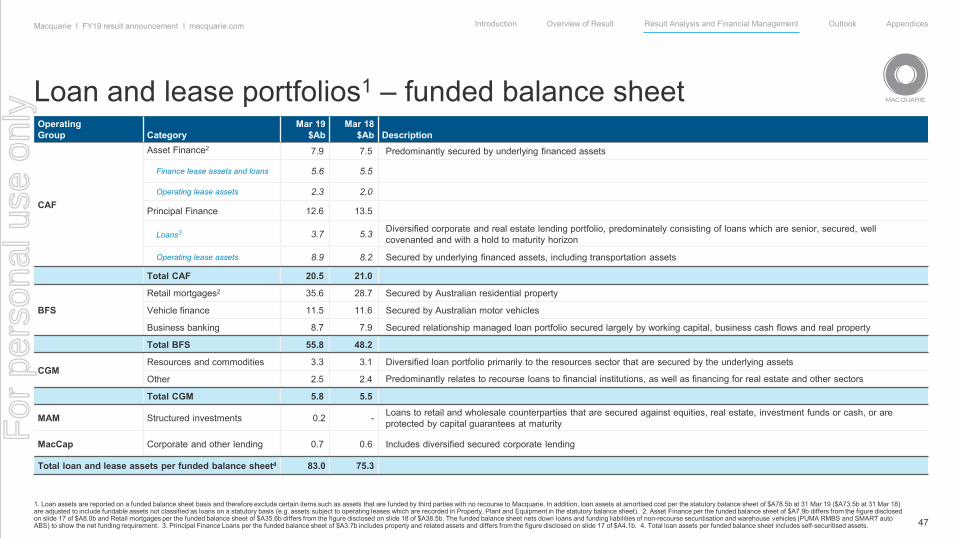
Loan and lease portfolios1 – funded balance sheet
1. Loan assets are reported on a funded balance sheet basis and therefore exclude certain items such as assets that are funded by third parties with no recourse to Macquarie. In addition, loan assets at amortised cost per the statutory balance sheet of $A78.5b at 31 Mar 19 ($A73.5b at 31 Mar 18) are adjusted to include fundable assets not classified as loans on a statutory basis (e.g. assets subject to operating leases which are recorded in Property, Plant and Equipment in the statutory balance sheet). 2. Asset Finance per the funded balance sheet of $A7.9b differs from the figure disclosed on slide 17 of $A8.0b and Retail mortgages per the funded balance sheet of $A35.6b differs from the figure disclosed on slide 18 of $A38.5b. The funded balance sheet nets down loans and funding liabilities of non-recourse securitisation and warehouse vehicles (PUMA RMBS and SMART auto ABS) to show the net funding requirement. 3. Principal Finance Loans per the funded balance sheet of $A3.7b includes property and related assets and differs from the figure disclosed on slide 17 of $A4.1b. 4. Total loan assets per funded balance sheet includes self-securitised assets.
OperatingGroup Category
Mar 19 $Ab
Mar 18$Ab Description
CAF
Asset Finance2 7.9 7.5 Predominantly secured by underlying financed assets
Finance lease assets and loans 5.6 5.5
Operating lease assets 2.3 2.0
Principal Finance 12.6 13.5
Loans3 3.7 5.3 Diversified corporate and real estate lending portfolio, predominately consisting of loans which are senior, secured, well covenanted and with a hold to maturity horizon
Operating lease assets 8.9 8.2 Secured by underlying financed assets, including transportation assets
Total CAF 20.5 21.0
BFS
Retail mortgages2 35.6 28.7 Secured by Australian residential property
Vehicle finance 11.5 11.6 Secured by Australian motor vehicles
Business banking 8.7 7.9 Secured relationship managed loan portfolio secured largely by working capital, business cash flows and real property
Total BFS 55.8 48.2
CGMResources and commodities 3.3 3.1 Diversified loan portfolio primarily to the resources sector that are secured by the underlying assets
Other 2.5 2.4 Predominantly relates to recourse loans to financial institutions, as well as financing for real estate and other sectors
Total CGM 5.8 5.5
MAM Structured investments 0.2 - Loans to retail and wholesale counterparties that are secured against equities, real estate, investment funds or cash, or areprotected by capital guarantees at maturity
MacCap Corporate and other lending 0.7 0.6 Includes diversified secured corporate lending
Total loan and lease assets per funded balance sheet4 83.0 75.3
For
per
sona
l use
onl
y

48
Introduction Overview of Result Result Analysis and Financial Management Outlook AppendicesMacquarie I FY19 result announcement I macquarie.com
Equity investments of $A5.9b1
1. Equity investments per the statutory balance sheet of $A6.1b (Mar 18: $A8.5b) have been adjusted to reflect the total economic exposure to Macquarie. 2. Total funded equity investments of $A5.9b (Mar 18: $A6.8b).
Category
Carrying value2
Mar 19 $Ab
Carrying value2
Sep 18 $Ab
Carrying value2
Mar 18 $Ab Description
Macquarie Asset Management (MIRA) managed funds
1.9 1.9 1.5 Includes Macquarie Infrastructure Corporation, Macquarie SBI Infrastructure Fund, Macquarie Korea Infrastructure Fund, Macquarie Asia Infrastructure Fund, Macquarie Infrastructure Partners 4, Macquarie European Infrastructure Fund 4
Investments acquired to seed new MIRA products and mandates
- 0.1 0.8 Includes held for sale investments acquired to seed new MIRA products and mandates
Other Macquarie-managed funds 0.3 0.4 0.4 Includes MIM funds as well as investments that hedge directors’ profit share plan liabilities
Transport, industrial and infrastructure 0.6 0.7 0.6 Over 20 separate investments
Telcos, IT, media and entertainment 0.5 0.6 0.7 Over 45 separate investments
Green energy 1.0 1.2 1.4 Over 25 separate investments
Conventional energy, resources and commodities
0.4 0.6 0.6 Over 50 separate investments
Real estate investment, property and funds management
0.7 0.3 0.3 Over 15 separate investments
Finance, wealth management and exchanges
0.5 0.5 0.5 Includes investments in fund managers, investment companies, securities exchanges and other corporations in the financial services industry
5.9 6.3 6.8
For
per
sona
l use
onl
y

49
Introduction Overview of Result Result Analysis and Financial Management Outlook AppendicesMacquarie I FY19 result announcement I macquarie.com
Regulatory update
1. ‘Revisions to the capital framework for ADIs’, 14 Feb 18. 2. ‘Prudential Standard APS 112 Capital Adequacy: Standardised approach to credit risk’, 23 Apr 18. 3. ‘APRA proposes updates to related parties framework for ADIs’; 2 Jul 18. 4. ‘Improving the transparency, comparability and flexibility of the ADI capital framework’; 14 Aug 18. 5. ‘Draft Prudential Standard APS 110 Capital Adequacy’ and ‘Response to submissions: Leverage ratio requirement for ADIs’; 27 Nov 18. 6. ‘Increasing the loss-absorbing capacity of ADIs to support orderly resolution’; 8 Nov 18. 7. ‘Minimum capital requirements for market risk’, 14 Jan 19.
Regulatory capital• APRA is currently undertaking regulatory reviews in a number of areas, including:
– Finalisation of Basel III - APRA is yet to release final standards for Australian banks to ensure that their capital levels can be considered ‘unquestionably strong’ 1
– In Apr 18, APRA released final standards for a standardised approach for measuring counterparty credit risk exposures (SA-CCR), with changes effective 1 Jul 192
– In Jul 18, APRA released a discussion paper proposing changes to the related entities framework (APS 222), with implementation from 1 Jan 20, plus any transition granted by APRA3
– In Aug 18, APRA released a discussion paper setting out potential options to improve the transparency, international comparability and flexibility of the capital framework. The proposals are not intended to change the amount of capital that ADIs are required to hold4
– In Nov 18, APRA released draft prudential standards on its implementation of a minimum requirement for the leverage ratio of 3.5% expected to be effective from Jan 225. MBL’s leverage ratio is 5.3% at Mar 19
– Loss-absorbing capacity (LAC) - APRA released a discussion paper in Nov 18 outlining its approach for LAC to support the orderly resolution of Australian ADIs6
– MBL expects to be subject to additional LAC requirements, in line with the major banks, with the final quantum of LAC to be determined by APRA as part of the resolution planning process
– APRA intends to consult on a framework for recovery and resolution in 2019, which will include further details on resolution planning– In Jan 19 the Basel Committee on Banking Supervision (BCBS) released revisions to the market risk framework7, with implementation from 1 Jan 2022. APRA is yet to
release guidance on implementation in Australia• Based on the current information available, it is Macquarie’s expectation that it will have sufficient capital to accommodate likely additional regulatory Tier 1 capital
requirements as a result of the above changes, noting that some of them are at an early stage of review and hence the final impact is uncertain• The Banking Executive Accountability Regime (BEAR) will apply to Macquarie from 1 July 2019. To ensure full compliance by this date, the vesting period of PSUs awarded
from FY2020 will be extended to four years, subject to performance hurdles.For
per
sona
l use
onl
y

50
Introduction Overview of Result Result Analysis and Financial Management Outlook AppendicesMacquarie I FY19 result announcement I macquarie.com
Regulatory update• Macquarie Equities Limited - Fee for no service review and remediation program
– Macquarie Equities Limited has completed its assessment of client files under its Fee for No Service Review. Macquarie expects to refund $3m, plus interest, in fees to clients. The outcomes of this review are subject to final assessment by the independent expert and the Australian Securities and Investments Commission.
• Brexit– As previously stated, Macquarie does not believe that the UK’s withdrawal from the European Union (EU) will be a material event for the Group– Progress on licence applications to supplement existing EU licences is well advanced with three of the four targeted new licences now in place.– Macquarie is subject to an application process that may cause the credit institution licence in Ireland to be issued early in the second half of the calendar year 2019.
Contingency arrangements are in place for a small number of clients who could be affected if the UK leaves the EU without a withdrawal or transition agreement before this licence is secured
– Macquarie has a longstanding and deep commitment to the UK as the hub for the EMEA region’s operations and this will continue to be the case. Macquarie has been in the UK for 30 years with over 1,900 staff based there as at 31 March 2019
• Germany– Macquarie continues to cooperate with German authorities in relation to an historical German lending transaction in 2011. No current staff members have been interviewed
to date. The total amount at issue is not material and MGL has provided for the matter.– As previously stated, Macquarie resolved two dividend trading matters that took place between 2006 and 2009. The industry-wide investigation relating to dividend trading
continues and Macquarie continues to respond to requests for information about its activities in this market. Macquarie’s profits from these activities were not material.
For
per
sona
l use
onl
y
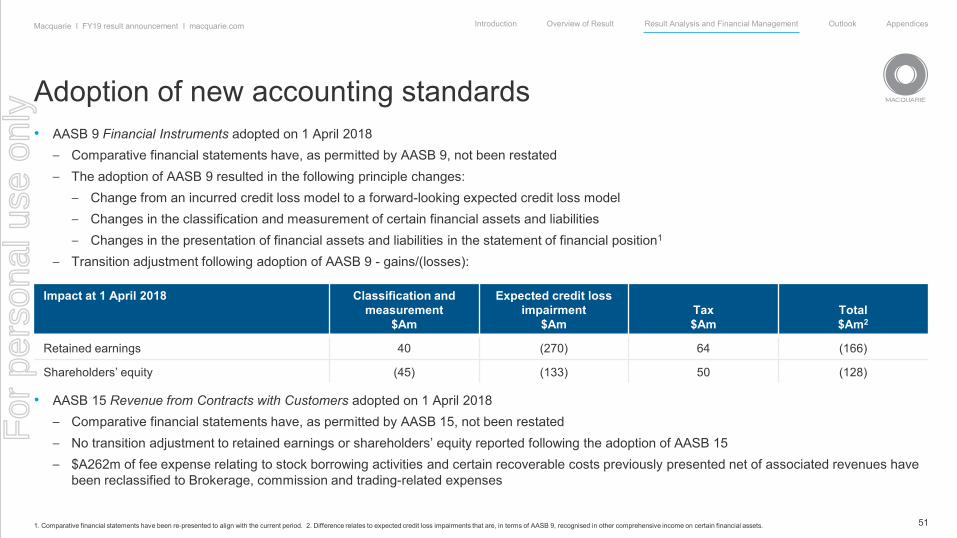
51
Introduction Overview of Result Result Analysis and Financial Management Outlook AppendicesMacquarie I FY19 result announcement I macquarie.com
Adoption of new accounting standards
1. Comparative financial statements have been re-presented to align with the current period. 2. Difference relates to expected credit loss impairments that are, in terms of AASB 9, recognised in other comprehensive income on certain financial assets.
• AASB 9 Financial Instruments adopted on 1 April 2018– Comparative financial statements have, as permitted by AASB 9, not been restated– The adoption of AASB 9 resulted in the following principle changes:
– Change from an incurred credit loss model to a forward-looking expected credit loss model– Changes in the classification and measurement of certain financial assets and liabilities– Changes in the presentation of financial assets and liabilities in the statement of financial position1
– Transition adjustment following adoption of AASB 9 - gains/(losses):
• AASB 15 Revenue from Contracts with Customers adopted on 1 April 2018– Comparative financial statements have, as permitted by AASB 15, not been restated– No transition adjustment to retained earnings or shareholders’ equity reported following the adoption of AASB 15– $A262m of fee expense relating to stock borrowing activities and certain recoverable costs previously presented net of associated revenues have
been reclassified to Brokerage, commission and trading-related expenses
Impact at 1 April 2018 Classification and measurement
$Am
Expected credit loss impairment
$AmTax $Am
Total $Am2
Retained earnings 40 (270) 64 (166)
Shareholders’ equity (45) (133) 50 (128)
For
per
sona
l use
onl
y
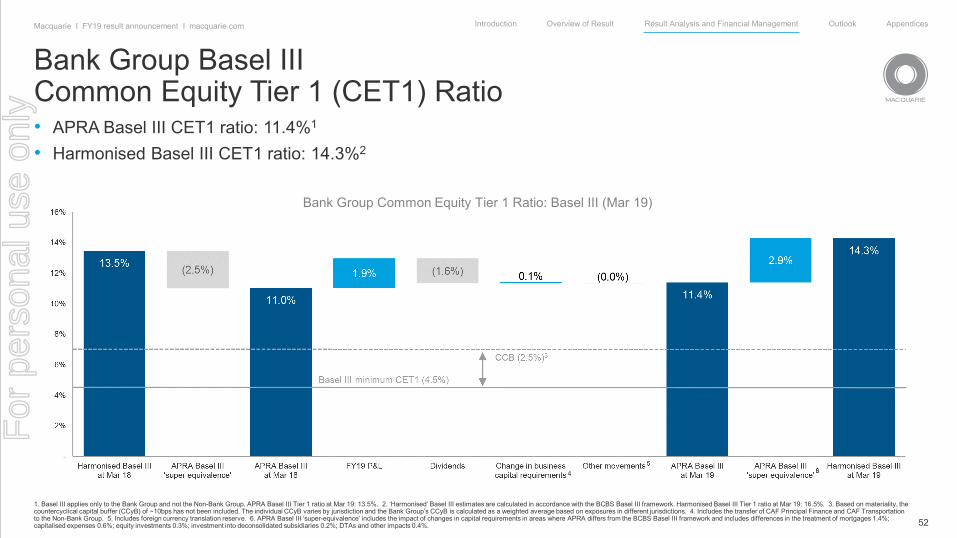
52
Introduction Overview of Result Result Analysis and Financial Management Outlook AppendicesMacquarie I FY19 result announcement I macquarie.com
Bank Group Common Equity Tier 1 Ratio: Basel III (Mar 19)
Bank Group Basel III Common Equity Tier 1 (CET1) Ratio• APRA Basel III CET1 ratio: 11.4%1
• Harmonised Basel III CET1 ratio: 14.3%2
1. Basel III applies only to the Bank Group and not the Non-Bank Group. APRA Basel III Tier 1 ratio at Mar 19: 13.5%. 2. ‘Harmonised’ Basel III estimates are calculated in accordance with the BCBS Basel III framework. Harmonised Basel III Tier 1 ratio at Mar 19: 16.5%. 3. Based on materiality, the countercyclical capital buffer (CCyB) of ~10bps has not been included. The individual CCyB varies by jurisdiction and the Bank Group’s CCyB is calculated as a weighted average based on exposures in different jurisdictions. 4. Includes the transfer of CAF Principal Finance and CAF Transportation to the Non-Bank Group. 5. Includes foreign currency translation reserve. 6. APRA Basel III ‘super-equivalence’ includes the impact of changes in capital requirements in areas where APRA differs from the BCBS Basel III framework and includes differences in the treatment of mortgages 1.4%; capitalised expenses 0.6%; equity investments 0.3%; investment into deconsolidated subsidiaries 0.2%; DTAs and other impacts 0.4%.
4
For
per
sona
l use
onl
y
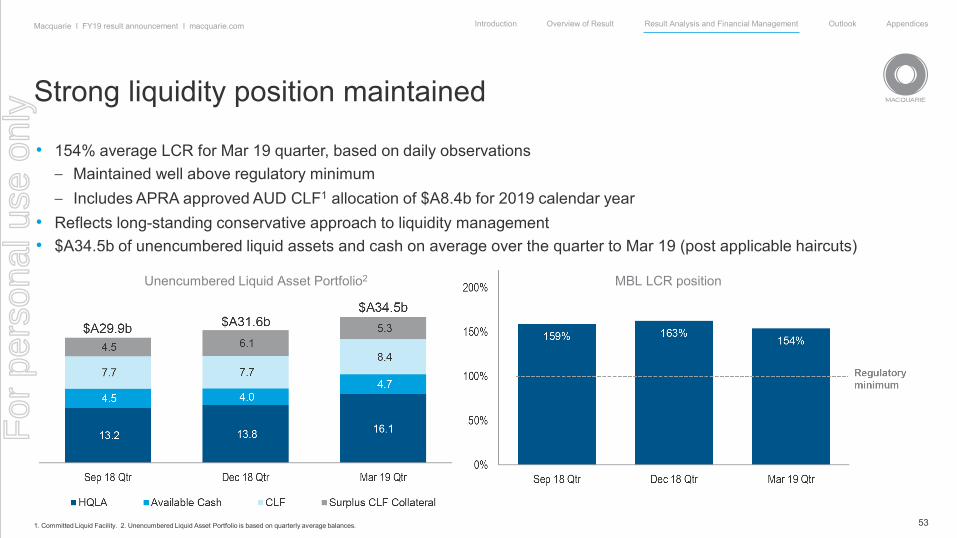
53
Introduction Overview of Result Result Analysis and Financial Management Outlook AppendicesMacquarie I FY19 result announcement I macquarie.com
Strong liquidity position maintained
• 154% average LCR for Mar 19 quarter, based on daily observations– Maintained well above regulatory minimum– Includes APRA approved AUD CLF1 allocation of $A8.4b for 2019 calendar year
• Reflects long-standing conservative approach to liquidity management• $A34.5b of unencumbered liquid assets and cash on average over the quarter to Mar 19 (post applicable haircuts)
1. Committed Liquid Facility. 2. Unencumbered Liquid Asset Portfolio is based on quarterly average balances.
MBL LCR positionUnencumbered Liquid Asset Portfolio2
For
per
sona
l use
onl
y

54
Introduction Overview of Result Result Analysis and Financial Management Outlook AppendicesMacquarie I FY19 result announcement I macquarie.com
Capital management update• Impact of changes to CAF business structure
– As previously foreshadowed, the transfer of the CAF Principal Finance and CAF Transportation businesses from the Bank Group to the Non-Bank Group occurred on 10 December 2018 following a meeting of MBL shareholders (which included holders of Macquarie Income Securities) which approved the transaction
– In connection with the transfer, MBL returned $A2.04b of capital to MGL. Additionally, the transfer resulted in a post-tax increase in ordinary equity for MBL of approximately $A0.3b which was paid as a dividend to MGL1
• Macquarie Group Employee Retained Equity Plan (MEREP)– The Board has resolved:
– To purchase shares2,3 to satisfy the MEREP requirements of approx. $A590m. The buying period for the MEREP will commence on 13 May 19 and is expected to be completed by 28 Jun 194
– MQG shares sold by staff between 13 May 19 and 7 Jun 195 are expected to be acquired by the MEREP Trustee to meet the MEREP buying requirements– Shares sold by staff during this window are to be acquired off-market at the daily Volume Weighted Average Price (VWAP)6, reducing the number of shares
acquired on-market to meet the MEREP requirements– FY18 MEREP requirements of $A454m were purchased – $A361m off-market under the staff sale arrangements and $A93m on-market, with a combined VWAP
of $A113.76• Dividend Reinvestment Plan (DRP)
– Shares for the 2H18 and 1H19 DRP were acquired on-market– The Board has resolved that no discount will apply for the 2H19 DRP and the shares are to be acquired on-market3
• Hybrids– On 7 Jun 18, Macquarie announced that it had issued 10,000,000 Macquarie Group Capital Notes 3 (MCN3) at an issue price of $A100 each, raising $A1b. The
MCN3 offer facilitated the redemption of $A600m Macquarie Group Capital Notes (MCN)– On 27 Mar 19, Macquarie announced that it had issued 9,054,910 Macquarie Group Capital Notes 4 (MCN4) at an issue price of $A100 each, raising $A905.5m
1. Via the intermediate holding company, Macquarie B.H. Pty Ltd. 2. Shares may be purchased on-market and off-market. 3. Shares will be issued if purchasing becomes impractical or inadvisable. 4. Actual buying may be completed sooner or later. On-market buying for the MEREP will be suspended during the DRP pricing period (21 May 19 to 27 May 19). 5. This date is subject to change. 6. Trades will be crossed off-market by Macquarie Securities (Australia) Limited and reported to ASX and Chi-X accordingly.
For
per
sona
l use
onl
y

MACQUARIE 2019
OutlookShemara WikramanayakeManaging Director and Chief Executive Officer
04
For
per
sona
l use
onl
y
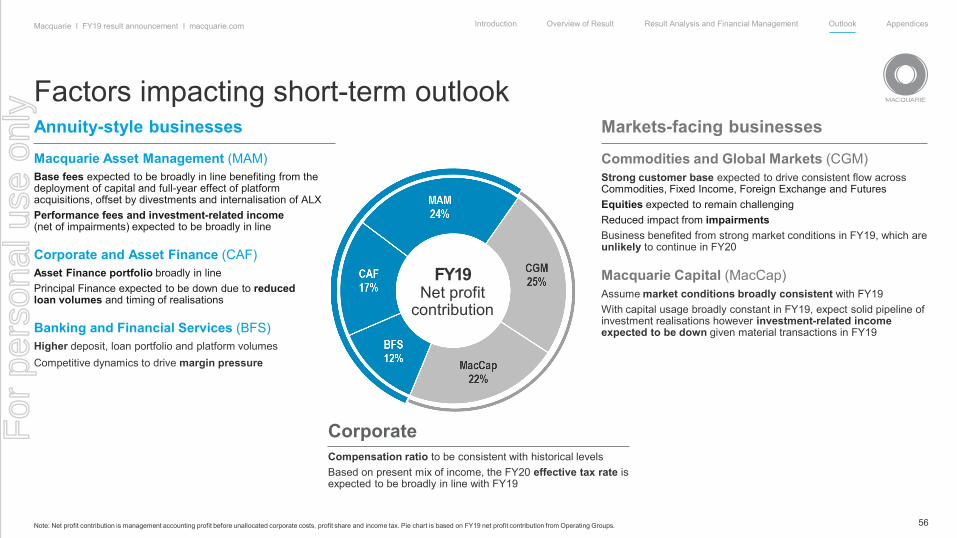
56
Introduction Overview of Result Result Analysis and Financial Management Outlook AppendicesMacquarie I FY19 result announcement I macquarie.com
Factors impacting short-term outlook
Note: Net profit contribution is management accounting profit before unallocated corporate costs, profit share and income tax. Pie chart is based on FY19 net profit contribution from Operating Groups.
Annuity-style businesses
Macquarie Asset Management (MAM)Base fees expected to be broadly in line benefiting from the deployment of capital and full-year effect of platform acquisitions, offset by divestments and internalisation of ALXPerformance fees and investment-related income (net of impairments) expected to be broadly in line
Corporate and Asset Finance (CAF)Asset Finance portfolio broadly in linePrincipal Finance expected to be down due to reduced loan volumes and timing of realisations
Banking and Financial Services (BFS)Higher deposit, loan portfolio and platform volumesCompetitive dynamics to drive margin pressure
Markets-facing businesses
Commodities and Global Markets (CGM)Strong customer base expected to drive consistent flow across Commodities, Fixed Income, Foreign Exchange and FuturesEquities expected to remain challengingReduced impact from impairmentsBusiness benefited from strong market conditions in FY19, which areunlikely to continue in FY20
Macquarie Capital (MacCap) Assume market conditions broadly consistent with FY19With capital usage broadly constant in FY19, expect solid pipeline of investment realisations however investment-related income expected to be down given material transactions in FY19
CorporateCompensation ratio to be consistent with historical levelsBased on present mix of income, the FY20 effective tax rate is expected to be broadly in line with FY19
FY19Net profit
contribution
For
per
sona
l use
onl
y
57
Introduction Overview of Result Result Analysis and Financial Management Outlook AppendicesMacquarie I FY19 result announcement I macquarie.com
Short-term outlook• The Group’s result for FY20 is currently expected to be slightly down on FY19• Our short term outlook remains subject to:
– The completion rate of transactions– Market conditions– The impact of foreign exchange– Potential regulatory changes and tax uncertainties– Geographic composition of income
For
per
sona
l use
onl
y

58
Introduction Overview of Result Result Analysis and Financial Management Outlook AppendicesMacquarie I FY19 result announcement I macquarie.com
Medium-term• Macquarie remains well positioned to deliver superior performance in the medium-term• Deep expertise in major markets • Build on our strength in diversity and continue to adapt our portfolio mix to changing market conditions
– Annuity-style income is provided by three Operating Groups’ businesses which are delivering superior returns following years of investment and acquisitions– Macquarie Asset Management, Corporate and Asset Finance and Banking and Financial Services
– Two markets-facing businesses well positioned to benefit from improvements in market conditions with strong platforms and franchise positions– Commodities and Global Markets and Macquarie Capital
• Ongoing program to identify cost saving initiatives and efficiency• Strong and conservative balance sheet
– Well matched funding profile with minimal reliance on short-term wholesale funding– Surplus funding and capital available to support growth
• Proven risk management framework and cultureFor
per
sona
l use
onl
y

59
Introduction Overview of Result Result Analysis and Financial Management Outlook AppendicesMacquarie I FY19 result announcement I macquarie.com
31 Mar 19Approximate business Basel III Capital and ROE
Note: Differences in totals due to rounding. 1. Business Group capital allocations are based on 31 Dec 18 allocations adjusted for material movements over the Mar 19 quarter. 2. NPAT used in the calculation of approx. FY19 ROE is based on Operating Groups’ net profit contribution adjusted for indicative allocations of profit share, tax and other corporate expenses. Accounting equity is attributed to businesses based on regulatory capital requirements which are based on the quarterly average capital usage from FY18 to FY19, inclusive. 13-year average covers FY07 to FY19, inclusive. 3. CAF returns prior to FY11 excluded from 13-year average as not meaningful given the significant increase in scale of CAF’s platform over this period. 4. Comprising of $A17.8b of ordinary equity and $A4.0b of hybrids.
Operating Group APRA Basel III Capital1
@ 8.5% ($Ab)Approx. FY19 Return on Ordinary Equity2
Approx. 13-Year AverageReturn on Ordinary Equity2
Annuity-style businesses 9.2Macquarie Asset Management 2.1
22% 22%3Corporate and Asset Finance 3.0
Banking and Financial Services 4.0
Markets-facing businesses 5.9Commodities and Global Markets 3.5
23% 16%Macquarie Capital 2.4
Corporate 0.6Total regulatory capital requirement @ 8.5% 15.7
Group surplus 6.1
Total APRA Basel III capital supply 21.84
For
per
sona
l use
onl
y

60
Introduction Overview of Result Result Analysis and Financial Management Outlook AppendicesMacquarie I FY19 result announcement I macquarie.com
Medium-termAnnuity-style businesses
Leading platform, well placed to grow assets under management through MAM’s diversified product offering, track record and experienced local investment teamsWell positioned for organic growth
Leverage deep industry expertise to maximise growth potential in asset and loan portfoliosPositioned for further asset acquisitions and realisations, subject to market conditions Tailored finance solutions globally across a variety of industries and asset classes
Opportunities to grow commodities business, both organically and through acquisition Development of institutional and corporate coverage for specialised credit, rates and foreign exchange productsIncrease financing activitiesGrowing the client base across all regionsLeveraging a strong market position in Asia-Pacific through investment in the equities platform
Positioned to benefit from any improvement in M&A and capital markets activityContinues to tailor the business offering to current opportunities, market conditions and strengths in each sector and region
Macquarie Asset Management (MAM)
Corporate and Asset Finance (CAF)
Strong growth opportunities through intermediary and direct retail client distribution, platforms and client serviceOpportunities to increase financial services engagement with existing business banking clients and extend into adjacent segmentsModernising technology to improve client experience and support growth
Banking and Financial Services (BFS)
Commodities and Global Markets (CGM)
Macquarie Capital (MacCap)
Markets-facing businesses
CGM
MacCapBFS
CAF
MAM
For
per
sona
l use
onl
y

Presentation to investors and analysts
3 May 2019
Result announcement for the year ended 31 March 2019
For
per
sona
l use
onl
y

MACQUARIE 2019
AppendixDetailed Result Commentary A
For
per
sona
l use
onl
y
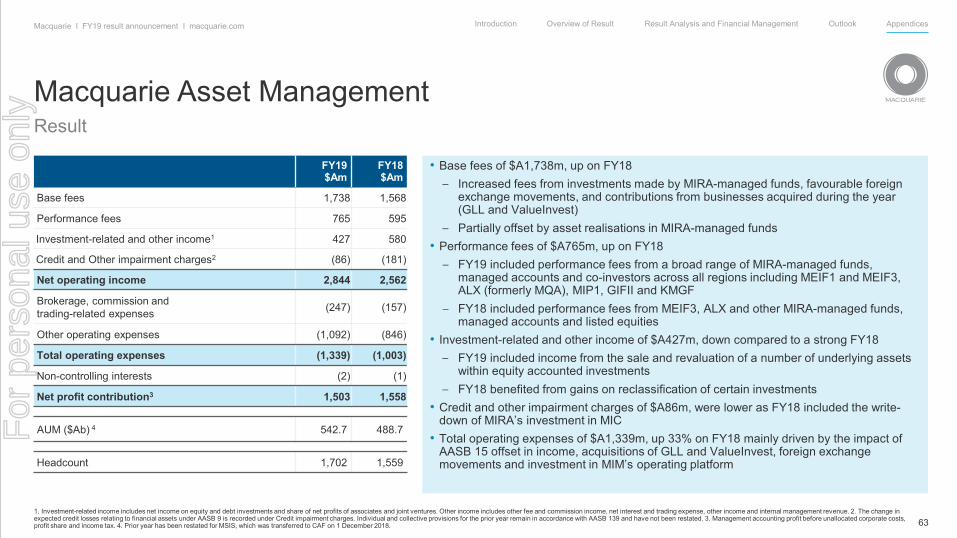
63
Introduction Overview of Result Result Analysis and Financial Management Outlook AppendicesMacquarie I FY19 result announcement I macquarie.com
Macquarie Asset ManagementResult
FY19 $Am
FY18 $Am
Base fees 1,738 1,568
Performance fees 765 595
Investment-related and other income1 427 580
Credit and Other impairment charges2 (86) (181)
Net operating income 2,844 2,562
Brokerage, commission andtrading-related expenses (247) (157)
Other operating expenses (1,092) (846)
Total operating expenses (1,339) (1,003)
Non-controlling interests (2) (1)
Net profit contribution3 1,503 1,558
AUM ($Ab) 4 542.7 488.7
Headcount 1,702 1,559
• Base fees of $A1,738m, up on FY18– Increased fees from investments made by MIRA-managed funds, favourable foreign
exchange movements, and contributions from businesses acquired during the year (GLL and ValueInvest)
– Partially offset by asset realisations in MIRA-managed funds• Performance fees of $A765m, up on FY18
– FY19 included performance fees from a broad range of MIRA-managed funds, managed accounts and co-investors across all regions including MEIF1 and MEIF3, ALX (formerly MQA), MIP1, GIFII and KMGF
– FY18 included performance fees from MEIF3, ALX and other MIRA-managed funds, managed accounts and listed equities
• Investment-related and other income of $A427m, down compared to a strong FY18– FY19 included income from the sale and revaluation of a number of underlying assets
within equity accounted investments – FY18 benefited from gains on reclassification of certain investments
• Credit and other impairment charges of $A86m, were lower as FY18 included the write-down of MIRA’s investment in MIC
• Total operating expenses of $A1,339m, up 33% on FY18 mainly driven by the impact of AASB 15 offset in income, acquisitions of GLL and ValueInvest, foreign exchange movements and investment in MIM’s operating platform
1. Investment-related income includes net income on equity and debt investments and share of net profits of associates and joint ventures. Other income includes other fee and commission income, net interest and trading expense, other income and internal management revenue. 2. The change in expected credit losses relating to financial assets under AASB 9 is recorded under Credit impairment charges. Individual and collective provisions for the prior year remain in accordance with AASB 139 and have not been restated. 3. Management accounting profit before unallocated corporate costs, profit share and income tax. 4. Prior year has been restated for MSIS, which was transferred to CAF on 1 December 2018.
For
per
sona
l use
onl
y
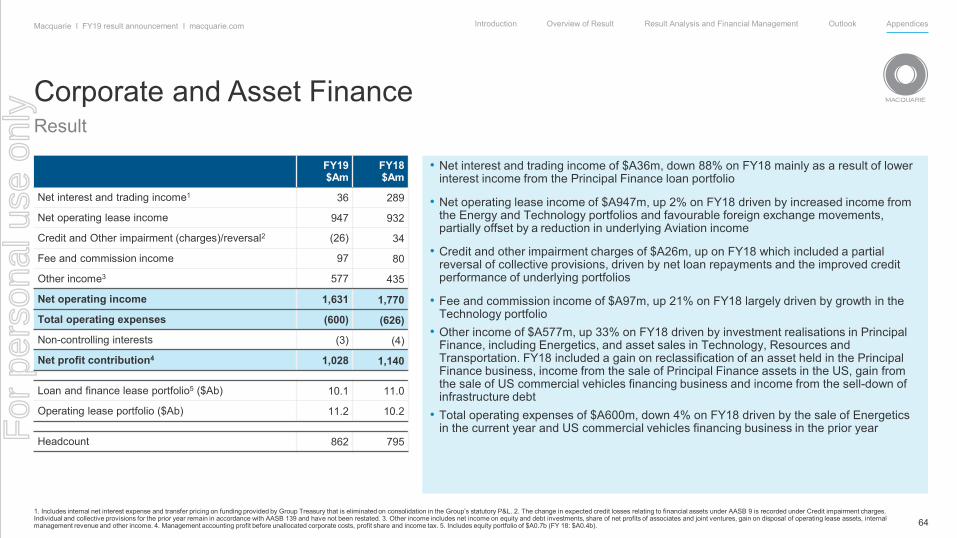
64
Introduction Overview of Result Result Analysis and Financial Management Outlook AppendicesMacquarie I FY19 result announcement I macquarie.com
Corporate and Asset FinanceResult
FY19 $Am
FY18 $Am
Net interest and trading income1 36 289
Net operating lease income 947 932
Credit and Other impairment (charges)/reversal2 (26) 34
Fee and commission income 97 80
Other income3 577 435
Net operating income 1,631 1,770
Total operating expenses (600) (626)
Non-controlling interests (3) (4)
Net profit contribution4 1,028 1,140
Loan and finance lease portfolio5 ($Ab) 10.1 11.0
Operating lease portfolio ($Ab) 11.2 10.2
Headcount 862 795
• Net interest and trading income of $A36m, down 88% on FY18 mainly as a result of lower interest income from the Principal Finance loan portfolio
• Net operating lease income of $A947m, up 2% on FY18 driven by increased income from the Energy and Technology portfolios and favourable foreign exchange movements, partially offset by a reduction in underlying Aviation income
• Credit and other impairment charges of $A26m, up on FY18 which included a partial reversal of collective provisions, driven by net loan repayments and the improved credit performance of underlying portfolios
• Fee and commission income of $A97m, up 21% on FY18 largely driven by growth in the Technology portfolio
• Other income of $A577m, up 33% on FY18 driven by investment realisations in Principal Finance, including Energetics, and asset sales in Technology, Resources and Transportation. FY18 included a gain on reclassification of an asset held in the Principal Finance business, income from the sale of Principal Finance assets in the US, gain from the sale of US commercial vehicles financing business and income from the sell-down of infrastructure debt
• Total operating expenses of $A600m, down 4% on FY18 driven by the sale of Energetics in the current year and US commercial vehicles financing business in the prior year
1. Includes internal net interest expense and transfer pricing on funding provided by Group Treasury that is eliminated on consolidation in the Group’s statutory P&L. 2. The change in expected credit losses relating to financial assets under AASB 9 is recorded under Credit impairment charges. Individual and collective provisions for the prior year remain in accordance with AASB 139 and have not been restated. 3. Other income includes net income on equity and debt investments, share of net profits of associates and joint ventures, gain on disposal of operating lease assets, internal management revenue and other income. 4. Management accounting profit before unallocated corporate costs, profit share and income tax. 5. Includes equity portfolio of $A0.7b (FY 18: $A0.4b).
For
per
sona
l use
onl
y
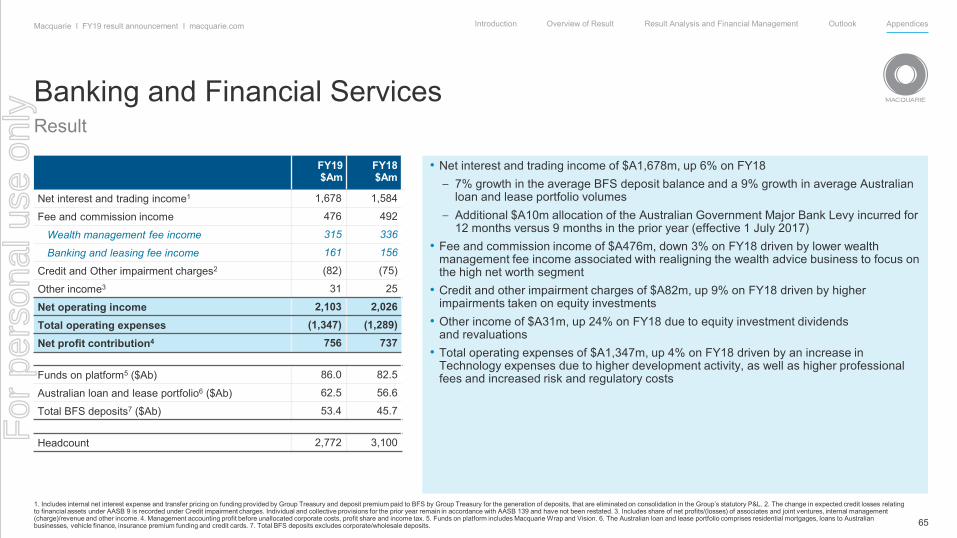
65
Introduction Overview of Result Result Analysis and Financial Management Outlook AppendicesMacquarie I FY19 result announcement I macquarie.com
Banking and Financial ServicesResult
FY19 $Am
FY18 $Am
Net interest and trading income1 1,678 1,584
Fee and commission income 476 492
Wealth management fee income 315 336
Banking and leasing fee income 161 156
Credit and Other impairment charges2 (82) (75)
Other income3 31 25
Net operating income 2,103 2,026Total operating expenses (1,347) (1,289)Net profit contribution4 756 737
Funds on platform5 ($Ab) 86.0 82.5
Australian loan and lease portfolio6 ($Ab) 62.5 56.6
Total BFS deposits7 ($Ab) 53.4 45.7
Headcount 2,772 3,100
• Net interest and trading income of $A1,678m, up 6% on FY18– 7% growth in the average BFS deposit balance and a 9% growth in average Australian
loan and lease portfolio volumes– Additional $A10m allocation of the Australian Government Major Bank Levy incurred for
12 months versus 9 months in the prior year (effective 1 July 2017) • Fee and commission income of $A476m, down 3% on FY18 driven by lower wealth
management fee income associated with realigning the wealth advice business to focus on the high net worth segment
• Credit and other impairment charges of $A82m, up 9% on FY18 driven by higher impairments taken on equity investments
• Other income of $A31m, up 24% on FY18 due to equity investment dividends and revaluations
• Total operating expenses of $A1,347m, up 4% on FY18 driven by an increase in Technology expenses due to higher development activity, as well as higher professional fees and increased risk and regulatory costs
1. Includes internal net interest expense and transfer pricing on funding provided by Group Treasury and deposit premium paid to BFS by Group Treasury for the generation of deposits, that are eliminated on consolidation in the Group’s statutory P&L. 2. The change in expected credit losses relating to financial assets under AASB 9 is recorded under Credit impairment charges. Individual and collective provisions for the prior year remain in accordance with AASB 139 and have not been restated. 3. Includes share of net profits/(losses) of associates and joint ventures, internal management (charge)/revenue and other income. 4. Management accounting profit before unallocated corporate costs, profit share and income tax. 5. Funds on platform includes Macquarie Wrap and Vision. 6. The Australian loan and lease portfolio comprises residential mortgages, loans to Australian businesses, vehicle finance, insurance premium funding and credit cards. 7. Total BFS deposits excludes corporate/wholesale deposits.
For
per
sona
l use
onl
y
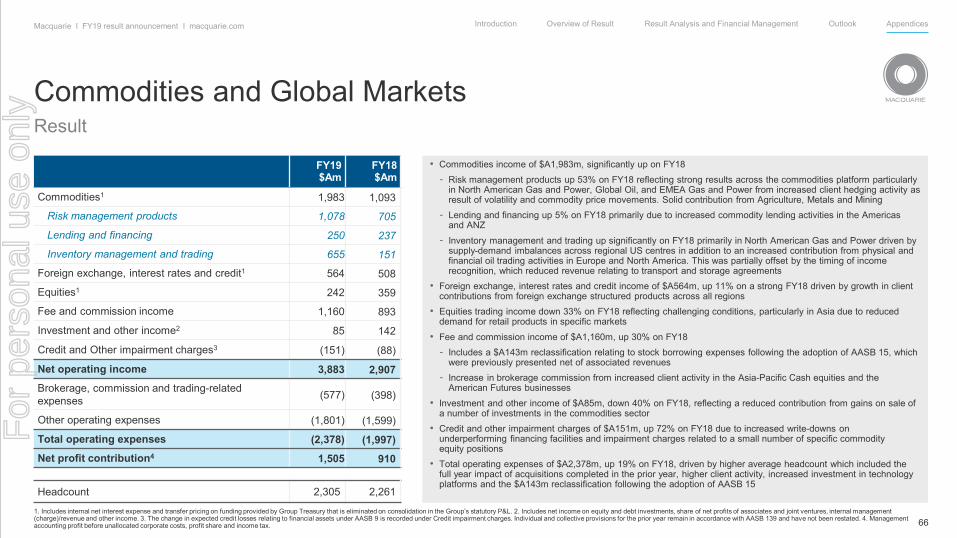
66
Introduction Overview of Result Result Analysis and Financial Management Outlook AppendicesMacquarie I FY19 result announcement I macquarie.com
Commodities and Global MarketsResult
FY19 $Am
FY18 $Am
Commodities1 1,983 1,093
Risk management products 1,078 705
Lending and financing 250 237
Inventory management and trading 655 151
Foreign exchange, interest rates and credit1 564 508
Equities1 242 359
Fee and commission income 1,160 893
Investment and other income2 85 142
Credit and Other impairment charges3 (151) (88)
Net operating income 3,883 2,907Brokerage, commission and trading-related expenses (577) (398)
Other operating expenses (1,801) (1,599)
Total operating expenses (2,378) (1,997)Net profit contribution4 1,505 910
Headcount 2,305 2,261
1. Includes internal net interest expense and transfer pricing on funding provided by Group Treasury that is eliminated on consolidation in the Group’s statutory P&L. 2. Includes net income on equity and debt investments, share of net profits of associates and joint ventures, internal management (charge)/revenue and other income. 3. The change in expected credit losses relating to financial assets under AASB 9 is recorded under Credit impairment charges. Individual and collective provisions for the prior year remain in accordance with AASB 139 and have not been restated. 4. Management accounting profit before unallocated corporate costs, profit share and income tax.
• Commodities income of $A1,983m, significantly up on FY18- Risk management products up 53% on FY18 reflecting strong results across the commodities platform particularly
in North American Gas and Power, Global Oil, and EMEA Gas and Power from increased client hedging activity as result of volatility and commodity price movements. Solid contribution from Agriculture, Metals and Mining
- Lending and financing up 5% on FY18 primarily due to increased commodity lending activities in the Americas and ANZ
- Inventory management and trading up significantly on FY18 primarily in North American Gas and Power driven by supply-demand imbalances across regional US centres in addition to an increased contribution from physical and financial oil trading activities in Europe and North America. This was partially offset by the timing of income recognition, which reduced revenue relating to transport and storage agreements
• Foreign exchange, interest rates and credit income of $A564m, up 11% on a strong FY18 driven by growth in client contributions from foreign exchange structured products across all regions
• Equities trading income down 33% on FY18 reflecting challenging conditions, particularly in Asia due to reduced demand for retail products in specific markets
• Fee and commission income of $A1,160m, up 30% on FY18- Includes a $A143m reclassification relating to stock borrowing expenses following the adoption of AASB 15, which
were previously presented net of associated revenues- Increase in brokerage commission from increased client activity in the Asia-Pacific Cash equities and the
American Futures businesses
• Investment and other income of $A85m, down 40% on FY18, reflecting a reduced contribution from gains on sale of a number of investments in the commodities sector
• Credit and other impairment charges of $A151m, up 72% on FY18 due to increased write-downs on underperforming financing facilities and impairment charges related to a small number of specific commodity equity positions
• Total operating expenses of $A2,378m, up 19% on FY18, driven by higher average headcount which included the full year impact of acquisitions completed in the prior year, higher client activity, increased investment in technology platforms and the $A143m reclassification following the adoption of AASB 15
For
per
sona
l use
onl
y

67
Introduction Overview of Result Result Analysis and Financial Management Outlook AppendicesMacquarie I FY19 result announcement I macquarie.com
Macquarie CapitalResult
FY19 $Am
FY18 $Am
Fee and commission income 1,031 845Investment-related income (ex non-controlling interests) 1,380 649
Investment and other income1 1,462 714
Net interest and trading expense2 (82) (65)
Credit and Other impairment charges3 (182) (56)
Internal management revenue4 8 22
Net operating income 2,237 1,460
Total operating expenses (898) (739)
Non-controlling interests 14 (5)
Net profit contribution5 1,353 716
Capital markets activity6:
Number of transactions 417 461
Transactions value ($Ab) 478 400
Headcount 1,379 1,114
• Increased fee and commission income:- M&A and other fee income: higher fee income across ANZ, Europe and the US- Higher ECM fee income in ANZ
- Includes the impacts of adopting AASB 15 and foreign exchange movements• Higher investment-related income (excluding non-controlling interests):
- Higher revenue from asset realisations in ANZ, Europe and the US, particularly in the technology, green energy and conventional energy sectors
- Partially offset by higher share of losses of associates and joint ventures reflecting a change in the composition and performance of investments in the portfolio including increased expenditure on green energy and other projects in the development phase
• Higher net credit and other impairment charges related to a small number of underperforming investments
• Higher operating expenses reflects additional headcount, increased investing activity, the impact of adopting AASB 15 and foreign exchange movements
1. Includes net income on equity and debt investments, share of net losses or profits of associates and joint ventures and other income. 2. Includes internal net interest expense and transfer pricing on funding provided by Group Treasury that is eliminated on consolidation in the Group’s statutory P&L. 3. The change in expected credit losses relating to financial assets under AASB 9 is recorded under Credit impairment charges. Individual and collective provisions for the prior year remain in accordance with AASB 139 and have not been restated. 4. Internal revenue allocations are eliminated on consolidation in the Group’s statutory P&L. 5. Management accounting profit before unallocated corporate costs, profit share and income tax. 6. Source: Dealogic and IJGlobal for Macquarie Group completed M&A, balance sheet positions, ECM and DCM transactions converted as at the relevant reporting date. Deal values reflect the full transaction value and not an attributed value.
For
per
sona
l use
onl
y
MACQUARIE 2019
AppendixAdditional information - FundingB
For
per
sona
l use
onl
y
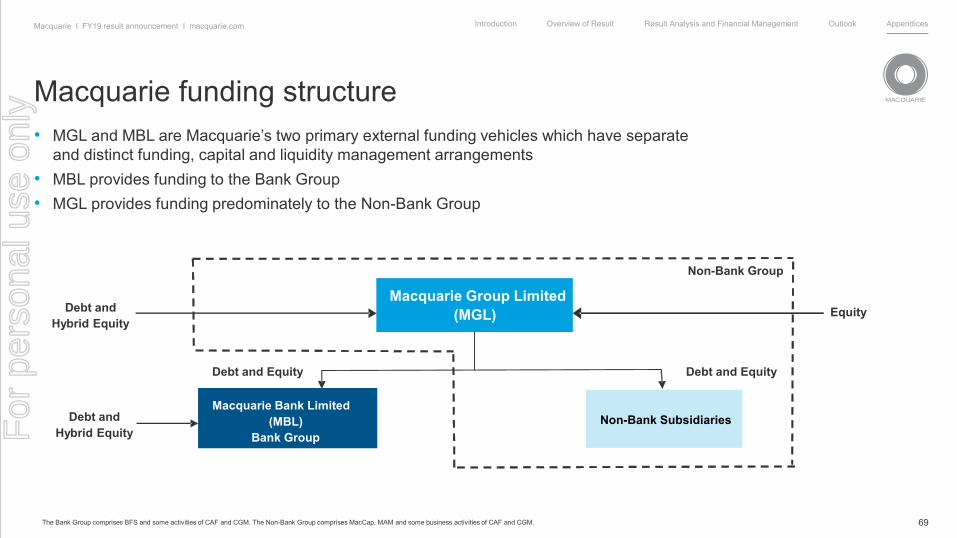
69
Introduction Overview of Result Result Analysis and Financial Management Outlook AppendicesMacquarie I FY19 result announcement I macquarie.com
Macquarie funding structure• MGL and MBL are Macquarie’s two primary external funding vehicles which have separate
and distinct funding, capital and liquidity management arrangements• MBL provides funding to the Bank Group• MGL provides funding predominately to the Non-Bank Group
Non-Bank Group
Debt and Equity Debt and Equity
Equity
Macquarie Bank Limited(MBL)
Bank GroupDebt and
Hybrid Equity
Debt and Hybrid Equity
Non-Bank Subsidiaries
Macquarie Group Limited(MGL)
The Bank Group comprises BFS and some activities of CAF and CGM. The Non-Bank Group comprises MacCap, MAM and some business activities of CAF and CGM.
For
per
sona
l use
onl
y
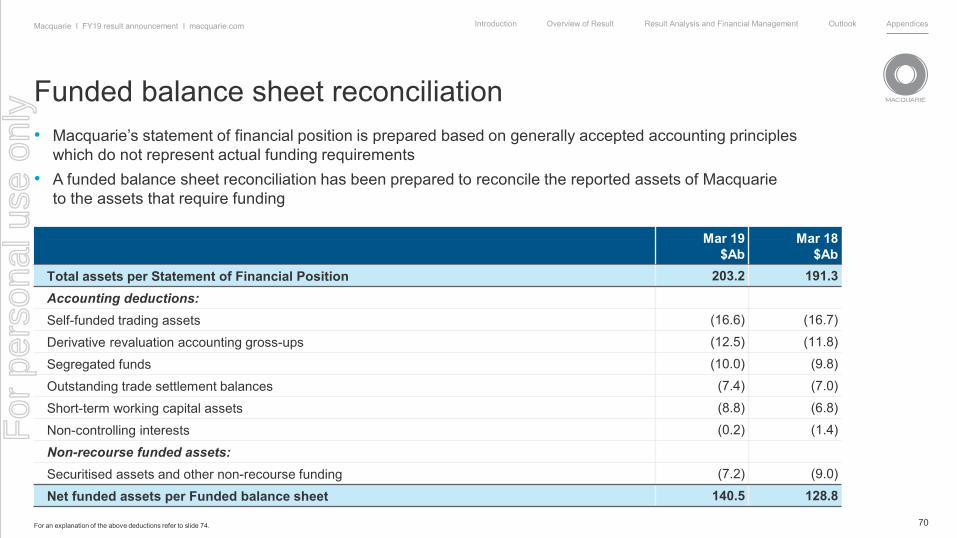
70
Introduction Overview of Result Result Analysis and Financial Management Outlook AppendicesMacquarie I FY19 result announcement I macquarie.com
• Macquarie’s statement of financial position is prepared based on generally accepted accounting principles which do not represent actual funding requirements
• A funded balance sheet reconciliation has been prepared to reconcile the reported assets of Macquarie to the assets that require funding
Mar 19$Ab
Mar 18$Ab
Total assets per Statement of Financial Position 203.2 191.3Accounting deductions:Self-funded trading assets (16.6) (16.7)
Derivative revaluation accounting gross-ups (12.5) (11.8)
Segregated funds (10.0) (9.8)
Outstanding trade settlement balances (7.4) (7.0)
Short-term working capital assets (8.8) (6.8)
Non-controlling interests (0.2) (1.4)
Non-recourse funded assets:Securitised assets and other non-recourse funding (7.2) (9.0)
Net funded assets per Funded balance sheet 140.5 128.8
Funded balance sheet reconciliation
For an explanation of the above deductions refer to slide 74.
For
per
sona
l use
onl
y

71
Introduction Overview of Result Result Analysis and Financial Management Outlook AppendicesMacquarie I FY19 result announcement I macquarie.com
Mar 19$Ab
Mar 18$Ab
Funding sourcesCertificates of deposit 1.0 0.6
Commercial paper 6.3 8.4
Net trade creditors 2.1 2.3
Structured notes 2.5 2.5
Secured funding 5.8 4.9
Bonds 32.2 34.7
Other loans 1.2 1.2
Syndicated loan facilities 8.3 4.0
Customer deposits 56.0 48.1
Subordinated debt 3.0 2.8
Equity and hybrids1 22.1 19.3
Total funding sources 140.5 128.8
Funded assetsCash and liquid assets 26.3 25.4
Self-securitisation 21.1 15.5
Net trading assets 20.6 17.9
Loan assets including operating lease assets less than one year 14.3 14.4
Loan assets including operating lease assets greater than one year 47.6 45.4
Debt investment securities 1.7 1.7Co-investment in Macquarie-managed funds and other equity investments
5.9 6.8
Property, plant and equipment and intangibles 3.0 1.7
Total funded assets 140.5 128.8
1. Hybrid instruments include Macquarie Income Securities, Macquarie Additional Capital Securities, Macquarie Capital Notes 2, 3 & 4 and Macquarie Bank Capital Notes. 2. As at 31 Mar 19. 3. Macquarie Income Securities of $A0.4b are excluded as they do not have a maturity date. 4. Includes drawn term funding facilities only.
Funding for Macquarie• Well diversified funding sources• Minimal reliance on short-term wholesale funding markets• Deposit base represents 40%2 of total funding sources• Term funding beyond one year (excluding equity and securitisations) has
a weighted average term to maturity of 5.6 years2,3
Macquarie’s term funding maturing beyond one year(includes Equity and hybrids)4
For
per
sona
l use
onl
y

72
Introduction Overview of Result Result Analysis and Financial Management Outlook AppendicesMacquarie I FY19 result announcement I macquarie.com
Mar 19$Ab
Mar 18$Ab
Funding sourcesCertificates of deposit 1.0 0.6Commercial paper 6.3 8.4Net trade creditors 1.1 1.1Structured notes 2.2 2.1Secured funding 1.4 4.4Bonds 16.1 20.7Other loans 0.7 1.1Syndicated loan facilities - 0.8Customer deposits 56.0 48.1Subordinated debt 3.0 2.8Equity and hybrids1 12.8 14.6Total funding sources 100.6 104.7Funded assetsCash and liquid assets 24.3 23.6Self-securitisation 21.1 15.5Net trading assets 19.6 17.1Loan assets including operating lease assets less than one year 13.0 14.1Loan assets including operating lease assets greater than one year 35.3 44.7Debt investment securities 1.1 1.3Non-Bank Group deposit with MBL (14.8) (12.9)Co-investment in Macquarie-managed funds and other equity investments 0.4 0.8
Property, plant and equipment and intangibles 0.6 0.5Total funded assets 100.6 104.7
• Bank balance sheet remains liquid and well capitalised, with a diverse range of funding sources
• Term funding beyond one year (excluding equity and securitisations) has a weighted average term to maturity of 4.5 years2,3
• Accessed term funding across a variety of products and jurisdictions
1. Hybrid instruments include Macquarie Income Securities, Macquarie Additional Capital Securities and Macquarie Bank Capital Notes. 2. As at 31 Mar 19. 3. Macquarie Income Securities of $A0.4b are excluded as they do not have a maturity date 4. Includes drawn term funding facilities only.
Funding for the Bank Group
Bank Group term funding maturing beyond one year(includes Equity and hybrids)4
For
per
sona
l use
onl
y
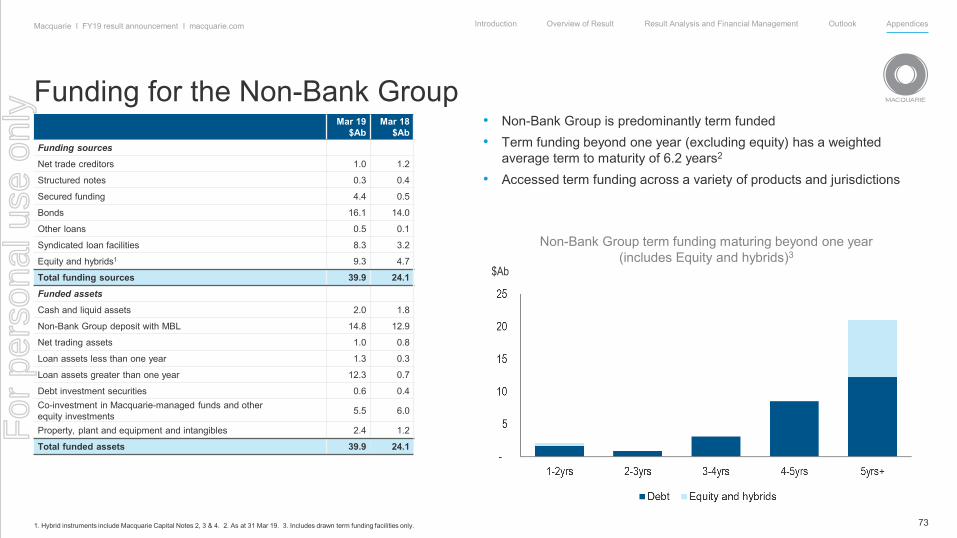
73
Introduction Overview of Result Result Analysis and Financial Management Outlook AppendicesMacquarie I FY19 result announcement I macquarie.com
Mar 19$Ab
Mar 18$Ab
Funding sources
Net trade creditors 1.0 1.2
Structured notes 0.3 0.4
Secured funding 4.4 0.5
Bonds 16.1 14.0
Other loans 0.5 0.1
Syndicated loan facilities 8.3 3.2
Equity and hybrids1 9.3 4.7
Total funding sources 39.9 24.1
Funded assets
Cash and liquid assets 2.0 1.8
Non-Bank Group deposit with MBL 14.8 12.9
Net trading assets 1.0 0.8
Loan assets less than one year 1.3 0.3
Loan assets greater than one year 12.3 0.7
Debt investment securities 0.6 0.4Co-investment in Macquarie-managed funds and other equity investments 5.5 6.0
Property, plant and equipment and intangibles 2.4 1.2
Total funded assets 39.9 24.1
• Non-Bank Group is predominantly term funded• Term funding beyond one year (excluding equity) has a weighted
average term to maturity of 6.2 years2
• Accessed term funding across a variety of products and jurisdictions
Funding for the Non-Bank Group
1. Hybrid instruments include Macquarie Capital Notes 2, 3 & 4. 2. As at 31 Mar 19. 3. Includes drawn term funding facilities only.
Non-Bank Group term funding maturing beyond one year(includes Equity and hybrids)3
$Ab
For
per
sona
l use
onl
y
74
Introduction Overview of Result Result Analysis and Financial Management Outlook AppendicesMacquarie I FY19 result announcement I macquarie.com
Explanation of Funded Balance Sheet reconciling items• Self-funded trading assets: Macquarie enters into stock borrowing and lending as well as repurchase agreements and reverse repurchase
agreements in the normal course of trading activity that it conducts with its clients and counterparties. Also as part of its trading activities, Macquarie pays and receives margin collateral on its outstanding derivative positions. These trading-related asset and liability positions are presented gross on the statement of financial position but are viewed as being self-funded to the extent that they offset one another and, therefore, are netted as part of this adjustment.
• Derivative revaluation accounting gross-ups: Macquarie’s derivative activities are mostly client driven with client positions hedged by offsetting positions with a variety of counterparties. The derivatives are largely matched and this adjustment reflects that the matched positions do not require funding.
• Segregated funds: These represent the assets and liabilities that are recognised where Macquarie provides products such as investment-linked policy contracts or where Macquarie holds segregated client monies. The policy (contract) liability and client monies will be matched by assets held to the same amount and hence do not require funding.
• Outstanding trade settlement balances: At any particular time Macquarie will have outstanding trades to be settled as part of its brokering business and trading activities. These amounts (payables) can be offset in terms of funding by amounts that Macquarie is owed on other trades (receivables).
• Short-term working capital assets: As with the outstanding trade settlement balances above, Macquarie through its day-to-day operations generates working capital assets (e.g. receivables and prepayments) and working capital liabilities (e.g. creditors and accruals) that produce a ‘net balance’ that either requires or provides funding.
• Non-controlling interests: These represent the portion of equity ownership in subsidiaries not attributable to Macquarie. As this is not a position thatMacquarie is required to fund it is netted against the consolidated assets and liabilities in preparing the funded balance sheet.
• Securitised assets and other non-recourse funding: These represent assets that are funded by third parties with no recourse to Macquarie including lending assets (mortgages and leasing) sold down into external securitisation entities.
For
per
sona
l use
onl
y

75
Introduction Overview of Result Result Analysis and Financial Management Outlook AppendicesMacquarie I FY19 result announcement I macquarie.com
Liquidity Policy• The key requirement of MGL and MBL’s liquidity policy is that the entities are able to meet all liquidity obligations during
a period of liquidity stress: – A 12 month period with constrained access to funding markets for MBL, no access to funding markets for MGL and with
only a limited reduction in franchise businesses• Term assets are funded by term funding, stable deposits, hybrids and equity
Liquidity Framework• A robust liquidity risk management framework is designed to ensure that both MGL and MBL are able to meet their funding
requirements as they fall due under a range of market conditions. Key tools include:– Liability driven approach to balance sheet management– Scenario analysis– Maintenance of unencumbered liquid asset holdings
• Liquidity management is performed centrally by Group Treasury, with oversight from the Asset and Liability Committee and the Risk Management Group
• The MGL and MBL Boards approve the liquidity policy and are provided with liquidity reporting on a regular basis
Conservative long standing liquidity risk management framework
For
per
sona
l use
onl
y

MACQUARIE 2019
AppendixAdditional information - CapitalC
For
per
sona
l use
onl
y
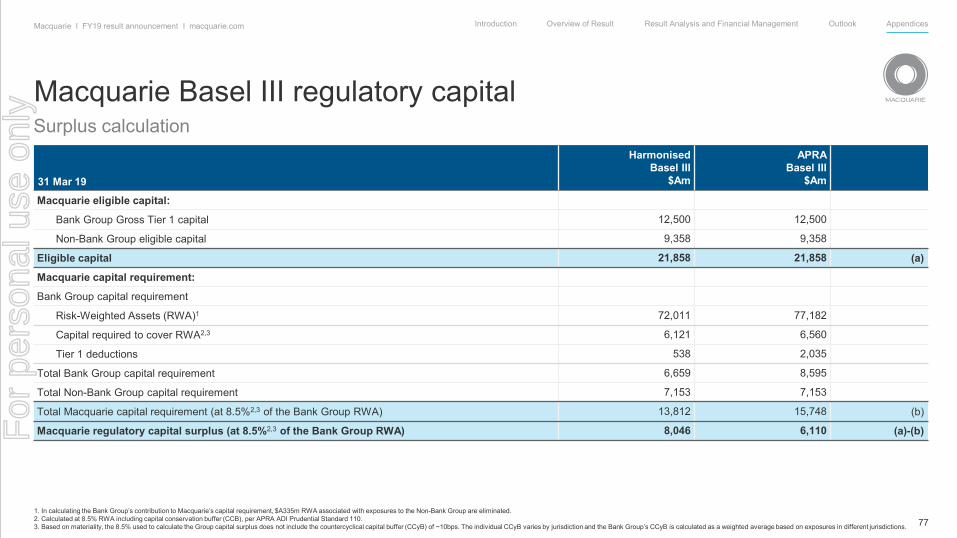
77
Introduction Overview of Result Result Analysis and Financial Management Outlook AppendicesMacquarie I FY19 result announcement I macquarie.com
Surplus calculation
31 Mar 19
Harmonised Basel III
$Am
APRA Basel III
$Am
Macquarie eligible capital:
Bank Group Gross Tier 1 capital 12,500 12,500
Non-Bank Group eligible capital 9,358 9,358
Eligible capital 21,858 21,858 (a)
Macquarie capital requirement:
Bank Group capital requirement
Risk-Weighted Assets (RWA)1 72,011 77,182
Capital required to cover RWA2,3 6,121 6,560
Tier 1 deductions 538 2,035
Total Bank Group capital requirement 6,659 8,595
Total Non-Bank Group capital requirement 7,153 7,153
Total Macquarie capital requirement (at 8.5%2,3 of the Bank Group RWA) 13,812 15,748 (b)
Macquarie regulatory capital surplus (at 8.5%2,3 of the Bank Group RWA) 8,046 6,110 (a)-(b)
Macquarie Basel III regulatory capital
1. In calculating the Bank Group’s contribution to Macquarie’s capital requirement, $A335m RWA associated with exposures to the Non-Bank Group are eliminated.2. Calculated at 8.5% RWA including capital conservation buffer (CCB), per APRA ADI Prudential Standard 110.3. Based on materiality, the 8.5% used to calculate the Group capital surplus does not include the countercyclical capital buffer (CCyB) of ~10bps. The individual CCyB varies by jurisdiction and the Bank Group’s CCyB is calculated as a weighted average based on exposures in different jurisdictions.
For
per
sona
l use
onl
y
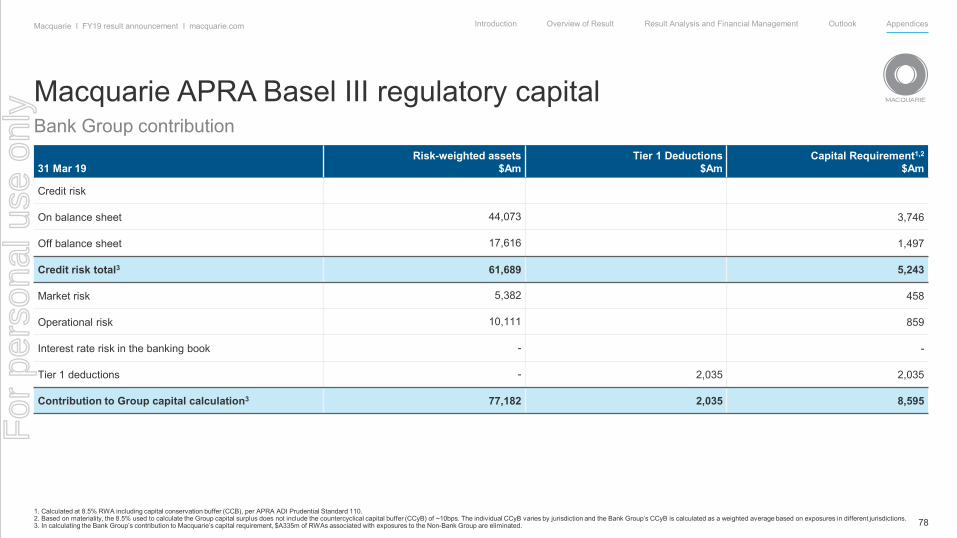
78
Introduction Overview of Result Result Analysis and Financial Management Outlook AppendicesMacquarie I FY19 result announcement I macquarie.com
Bank Group contributionMacquarie APRA Basel III regulatory capital
1. Calculated at 8.5% RWA including capital conservation buffer (CCB), per APRA ADI Prudential Standard 110.2. Based on materiality, the 8.5% used to calculate the Group capital surplus does not include the countercyclical capital buffer (CCyB) of ~10bps. The individual CCyB varies by jurisdiction and the Bank Group’s CCyB is calculated as a weighted average based on exposures in different jurisdictions.3. In calculating the Bank Group’s contribution to Macquarie’s capital requirement, $A335m of RWAs associated with exposures to the Non-Bank Group are eliminated.
31 Mar 19Risk-weighted assets
$AmTier 1 Deductions
$AmCapital Requirement1,2
$Am
Credit risk
On balance sheet 44,073 3,746
Off balance sheet 17,616 1,497
Credit risk total3 61,689 5,243
Market risk 5,382 458
Operational risk 10,111 859
Interest rate risk in the banking book - -
Tier 1 deductions - 2,035 2,035
Contribution to Group capital calculation3 77,182 2,035 8,595
For
per
sona
l use
onl
y

79
Introduction Overview of Result Result Analysis and Financial Management Outlook AppendicesMacquarie I FY19 result announcement I macquarie.com
Macquarie regulatory capital
• APRA has specified a regulatory capital framework for Macquarie• A dollar capital surplus is produced; no capital ratio calculation is specified• APRA has approved Macquarie’s Economic Capital Adequacy Model (ECAM) for use in calculating the regulatory capital requirement
of the Non-Bank Group• The ECAM is based on similar principles and models as the Basel III regulatory capital framework for Banks, with both calculating
capital at a one year 99.9% confidence level:
Risk1 Basel III ECAM
Credit Capital requirement generally determined by Basel III IRB formula, with some parameters specified by the regulator (e.g. loss given default)
Capital requirement generally determined by Basel III IRB formula, but with internal estimates of key parameters
Equity Harmonised Basel III: 250%, 300% or 400% risk weight, depending on the type of investment2. Deduction from Common Equity Tier 1 above a threshold APRA Basel III: 100% Common Equity Tier 1 deduction
Extension of Basel III credit model to cover equity exposures. Capital requirement between 36% and 82% of face value; average 51%
Market 3 times 10 day 99% Value at Risk (VaR) plus 3 times 10-day 99% Stressed VaR plus a specific risk charge
Scenario-based approach
Operational Advanced Measurement Approach Advanced Measurement Approach
1. The ECAM also covers non-traded interest rate risk and the risk on assets held as part of business operations, including: fixed assets, goodwill, intangible assets and capitalised expenses. 2. Includes all Banking Book equity investments, plus net long Trading Book holdings in financial institutions.
Non-Bank Group contribution
For
per
sona
l use
onl
y

80
Introduction Overview of Result Result Analysis and Financial Management Outlook AppendicesMacquarie I FY19 result announcement I macquarie.com
Non-Bank Group contribution
31 Mar 19Assets
$Ab
Capital Requirement
$AmEquivalent
Risk WeightFunded assetsCash and liquid assets 2.0 34 21%Loan assets1 13.6 1,689 155%Debt investment securities 0.6 96 200%Co-investment in Macquarie-managed funds and other equity investments 5.1 2,473 606%Co-investment in Macquarie-managed funds and other equity investments (relating to investments that hedge DPS plan liabilities) 0.4Property, plant & equipment and intangibles 2.4 930 485%Non-Bank Group deposit with MBL 14.8Net trading assets 1.0Total funded assets 39.9 5,222Self-funded and non-recourse assetsSelf funded trading assets 1.0Outstanding trade settlement balances 4.3Derivative revaluation accounting gross ups 0.1Short-term working capital assets 6.6Non-controlling interests 0.2Total self-funded and non-recourse assets 12.2Total Non-Bank Group assets 52.1Off balance sheet exposures, operational, market and other risks, and diversification offset2 1,931Non-Bank Group capital requirement 7,153
Macquarie regulatory capital
1. Includes leases. 2. Capital associated with net trading assets (including market risk capital) and net trade debtors has been included here.
For
per
sona
l use
onl
y

MACQUARIE 2019
AppendixGlossaryD
For
per
sona
l use
onl
y

82
Introduction Overview of Result Result Analysis and Financial Management Outlook AppendicesMacquarie I FY19 result announcement I macquarie.com
Glossary$A / AUD Australian Dollar$US / USD United States Dollar£ / GBP Pound Sterling€ Euro1H18 Half-Year ended 30 September 20171H19 Half-Year ended 30 September 20182H18 Half-Year ended 31 March 20182H19 Half-Year ended 31 March 2019ABN Australian Business NumberADI Authorised Deposit-Taking InstitutionALX Atlas ArteriaAML Anti-Money LaunderingANZ Australia and New ZealandApprox. ApproximatelyAPRA Australian Prudential Regulation AuthorityASX Australian Stock ExchangeAUM Assets under ManagementBCBS Basel Committee on Banking SupervisionBFS Banking and Financial ServicesCAF Corporate and Asset FinanceCapex Capital ExpenditureCCB Capital Conservation BufferCET1 Common Equity Tier 1
CFM Commodities and Financial Markets CGM Commodities and Global Markets CLF Committed Liquid FacilityCMA Cash Management AccountCRM Customer Relationship ManagementCY18 Calendar Year ended 31 December 2018CY19 Calendar Year ending 31 December 2019DCM Debt Capital MarketsDPS Dividends Per ShareDRP Dividend Reinvestment PlanDTA Deferred Tax AssetECAM Economic Capital Adequacy ModelECM Equity Capital MarketsECS Exchangeable Capital SecuritiesEMEA Europe, the Middle East and AfricaEPS Earnings Per ShareEUM Equity Under ManagementFX Foreign ExchangeFY15 Full Year ended 31 March 2015FY16 Full Year ended 31 March 2016FY17 Full Year ended 31 March 2017FY18 Full Year ended 31 March 2018FY19 Full Year ended 31 March 2019
For
per
sona
l use
onl
y
83
Introduction Overview of Result Result Analysis and Financial Management Outlook AppendicesMacquarie I FY19 result announcement I macquarie.com
GlossaryGIFII Macquarie Global Infrastructure Fund 2GIG Green Investment GroupGLL GLL Real Estate PartnersIPO Initial Public OfferingIRB Internal Ratings-BasedIFRS International Financial Reporting StandardsIT Information TechnologyKMGF Korea Macquarie Growth FundLBO Leveraged BuyoutLCR Liquidity Coverage RatioLNG Liquefied Natural GasM&A Mergers and AcquisitionsMacCap Macquarie CapitalMAM Macquarie Asset Management MBL Macquarie Bank LimitedMD&A Management Discussion & AnalysisMEIF1 Macquarie European Infrastructure Fund 1MEIF3 Macquarie European Infrastructure Fund 3MEREP Macquarie Group Employee Retained Equity PlanMGL / MQG Macquarie Group LimitedMIC Macquarie Infrastructure CorporationMIDIS Macquarie Infrastructure Debt Investment SolutionsMiFID Markets in Financial Instruments DirectiveMIM Macquarie Investment ManagementMIP1 Macquarie Infrastructure Partners Fund 1
MIRA Macquarie Infrastructure and Real AssetsMQA Macquarie Atlas RoadsMREI Macquarie Real Estate InvestmentsMSIS Macquarie Specialised Investment SolutionsMW Mega WattNGLs Natural gas liquids No. NumberNPAT Net Profit After TaxNPC Net Profit ContributionNSFR Net Stable Funding RatioOTC Over-The-CounterP&L Profit and Loss StatementPPE Property, Plant and EquipmentPPP Public Private PartnershipRBA Reserve Bank of AustraliaRHS Right Hand SideROE Return on EquityRWA Risk Weighted AssetsSBI State Bank of IndiaSME Small and Medium EnterpriseSMSF Self Managed Super FundUK United KingdomUS United States of AmericaVaR Value at Risk
For
per
sona
l use
onl
y

Presentation to investors and analysts
3 May 2019
Result announcement for the year ended 31 March 2019
For
per
sona
l use
onl
y