
Presentation to investors 10-set-07 - Saras S.p.A. · Certain statements contained in this...
82
September 2007 SARAS S.p.A. 1 Presentation to investors Last update 10 th September 2007
Transcript of Presentation to investors 10-set-07 - Saras S.p.A. · Certain statements contained in this...
September 2007 SARAS S.p.A. 1
Presentation to investors
Last update 10th September 2007

September 2007 SARAS S.p.A. 2
Contents
• Saras in brief• Refining&Power margin• Competitive positioning• Refining context• Margins stability• Growth strategy• Maintenance schedule
SARAS IN A SNAPSHOT page 4
Historical data
• Supply-demand balance
• Stocks
• Commodity prices
• Cracks and differentials
• Oil market outlook
• Supply-demand balance
• Recent news
MARKET OVERVIEW page 19
• Refining
• IGCC Power generation
• Marketing
• Wind
BUSINESS SEGMENTS page 36
• Financial targets
• Group Financials
• Segment financials
• Key ratios
• Sensitivities
• Market multiples
• Analysts estimates
FINANCIALS page 61
• Board of Directors and Top management
• Management compensation
• Corporate governance
• Personnel
• HSE
OTHER page 75

September 2007 SARAS S.p.A. 3
Disclaimer
Certain statements contained in this presentation are based on the belief of the Company, as well as factual assumptions made by any information available to the Company. In particular, forward-looking statements concerning the Company’s future results of operations, financial condition, business strategies, plans and objectives, are forecasts and quantitative targets that involve known and unknown risks, uncertainties and other important factors that could cause the actual results and condition of the Company to differ materially from that expressed by such statements.

• Saras in a snapshot
••• Market overviewMarket overviewMarket overview
••• Business segments descriptionBusiness segments descriptionBusiness segments description
••• FinancialsFinancialsFinancials
••• OtherOtherOther

September 2007 SARAS S.p.A. 5
Saras in brief
ITALY
SPAIN
Ulassai
Sarroch
Sardinia
• 300,000 bl/day 2nd largest supersite* in
Europe integrated with petrochemical� Diesel oriented (diesel yield > 50%)
� Ability to run “unconventional” difficult crudes
� Strategically located in the middle of the Med
Cartagena
Arcola
Saras is a pure play refiner with stabilization of returns coming from Power generation
• Track record of superior site margins
• Marketing activities based in the high diesel demand regions of Italy and Spain
• Investing also in renewable energy� 84 MW wind farm in Sardinia
• Largest liquid fuel gasification plant in the world converting heavy bottoms into clean gas fed into a 560 MW CCGT
� fuel oil yield ~5%
* By complexity: source WoodMackenzie
Refinery&Power plant
Wind farm
Tank farm
Tank farm

September 2007 SARAS S.p.A. 6
Refining 57%Power
Generation 39%
Marketing 4% Ind.Serv&IT 0%
EBITDA by business segment
Saras in brief
568354Group Comparable1 EBITDA
2513MARKETING
324237REFINING
220106POWER GENERATION
-1-1OTHER
26
20062006
15
H1/07H1/07
WIND2 (100%)
EUR ml
% based on 2006 data
1. Calculated evaluating inventories at LIFO
2. Joint Venture Consolidated under the equity method (Saras share 70%)

September 2007 SARAS S.p.A. 7
Refining & Power Margin
* Q3/07 as at 7 September 2007
*
Track record of superior margins
1.9 1.9 5.6 7.1 6.2 5.6 7.7 6.5 5.6 6.7 9.9
2.22.8
3.5
3.9
3.7
3.94.0
4.5
3.6
3.6
3.7
4.4
2.6
1.52.1
4.5 4.7
2.8
1.9
4.7
2.8
1.6
3.0
5.4
2.2
4.14.7
6.1
9.5
10.710.1
9.6
12.2
10.1
9.2
10.4
0.6
14.3
0
2
4
6
8
10
12
14
16
2001 2002 2003 2004 2005 2006 Q1/06 Q2/06 Q3/06 Q4/06 Q1/07 Q2/07 Q3/07
$/b
l
Refinery Margin IGCC margin EMC Benchmark Totale

September 2007 SARAS S.p.A. 8
Ability to fully exploit the current trend in refining margins
• 300,000 bl/day supersite� high complexity (Nelson 9.6*)
� high conversion capacity (#1 in Europe)� integrated with petrochemical
• Diesel oriented (yield > 50%),
� total high value products yield greater that 80%
• Very low fuel oil production (~5%)
� Gasification plant converting the heavy bottoms into clean gas then used in a CCGT
• Marketing activities based in the high diesel demand regions of Italy and Spain
• Ability to run “unconventional” crudes that
normally trade below parity
• Strategically located in the middle of the Med
• Stabilization of returns through Power
generation and processing contracts
Saras’ competitive positioning
Ideal product yield to fully benefit from the projected evolution of products demand
Saras ideally placed to fully benefit from today’s context
Flexibility and geographical location allow a further optimization of crude oil slate
Electricity sold under long term contract with price linked to crude and oil products prices
* Site complexity: includes gasification and petrolchemical

September 2007 SARAS S.p.A. 9
0
2
4
6
8
10
12
14
16
1991
1992
1993
1994
1995
1996
1997
1998
1999
2000
2001
2002
2003
2004
2005
2006
2007 y
td
2008
2009
2010
60
64
68
72
76
80
84
88
92
Med crack spread (*)
Refining Capacity
World Oil Demand
million bbls/day$/bl
(*) 2/3 ULSD crack spread vs Brent + 1/3 Unleaded Gasoline crack spread vs Brent
Source: Saras elaboration on BP statistical review and EMC data for forecast
World Refining context
Strong mid-term margin prospect
• Soaring costs and delays in refinery new builds are supporting the duration of the tight supply/demand balance
• Need for sophisticated (and expensive) secondary units to be built alongside new distillation capacity in order to meet the severe product quality specifications
• Steady growth of demand, focused on light and middle distillates

September 2007 SARAS S.p.A. 10
World Refining context
Light product demand strength is key
• world diesel and gasoline demand steadily growing as high as 2.0-2.5% pa, while fuel oil consumption continues to decline (with benefits for complex refineries vs simple ones)
• the value of middle and light distillates boosted by growing demand and tightening of environmental specifications
• ongoing discussions for bunker fuel switch to gasoil could further boost demand of middle distillates in the next decade
-30
-25
-20
-15
-10
-5
0
5
10
15
20
25
30
Jan-9
9
Jul-9
9Ja
n-00
Jul-0
0Ja
n-01
Jul-0
1Ja
n-02
Jul-0
2Ja
n-03
Jul-0
3Ja
n-04
Jul-0
4Ja
n-05
Jul-0
5Ja
n-06
Jul-0
6Ja
n-07
Jul-0
7
$/b
l
0
10
20
30
40
50
60
70
80
90
$/b
l
Brent Dtd (RHs axis) ULSD crack vs Brent
Gasoline crack vs Brent HSFO crack vs Brent

September 2007 SARAS S.p.A. 11
Med refining context
CRUDE
• The Med crude slate is forecast to become sweeter and lighter, an exception to world average
• The Med is becoming a net crude exporter with a positive pressure on prices
0
10
20
30
40
50
1995 2005
Diesel car registrations trend
(% of total registrations)
Mediterranean Europe: crude demand and supply
0
1
2
3
4
5
6
7
2000 2001 2002 2003 2004 2005 2006M
illio
n b
arr
els
/da
y
Black Sea Lybia BTC Algeria South Europe imports
The Med : the ideal position for complex and diesel oriented refineries
PRODUCTS
• Diesel demand becoming more difficult to satisfy in Europe: new car registrations show a continuous growth of diesel-powered cars at the expense of gasoline-fuelled vehicles
• Deficit of diesel growing by about 2.5 million tons per year while surplus of gasoline growing by about 1.5 million tons per year

September 2007 SARAS S.p.A. 12
Margins stability: influence of Power
213 220 220
349445 457
0
100
200
300
400
500
600
700
800
2005 2006 2007E(*)
Eur million
Power Generation Refining&Marketing
(*) Bloomberg consensus
6.59
2.69
2.74
2.80 2.80
3.48
3.543.61 3.61
7.316.07 6.26
12.24
13.5912.67 13.00
0
2
4
6
8
10
12
14
16
2005 2006 Q1/07 Q2/07
Eur cent/KWhour
Fuel (indexed to Brent) Capex+operations (indexed to inflation)Incentive (up to 2009) Italian average electricity price
Power EBITDA essentially flat until 2021 Power tariff indexed to oil prices
• Power tariff set by law until 2021 and indexed to oil prices (CIP6/92 law)
• EBITDA substantially flat until 2021 due to the linearization procedure required by IFRS accounting rules

September 2007 SARAS S.p.A. 13
Saras is also a provider of refining services through processing contracts
A processing contract is an agreement to process third party crude oil under predetermined
conditions (i.e. product yields, processing fee, storage and delivery terms).
Saras’ processing contracts are grade specific and focused on certain families for which Saras
has specific need/interest.
Advantages of processing:
� Access to special crude oils otherwise
difficult to acquire
� Long term stability of supply
� Reduced working capital
� Stabilization of returns (equivalent to a put
option on the refining margins at fraction
of cost)
Approximate split of the value for third party runs
Profit Share
Optimization
Base Fee
Margins stability: Processing contracts

September 2007 SARAS S.p.A. 14
2,0
3,0
4,0
5,0
6,0
7,0
8,0
9,0
10,0
0,0 0,5 1,0 1,5 2,0 2,5 3,0 3,5 4,0 4,5 5,0
EMC benchmark, $/bl
Sara
s m
arg
in,
$/b
l
equivalent PUT Option
Processing
Saras' own crude
Efficient protection in case of margin downturn
Margins stability: Processing contracts

September 2007 SARAS S.p.A. 15
Growth strategy
High return and low risk organic growth strategy
Saras has a track record of “no regret” upgrading of the refinery
� lower investment risk (addition rather than step change)
� synergies with existing units, thanks to a long term view
CAPEX approx EUR 600 million in the period 2006-2009 (of which half is maintain capacity) with the following goals:
� Increase conversion capacity (+350,000 tons/year of diesel by end of 2007)
� additional runs thanks to increased time interval between major overhauls
� Increase capacity of running “unconventional” difficult crudes
Expected refining margin improvement of 1.8-2.4 $/bl by 2009 (1.2 $/bl already achieved in 2006/2007) with a positive impact on EBITDA of US$ 210-300 ml (US$ 120 million already achieved in 2006/2007)
After tax project IRR higher than 20%

September 2007 SARAS S.p.A. 16
Growth strategy
CAPEX forrefining
EUR 600 ml
2006 INCREASE CONVERSION CAPACITY
+ 200,000 TONS PER YEAR OF DIESEL + 0.5-0.7 $/bl
+ 150,000 TONS PER YEAR OF DIESEL (starting from Q3)
INCREASE REFINERY RUNS
+ 700,000 TONS
IMPROVE ENERGY EFFICIENCY
- 75,000 tons of C&L
HEAVY UP OF CRUDE SLATE
- 2 deg API
2007
2008
2009
Impact on refining margin
+ 0.5-0.6 $/bl
+ 0.6-0.8 $/bl
+ 0.2-0.3 $/bl
+ 1.8-2.4 $/bl
+ $ 50-70 ml
Impact on refining EBITDA
+ $ 60-80 ml
+ $ 20-30 ml
+ $ 210-300 ml
+ $ 50-60 ml
+ $ 30-50 ml
EUR
150 ml
EUR
150 ml
EUR
130 ml
EUR
170 ml
After tax project IRR > 20 %
TOTAL
organic growth strategy: further details

September 2007 SARAS S.p.A. 17
Growth strategy
Strong balance sheet sets the base of our external growth strategy
IN OUR CORE BUSINESSES
M&A opportunities in:
� Refining in Europe: assets and companies possibly available for sale are potential targets
� Marketing & Oil logistics: selective acquisitions to improve competitive position in specific areas (Spanish Med and Italy)
IN RELATED SECTORS
� WIND: pipeline of projects in the permitting phase
� BIODIESEL: 200,000 tons/year plant operational from 2008 (investment EUR 35 mil) to comply with new European regulations by 2010
� GAS EXPLORATION: committed about EUR 10 ml for seismic tests. Encouraging preliminary results, final results by end 2008.
BASIS FOR INVESTMENT: Stringent investment criteria:
• PROJECT IRR AFTER TAX 10-% 20% depending on business sector
• No growth for growth’s sake
• EPS accretive from day 1

September 2007 SARAS S.p.A. 18
Major maintenance schedule
• 2007 refinery maintenance schedule will affect refinery runs and also marginally conversion, no major maintenance in 2008
• Maintenance on IGCC power plant will have negligible impact on IFRS EBITDA since scheduled maintenance cycles and related production changes are included in the linearization procedure required by IFRS accounting principles
Impact of maintenance minimized by multi train configuration
IGCC
2 gasifier2 turbine
1 gasifier1 turbine
1 gasifier1 turbine
PLANT
4.2-4.64.2-4.61.0-1.11.1-1.20.9341.215Millions of
MWh
Estimated power production
1477USD millionAdditional loss on EBITDA due to lower conversion capacity
REFINERY
15.0-15.2110-111
14.3-14.5104-106
3.35-3.4524.5-25.2
3.70-3.8027.0-27.7
3.4124.9
3.8127.8
million tonsmillion bblEstimated runs
2 crude dist
1 vacuumMHC visbr
1 crude dist.
1 MHC1 crude dist.
1 vacuumvisbreaker
PLANT
2008expected
2007expected
Q4/07expected
Q3/07expected
Q2/07actual
Q1/07actual

••• Saras in a snapshotSaras in a snapshotSaras in a snapshot
• Market overview
••• Business segments descriptionBusiness segments descriptionBusiness segments description
••• FinancialsFinancialsFinancials
••• OtherOtherOther

September 2007 SARAS S.p.A. 20
Historical data
World Oil Demand and Refining Capacity
40.0
45.0
50.0
55.0
60.0
65.0
70.0
75.0
80.0
85.0
90.0
1980 1982 1984 1986 1988 1990 1992 1994 1996 1998 2000 2002 2004 2006
MM
bl
per
day
70%
75%
80%
85%
90%
95%
100%
Refinery utilization %
Oil demand
Distillation capacity
Refinery throughput

September 2007 SARAS S.p.A. 21
Historical data
US and Europe demand by productssource EMC World Refining Outlook, 2006
2.0
3.0
4.0
5.0
6.0
7.0
8.0
9.0
10.0
11.0
2002 2003 2004 2005 2006
Mil
lio
n b
/d
North America Gasoil EU Gasoil EU Gasoline North America Gasoline
USA and Europe: product demand pattern

September 2007 SARAS S.p.A. 22
Historical data
Crude prices
Source: Platt’s
0
10
20
30
40
50
60
70
80
Jan-
99Ju
l-99
Jan-
00
Jul-0
0Ja
n-01
Jul-0
1Ja
n-02
Jul-0
2Ja
n-03
Jul-0
3Ja
n-04
Jul-0
4Ja
n-05
Jul-0
5Ja
n-06
Jul-0
6Ja
n-07
Jul-0
7
$/bl
0
2
4
6
8
10
12
14
$/blBrent vs Arab Hvy (RHs axis) Brent dtd Urals Med Arabian Heavy Med
0
10
20
30
40
50
60
70
80
Jan-
99Ju
l-99
Jan-
00Ju
l-00
Jan-
01Ju
l-01
Jan-
02Ju
l-02
Jan-
03Ju
l-03
Jan-
04Ju
l-04
Jan-
05Ju
l-05
Jan-
06Ju
l-06
Jan-
07Ju
l-07
$/bl
02468101214161820
$/blWTI vs Maya (RHs axis) WTI Maya

September 2007 SARAS S.p.A. 23
Historical data
US market: gasoline crack spreads & stocks
Source: Platt’s & DOE
USA: Gasoline Crack spread vs WTI (Nymex)
0
5
10
15
20
25
30
35
40
1 4 7 10 13 16 19 22 25 28 31 34 37 40 43 46 49 52
Week n°
US
$/b
l
2007
2006
2001-2005 avg
2001-2005 range
USA: Gasoline stocks (demand fwd cover)
19
20
21
22
23
24
25
26
27
28
29
1 4 7 10 13 16 19 22 25 28 31 34 37 40 43 46 49 52
Week n°
day
s
2007
2006
2001-2005 avg
2001-2005 range

September 2007 SARAS S.p.A. 24
Historical data
US market: distillates crack spreads & stocks
Source: Platt’s & DOE
USA: Distillates stocks (demand fwd cover)
15
20
25
30
35
40
45
50
1 4 7 10 13 16 19 22 25 28 31 34 37 40 43 46 49 52
Week n°
day
s
2007 2006
2001-2005 avg
2001-2005 range
USA: Distillate Crack spread vs WTI (Nymex)
0
4
8
12
16
20
24
28
1 4 7 10 13 16 19 22 25 28 31 34 37 40 43 46 49 52
Week n°
US
$/b
l
2007
2006
2001-2005 avg
2001-2005 range

September 2007 SARAS S.p.A. 25
Historical data
US market: refinery utilization
Source: DOE
USA: Refinery utilization
65
70
75
80
85
90
95
100
1 4 7 10 13 16 19 22 25 28 31 34 37 40 43 46 49 52
Week n°
% u
tili
zati
on
2007
2006
2001-2005 avg
2001-2005 range

September 2007 SARAS S.p.A. 26
Historical data
Europe Med: Crude and Products prices
Source: Platt’s
0
10
20
30
40
50
60
70
80
Jan-
99Jul
-99
Jan-
00Ju
l-00
Jan-
01Ju
l-01
Jan-
02Ju
l-02
Jan-
03Ju
l-03
Jan-
04Ju
l-04
Jan-0
5Ju
l-05
Jan-
06Ju
l-06
Jan-
07Ju
l-07
Ura
ls M
ed
, $
/bl
0
100
200
300
400
500
600
700
800
Pro
du
cts
, $/t
on
Urals Med Gasoline ULSD Fuel Oil HS

September 2007 SARAS S.p.A. 27
Historical data
Med market: gasoline and diesel crack spreadsMonthly averages
Source: Platt’s
Med: Gasoline Crack spread vs Brent
0
2
4
6
8
10
12
14
16
18
20
22
24
Jan Feb Mar Apr May Jun Jul Aug Sep Oct Nov Dec
US
$/b
l
2007
2006
2001-2005 avg
2001-2005 range
Med: Diesel Crack spread vs Brent
0
3
6
9
12
15
18
21
24
27
30
Jan Feb Mar Apr May Jun Jul Aug Sep Oct Nov Dec
US
$/b
l
2007
2006
2001-2005 avg
2001-2005 range

September 2007 SARAS S.p.A. 28
Historical data
European market: refinery utilization
OECD Europe: Refinery utilization
75
77
79
81
83
85
87
89
91
93
95
Jan Feb Mar Apr May Jun Jul Aug Sep Oct Nov Dec
% utilization
2007
2006
2001-2005 avg
2001-2005 range

September 2007 SARAS S.p.A. 29
Historical data
Europe Med: product differentials
Source: Platt’s
0
50
100
150
200
250
300
350
400
Jan-
99Ju
l-99
Jan-
00Ju
l-00
Jan-
01Ju
l-01
Jan-
02Ju
l-02
Jan-
03Ju
l-03
Jan-
04Ju
l-04
Jan-
05Ju
l-05
Jan-
06Ju
l-06
Jan-
07Ju
l-07
$/t
on
0
20
40
60
$/t
on
ULSD vs HSFO LSFO vs HSFO (rhs axis)
0
100
200
300
400
500
600
700
Jan-
99Ju
l-99
Jan-
00Ju
l-00
Jan-
01Ju
l-01
Jan-
02Ju
l-02
Jan-
03Ju
l-03
Jan-
04Ju
l-04
Jan-
05Ju
l-05
Jan-
06Ju
l-06
Jan-
07Ju
l-07
$/t
on
0
20
40
60
$/t
on
Delta (rhs axis) ULSD Gasoil 0,2%S

September 2007 SARAS S.p.A. 30
Oil Market Outlook
Middle Distillates demand forecast
source EMC World Refining Outlook, 2006
4.8 4.8 4.8 4.9
6.6 6.7 6.8 6.9
7.0 7.1 7.2 7.4
1.3 1.4 1.5 1.6
0
2
4
6
8
10
12
14
16
18
20
22
24
2007 2008 2009 2010
Mil
lio
n b
/d
North America Europe Asia Middle East
Gasoline demand forecast
source EMC World Refining Outlook, 2006
10.1 10.2 10.3 10.4
2.6 2.5 2.4 2.3
4.1 4.2 4.3 4.4
1.6 1.8 1.8 1.9
0
2
4
6
8
10
12
14
16
18
20
22
2007 2008 2009 2010M
illi
on
b/d
North America Europe Asia Middle East
2007-2010 Avg growth rate: 1.7% 2007-2010 Avg growth rate: 1.0%
Product demand forecast

September 2007 SARAS S.p.A. 31
Oil Market Outlook
Refining Industry: capital costs & investments
US PPI IRON&STEEL
1982=100
Source BLOOMBERG
Rising construction costs have made new projects unprofitable

September 2007 SARAS S.p.A. 32
Oil Market Outlook
Coker (20 kbd), Hydrocracker (40 kbd). Planned for 2010ELEFSIS (HELLENIC PETROLEUM)
Distillation (50 kbd). Planned for 2010SINES (GALP)
Sources: Purvin&Gertz, Emc (World Refining Outlook 2006)
Coker (20 kbd). Declared completion: 2009CASTELLON (BP)
Distillation (110 kbd), Hydrocracker (50 kbd), Coker (60 kbd).
Declared completion: 2009
CARTAGENA (REPSOL)
Hydrocracker (18 kbd). Declared completion: 2009TARANTO (ENI)
Coker (40 kbd). Declared completion: 2009BILBAO (REPSOL)
PROCESSING UNITS AND COMMENTSREFINERY
European Refining Industry: investments in distillation and conversion

September 2007 SARAS S.p.A. 33
Oil Market Outlook
ReutersPlans to build new refineries in Indonesia (with Aramco, KNPC, Petronas and Sinopec) cancelled as costs soared
Pertamina19 Feb ’07
Energy CompassExxonMobil and state Qatar Petroleum (QP) have shelved their Palm natural gas-to-liquids(GTL) project in the Mideast Gulf state. Qatari Energy Minister Abdullah al-Attiyah said high costs forced cancellation of the 154,000 b/d complex. Project inflation had pushed the price tag from an initial $7 billion in 2004 to more than $15 billion, according to industry sources.
ExxonMobil23 Feb ‘07
Kuwait’s Al-Zour refinery could be scrapped: rising costs could doom Kuwait’s proposed Al-Zour refinery, which may be scrapped after bids submitted in December were much higher than Kuwait National Petroleum Co. (KNPC) Envisaged
Oil refiner Sunoco Inc. is reviewing its expansion plans after the cost of a $300 million expansion project at its Philadelphia, Pennsylvania, refinery jumped by a third in less than a year
ConocoPhillips Corp. said it is re-evaluating the deep conversion expansion project at its 260,000 barrel per day refinery in Wilhelmshaven, Germany, due to shifting economics
NEWS
Al-Zour (Kuwait)
Sunoco
ConocoPhillips
REFINERY or COMPANY
Reuters2 Nov ‘06
Energy CompassDec ‘06
Reuters2 Nov ‘06
SOURCEDATE
Refining Industry: relevant news about investment plans

September 2007 SARAS S.p.A. 34
Oil Market Outlook
Energy CompassThe stalled 615,000 b/d project was relaunched with $12 billion budget and with new construction terms (cost-reimbursable basis). Planned statrup for 2011
Al-Zour (Kuwait)22 June ‘07
Middle east economic digest
State owned oil company, plans to build a 400,000 barrel-a-day refinery that will cost as much as $8 billion, The East Coast refinery will be built at Ras Tanura, Saudi Arabia, and is scheduled to be completed by January 2012 and will process Arabian heavy crude
Saudi Aramco15 June ‘07
Energy CompassRD Shell looks set to upgrade rather than expand its 110,000 b/d Tabangaorefinery; initial estimates for the upgrade have already risen above $300 ml from initial $100-200 ml
Philippines22 June ‘07
Energy CompassQatar agreed to build a 150,000 b/d refinery on Tunisia’s east cost. A joint committee will study technical specifications for the $2 billion plant over the next six months, with a start-up targeted for 2011
Qatar Petroleum22 June ‘07
Energy CompassFujairah refinery: Abu Dhabi’s International Petroleum Investment Co. may scale down a planned refinery in the UAE amid concerns that partner ConocoPhillips will pull out because of soaring costs. A pre-feasibility study for the Fujairah refinery came in recently with a cost of around $11 billion, up from original estimates of $5 billion- $6 billion
ConocoPhillipsApr’ 07
BloombergAngola’s state owned company is seeking to cut the cost of a new 200,000 b/d refinery, after the decision to end talks with Sinopec for a $3.7 billion project
Sonangol6 Mar ’07
NEWSREFINERY or COMPANY
SOURCEDATE
Refining Industry: relevant news about investment plans

September 2007 SARAS S.p.A. 35
Oil Market Outlook
BloombergTechnip Awarded a Front-End Engineering Design Contract for a 250,000 bbl/day Grassroots Refinery in Qatar + a crude oil pipeline from the Al Shaheenfield to Messaieed (90km offshore and 110km onshore), as well as other required import/export facilities. The facilities are scheduled to be operational by the end of 2011.
Qatar petroleum/ Techinp
27 Aug ‘07
ReutersTurkish fuel retailer Petrol Ofisi said it would invest $4.5 billion in building a refinery in the Mediterranean port city of Ceyhan for which it received permission late last month
Petrol Ofisi / Ceyhan4 Lug ’07
NEWSREFINERY or COMPANY
SOURCEDATE
Refining Industry: relevant news about investment plans

••• Saras in a snapshotSaras in a snapshotSaras in a snapshot
••• Market overviewMarket overviewMarket overview
• Business segments description
••• FinancialsFinancialsFinancials
••• OtherOtherOther

September 2007 SARAS S.p.A. 37
Refining
2,623,2508.7TOTAL with Gasification
180,00015.012,000BTX Plant
85,0005.017,000Semi-rigenerative Reformer
2,383,2507.9TOTAL COMPLEXITY
9.6
12.0
1.0
10.0
10.0
2.5
6.0
5.0
6.0
2.75
2.0
1.0
Nelson Complexity
Factor
240,00020,000Gasification
62,000
6,000
8,000
107,000
105,000
29,000
86,000
41,000
105,000
300,000
Capacity (barrels per
calendar day)
60,000Oxygenates (TAME)
62,000Hydrogen/PSA (MMcfd)
267,500Hydrotreating
80,000Alkylation
145,000Cat Reforming (CCR)
2,888,250TOTAL with Gasification & PetChem
630,000Distillate Hydrocracking
516,000Distillate Cracking (FCC)
112,750Visbreaking
210,000Vacuum Distillation
300,000Atmospheric Distillation
Complexity barrels
Process Unit
Sarroch refinery: structure and Nelson complexity index

September 2007 SARAS S.p.A. 38
Refining
Supersites and non-supersites ranking (source: WoodMackenzie)
All Data from WoodMac Downstream Online ( data available as of February 2007):
(*) Note for Saras: reported complexity by WoodMac is 7.9 but does not include full ownership of IGCC and is based on 313 kbcd capacity
We are restating Saras complexity (under WoodMac methodology) considering 100% IGCC ownership and a capacity of 300 kbcd
CAPACITIES (Mton/y)
8.6 8.6 8.47.9
7.0 6.9
6.1
9.28.7
8.3 8.2
6.3
Kar
lsru
he
(Sh
, Ex
x, C
on, B
P)
Sar
roch
(S
AR
AS
)
An
twer
p (
TOT
AL)
Pri
olo
(E
RG
)
Plo
ck (
PK
N)
Gel
sen
kirc
hen
(B
P)
Per
nis
(She
l l)
Mo
torO
il H
ella
s
Asp
ropy
rgo
s (H
EP)
Sza
zhal
om
batt
a (M
OL)
Po
rvo
o (
NE
ST
E)
Sch
wec
hat
(O
MV
)
WoodMackenzie: complexity indexes for the major European refineries (*)
14,9 15,0 17,4 14,6 8,016,9 12,6 6,720,7 5,3 10,0
SUPERSITES
9,4
NON SUPERSITES

September 2007 SARAS S.p.A. 39
Refining
24,122,800
375,500
5,541,490
4,365,260
713,900
5,012,500
8,114,100
barrels
3,835,100162TOTAL
59,700
881,000
694,000
113,500
796,900
1,290,000
Cubic metres
37
31
35
11
35
13
Nr. of tanks
FUEL OIL
LPG AND PENTANES
GASOIL
KEROSENE
GASOLINE
CRUDE OIL
• 11 BERTHS • 300,000 SDWT VESSELS (MAX)
Sarroch refinery: storage and marine terminal

September 2007 SARAS S.p.A. 40
Refining
Sarroch refinery: ranking by capacity
European Refineries
0
50
100
150
200
250
300
350
400
450
Ca
pa
cit
y,
kb
d
Average = 140 kbd
ERG coastal
SARAS
HEP Aspropyrgos
NESTE Porvoo
PKN Plock
MotorOilPetroplus Ingolstadt

September 2007 SARAS S.p.A. 41
Refining
Sarroch refinery: ranking by complexity
Nelson Index for European refineries with at least 140 kbd capacity (i.e. European average)
0
2
4
6
8
10
12
14
16
18
20
Ne
lso
n C
om
ple
xit
y In
de
x
ERG coastal
SARAS
HEP AspropyrgosNESTE Porvoo
PKN Plock
Petroplus Coryton

September 2007 SARAS S.p.A. 42
Refining
234,400
48,000
84,000
16,400
86,000
FCC Equivalent
barrels
240
80
40
100
FCC Equivalent
Factor %
16.020,000Gasification
105,000
41,000
86,000
Capacity (barrels per
calendar day)
78.1TOTAL
28.0Distillate Hydrocracking
5.5Visbreaking
28.6FCC
FCC Equivalent % on Distillation
Process Unit
Sarroch refinery: FCC equivalent index
Source: WoodMackenzie

September 2007 SARAS S.p.A. 43
Refining
Sarroch refinery: ranking by FCC equivalent conversion installed
Source: WoodMackenzie
Residue conversion capacity of European refineries
0
20
40
60
80
100
120
140
160
180
200
220
240
FC
C e
qu
ivale
nt
ba
rre
ls, k
bd
ERG coastal
SARAS
HEP Aspropyrgos
NESTE Porvoo
PKN Plock
MotorOil
Petroplus Ingolstadt
Conoco Killingholme
Petroplus Coryton
September 2007 SARAS S.p.A. 44
Refining
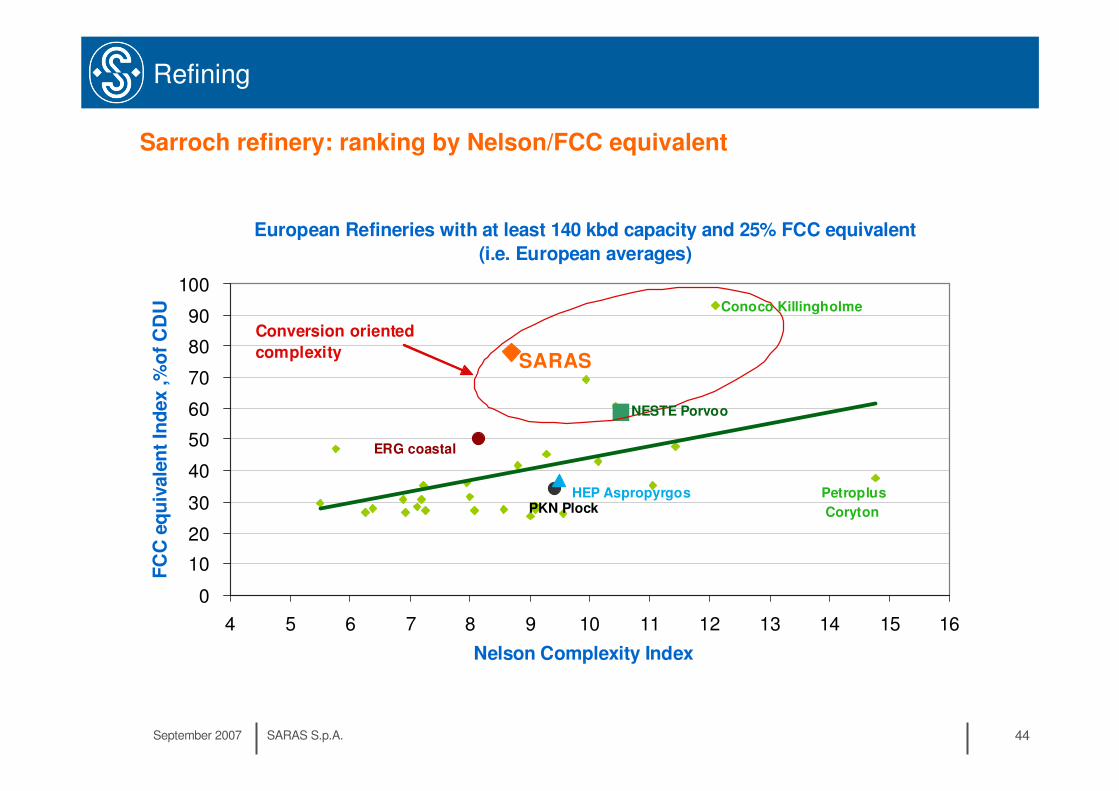
Sarroch refinery: ranking by Nelson/FCC equivalent
European Refineries with at least 140 kbd capacity and 25% FCC equivalent
(i.e. European averages)
0
10
20
30
40
50
60
70
80
90
100
4 5 6 7 8 9 10 11 12 13 14 15 16
Nelson Complexity Index
FC
C e
qu
ivale
nt
Ind
ex ,%
of
CD
U
Conversion oriented
complexity
ERG coastal
SARAS
HEP Aspropyrgos
NESTE Porvoo
PKN Plock
Conoco Killingholme
Petroplus
Coryton

September 2007 SARAS S.p.A. 45
1
3 CDU
(Crude DistillationUnit)
2 VDU
(VacuumDistillationUnit)
2 MHC
(MildHydrocracking)
1 FCC
(Fluid CatalyticCracker)
HeavydistillatesT1
T2
T3
V1
V2
Heavyresidue
MHC1
MHC2
FCC
2 REFORMERCCR1
CCR2(Polimeri)
TAR
1 VSB
(Visbreaker)VSB
3 GASIFIERS
G1G2
G3SYNGAS
3 GAS-STEAM TURBINES
POWER
1 ETHERIFICATION
1 ALKYLATION
5 DESULPHURIZATION UNITS
DIESEL
GASOLINE
Hydrogen
Hyd
rog
en
CRUDE OIL
Athmosferic and Vacuumdistillation
Conversion units Desulphurization & finishing
IGCC Power plant
Refining
Sarroch refinery: structure

September 2007 SARAS S.p.A. 46
Refining
Sarroch refinery reference capacity is 300,000 barrels per calendar day
Sarroch refinery: runs
14.0 14.2 14.0 14.4 14.3 14.515.1
14.5
106 106102 104 102
105 104110
0.0
2.0
4.0
6.0
8.0
10.0
12.0
14.0
16.0
18.0
20.0
2002 2003 2004 2005 2006 2007E 2008E 2009E
million tons
80
85
90
95
100
105
110
115million bbl
Processing for third parties Own crude Total runs tot

September 2007 SARAS S.p.A. 47
Refining
Sarroch refinery: crude oil slate by grade and by origin (2006 data)
-1 0 1 2 3
%S
15
20
25
30
35
40
45
°AP
I
Brent
Ural
45 million
Barrel/year
28 million
Barrel/year
24 million
Barrel/year
Saras average
Light extra sweet
Light sweet
Medium Sour
Medium Sweet
Heavy Sour
-1 0 1 2 3
%S
15
20
25
30
35
40
45
°AP
I
Brent
Ural
45 million
Barrel/year
28 million
Barrel/year
24 million
Barrel/year
Saras average
Light extra sweet
Light sweet
Medium Sour
Medium Sweet
Heavy Sour
North Sea 20%
Middle East
13% FSU 6%
North Africa
61%

September 2007 SARAS S.p.A. 48
2006 data
Refining
Sarroch refinery: product yields
H1/07 data
C&L
6.1%LPG
2.3%
Naphtha&
Gasoline
27.8%
Middle
Distillates
52.0%
Fuel Oil&Other
4.2%
IGCC feed
7.6%
C&L 5.9%
Naphtha &
Gasoline
27.3%
LPG 2.2 %
Middle
Distillates
(mainly diesel)
51.4%
IGCC feed
8.1%
Fuel Oil&Other
5.1%

September 2007 SARAS S.p.A. 49
Refining
2.62.4 2.4
0.0
0.3
0.5
0.8
1.0
1.3
1.5
1.8
2.0
2.3
2.5
2.8
3.0
3.3
3.5
2005
2006
2007
2008
2009
2010
2011
2012
allocated emissions
Million tons
Sarroch refinery Co2 emissions
September 2007 SARAS S.p.A. 50
Refining
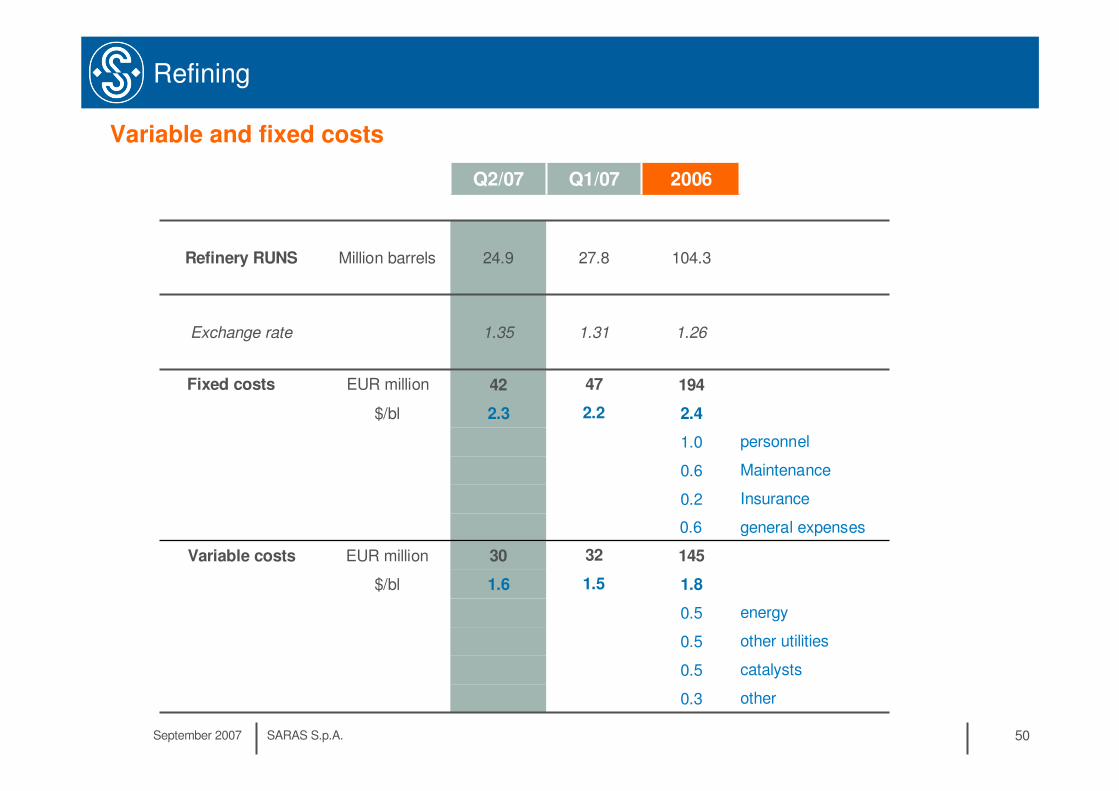
1.6
30
2.3
42
1.35
24.9
Q2/07
energy0.5
other utilities0.5
catalysts0.5
14532EUR millionVariable costs
0.3
1.8
0.6
0.2
0.6
1.0
2.4
194
1.26
104.3
2006
other
general expenses
Insurance
Maintenance
personnel
47EUR millionFixed costs
1.5$/bl
2.2$/bl
Million barrels
1.31Exchange rate
27.8
Q1/07
Refinery RUNS
Variable and fixed costs
September 2007 SARAS S.p.A. 51
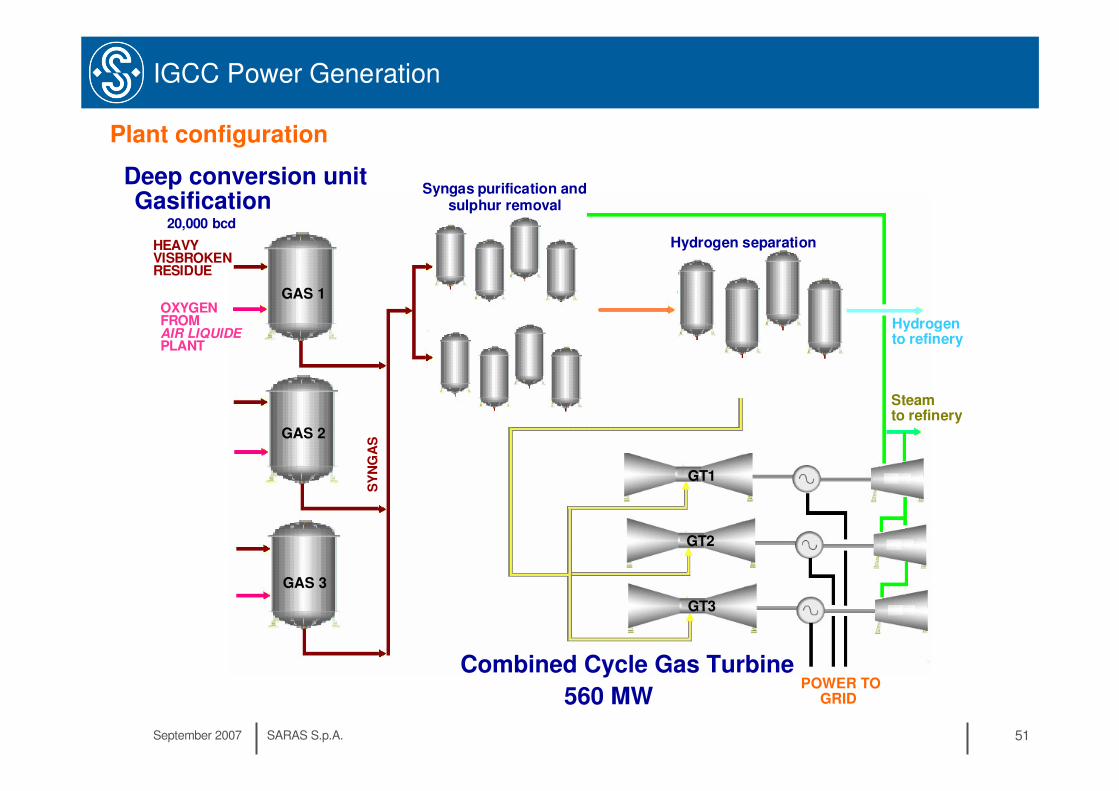
IGCC Power Generation
Plant configuration
HEAVY VISBROKEN RESIDUE
OXYGEN FROMAIR LIQUIDEPLANT
Hydrogento refinery
Deep conversion unitGasification
20,000 bcd
Combined Cycle Gas Turbine
560 MW
SY
NG
AS
Steamto refinery
GAS 1
POWER TO GRID
GT1
GAS 2
GAS 3
GT3
GT2
Syngas purification and sulphur removal
Hydrogen separation
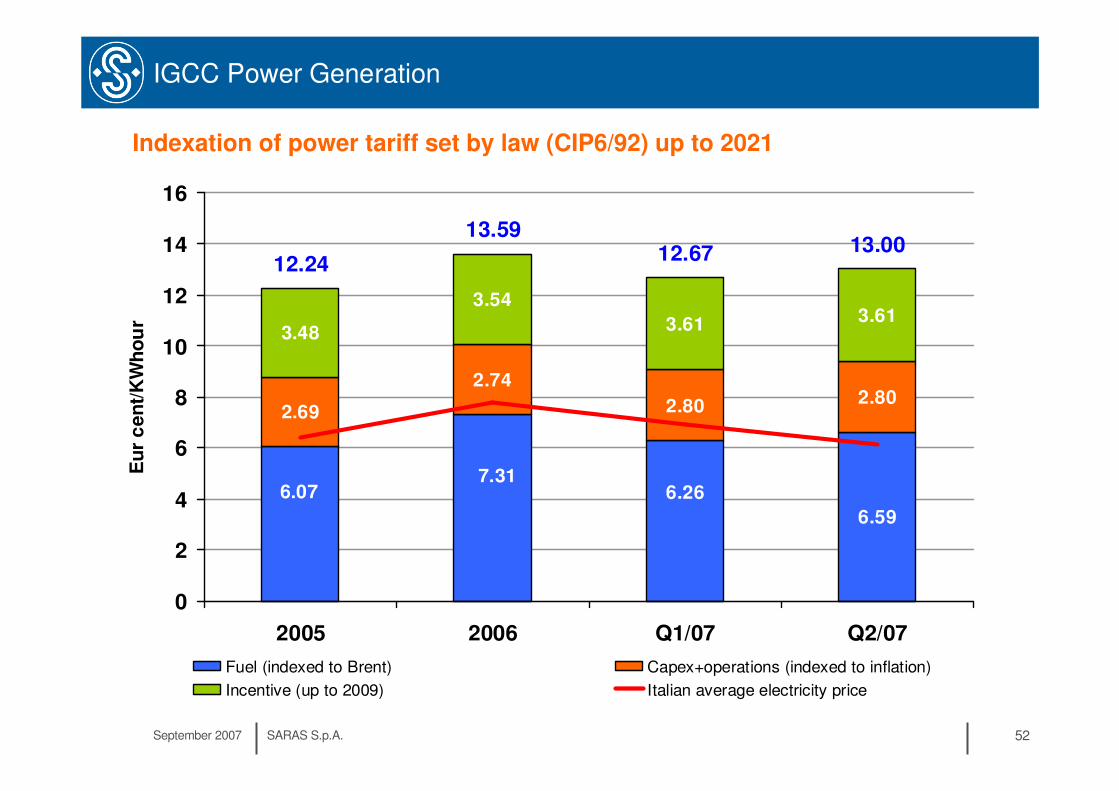
September 2007 SARAS S.p.A. 52
IGCC Power Generation
6.59
2.69
2.74
2.80 2.80
3.48
3.54
3.61 3.61
7.316.07 6.26
12.24
13.5912.67 13.00
0
2
4
6
8
10
12
14
16
2005 2006 Q1/07 Q2/07
Eu
r c
en
t/K
Wh
ou
r
Fuel (indexed to Brent) Capex+operations (indexed to inflation)
Incentive (up to 2009) Italian average electricity price
Indexation of power tariff set by law (CIP6/92) up to 2021

September 2007 SARAS S.p.A. 53
IGCC Power Generation
0.5
0.6
0.7
0.8
0.9
1.0
1.1
1.2
1.3
2001 2002 2003 2004 2005 2006
Gasific
ation feed '000,0
00 tons
2.1
2.4
2.7
3.0
3.3
3.6
3.9
4.2
4.5
Ele
ctric
ity p
roduction, TW
h
Tar Gasoil Electricity
Production & feedstock consumptions

September 2007 SARAS S.p.A. 54
IGCC Power Generation
Million tons
CO2 emissions
3.7 3.9 3.9
0.0
0.5
1.0
1.5
2.0
2.5
3.0
3.5
4.0
4.5
2005
2006
2007
2008
2009
2010
2011
2012
allocatedemissions
• Article 7bis of CIP6/92 law state: “the sale price of electricity will be updated in case of changes of regulations implying higher or additional costs for the producers”
• The guidelines of Italian energy authority, issued on 15th November 2006, confirm applicability of article 7bis to the CO2 related costs and also define reimbursement mechanism.
• Final resolution from the energy authority expected soon
September 2007 SARAS S.p.A. 55
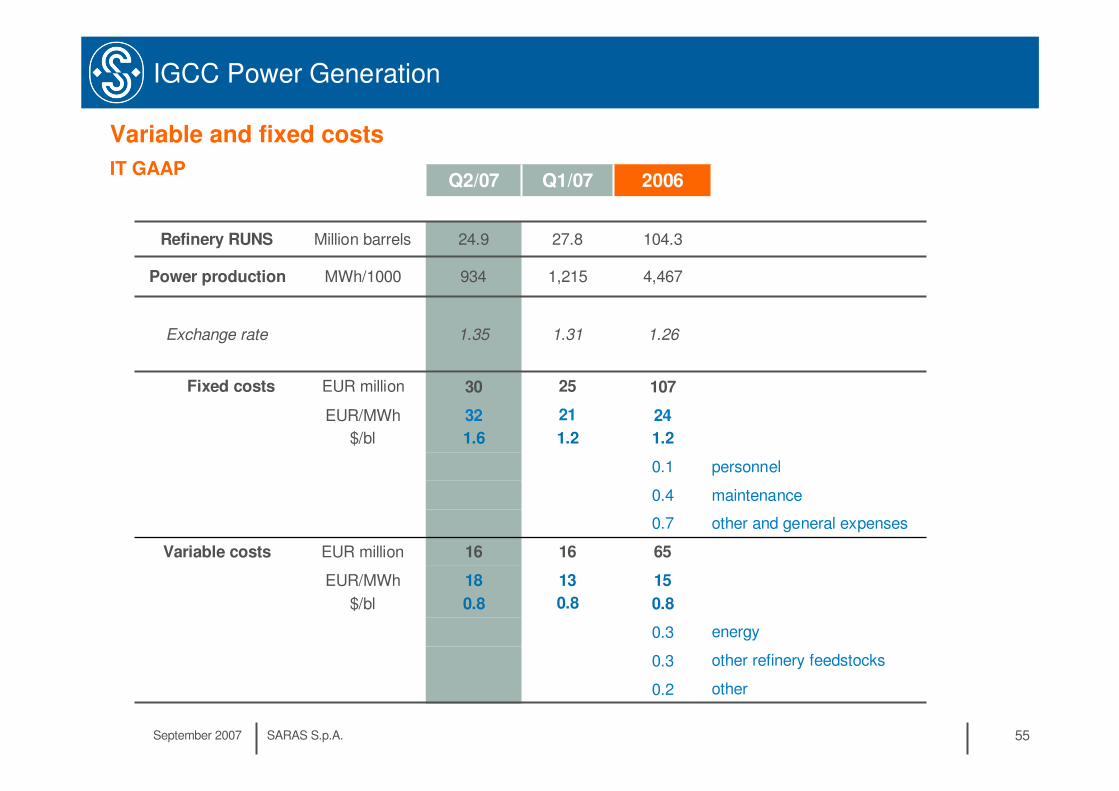
IGCC Power Generation
4,4671,215934MWh/1000Power production
energy0.3
other refinery feedstocks0.3
651616EUR millionVariable costs
0.2
15
0.8
0.7
0.4
0.1
24
1.2
107
1.26
104.3
2006
other
other and general expenses
maintenance
personnel
2530EUR millionFixed costs
13
0.8
18
0.8
EUR/MWh
$/bl
21
1.2
32
1.6
EUR/MWh
$/bl
Million barrels
1.311.35Exchange rate
24.9
Q2/07
27.8Refinery RUNS
Q1/07
Variable and fixed costs
IT GAAP

September 2007 SARAS S.p.A. 56
IGCC Power Generation
40.5
(14.5)
55.0
(32.0)
(18.0)
(38.7)
13.7
36.1
93.9
130.0
Q2/07
35.4
100.5
36.1
90.6
€ /MWh
€ /MWh
Incentive (up to 2009)
Other tariff components
13.711.7€ /MWhREVENUES FROM UTILITIES
(38.1)(33.9)€ /MWhFEEDSTOCKS FOR GASIFICATION
135.9126.7€/MWhREVENUES FROM POWER
(14.6)(13.0)€ /MWhVARIABLE COSTS
(24.0)(21.0)€ /MWhFIXED COSTS
73.070.5€ /MWhEBITDA
(12.1)(11.0)€ /MWhD&A
60.959.5€ /MWhEBIT
Q1/07 2006
Revenues and costs per Megawatt-hour (IT GAAP)

September 2007 SARAS S.p.A. 57
Marketing
Logistic of wholesale/retail operations in Italy and Spain
Owned depot
Third party depot
934
255
680
Q1/07
3,219
1,013
2,206
2006
803
263
540
Q1/06
771
236
535
Q2/06
2,957
1,037
1,920
2005
775
238
537
Q3/06
870
276
594
Q4/06
268ITALY
920TOTAL
652SPAIN
Q2/07Sales (thousand
tons)
37 service stations
other inland depot
wholesale market
share in Italy: ~5.5%
wholesale market share
in Spain: ~ 3.5%
Arcola Petrolifera
2 time chartered product vessels

September 2007 SARAS S.p.A. 58
Marketing
2 owned depots
Cartagena (Spain): 112,000 cubic meters
Arcola (Italy) : 200,000 cubic meters
A retail network of 37 high throughput service stations (abt 3.5 million litre per year) located in the Spanish med area

September 2007 SARAS S.p.A. 59
Wind
Wind in Italy
Sardinia347 MW
North Italy44 MW
Campania and Basilicata574 MW
Puglia, Abruzzo and Molise695 MW
Sicily451 MW
Capacity installed end 2006
Wind in Europe
3,136DENMARK
2,123ITALY
MW
48,416
11,615
20,622
SPAIN
TOTAL EU
GERMANY
Capacity installed end 2006
• Electric energy created by renewable energy plants are entitled to receive GC, related to the KWh produced, for the first 12 years of production since their last inspection.
• Said GC are issued by the Administrator with reference to the previous year´s effective production or in accordance with the foreseeable quantity of energy that will be produced the following year by the requesting operator.
• Specifically, all operators of the field, whether producers or traders, must possess and subsequently file a certain number of GC equal to 2% of the energy used/produced in the course of the previous year. GC are securities representing renewable energy whose purchase and filing with the Administrator must occur to avoid unlawful use of the energy by the operator. Also noteworthy is the
fact that the Administrator issues the GC and is then required to annul them, thus entitling the operators to comply with the above indicated Green Portfolio requirements.
• GC may be traded independently from the related renewable energy. Further, there is no legal
limitation on the possibility to freely and repeatedly trade GC before they are annulled by the Administrator. The only limit is given by the need of using certificates representing the past year´́́́s production. By way of example, if a GC is issued at the beginning of the year 2001, referring to energy that will be produced in the year 2002, its annulment must occur by March 31, 2003. Therefore,
throughout the entire period running from the date of issuance to the date of annulment, operators are entitled to trade GC, privately or within the Energy Stock Market, without any legal limitations whatsoever, except to the possibility of exporting the certificates abroad. In particular, as briefly mentioned above, GC do not necessarily have to be traded in connection with the energy they
represent, as long as the relative sale takes place in Italy. Contrarily, GC can be sold abroad only in conjunction with the sale of energy.
Green Certificates

September 2007 SARAS S.p.A. 60
Wind
Ulassai wind farm
Ulassai wind farm
Sardinia
• area of 6,500 acres
• 84 MW (42 Vestas aero generators x 2MW)
• upgradeable to 96 MW
• production of approx 150,000 MWh per year
• investment of EUR 100 million
• joint venture with Backcock&Brown (Saras 70%)
• project finance (equity 15%)
• equity IRR above 50%Sardeolica
11.9
7.6
54,910
Q1/07
12.1
7.4
157,292
2006
10.9
7.5
52,902
Q1/06
12.1
6.7
31,624
Q2/06
12.1
8.1
33,058
Q3/06
12.1
8.2
39,708
Q4/06
9.9Power tariff(€cent/MWh)
11.9Green certificates(€cent/MWh)
31,789Electricityproduction (MWh)
Q2/07
••• Saras in a snapshotSaras in a snapshotSaras in a snapshot
••• Market overviewMarket overviewMarket overview
••• Business segments descriptionBusiness segments descriptionBusiness segments description
• Financials
••• OtherOtherOther

September 2007 SARAS S.p.A. 62
Financial targets
17% 17%
0%
5%
10%
15%
20%
25%
2005 2006 2007
0.50
0.88
0.00
0.50
1.00
1.50
2.00
2.50
3.00
3.50
2005 2006
ROACE – target between 10% to 15%
over the cycleNFP/EBITDA – less than 3.5
59%
0%
20%
40%
60%
80%
2005 2006 2007
Leverage - long term target 50%
18%
39%
0%
20%
40%
60%
2005 2006
Payout ratio - between 40% to 60%
ROACE: return on average capital employed after tax
Leverage: Net debt /(net debt + equity)
Payout: calculated on adjusted net income

September 2007 SARAS S.p.A. 63
48% 48% 46%39%
45%
20%13%
18%
9%
-1%-10%
0%
10%
20%
30%
40%
50%
60%
Q1/0
5Q
2/05
Q3/0
5Q
4/05
Q1/0
6Q
2/06
Q3/0
6Q
4/06
Q1/0
7Q
2/07
0.881.01
0.49
0.32
0.50
0.23
-0.02-0.20
0.00
0.20
0.40
0.60
0.80
1.00
1.20
1.40
Q4/
05
Q1/
06
Q2/
06
Q3/
06
Q4/
06
Q1/0
7
Q2/
07
17% 18% 18% 18% 17% 18%21%
0%
5%
10%
15%
20%
25%
30%
2005
Q1/
06
Q2/
06
Q3/
06
2006
Q1/
07
Q2/
07
29%32%
25% 24%22% 23% 23%
0%
5%
10%
15%
20%
25%
30%
35%
2005
Q1/
06
Q2/
06
Q3/
06
2006
Q1/
07
Q2/
07
1,2 : quarterly figures are 1 year rolling
leverage , % NFP/EBITDA, %
ROAE2 , %ROACE1, %
Key Ratios

September 2007 SARAS S.p.A. 64
Group Financials
115.0
-0.533.44.2
77.9
105.3
40.0
0.620.31.3
17.8
155.00.1
53.75.5
95.7
145.3
Q1/07
225.9363.458.744.0161.898.9612.8EBIT
39.9162.843.740.539.439.2170.9Depreciation&amort.
159.4404.895.2120.085.2104.4482.7Comparable EBIT
-1.6-3.7-0.4-0.5-0.5-2.3-7.7Other activities
199.3567.5138.9160.5124.5143.6653.6Comparable EBITDA
17.668.418.317.217.815.173.3Refining1.23.42.20.60.30.31.2Marketing
20.588.322.122.122.022.193.0Power0.52.61.10.6-0.81.73.4Other activities
-1.1-1.10.70.1-1.3-0.6-4.3Other activities
123.2255.462.581.349.062.6348.2Refining6.021.43.28.76.43.121.8Marketing
31.8131.729.930.530.341.0120.4Power
213.423.0
421.5
783.7
2005
63.13.4
77.7
138.1
Q1/06
52.3220.052.052.652.3Power
140.8323.880.898.566.8Refining
24.8
526.2
2006
6.7
201.2
Q2/06
7.25.49.3Marketing
265.7102.484.5EBITDA
Q2/07Q4/06Q3/06
Comparable EBITDA : calculated evaluating inventories at LIFO
Comparable EBIT equal to comparable EBITDA less depreciation&amortization
Income statement (1) EUR million

September 2007 SARAS S.p.A. 65
Group Financials
20.1
14.0
0.0
6.1
0.07
71.020.1
50.9
40.9%
-33.5
84.40.0
2.6
-23.5-22.0
3.6-5.1
115.0
105.3
Q1/07
-46.533.730.335.4-35.53.5-75.9Adjustments
0.0-22.2-9.30.0-12.90.00.0Non recurring expenses
-3.514.76.60.08.10.00.0Non recurring items net of taxes
-4.3-6.90.8-12.34.50.15.7Change of derivatives fair value net of taxes
Detail of adjustments to net income-38.725.922.947.7-48.13.5-81.6(Invent. at LIFO- inv. at LIFO) net of taxes
1.36.52.50.51.12.4-0.4Equity interest
218.0338.257.856.4123.5100.5518.5Profit before taxes-82.1-130.1-22.1-22.6-47.7-37.7-212.1Taxes37.9%39.2%40.0%40.4%39.0%38.4%40.9%Tax rate
136.0208.135.733.875.862.8306.4Net income
89.5241.866.069.240.366.3230.5Adjusted net income
0.090.260.070.070.050.070.26Adjusted EPS
+5.910.1-2.619.5-6.7-0.1-8.6derivatives fair value
-3.2-22.0-0.8-4.6-9.3-7.3-25.3Interest expenses-11.82.19.3-3.2-10.66.6-60.0derivatives gains/losses
-9.2-9.95.911.7-26.6-0.8-93.9Net Financial expenses
159.4404.895.2120.085.2104.4482.7Comparable EBIT
225.9363.458.744.0161.898.9612.8EBIT
-46.533.730.335.4-35.53.5-75.9TOTAL adjustments
2005 Q1/06 2006Q2/06 Q2/07Q4/06Q3/06
Income statement (2) EUR million
September 2007 SARAS S.p.A. 66
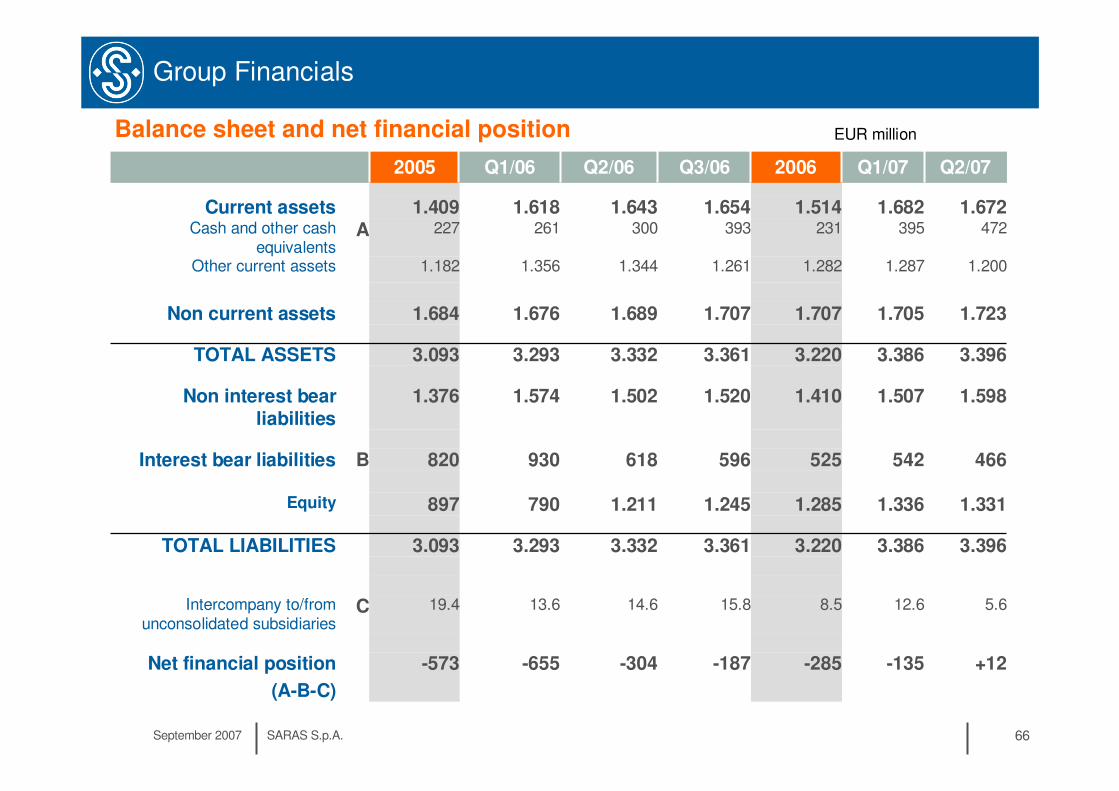
Group Financials
-135
12.6
3.386
1.336
542
1.507
3.386
1.705
1.287
395
1.682
Q1/07
C
B
A
466525596618930820Interest bear liabilities
1.5981.4101.5201.5021.5741.376Non interest bear liabilities
1.3311.2851.2451.211790897Equity
3.3963.2203.3613.3323.2933.093TOTAL LIABILITIES
5.68.515.814.613.619.4Intercompany to/from unconsolidated subsidiaries
+12-285-187-304-655-573Net financial position
(A-B-C)
3.3963.2203.3613.3323.2933.093TOTAL ASSETS
1.7231.7071.7071.6891.6761.684Non current assets
1.2001.2821.2611.3441.3561.182Other current assets
1.6721.5141.6541.6431.6181.409Current assets472231393300261227Cash and other cash
equivalents
2005 Q1/06 2006Q2/06 Q2/07Q3/06
Balance sheet and net financial position EUR million

September 2007 SARAS S.p.A. 67
Group Financials
-135
149
00
0
0-36
-36
78
185
-285
Q1/07
-57-133-41-19-46-27-86in tangible&intangible. assets
-285
-98
00
0
0
-41
-151
-57
-187
Q4/06
-143-17000-170-140dividends
-1431720342-170-140CF FROM FINANCING0342034200capital increase
147289117351-81152TOTAL CASHFLOW
+12-285-187-304-655-573Final net financial position
0-28-28000acquisitions
-57-161-47-46-27-86CF FROM INVESTMENTS
34727716454116379CF FROM OPERATIONS54-21671-104-32-320of which working capital
-135-573-304-655-573-726Initial net financial position
2005 Q1/06 2006Q2/06 Q2/07Q3/06
Cashflow EUR million
Capex by business segment EUR million
35.50.6
0.34.5
30.2
Q1/07
57.40.6
5.50.8
50.5
Q2/07
210011OTHER ACTIVITIES41
116
23
Q4/06
162211POWER GENERATION
13319462786TOTAL CAPEX
10815442670REFINING
710014MARKETING
2005 Q1/06 2006Q2/06 Q3/06

September 2007 SARAS S.p.A. 68
Segment Financials
Refining
40%36%48%46%47%55%46%Of which for third parties
5.43.02.81.62.84.71.9EMC benchmark
3.4153.80914.2863.8953.7642.9183.709Thousand tons
24.927.8104.328.427.521.327.1Million barrels
274309286309299234301Barrels/day
REFINERY RUNS
9.96.76.25.66.57.75.6Saras refining margin
513010823164423CAPEX
123.2
179.6
140.8
197.2
Q2/07
17.8
70.7
95.7
88.5
Q1/07
68.4
223.8
323.8
292.2
2006
18.317.217.815.1Comparable EBIT
36.813.8120.053.2EBIT
80.898.566.877.7Comparable EBITDA
55.131.0137.868.3EBITDA
Q4/06Q3/06Q2/06Q1/06EUR million

September 2007 SARAS S.p.A. 69
Segment Financials
Power generation
$/bl
€cent/Kwh
Mwh/1000
51.385.6323.868.888.786.879.5EBITDA ITALIAN GAAP37.972.4270.055.275.273.366.3EBIT ITALIAN GAAP
13.0012.6713.5913.4912.4613.7113.31POWER TARIFF
4.43.73.93.63.44.54.0POWER IGCC MARGIN
9341,2154,4679991,1471,1361,155ELECTRICITY PRODUCTION
64129120CAPEX
22.6
31.8
52.3
Q2/07
43.4
33.4
53.7
Q1/07
160.9
131.7
220.0
2006
32.445.244.039.3NET INCOME IT GAAP
29.930.530.341.0EBIT
52.052.652.363.1EBITDA
Q4/06Q3/06Q2/06Q1/06EUR million

September 2007 SARAS S.p.A. 70
Segment Financials
Marketing
2682551,013276238236263ITALY
6526802,204594537535540SPAIN
9209343,217870775771803TOTAL
SALES (THOUSAND TONS)
1098100CAPEX
6.0
16.1
7.2
17.3
Q2/07
4.2
1.7
5.5
3.0
Q1/07
21.5
11.7
24.8
15.1
2006
3.28.76.43.1Comparable EBIT
-7.60.212.17.0EBIT
5.49.36.73.4Comparable EBITDA
-5.40.812.47.3EBITDA
Q4/06Q3/06Q2/06Q1/06EUR million

September 2007 SARAS S.p.A. 71
Segment Financials
Other activities
1011001CAPEX
-1.6
-1.0
Q2/07
-0.5
0.1
Q1/07
-3.7
-1.1
2006
-0.4-0.5-0.5-2.3EBIT
0.70.1-1.3-0.6EBITDA
Q4/06Q3/06Q2/06Q1/06EUR million
Wind
Equity company – Saras share is 70%
€cent/Kwh
€cent/Kwh
Mwh
2.03.88.93.20.81.63.4NET INCOME
1.43.48.11.71.41.63.4Adjusted NET INCOME
9.97.67.48.28.16.77.4POWER TARIFF
11.911.912.112.112.112.112.1GREEN CERTIFICATES
31,78954,910157,29039,70833,05831,62452,902ELECTRICITY PRODUCTION
3.6
5.9
Q2/07
7.1
9.4
Q1/07
17.4
25.7
2006
5.63.32.85.8EBIT
7.95.44.77.7EBITDA
Q4/06Q3/06Q2/06Q1/06EUR million

September 2007 SARAS S.p.A. 72
Sensitivities
Refining
• 1 $/bbl of change on our refining margin affect refining annual EBITDA by roughly 100 USD million or 77 EUR million at 1.30
• +10 $/ton ULSD-HSFO, at constant overall margins, are +5 EUR million worth
• 0.05 change in the EUR/USD exchange rate affect annual refining EBITDA by roughly 25 EUR million (assuming a Saras refining margin of 7$/bl)
Power Generation
• +/- 10% of change of crude/product prices affect annual IT GAAP EBITDA by abt +/- 6.6%
• EUR/USD exchange rate from 1.30 to 1.20 affect annual IT GAAP EBITDA by roughly +10 EUR million

September 2007 SARAS S.p.A. 73
Market multiples
EV/EBITDA – PE – EV per complexity barrel
EV/EBITDA 2008source: Saras elaboration on Bloomberg data
5.05.5 5.8
6.6 6.6 6.97.8
8.7
4.7
0
2
4
6
8
10
12
14
LOTO
S
ERG
PKN
SAR
AS
PPHN
OIL
REF
NES
TE
HEP
MO
H
media= 6.4
PE 2008
source: Bloomberg
7.9
12.612.211.811.8
10.410.39.7
9.0
0
2
4
6
8
10
12
14
16
PPHN
OIL
RE
F
LOTO
S
NES
TE
PKN
MO
H
ERG
SARA
S
HEP
media= 10.6
EV per complexity barrel
984 1,036
1,391 1,442
1,702
1,938 1,922
2,1832,296
$0
$500
$1,000
$1,500
$2,000
$2,500
$3,000
LOTO
S
ER
G
OIL
REF
SA
RA
S
PPH
N
PK
N
HE
P
NE
STE
MO
H
average= 1,656$
EV per complexity barrel
recent transactions
678
850
1,053
1,333
1,518
1,843 1,818
2,100
2,513
$0
$500
$1,000
$1,500
$2,000
$2,500
$3,000
Coryton (UK)
2 Shell Ref (FR)
Wilmington (US)
Ashdod (ISR)
Mazeiku (LIT)
Houston (US)
Wilhelmshaven (GER)IES
TAMOIL
Last update 10th September 2007

September 2007 SARAS S.p.A. 74
Analyst estimates
Analyst recommendations and 2007 / 2008 / 2009 estimates (Bloomberg)
EBITDA Low Hi Mean
2007 659 695 6772008 597 784 717
2009 559 783 702
EBIT Low Hi Mean2007 374 534 486
2008 406 621 5252009 398 578 512
EPS Low Hi Mean
2007 0.31 0.33 0.332008 0.28 0.41 0.362009 0.35 0.41 0.38
Reported 2007Q1 Q2 Q3 Q4 TOTAL
EBITDA 155 199 354EBIT 115 159 274EPS 0.07 0.09 0.17
ANALYST RECCOMENDATIONS
BROKER DATE CONSENSUS TARGET
PRICE
JPMORGAN 05-Feb-07 OVERWEIGHT 5.00
MORGAN STANLEY 5-set-07 EQUALWEIGHT 4.70
UBS 1-ago-07 BUY 5.25
MERRILL LYNCH 02-Mar-07 NEUTRAL 4.40
CABOTO 15-May-07 ADD 5.00
INTERMONTE 10-ago-07 OUTPERFORM 5.20
BANCA AKROS 14-feb-07 BUY 5.00
UNICREDIT 8-mag-07 BUY 4.95
ACTINVEST 15-Dec-06 BUY 5.36
EUROMOBILIARE 6-lug-07 BUY 5.20
CA CHEUVREUX 31-ago-07 OUTPERFORM 5.30
IXIS 10-ago-07 ADD 4.85
LEHMAN BROTHERS 6-lug-07 OVERWEIGHT 5.20
GOLDMAN SACHS 22-giu-07 NEUTRAL 4.50
MEDIAN TARGET PRICE 5.00
source Thomson
Last update 10th September 2007

••• Saras in a snapshotSaras in a snapshotSaras in a snapshot
••• Market overviewMarket overviewMarket overview
••• Business segments descriptionBusiness segments descriptionBusiness segments description
••• FinancialsFinancialsFinancials
• Other

September 2007 SARAS S.p.A. 76
Board of Directors and Top Management
Board of Directors
Chairman Gianmarco MorattiCEO Massimo MorattiVice Chairman Angelo MorattiDirector Dario ScaffardiDirector Angelomario MorattiDirector Gabriele PreviatiIndep.Director Mario GrecoIndep. Director Gilberto Callera
General Manager
Dario Scaffardi
Chief Financial Officer
Corrado Costanzo
Internal audit
Ferruccio Bellelli
Public Affairs
Marco Ghiringhelli
September 2007 SARAS S.p.A. 77
Management compensation
Annual salary and fringe benefits
Annual incentive bonuses• based on both Company’s financial performance vs budget and individual
performance
Medium term Stock grant incentive plan• period 2007-2009• based on Saras’ stock performance vs peers and Company’s financial
performance

September 2007 SARAS S.p.A. 78
Corporate Governance
The Company is structured according to the traditional business administration and audit model as follows:
Board of Directors charged with overseeing business management within which various committees have been set up, namely
• remuneration committee• internal control committee
the Board includes two independent non-executive directors, Mr Mario Greco and Mr Gilberto Callera, who, together with another non-executive director, Mr Gabriele Previati, make up the above mentioned remuneration committee and the internal control committee.
Board of Statutory Auditors charged with supervising the compliance with laws and statutes, and monitoring the adequacy of the organisational structure, the internal control system and the Company’s accounting-administrative system.The Board has nominated the Chairman of the Board of Directors as the executive in charge of surveying internal control system functions.

September 2007 SARAS S.p.A. 79
Personnel
2006Male 80% 1,446Female 20% 352
Average age: 40 years
Average time at the company 11 years
The Saras Group has around 1,800 staff. Approximately 80% of these are employed in Sardinia, mostly at the Sarroch refinery. Some 230 people work overseas, in distribution and marketing.In over 40 years of activity, Saras has successfully built a reputation that has enabled it to attract the best employees, and to develop and retain talented and motivated personnel, who share the company’s values of honesty, respect, excellence and responsibility. Saras has promoted these values by creating and constantly improving a safe and stimulating work environment, which encourages respect for the individual and offers attractive opportunities for staff development.

September 2007 SARAS S.p.A. 80
HSE
2000-2001 2002-2003 2004-2005 2006-2008
Policy definition
EMS
Enviromentalreport
ISO14001
certification
The Eco-Management and Audit Scheme (EMAS) is the EU voluntary instrument which acknowledges organisations that improve their environmental performance on a continuous basis. EMAS registered organisations are legally compliant, run an environment management system and report on their environmental performance through the publication of an independently verified environmental statement. They are recognised by the EMAS logo, which guarantees the reliability of the information provided.
Saras certification pattern The Saras Group has always paid particular attention to the environmental issues connected with its activities.Investments in environmental and safety initiatives stood at EUR 17.6 million in 2006. This was approximately 16% of total investments made in the year
The Saras Group has a programme aimed at ensuring the safety of all its employees at work.The company introduced a specific safety policy in 1996, and since then has achieved positive results in safeguarding both its workers and the environment.
Saras’ environmental objectives include transparency of information. It has always made company data and the results of studies available to the authorities and the public. In keeping with this policy, Saras draws up an Environment and Safety Report each year.
The Group’s Safety Management System for the prevention of major accidents was developed pursuant to Legislative Decree 334/99. The main components ofthis system are a Safety Report, an Internal
Emergency Plan and an External Emergency Plan.

September 2007 SARAS S.p.A. 81
WEBSITE
www.saras.it
A comprehensive market section updated weekly including:
- EMC margin benchmark- Crude oil and products prices- Crack spreads
Saras Investor Relations

IR contacts
General email [email protected]
IR Manager- Marco Schiavetti +39 02 7737 301 [email protected]
IR Assistant- Giordano Serafini +39 02 7737 641
Financial communication- Rafaella Casula +39 02 7737 495
Assistant- Alessandra Gelmini +39 02 7737 642


