T-TY Tank Farm Interim Surface Barrier Demonstration ... · Project Management Plan : ... 1.1 T...
68
PNNL-20144 Prepared for the U.S. Department of Energy Under Contract DE-AC05-76RL01830 T-TY Tank Farm Interim Surface Barrier Demonstration—Vadose Zone Monitoring FY10 Report ZF Zhang CE Strickland Pacific Northwest National Laboratory JG Field DL Parker Washington River Protection Solutions, Inc. January 2011
Transcript of T-TY Tank Farm Interim Surface Barrier Demonstration ... · Project Management Plan : ... 1.1 T...

PNNL-20144
Prepared for the U.S. Department of Energy Under Contract DE-AC05-76RL01830
T-TY Tank Farm Interim Surface Barrier Demonstration—Vadose Zone Monitoring FY10 Report ZF Zhang CE Strickland Pacific Northwest National Laboratory JG Field DL Parker Washington River Protection Solutions, Inc. January 2011

DISCLAIMER This report was prepared as an account of work sponsored by an agency of the United States Government. Neither the United States Government nor any agency thereof, nor Battelle Memorial Institute, nor any of their employees, makes any warranty, express or implied, or assumes any legal liability or responsibility for the accuracy, completeness, or usefulness of any information, apparatus, product, or process disclosed, or represents that its use would not infringe privately owned rights. Reference herein to any specific commercial product, process, or service by trade name, trademark, manufacturer, or otherwise does not necessarily constitute or imply its endorsement, recommendation, or favoring by the United States Government or any agency thereof, or Battelle Memorial Institute. The views and opinions of authors expressed herein do not necessarily state or reflect those of the United States Government or any agency thereof.
PACIFIC NORTHWEST NATIONAL LABORATORY operated by BATTELLE
for the UNITED STATES DEPARTMENT OF ENERGY
under Contract DE-AC05-76RL01830
Printed in the United States of America
Available to DOE and DOE contractors from the Office of Scientific and Technical Information,
P.O. Box 62, Oak Ridge, TN 37831-0062; ph: (865) 576-8401 fax: (865) 576-5728
email: [email protected]
Available to the public from the National Technical Information Service, U.S. Department of Commerce, 5285 Port Royal Rd., Springfield, VA 22161
ph: (800) 553-6847 fax: (703) 605-6900
email: [email protected] online ordering: http://www.ntis.gov/ordering.htm
PNNL-20144
T-TY Tank Farm Interim Surface Barrier Demonstration—Vadose Zone Monitoring FY10 Report ZF Zhang CE Strickland Pacific Northwest National Laboratory JG Field DL Parker Washington River Protection Solutions, Inc. January 2011 Prepared for the U.S. Department of Energy under Contract DE-AC05-76RL01830 Pacific Northwest National Laboratory Richland, Washington 99352


v
Executive Summary
The U.S. Department of Energy’s Office of River Protection has constructed interim surface barriers over a portion of the T and TY tank farms as part of the Interim Surface Barrier Demonstration Project. The interim surface barriers (hereafter referred to as the surface barriers or barriers) are designed to minimize the infiltration of precipitation into the soil zones containing radioactive contaminants and minimize the movement of the contaminants. As part of the demonstration effort, vadose zone moisture is being monitored to assess the effectiveness of the barriers at reducing soil moisture. Solar-powered systems were installed to continuously monitor soil water conditions at four locations in the T (i.e., instrument Nests TA, TB, TC, and TD) and the TY (i.e., instrument Nests TYA and TYB) Farms beneath the barriers and outside the barrier footprint as well as site meteorological conditions. Nests TA and TYA are placed in the area outside the barrier footprint and serve as controls, providing subsurface conditions outside the influence of the surface barriers. Nest TB provides subsurface measurements to assess surface-barrier edge effects. Nests TC, TD, and TYB are used to assess changes in soil-moisture conditions beneath the interim surface barriers.
A timeline showing major events of monitoring system installation, data logging, and the construction of the surface barriers is given below:
• September 2006: Completed the installation of instruments in Nests TA and TB and the T tank farm meteorological station (TMS); started data logging from instruments in Nests TA and TB and the TMS
• June 2007: Completed the installation of instruments in Nests TC and TD
• April 2008: Completed the construction of the T tank farm interim surface barrier (TISB)
• May 2008: Hooked up instruments in Nests TC and TD for data logging
• March 2010: Completed the installation of instruments in Nests TYA and TYB; started data logging from instruments in TYA and TYB
• June 2010: Unhooked wires at Nest TYB because of barrier construction
• August 2010: Completed the construction of the TY tank farm interim surface barrier; TYB was hooked up for data logging.
Each instrument nest is composed of a capacitance probe (CP) with multiple sensors, multiple heat-dissipation units (HDUs), and a neutron probe (NP) access tube. The principal variables monitored for this purpose are soil-water content (θ) and soil-water pressure (ψ). Soil temperature, precipitation, and air temperature are also measured. Table S.1 summarizes the monitoring instruments and variables, instrument nests, measurement points, and monitoring frequencies:

vi
Table S.1. Monitoring Instruments and Approximate Frequency Under Normal Working Conditions
Monitoring Instrument Monitoring Variable
Instrument Placement
(Nest) Depth of Sensors/
Measurement Points
Actual Monitoring Frequency
Neutron Moisture Probe Soil-water content
TA, TB, TC, TD, TYA, TYB
From 0.3 to 15.2 m bgs at 0.3-m interval Quarterly
Capacitance Probe Soil-water content 0.6, 0.9, 1.3, 1.8, and
2.3 m Hourly
Heat Dissipation Unit
Soil-Water Pressure and Soil Temperature 1, 2, 5, and 9 or 10 m Every 6 hours
Thermistor Air Temperature TMS - Every 15 minutes
Each instrument nest is designed to have its own data logger, the data from which are transmitted remotely to the receiving computer. The neutron-probe access tube is used to perform quarterly manual measurements of soil-water content using a neutron probe. The monitoring results in FY10 are summarized below.
Except for occasional times for TC and TD and planned dates for TYB, during FY10, the battery voltage at the TMS and instrument Nests in both T and TY tank farms remained above 12.0 V, denoting that the battery voltages were sufficient for the stations to remain functional. The capacitance probes (CPs) in Nest TC before January 14 were not functional because of corrosion. The CPs in Nest TB before November 15 and the 1.8-m CP sensor in Nest TC after May 25 gave noisy data. Other than these, the CPs in both tank farms were functioning normally. All the HDUs were functioning normally, but some pressure-head values were greater than the upper measurement limit. The values that exceeded the upper limit may indicate wet soil conditions and/or measurement error, but they do not imply a malfunction of the sensors.
Similar to FY07 through FY09, in FY10, the soil under natural conditions in the T Farm (Nest TA) was generally recharged during the winter period (October–March), and they discharged during the summer period (April–September). Soil water conditions above about 1.5-m to 2-m depth from all three types of measurements (i.e., CP, NP, and HDU) showed relatively large variation during the seasonal wetting-drying cycle. For the soil below 2-m depth, the seasonal variation of soil water content was relatively small.
The construction of the TISB was completed in April 2008. In the soil below the TISB (Nests TC and TD), the CP-measured water content showed that θ at the soil between 0.6-m and 2.3-m depths was stable, indicating no climatic impacts on soil water conditions beneath the barrier. The NP-measured water content in the soil between about 3.4 m (11 ft) and 12.2 m (40 ft) since the completion of the barrier decreased by 0.007 to 0.014 m3 m-3. The HDU-measured soil-water pressure at 1-m, 2-m, and 5-m depths decreased by 0.7 to 2.4 m, indicating soil water drainage at these depths of the soil.
In the soil below the edge of the TISB (Nest TB), the CP-measured water content was relatively stable through the year; the NP-measured water content showed that soil water drainage was occurring in the soil between about 3.4 m (11 ft) and 12.2 m (40 ft) but at a slightly smaller magnitude than in Nests

vii
TC and TD; the HDU-measurements show that the pressure head changes at Nest TB since the completion of the barrier were generally less than those at TC and TD, but more than those at TA.
These results indicate that the TISB is performing as expected by intercepting the meteoric water from infiltrating into the soil, and the soil is becoming drier gradually. The barrier also had some effects on the soil below the barrier edge, but at a reduced magnitude. There was no significant difference in soil-water regime between the two nests in the TY tank farm because the barrier at the TY Farm was just completed one month before the end of the FY.


ix
Acronyms and Abbreviations
bgs Below Ground Surface CP Capacitance Probe DOE Department of Energy CSI Campbell Scientific, Inc. FY07 Fiscal Year 2007 FY08 Fiscal Year 2008 FY09 Fiscal Year 2009 FY10 Fiscal Year 2010 HDU Heat-Dissipation Unit HMS Hanford Meteorological Station MNCP the Monte Carlo N-Particle NP Neutron Probe OD Outside Diameter ORP Office of River Protection PMP Project Management Plan PNNL Pacific Northwest National Laboratory PVC Polyvinyl Chloride QAP Quality Assurance Plan SST Single-Shell Tank STD Standard Deviation TISB T Farm interim surface barrier TMS T Tank Farm Meteorological Station TYISB TY Farm interim surface barrier


xi
Definition of Variables
a, b, c Coefficients for the relationship between soil water content and normalized frequency
b Coefficient for correcting temperature effects on CP measurements
A, B, C Coefficients for the relationship between Model 109 thermistor resistance and temperature
A, B Coefficients for the relationship between water content and neutron counts
c0, c1, c2, c3, c4, c5 Coefficients for correcting temperature effects on HDU measurements
C0, C1, C2, C3, C4, C5 Coefficients for the relationship between Model 107 thermistor resistance and temperature
F Frequency reading
Fa Frequency reading in air
Fw Frequency reading in water
k Permeability
N Neutron counts per 16 sec
Ns Standard neutron counts per 16 sec in the shield
Nsw Standard neutron counts per 16 sec in water
P Precipitation
q Heat input
r Correlation coefficient
Rs Resistance
s An intermediate variable
Sf Normalized frequency
S∆T Normalized temperature change
S∆T* Normalized temperature change after temperature correction
t, t0 Time, start time
T, T0 Temperature, initial temperature
Tair Air temperature
Tavg Average temperature
Tmax Maximum temperature
Tmin Minimum temperature
Tsoil Soil temperature
Tstd Standard deviation of soil temperature

xii
∆T Temperature change
∆Td Temperature change in a dry ceramic matrix
∆Tw Temperature change in a water-saturated ceramic matrix
θ Soil volumetric water content
θavg Average soil volumetric water content
θmax Maximum soil volumetric water content
θmin Minimum soil volumetric water content
θstd Standard deviation of Soil volumetric water content
θv* Soil volumetric water content after temperature correction
ψ Soil water pressure head
ψavg Average soil water pressure head
ψmax Maximum soil water pressure head
ψmin Minimum soil water pressure head
ψstd Standard deviation of soil water pressure head

xiii
C ontents Executive Summary ............................................................................................................................ v
Acronyms and Abbreviations ............................................................................................................ ix
Definition of Variables ...................................................................................................................... xi 1.0 Introduction ............................................................................................................................. 1.1
1.1 T Tank Farm and Tank T-106 Leak ................................................................................ 1.1
1.2 TY Tank Farm and Tank Leaks ...................................................................................... 1.2
1.3 Monitoring Nests ............................................................................................................. 1.3
1.4 Surface Barrier Construction ........................................................................................... 1.3
1.5 Recommendations from FY09 Report ............................................................................ 1.4
1.6 Objective and Scope ........................................................................................................ 1.4
2.0 The Vadose Zone Monitoring System ..................................................................................... 2.1
2.1 Monitoring Instruments and Calibration ......................................................................... 2.1
2.1.1 Neutron Probe ...................................................................................................... 2.3
2.1.2 Capacitance Probe ................................................................................................ 2.3
2.1.3 Heat-Dissipation Unit ........................................................................................... 2.5
2.1.4 Precipitation Sensor .............................................................................................. 2.7
2.1.5 Thermistor ............................................................................................................ 2.7
2.2 Monitoring Nests and Installation ................................................................................... 2.8
2.3 Monitoring Frequency ..................................................................................................... 2.9
2.4 Data-Analysis Methodology ......................................................................................... 2.10
2.5 Quality Assurance ......................................................................................................... 2.11
3.0 Functionality of the Monitoring System .................................................................................. 3.1
3.1 Weather Conditions ......................................................................................................... 3.1
3.2 Battery Voltage ............................................................................................................... 3.1
3.3 Air Temperature .............................................................................................................. 3.3
3.4 Precipitation .................................................................................................................... 3.5
3.5 Soil Temperature ............................................................................................................. 3.5
3.6 Soil-Water Pressure Head ............................................................................................. 3.10
3.7 CP-Measured Soil-Water Content ................................................................................. 3.10
4.0 Monitoring Results .................................................................................................................. 4.1
4.1 Soil-Water Content .......................................................................................................... 4.1
4.1.1 Capacitance-Probe Measurements ....................................................................... 4.1
4.1.2 Neutron-Probe Measurements .............................................................................. 4.6
4.2 Soil-Water-Pressure Head ............................................................................................. 4.10
4.3 Effects of Surface Barrier on Soil Water Conditions .................................................... 4.15
4.4 Instrument Performance ................................................................................................ 4.18

xiv
5.0 Summary .................................................................................................................................. 5.1
5.1 System Functionality ....................................................................................................... 5.1
5.2 Soil Water Conditions ..................................................................................................... 5.1
6.0 References ............................................................................................................................... 6.1

xv
F igures Figure 1.1. Location of T and TY Farms in 200 West Area (from RPP-23752, CHG 2005) ................ 1.2
Figure 1.2. Plan View of T-TY Tank Farm with the Approximate Locations of Monitoring Nests TA, TB, TC, TD, TYA, and TYB and Approximate Interim Surface Barrier Boundaries as Marked by the Blue Lines. (The schematic is not to scale.) .......................................................... 1.5
Figure 2.1. Vadose Zone Monitoring Components, Instrumentation, and Data-Collection and Management Flow Diagram for the T-TY Tank Farm Interim Surface Barrier Demonstration Project ............................................................................................................................................. 2.2
Figure 2.2. HDU Calibration Data Points and Calibration Relationship ............................................... 2.6
Figure 2.3. Hydraulic Hammer Used to Install Instruments in the T Tank Farm (Photo taken in the summer of 2006) ............................................................................................................................. 2.9
Figure 2.4. Cone-Tipped Drive Shaft Used in Conjunction with a Hydraulic Hammer for Creating Driving Boreholes (Photo taken in the summer of 2006) ............................................................... 2.9
Figure 3.1. FY10 and Multi-Year Average Monthly Precipitation (mm) in Hanford ............................ 3.2
Figure 3.2 FY10 and Multi-Year Average Monthly Air Temperature (°C) in Hanford ......................... 3.2
Figure 3.3. Daily Average Battery Voltage ............................................................................................ 3.3
Figure 3.4. (a) Daily Average Air Temperature and (b) Temperature Difference Between the Observed Values and Those at HMS .............................................................................................. 3.4
Figure 3.5. FY10 Monthly Precipitation at the T Tank Farm and Hanford Meteorological Station ...... 3.5
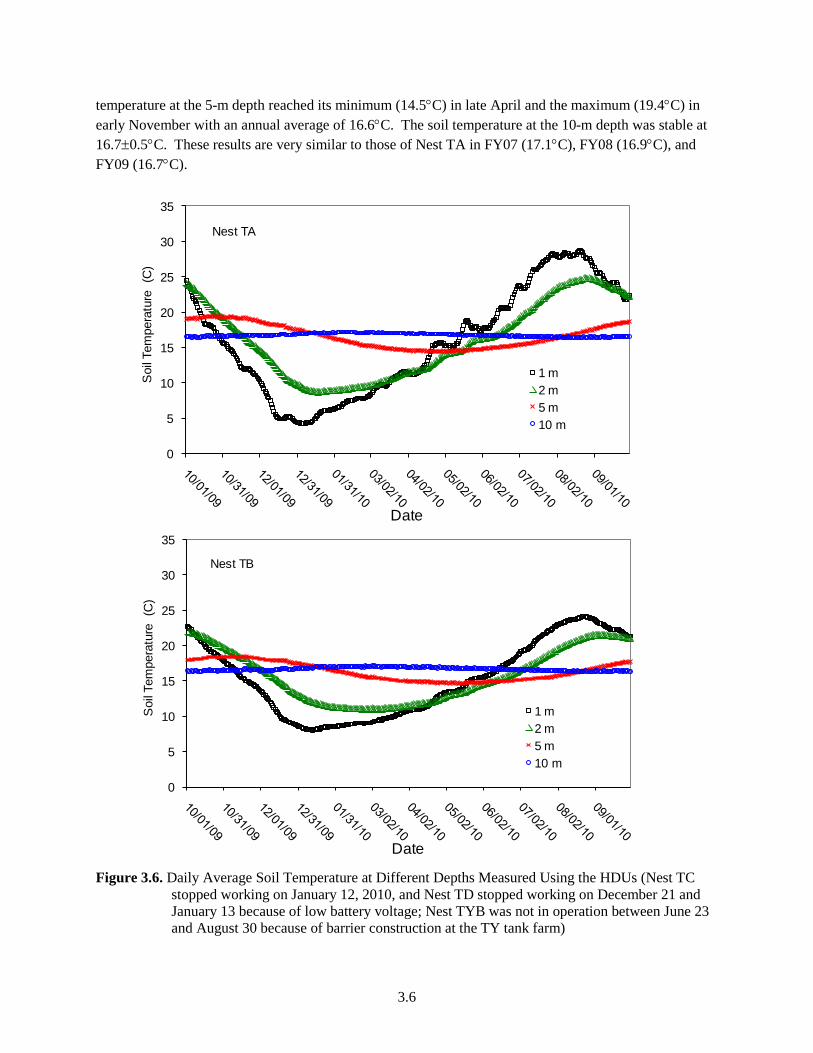
Figure 3.6. Daily Average Soil Temperature at Different Depths Measured Using the HDUs (Nest TC stopped working on January 12, 2010, and Nest TD stopped working on December 21 and January 13 because of low battery voltage; Nest TYB was not in operation between June 23 and August 30 because of barrier construction at the TY tank farm) ........................................ 3.6
Figure 3.7. Average Soil Temperature at Different Depths Measured Using the HDUs. The line on each bar shows the range of standard deviation (±Tstd). .......................................................... 3.10
Figure 4.1. Daily Average Soil-Water Content at Five Depths Measured Using the CPs (Nest TC stopped working on January 12, 2010, and Nest TD stopped working on December 21 and January 13 because of low battery voltage; Nest TYB was not in operation between June 23 and August 30 because of barrier construction at the TY tank farm. The CPs in Nests TB and TC were replaced by new probes on January 14. The repaired CPs were switched back on April 20). .................................................................................................................................... 4.2
Figure 4.2. The Mean and Standard Deviation of Soil Water Content in FY10. Outliers were not considered in the analysis (see Section 2.4). ................................................................................... 4.6
Figure 4.3. Soil Water Content Measured Using Neutron Probes at Different Depths (the depth bgs was relative to the ground surface before barrier construction) ............................................... 4.7
Figure 4.4. Daily Average Soil-Water Pressure at Different Depths Measured Using the HDUs (Nest TC stopped working on January 12, 2010, and Nest TD stopped working on December 21 and January 13 because of low battery voltage; Nest TYB was not in operation between June 23 and August 30 because of barrier construction at the TY tank farm) .............................. 4.11
Figure 4.5. The Mean and Standard Deviation of Soil Water Pressure in FY10 .................................. 4.15
Figure 4.6. CP-Measured, Soil-Water-Content Change from May 3, 2008, to September 30, 2010 (Nest TA was from October 1, 2008, to September 30, 2010, because this probe was not in operation from January to September 2008) ................................................................................. 4.16

xvi
Figure 4.7. Depth-Averaged, Soil-Water-Content Changes from April 9, 2008, to September 16, 2010, Measured with Neutron Probes at Different Depths (The vertical lines indicate the range of 2σθ with σθ being the standard deviation of water-content change within the layer the average was taken. The depth bgs was relative to the ground surface before barrier construction.) ................................................................................................................................ 4.17
Figure 4.8. HDU-Measured Soil-Water-Pressure-Head Change Between May 3, 2008, and September 30, 2010 ...................................................................................................................... 4.18
xvii
T ables Table 2.1. Instruments Selected for Interim Surface Barrier Monitoring and the Monitored
Variables (from the T-TY Monitoring Plan)................................................................................... 2.2
Table 2.2. Neutron Calibration Curve for the 2.5-Inch Steel Casings (Ward and Wittmand 2009) ....... 2.3
Table 2.3. Data-Collection Method(a) and Approximate Frequency Under Normal Working Conditions ..................................................................................................................................... 2.10
Table 3.1. The FY10 Annual HDU-Measured Average (Tavg), Minimum (Tmin), Maximum (Tmax), and Standard Deviation (Tstd) of Soil Temperature ......................................................................... 3.9
Table 4.1. The FY10 Annual CP-Measured Average (θavg), Minimum (θmin), Maximum (θmax), and Standard Deviation (θstd) of Soil Water Content(a) ................................................................... 4.5
Table 4.2. The FY10 Annual HDU-Measured Average (ψavg), Minimum (ψmin), Maximum (ψmax), and Standard Deviation (ψstd) of Soil Water Pressure .................................................................. 4.14
Table 4.3. Instrument Performance in FY10 ......................................................................................... 4.18

1.1
1.0 Introduction
The Hanford Site in southeastern Washington State has 149 underground single-shell tanks (SSTs) that store hazardous radioactive waste. Many of these tanks and/or their associated infrastructure (e.g., pipelines, diversion boxes) have leaked. The largest known leak occurred from the T-106 Tank of the 241-T Tank Farm (T tank farm) in 1973. Five tanks are assumed to have leaked in the 241-TY Tank Farm (TY tank farm). Many of the contaminants from that leak still reside within the vadose zone beneath the T and TY tank farms. The U.S. Department of Energy (DOE), Office of River Protection (ORP) has sought to minimize the movement of this residual contaminant plume by placing an interim barrier on the ground surface to minimize the infiltration of precipitation. Interim surface barriers were constructed at the T and TY tank farms as part of the Interim Surface Barrier Demonstration Project. Vadose zone moisture is being monitored to assess the effectiveness of the surface barriers at reducing soil moisture beneath the barrier. The technology being used in the T tank farm to create the impermeable barrier is a spray-polyurea liner material above a layer of compact soil. Construction of the T tank farm surface barrier (TISB) was completed in April 2008. The technology being used in the TY tank farm to create the impermeable barrier is a modified asphalt layer above a layer of compact soil. Construction of the TY tank farm surface barrier (TYISB) was completed in August 2010.
This report presents soil-moisture data that were collected during fiscal year 2010 (FY10) from October 2009 to September 2010. The monitoring results in FY07, FY08, and FY09 were summarized in the FY07 Report (Zhang et al. 2008), the FY08 Report (Zhang et al. 2009), and the FY09 Report (Zhang et al. 2010a), which will be referred to as the FY07, FY08, and FY09 Report, respectively, hereafter. The detailed description of the design of the monitoring system is given in the “T-TY Tank Farm Interim Surface Barrier Demonstration – Vadose Zone Monitoring Plan” (Zhang et al. 2010b), which is an update of the monitoring plan for the T tank farm (Zhang et al. 2007) and will be referred to as the T-TY Monitoring Plan. The location of the T and TY tank farms is shown in Figure 1.1.
1.1 T Tank Farm and Tank T-106 Leak
According to Myers (2005), the T tank farm was built from 1943 to 1944. The T tank farm contains 12 SSTs with a diameter of 23 m (75 ft) and a capacity of 2,006,050 L (530,000 gal), four SSTs with a diameter of 6.1 m (20 ft) and a capacity of 208,175 L (55,000 gal), waste-transfer lines, leak-detection systems, and tank ancillary equipment. The soil cover from the apex of the tank domes to the ground surface is approximately 2.2 m (7.3 ft). All the tanks have a dish-shaped bottom.
In general, the vadose zone in the T tank farm, from groundwater table to ground surface, consists of a portion of the thick, relatively coarse-grained sediments of the middle Ringold Formation overlain by the finer grained sediments of the upper Ringold Formation and the Plio-Pleistocene unit (also called the Cold Creek Unit), overlain by the coarser grained sands and gravels of the Hanford formation, which are exposed at the surface. The upper 12 m (40 ft) of the Hanford formation was locally excavated and backfilled with gravelly sand when the SSTs were installed.

1.2
101102
105 104
103 101
108 107
106
110
109
112 111
102
105
104 103
101
106
T Tank Farm
TY Tank Farm
TX Tank Farm
113
102
105
104 103 101
108 107 106
110 109112 111
117 116
115 114
118
Figure 1.1. Location of T and TY Farms in 200 West Area (from RPP-23752, CHG 2005)
An accidental leak from Tank T-106 occurred in 1973; the details and chronology of the leak are well documented (ARHCO 1973, Routson et al. 1979). The leak was suspected to have started on April 20, 1973, during a routine filling operation. The leak stopped on June 10, 1973, when the free liquid contents of the tank were removed. The total duration of the leak was estimated to be 51 days. Approximately 435,000 L (115,000 gal) of fluid leaked from Tank T-106. The fluid contained cesium-137, strontium-90, plutonium, and various fission products, including technetium-99. It is likely that the leak occurred in the southeast quadrant of the tank near the bottom of the tank.
1.2 TY Tank Farm and Tank Leaks
The TY tank farm was built in 1952 and contains six SSTs with a diameter of 23 m (75 ft) and a capacity of 2,870,000 L (758,000 gal), waste-transfer lines, leak-detection systems, and tank ancillary

1.3
equipment. The soil cover from the apex of the tank domes to the ground surface is approximately 2.4 m (8 ft). The vadose zone in the TY tank farm is composed of three major layers, which are, from groundwater table to ground surface, a portion of the relatively coarse-grained sediments of the middle Ringold Formation, overlain by the finer gained sediments of the upper Ringold Formation, and the Plio-Pleistocene units, overlain by the coarse-grained sand and gravel of the Hanford formation. The upper 12 m (40 ft) of the Hanford formation was locally excavated and backfilled with gravelly sand when the tanks were installed, which was the same as the T tank farm.
Five of the six SSTs in the TY tank farm are assumed to have leaked about 228,600 L (60,400 gal) of mixed-radioactive waste into the vadose zone (Rodgers 2010).
1.3 Monitoring Nests
The instruments in the T Farm are grouped into four nests (i.e., TA, TB, TC, and TD), and those in the TY Farm are grouped into two nests (i.e., TYA and TYB), each of which includes a neutron probe (NP) access tube, a capacitance probe (CP) with five sensors, and four heat dissipation units (HDUs). Figure 1.2 shows the approximate locations of monitoring Nests and the approximate interim surface barrier boundaries. Nests TA and TYA were placed in the area without a cover and serve as controls. Control nests need to be at least 5 m away from the closest edge of the surface cover to prevent measurable impacts from the cover. Nest TB was placed at the edge of the TISB to monitor the edge effect of the surface barrier on the soil-water regime. Nests TC and TD are duplicates and were placed inside the covered area in the T tank farm; Nest TYB was placed in the covered area in the TY tank farm. The nests under the barriers need to be at least 5 m from the closest edge of the surface barrier and between two or more tanks where the largest change of soil-water content, and hence water flux, is expected after the emplacement of the surface barrier.
Vertically, the monitoring depths go to 15-m below ground surface (bgs). Considering that, upon the emplacement of the surface barrier, the changes of soil moisture are more significant in shallower depths; more intensive and frequent measurements are taken at shallow depths. All instrument nests lie within backfill material, except for the lower part of the neutron access tubes, which extend into the undisturbed Hanford formation below the tanks. Nests TA and TB were installed in late FY06, and monitoring was initiated in September 2006. Nests TC and TD were installed in FY07, and monitoring was initiated in May 2008. Nests TYA and TTB were installed in FY10, and monitoring was initiated in March 2010.
1.4 Surface Barrier Construction
The construction of the TISB was started in October 2007 and completed in April 2008. The approximate interim surface barrier boundary is marked by the octagon in Figure 1.2a. Approximately 1-foot-thick compacted soil was added to the original ground surface before the surface barrier was emplaced. Above the compacted soil is a 1/4-inch-thick polyurea as the impermeable interim barrier. The barrier dips slightly to the north so that the rainwater on it can run off it along a lined runoff ditch to a runoff infiltration area.
The construction of the TYISB was started in March 2010 and completed in August 2010. The approximate interim surface barrier boundary is marked in Figure 1.2b. A 4-inch-thick modified asphalt layer, developed by the Wilder Construction Company (Wilder) as MatConTM, was used for the TYISB.

1.4
1.5 Recommendations from FY09 Report
Based on the instrument performance and data obtained, the following recommendations were given in the FY09 Report (Zhang et al. 2009):
• It seems that the CPs tend to malfunction more frequently than other sensors because of corrosion on the CPs. It is suggested to put some anti-corrosion agent on a CP before deployment.
• It was also observed that the batteries tended to have lower voltage during the winter season because of continuous cloudy days. It is recommended to use larger or dual solar panels for each instrument nest.
Based on the above recommendation, larger or dual batteries, instead of solar panels, were used for more power storage for each of the T and TY instrument nests. The anti-corrosion agent has not been used on the CPs because its impact on measurements is unknown.
1.6 Objective and Scope
The objective of this report is to present the data collected from the six subsurface instrument nests (Figure 1.1) through FY10 in accordance with the T-TY Monitoring Plan. The data collected from different instrument nests are compared. Data from all nests will be used to evaluate the impacts of the interim surface barriers on sub-surface moisture conditions. Chapter 2 of this report summarizes the monitoring instruments, pertinent calibration information, instrument installation methods, and data-analysis methodology. Chapter 3 summarizes the functionality of the monitoring system. Chapter 4 presents the monitoring results of the primary variables, i.e., the soil-water content measured by the CPs and by the NP and the soil-water pressure by the HDUs. Chapter 5 summarizes instrument functionality and results of the measured soil-water conditions.

1.5
TA
TC TD
TB
TYA
TYB
Instrument Nests
(a) T Tank Farm
(b) TY Tank Farm
Figure 1.2. Plan View of T-TY Tank Farm with the Approximate Locations of Monitoring Nests TA, TB,
TC, TD, TYA, and TYB and Approximate Interim Surface Barrier Boundaries as Marked by the Blue Lines. (The schematic is not to scale.)

2.1
2.0 The Vadose Zone Monitoring System
Soil-moisture conditions were monitored with an array of solar-powered instrument nests and neutron-probe access tubes located beneath and outside of the interim barriers. The principal variables monitored for this purpose are soil-water content (θ) and soil-water pressure (ψ). (Based on the FY07 monitoring results and the recommendation from the FY07 Report, the drain gauges have not been used to monitor soil water flux since FY08.) The reasons for selecting these variables were given in Section 2.1 of the T-TY Monitoring Plan. Briefly, each variable reflects one aspect of the soil-moisture regime, and their variation is different under different wetness conditions. Measuring two different variables also serves as a redundancy of monitoring. Secondary variables monitored include soil temperature and meteorological conditions, including precipitation and air temperature. The measured precipitation is used to estimate the total volume of water intercepted by the surface barrier after construction is complete. The soil temperature is used to correct the temperature impact on θ and ψ, and along with air temperature, to assess system functionality.
To fulfill the purpose of monitoring surface-barrier impacts on the subsurface water regime, multiple instrument nests were installed both under the interim surface barrier and outside of the surface barrier, as described in Section 4.1 of the T-TY Monitoring Plan. Nests TA and TYA were placed in the area outside the barrier footprint and serve as controls, providing subsurface conditions outside the influence of the surface barriers. Nest TB provides subsurface measurements to assess surface-barrier edge effects. Nests TC, TD, and TYB are used to assess changes in soil-moisture conditions beneath the interim surface barriers. Spatial variability of soil properties and measurement error were considered and were minimized by one of more of the following: 1) using measurements of different types (i.e., θ, and ψ), 2) taking multiple measurements in the vertical direction (for all the variables), 3) duplicating instrument nests (e.g., Nests TC and TD), 4) measuring the same variable with more than one method (e.g., θ is measured using CPs and a NP), and 5) measuring the variation with time at a desired frequency (for all the variables).
The T-TY Monitoring Plan presented the criteria used to select the various measurement methods, the principles of selected methods (Section 2.0), part of the instrument calibrations (Section 3.0), instrument layout and installation (Section 4.0), and measurement procedures and frequencies (Section 5.1). This section summarizes the monitoring instruments, pertinent calibration information, instrument installation methods, and data-analysis methodology for convenience for the readers and completeness.
2.1 Monitoring Instruments and Calibration
Monitoring instruments were chosen based on several considerations. Primary considerations used to select instrumentation are that the instrumentation is amenable to the prescribed installation method (hydraulic hammer) and restrictions of working within the tank farms. Additional criteria considered are described in Table 2.1 of the T-TY Monitoring Plan. Table 2.1 lists the instruments selected and the variables monitored by each instrument. Figure 2.1 shows monitoring components, instrumentation, and a data-collection and management flow diagram. In the following sections, each instrument is briefly described, and supporting calibration information is provided.

2.2
Meteorological ConditionsSoil Water Pressure Soil Water Content Soil Temperature
Air Temperature Precipitation
HDU Capacitance Probe
Neutron Probe HDU Thermister Rain Gauge
Datalogger RF Telemetry and Telephone
Central Database
Post Processing
Analysis
Reporting
Monitoring Components
Instruments
Data Collection and Management
Figure 2.1. Vadose Zone Monitoring Components, Instrumentation, and Data-Collection and
Management Flow Diagram for the T-TY Tank Farm Interim Surface Barrier Demonstration Project
Table 2.1. Instruments Selected for Interim Surface Barrier Monitoring and the Monitored Variables (from the T-TY Monitoring Plan)
Instrument Manufacturer Model Variable Monitored Measurement
Precision
Neutron Probe Campbell Pacific Nuclear
503DR Hydroprobe
Soil Moisture Content ±0.016 m3m-3
Capacitance Probe Sentek EnviroSMART Soil Moisture Content ±0.01 m3m-3
Heat Dissipation Unit
Campbell Scientific, Inc. 229-L Soil-Water Pressure,
Soil Temperature ±20%
±0.25°C Precipitation
Sensor Texas Electronics TE525WS Precipitation ±1%
Thermistor Campbell Scientific, Inc. 109-L Air Temperature ±0.1°C

2.3
2.1.1 Neutron Probe
Neutron thermalization, as a method to measure soil-water content, uses a radioactive source of fast neutrons (mean energy of 5 MeV) and a detector of slow neutrons (~0.025 eV). High-energy neutrons emitted from the source are either slowed through repeated collisions with the nuclei of atoms in the soil (scattering) or are absorbed by those nuclei. The most common elements in soil (Al, Si, and O) scatter neutrons with little energy loss. If the neutron hits a hydrogen (H) atom, its energy is reduced on average by about half because the mass of the H nucleus is the same as that of the neutron. The concentration of thermal neutrons changes mainly with the H content of the surrounding material, while changes in H content occur mainly because of changes in soil-water content. Therefore, the concentration of thermal neutrons surrounding a neutron source placed in the soil can be related to the soil volumetric water content. Neutron-probe monitoring of interim surface barriers uses a 503DR hydroprobe manufactured by CPN International, Inc. (Martinez, California), which was described in detail in Section 2.3.1 of the T-TY Monitoring Plan. The 2.5-inch-OD, 0.375-inch-thick, 4140 carbon steel casings are used for NP access.
Ward and Wittmand (2009) calibrated the neutron probe using the Monte Carlo N-Particle (MCNP) transport computer code (X-5 Monte Carlo Team 2005) by performing theoretical analysis of neutron diffusion in air, the probe shield, and in the soil. The calibration curves for 2.5-in. steel casings are summarized in Table 2.2. In this report we calculated the moisture content based on neutron count ratio using the Mode #2 in Table 2.2.
Table 2.2. Neutron Calibration Curve for the 2.5-Inch Steel Casings (Ward and Wittmand 2009)
Model Equation A B #1 B
v NA)exp(=θ -17.9364 1.8648 #2 B
sv NNA )/)(exp(=θ -1.6622 1.8648
#3 Bswv NNA )/)(exp(=θ -0.6115 1.8648
N—16-sec neutron counts; Ns—standard neutron counts in the shield; Nsw—standard neutron counts in water; A and B—fitting coefficients.
2.1.2 Capacitance Probe
The CP is an electromagnetic method used to measure the volumetric soil-water content (θv) of the surrounding soil. Capacitance sensors use capacitance to measure the dielectric permittivity of a surrounding medium. The configuration is like the neutron probe where an access tube made of polyvinyl chloride (PVC) is installed in the soil. The conductive rings of the sensor form the plates of the capacitor. This capacitor is connected to an LC oscillator, consisting of an inductor (L) and a capacitor (C) connected to circuitry that oscillates at a frequency depending on the values of L and C. As the inductor is fixed, the frequency of oscillation varies, depending on variations of capacitance.
The capacitance method uses the soil surrounding the electrodes as part of a capacitor in which the dipoles of water in the soil become polarized in response to the frequency of an imposed electric field. Hence, oscillation frequency is a function of soil-water content. The CP used for the T-TY Farm interim

2.4
surface barrier monitoring is the EnviroSMART probe (Sentek Pty Ltd, Stepney, Australia), which was described in detail in Section 2.3.2 of the T-TY Monitoring Plan.
Two components exist as part of the EnviroSMART CP calibration: 1) a normalization process to minimize instrumental-dependent readings and 2) a calibration process to relate the soil-water content with the normalized frequency. For cylindrical sensors, a normalized frequency (Sf) is calculated by incorporating the raw-frequency reading in soil (F) with frequency readings in air (Fa) and in water (Fw) (Paltineanu and Starr 1997):
wa
af FF
FFS−−
= (2.1)
Table 3.2 of the T-TY Monitoring Plan tabulated the water and open-air measurement output for each sensor. The water measurements were taken with the sensors inside the watertight access tube that was placed in a 10-inch-diameter, cylindrical water vessel. The CP calibration documentation (Sentek Pty Ltd. 2001) provides a default calibration developed using sand, loam, and clay-loam soils. This calibration was developed by performing nonlinear regression on frequency data for paired volumetric moisture content and normalized frequency:
bf
acS /1
−=θ (2.2)
where a = 0.1957, b = 0.4040, and c = 0.02852. The general calibration can also be used in gravelly soils (e.g., the T-TY tank farm soils) because capacitance probes are relatively insensitive to gravel content (Baumhardt et al. 2000).
Generally, there is a positive relationship between the capacitance sensor measurement and the soil temperature due to the temperature effects on the dielectric properties of water and air. Assuming that the factory calibration was conducted at 20°C, the correction equation under any soil temperature conditions was
)20(* −−= Tbθθ (2.3) where θ* and θ are the volumetric water contents with and without temperature correction, respectively, T (°C) is soil temperature, and b is a coefficient of temperature impact on measurement. Evett et al. (2006) reported an average value of b = 0.0011 m3m-3 °C-1 for the EnviroSCAN CP, which is similar to the EnviroSMART probe used in the T tank farm and made by the same manufacturer. This average b value was used to calibrate the temperature impacts on the capacitance sensors in the FY07 and FY08 annual reports. However, we have found that the soil in the T-TY tank farm generally has relatively low water content. Therefore, the use of an average b seemed to over-correct the temperature impact on θ, and an average value of b = 0.0007 m3m-3 °C-1 in Evett et al. (2006) for air-dry soils produced a better correction. Hence, b = 0.0007 m3m-3 °C-1 was used for temperature correction in the FY09 annual report and this report.
Each CP contains five sensors residing at different depths. However, there were no soil-temperature measurements corresponding to each sensor. Hence, the HDU-measured soil temperature at 1- and 2-m

2.5
depths was linearly interpolated or extrapolated to estimate soil temperatures at the remaining depths. In the future, sufficient temperature sensors should be installed at the depths corresponding to the depths of the CP sensors so that temperatures will not be approximated by interpolation or extrapolation as described above.
2.1.3 Heat-Dissipation Unit
An HDU indirectly measures the soil matric potential (ψ) by measuring the thermal conductivity of the reference matrix, which is part of an HDU and is made of porous ceramics. HDU measurement and calibration are independent of soil texture because the heat pulse is restricted to the ceramic. It is also independent of salinity because the method is independent of electrical conductivity. HDUs have the added benefit of also measuring soil temperature.
HDUs consist of a heater and a temperature sensor in a porous ceramic. The temperature rise measured by the temperature sensor at time t represents the heat that is not dissipated at this time. The time dependence of temperature, T, in a line heat source buried in an infinite medium can be approximated by the method of Shiozawa and Campbell (1990):
)ln(4 00 tt
kqTTT −=−=∆π
(2.4)
where T and T0 are the temperatures (°C) at time t and t0, respectively, q is the heat input, and ∆T is the temperature rise. The HDU used for the T-TY Farm interim surface barriers monitoring is the model 229-L HDU manufactured by Campbell Scientific, Inc. (Logan, Utah), which was described in detail in Section 2.4 in the T-TY Monitoring Plan.
Similar to the CP, there are two elements to the HDU calibration: 1) a normalization procedure to remove variation between the HDU sensors and 2) a calibration procedure to develop the relationship between soil-water pressure head and the normalized temperature rise measured by the HDU. The normalization procedure of Flint et al. (2002) was used to calculate the normalized temperature rise (S∆T), according to:
wd
dT TT
TTS∆−∆∆−∆
=∆ (2.5)
where subscripts “d” and “w” denote the temperature rises for a dry and water-saturated ceramic matrix, respectively. The HDU temperature-rise measurement under dry conditions (∆Td) was made after the HDU had been placed over oven-dried desiccant in a sealed container for a length of time (approximately 24 hours). For the HDU temperature-rise measurement under water-saturated conditions (∆Tw), the sensor was submerged in water for 24 to 48 hours and then removed before the HDU measurement. All readings were taken with a constant line-heat source current of 50 mA and measurement times of 1 s and 30 s after HDU heating was initiated. Details of sensor normalization and calibration are given in Section 3.3 of the T-TY Monitoring Plan.
Using the normalized HDU temperature rise and tensiometer readings under steady-state soil conditions, empirical calibration equations were developed by fitting the paired pressure head (in meters) and normalized HDU data points [Eq. (2.6) and (2.7)]. We have noticed that these data pairs for the two

2.6
batches of HDUs, respectively, installed in the T and TY tank farms are significantly different (Figure 2.2). A possible cause is that the materials used for making the HDUs might be different because they were made about 3 years apart. After further examination of the calibration results for the HDUs installed in the T tank farm, we found that the tensiometer readings at the driest soil-water conditions were questionable (the dimmed circles in Figure 2.2). Hence, the T tank farm HDU calibration was re-developed after removing the questionable points. We found that an exponential function, as exemplified in Campbell Scientific, Inc. (CSI 2006), can describe the calibration (Figure 2.2):
T farm HDUs )39.4exp(71.52 TS∆−×−=ψ , r2 = 0.9882 (2.6)
TY farm HDUs )715.6exp(3.645 TS∆−×−=ψ , r2 = 0.9072 (2.7)
y = 52.71e-4.39x
R² = 0.9882
y = 6.453E+02e-6.715E+00x
R² = 9.072E-01
0.1
1
10
0 0.2 0.4 0.6 0.8 1 1.2
Mat
ric
Pote
ntia
l (-m
)
Normalized Temperature Change
T Farm
TY Farm
Expon. (T Farm)
Expon. (TY Farm)
Figure 2.2. HDU Calibration Data Points and Calibration Relationship
The thermal conductivity of the HDUs is temperature dependent, and thus, the measurements that deviate from a reference temperature need to be corrected to the reference temperature. Flint et al. (2002) developed the following equations to correct for temperature effects for HDUs calibrated at 20°C:
)20(* −−= ∆∆ TsSS TT (2.8a) 5
54
43
32
210 TTTTT ScScScScSccs ∆∆∆∆∆ +++++= (2.8b)
where S∆T* = corrected S∆T
s = an intermediate variable T = the field temperature c0 = 0.0013 c1 = 0.011 c2 = 0.0203 c3 = -0.0747 c4 = 0.0559 c5 = -0.0133.

2.7
The air-entry pressure (bubbling pressure) of the matrix material of the probe, which is approximately -10 kPa (-1 m), controls the upper measurement range of the HDUs. Matric potentials above the air-entry pressure (i.e., between 0 and -10 kPa [-1 m]) cannot be measured because the matrix material is essentially saturated. The lower measurement limit is generally considered to be about -1 MPa (-100 m) (Reece 1996). However, less-accurate measurements can be made between -1 and -35 MPa (-100 and -3500 m).
2.1.4 Precipitation Sensor
Monitoring precipitation directly at the tank farms is useful in determining the total amount of meteoric water and the amount of water intercepted by the surface barriers. Localized thunderstorms that occasionally occur at Hanford produce spatially variable short-term, high-energy precipitation events. The possibility of such events requires that a meteorological monitoring station be located at the tank farms to document potential localized precipitation events.
The rain gauge installed at the T tank farm for this purpose is a tipping-spoon type rain gauge, model TE525WS, manufactured by Texas Electronics (Dallas, Texas). Power requirements needed for a heated rain gauge necessitated an unheated rain gauge because there is no available AC power. As such, the rain gauge may not accurately measure precipitation during periods of snowfall. Given the proximity of the Hanford Meteorological Station (HMS) and the uniformity of snowfall across the Hanford Site, it was concluded that snowfall measured by the HMS will approximately describe the snowfall at the T-TY tank farms. The rain-gauge tipping spoon is factory calibrated to an equivalent depth of water of 0.254 mm per tip.
2.1.5 Thermistor
A thermistor is a resistor that relies on the change in its resistance with changing temperature to measure temperature. Two different Campbell Scientific, Inc. models of thermistors are used for interim surface barrier monitoring, the Model 107 and the Model 109. The Model 107 temperature probe is used as a reference temperature probe and is located within the enclosure boxes housing the dataloggers that control the instruments inside the T tank farm. The Model 107 temperature probe is described by a fifth-order polynomial equation relating thermistor resistance, Rs (Ohms), to temperature, T (°C) by Campbell Scientific Inc. (CSI 2004),
55
44
33
2210 sssss RCRCRCRCRCCT +++++= (2.9)
where C0 = -53.4601 C1 = 90.807 C2 = -83.257 C3 = 52.283 C4 = -16.723 C5 = 2.211.
The Model 109 temperature probe is used as part of the T tank farm meteorological station (TMS). This temperature sensor relates thermistor resistance to temperature (°C) using the relationship (CSI 2004),

2.8
( )[ ]15.273
ln)ln(1
3 −
++=
ss RCRBAT (2.10)
where A = 1.129241×10⁻³, B = 2.341077×10⁻⁴, and C = 8.775468×10⁻⁸.
2.2 Monitoring Nests and Installation This section describes the location and composition of the instrument Nests and summarizes the
installation procedure. The instruments in the T Farm are grouped into four nests (i.e., TA, TB, TC, and TD), and those in the TY Farm are grouped into two nests (i.e., TYA and TYB), each of which includes a neutron access tube, a capacitance probe with five sensors, and four HDUs. Nests TA and TYA are placed in the area without a cover and serve as a control. Control nests need to be at least 5 m away from the closest edge of the surface cover to prevent measurable impacts from the cover. Nest TB is placed at the edge of the surface barrier to monitor the edge effect of the surface barrier on the soil-water regime. Nests TC and TD are duplicates and are placed inside the covered area in the T Farm; Nest TYB is placed in the covered area in the TY Farm. The nests under the barrier need to be at least 5 m from the closest edge of the surface barrier and between two or more tanks where the largest change of soil-water content, and hence water flux, is expected after the emplacement of the surface barrier.
Vertically, the monitoring depths go to 15-m bgs. Considering that, upon the emplacement of the surface barrier, the changes of soil moisture are more significant in shallower depths; more intensive and frequent measurements are taken at shallow depths. All instrument nests lie within backfill material, except for the lower part of the neutron access tubes, which extend into the undisturbed Hanford formation below the tanks.
Nests TA and TB were installed in late FY 2006, and monitoring was initiated in September 2006. Nests TC and TD were installed in FY 2007, and monitoring was initiated in May 2008. Nests TYA and TYB were installed in FY 2010, and monitoring was initiated in March 2010. Instruments were placed in an open driving borehole created by pounding a cone-tipped, hollow drive shaft into the ground using a hydraulic hammer (Figure 2.3).
Figure 2.4 shows a typical cone-tipped drive shaft used for driving boreholes. The benefit of using the hydraulic hammer to create a borehole as opposed to drilling is that the hydraulic-hammer technique avoids bringing potentially contaminated soil to the surface. The cone tip on the drive shaft has the capability to be removed once the desired driving depth is reached. This allows instruments to be placed down the borehole through the inside of the drive shaft as the drive shaft is removed from the soil. Likewise, the drive shaft can remain in the soil as a permanent access tube. The diameter of the borehole can be increased or decreased using differing drive-shaft and drive-head diameters. The adjacent instruments in a nest were kept 1 m apart except that the distance between the neutron-probe access tube and the CP access tube in Nest TD was 1.6 m.

2.9
Figure 2.3. Hydraulic Hammer Used to Install Instruments in the T Tank Farm (Photo taken in the summer of 2006)
Each instrument nest within the tank farm was designed to have a dedicated datalogger adjacent to the instrument nest. A CR10X CSI datalogger is used for instrument Nests TA and TB and the meteorological station, and a CR1000 Campbell Scientific datalogger is planned for instrument Nests TC, TD, TYA, and TYB. (The CR10X dataloggers were upgraded to CR1000 in December 2010 for better telecommunication.) The datalogger and peripherals in each instrument nest are powered by a 12-volt rechargeable battery, which is charged by a solar panel attached to the tripod. The battery is placed within an enclosure. Data from the datalogger are transmitted remotely by a 900-MHz spread spectrum radio to a receiving computer located outside of the tank farms.
Figure 2.4. Cone-Tipped Drive Shaft Used in Conjunction with a Hydraulic Hammer for Creating Driving Boreholes (Photo taken in the summer of 2006)
2.3 Monitoring Frequency
The monitoring approach uses the instrument Nests and the TMS presented in the previous section to document vadose zone response to the placement of the interim surface barriers in the T and TY tank farms. Table 6.1 in the T-TY Monitoring Plan summarizes the six variables monitored, the monitoring methods, and the monitoring frequency and is repeated in Table 2.3. In FY10, the actual monitoring frequency was the same or better (more frequent) than the planned frequency (Table 2.3).

2.10
Neutron-moisture-probe measurements are performed manually at 1-foot intervals to the depths of the access tubes following the neutron-probe-measurement procedure documented in CH2M HILL (Ross 2007). The dataloggers control and store the measurement data of moisture content from capacitance sensors, soil-water pressure and soil temperature from HDUs, precipitation from the rain gauge, and air temperature from the thermistor.
Table 2.3. Data-Collection Method(a) and Approximate Frequency Under Normal Working Conditions
Monitoring Variable Monitoring Method Planned Monitoring
Frequency Actual Monitoring
Frequency
Soil-water content Neutron Moisture Probe Quarterly Quarterly
Soil-water content Capacitance Probe Every 6 hours Hourly Soil-water pressure and soil temperature Heat Dissipation Unit Every 6 hours Every 6 hours
Air temperature Thermistor Hourly Every 15 minutes Precipitation Rain Gauge Hourly Every 15 minutes (a) All measurements except the neutron probe are controlled by dataloggers and taken automatically.
2.4 Data-Analysis Methodology
The methodology described in Sections 5.2 and 5.3 of the T-TY Monitoring Plan provided a general guidance for data analysis. To reduce the amount of data, daily-average values of each variable were calculated for further analyses. Instrument performance was evaluated by examining measurements against the instrument-performance indicators listed in Table 5.2 of the T-TY Monitoring Plan. The battery voltages and soil temperature were assessed to examine the functionality of the instruments. Additionally, the measured precipitation and air temperature at T tank farm were compared with those from the HMS.
The causes for anomalous data generally were due to (but are not limited to) interruptions of the system, other operations (e.g., barrier construction), poor wire connection (e.g., due to corrosion occurrence), and/or low battery voltage. The CP in Nest TB gave noisy data from October to December, and the CP in Nest TC was not operating correctly from October to mid-January. Both of these CPs were replaced temporarily by new probes on January 14. This probe swap caused a system shift of measurement. The repaired probes were switched back on April 20. The data from the CP at Nest TC became noisy after early June. The noisy data and data measured with the temporary CPs were reported in the results but were not considered in any statistical analysis.
Several neutron-logging values were suspect because they were very different (by 15% or more) from the counts at the same depths of the previous and/or next loggings, while the logging values in the soil immediately above and below did not show a similar change. Hence, an average of the counts of the immediately previous and next loggings was used to substitute the suspect values.

2.11
2.5 Quality Assurance
To verify the quality of the data, a stand-alone project management plan (PMP) was prepared and approved by the product line manager. A quality assurance plan (QAP) was also prepared. This project was conducted in accordance with the PMP and QAP.

3.1
3.0 Functionality of the Monitoring System
The functionality of the monitoring system is evaluated in this section. The battery voltage is examined because the instruments require a minimum voltage to remain in normal operation. The functionality of the instrument Nests and TMS was assessed by comparing the measured air temperature and precipitation at the T-TY tank farms with those measured at the HMS, which is about 1.7 km from the T-TY tank farms. Soil-temperature behavior was examined to assess the functionality of the HDUs. The functionality of the CPs and HDUs when used for pressure head measurements are also briefly summarized while the monitoring results are presented in Section 4.0.
3.1 Weather Conditions
Although the air temperature and precipitation were measured in the T tank farm, their purposes are to examine system functionality and detect any possible uneven distribution of precipitation. Hence, the data from the Hanford meteorological station are used here to describe the climate conditions.
Figure 3.1 shows the monthly precipitation in FY10 and the multi-year average values (from 1947 to 2009).(a
Figure 3.2
) The total precipitation in FY10 was 216.4 mm, which was 25.7% more than the 63-year average value of 172.2 mm. FY10 winter (November–March) precipitation was 18.3% less than but the summer (April–October) precipitation was 88.8% more than the multi-year average values. Hence, FY10 had a nearly average winter but a very wet summer in regard to precipitation. shows the monthly air temperature in FY10 and the 64-year average values (from 1945 to 2008).(b
3.2 Battery Voltage
) The FY10 annual mean air temperature was 11.7°C, which was 0.2°C less than the 64-year average value.
Rechargeable batteries were used for the instrument Nests and the TMS. Each battery was recharged by a connected solar panel. Generally, a battery voltage greater than 11.5 V is needed to provide sufficient power to the instrument. The variations in battery voltages are plotted in Figure 3.3. The lowest battery voltage occurred in late December 2009 and early January 2010 when solar energy was least available. Based on the system performance, a voltage of 10 V or higher provided sufficient power to the instruments. For the batteries in Nests TA, TB, TYA, and the Met station, the minimum voltage was no less than 12V. However, the batteries in Nests TC and TD showed the minimum battery voltage of 9.8 and 9.3 V, respectively, in December or January because of the extended cloudy days. Nests TC and TD stopped working from a few hours to a day on one occasion for Nest TC and two occasions for Nest TD when the battery voltage became insufficiently low, as shown by the low peaks in Figure 3.3. These two batteries were replaced on January 14, 2010. The logging of Nests TYA and TYB started in March 2010, but the wires in Nest TYB were disconnected, and hence, the battery for this nest was not charged between June 23 and August 30 because of barrier construction.
(a) Available at http://hms.pnl.gov/totprcp.htm. Verified in November 2010. (b) Available at http://hms.pnl.gov/monmean.htm. Verified in November 2010.

3.2
19.8
14.2
18.0
31.5
14.2
5.1
15.0
30.2
29.2
11.7
3.3
24.1
13.5
22.4
26.4
24.1
16.0
12.7
11.9 13
.0
13.5
5.1 6.
1 7.6
0
5
10
15
20
25
30
35
40P
reci
pita
tion
(mm
)FY10 (Total: 216.4 mm)
Average (Total: 172.2 mm)
Figure 3.1. FY10 and Multi-Year Average Monthly Precipitation (mm) in Hanford
10.1
5.0
-4.1
3.3 5.
6 8.3
11.7 14
.4
19.4
24.8
23.6
18.8
11.7
4.5
0.2
-0.5
3.2
7.4
11.6
16.6
20.7
24.8
23.9
19.0
-10
-5
0
5
10
15
20
25
30
35
Air
Tem
pera
ture
(C)
FY10 (annual mean: 11.7 C)
Average (annual mean: 11.9 C)
Figure 3.2 FY10 and Multi-Year Average Monthly Air Temperature (°C) in Hanford

3.3
8
9
10
11
12
13
14B
atte
ry V
olta
ge (V
)
Date
T Farm Met
Nest TA
Nest TB
Nest TC
Nest TD
Nest TYA
Nest TYB
Figure 3.3. Daily Average Battery Voltage
3.3 Air Temperature
The daily average air temperature measured at the TMS located outside of the fence of T tank farm and the air temperature from the HMS are plotted in Figure 3.4. Also plotted are the reference temperatures of the dataloggers in the instrument nests. The temperature measurements from the different locations were very consistent. Except for the dates that the battery voltages in Nests TC and TD were too low, the difference between the observed values and those from the HMS was within about ±5°C. The FY10 annual average air temperatures were 11.7°C at HMS, 12.3°C at the TMS, and 12.1, 12.4, 12.5, and 12.4 °C at the enclosure of Nests TA, TB, TC, and TD, respectively. The measurements at the T tank farm were about 0.4~0.7°C higher than those at HMS. This difference is consistent with those in FY07, FY09, and FY09 (0.3~0.6°C). During the observation period (March to September 2010) for the TY tank farm, the air temperatures from the sensors in Nests TYA and TYB were consistent with those of TA, TB, TC, and TD. These indicate that the dataloggers for each of the instrument Nests were functioning properly.

3.4
-20
-10
0
10
20
30
40
Air
Tem
pera
ture
(C
)
Date
HMST Farm MetNest TANest TBNest TCNest TDNest TYANest TYB
Incorrect values due to low battery voltage in Nest s TC and/or TD
(a)
-20
-15
-10
-5
0
5
10
Air
Tem
pera
ture
Diff
eren
ce (C
)
Date
T Farm MetNest TANest TBNest TCNest TDNest TYANest TYB
Incorrect values due to low battery voltage in Nest s TC and/or TD
(b)
Figure 3.4. (a) Daily Average Air Temperature and (b) Temperature Difference Between the Observed
Values and Those at HMS

3.5
3.4 Precipitation
The FY10 cumulative precipitation measured outside of the fence of the T tank farm was 192.0 mm, which is 24.4 mm (11.3%) lower than that at the HMS (216.4 mm). The FY10 monthly precipitation at the T tank farm and Hanford Meteorological Station is shown in Figure 3.5, and a relatively large difference occurred in December. This is because the precipitation in winter was primarily in the form of snow. The T Farm rain gauge was not heated, and thus, the snow quantity might be underestimated in the T Farm.
17.3
11.9
6.4
33.5
13.0
2.8
13.5
32.8
25.1
11.7
3.0
21.1
19.8
14.2
18.0
31.5
14.2
5.1
15.0
30.2
29.2
11.7
3.3
24.1
0
5
10
15
20
25
30
35
40
Pre
cipi
tatio
n (m
m)
T Farm
HMS
Figure 3.5. FY10 Monthly Precipitation at the T Tank Farm and Hanford Meteorological Station
3.5 Soil Temperature
Figure 3.6 shows the daily average soil temperatures (T) measured by the HDUs for the six instrument nests installed in the T and TY tank farms. The HDU-measured FY10 average (Tavg), minimum (Tmin), and maximum (Tmax) T and the standard deviation of T (Tstd) are summarized in Table 3.1. The average temperature and variation are shown in Figure 3.7.
The soil temperature varied seasonally with a lag of phase relative to the variation of air temperature. Nest TA resides outside of the TISB footprint (see Figure 1.1a). The soil temperature at the 1-m depth decreased to the minimum (4.2°C) in early January, after which the soil temperature started to increase and reached the maximum (28.7°C) in late July to early August, with an annual average of 15.8°C. The soil temperature at the 2-m depth decreased to the minimum (8.7°C) in mid-January before beginning to increase to the maximum (24.9°C) in mid-August, with an annual average of 16.1°C. The soil
3.6
temperature at the 5-m depth reached its minimum (14.5°C) in late April and the maximum (19.4°C) in early November with an annual average of 16.6°C. The soil temperature at the 10-m depth was stable at 16.7±0.5°C. These results are very similar to those of Nest TA in FY07 (17.1°C), FY08 (16.9°C), and FY09 (16.7°C).
0
5
10
15
20
25
30
35
Soi
l Tem
pera
ture
(C
)
Date
1 m2 m5 m10 m
Nest TA
0
5
10
15
20
25
30
35
Soi
l Tem
pera
ture
(C
)
Date
1 m2 m5 m10 m
Nest TB
Figure 3.6. Daily Average Soil Temperature at Different Depths Measured Using the HDUs (Nest TC
stopped working on January 12, 2010, and Nest TD stopped working on December 21 and January 13 because of low battery voltage; Nest TYB was not in operation between June 23 and August 30 because of barrier construction at the TY tank farm)

3.7
0
5
10
15
20
25
30
35S
oil T
empe
ratu
re (
C)
Date
1 m2 m5 m9 m
Nest TC
0
5
10
15
20
25
30
35
Soi
l Tem
pera
ture
(C
)
Date
1 m2 m5 m10 m
Nest TD
Figure 3.6 (contd)

3.8
0
5
10
15
20
25
30
35S
oil T
empe
ratu
re (
C)
Date
1 m2 m5 m10 m
Nest TYA
0
5
10
15
20
25
30
35
Soi
l Tem
pera
ture
(C
)
Date
1 m2 m5 m10 m
Nest TYB
Figure 3.6 (contd)

3.9
Table 3.1. The FY10 Annual HDU-Measured Average (Tavg), Minimum (Tmin), Maximum (Tmax), and Standard Deviation (Tstd) of Soil Temperature
Farm Depth
(m) Nests Tavg (°C)
Tmin (°C)
Tmax (°C)
Tstd (°C)
T Tank Farm
1
TA 15.8 4.2 28.7 7.6 TB 15.3 8.0 24.0 5.4 TC 15.0 8.3 23.2 5.0 TD 14.9 7.6 23.5 5.2
2
TA 16.1 8.7 24.9 5.5 TB 15.8 11.0 21.9 3.8 TC 15.4 11.2 21.2 3.5 TD 15.3 11.1 21.1 3.5
5
TA 16.6 14.5 19.4 1.7 TB 16.3 14.6 18.5 1.3 TC 16.0 14.4 18.0 1.2 TD 15.9 14.2 18.0 1.3
10
TA 16.7 16.3 17.2 0.3 TB 16.7 16.3 17.2 0.2 TC 16.6 16.1 17.3 0.4 TD 16.5 16.0 16.9 0.3
TY Tank Farm
1 TYA 19.9 9.1 28.7 6.3 TYB 17.6 9.6 27.3 5.0
2 TYA 18.0 9.7 25.4 5.3 TYB 16.2 10.4 24.1 4.3
5 TYA 15.9 14.8 18.7 1.2 TYB 15.4 14.5 18.7 1.3
10 TYA 17.3 17.0 17.8 0.2 TYB 16.9 16.6 17.5 0.3
Nest TB resides near the edge but under the TISB (see Figure 1.1a). Generally, the soil-temperature variation in Nest TB is similar to that of Nest TA. However, the magnitude of soil-temperature variation at the 1-m and 2-m depths was smaller than those of Nest TA because of the impact of the barrier. At 1-m depth, Tmin was 3.8°C higher, Tmax 4.7°C lower, and Tavg 0.5°C lower for Nest TB than those for Nest TA. At 5-m and 10-m depths, the average temperature differences between the two Nests were no more than ±0.3°C.
Nests TC and TD both reside inside the barrier footprint. The soil temperatures of Nests TC and TD in FY10 were very similar (differ by no more than ±0.2°C). The average soil temperature for Nests TC and TD was about 0.9, 0.8, 0.7 and 0.2°C lower at 1-, 2-, 5-, and 10-m depths, respectively, than the corresponding values for Nest TA.
For instrument nests in the TY Farm, Nest TYA resides outside and TYB inside the barrier footprint (Figure 1.1b). The monitoring started in March 2010, and Nest TYB was not in operation between June 23 and August 30 because of barrier construction. The average soil temperature for Nest TYB was 2.3, 1.8, 0.7 and 0.4°C lower at 1-, 2-, 5-, and 10-m depths, respectively, than the corresponding values for Nest TYA.

3.10
These results indicate that the HDUs were functioning properly when used to measure soil temperature, and there were no problems with the communication between HDUs and the dataloggers. However, this does not mean that the correct measurement of the soil water pressure head was obtained with the HDUs.
0 5 10 15 20 25 30
1 m
2 m
5 m
10 m
Temperature (C)
Dep
th (m
)
TA
TB
TC
TD
TYA
TYB
Figure 3.7. Average Soil Temperature at Different Depths Measured Using the HDUs. The line on each
bar shows the range of standard deviation (±Tstd).
3.6 Soil-Water Pressure Head
All the HDUs were functional, but some values were higher than the upper limit of about -1 m. According to the HDU specification (CSI 2006), the upper-limit of HDU-measured ψ is -1 m H2O height. Theoretically, the HDU should report a constant value of -1 m for the ψ values > -1 m. Some ψ values measured by HDUs were greater than -1 m, but were not constant. This indicates that these HDUs were still responding to the variation of soil-water pressure, but the measurements may not be accurate. Possible explanations are 1) the actual upper limit of the ceramic of the HDUs may be higher than -1 m, and 2) there is some uncertainty from the calibration equation. In spite of the potential error, the measurements can still correctly reflect soil-water pressure variation over time, assuming that the error stays nearly the same with time.
3.7 CP-Measured Soil-Water Content
All the CPs were functioning properly except the CPs at Nests TC and TD at certain periods of time (see Section 2.4 for details).

4.1
4.0 Monitoring Results
The construction of the TISB was completed in April 2008 and that of the TYISB in September 2010. This section summarizes the water contents from the capacitance probes, the pressure head from the heat-dissipation-units, and the soil water content from the neutron probe.
4.1 Soil-Water Content
This section summarizes the results of soil-water content measured with the CPs and the NP.
4.1.1 Capacitance-Probe Measurements
The soil water dynamic is shown by the temporal variation of the soil-water content. A quantitative description is given by the annual average, minimum, maximum, and standard deviation.
Figure 4.1 shows the temporal variation of the soil-water content measured by the CPs for the six instrument nests. For Nest TA outside of the TISB footprint, at the 0.6-m depth, the soil-water content was relatively stable in October and November, 2009, but increased sharply in late December because of a snowmelt and reached the maximum in early- to mid-January 2010. This was followed by a gradual decrease, and there was another increase in soil water content in early June. These increases were also observed at the 0.9-m depth but at a lesser magnitude. As will be shown later, these increases were detected by the HDUs as well. At the 1.3-m depth and deeper, the soil-water contents were relatively stable during FY10. For Nest TB near the edge of the TISB, the soil water conditions were relatively stable through the whole year except at the 0.6-m and 0.9-m depths, at which the soil water content increased slightly. For Nests TC and TD below the TISB, the soil water content at all depths was stable because there was no water infiltrating into or evaporating from the soil at the ground surface. Starting from March 2010, the time the TY tank farm instruments were installed, the water content for both TYA and TYB was relatively stable.
The annual CP-measured average (θavg), minimum (θmin), maximum (θmax), and standard deviation (θstd) of soil water content are tabulated in Table 4.1. The mean and standard deviation of θ in FY10 are also plotted in Figure 4.2. The standard deviation indicates the temporal variation of soil water content. Although there were some exceptions, generally, at the relatively shallow depths (e.g., 0.6 and 0.9 m), both the mean and standard deviation were the largest for Nest TA, intermediate for TB, and smallest for TC and TD.

4.2
0.00
0.05
0.10
0.15
0.20
0.25
0.30
0.35S
oil M
oist
ure
Con
tent
(m3/
m3)
Date
0.6 m0.9 m1.3 m1.8 m2.3 m
Nest TA
0.00
0.05
0.10
0.15
0.20
0.25
0.30
0.35
Soi
l Moi
stur
e C
onte
nt(m
3/m
3)
Date
0.6 m0.9 m1.3 m1.8 m2.3 m
Nest TB
Figure 4.1. Daily Average Soil-Water Content at Five Depths Measured Using the CPs (Nest TC stopped
working on January 12, 2010, and Nest TD stopped working on December 21 and January 13 because of low battery voltage; Nest TYB was not in operation between June 23 and August 30 because of barrier construction at the TY tank farm. The CPs in Nests TB and TC were replaced by new probes on January 14. The repaired CPs were switched back on April 20).

4.3
0.00
0.05
0.10
0.15
0.20
0.25
0.30
0.35S
oil M
oist
ure
Con
tent
(m3/
m3)
Date
0.6 m0.9 m1.3 m1.8 m2.3 m
Nest TC
0.00
0.05
0.10
0.15
0.20
0.25
0.30
0.35
Soi
l Moi
stur
e C
onte
nt(m
3/m
3)
Date
0.6 m0.9 m1.3 m1.8 m2.3 m
Nest TD
Figure 4.1 (contd)

4.4
0.00
0.05
0.10
0.15
0.20
0.25
0.30
0.35S
oil M
oist
ure
Con
tent
(m3/
m3)
Date
0.6 m0.9 m1.3 m1.8 m2.3 m
Nest TYA
0.00
0.05
0.10
0.15
0.20
0.25
0.30
0.35
Soi
l Moi
stur
e C
onte
nt(m
3/m
3)
Date
0.6 m0.9 m1.3 m1.8 m2.3 m
Nest TYB
Figure 4.1 (contd)

4.5
Table 4.1. The FY10 Annual CP-Measured Average (θavg), Minimum (θmin), Maximum (θmax), and Standard Deviation (θstd) of Soil Water Content(a)
Farm Depth
(m) Nests θavg
(m3 m-3) θmin
(m3 m-3) θmax
(m3 m-3) θstd
(m3 m-3)
T Tank Farm
0.6
TA 0.188 0.141 0.257 0.032 TB 0.134 0.106 0.196 0.008 TC 0.095 0.079 0.108 0.009 TD 0.094 0.090 0.100 0.002
0.9
TA 0.160 0.140 0.179 0.012 TB 0.159 0.131 0.168 0.010 TC 0.085 0.057 0.104 0.014 TD 0.039 0.035 0.047 0.002
1.3
TA 0.065 0.056 0.075 0.005 TB 0.093 0.082 0.098 0.006 TC 0.076 0.055 0.114 0.027 TD 0.054 0.051 0.063 0.002
1.8
TA 0.046 0.038 0.050 0.003 TB 0.084 0.070 0.100 0.009 TC 0.085 0.049 0.093 0.008 TD 0.086 0.084 0.093 0.001
2.3
TA 0.060 0.053 0.077 0.003 TB 0.078 0.059 0.094 0.011 TC 0.088 0.065 0.105 0.011 TD 0.084 0.083 0.095 0.001
TY Tank Farm
0.6 TYA 0.020 0.015 0.026 0.004 TYB 0.033 0.030 0.037 0.002
0.9 TYA 0.033 0.027 0.039 0.003 TYB 0.033 0.028 0.036 0.002
1.3 TYA 0.020 0.016 0.025 0.003 TYB 0.031 0.027 0.034 0.002
1.8 TYA 0.057 0.055 0.059 0.001 TYB 0.036 0.033 0.038 0.002
2.3 TYA 0.027 0.023 0.030 0.002 TYB 0.037 0.034 0.039 0.001
(a) Outliers were not considered in the analysis (see Section 2.4).

4.6
TATB
TCTD
TYATYB
0
0.05
0.1
0.15
0.2
0.60.91.31.82.3
Wat
er C
onte
nt (m
3m
-3)
(A)
TATB
TCTD
TYATYB
0
0.01
0.02
0.03
0.04
0.60.91.31.82.3
STD
of
Wat
er C
onte
nt (m
3m
-3)
(B)
Figure 4.2. The Mean and Standard Deviation of Soil Water Content in FY10. Outliers were not
considered in the analysis (see Section 2.4).
4.1.2 Neutron-Probe Measurements
Four neutron loggings were carried out for the instrument Nests in the T tank farm and two loggings for those in the TY tank farm. The measured water contents are shown in Figure 4.3. For Nest TA, the soil was wetting from October to March but was drying thereafter; there was a significant seasonal variation of soil water content at the depths above about 2 m (6 ft) bgs. For Nests TB, TC, and TD, there was little seasonal variation of soil water content because of the impacts of the TISB. For Nests TYA and TYB, the changes between the two loggings were small.

4.7
0
2
4
6
8
10
12
14
160 0.02 0.04 0.06 0.08 0.1
Dep
th b
gs (
m)
Water Content (m3 m-3)
8/6/200912/7/20093/18/20106/9/20109/16/2010
Nest TA0
2
4
6
8
10
12
14
160 0.02 0.04 0.06 0.08 0.1
Dep
th b
gs (
m)
Water Content (m3 m-3)
8/6/200912/7/20093/18/20106/9/20109/16/2010
Nest TB
Figure 4.3. Soil Water Content Measured Using Neutron Probes at Different Depths (the depth bgs was
relative to the ground surface before barrier construction)

4.8
0
2
4
6
8
10
12
14
160 0.02 0.04 0.06 0.08 0.1
Dep
th b
gs (
m)
Water Content (m3 m-3)
8/6/200912/7/20093/18/20106/9/20109/16/2010
Nest TC0
2
4
6
8
10
12
14
160 0.02 0.04 0.06 0.08 0.1
Dep
th b
gs (
m)
Water Content (m3 m-3)
8/6/200912/7/20093/18/20106/9/20109/16/2010
Nest TD
Figure 4.3 (contd)

4.9
0
2
4
6
8
10
12
14
160 0.02 0.04 0.06 0.08 0.1 0.12 0.14
Dep
th b
gs (
m)
Water Content (m3 m-3)
4/22/20109/26/2010
Nest TYA0
2
4
6
8
10
12
14
160 0.02 0.04 0.06 0.08 0.1 0.12 0.14
Dep
th b
gs (
m)
Water Content (m3 m-3)
4/22/20109/26/2010
Nest TYB
Figure 4.3 (contd)

4.10
4.2 Soil-Water-Pressure Head
Figure 4.4 shows the soil-water pressure measured by the HDUs after temperature correction. For Nest TA outside the TISB footprint, at the 1-m depth, a slight decrease of ψ from October to November was followed by a sharp increase in early January 2010; ψ started to drop from February at the 1-m depth; soil-water pressure at the 2-m depth had a similar but delayed trend as that at the 1-m depth; the soil-water pressure was relatively stable at the 5-m and 10-m depths. For Nest TB at the edge of the TISB, ψ was relatively stable at other depths except that there was a ψ increase in February at the 1-m depth. For Nests TC and TD inside TISB, the soil-water pressure had a mild decreasing trend through the year at all the depths. Some pressure-head values were greater than the upper measurement limit of -1 m. The values that exceeded the upper limit may indicate very wet soil conditions and/or measurement error, but they do not imply a malfunction of the sensors.
For TYA outside the TYISB, the soil-water pressure from March to September had a decreasing trend at the 1-m depth and was relatively stable at other depths. For TYB inside the TYISB, ψ was variable at the 1-m depth because of barrier construction and was relatively stable at other depths.
The annual HDU-measured average (ψavg), minimum (ψmin), maximum (ψmax), and standard deviation (ψstd) of soil-water pressure are tabulated in Table 4.2. The mean and standard deviation of ψ in FY10 are also plotted in Figure 4.5. The standard deviation indicates the temporal variation of soil water conditions. Generally, among the four instrument nests in the T tank farm, Nest TA had the highest pressure-head values, indicating the wettest soil water conditions and the largest temporal variations due to water exchange with the atmosphere. There were no significant differences between TYA and TYB.

4.11
-6
-5
-4
-3
-2
-1
0P
ress
ure
Hea
d (m
)
Date
1 m2 m5 m10 m
Nest TA
-6
-5
-4
-3
-2
-1
0
Pre
ssur
e H
ead
(m)
Date
1 m2 m5 m10 m
Nest TB
Figure 4.4. Daily Average Soil-Water Pressure at Different Depths Measured Using the HDUs (Nest TC
stopped working on January 12, 2010, and Nest TD stopped working on December 21 and January 13 because of low battery voltage; Nest TYB was not in operation between June 23 and August 30 because of barrier construction at the TY tank farm)

4.12
-7
-6
-5
-4
-3
-2
-1
0P
ress
ure
Hea
d (m
)
Date
1 m2 m5 m9 m
Nest TC
-6
-5
-4
-3
-2
-1
0
Pre
ssur
e H
ead
(m)
Date
1 m2 m5 m10 m
Nest TD
Figure 4.4 (contd)

4.13
-6
-5
-4
-3
-2
-1
0P
ress
ure
Hea
d (m
)
Date
1 m2 m5 m10 m
Nest TYA
-6
-5
-4
-3
-2
-1
0
Pre
ssur
e H
ead
(m)
Date
1 m2 m5 m10 m
Nest TYB
Figure 4.4 (contd)

4.14
Table 4.2. The FY10 Annual HDU-Measured Average (ψavg), Minimum (ψmin), Maximum (ψmax), and Standard Deviation (ψstd) of Soil Water Pressure
Farm Depth (m) Nests
ψavg (m)
ψmin (m)
ψmax (m)
ψstd (m)
T Tank Farm
1
TA -1.9 -3.3 -0.8 0.77 TB -2.1 -2.4 -1.9 0.14 TC -6.1 -6.5 -5.5 0.17 TD -3.1 -3.3 -2.8 0.11
2
TA -1.5 -1.9 -1.3 0.18 TB -2.7 -2.9 -2.4 0.10 TC -2.4 -2.5 -2.1 0.08 TD -2.7 -3.0 -2.4 0.18
5
TA -1.6 -1.7 -1.5 0.06 TB -2.0 -2.2 -1.9 0.08 TC -2.5 -2.9 -2.2 0.18 TD -2.9 -3.2 -2.7 0.11
10
TA -1.6 -1.7 -1.6 0.02 TB -1.5 -1.6 -1.4 0.03 TC -2.9 -3.1 -2.7 0.07 TD -1.5 -1.6 -1.4 0.04
TY Tank Farm
1 TYA -2.2 -2.5 -1.9 0.1 TYB -2.5 -2.8 -2.0 0.1
2 TYA -1.0 -1.9 -1.0 0.1 TYB -1.0 -1.2 -0.9 0.0
5 TYA -0.8 -1.2 -0.7 0.1 TYB -1.5 -1.7 -1.1 0.2
10 TYA -0.8 -1.0 -0.8 0.0 TYB -1.4 -2.4 -1.2 0.2
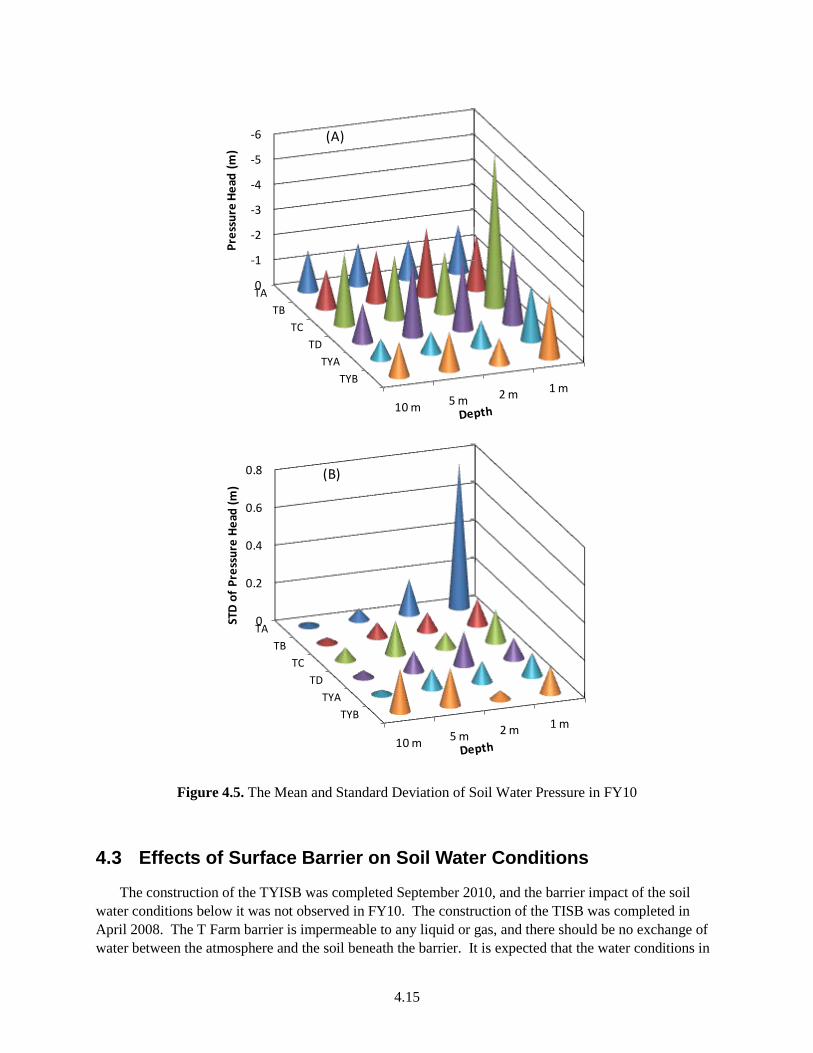
4.15
TA
TB
TC
TD
TYA
TYB
-6
-5
-4
-3
-2
-1
0
1 m2 m5 m10 m
Pres
sure
Hea
d (m
)
(A)
TA
TB
TC
TD
TYA
TYB
0
0.2
0.4
0.6
0.8
1 m2 m5 m10 m
STD
of
Pres
sure
Hea
d (m
)
(B)
Figure 4.5. The Mean and Standard Deviation of Soil Water Pressure in FY10
4.3 Effects of Surface Barrier on Soil Water Conditions
The construction of the TYISB was completed September 2010, and the barrier impact of the soil water conditions below it was not observed in FY10. The construction of the TISB was completed in April 2008. The T Farm barrier is impermeable to any liquid or gas, and there should be no exchange of water between the atmosphere and the soil beneath the barrier. It is expected that the water conditions in

4.16
the soil beneath the TISB (Nests TC and TD) are not affected by atmospheric conditions, and hence, there is little seasonal variation, while those in the soil exposed to natural conditions (Nest TA), especially at shallow depths, are significantly affected by the temperature and precipitation.
The CP-measured, soil-water-content changes from May 3, 2008 (the time the T Farm barrier was constructed), to September 30, 2010, are shown in Figure 4.6. Although most of the changes are within the measurement error of a CP (i.e., 0.015 m3 m-3), there still was a general trend. Soil water contents at Nests TA and TB increased during this period, and those in TD decreased or stayed unchanged. Soil water contents at TC increased in some depths but decreased in others, possibly because of the uncertainty of some sensors.
-0.02
-0.015
-0.01
-0.005
0
0.005
0.01
0.015
0.02
0.025
0.03
0.035
Nest TA Nest TB Nest TC Nest TD
Wat
er C
onte
nt C
hang
e (m
3m
-3)
Instrument Nests
0.6 m
0.9 m
1.3 m
1.8 m
2.3 m
Figure 4.6. CP-Measured, Soil-Water-Content Change from May 3, 2008, to September 30, 2010 (Nest
TA was from October 1, 2008, to September 30, 2010, because this probe was not in operation from January to September 2008)
To assess the barrier impact on soil water conditions based on the NP measurements, the soil water content was averaged over 3.1-m (10-ft) intervals and also over the whole profile. The changes between April 9, 2008 (the time the barrier construction was nearly completed), and September 16, 2010, are shown in Figure 4.7. The changes were all negative, meaning that the soil became drier during this period. At the depths from ground surface to 12.2 m bgs, the decreases of θ were between 0.001 and 0.008 m3 m-3 in Nests TA and TB, and between 0.007 and 0.014 m3 m-3 in Nests TC and TD (Figure 4.7a, through d). At depths below 12.2 m (Figure 4.7e), there was no difference in θ between the Nests. On average, over the whole profile (from ground surface to depth 15.2 m), the change was about 0.002 m3 m-3 in Nest TA, and about 0.009 m3 m-3 in Nests C and D. However, the difference between Nest TA outside of the barrier and Nests TC and TD inside the barrier was less than the measuring resolution of a neutron probe, i.e., about 0.016 m3m-3 (Table 2.1). In most cases, the change was even smaller than the standard deviation within the corresponding soil layer. Thus, the results can be used qualitatively but not quantitatively. The reason for the small changes is possibly due to the relatively coarse texture of the soil, whose water content is relatively low under natural conditions.
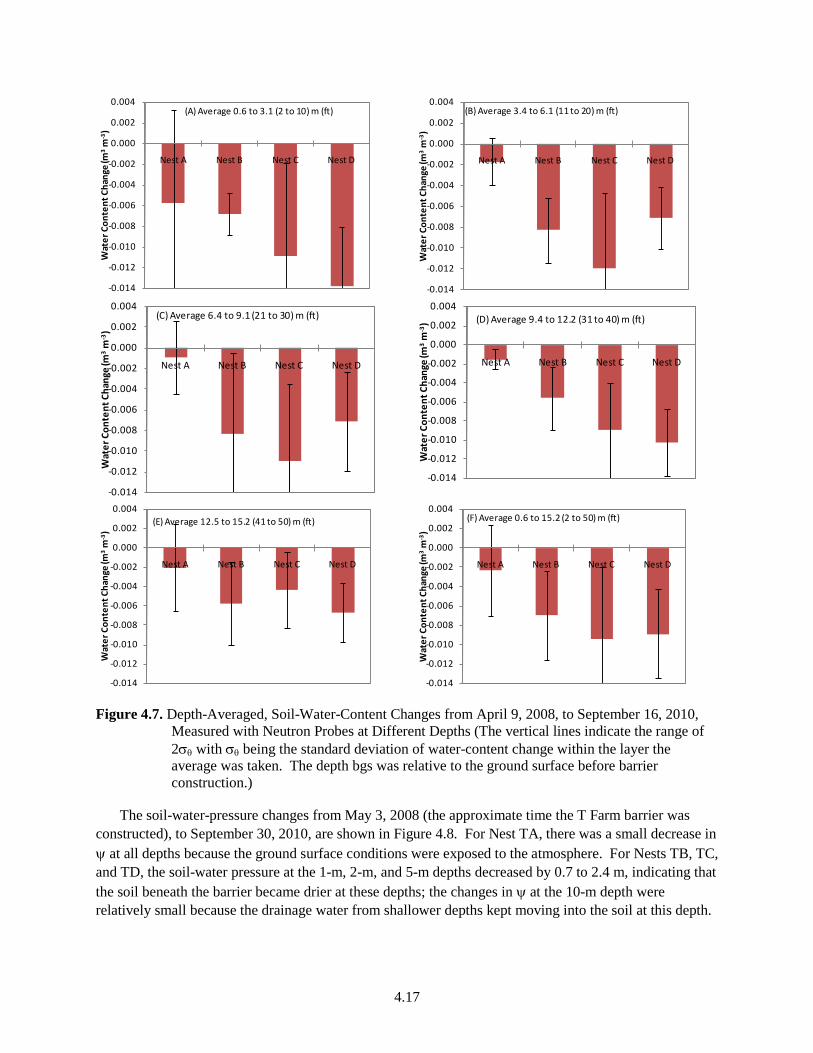
4.17
-0.014
-0.012
-0.010
-0.008
-0.006
-0.004
-0.002
0.000
0.002
0.004
Nest A Nest B Nest C Nest D
Wat
er C
onte
nt C
hang
e (m
3m
-3)
(A) Average 0.6 to 3.1 (2 to 10) m (ft)
-0.014
-0.012
-0.010
-0.008
-0.006
-0.004
-0.002
0.000
0.002
0.004
Nest A Nest B Nest C Nest D
Wat
er C
onte
nt C
hang
e (m
3m
-3)
(B) Average 3.4 to 6.1 (11 to 20) m (ft)
-0.014
-0.012
-0.010
-0.008
-0.006
-0.004
-0.002
0.000
0.002
0.004
Nest A Nest B Nest C Nest D
Wat
er C
onte
nt C
hang
e (m
3m
-3)
(C) Average 6.4 to 9.1 (21 to 30) m (ft)
-0.014
-0.012
-0.010
-0.008
-0.006
-0.004
-0.002
0.000
0.002
0.004
Nest A Nest B Nest C Nest D
Wat
er C
onte
nt C
hang
e (m
3m
-3) (D) Average 9.4 to 12.2 (31 to 40) m (ft)
-0.014
-0.012
-0.010
-0.008
-0.006
-0.004
-0.002
0.000
0.002
0.004
Nest A Nest B Nest C Nest D
Wat
er C
onte
nt C
hang
e (m
3m
-3)
(E) Average 12.5 to 15.2 (41 to 50) m (ft)
-0.014
-0.012
-0.010
-0.008
-0.006
-0.004
-0.002
0.000
0.002
0.004
Nest A Nest B Nest C Nest D
Wat
er C
onte
nt C
hang
e (m
3m
-3)
(F) Average 0.6 to 15.2 (2 to 50) m (ft)
Figure 4.7. Depth-Averaged, Soil-Water-Content Changes from April 9, 2008, to September 16, 2010, Measured with Neutron Probes at Different Depths (The vertical lines indicate the range of 2σθ with σθ being the standard deviation of water-content change within the layer the average was taken. The depth bgs was relative to the ground surface before barrier construction.)
The soil-water-pressure changes from May 3, 2008 (the approximate time the T Farm barrier was constructed), to September 30, 2010, are shown in Figure 4.8. For Nest TA, there was a small decrease in ψ at all depths because the ground surface conditions were exposed to the atmosphere. For Nests TB, TC, and TD, the soil-water pressure at the 1-m, 2-m, and 5-m depths decreased by 0.7 to 2.4 m, indicating that the soil beneath the barrier became drier at these depths; the changes in ψ at the 10-m depth were relatively small because the drainage water from shallower depths kept moving into the soil at this depth.

4.18
-3.0
-2.5
-2.0
-1.5
-1.0
-0.5
0.0
0.5
1.0
Nest TA Nest TB Nest TC Nest TDPr
essu
re H
ead
Chan
ge (m
)
Instrument Nests
1 m
2 m
5 m
10 m
Figure 4.8. HDU-Measured Soil-Water-Pressure-Head Change Between May 3, 2008, and
September 30, 2010
4.4 Instrument Performance
The instrument performance is assessed against the indicators given in Table 5.2 of the T-TY Monitoring Plan and is given in Table 4.3. All instruments were within the required ranges of performance.
Table 4.3. Instrument Performance in FY10
Monitoring Method Monitoring Component Performance Indicator Within the Indicated
Range? Neutron Moisture Probe Soil-Water Content (θ) 0.75 ≤ SDR ≤ 1.25 Yes Capacitance Probe Soil-Water Content (θ) 0 ≤ θv ≤ θs Yes Heat Dissipation Unit Soil-Water Pressure (ψ) -100 m ≤ ψ ≤ -0.5 m Yes Heat Dissipation Unit Soil Temperature (Tsoil) -5°C ≤ Tsoil ≤ 35°C Yes
Rain Gauge Precipitation (P) Annual value is within ±50% HMS measured P Yes
Thermister Air Temperature (Tair) Annual average is within ±5% HMS Tair
Yes
SDR—standard deviation ratio of neutron count (Chi-value) SC—standard count PSC—previous standard count

5.1
5.0 Summary
This section summarizes instrument functionality and the results of measured soil-water conditions in both the T and TY tank farms.
5.1 System Functionality
Except a couple of days in Nests TC and TD and during the barrier-construction period for TYB, the battery voltage at the meteorological station and instrument Nests in both tank farms remained above 12.0 V, denoting sufficient power for the instruments to be functional. Nest TC stopped working on January 12, 2010, and Nest TD stopped working on December 21 and January 13 because of insufficient battery voltage. These two batteries were replaced on January 14, 2010. Wires in Nest TYB were unhooked, and its battery was not charged between June 23 and August 30 because of the TYISB construction. The air temperature at the TMS and that measured at the HMS were very similar, supporting the functionality of the temperature sensors. The soil temperature as measured by the HDUs produced typical trends with depth and compared similarly to soil-temperature data in FY07, FY08, and FY09, indicating normal function of the HDU sensors when they were used to measure soil temperature. The good agreement of air temperature and soil-temperature measurements indicates normal functionality of the vadose zone monitoring system, except the dates mentioned above for Nests TC and TD due to insufficient battery voltage.
Cumulative precipitation measured at the TMS was less than that measured at the HMS because the T tank farm rain gauge was not heated in winter. The CPs in Nest TC before January 14 were not functional. The CPs in Nest TB before November 15 and the 1.8-m CP sensor in Nest TC after May 25 gave noisy data. Except these, the other CP sensors in both tank farms functioned normally. All the HDUs functioned normally, but some pressure-head values were greater than the upper measurement limit. The values that exceeded the upper limit may indicate wet soil conditions and/or measurement error, but they do not imply a malfunction of the sensors.
5.2 Soil Water Conditions
Similar to those in FY07 through FY09, in FY10, the soil under natural conditions in the T tank farm (Nest TA) was generally recharged during the winter period (November–March) and discharged during the summer period (April–October). Soil water conditions above about 1.5-m to 2-m depth from all three types of measurements (i.e., CP, NP, and HDU) showed relatively large variation during the seasonal wetting-drying cycle. For the soil below the 2-m depth, the seasonal variation of the soil water content was relatively small.
The construction of the TISB was completed in April 2008. In the soil below the surface barrier (Nests TC and TD), the CP-measured water content showed that θ at the soil between 0.6-m and 2.3-m depths was very stable, indicating no weather impacts on soil water conditions beneath the barrier. The NP-measured water content in the soil between about 3.4 m (11 ft) and 12.2 m (40 ft) decreased by 0.007 to 0.014 m3 m-3 since the completion of the barrier. The HDU-measured, soil-water pressure at 1-, 2-, and 5-m decreased by 0.7 to 2.4 m, indicating soil water drainage at these depths of the soil.

5.2
In the soil below the edge of the TISB (Nest TB), the CP-measured water content was relatively stable through the year; the NP-measured water content showed that soil water drainage was occurring in the soil between about 3.4 m (11 ft) and 12.2 m (40 ft) but at a slightly smaller magnitude than those in Nests TC and TD; the HDU-measurements show that the pressure head changes at Nest TB since the completion of the TISB were generally less than those at TC and TD but more than those at TA.
These results indicate that the TISB was performing as expected by intercepting the meteoric water from infiltrating into the soil, and the soil was becoming drier gradually. The barrier also has some effects on the soil below the barrier edge but at a reduced magnitude. There was no significant difference in soil-water regime between the two nests in the TY tank farm because the TYISB was completed just at the last month of the FY.

6.1
6.0 References
ARHCO—Atlantic-Richfield Hanford Company. 1973. 241-T-106 Tank leak investigation. ARH_2874, Atlantic-Richfield Hanford Company, Richland, Washington. Baumhardt RL, RJ Lascano, and SR Evett. 2000. “Soil material, temperature, and salinity effects on calibration of multisensor capacitance probes.” Soil Sci. Soc. Am. J. 64:1940–1946. CHG—CH2M HILL Hanford Group, Inc. 2005. Field Investigation Report for Waste Management Areas T and TX-TY, Rev. 0-A. RPP-23752, Richland, Washington. CSI—Campbell Scientific, Inc. 2004. Model 107 Temperature Probe Instruction Manual. Logan, Utah. CSI—Campbell Scientific, Inc. 2006. Water Matric Potential Sensor Models 229, CE4, CE8. Logan, Utah. Evett SR, JA Tolk, and TA Howell. 2006. “Soil profile water content determination: sensor accuracy, axial response, calibration, temperature dependence, and precision.” Vadose Zone Journal 5:894–907. Flint AL, GS Campbell, KM Ellett, and C Calissendorff. 2002. “Calibration and temperature correction of heat dissipation matric potential sensors.” Soil Sci. Soc. Am. J. 66:1439–1445. Myers DA. 2005. Field Investigation Report for Waste Management Areas. RPR-23752, CH2M HILL Hanford Group, Richland, Washington. Paltineanu IC and JL Starr. 1997. “Real-time soil water dynamics using multisensor capacitance probes: laboratory calibration.” Soil Sci. Soc. Am. J. 61:1576–1585. Reece C. 1996. “Evaluation of a line heat dissipation sensor for measuring soil matric potential.” Soil Sci. Soc. Am. J. 60:1022-1028. Rodgers MJ. 2010. Waste tank summary status report for month ending December 31, 2009. HNF-EP-0182, 2010, Rev. 261, Washington River Protection Solutions, Richland, Washington. Ross L. 2007. Tank Farm Plant Operating Procedure - Operate Model 503DR Hydroprobe Neutron Moisture Detection. TO-320-022, B-8. CH2M HILL Hanford Group, Richland, Washington. Routson RC, WH Price, DJ Brown, and KR Fecht. 1979. High-level waste leakage from the 241-T-106 tank at Hanford. RHO-ST-14, Rockwell Hanford Operations, Richland, Washington. Sentek Pty Ltd. 2001. Calibration of the Sentek Pty Ltd Soil Moisture Sensors. Stepney, Australia. Shiozawa S and GS Campbell. 1990. “Soil thermal conductivity.” Remote Sens. Rev. 5:301–310. Ward AL and RS Wittman. 2009. Calibration of a Neutron Hydroprobe for Moisture Measurements in Small-Diameter Steel-Cased Boreholes. PNNL-18539, Pacific Northwest National Laboratory, Richland, Washington.

6.2
X-5 Monte Carlo Team. 2005. MCNP — A General Monte Carlo N-Particle Transport Code, Version 5 Volume I: Overview and Theory. LA-UR-03-1987, Los Alamos National Laboratory, Los Alamos, New Mexico. Zhang ZF, JM Keller, and CE Strickland. 2007. T Tank Farm Interim Surface Barrier Demonstration – Vadose Zone Monitoring Plan. PNNL-16538, Pacific Northwest National Laboratory, Richland, Washington. Zhang ZF, CE Strickland, JM Keller, CD Wittreich, and HA Sydnor. 2008. T Tank Farm Interim Surface Barrier Demonstration -Vadose Zone Monitoring FY07 Report. PNNL-17306, Pacific Northwest National Laboratory, Richland, Washington. Zhang ZF, CE Strickland, JE Field, and DL Parker. 2009. T Tank Farm Interim Surface Barrier Demonstration -Vadose Zone Monitoring FY08 Report. PNNL-18083 FINAL, Pacific Northwest National Laboratory, Richland, Washington. Zhang ZF, CE Strickland, JG Field, and DL Parker. 2010a. T Tank Farm Interim Surface Barrier Demonstration – Vadose Zone Monitoring FY09 Report. PNNL-19123, Pacific Northwest National Laboratory, Richland Washington. Zhang ZF, CE Strickland, JG Field, and DL Parker. 2010b. T-TY Tank Farm Interim Surface Barrier Demonstration – Vadose Zone Monitoring Plan. PNNL-19772, Pacific Northwest National Laboratory, Richland Washington.

PNNL-20144
Distribution
No. of No. of Copies Copies
Distr.1
Local Distribution 6 Pacific Northwest National Laboratory ZF Zhang (2) K9-33 CE Strickland K9-33 MJ Fayer K9-33 AL Ward K9-33 ML Rockhold K9-33
2 Washington River Protection Solutions Inc. JG Field E6-31 DL Parker S7-83