
Presentation: The Increasingly Important Role of Private ... · Hertz Semiconductor $15.0B Kinder...
21
© Copyright 2005 SunTrust Banks, Inc. The Increasingly Important Role of Private Equity Firms in M&A Private Equity 3Q 2006 Review Presentation for the University of Florida Finance Professional Speakers Series November 3, 2006 The data and interpretation in this review are not intended, nor implied to be a recommendation or advice of any form. Please seek the professional advice of a qualified accountant, financial advisor or attorney before making any investment or financial decisions as a result of reading this review. Duplication or transmission of this publication is strictly forbidden. Philip E. Marshall Managing Director – Investment Banking 407.237.5895 [email protected]
Transcript of Presentation: The Increasingly Important Role of Private ... · Hertz Semiconductor $15.0B Kinder...
© Copyright 2005 SunTrust Banks, Inc.
The Increasingly Important Role of Private Equity Firms in M&APrivate Equity 3Q 2006 ReviewPresentation for the University of Florida Finance Professional Speakers Series
November 3, 2006
The data and interpretation in this review are not intended, nor implied to be a recommendation or advice of any form. Please seek the professional advice of a qualified accountant, financial advisor or attorney before making any investment or financial decisions as a result of reading this review.
Duplication or transmission of this publication is strictly forbidden.
Philip E. MarshallManaging Director – Investment [email protected]
2
Biography
B.S. Food & Resource Economics – University of Florida - 1981
Focus on Economics, Accounting, and Finance
Sun Bank, N.A. (SunTrust Predecessor) 1981 - 1983
Management Training Program
Corporate Banking – Agribusiness
MBA - Wharton School – University of Pennsylvania – 1985
Emphasis on Finance
SunTrust Banks, Inc. 1985 – Present
Corporate Banking 1985 – 1988
SunTrust Capital Markets / SunTrust Robinson Humphrey – 1988 to Present
Vice President – Aircraft Leveraged Lease Finance Program
Director – Syndicated Finance Group
Managing Director – Capital Markets Origination
Managing Director – Investment Banking
Introduction
3
Introduction
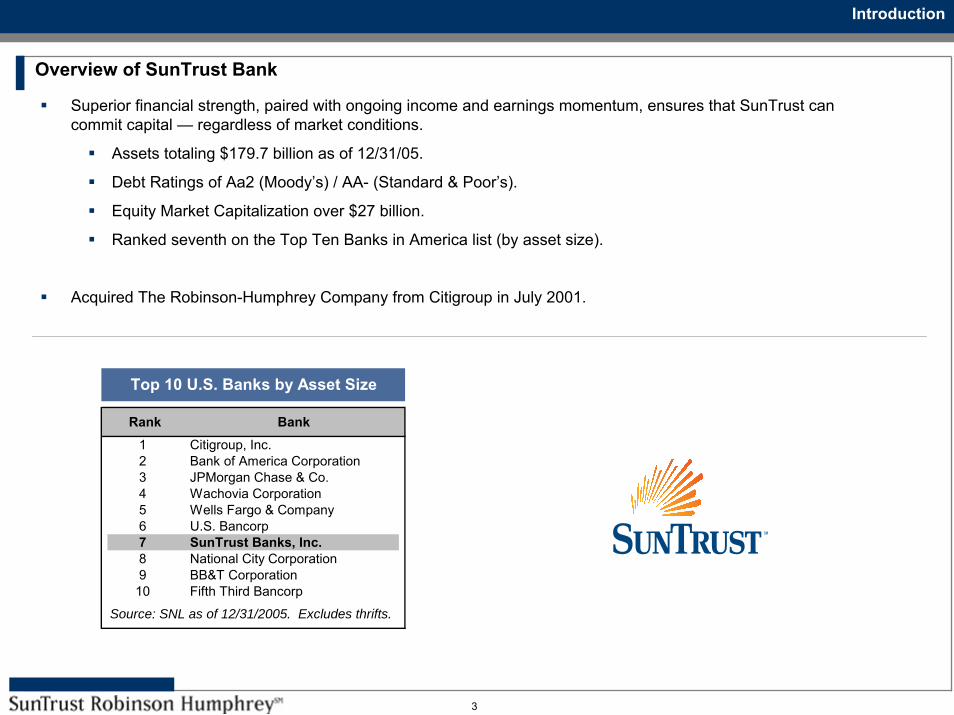
Overview of SunTrust Bank
Top 10 U.S. Banks by Asset Size
Rank Bank1 Citigroup, Inc.2 Bank of America Corporation3 JPMorgan Chase & Co.4 Wachovia Corporation5 Wells Fargo & Company6 U.S. Bancorp7 SunTrust Banks, Inc.8 National City Corporation9 BB&T Corporation
10 Fifth Third Bancorp
Source: SNL as of 12/31/2005. Excludes thrifts.
Superior financial strength, paired with ongoing income and earnings momentum, ensures that SunTrust can commit capital — regardless of market conditions.
Assets totaling $179.7 billion as of 12/31/05.
Debt Ratings of Aa2 (Moody’s) / AA- (Standard & Poor’s).
Equity Market Capitalization over $27 billion.
Ranked seventh on the Top Ten Banks in America list (by asset size).
Acquired The Robinson-Humphrey Company from Citigroup in July 2001.
4
Introduction
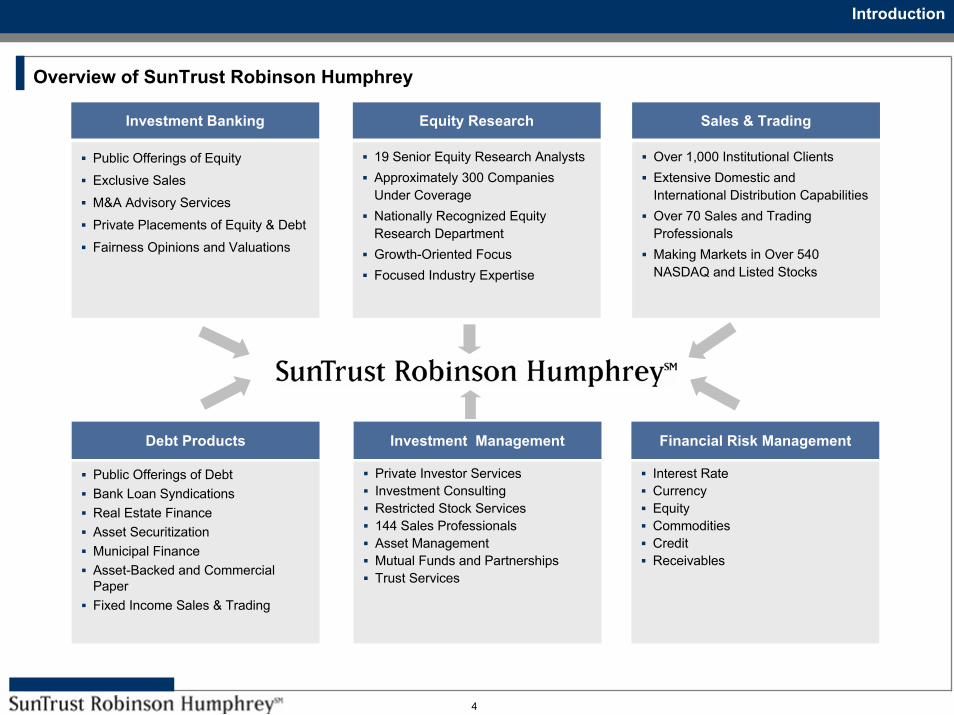
Overview of SunTrust Robinson Humphrey
Investment Banking
Public Offerings of Equity
Exclusive Sales
M&A Advisory Services
Private Placements of Equity & Debt
Fairness Opinions and Valuations
Equity Research
19 Senior Equity Research AnalystsApproximately 300 Companies Under CoverageNationally Recognized Equity Research DepartmentGrowth-Oriented FocusFocused Industry Expertise
Sales & Trading
Over 1,000 Institutional ClientsExtensive Domestic and International Distribution CapabilitiesOver 70 Sales and Trading ProfessionalsMaking Markets in Over 540 NASDAQ and Listed Stocks
Debt Products
Public Offerings of DebtBank Loan SyndicationsReal Estate FinanceAsset Securitization Municipal FinanceAsset-Backed and Commercial PaperFixed Income Sales & Trading
Investment Management
Private Investor ServicesInvestment ConsultingRestricted Stock Services144 Sales ProfessionalsAsset ManagementMutual Funds and PartnershipsTrust Services
Financial Risk Management
Interest RateCurrency Equity CommoditiesCredit Receivables

5
3Q 2006 Review
Private Equity (“PE”) has become one of the most important forces in the domestic and international M&A market
PE Buys One in Three Companies Sold 1
PE owned companies employ one in five people outside the public sector 2
Sponsor Activity Approached $200B in 2005
Strong 3Q 2006 Results 3
$57B in Disclosed Transactions
$5.6B in Sponsor Driven IPO Volume
Buyout firms raised $140B through 3Q 2006, compared to $112B in through 3Q 2005
Through 3Q 2006, 770 control-stake transactions were completed for an aggregate total of $182B
A recent survey by the Association for Corporate Growth and Thompson Financial reports that the private equity market is expecting continued exuberance through the end of 2006 4
Small and Middle Market Buyouts hold the Greatest Potential in Terms of Return
3Q 2006 REVIEW
1 BBC News, 6/20/20062 BBC News, 6/20/2006
3 Buyouts, 10/09/20064 Buyouts, 6/26/2006

6
2006 levels (volume / deals) on track to exceed 2005 levels
More than $150B in deals scheduled to close 4Q or 1Q 2007
On pace for a fifth straight year in terms of growth in annual deal volume
Sponsor-backed IPO volume totals $24.9B through 3Q 2006, down 2% from $25.5B in the same period last year 5
Sponsor-backed Secondary Offering volume totals $28B through 3Q 2006, up 17%, from $24B for the same period in 2005 6
Source: Buyouts, 10/09/20062005 1Q-3Q 2006
3Q 2006 Review
3Q 2006 REVIEW
5 Dealogic – Financial Sponsor Review, 10/05/20066 EBID
(in Billions)
U.S. BASED DEAL VOLUME (BY QUARTER)
12
4 4
20
16
40
52
10 11 8 12
38
42
73
11
5
12
20
37
57 57
9
4
17
42
46
59
$0
$10
$20
$30
$40
$50
$60
$70
$80
2000 2001 2002 2003 2004 2005 2006
(in Billions)
DEALS VOLUME AND FUNDRASING GROWTH2005 vs 1Q-3Q 2006
$182$198$140
$182
$0
$50
$100
$150
$200
$250
Deals Completed Buyout Funds Raised

7
The Rise of Private Equity
Last Year, All But Four Of the Largest Twenty Generators of Investment Banking Fees Were Private Equity Groups
3Q 2006 REVIEW
2005 2001
Rank Company Name Total Fees ($MM) Rank Company Name Total Fees ($MM)
1 Blackstone Group 305 1 Altria Group 257
2 KKR 304 2 France Telecom 250
3 Telefonica 296 3 Vodafone Group 230
4 Warburg Pincus & Co 295 4 Koninklijke KPN 224
5 Carlyle Group 264 5 BT Group 223
6 Goldman Sachs Merchant Banking 262 6 Nippon Telegraph & Telephone 216
7 Apax Partners 245 7 Tyco International 189
8 Thomas H Lee 240 8 KKR 174
9 Apollo Management 217 9 Agere Systems 168
10 EDF 201 10 Time Warner 166
11 Texas Pacific Group 197 11 Orange 162
12 Gazprom 194 12 AT&T Wireless 160
13 CVC Capital Partners 189 13 Charter Communications Hldgs 152
14 Permira Advisers 182 14 Deutsche Telekom 146
15 Cinven Limited 177 15 Calpine Corp 145
16 Suex 175 16 Adelphia Communications Corp 144
17 Ripplewood Holdings 165 17 Warburg Pincus & Co 140
18 3i Group 161 18 JP Morgan Partners 139
19 CSFB Private Equity 160 19 Telecom Italia 135
20 First Reserve Corporation 159 20 Sprint Corp 134
TOTAL $4,388 TOTAL $3,554
Source: Thompson Financial / Freeman & Co. Note: rankings exclude financial institutions and governmentsClosed end funds' ECM activity is excluded
INVESTMENT BANKING FEES - M&A, ECM, DCM, LOANS
8
Current Macro Trends in the Market
Growth of the Mega Deal
Convergence of Hedge Funds / Private Equity Funds
Trend to Long Term Outlook
Attractive Debt Markets Environment
Lower Return Expectations
3Q 2006 REVIEW

9
HCA$21.3B
FreescaleHertz Semiconductor
$15.0B Kinder Morgan $16.2BSunGardData Systems$11.3B
VNU$8.8B
Texas GencoToys 'R' Us $8.3B$6.6B Aramark Royal
$5.9B PhilipsSemiconductor
Dunkin' Brands Business$2.4B $5.5B
● ● ● ● ● ●Bain Capital ● ●
● ● ● ●● ● ● ● ●
Merrill Lynch ●● ● ●
● ● ●J F A M J J A S O N D J F M A J J A S O
2005 2006
Current Fund Size
CARLYLE GROUP BLACKSTONE GROUP **
Texas Pacific Group
AWASH IN CASH
Thomas H. LeeM M
Carlyle Group
Blackstone GroupKohlberg Kravis Roberts
TEXAS PACIFICGROUP
KOHLBERG KRAVIS ROBERTS*THOMAS H. LEE
$13.5B
$7.5B $8B$10B $14B $15.6B
Private Equity ActivityRecent high profile acquisitions involving some of the biggest private equity firms, and deal value excluding net debt, at announcement date
Mega Deals Successfully Completed
GROWTH OF THE MEGA DEAL
Source: Wall Street Journal / Weekend Edition – 6/03/2006, Capital IQ, 10/03/2006, Dow Jones 10/18/2006
* Does not include recent $5B IPO** Blackstone intends to add $5B to its $15.6B fund
10
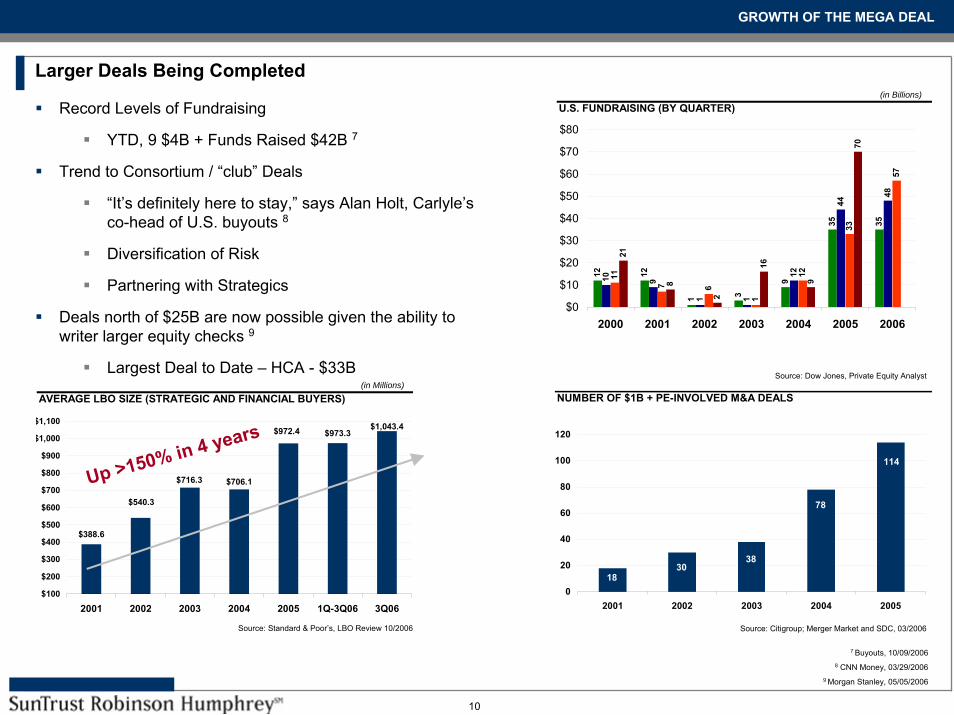
(in Millions)
AVERAGE LBO SIZE (STRATEGIC AND FINANCIAL BUYERS)
$388.6
$973.3$1,043.4
$706.1$716.3
$972.4
$540.3
$100
$200
$300
$400
$500
$600
$700
$800
$900
$1,000
$1,100
2001 2002 2003 2004 2005 1Q-3Q06 3Q06
(in Billions)
U.S. FUNDRAISING (BY QUARTER)
12 12
1 3
9
35 35
10 9
1 1
12
44
48
11
7 6
1
12
33
57
21
8
2
16
9
70
$0
$10
$20
$30
$40
$50
$60
$70
$80
2000 2001 2002 2003 2004 2005 2006
Larger Deals Being Completed
Up >150% in 4 years
Record Levels of Fundraising
YTD, 9 $4B + Funds Raised $42B 7
Trend to Consortium / “club” Deals
“It’s definitely here to stay,” says Alan Holt, Carlyle’s co-head of U.S. buyouts 8
Diversification of Risk
Partnering with Strategics
Deals north of $25B are now possible given the ability to writer larger equity checks 9
Largest Deal to Date – HCA - $33B
GROWTH OF THE MEGA DEAL
7 Buyouts, 10/09/20068 CNN Money, 03/29/2006
9 Morgan Stanley, 05/05/2006
Source: Standard & Poor’s, LBO Review 10/2006 Source: Citigroup; Merger Market and SDC, 03/2006
Source: Dow Jones, Private Equity Analyst
NUMBER OF $1B + PE-INVOLVED M&A DEALS
114
78
1830
38
0
20
40
60
80
100
120
2001 2002 2003 2004 2005
11
Its Getting Blurry in Here
2005 saw numerous high-profile examples of hedge funds taking on the long-term control investing due to overcrowding in its traditional short-term “trading” space, the influx of investor cash and recent regulatory amendments to lockup periods. 10
Hedge Funds Acting More like Buyout Funds:
In April, GMAC was acquired for $7.3B by a consortium led by Cerberus Capital Management, a NY-based hedge fund manager.
In February 2006, Harvard Business School reported that NY-based Freeman & Co. estimated “side-pocket”investments accounted for about 7% of hedge fund investments last year, a figure likely to go north of $100B in 2006. 11
In 2005, Circuit City was acquired for $3.25B by Boston-based hedge fund manager Highfields Capital Management.
In 2005, Beverly Enterprises, a US nursing home chain, rejected a bid worth $1.41B from an investor group that included hedge fund Appalossa Management.
Private Equity Funds Acting More like Hedge Funds:
The Carlyle Group launched two hedge funds earlier this year.
Blackstone Group, the world’s biggest buyout fund, has a hedge-fund unit with about $9B in assets.
Carl Ichan, legendary Wall Street raider, is launching his own hedge fund.
Over Time, the Ability to Distinguish the Two will be Blurred:
In February, at a conference in Frankfurt, David Rubenstein, a co-founder of Carlyle Group, said private equity and hedge funds may eventually converge. 12
In 2005, New York-based private equity firm AEA Investors, merged with Aetos Capital, a real estate and hedge fund firm. 13
10 Bank of America, Capital Eyes, 06/200511 Harvard Business School, Journal of Working Knowledge, 02/20/2006
12 Super Return Conference, Frankfurt, Germany, 02/23/200613 The Deal, 02/18/2005
CONVERGENCE OF PRIVATE FUNDS / HEDGE FUNDS

12
What to Expect in the Short Term
More Mergers Between Hedge and Private Equity Funds
More Private Equity Firms Launching Hedge Funds
More Hedge Funds Acting like Buyout Funds
A new breed of alternative investment that offers the investment flexibility of a hedge fund with a long-term investment profile of private equity
CONVERGENCE OF PRIVATE FUNDS / HEDGE FUNDS
13
Trend Towards Long Term Outlook
General Partners can no longer generate strong returns through financial engineering alone
Firms have shifted their strategy, increasing focus on “post acquisition” activities to add value:
Acquiring additional product lines through bolt-on acquisitions
In 1Q 2006, U.S. based PE firms completed at least 50 add-on acquisitions, one of every 4.5 deals closed 14
2005: One of Every 4.6 Deals; 2004: One of Every 6.5 Deals; 2003: One of Every 7 Deals 15
Enhancing Productivity / Growing Earnings
Roster of senior executives "on the bench" who work on specific projects
Specialization in sectors and partner with veterans to serve in executive management
Successful entrepreneurs can individually arrange financial backers
Longer Hold Periods are Now Needed to Actualize These Activities
Need for More “Patient Capital”
Public
KKR - $5B IPO / Apollo $1.5B – IPO
Apollo Failed to Raise its $2.5B Goal
Blackstone, Carlyle, Doughty Hanson have postponed plans for IPOs due to KKR’s poor performance 16
KKR Currently Trading Below Net Asset Value
Much of the capital invested in conservative instruments that return 2 – 3%, while charging a management fee that consumes almost as much as the return
Private
Lindsay Goldberg – Recently Closed New $3.1B, 20 Year Fund 1714 Buyouts, 04/05/2006 15 Buyouts, 04/05/2006
16 Wall Street Journal, 06/13/2006, Buyouts 10/06/200617 STRH Financial Sponsors Group, Capital IQ, 10/18/2006
TREND TO LONG TERM OUTLOOK

14
Perfect Storm of Circumstances
Historically Low Financing Costs
Substantial Liquidity
Flexible Debt Covenants
Robust Supply of Mezzanine Debt
Debt Market Receptive to Dividend Recapitalizations
ATTRACTIVE DEBT MARKETS ENVIRONMENT
15
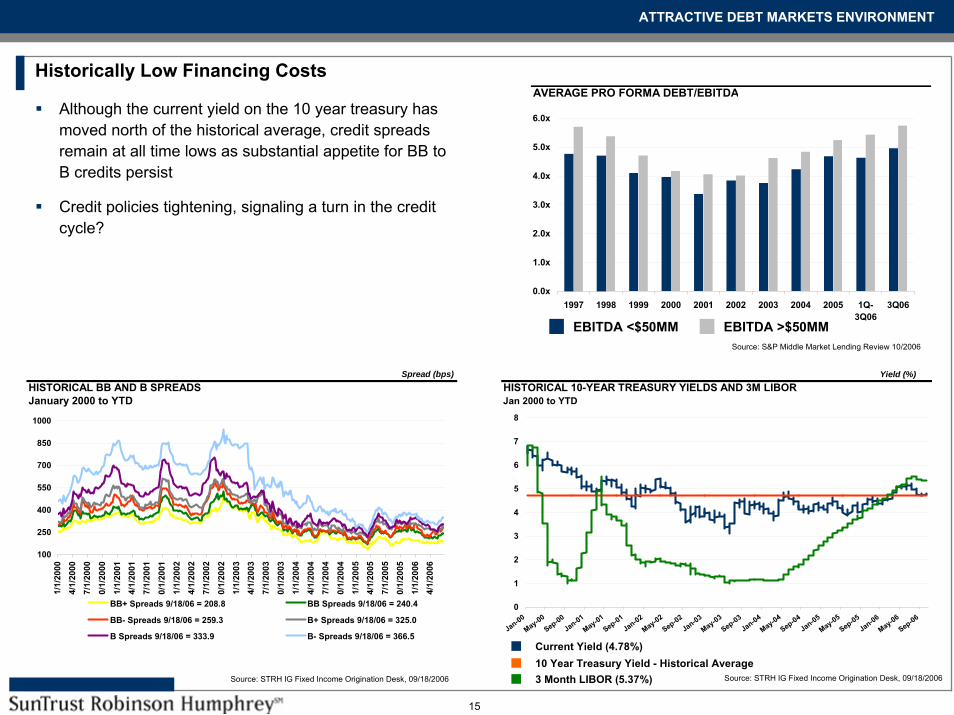
AVERAGE PRO FORMA DEBT/EBITDA
0.0x
1.0x
2.0x
3.0x
4.0x
5.0x
6.0x
1997 1998 1999 2000 2001 2002 2003 2004 2005 1Q-3Q06
3Q06
Spread (bps)HISTORICAL BB AND B SPREADSJanuary 2000 to YTD
100
250
400
550
700
850
1000
1/1/
2000
4/1/
2000
7/1/
2000
10/1
/200
0
1/1/
2001
4/1/
2001
7/1/
2001
10/1
/200
1
1/1/
2002
4/1/
2002
7/1/
2002
10/1
/200
2
1/1/
2003
4/1/
2003
7/1/
2003
10/1
/200
3
1/1/
2004
4/1/
2004
7/1/
2004
10/1
/200
4
1/1/
2005
4/1/
2005
7/1/
2005
10/1
/200
5
1/1/
2006
4/1/
2006
BB+ Spreads 9/18/06 = 208.8 BB Spreads 9/18/06 = 240.4
BB- Spreads 9/18/06 = 259.3 B+ Spreads 9/18/06 = 325.0
B Spreads 9/18/06 = 333.9 B- Spreads 9/18/06 = 366.5
Yield (%)HISTORICAL 10-YEAR TREASURY YIELDS AND 3M LIBORJan 2000 to YTD
0
1
2
3
4
5
6
7
8
Jan-00May-00
Sep-00Jan-01
May-01Sep-01
Jan-02May-02
Sep-02Jan-03
May-03Sep-03
Jan-04May-04
Sep-04Jan-05
May-05Sep-05
Jan-06May-06
Sep-06
Historically Low Financing Costs
Although the current yield on the 10 year treasury has moved north of the historical average, credit spreads remain at all time lows as substantial appetite for BB to B credits persist
Credit policies tightening, signaling a turn in the credit cycle?
Source: STRH IG Fixed Income Origination Desk, 09/18/2006 Source: STRH IG Fixed Income Origination Desk, 09/18/2006
10 Year Treasury Yield - Historical AverageCurrent Yield (4.78%)
3 Month LIBOR (5.37%)
ATTRACTIVE DEBT MARKETS ENVIRONMENT
EBITDA >$50MMEBITDA <$50MMSource: S&P Middle Market Lending Review 10/2006
16
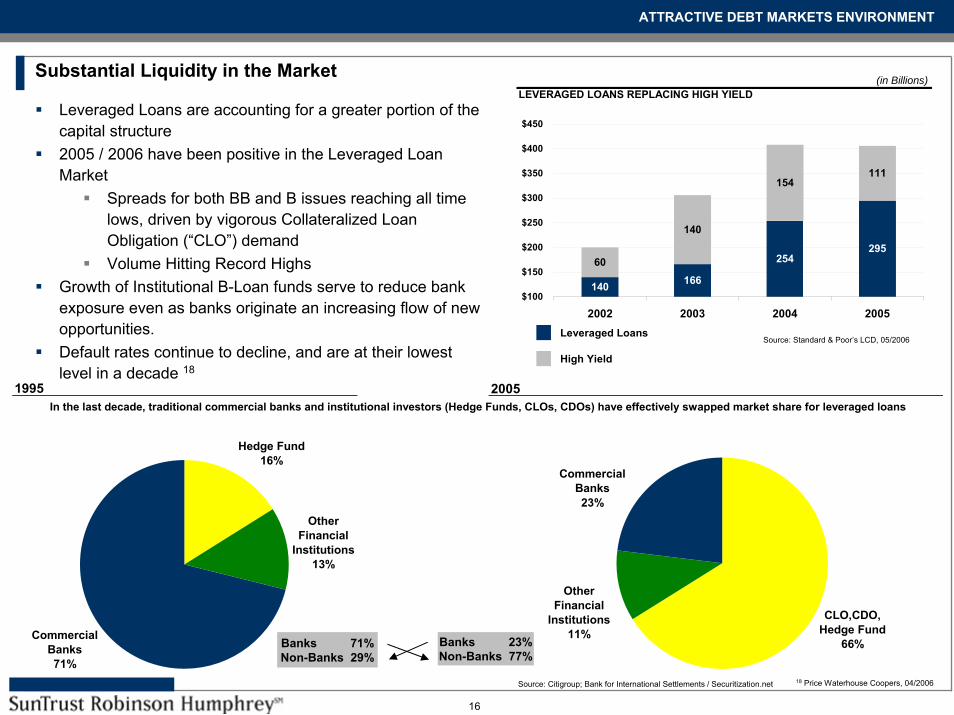
20051995In the last decade, traditional commercial banks and institutional investors (Hedge Funds, CLOs, CDOs) have effectively swapped market share for leveraged loans
Hedge Fund16%
Other Financial
Institutions13%
Commercial Banks71%
CLO,CDO, Hedge Fund
66%
Other Financial
Institutions11%
Commercial Banks23%
Leveraged Loans are accounting for a greater portion of the capital structure2005 / 2006 have been positive in the Leveraged Loan Market
Spreads for both BB and B issues reaching all time lows, driven by vigorous Collateralized Loan Obligation (“CLO”) demandVolume Hitting Record Highs
Growth of Institutional B-Loan funds serve to reduce bank exposure even as banks originate an increasing flow of new opportunities.Default rates continue to decline, and are at their lowest level in a decade 18
Substantial Liquidity in the Market
High Yield
Leveraged LoansSource: Standard & Poor’s LCD, 05/2006
Source: Citigroup; Bank for International Settlements / Securitization.net
Banks 71%Non-Banks 29%
Banks 23%Non-Banks 77%
ATTRACTIVE DEBT MARKETS ENVIRONMENT
18 Price Waterhouse Coopers, 04/2006
(in Billions)LEVERAGED LOANS REPLACING HIGH YIELD
140 166
254295
60
140
154111
$100
$150
$200
$250
$300
$350
$400
$450
2002 2003 2004 2005
17
Flexible Debt Covenants
Institutional and Pro Rata Loans
More borrowers are turning to the loan markets as they typically do not carry prepayment penalties 19
Explosive demand for CLO products has enabled less restrictive loan terms with fewer covenants and higher leverage levels
Quiznos Master LLC bypassed the HY market entirely
Quiznos sold a majority stake to JP Morgan Partners, debt financing provided ($925MM) entirely in first and second-lien debt
Public High Yield (“HY”)
Recent Public HY offerings during March and April (Nutro Products, AutoNation, Wood Resources and AngiotechPharmaceuticals) have all featured lower than normal call structures
Eight-year offerings by Angiotech, Nutro, and AutoNation had three year NC, while Wood Resources’ seven-year offering had a one-year NC
Issuers are getting the reduced NC provisions essentially for free
Bond investors are desperate enough for new paper to yield to the issuer’s demands without making them pay
19 Buyouts, 05/01/2006
ATTRACTIVE DEBT MARKETS ENVIRONMENT

18
Robust Supply of Mezzanine Debt
Three Month Libor has increased by almost 200 bps over the past 12 months, and has increased by about 90 bps since the beginning of 2006
2nd Lien no longer a more attractive option than fixed rate Mezzanine
Overall, the presence of 2nd Lien in middle market deals has declined dramatically from its peak
Economic Trends are Favorable for Mezzanine
Rising Interest Rates
Current Economic Cycle Drawing Closer to an End
Mezzanine lenders are reacting to the changing environment
Mezzanine Getting Cheaper
Three to four years ago, lenders were getting 18-20% interest rates inclusive of 6-7% warrants
Deals done today in the area of 14%, inclusive of 1-4% warrants.
Equity Co-Invest
ATTRACTIVE DEBT MARKETS ENVIRONMENT
Source: Merrill Lynch Middle Market Commentary, 09/2006
as % of Institutional Volume
SECOND-LIEN MIDDLE MARKET VOLUME($50MM EBITDA or Less)
0.0%
2.0%
4.0%
6.0%
8.0%
10.0%
12.0%
14.0%
16.0%
18.0%
20.0%
1997 1998 1999 2000 2001 2002 2003 2004 2005 1Q-3Q06
3Q06
19
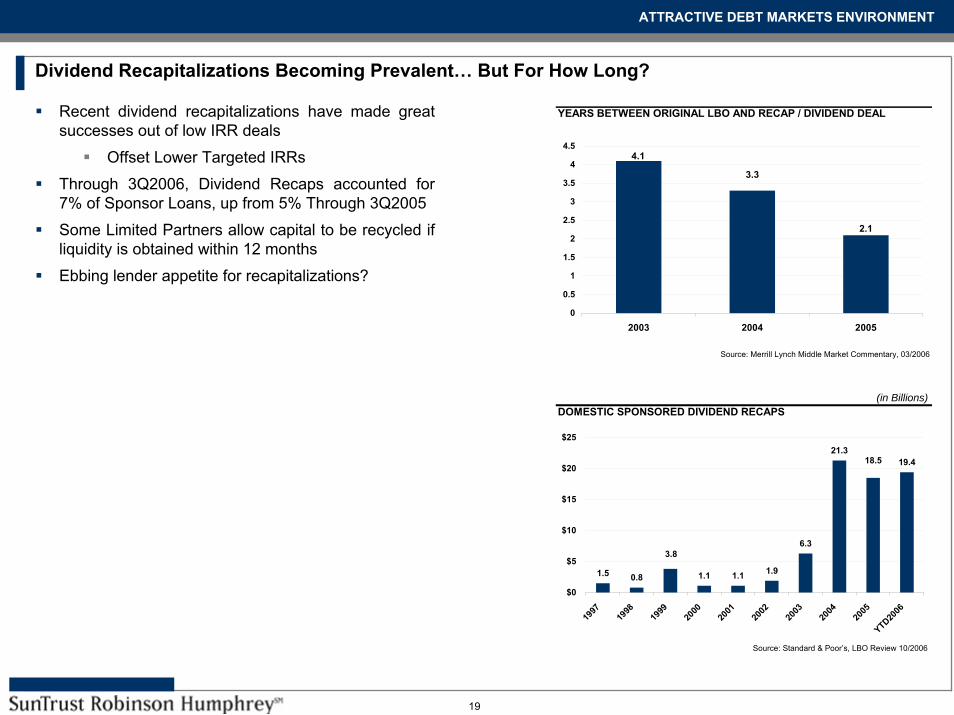
Recent dividend recapitalizations have made great successes out of low IRR deals
Offset Lower Targeted IRRs
Through 3Q2006, Dividend Recaps accounted for 7% of Sponsor Loans, up from 5% Through 3Q2005
Some Limited Partners allow capital to be recycled if liquidity is obtained within 12 months
Ebbing lender appetite for recapitalizations?
Dividend Recapitalizations Becoming Prevalent… But For How Long?
Source: Standard & Poor’s, LBO Review 10/2006
Source: Merrill Lynch Middle Market Commentary, 03/2006
ATTRACTIVE DEBT MARKETS ENVIRONMENT
(in Billions)DOMESTIC SPONSORED DIVIDEND RECAPS
1.5 0.8 1.1 1.1 1.9
6.3
21.319.4
3.8
18.5
$0
$5
$10
$15
$20
$25
1997
1998
1999
2000
2001
2002
2003
2004
2005
YTD2006
YEARS BETWEEN ORIGINAL LBO AND RECAP / DIVIDEND DEAL
2.1
4.1
3.3
0
0.5
1
1.5
2
2.5
3
3.5
4
4.5
2003 2004 2005

20
AVERAGE EQUITY CONTRIBUTION
0%
5%
10%
15%
20%
25%
30%
35%
40%
45%
1997 1998 1999 2000 2001 2002 2003 2004 2005 1Q-3Q06
3Q06
Downward Pressure on Returns
20042003
LOWER RETURN EXPECTATIONS
Average EBITDA Multiples on the RiseLarger Deals More ExpensivePurchase price multiples for mid-market LBOs(<$50MM) remain at a 10 year high 20
Substantial LiquidityEstimates of $300B in funds available, $1T in purchasing powerEstimates of more than 100 funds with over $1B in management 21
Mega Funds Emerging ($10B +)Same Funds Chasing the Same Opportunities
Sponsor to Sponsor trades accounted for 16% of 1Q 2006 transactions 22
2005
20 Buyouts, 10/03/200621 Morgan Stanley, 05/05/200622 Buyouts, 04/03/2006
Source: Standard & Poor’s LBO Review 10/2006
Source: TA Associates, Annual LP Meeting, 2006
1Q-3Q 2006
Source: Standard & Poor’s LBO Review, 10/2006EBITDA >$50MMEBITDA <$50MM
TARGET RETURNS ON INVESTMENTS
0% 10% 20% 30% 40% 50% 60%
1998-2001
2001-2003
2004- Current
LBO PURCHASE PRICE / ADJUSTED EBITDA MULTIPLES
6.4
7.57.5
8.18.4
7.3
8.0
8.5
6.7 6.96.96.8
4x
5x
6x
7x
8x
9x
$100-$249MM $250-$499MM >$500MM
21
Expect Public Equities to Deliver 6-8% Returns
Expect Private Equity to Deliver 300-500 bps Over Public Equities
9-13% Returns
Big State Pension Funds and International Investors are Creating Overwhelming Demand
Good IRR Results and Distributions for 2005-2006
Will Sustain Demand for Several Years
Prefer Firms with Differentiated Strategies and Value Added
Target 18-22% Net Returns, will be Satisfied with 12-15%
LP Expectations
LOWER RETURN EXPECTATIONS