
Presentation on irish property market trends 2014 to 2016 (free company health check class) matthew...
30
The Irish Property Market pre 2014 up to now 20/08/2016 presented by Matthew Scott
-
Upload
matthew-scott -
Category
Real Estate
-
view
72 -
download
1
Transcript of Presentation on irish property market trends 2014 to 2016 (free company health check class) matthew...

The Irish Property Market pre 2014 up to now
20/08/2016 presented by Matthew Scott

OverviewIn today’s class I will breakdown the key trends and performance indicators in the Irish
real estate market into three time periods:
Pre 2015
2015
2016

Key stats and figures Pre 2015
● 2014 totalled 43,100 sales transactions
worth a combined value of 9.3 billion
Euro (up from 6 billion in 2013)
● Home Ownership in Ireland was 78%
across all property dwellers
● 2009 sales and rental listings were
60,000 and 16,000 nationwide.
● 2013 was the peak year for irish
citizens immigrating peaking at
52,000, EU and rest of world citizens
coming to Ireland reached levels of
9,000 and 25,000 per year
● Private residential completions for
homes and apartments peaked in 2007
resulting in 78,211 and 19, 946 new
builds
2015
● 2015 totalled just over 48,000 sales
transactions and increased to 10.6
billion Euro
● At an average of 1.5% commission per
sale real estate agencies would have
made 159 million Euro
● Stock levels reached a nine year low
with 24,000 sales and 3,600 rental
properties
● In Dublin under the current stock
levels there would have been 27 sales
listing per 1000 people, and
nationwide 62.
● 27,000 residential units were under
completion, with only 11,000 entering
the market (up from 8,300 in 2014)
● House prices up 2.7% in Dublin, 13%
nationwide
2016 so far
● 2.6 billion Euro has already been
invested in sales over H1 2016
● Dublin has the lowest vacancy rates of
4%, compared to leitrim (30%),
Donegal (28%) and Kerry (24%)
● 40,000 buy to let properties have left
the market since 2011
● Rental market now includes over
700,000 citizens with 10,000 plus new
entrants per month
● Increased job opportunities due to
international tech/IT firms
● First time buyers age is now 33,
compared to 29 in 2005
● 14,000 new completions expected by
the end of the year
● In 300 investment deals 9,000
residential units bought in bulk from
2010

Pre 2015 real estate market

How did the property bust affect the market?

The Irish construction industry during the peak year of 2006 employed 386,000 people and represented 19% of the workforce
By 2014 it had halved to just 186,000 people and 7% of the workforce.
In turn this led to new residential unit construction output declining heavily from 78,211 new homes and 19,946 new apartments to new lows of 7,553 and 2,250 by 2014
Mortgage activity 2006 to 2007 at its height was 114,600 applications and a combined value of 32 billion Euro
Annual Housing Completions by
Type
House Apartments
Year House Apartment
2004 60448 16106
2005 62522 18035
2006 73073 19946
2007 58936 18691
2008 38513 12811
2009 21272 5148
2010 12514 2088
2011 9146 1340
2012 7495 993
2013 7379 922
2014 8766 2250
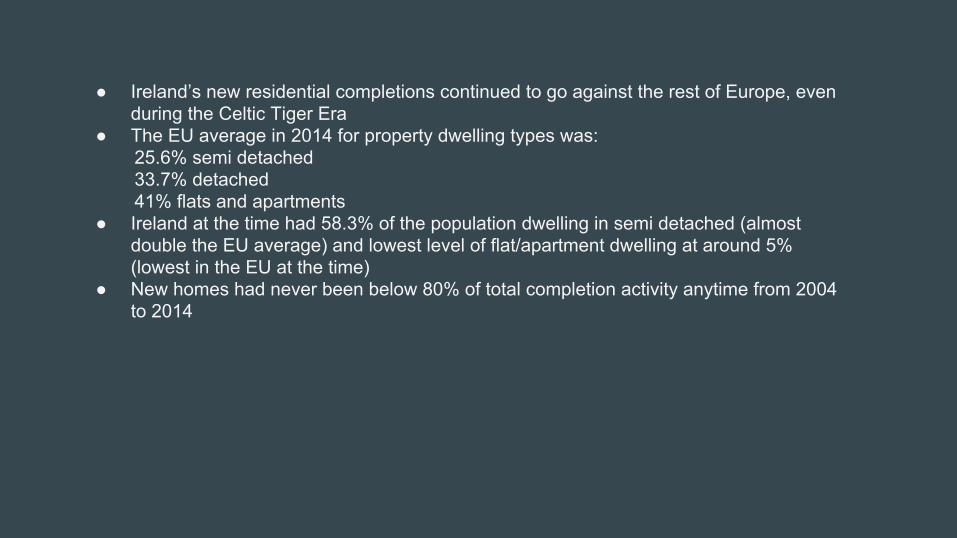
● Ireland’s new residential completions continued to go against the rest of Europe, even during the Celtic Tiger Era
● The EU average in 2014 for property dwelling types was: 25.6% semi detached 33.7% detached 41% flats and apartments
● Ireland at the time had 58.3% of the population dwelling in semi detached (almost double the EU average) and lowest level of flat/apartment dwelling at around 5% (lowest in the EU at the time)
● New homes had never been below 80% of total completion activity anytime from 2004 to 2014

2015 Irish Market Performance

Year Total Residential Sales Value
2013 6 billion Euro
2014 9.3 billion Euro
2015 10.6 billion Euro
Transactions from 2014 to 2015 increased by over 6,000 transactions 43,1000 to over 48,000 in 2015

Sales listingsYear Sales Listings
2009 60,000
2014 30,000
2015 25,000
59% of all the sales transactions across the country took part in Dublin!

Building trends 2015● Irish new homes pre 2014 were almost equal to the EU 28 average of 90.7 SQ M (at
88.3 SQM) This changed dramatically in 2014 when new homes started to get smaller
● The EU 28 average from 2014 increased to 101 SQ M, as Ireland fell to the second smallest homes just above the UK (87.7 SQM)

Mortgage Activity 2006 to 2015 Year Number of Mortgage Applications
2006 114,600
2011 12,900
2013 17,056
2014 25,500
2015 26,756
The peak year of 2006 totalled 32 billion year, the reason I have included the year of 2011 is it that replicated the low levels of the 1970’s. As of 2015, Mortgage applications were worth 4.7 billion Euro. Borrowing from the central bank will be getting closer to the 8 billion mark over the coming years (29% growth projected by the end of 2016)

First Time Buyers and Mortgage Repossessions
● Despite Mortgage applications picking up year on year from 2011, it has not all been good news● Existing mortgage holders from 2007 have lost an alarming amount of 17.6 billion Euro in property value● The number of repossessions form 2014 to 2015 has increased by 200% (333 to 1000), Cork at 123
and Dublin 116 have the most repossession activity. ● Over 72 million Euros has been wrote off in 641 personal insolvency cases in 2015, as 4 billion Euro of
defaulted payments covers both family and investment properties● 43% of mortgage holders from 2011 were now experiencing negative equity with an average loss of
66,300 Euro. ● The average mortgage debt ratio of Europe in 2015 was 37%, Irish mortgage holders came in at 73%● At the end of 2015, Ireland had 38,000 homes with rents overdue by 720 days, 18,000 from 361 to 720
days and 12,000 180 to 361 days.● Ireland was amongst the worst countries for available credit at -13%, only beaten by the Ukraine (-32%),
the top European performers were Sweden (+4%), Norway (+3%) and Malta (+2%)

It’s not all bad news!● First time buyers in Quarter 1 to 3 2015 borrowed 1.685 million Euro over 10,000
transactions, increasing the average mortgage approval figure the previous year (1.877 million Euro over 11,476 transactions)
● The beginning of the year saw first time buyers averaging mortgages at 220,000 but by the end of Quarter 3 2015 increased to 250,000 plus.
● House prices increased by 2.7% in Dublin and 13% outside of the capital● Dublin houses were selling 7% above the listed price due to the shortage of stock
and on average within 3 months of entering the market. ● Cash buyers represented 46% of the buyers market in 2015, with an extremely
strong performance in Quarter 4 (8,103 out of 12,065 completed sales transactions)
● It is believed that Dublin as of 2015 had 32,000 millionaires, ranking it well inside the top 30 wealthiest cities in Europe.
● 27,000 new residential units were under planning stage from the end of 2015 up till February 2016 according to the CIS (construction Industry services) with Dublin being the desired location for 165 out of all 336 nationwide projects (49%)

The Number of real estate agency complaints logged increased from 198 in 2014 to 283 in 2015
In 2015, the RTB (formerly the PRTB) saw the number of complaints filed for unfair conduct complaints rise from 185 to 313, with 66 disputes already logged Quarter 1 2016. These complaints mostly regarded cases whereby, the rent being paid was higher than the true market rate. Rent deposits and arrears alone were the reason for 1,200 cases.
Warning Signs!

2016 Irish real estate market

Quarter 1 2016 Dublin

Top performing Dublin regions● Dublin has the lowest vacancy rate in the country (4%), with the worst being Leitrim (30%), Donegal (28%) and Kerry
(24%)● Secondary homes due to the lack of new builds entering the market dominate (2,822 to 194 across all dublin regions)● 2 bedroom apartments rental growth is highest across all property types at 5.1% to 11.21%, closely followed by 1
bedroom apartments (3.46 to 9.84%) and 3 bedroom semi detached houses (5.07% to 9.79%) ● Total sales in Quarter 1 2016 totalled 1.73 billion, average sales price of 386,055 Euro (the country average being
220,000 Euro)● Ireland and Dublin especially is fast becoming an international Hub for large international corporations, seeing a projected
20,000 irish citizen return to Ireland over the next few years. Dublin ranks 16th for starting up new businesses enterprises and 4th for a friendly attitude towards foreign residents.
● 63% of residents in ireland now live in urban areas (still below the EU average of 75%)

New Home SalesOnly 194 new home sales were completed in Quarter 1 2016, the most popular regions in Dublin were:
Dublin 15- 39 new home sales
Dublin 18- 31 new home sales
Dublin 16- 25 new home sales
Dublin 10, 12 and 22 on the other hand all combined had no new home sales.

Top average sales prices in Dublin Q1 2016
Dublin 24- 591,512 Euro
Dublin 14- 522,708 Euro
Dublin 18- 515,942 Euro
Daft and myhome.ie in terms of available sales listed properties had 4,057 and 4,711 properties.

Top sales areas in Dublin Q1 2016Dublin 4- 187.88 Million Euro
Dublin 15- 121.67 Million Euro
Dublin 18- 111.95 Million Euro

Who is buying?The most active age groups for purchasing homes are:
35-44 (59.8% ownership) and 45-54 (49% ownership), on top of this 35-44 are three times more likely to be a cash buyer than the 0-24 age range at 9.1%, and 45-54 ten times more likely (29.6%)

Renting in Dublin ● The Greater Dublin Area is projected to grow by an additional further 400,000 by
2031 (plus an additional 231,000 immigrants. No other country is close to this level of growth as the second largest population growth is expected to be the Mid-West by 200,000.
● Dublin 17 was the only region to suffer from a rental decrease in all property types 1, 2 and 3 bedrooms (-0.76%, -1.84%, -1.98%) In comparison Dublin 22, 13 and saw growth in all property types as rental growth ranged from 11.21% to 9.25%
● The rental prices in Dublin are now double that of the rest of the country (1,435 Euro to 727 Euro)
● Daft and myhome.ie in terms of listed rental properties had 1,330 and 607 by the end of Quarter 1 2016.

Who is renting in Dublin The age range most likely to rent is 0-24 with 74.2% renting privately, followed closely by 25-34 (44.3%). The next age range 35-44 heavily reduces to 19.4% private renting and 59.8% home ownership

Quarter 2 2016 ● The regions with the most sales transactions were North County Dublin (257 down from 373 Quarter 2
2015), Dublin 15 (283 to 326) and Dublin 24 (284 to 219) ● Only County Dublin saw it sales transactions increase from 147 to 212.● Quarter 2 2015 had 4,115 sales transactions, this reduced to 2,798 sales transactions in Quarter 2
2016 (total sales value reduced from 1.4 billion to 1.1 billion Euro) ● Dublin 20 and 10 were amongst the weakest performers in Quarter 1, this performance continues into
Quarter 2 (34 to 12 transactions and 32 to 24 transactions) The low number of transactions also led to low sales activity of 3.09 million and 3.18 million Euro.
● Dublin 4, North County Dublin and Dublin 15 led the way in total sales value (130.15 million Euro , 119.52 million Euro and 85.52 million Euro) Both Dublin 4 and 15 were the top two areas in Quarter 1 2016, even with total sales reduced.
● Dublin 14, 3 and 2 all saw their quarter 1 performance almost halved in Quarter 2 2016 (86.35 to 48.79 million Euro, 49.2 to 28.5 million Euro and 26.2 million to 14 million Euro)

Quarter 2 2016 average sale prices● The largest average sale price increases were located in North
County Dublin (251,241 to 320,776 Euro), Dublin 5 (487,152 to 744,973 Euro) and Dublin 4 (584,935 to 1,008,000 Euro)
● Dublin 14 and Dublin 12 experienced the largest price decreases (719, 623 to 567,407 Euro and 346,575 to 281,948 Euro) from Quarter 2 2015 to Quarter 2 2016

Sales and Rental Listings Quarter 2 2016● Dublin 10 and 20 low sales activity was backed up by having a low amount of listed
available sales listings ( 3 and 38 listings) joined by Dublin with 15. ● Dublin 15, 9 and 18 were the most active in sales listings 257,181 and 179, but both
Dublin 15 and Dublin 18 had seen their stock reduced from 391 and 204 sales listings in Quarter 1 2016
● Dublin 2 went from having more rental listings in quarter 1 (38 sales and 121 rentals) to 112 sales and 50 rentals in Quarter 2 2016.
● The most listed rental properties were found in County Dublin (245 rental listings), Dublin 4 (165) and Dublin 18 (102)
● The above listings support a trend that suburban living is becoming more popular than city living, especially as average sale prices are more affordable to a wider market.

Projected construction output in Ireland Year Total Construction Value
2014 9 billion Euro
2015 12.55 billion Euro
2016 Projected to be 15 billion Euro
● The Bruce Shaw institute believe that construction output should be closer to the 20-25 billion mark to release the target set of 25,000 new homes per year from 2014 to 2020.
● New residential units completed has continued to steadily increase from 2013, nearly doubling from 8,300 to a projected figure of 14,000.
● Dublin in Quarter 1 2016 had a total of 13 projects covering 1,113 new residential units (down from 12
projects and 1,222 units Quarter 4 2015)

What challenges do the developers face?● 35,443 new residential units are needed for the population growth expected
between 2014 to 2018 in Dublin alone. From the start of 2016 there is 1,073 new residential units in either under planning stage or planning agreed, surprisingly only 49 projects are onsite.
● Developers are now under huge pressure since the Paris treaty was signed, as the nearly zero energy efficiency standards (NZEB) has meant that the major challenges such as increased building costs, lack of labour and the re-education of the current labour force have been made ever clearer
● The Irish Green Building Council are looking to make new builds ongoing more environmentally friendly and reduce the level of greenhouse gases from present levels by 40-60%. By the end of the year Ireland has to submit its “Natural Renovation Strategy” to outline its plan to save up to 195 million Euro in building energy costs and maintenance by 2020.

What challenges do the developers face?
● It is well known to the Construction Industry Federation that not many developers have a clear understanding of the new banking regulations. This is a major weakness where they are now unable to get 100% funding from the bank
● New banking regulations now mean that only 65% of the project funds can provided by the bank, meaning an additional 35% is required from a third party or mezzanine funding party. The levels of profit per unit continues to drop so now sharing equity means building are harming their already declining profits but also increasing their overall risk.
● The most recent SCSI report for new homes costs and activity had a survey speaking to developers about their intentions to deliver new residential units to the market, 61% in both homes and apartments would deliver less than 20 new units. Development for over 50 and 100 residential units for houses and apartments, is only 6 and 2% and 11 and 11%.
● The cost of new building according to the SCSi as of Quarter 2 2016 is around 330,000 Euro, whilst the average sales price in Dublin is 285,000 (so there is presently a shortfall of 45,000 Euro)


![Matthew G. Knepley - University at Buffaloknepley/docs/CV_Long.pdf · 2019-08-22 · [26] Peter R. Brune, Matthew G. Knepley, and L. Ridgway Scott. Unstructured geometric multigrid](https://static.fdocuments.in/doc/165x107/5f09afef7e708231d428087c/matthew-g-knepley-university-at-buffalo-knepleydocscvlongpdf-2019-08-22.jpg)
