Presentation of the Teacher Advancement Program by Lewis C. Solmon Senior Vice President and
78
Presentation of the Teacher Advancement Program by Lewis C. Solmon Senior Vice President and Director of Teacher Advancement Program Milken Family Foundation November 21, 2002 National Conference on Teacher Compensation and Evaluation
-
Upload
fletcher-moses -
Category
Documents
-
view
30 -
download
1
description
National Conference on Teacher Compensation and Evaluation. Presentation of the Teacher Advancement Program by Lewis C. Solmon Senior Vice President and Director of Teacher Advancement Program Milken Family Foundation November 21, 2002. NCLB : Qualifications for Teachers. - PowerPoint PPT Presentation
Transcript of Presentation of the Teacher Advancement Program by Lewis C. Solmon Senior Vice President and
Presentation of the Teacher Advancement Program
by
Lewis C. Solmon
Senior Vice President and
Director of Teacher Advancement Program
Milken Family Foundation
November 21, 2002
Presentation of the Teacher Advancement Program
by
Lewis C. Solmon
Senior Vice President and
Director of Teacher Advancement Program
Milken Family Foundation
November 21, 2002
National Conference on
Teacher Compensation and Evaluation
National Conference on
Teacher Compensation and Evaluation

Any new teacher hired must meet the requirements of a “highly qualified” teacher.
States must establish a plan to ensure that by the end of 2005-06 all teachers in core academic subjects must be highly qualified. The plan must include annual measurable increases towards the goal.
States and districts must begin to report progress toward ensuring all teachers are highly qualified by 2005-06.
NCLB: Qualifications for Teachers

NCLB: “Highly Qualified”NCLB: “Highly Qualified”
Fully licensed or certified No waivers or emergency credentials At least a bachelor’s degree Demonstrated subject matter
knowledge though state test Teaching skills also demonstrated
through state test (elementary)


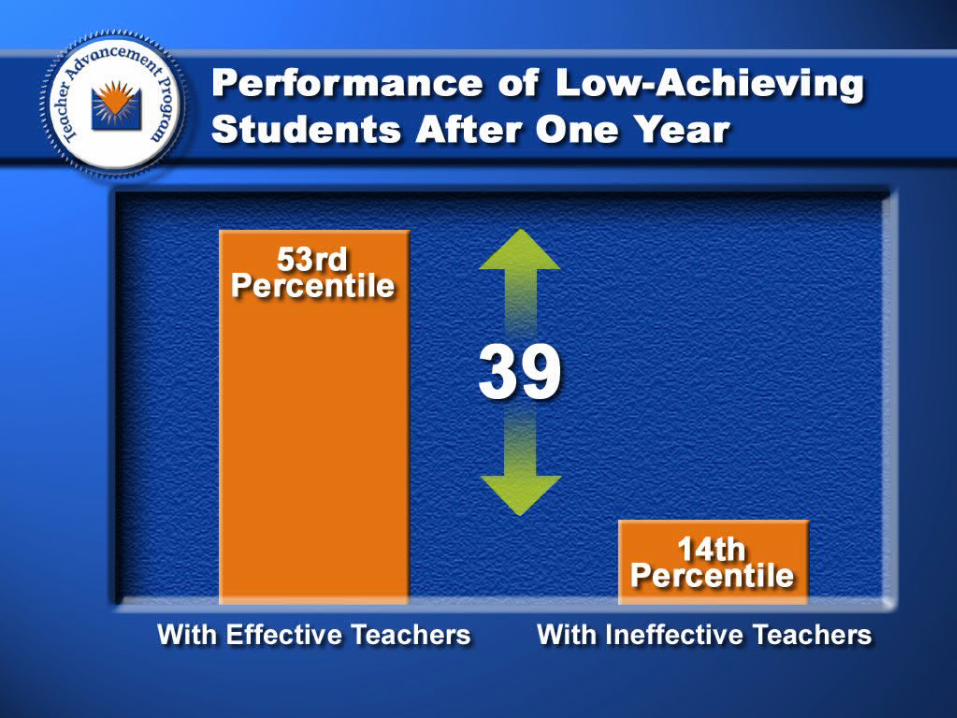
Nothing Matters More Than a Quality TeacherNothing Matters More Than a Quality Teacher
Rivers longitudinal work found that average achieving students assigned to 4 years of ineffective teachers had only a 40 percent chance of passing the Tennessee high school exit examination. The same students assigned to 4 years of effective teachers had an 80 percent chance of passing.
Rivers longitudinal work found that average achieving students assigned to 4 years of ineffective teachers had only a 40 percent chance of passing the Tennessee high school exit examination. The same students assigned to 4 years of effective teachers had an 80 percent chance of passing.
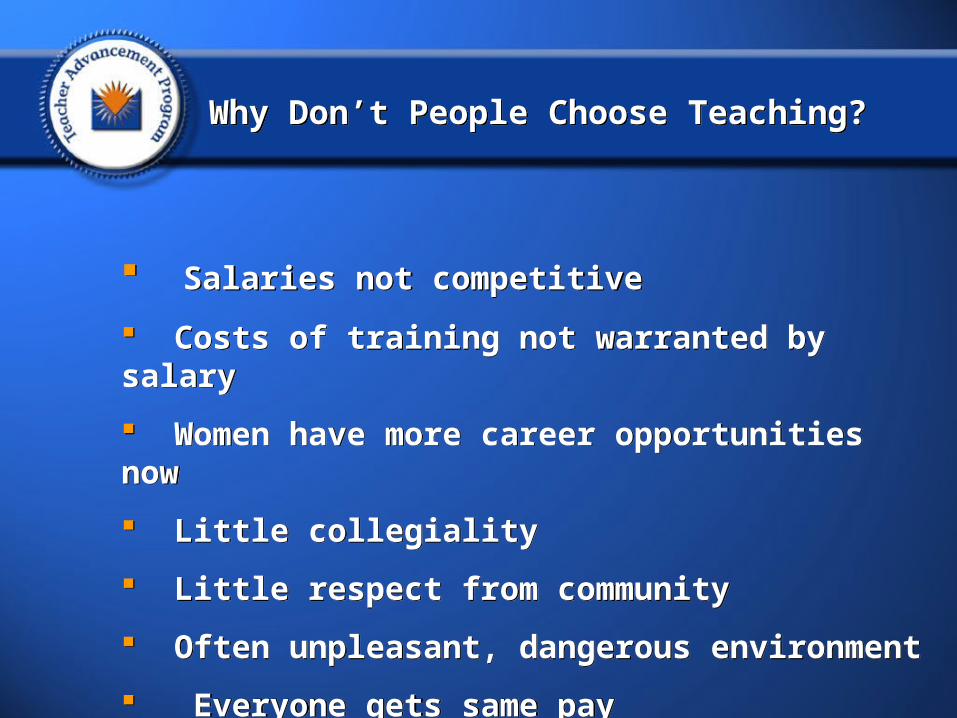
Why Don’t People Choose Teaching?Why Don’t People Choose Teaching?
Salaries not competitive
Costs of training not warranted by salary
Women have more career opportunities now
Little collegiality
Little respect from community
Often unpleasant, dangerous environment
Everyone gets same pay
Salaries not competitive
Costs of training not warranted by salary
Women have more career opportunities now
Little collegiality
Little respect from community
Often unpleasant, dangerous environment
Everyone gets same pay


Teachers Who LeaveTeachers Who Leave
20% of teachers leave within 3 years
50% of urban school teachers leave within 5 years
Twice as likely to leave with no induction program
Twice as likely to leave with top scores on high- stakes exams
20% of teachers leave within 3 years
50% of urban school teachers leave within 5 years
Twice as likely to leave with no induction program
Twice as likely to leave with top scores on high- stakes exams
Teacher Quality EffortsTeacher Quality Efforts
Past EffortsPast Efforts New IdeasNew Ideas
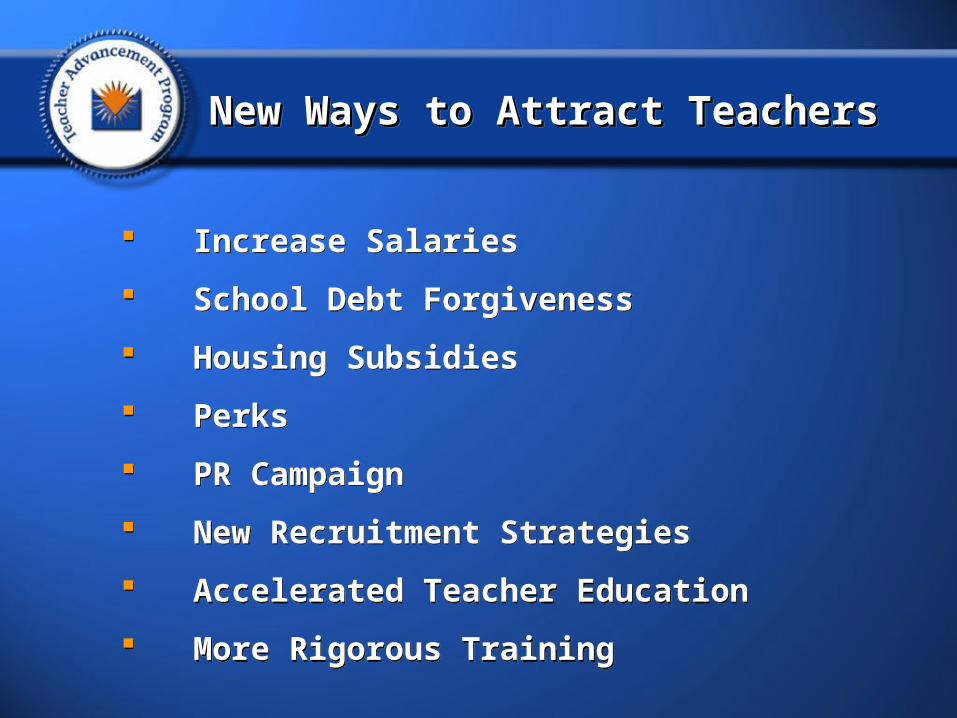
New Ways to Attract TeachersNew Ways to Attract TeachersNew Ways to Attract TeachersNew Ways to Attract Teachers
Increase Salaries
School Debt Forgiveness
Housing Subsidies
Perks
PR Campaign
New Recruitment Strategies
Accelerated Teacher Education
More Rigorous Training
Increase Salaries
School Debt Forgiveness
Housing Subsidies
Perks
PR Campaign
New Recruitment Strategies
Accelerated Teacher Education
More Rigorous Training
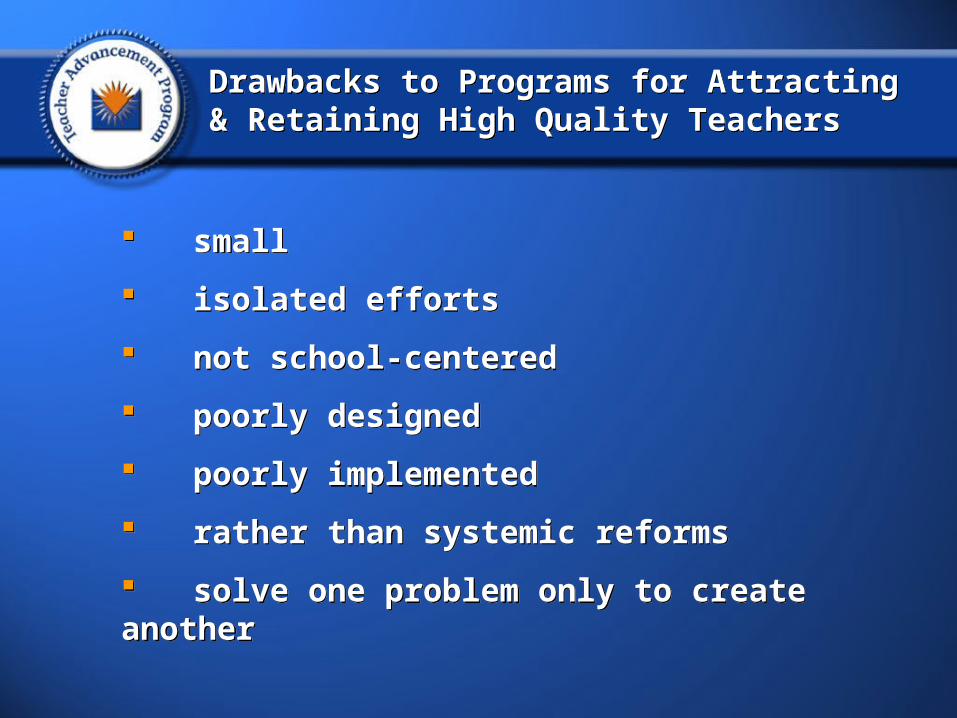
small
isolated efforts
not school-centered
poorly designed
poorly implemented
rather than systemic reforms
solve one problem only to create another
small
isolated efforts
not school-centered
poorly designed
poorly implemented
rather than systemic reforms
solve one problem only to create another
Drawbacks to Programs for Attracting & Retaining High Quality TeachersDrawbacks to Programs for Attracting & Retaining High Quality Teachers

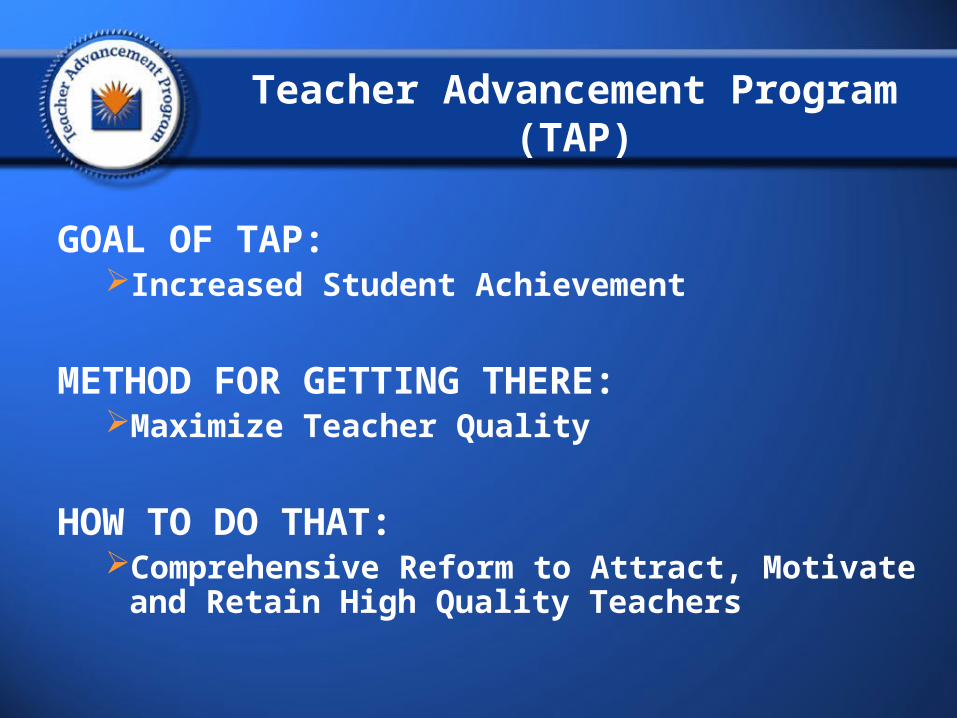
Teacher Advancement Program (TAP)
GOAL OF TAP:Increased Student Achievement
METHOD FOR GETTING THERE:Maximize Teacher Quality
HOW TO DO THAT:Comprehensive Reform to Attract, Motivate and
Retain High Quality Teachers
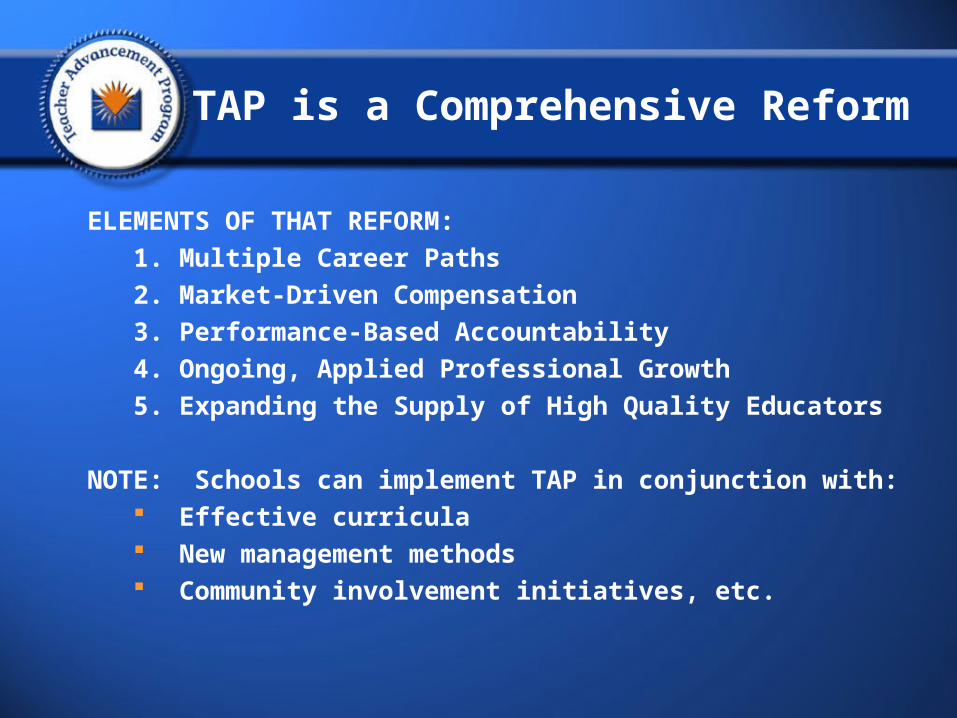
TAP is a Comprehensive Reform
ELEMENTS OF THAT REFORM:
1. Multiple Career Paths
2. Market-Driven Compensation
3. Performance-Based Accountability
4. Ongoing, Applied Professional Growth
5. Expanding the Supply of High Quality Educators
NOTE: Schools can implement TAP in conjunction with: Effective curricula New management methods Community involvement initiatives, etc.

Teacher Advancement ProgramTeacher Advancement ProgramTeacher Advancement ProgramTeacher Advancement Program
Initial academic degree and teaching certification attainable in four years
Alternative certification through assessments and classroom demonstration
Outstanding retired teachers continue working on a part-time basis as faculty fellows
Multi-state credentialing
Portable, private pension plans
Opportunity for national certification
The expansion of the pool is achieved by:The expansion of the pool is achieved by:
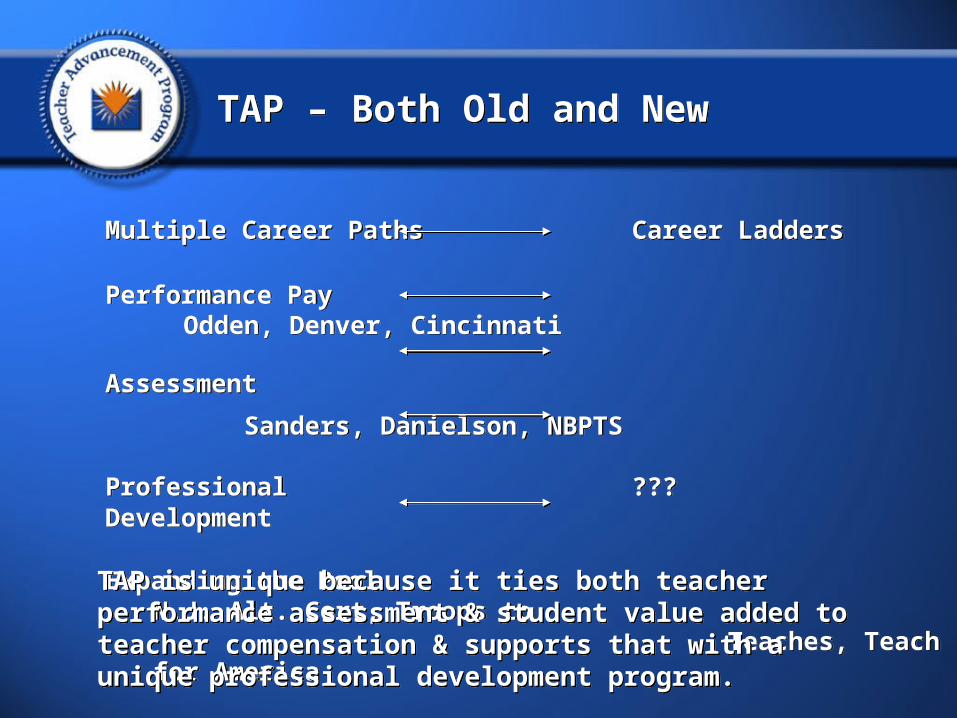
TAP – Both Old and NewTAP – Both Old and New
Multiple Career Paths Career Ladders
Performance Pay Odden, Denver, Cincinnati
Assessment Sanders, Danielson, NBPTS
Professional ???Development
Expanding the Pool N.J. Alt. Cert, Troops to Teaches, Teach
for America
Multiple Career Paths Career Ladders
Performance Pay Odden, Denver, Cincinnati
Assessment Sanders, Danielson, NBPTS
Professional ???Development
Expanding the Pool N.J. Alt. Cert, Troops to Teaches, Teach
for AmericaTAP is unique because it ties both teacher performance assessment & student value added to teacher compensation & supports that with a unique professional development program.
TAP is unique because it ties both teacher performance assessment & student value added to teacher compensation & supports that with a unique professional development program.
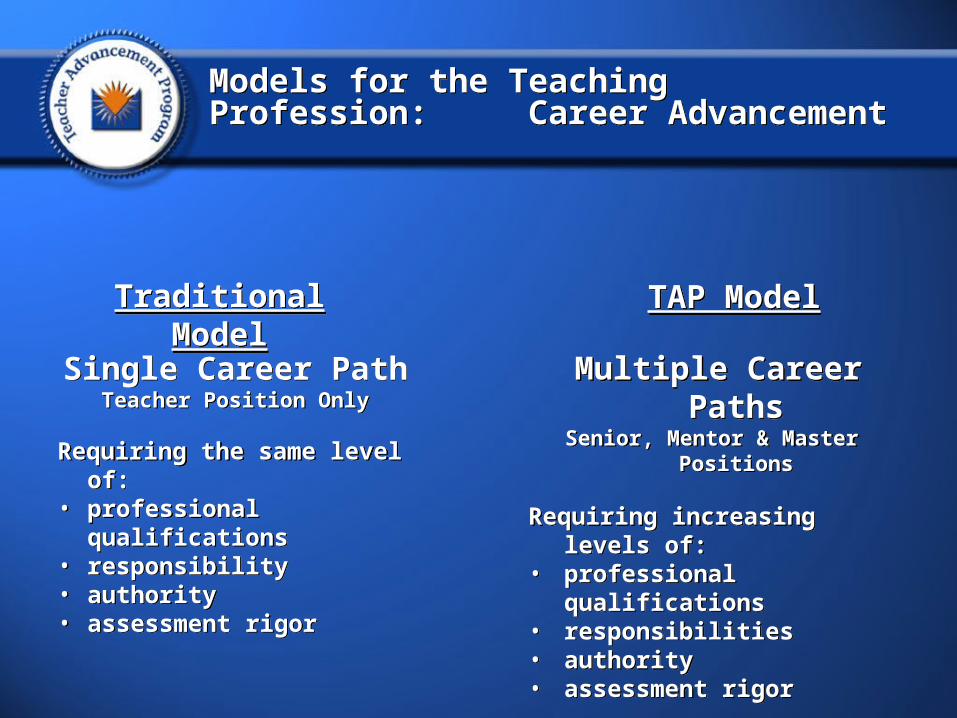
Models for the Teaching Profession: Career AdvancementModels for the Teaching Profession: Career Advancement
Traditional ModelTraditional Model TAP ModelTAP Model
Single Career PathTeacher Position Only
Requiring the same level of:• professional qualifications• responsibility• authority• assessment rigor
Single Career PathTeacher Position Only
Requiring the same level of:• professional qualifications• responsibility• authority• assessment rigor
Multiple Career PathsSenior, Mentor & Master Positions
Requiring increasing levels of:• professional qualifications• responsibilities• authority• assessment rigor
Multiple Career PathsSenior, Mentor & Master Positions
Requiring increasing levels of:• professional qualifications• responsibilities• authority• assessment rigor
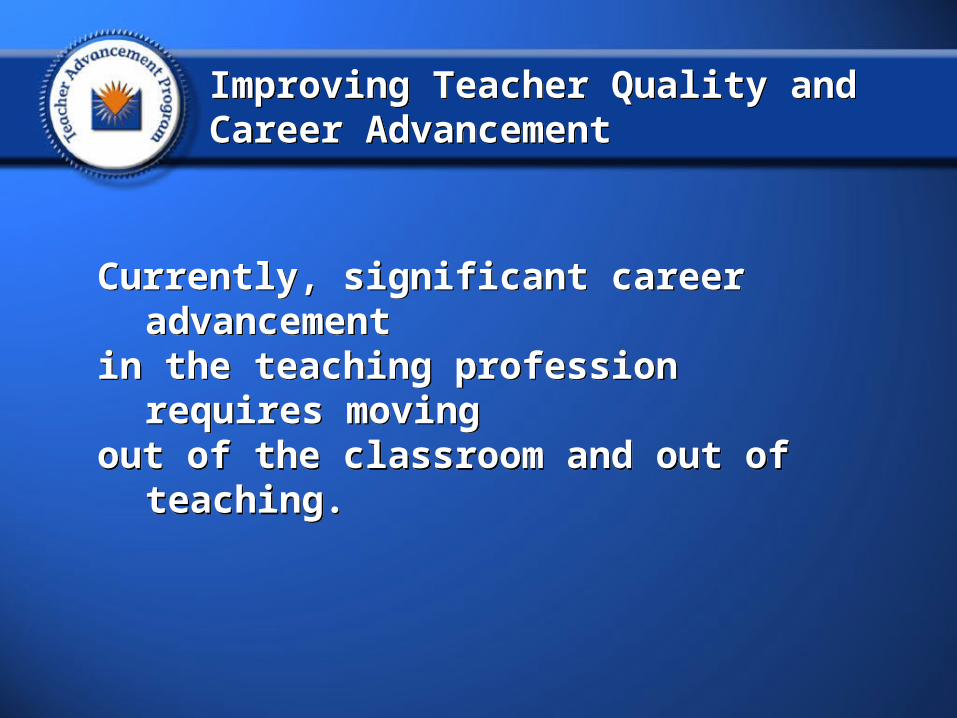
Improving Teacher Quality and Career AdvancementImproving Teacher Quality and Career Advancement
Currently, significant career advancement in the teaching profession requires moving out of the classroom and out of teaching.
Currently, significant career advancement in the teaching profession requires moving out of the classroom and out of teaching.
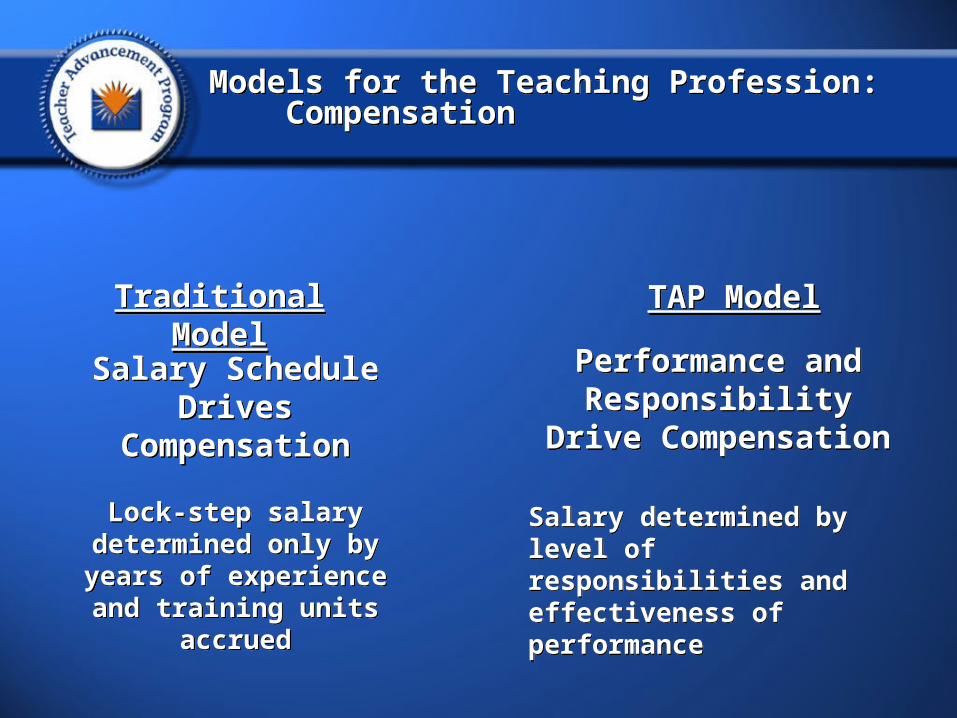
Models for the Teaching Profession: CompensationModels for the Teaching Profession: Compensation
Traditional ModelTraditional Model TAP ModelTAP Model
Salary Schedule Drives Compensation
Lock-step salary determined only by years of
experience and training units accrued
Salary Schedule Drives Compensation
Lock-step salary determined only by years of
experience and training units accrued
Performance and Responsibility Drive
Compensation
Salary determined by level of responsibilities and effectiveness of performance
Performance and Responsibility Drive
Compensation
Salary determined by level of responsibilities and effectiveness of performance
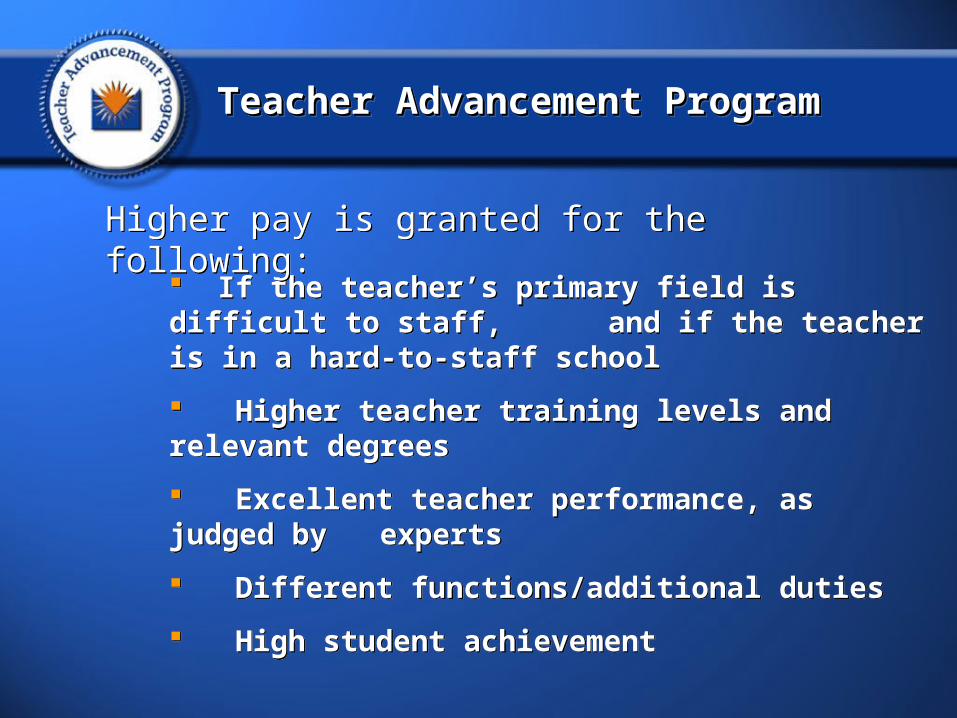
Teacher Advancement ProgramTeacher Advancement ProgramTeacher Advancement ProgramTeacher Advancement Program
If the teacher’s primary field is difficult to staff, and if the teacher is in a hard-to-staff school
Higher teacher training levels and relevant degrees
Excellent teacher performance, as judged by experts
Different functions/additional duties
High student achievement
If the teacher’s primary field is difficult to staff, and if the teacher is in a hard-to-staff school
Higher teacher training levels and relevant degrees
Excellent teacher performance, as judged by experts
Different functions/additional duties
High student achievement
Higher pay is granted for the following:Higher pay is granted for the following:
Other plans reject pay based onOther plans reject pay based onOther plans reject pay based onOther plans reject pay based on
Judgment of others
Student achievement/ test scores
Subject specialty
Judgment of others
Student achievement/ test scores
Subject specialty
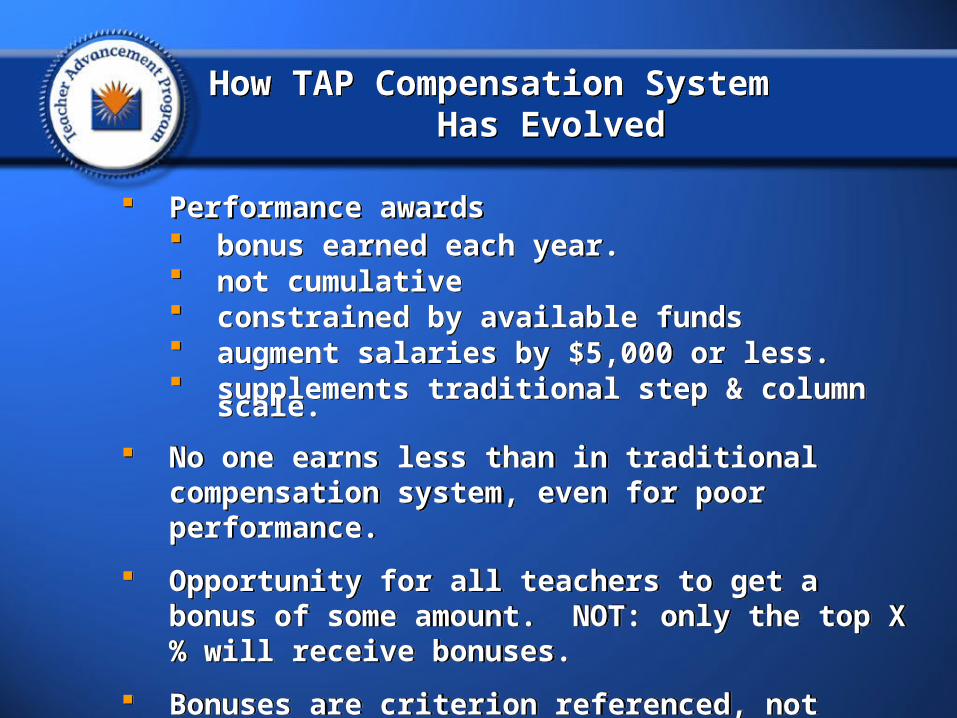
How TAP Compensation System Has EvolvedHow TAP Compensation System Has Evolved
Performance awards bonus earned each year. not cumulative constrained by available funds augment salaries by $5,000 or less. supplements traditional step & column scale.
No one earns less than in traditional compensation system, even for poor performance.
Opportunity for all teachers to get a bonus of some amount. NOT: only the top X% will receive bonuses.
Bonuses are criterion referenced, not relative. Any teacher who meets a standard receives the bonus.
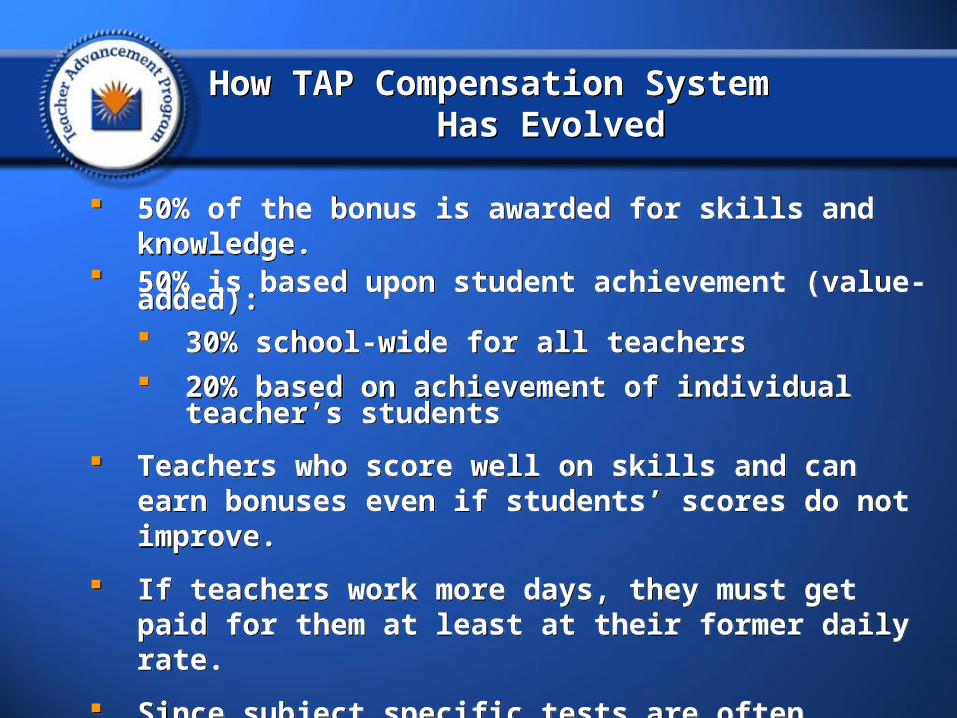
50% of the bonus is awarded for skills and knowledge. 50% is based upon student achievement (value-added):
30% school-wide for all teachers 20% based on achievement of individual teacher’s
students
Teachers who score well on skills and can earn bonuses even if students’ scores do not improve.
If teachers work more days, they must get paid for them at least at their former daily rate.
Since subject specific tests are often unavailable, the student achievement element of the bonus for high school teachers is complicated.
How TAP Compensation System Has EvolvedHow TAP Compensation System Has Evolved
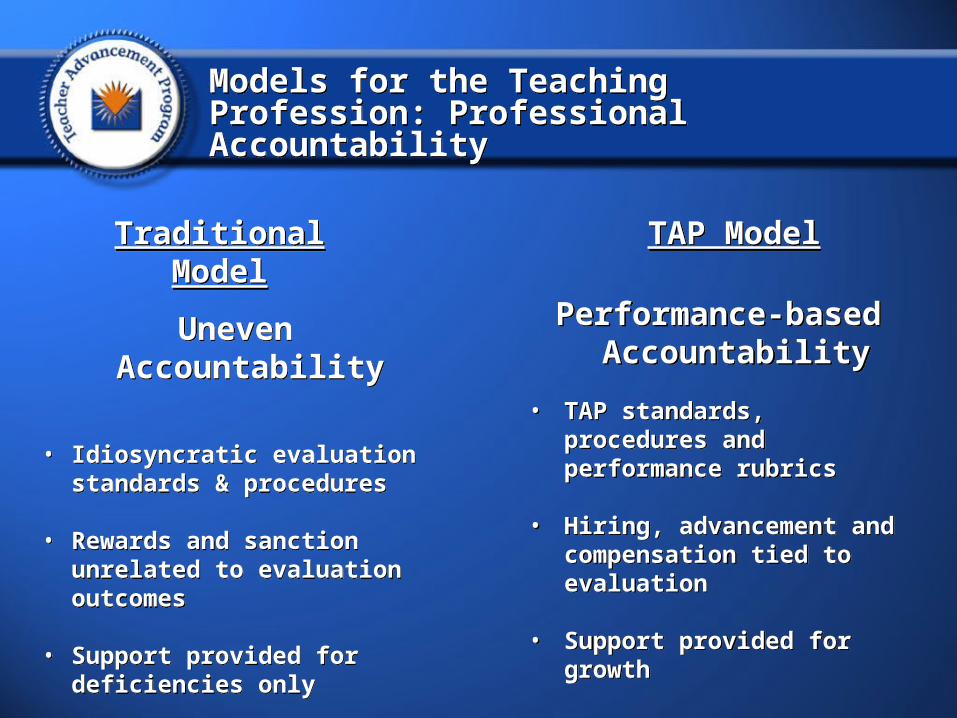
Models for the Teaching Profession: Professional AccountabilityModels for the Teaching Profession: Professional Accountability
Traditional ModelTraditional Model
Uneven Accountability
• Idiosyncratic evaluation standards & procedures
• Rewards and sanction unrelated to evaluation outcomes
• Support provided for deficiencies only
Uneven Accountability
• Idiosyncratic evaluation standards & procedures
• Rewards and sanction unrelated to evaluation outcomes
• Support provided for deficiencies only
TAP ModelTAP Model
Performance-based Accountability
• TAP standards, procedures and performance rubrics
• Hiring, advancement and compensation tied to evaluation
• Support provided for growth
Performance-based Accountability
• TAP standards, procedures and performance rubrics
• Hiring, advancement and compensation tied to evaluation
• Support provided for growth
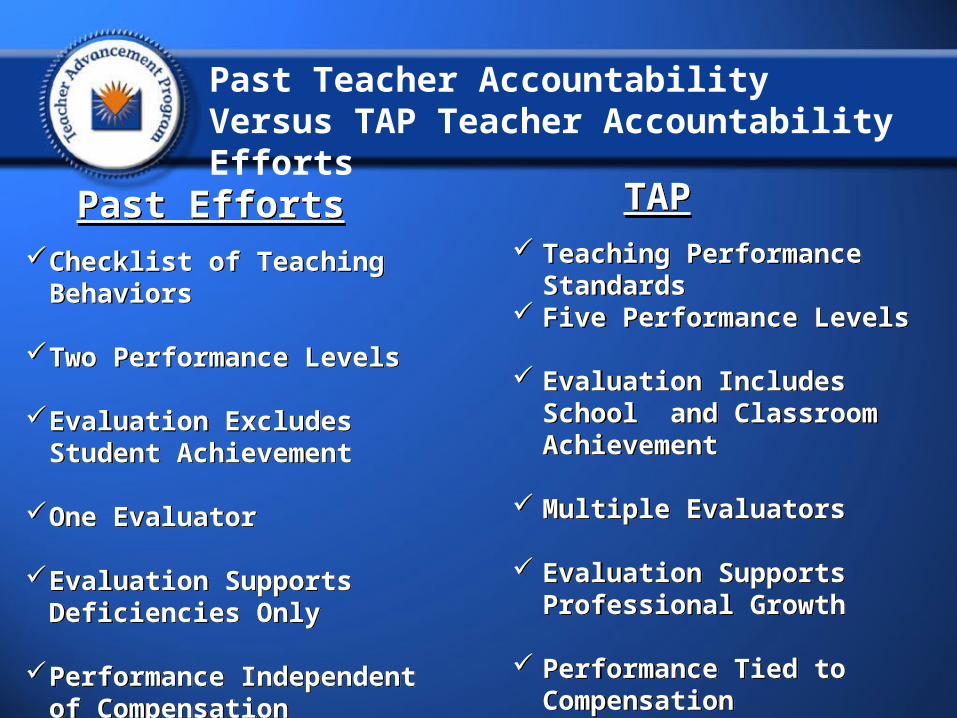
Past Teacher Accountability Versus TAP Teacher Accountability Efforts
Past EffortsPast Efforts TAPTAP
Checklist of Teaching Behaviors
Two Performance Levels
Evaluation Excludes Student Achievement
One Evaluator
Evaluation Supports Deficiencies Only
Performance Independent of Compensation
Checklist of Teaching Behaviors
Two Performance Levels
Evaluation Excludes Student Achievement
One Evaluator
Evaluation Supports Deficiencies Only
Performance Independent of Compensation
Teaching Performance Standards
Five Performance Levels
Evaluation Includes School and Classroom Achievement
Multiple Evaluators
Evaluation Supports Professional Growth
Performance Tied to Compensation
Teaching Performance Standards
Five Performance Levels
Evaluation Includes School and Classroom Achievement
Multiple Evaluators
Evaluation Supports Professional Growth
Performance Tied to Compensation
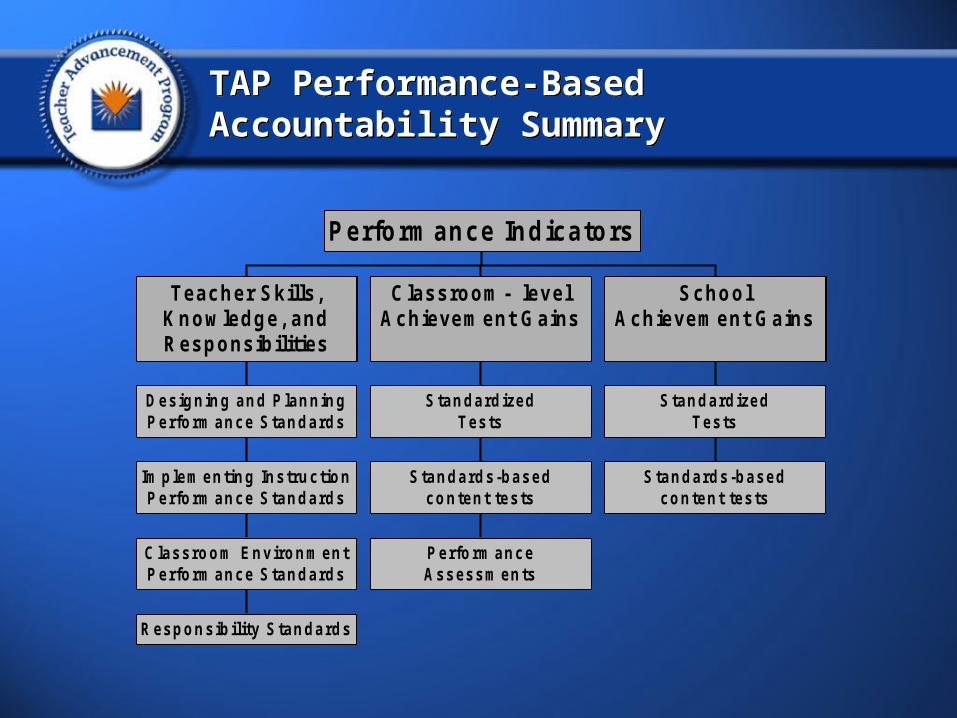
TAP Performance-Based Accountability SummaryTAP Performance-Based Accountability Summary
R esponsib ility S tandards
C lassroom Environm entPerform ance S tandards
Im plem enting InstructionPerform ance S tandards
D esigning and P lanningPerform ance S tandards
Teacher Skills,Know ledge, andResponsibilities
Perform anceAssessm ents
Standards-basedcontent tests
Standard izedTests
Classroom- levelAchievem ent Gains
Standards-basedcontent tests
Standard izedTests
SchoolAchievem ent Gains
Perform ance Indicators
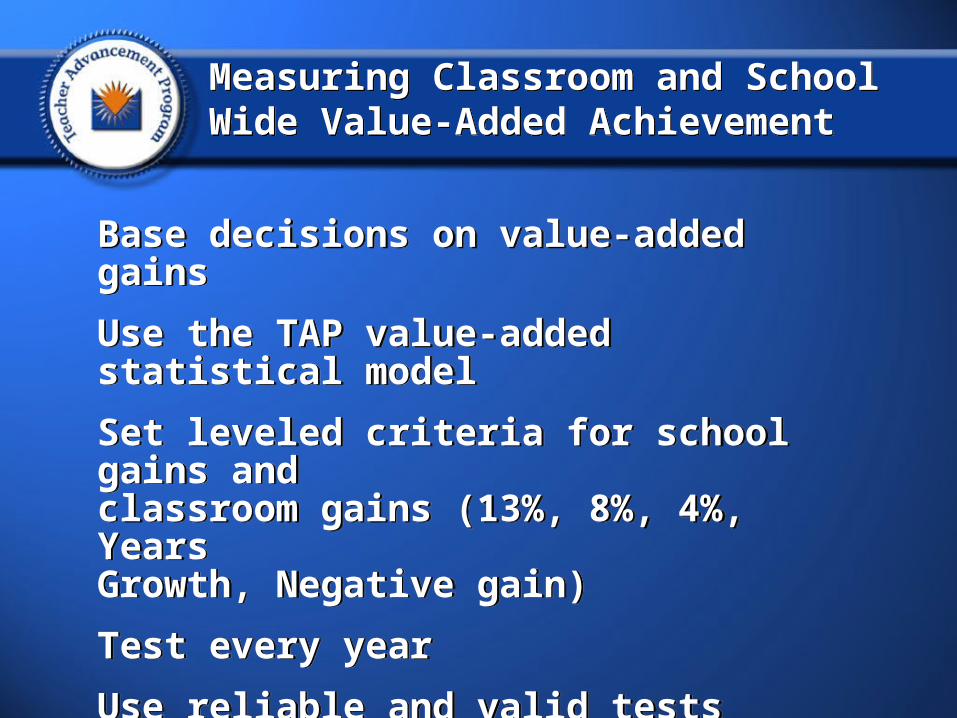
Measuring Classroom and School Wide Value-Added AchievementMeasuring Classroom and School Wide Value-Added Achievement
Base decisions on value-added gains
Use the TAP value-added statistical model
Set leveled criteria for school gains and classroom gains (13%, 8%, 4%, YearsGrowth, Negative gain)
Test every year
Use reliable and valid tests
Tie student level data to teacher each year
Base decisions on value-added gains
Use the TAP value-added statistical model
Set leveled criteria for school gains and classroom gains (13%, 8%, 4%, YearsGrowth, Negative gain)
Test every year
Use reliable and valid tests
Tie student level data to teacher each year
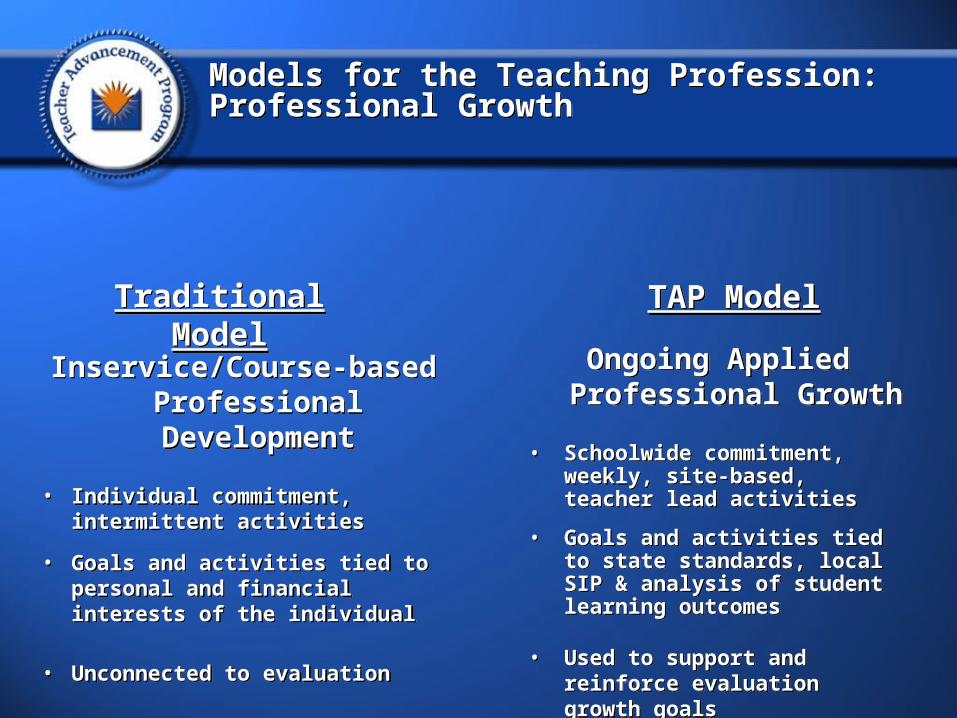
Models for the Teaching Profession: Professional GrowthModels for the Teaching Profession: Professional Growth
Traditional ModelTraditional Model TAP ModelTAP Model
Inservice/Course-based Professional Development
• Individual commitment, intermittent activities
• Goals and activities tied to personal and financial interests of the individual
• Unconnected to evaluation
Inservice/Course-based Professional Development
• Individual commitment, intermittent activities
• Goals and activities tied to personal and financial interests of the individual
• Unconnected to evaluation
Ongoing Applied Professional Growth
• Schoolwide commitment, weekly, site-based, teacher lead activities
• Goals and activities tied to state standards, local SIP & analysis of student learning outcomes
• Used to support and reinforce evaluation growth goals
Ongoing Applied Professional Growth
• Schoolwide commitment, weekly, site-based, teacher lead activities
• Goals and activities tied to state standards, local SIP & analysis of student learning outcomes
• Used to support and reinforce evaluation growth goals
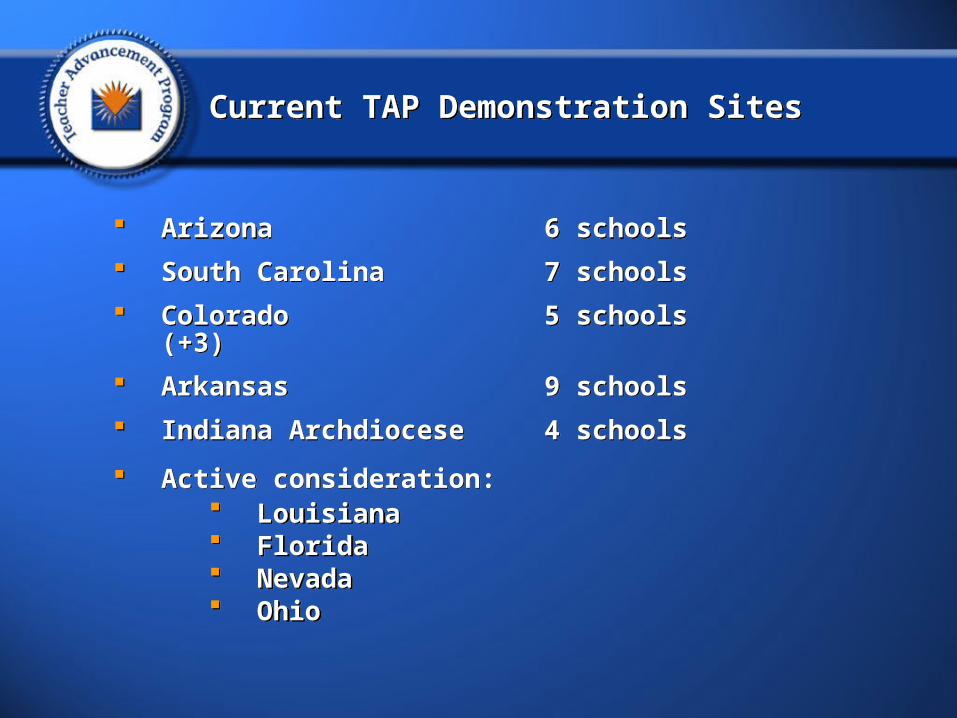
Current TAP Demonstration SitesCurrent TAP Demonstration Sites
Arizona 6 schools
South Carolina 7 schools
Colorado 5 schools (+3)
Arkansas 9 schools
Indiana Archdiocese 4 schools
Active consideration: Louisiana Florida Nevada Ohio
Arizona 6 schools
South Carolina 7 schools
Colorado 5 schools (+3)
Arkansas 9 schools
Indiana Archdiocese 4 schools
Active consideration: Louisiana Florida Nevada Ohio
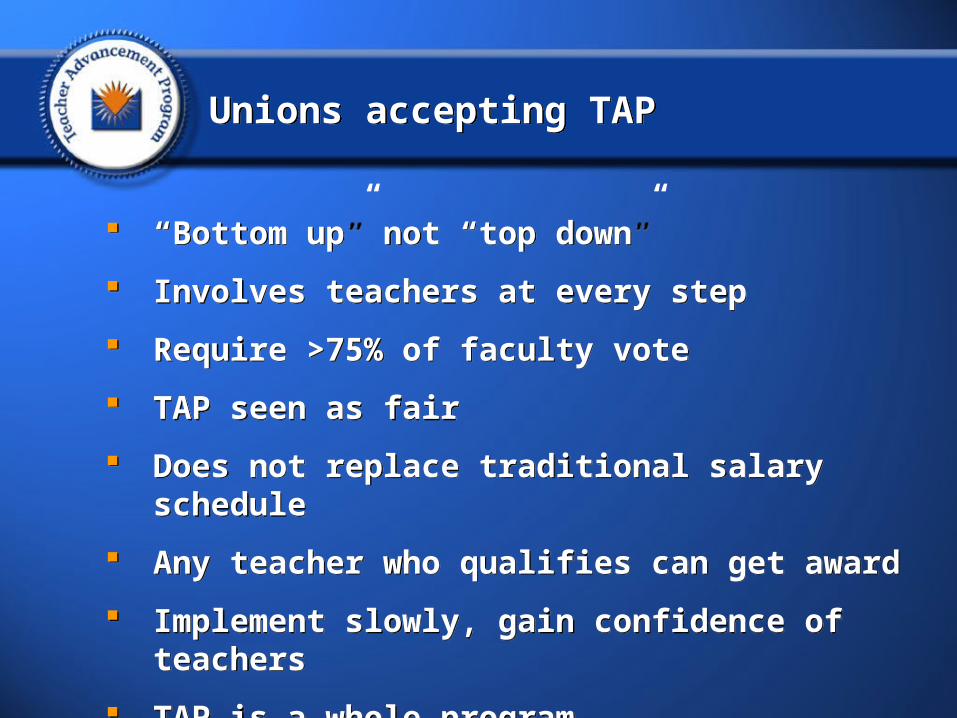
Unions accepting TAPUnions accepting TAP
“Bottom up” not “top down”
Involves teachers at every step
Require >75% of faculty vote
TAP seen as fair
Does not replace traditional salary schedule
Any teacher who qualifies can get award
Implement slowly, gain confidence of teachers
TAP is a whole program
“Bottom up” not “top down”
Involves teachers at every step
Require >75% of faculty vote
TAP seen as fair
Does not replace traditional salary schedule
Any teacher who qualifies can get award
Implement slowly, gain confidence of teachers
TAP is a whole program

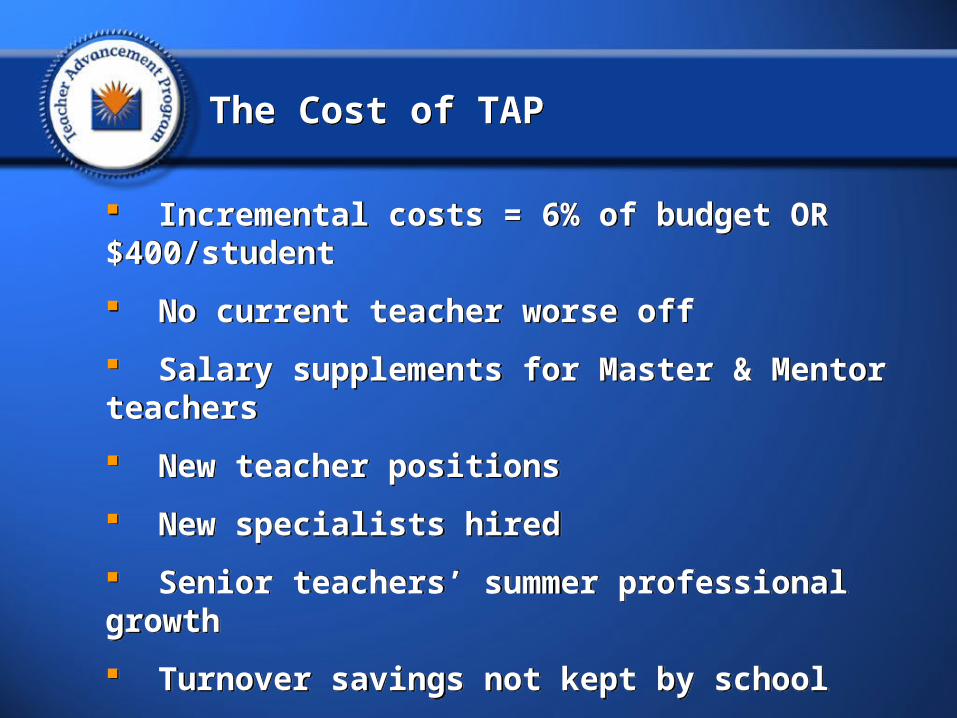
The Cost of TAPThe Cost of TAP
Incremental costs = 6% of budget OR $400/student
No current teacher worse off
Salary supplements for Master & Mentor teachers
New teacher positions
New specialists hired
Senior teachers’ summer professional growth
Turnover savings not kept by school
Traditional salary schedule increases in place
Bonus pool must be > current certain raises

New Sources of FundsNew Sources of Funds
Current district/school budgets
New state appropriations
Ballot initiatives
Private foundations
Federal Funds
Current district/school budgets
New state appropriations
Ballot initiatives
Private foundations
Federal Funds
Expected Final OutcomeExpected Final Outcome
Improved Student Achievement Improved Student Achievement
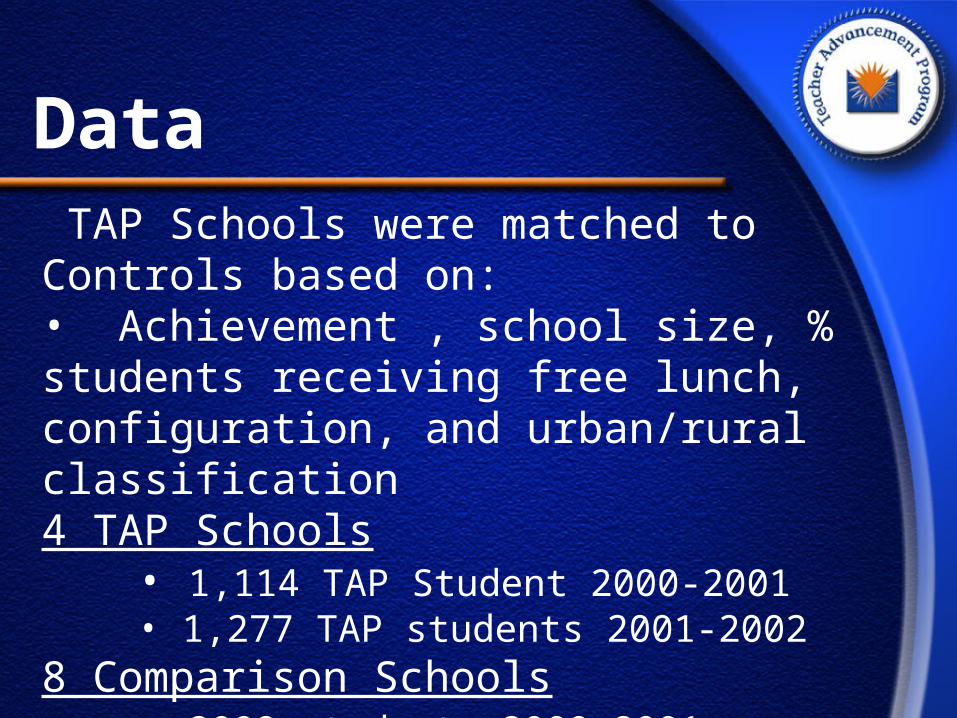
Data TAP Schools were matched to Controls based on: • Achievement , school size, % students receiving free lunch, configuration, and urban/rural classification4 TAP Schools
• 1,114 TAP Student 2000-2001• 1,277 TAP students 2001-2002
8 Comparison Schools• 2009 students 2000-2001• 1,372 students 2001-2002
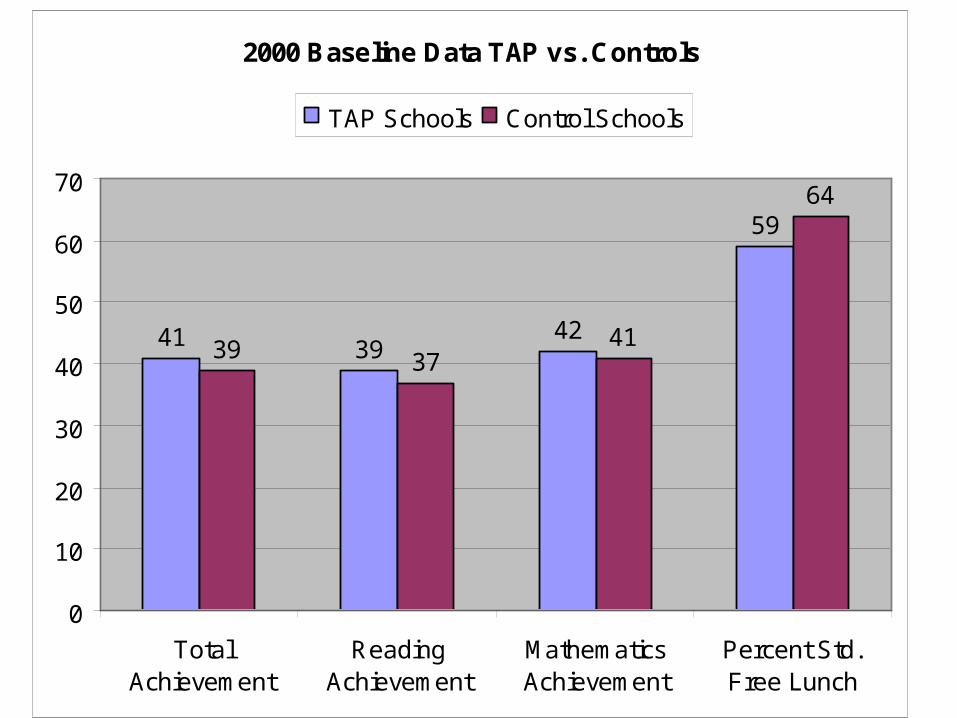
2000 Baseline Data TAP vs. Controls
41 3942
59
39 3741
64
0
10
20
30
40
50
60
70
TotalAchievement
ReadingAchievement
MathematicsAchievement
Percent Std.Free Lunch
TAP Schools Control Schools
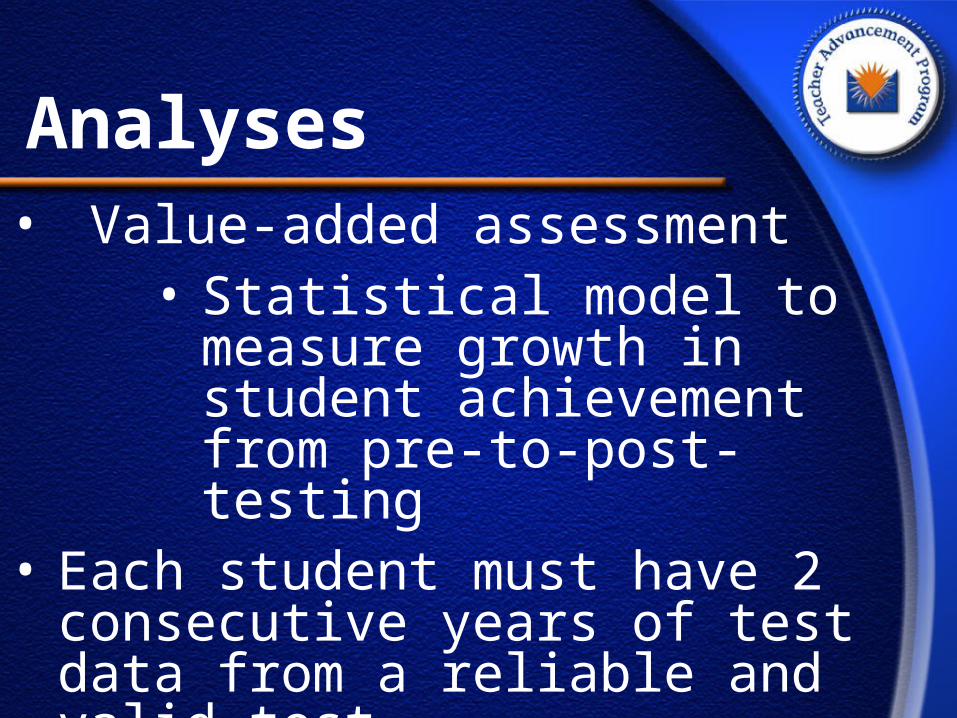
Analyses• Value-added assessment
• Statistical model to measure growth in student achievement from pre-to-post-testing
• Each student must have 2 consecutive years of test data from a reliable and valid test
• Data needs to be linked to school, and ideally, teachers each year
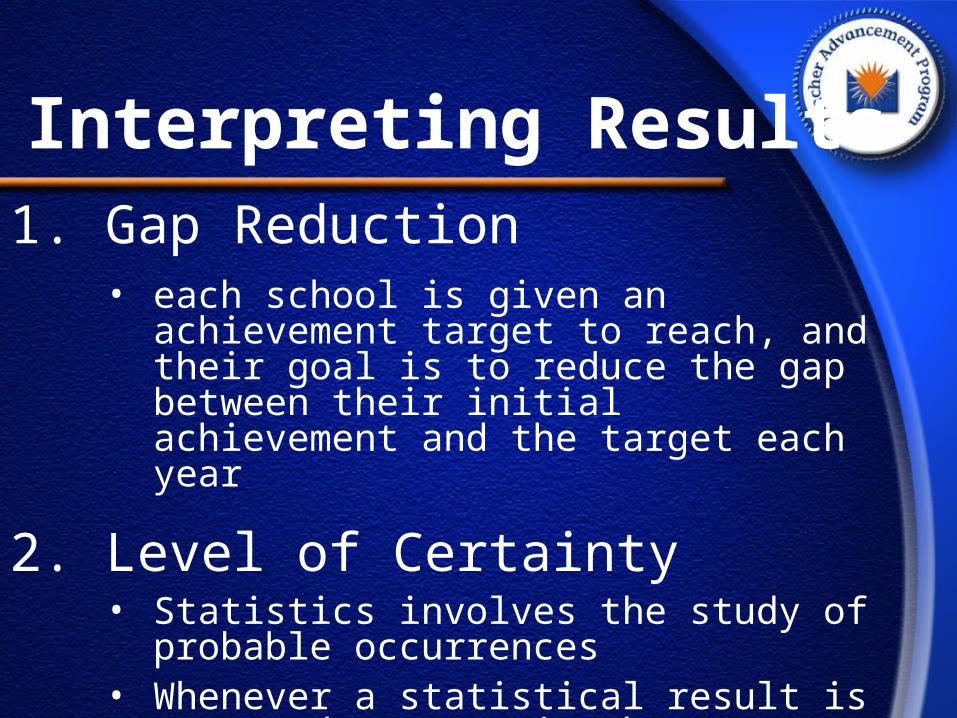
Interpreting Results1. Gap Reduction
• each school is given an achievement target to reach, and their goal is to reduce the gap between their initial achievement and the target each year
2. Level of Certainty• Statistics involves the study of
probable occurrences• Whenever a statistical result is
reported, so too is the likelihood of achieving that result
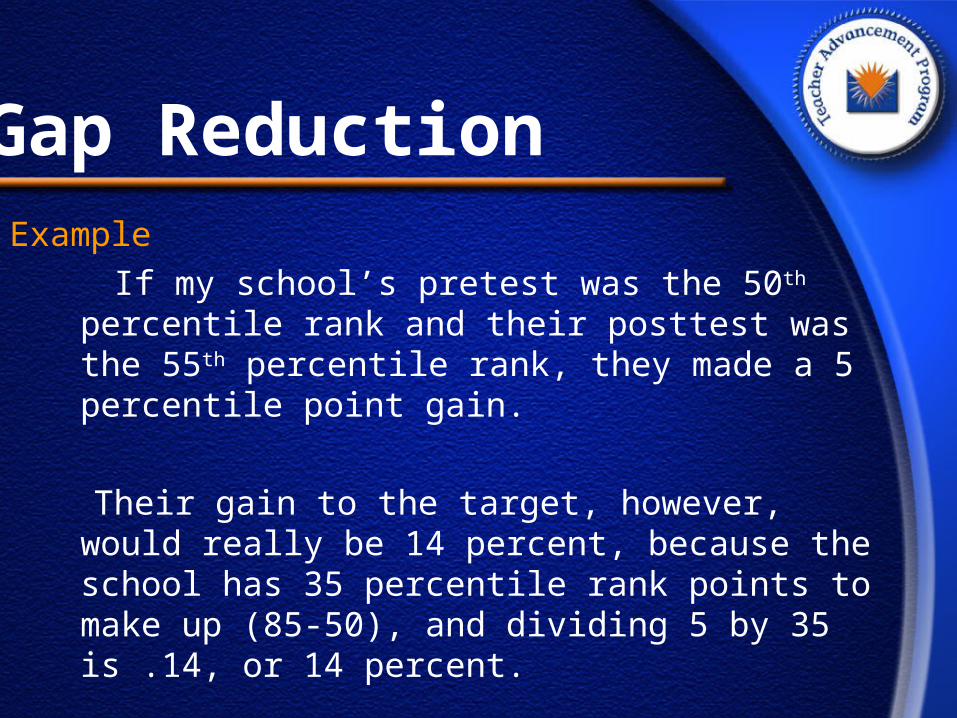
Gap ReductionExample
If my school’s pretest was the 50th percentile rank and their posttest was the 55th percentile rank, they made a 5 percentile point gain.
Their gain to the target, however, would really be 14 percent, because the school has 35 percentile rank points to make up (85-50), and dividing 5 by 35 is .14, or 14 percent.
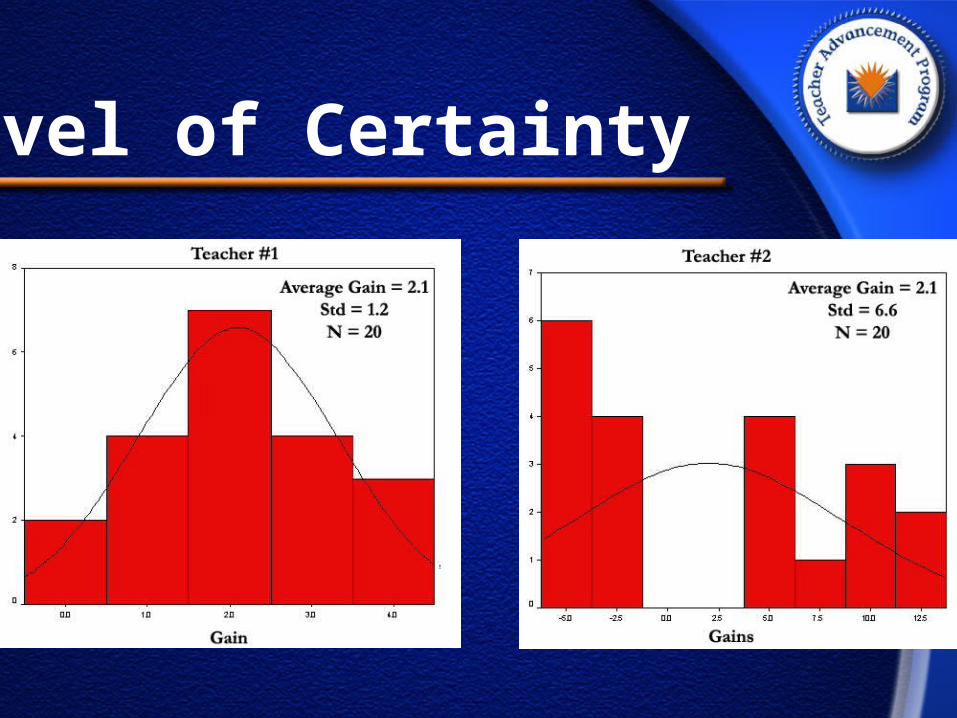
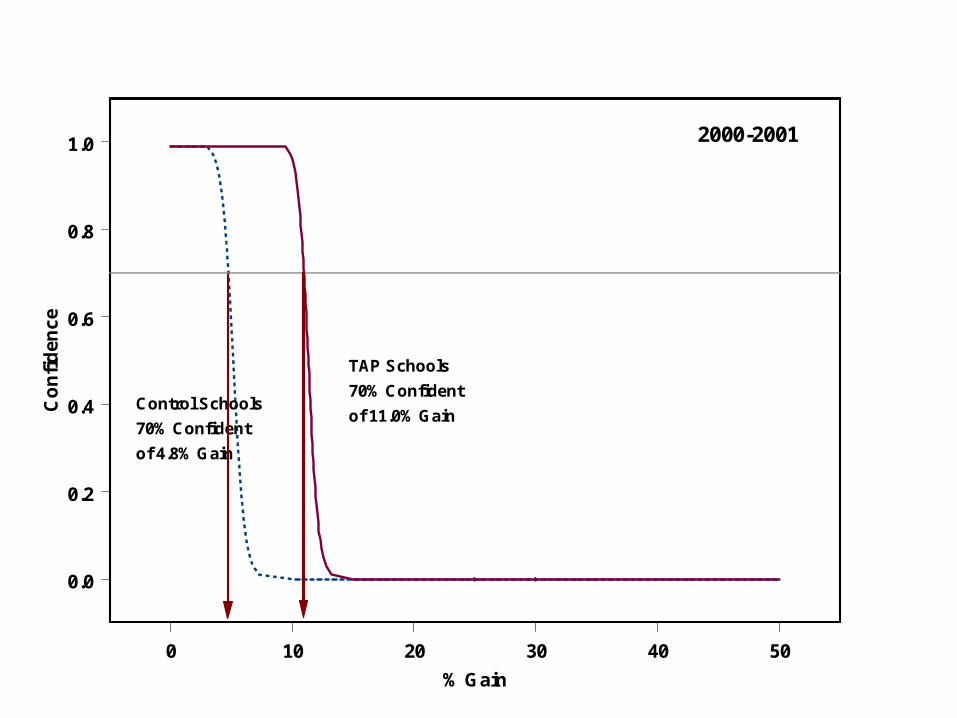
Level of Certainty
Level of CertaintyFor TAP teachers/schools we want to be at least 70 percent certain that their classroom achieved a gain.
• Teacher #1 achieved a gain under that criteria
• Teacher #2 did not
We use statistics to calculate a certainty level associated with the gain for each teacher and each school.
Research Question # 1
1.Do TAP schools improve student achievement on a yearly basis?

Research Conclusion 1
The average TAP school gain per year was 11.5 percent, or 23 percent to standard over two years.
Research Question # 2
2. Do TAP schools outperform comparable schools on a yearly basis?
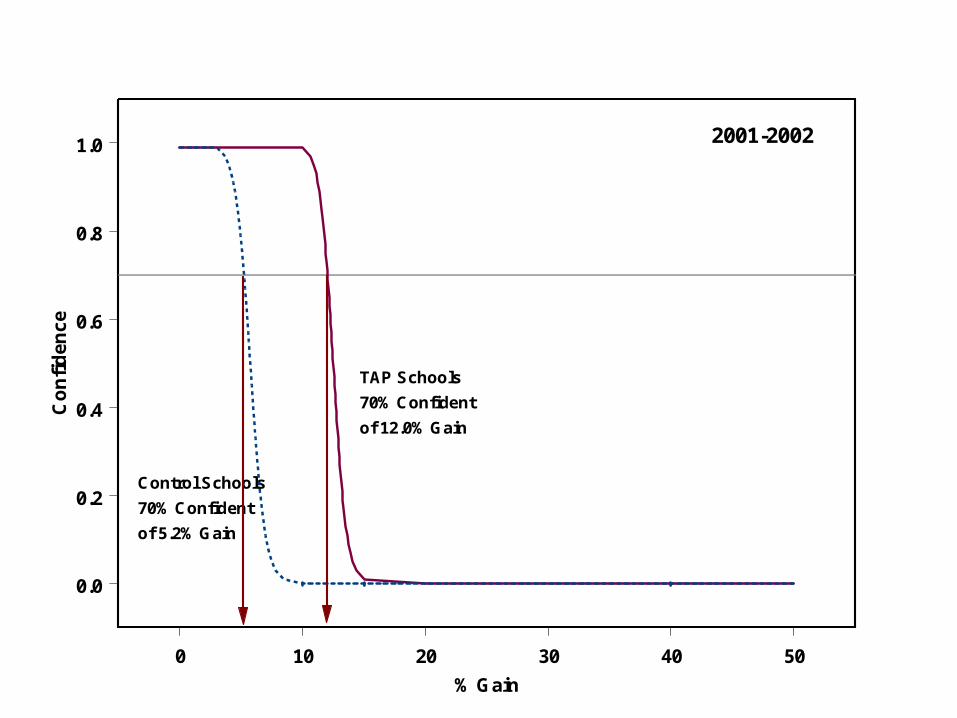
Research Conclusion 2
Over the course of two years, TAP schools out-gained their controls by approximately 13 percent.
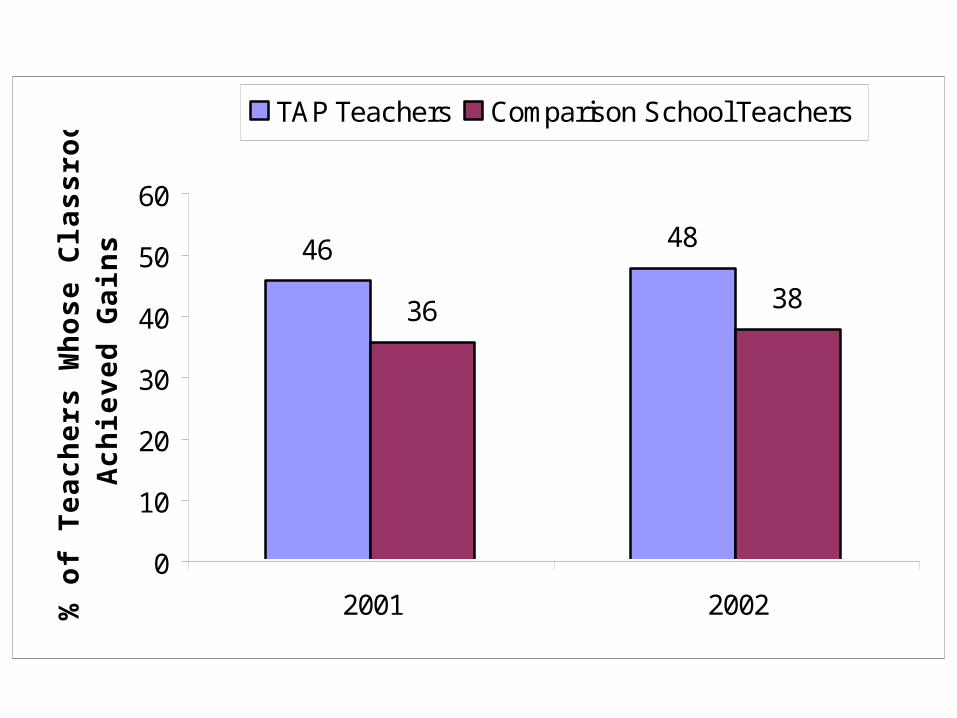
Research Question # 3
3. Do a greater proportion of teachers in TAP schools achieve student learning gains than teachers in comparable schools?
46 48
36 38
0
10
20
30
40
50
60
2001 2002% o
f Te
ach
ers
Wh
ose
Cla
ssro
om
s A
chie
ved
Gai
ns
TAP Teachers Comparison School Teachers
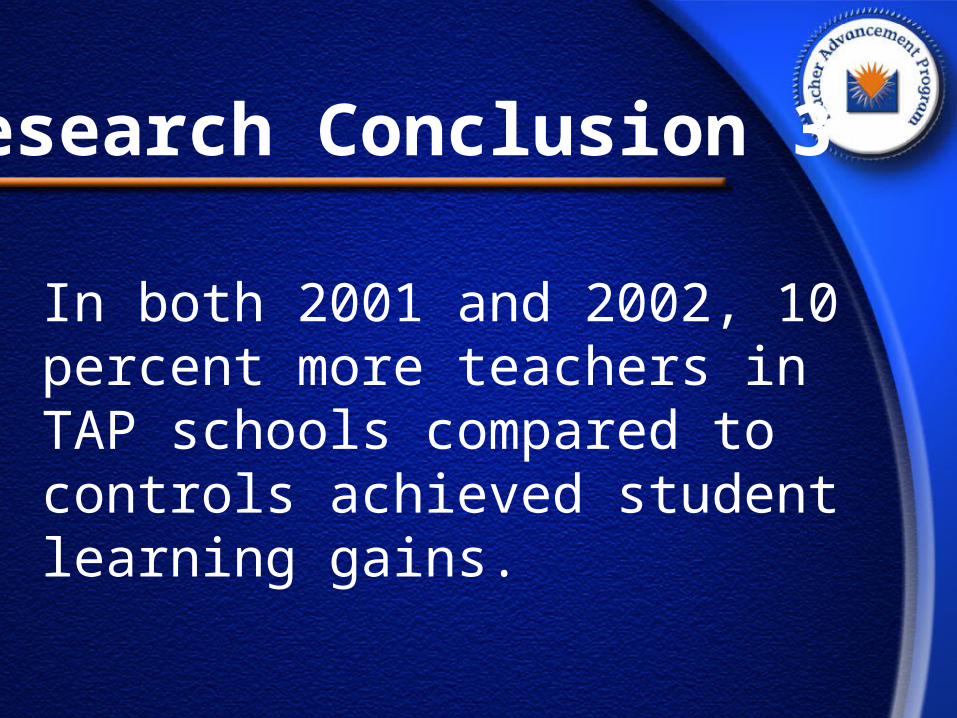
Research Conclusion 3
In both 2001 and 2002, 10 percent more teachers in TAP schools compared to controls achieved student learning gains.
Research Question # 4
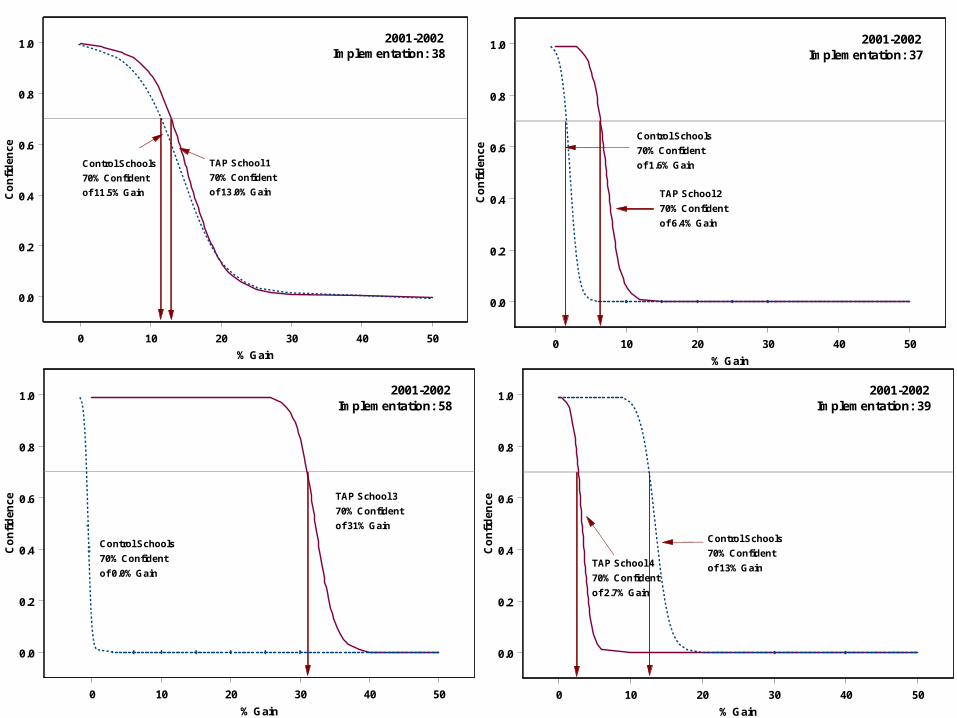
4. Does each individual TAP school outperform its comparable control schools?
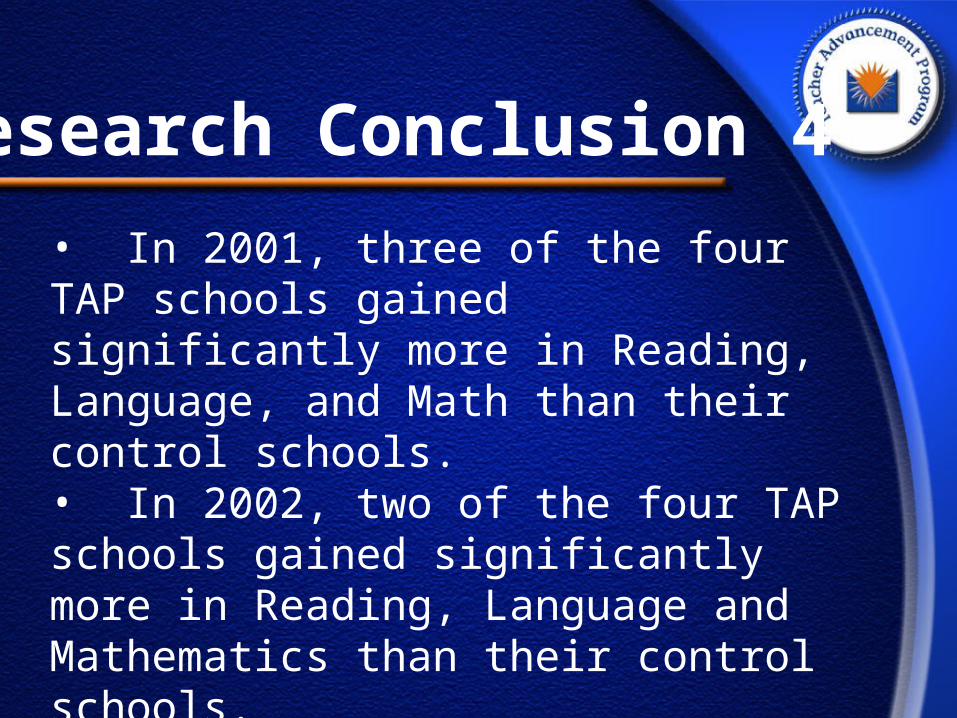
Research Conclusion 4• In 2001, three of the four TAP schools gained significantly more in Reading, Language, and Math than their control schools. • In 2002, two of the four TAP schools gained significantly more in Reading, Language and Mathematics than their control schools.

Research Question # 5
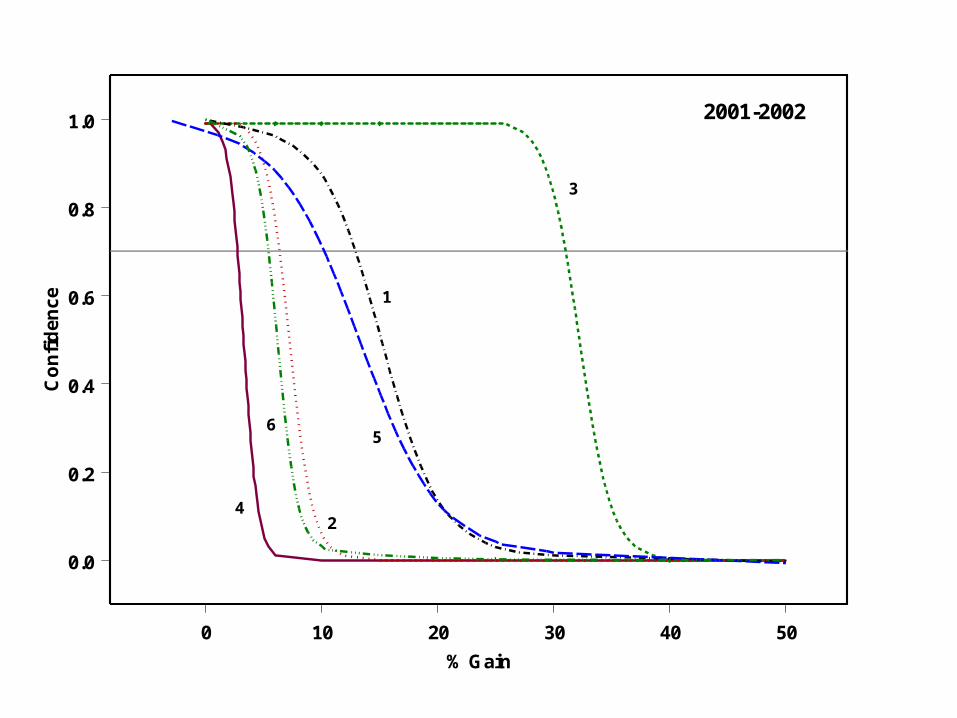
5. Do TAP schools that strictly adhere to implementing the five TAP principles produce greater student achievement gains than TAP schools that implement the principles with less rigor?

TAP School Implementation Scores
90 87
147
94
144 140
020406080
100120140160
1 2 3 4 5 6
TAP School Number
Imp
lem
enat
ion
Sco
re
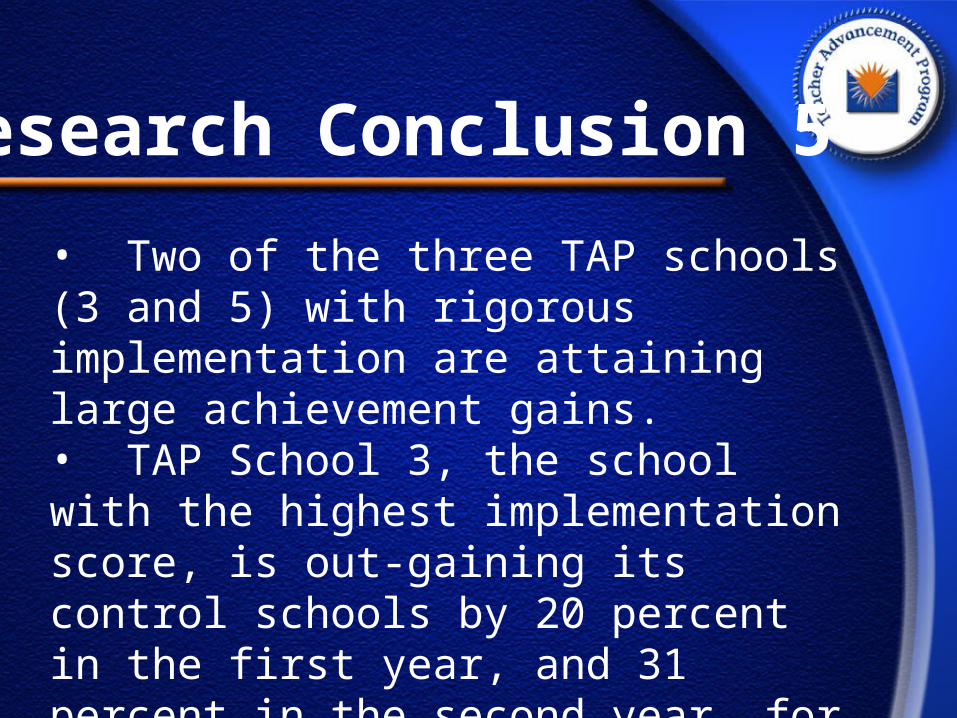
Research Conclusion 5
• Two of the three TAP schools (3 and 5) with rigorous implementation are attaining large achievement gains. • TAP School 3, the school with the highest implementation score, is out-gaining its control schools by 20 percent in the first year, and 31 percent in the second year, for a total of 51 percent in two years.
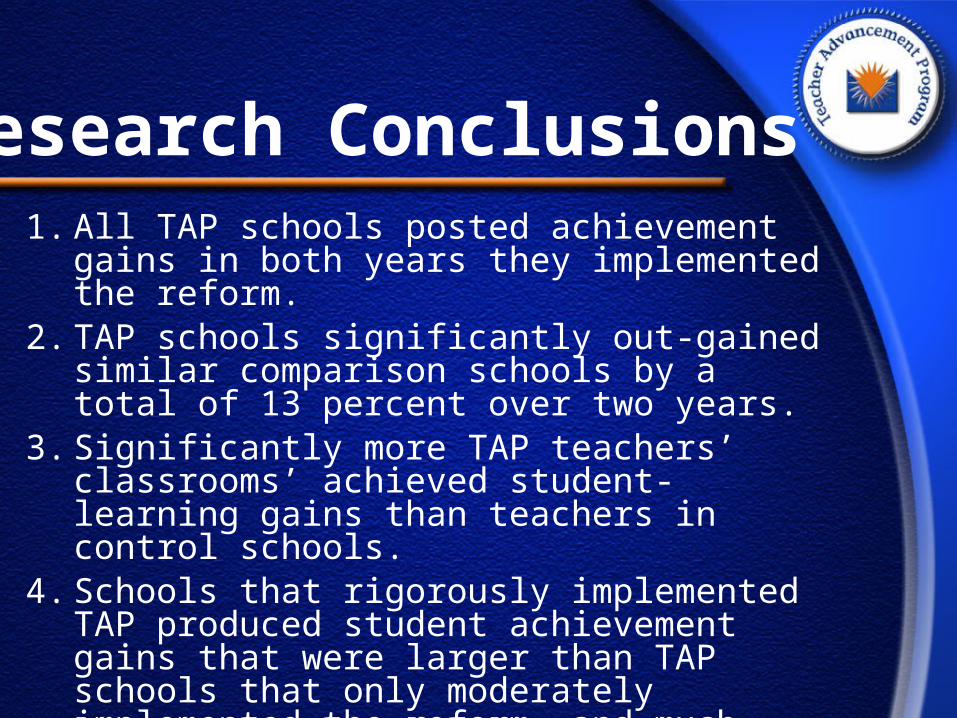
Research Conclusions1. All TAP schools posted achievement gains
in both years they implemented the reform.
2. TAP schools significantly out-gained similar comparison schools by a total of 13 percent over two years.
3. Significantly more TAP teachers’ classrooms’ achieved student-learning gains than teachers in control schools.
4. Schools that rigorously implemented TAP produced student achievement gains that were larger than TAP schools that only moderately implemented the reform, and much larger than control schools that did not implement TAP.
A Final Note
Although, all of the TAP schools realized student achievement gains in the first two years of the reform, the magnitude of those gains differed across schools (e.g. from an 11 percent gain to target to a 51 percent gain to target over two years).

A Final NoteStudies of comprehensive school reform show that the reform is more likely to be successful when:1. It is supported by teachers2. There is strong principal leadership3. There is a stable and committed district4. The schools receive on going assistance from developers5. The reform is implemented in smaller rather than larger schools
Intermediate OutcomesIntermediate Outcomes
Teachers opt for new system vs. existing system
Changes in types of individuals applying
Number of applicants
Differences in characteristics of people hired
Changes in teacher retention rates
Changes in which teachers stay in classroom
Survival rates in the first five years
Changing nature of collective bargaining
Stakeholder perceptions of staff quality & professionalism
Teacher satisfaction data

The Stories We’ve HeardThe Stories We’ve Heard
New teachers have support unheard of in other schools and in the past.
Veteran teachers are leaving comfortable school environments to be at TAP schools (often lower SES).
Teachers are collaborating and communicating much more.
New teachers have support unheard of in other schools and in the past.
Veteran teachers are leaving comfortable school environments to be at TAP schools (often lower SES).
Teachers are collaborating and communicating much more.

The Stories We’ve HeardThe Stories We’ve Heard
Seeing a great deal of flexibility and change among teachers’ classroom practices.
Developing/studying the rubrics helps teachers learn about and implement effective classroom practices.
Immediate feedback from evaluations enables teachers to enhance their performance.
Seeing a great deal of flexibility and change among teachers’ classroom practices.
Developing/studying the rubrics helps teachers learn about and implement effective classroom practices.
Immediate feedback from evaluations enables teachers to enhance their performance.
The Stories We’ve HeardThe Stories We’ve Heard
Analyses of student test scores serves as guide for individualized instruction.
Teachers are working harder than ever before, but a lot better.
Professional growth at the school site on a regular basis sends an affirming message to teachers that their development is important.
Analyses of student test scores serves as guide for individualized instruction.
Teachers are working harder than ever before, but a lot better.
Professional growth at the school site on a regular basis sends an affirming message to teachers that their development is important.
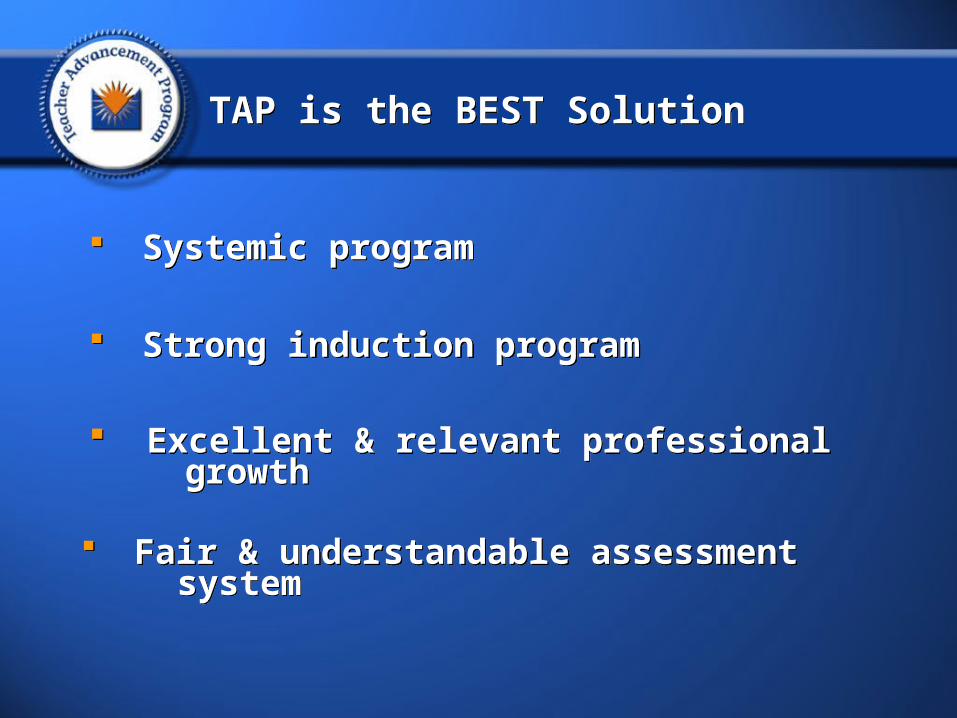
TAP is the BEST SolutionTAP is the BEST Solution
Systemic program Systemic program
Strong induction program Strong induction program
Excellent & relevant professional growth
Excellent & relevant professional growth
Fair & understandable assessment system
Fair & understandable assessment system

TAP is the BEST SolutionTAP is the BEST Solution
Increased responsibility & leadership Increased responsibility & leadership
Involves teachers at every step Involves teachers at every step
Gains teacher support for making change Gains teacher support for making change
Commensurate compensation Commensurate compensation
WITHOUT fully leaving classroom WITHOUT fully leaving classroom
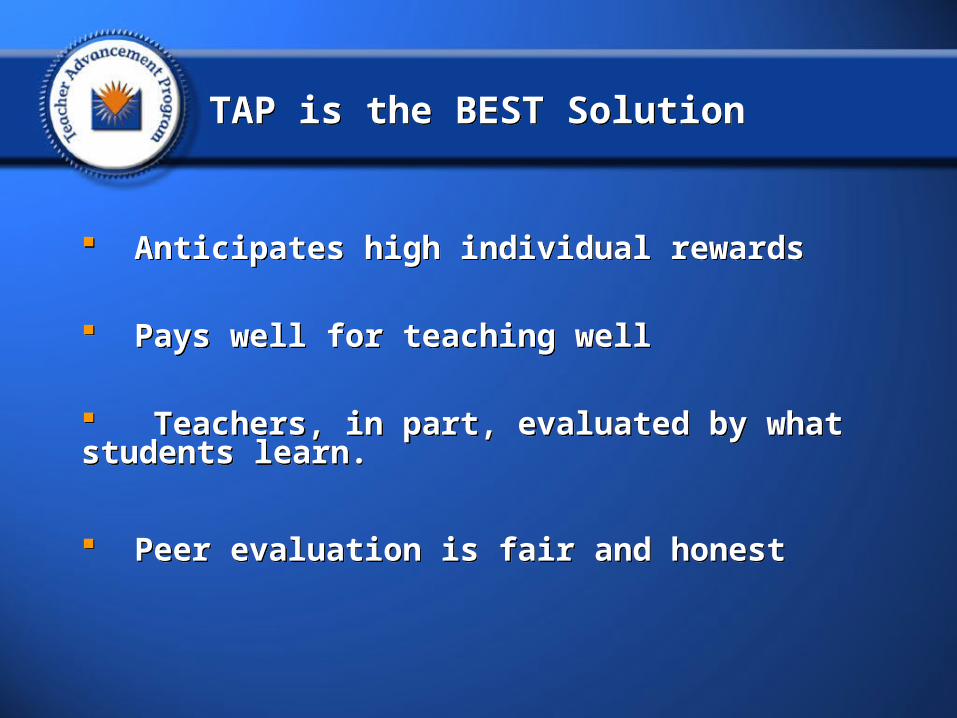
TAP is the BEST SolutionTAP is the BEST Solution
Anticipates high individual rewards Anticipates high individual rewards
Pays well for teaching well Pays well for teaching well
Teachers, in part, evaluated by what students learn.
Peer evaluation is fair and honest
Teachers, in part, evaluated by what students learn.
Peer evaluation is fair and honest

www.mff.org/tapwww.mff.org/tap [email protected]@mff.org
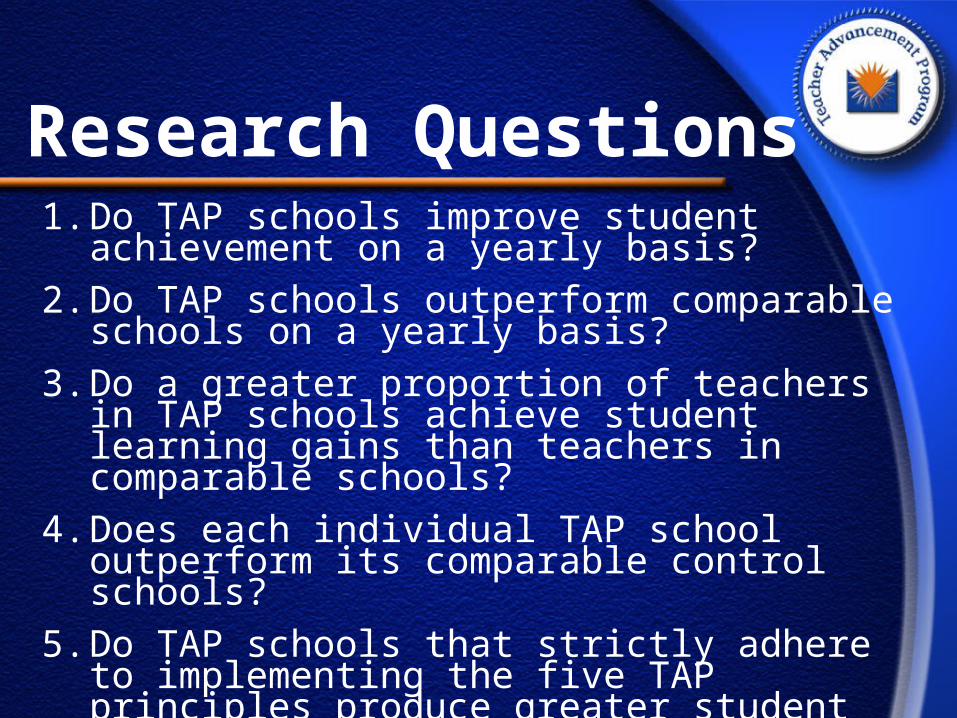
Research Questions1. Do TAP schools improve student
achievement on a yearly basis?2. Do TAP schools outperform comparable
schools on a yearly basis? 3. Do a greater proportion of teachers in TAP
schools achieve student learning gains than teachers in comparable schools?
4. Does each individual TAP school outperform its comparable control schools?
5. Do TAP schools that strictly adhere to implementing the five TAP principles produce greater student achievement gains than TAP schools that implement the principles with less rigor?


Demanding one uniform gain for every student irrespective of where they start is unfair• When you start at the 80th percentile it is more
difficult to make -- say 10 percentile rank gain-- than someone who started at the 50th percentile
Demanding that a student makes up the distance from where they start to a target each year takes into account every student’s initial status, making the gain relative to a starting point
We set the target at the 85th percentile rank (primarily for statistical reasons relating to the test’s scale)
Gap Reduction
Remember
1. TAP’s value-added assessment is a GAP REDUCTION MODEL
2. There is always probability associated with achievement gains
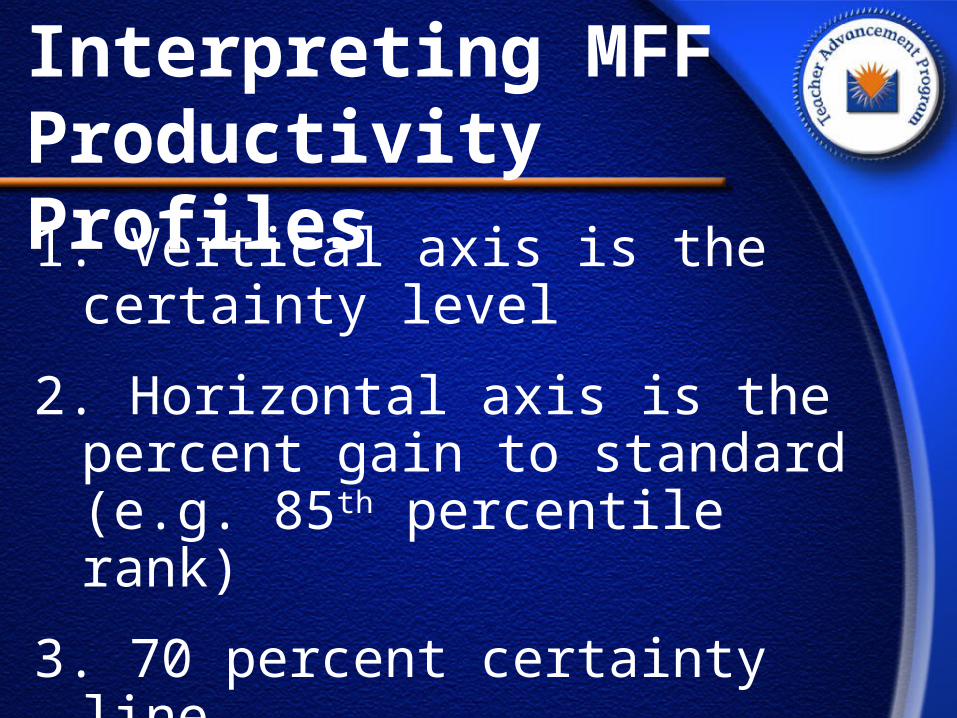
Interpreting MFF Productivity Profiles1. Vertical axis is the
certainty level
2. Horizontal axis is the percent gain to standard (e.g. 85th percentile rank)
3. 70 percent certainty line
4. School growth curves
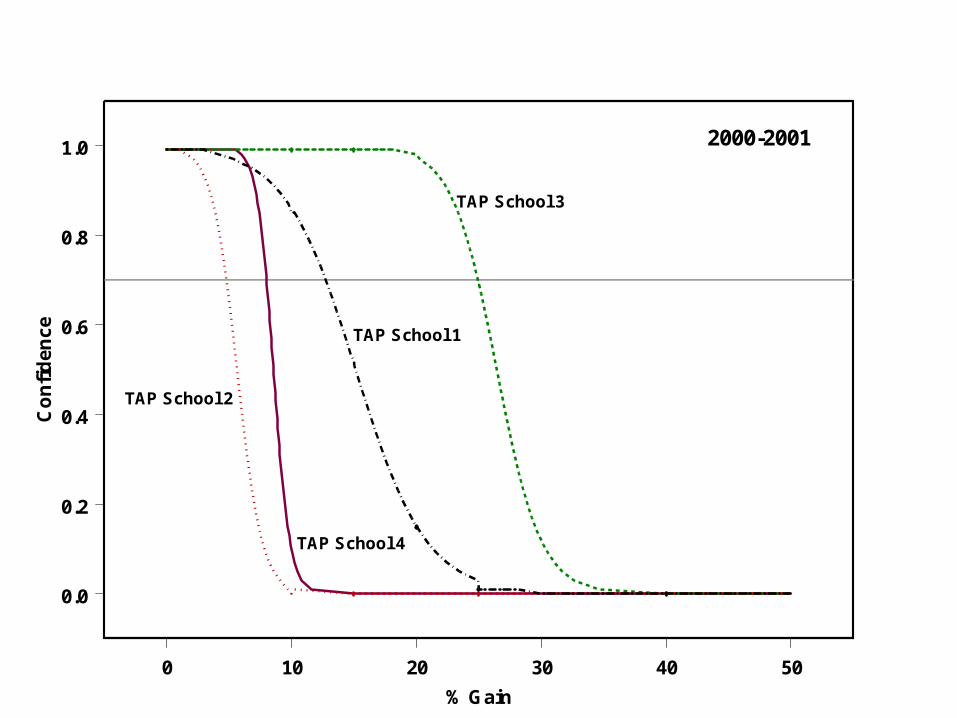
0 10 20 30 40 50
% Gain
0.0
0.2
0.4
0.6
0.8
1.0
Co
nfi
den
ce
2000-2001
TAP School 1
TAP School 4
TAP School 3
TAP School 2
0 10 20 30 40 50
% Gain
0.0
0.2
0.4
0.6
0.8
1.0
Co
nfi
den
ce
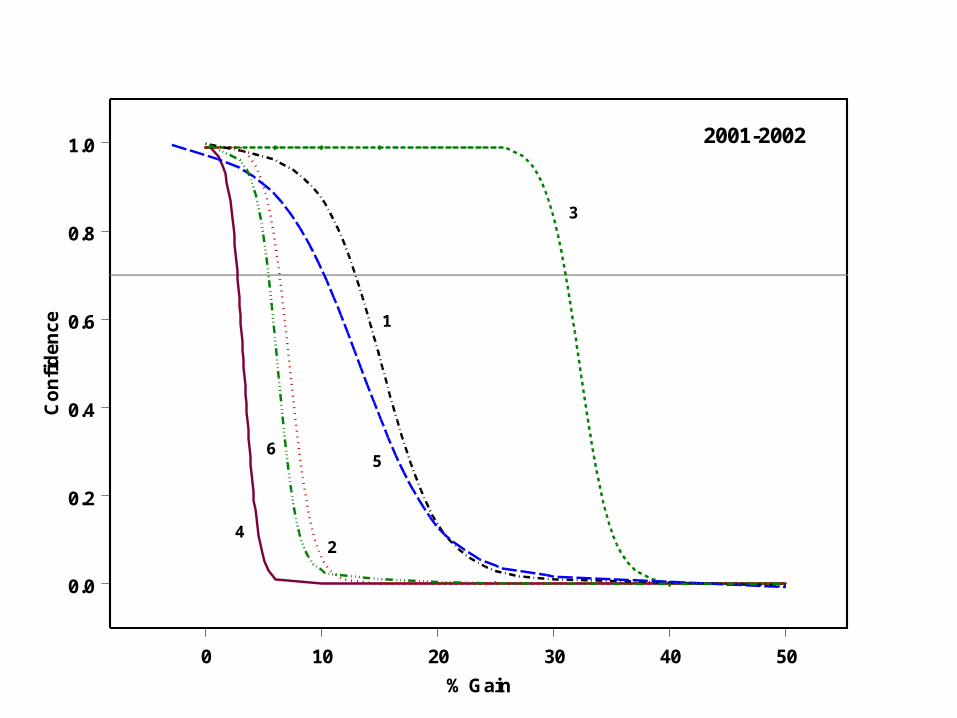
2001-2002
1
4
3
2
56
0 10 20 30 40 50
% Gain
0.0
0.2
0.4
0.6
0.8
1.0
Co
nfi
den
ce
Control Schools
70% Confident
of 4.8% Gain
2000-2001
TAP Schools
70% Confident
of 11.0% Gain
0 10 20 30 40 50
% Gain
0.0
0.2
0.4
0.6
0.8
1.0
Co
nfi
den
ce
Control Schools
70% Confident
of 5.2% Gain
2001-2002
TAP Schools
70% Confident
of 12.0% Gain

0 10 20 30 40 50
% Gain
0.0
0.2
0.4
0.6
0.8
1.0
Co
nfi
den
ce
Control School
70% Confident
of 9.5% Gain
2000-2001
TAP School 1
70% Confident
of 12.7% Gain
0 10 20 30 40 50
% Gain
0.0
0.2
0.4
0.6
0.8
1.0
Co
nfi
den
ce
Control Schools
70% Confident
of 0% Gain
2000-2001
TAP School 2
70% Confident
of 4.8% Gain
0 10 20 30 40 50
% Gain
0.0
0.2
0.4
0.6
0.8
1.0
Co
nfi
den
ce
Control Schools
70% Confident
of 8.5% Gain
2000-2001
TAP School 3
70% Confident
of 25% Gain
0 10 20 30 40 50
% Gain
0.0
0.2
0.4
0.6
0.8
1.0
Co
nfi
den
ce
Control Schools
70% Confident
of 6.0% Gain
2000-2001
TAP School 4
70% Confident
of 8.0% Gain
0 10 20 30 40 50
% Gain
0.0
0.2
0.4
0.6
0.8
1.0
Co
nfi
den
ce
Control Schools
70% Confident
of 11.5% Gain
2001-2002Implementation: 38
TAP School 1
70% Confident
of 13.0% Gain
0 10 20 30 40 50
% Gain
0.0
0.2
0.4
0.6
0.8
1.0
Co
nfi
den
ce
Control Schools
70% Confident
of 1.6% Gain
2001-2002Implementation: 37
TAP School 2
70% Confident
of 6.4% Gain
0 10 20 30 40 50
% Gain
0.0
0.2
0.4
0.6
0.8
1.0
Co
nfi
de
nce
Control Schools
70% Confident
of 0.0% Gain
2001-2002Implementation: 58
TAP School 3
70% Confident
of 31% Gain
0 10 20 30 40 50
% Gain
0.0
0.2
0.4
0.6
0.8
1.0
Co
nfi
den
ce
Control Schools
70% Confident
of 13% Gain
2001-2002Implementation: 39
TAP School 4
70% Confident
of 2.7% Gain
0 10 20 30 40 50
% Gain
0.0
0.2
0.4
0.6
0.8
1.0
Co
nfi
den
ce
2001-2002
1
4
3
2
56