Presentation NAEM 2014
21
The Tea Bag Index Bas Dingemans Joost Keuskamp Judith Sarneel Taru Lehtinen Mariet Hefting Abi Ashton [Faculty of Science Biology]
-
Upload
bas-dingemans -
Category
Education
-
view
887 -
download
0
Transcript of Presentation NAEM 2014

The Tea Bag IndexBas Dingemans
Joost KeuskampJudith SarneelTaru Lehtinen
Mariet HeftingAbi Ashton
[Faculty of ScienceBiology]
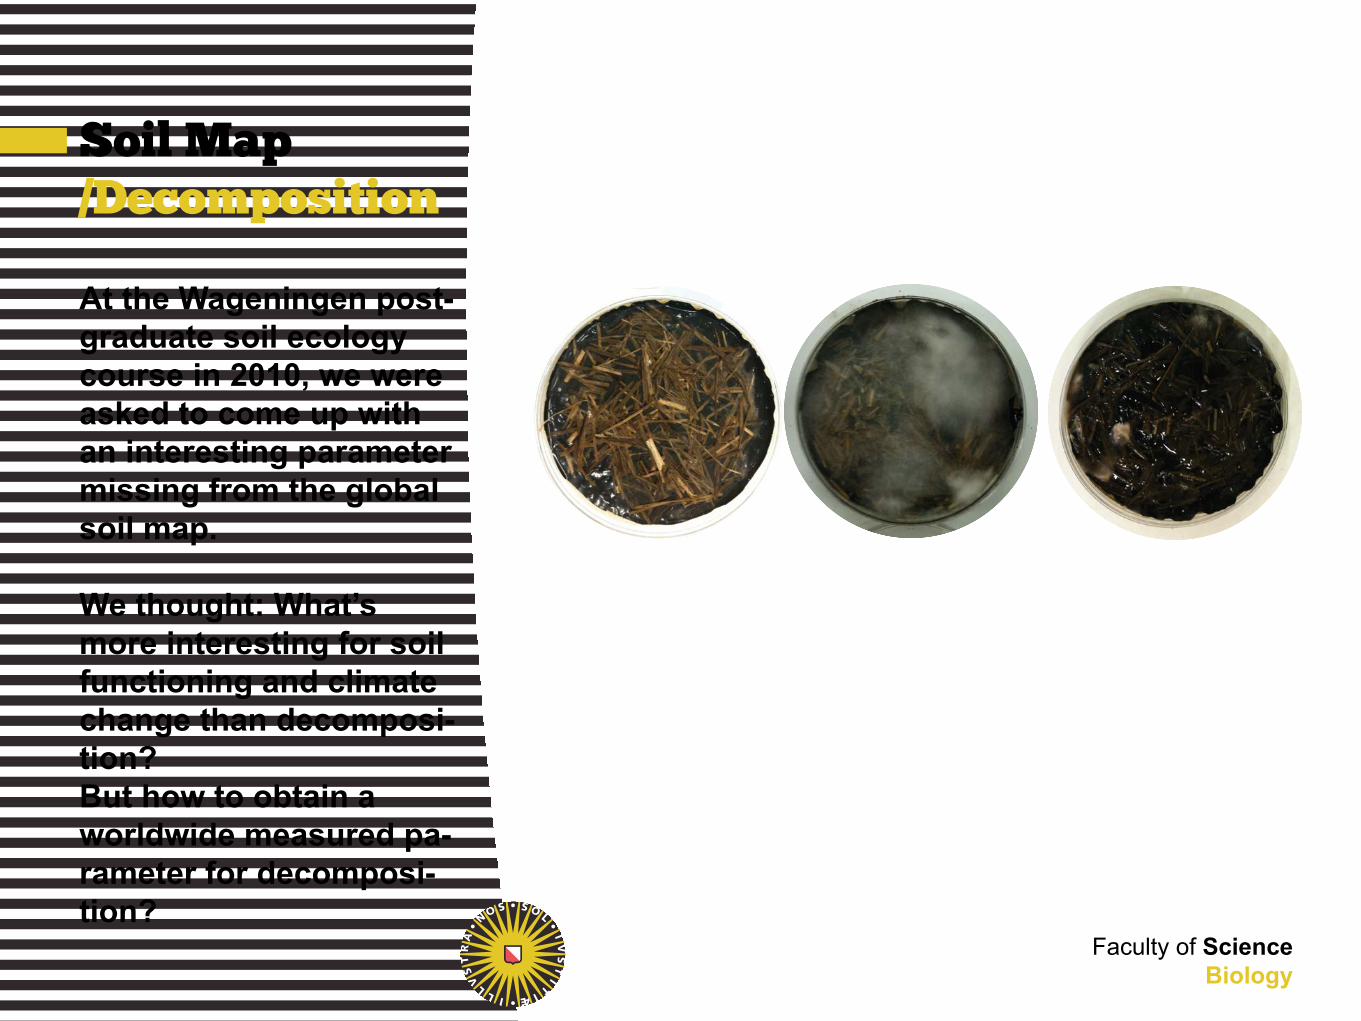
Soil Map/Decomposition
At the Wageningen post-graduate soil ecology course in 2010, we were asked to come up with an interesting parameter missing from the global soil map.
We thought: What’s more interesting for soil functioning and climate change than decomposi-tion? But how to obtain a worldwide measured pa-rameter for decomposi-tion?
Faculty of ScienceBiology

Experiments/Litterbags
One method to analyse decomposition rate in the field is measuring lit-ter mass loss using litter bags.
Making litter bags (weighing, sealing or sowing) is time consum-ing.
Moreover, to get an over-view of decomposition rate and carbon seques-tration, one has to do various measurements in time.
[Faculty of ScienceBiology]
Photo: LogLife ExperimentPoster 103
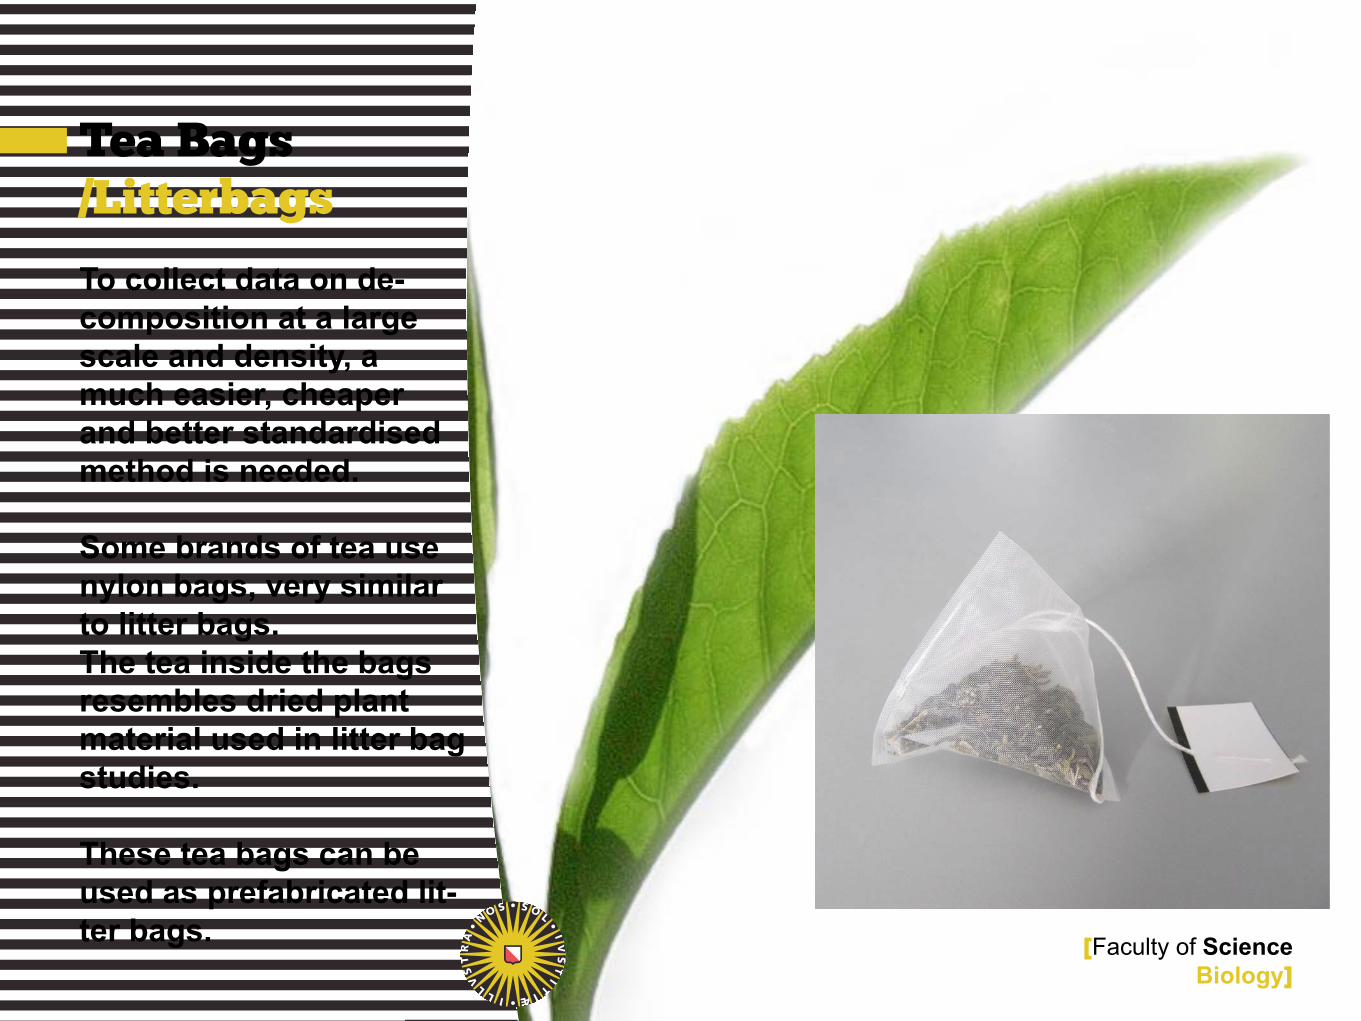
Tea Bags/Litterbags
To collect data on de- composition at a large scale and density, a much easier, cheaper and better standardised method is needed.
Some brands of tea use nylon bags, very similar to litter bags.The tea inside the bags resembles dried plant material used in litter bag studies.
These tea bags can be used as prefabricated lit-ter bags. [Faculty of Science
Biology]

Tea Bags/Decomposable
After extensive experi-menting burying different tea types, we chose two tea types that differed in decomposability: Green tea and Rooibos tea.
Green tea decomposed faster than rooibos tea and reached the fase where decomposition stagnates faster than rooibos tea.
Our goal was to get as much information as pos-sible out of one harvest in time.
0
1.0
0.8
0.6
0.4
Rel
ativ
e M
ass
Rem
aini
ng (g
g-1
)
0.2
0.010 20 30
Time (days)40 50 60
Rooibos tea
Green tea
[Faculty of ScienceBiology]

Tea bags/C fractions
We used chemical com-position analyses and linked that to decompos-ability.
Compared to rooibos tea, green tea contains a lot of water soluble carbon, while rooibos tea con-tains more acid insoluble carbon.
Therefore Rooibos teais more recalcitrant and decomposes slower than the green tea.
[Faculty of ScienceBiology]
0.03
0.520.30
0.150.00 0.03
0.22
0.37
0.37
0.00
Non-polar extractablesWater solublesAcid solublesAcid insolublesMineral fraction
Rooibos TeaGreen Tea

[Faculty of ScienceBiology]
Tea Bag Index/Calculations
From the weight loss and the initial chemical composition of the tea we calculate two parame-ters, comprising the TBI:
Decomposition rate k
A measure for turnover time of labile carbon
Stabilisation factor S
A measure for stabilisa-tion potential of organic carbon

[Faculty of ScienceBiology]
Tea Bag Index/Calculations
We modelled decompo-sition after Brock et al. (1985) as an exponential decay curve operating at two pools: a labile and a recalcitrant carbon pool.
W(t)=a e-kt + (1-a)
where W(t) is the mass fraction remaining at time t, a is labile pool fraction and k is initial decompo-sition rate of the labile pool.We assume that the mass loss of the recalcitrant pool is negligible.
Rooibos tea
Green tea
0
1.0
0.8
0.6
0.4
Rel
ativ
e M
ass
Rem
aini
ng (g
g-1
)
0.2
0.0
20 40 60Time (days)
80 100 120 140

[Faculty of ScienceBiology]
Tea Bag Index/Calculations
S is calculated from the green tea results:
S = 1 - ag / Hg
where ag is the decom-posable fraction of Green tea based on the mass loss in the field and Hg is the hydrolysable fraction of Green tea.
S can be interpreted as the inhibiting effect of en-vironmental conditions on decomposition of la-bile litter fraction
Green tea
0.03
0.520.30
0.150.00
Non-polar extractablesWater solublesAcid solublesAcid insolublesMineral fraction
Hg{
ag
0
1.0
0.8
0.6
0.4
Rel
ativ
e M
ass
Rem
aini
ng (g
g-1
)
0.2
0.0
20 40 60Time (days)
80 100 120 140

[Faculty of ScienceBiology]
Tea Bag Index/Calculations
Because the decomposa-ble fraction of Red tea (ar) cannot be determined in the field in a short-term incubation period, we es-timated ar under the as-sumption that S is equal for Green and Rooibos tea:
ar = Hr (1 - S)
where Hr is the hydrolys- able fraction of Red tea.
Rooibos tea
0
1.0
0.8
0.6
0.4
Rel
ativ
e M
ass
Rem
aini
ng (g
g-1
)
0.2
0.0
20 40 60Time (days)
80 100 120 140
0.03
0.22
0.37
0.37
0.00
Non-polar extractablesWater solublesAcid solublesAcid insolublesMineral fraction
Hr{
ar

[Faculty of ScienceBiology]
Tea Bag Index/Calculations
k is now calculated by linearising and solving the exponential decay function for the labile lit- ter pool:
Wr(t) = ar e-kt + (1-ar)
ln(ar)-ln(Wr(t))-(1-ar) k = t
8
734
1
265 17
16
1415
10
9
1112
13* 1234567891011121314151617
US-FL mangrove-dwarfUS-FL mangrove-fringe
IE peat-disturbedIE peat-undisturbed
IS grassland-warmedIS grassland-ambient
CN desert-sandyCN desert-loamy
NL forestNL wet forest
NL pastureNL peat
PA forestAU mixed forestAU birch forest
Lab 25°CLab 15°C
0.00 .1 0.20 .3 0.40 .5 0.60 .7
0.00
0.01
0.02
0.03
Stabilisation factor (S)
Dec
ompo
sitio
n ra
te (k
)
Keuskamp, Dingemans et al. 2013, Methods in Ecology and Evolution

Research/Iceland
An example of success-ful implementation of the TBI method is research in Iceland.
In a geothermally heat-ed valley with plots on cold and heated soil with comparable soil condi-tions.
[Faculty of ScienceBiology]
Reykjavik Hveragerdi
Iceland
< 0.8 M j
Land age
0.8 - 3.3 M j
3.3 - 15 M j
Research/Iceland
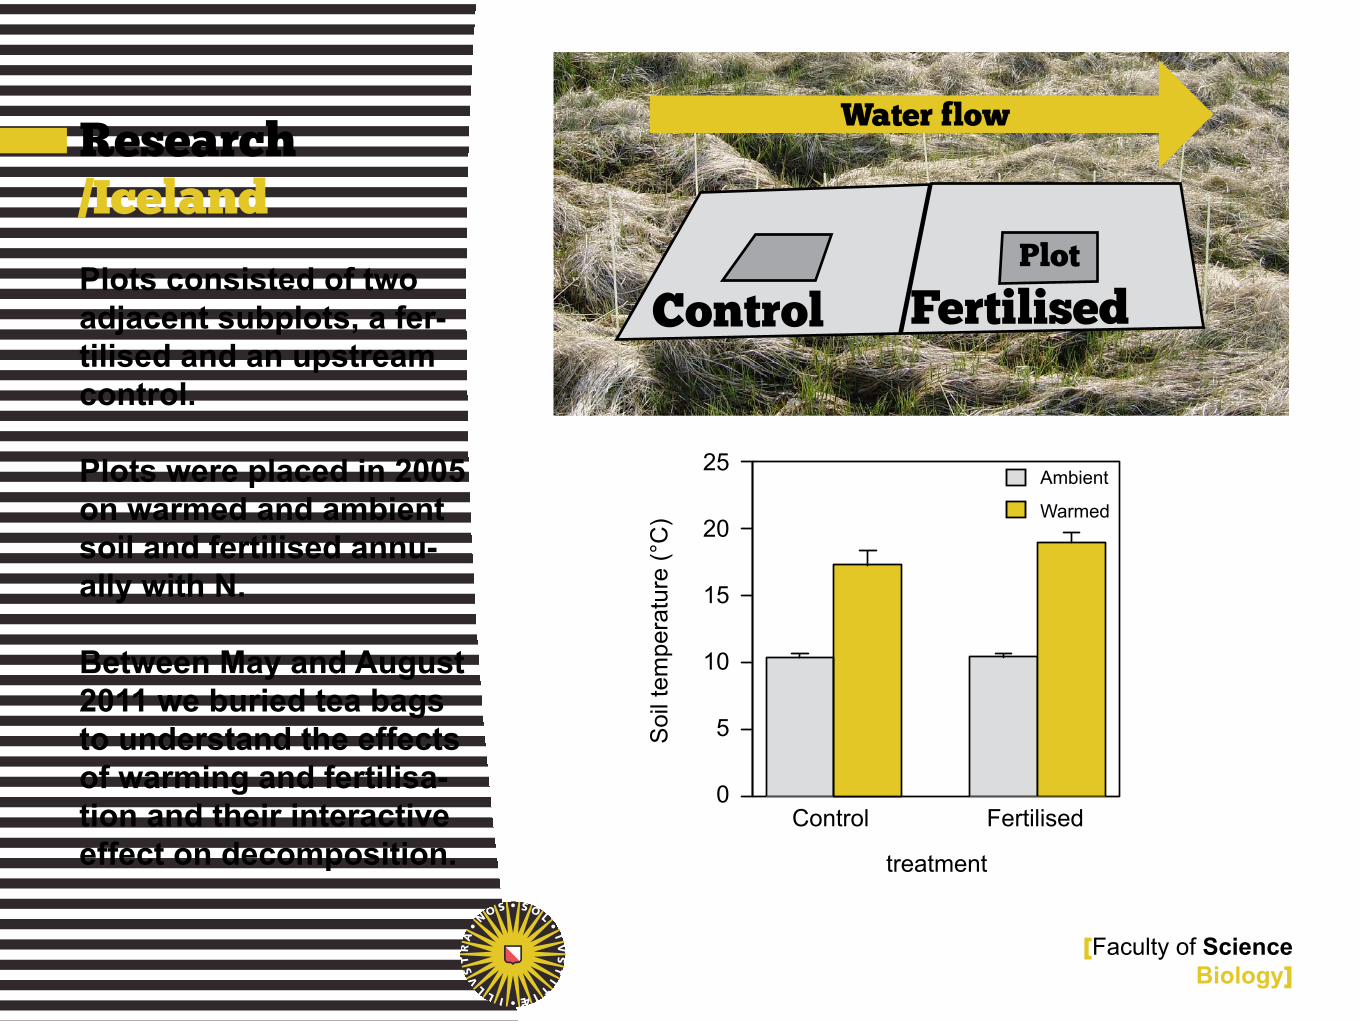
Plots consisted of two adjacent subplots, a fer-tilised and an upstream control.
Plots were placed in 2005 on warmed and ambient soil and fertilised annu-ally with N.
Between May and August 2011 we buried tea bags to understand the effects of warming and fertilisa-tion and their interactive effect on decomposition.
[Faculty of ScienceBiology]
Control FertilisedPlot
Water flow
25
20
15
10
5
0
Soi
l tem
pera
ture
(°C
)
Ambient
Warmed
Control
treatment
Fertilised

Research/Iceland
We buried a pair of green and rooibos tea bags in 80 plots and I was very happy to find most of them back after 3 months.
[Faculty of ScienceBiology]

Research/Iceland
Neither warming nor fer-tilisation had effect on the decomposition rate, however the stabilised fraction of tea in warmed plots was lower and, in the ambient plots, ferti-lisation caused a lower stabilised fraction of tea.
[Faculty of ScienceBiology]
0.0 0.1 0.2 0.30.00
0.01
0.02
0.03
Stabilised fraction (S)D
ecom
posi
tion
rate
(k)
UA
UW FA
FW
Dingemans et al. 2014, in prep.
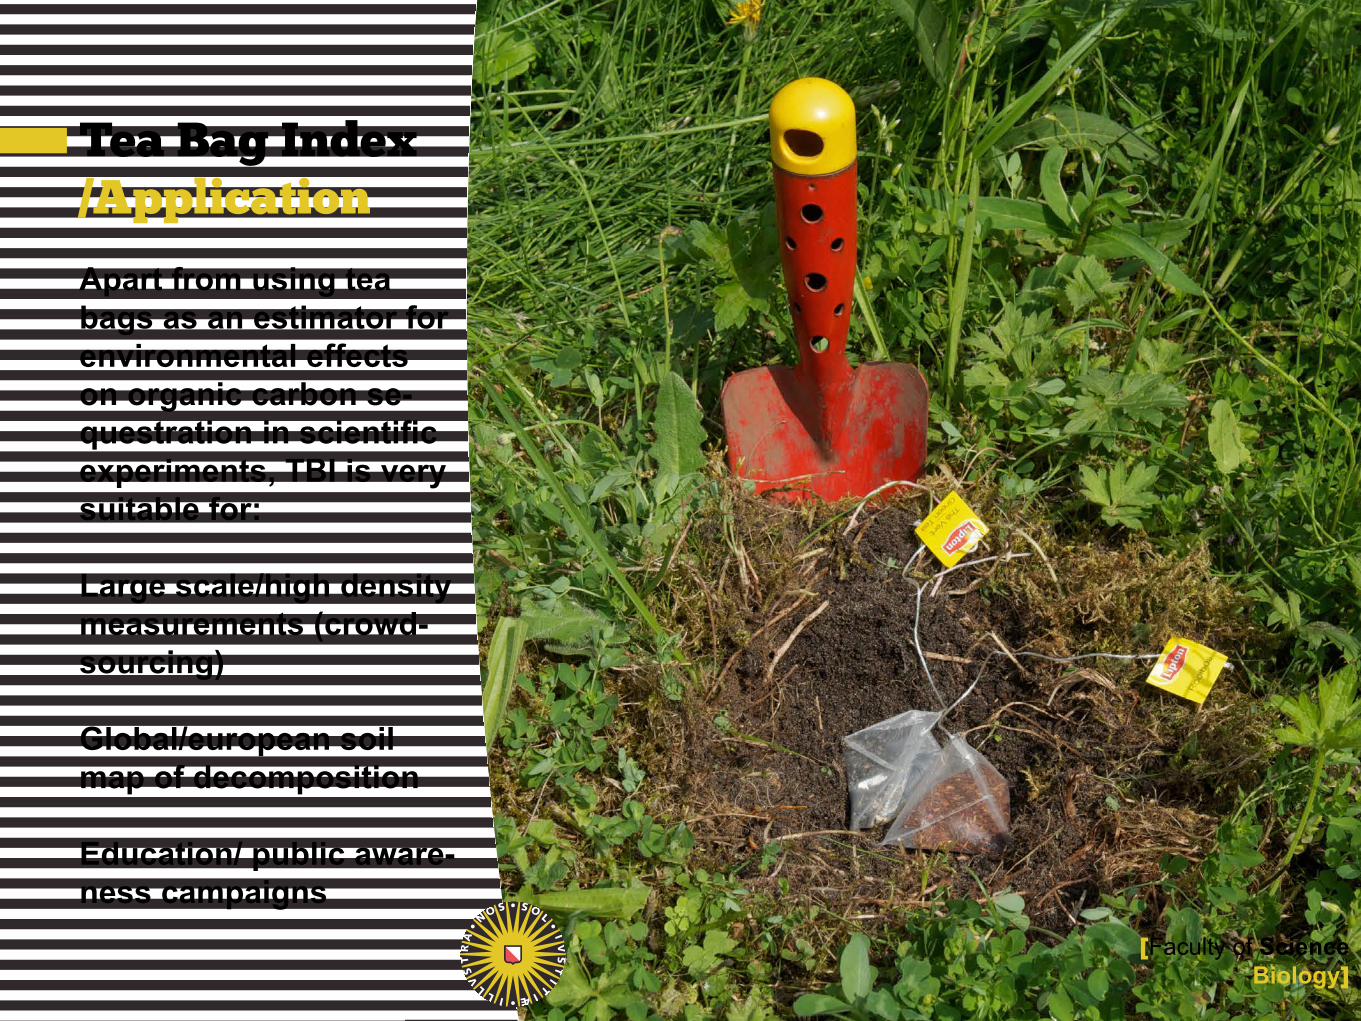
Tea Bag Index/Application
Apart from using tea bags as an estimator for environmental effects on organic carbon se-questration in scientific experiments, TBI is very suitable for:
Large scale/high density measurements (crowd- sourcing)
Global/european soil map of decomposition
Education/ public aware- ness campaigns
[Faculty of ScienceBiology]

Tea Bag Index/Crowdsourcing
The simplicity and low resource requirements make the TBI suitable for crowdsourcing.
We ask teadrinker world-wide to cooperate with our experiment.
They just have to bury two tea bags and weigh them after 3 months.
[Faculty of ScienceBiology]
@
production
distribution
bury tea bags
3 months in soil
decolab.org/tbi
weighing
harvest tea bags

Tea Bag Index/Soil Map
The results from these individual experiments have the potential to re-sult in a parameter for decomposition in the global soil map.
[Faculty of ScienceBiology]
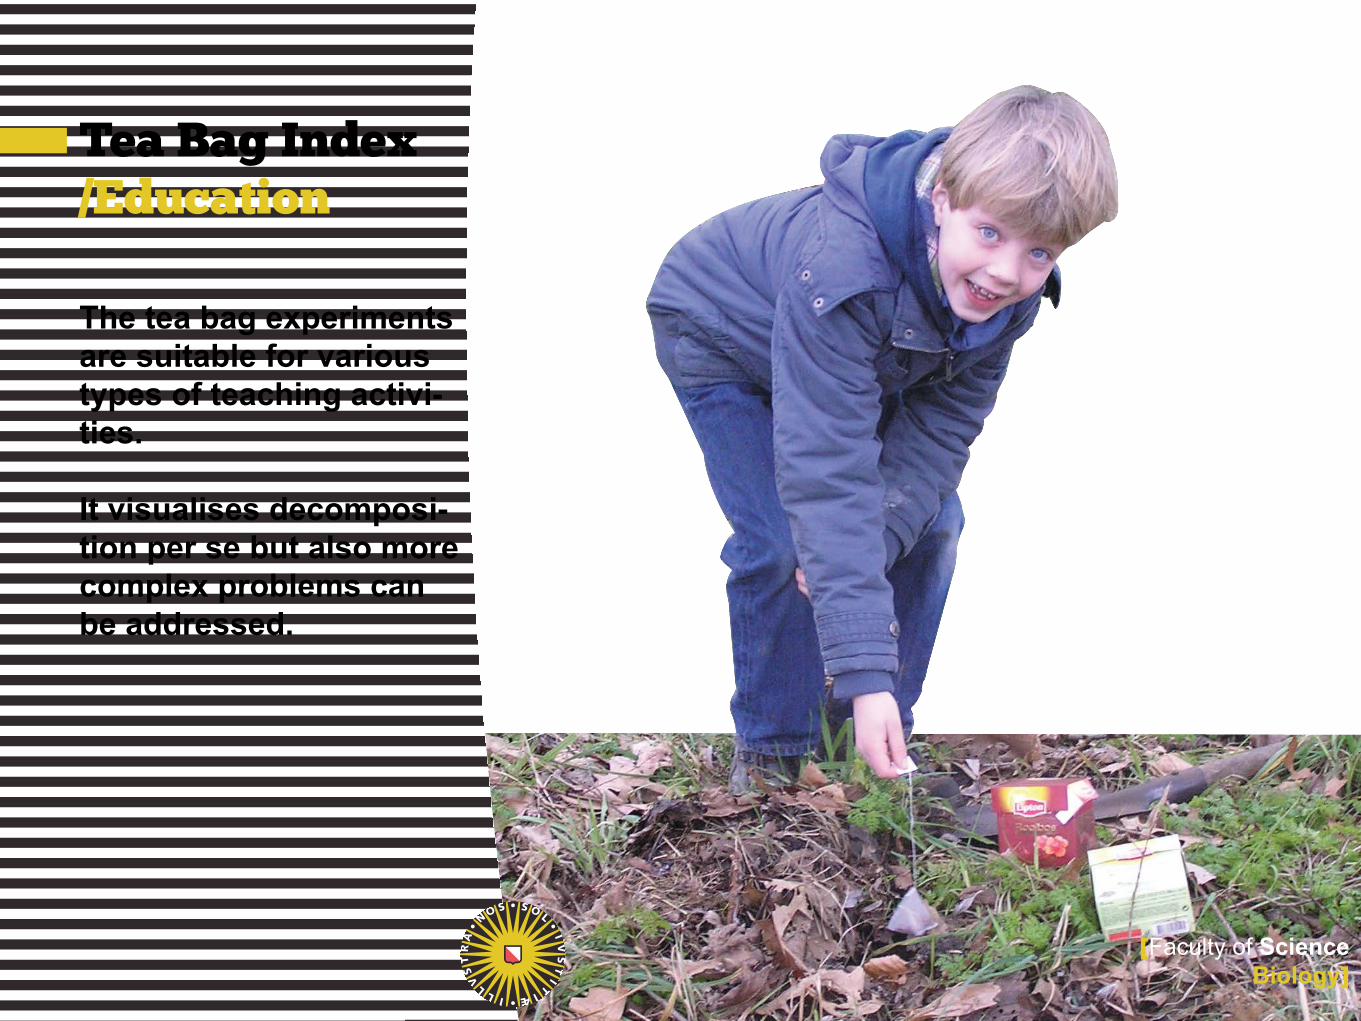
Tea Bag Index/Education
The tea bag experiments are suitable for various types of teaching activi- ties.
It visualises decomposi- tion per se but also more complex problems can be addressed.
[Faculty of ScienceBiology]

Faculty of ScienceBiology
Tea Bag Index/Future success
Method is accepted with-in the scientific commu-nity, but now...
We still aim to make the method more user-friendly.
Continuation and con-stant quality of Lipton tea and tea bags.
Global distribution
Implementing the param-eter in a global soil map.

[Faculty of ScienceBiology]
facebook.com/teabagindex
@TeaBagIndex
www.decolab.org/tbi
on behalf of the TBI team, thanks!