Preparing Students for Graduation and Beyond Jim Hull 2011 NSBA Annual Conference April 9, 2011.
61
Preparing Students for Graduation and Beyond Jim Hull 2011 NSBA Annual Conference April 9, 2011
-
Upload
kassandra-patridge -
Category
Documents
-
view
214 -
download
0
Transcript of Preparing Students for Graduation and Beyond Jim Hull 2011 NSBA Annual Conference April 9, 2011.
Preparing Students for Graduation and Beyond
Jim Hull2011 NSBA Annual Conference
April 9, 2011
Preparing students for graduation and beyond
• Getting students to graduate high school
• Preparing students for college/career
• Determining how prepared students are for postsecondary success
Meet our students
• Pat• Crystal• Brittney• Ricky
WHAT DID OUR STUDENTS’ SCHOOLS DO
DIFFERENTLY?

Pat’s SchoolsSITUATION
Middle School• Excessive absences • Poor grades
High School• Skipped school• Failed coursed
RESPONSE
Middle School• Retained in 7th grade
High School• Suspensions
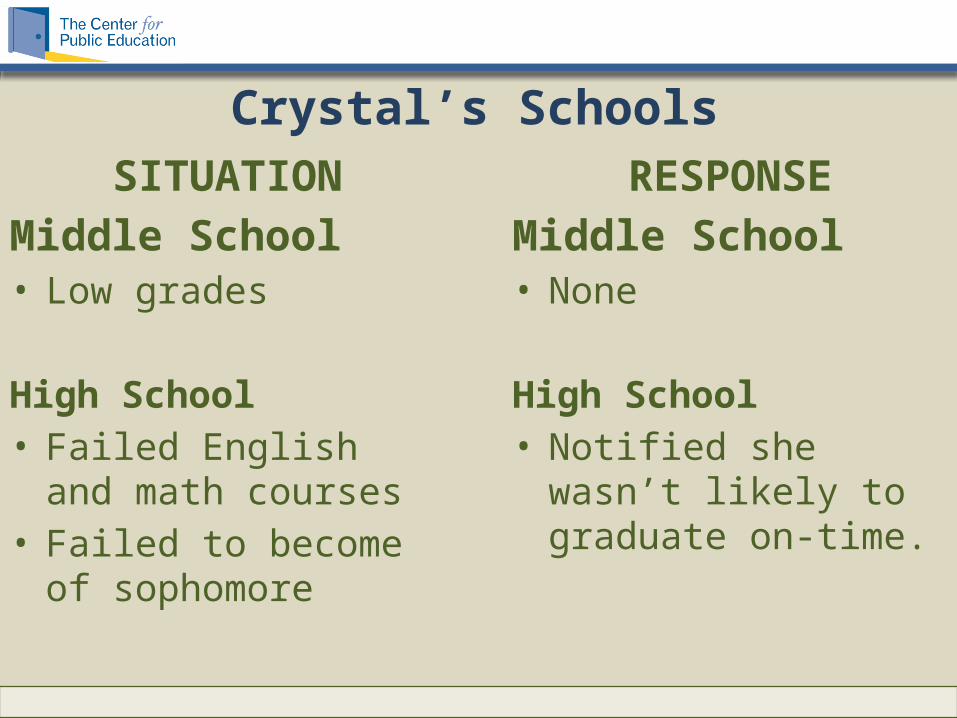
Crystal’s SchoolsSITUATION
Middle School• Low grades
High School• Failed English and
math courses• Failed to become of
sophomore
RESPONSE
Middle School• None
High School• Notified she wasn’t
likely to graduate on-time.

Brittney’s SchoolsSITUATION
Middle School• Low grades
High School• Failed General Math• Passed other courses
RESPONSE
Middle School• None
High School• Provided extra help in math
in her sophomore year.• Encouraged to complete
her course requirements• Arranged class schedule to
meet her needs
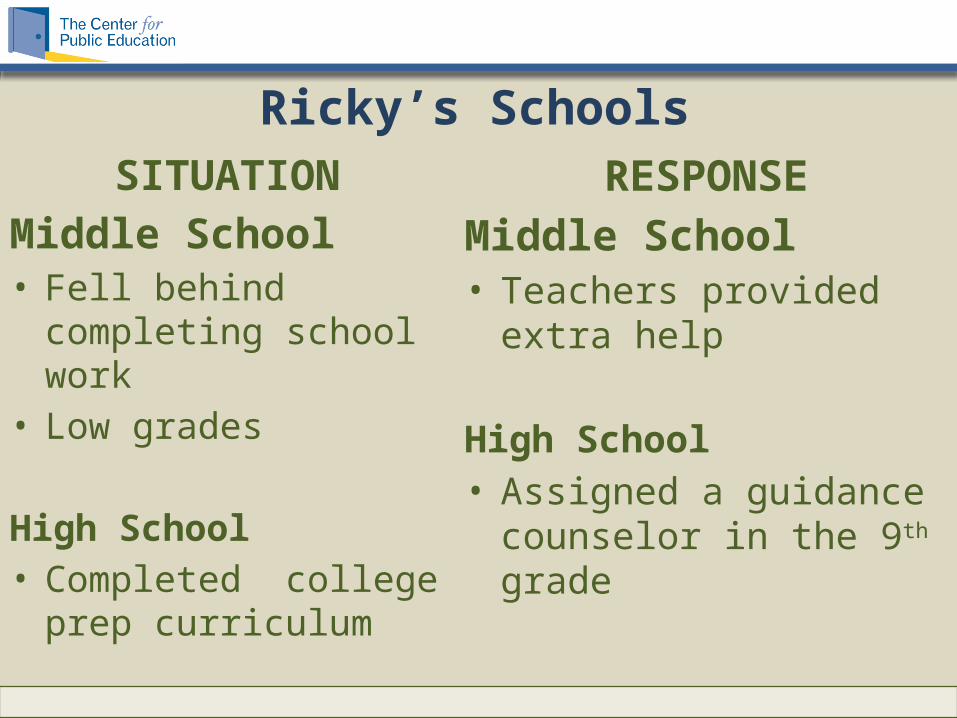
Ricky’s SchoolsSITUATION
Middle School• Fell behind completing
school work• Low grades
High School• Completed college
prep curriculum
RESPONSE
Middle School• Teachers provided extra
help
High School• Assigned a guidance
counselor in the 9th grade
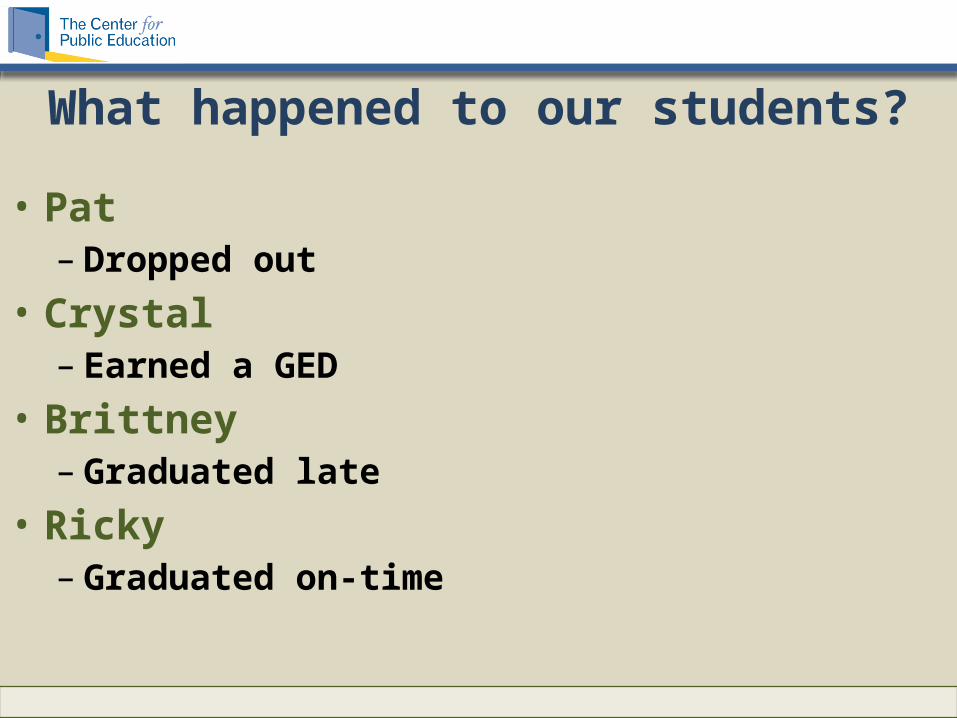
What happened to our students?
• Pat – Dropped out
• Crystal – Earned a GED
• Brittney – Graduated late
• Ricky – Graduated on-time

Why the different outcomes?
Why Students Dropout
• Dropouts are twice as likely to say they left for school related reasons as for family or personal circumstances.
• School related factors are a better predictor of who will dropout than such characteristics as race, poverty, gender, or family background.
Prediction
• 85% of eventual dropouts can be identified by 9th
grade.
– 50% of eventual dropouts show signs in 5th & 6th grade.
• The strongest predictors are academic failure &
disengagement from school
What schools can do
Early warnings of dropping out• Excessive absenteeism• Suspension/Behavior grades• Failed courses, especially in 9th grade• Extreme drop in GPA• Overage due to earlier retentions

Intervention
• Most effective intervention provide ongoing,
comprehensive counseling that is personalized.
• Occasional tutoring, counseling, or activities to
boost self-esteem do almost nothing to keep
students in school.
Prevention
• High-quality pre-kindergarten has many benefits,
including high school completions
• Small schools
• Good relationships with adults
• Strong and relevant curriculum

Recovery
• Unfortunately, researchers can’t reliably predict
100% of eventual dropouts.
• Some programs are showing considerable
promise.
• More research is needed.
WHAT DID RICKY’S SCHOOLS DO DIFFERENTLY?

How did Ricky’s schools do?
• Prediction: identified Ricky early
• Intervention: provided on-going personalized support
• Prevention: established good adult relationships and
provided Ricky with a rigorous and relevant curriculum
• Recovery: didn’t need to because they kept Ricky on
track to graduate.

WHAT ACTIONS SCHOOLS TAKE MAKE A DIFFERENCE
EARNING A HIGH SCHOOL DIPLOMA IS NOT ENOUGH
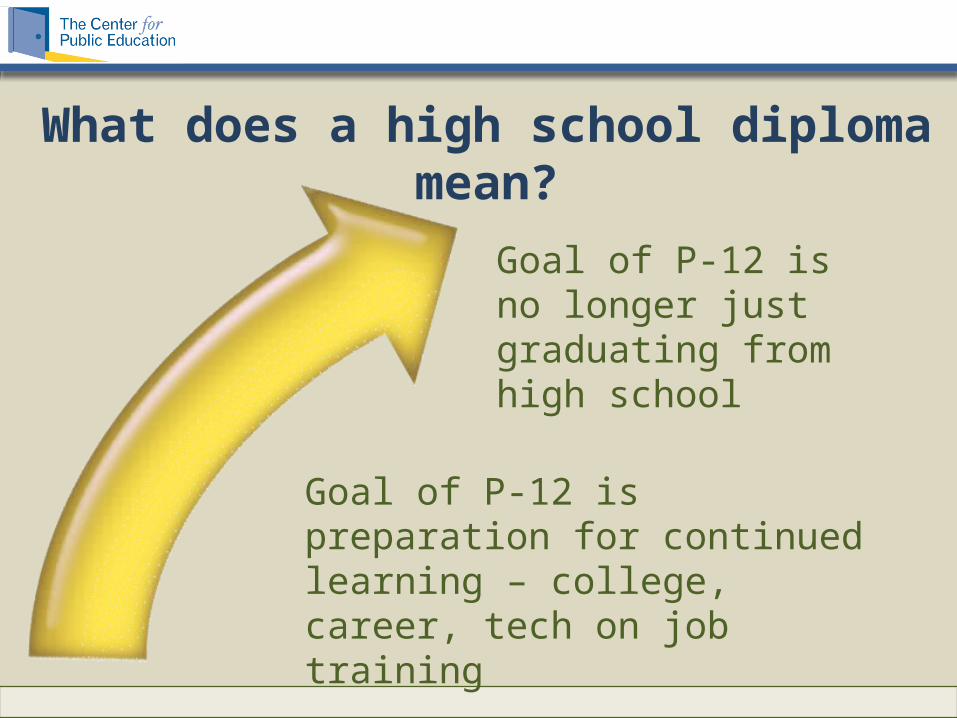
What does a high school diploma mean?
Goal of P-12 is no longer just graduating from high school
Goal of P-12 is preparation for continued learning – college, career, tech on job training

Changing WorkersFarm Factory/Office
Knowledge

Earnings boost for college degree has grown immensely
Source: Mortenson, T. (2007, November). Average family income by educational attainment of householder 1967 to 2006. Postsecondary Education Opportunity, 185. (p. 15)
-13%
6%14%
40%
59%
HS Dropout HS Graduate Some College Bachelor's Graduate or Professional
degree
Change in average family income from 1973 to 2006
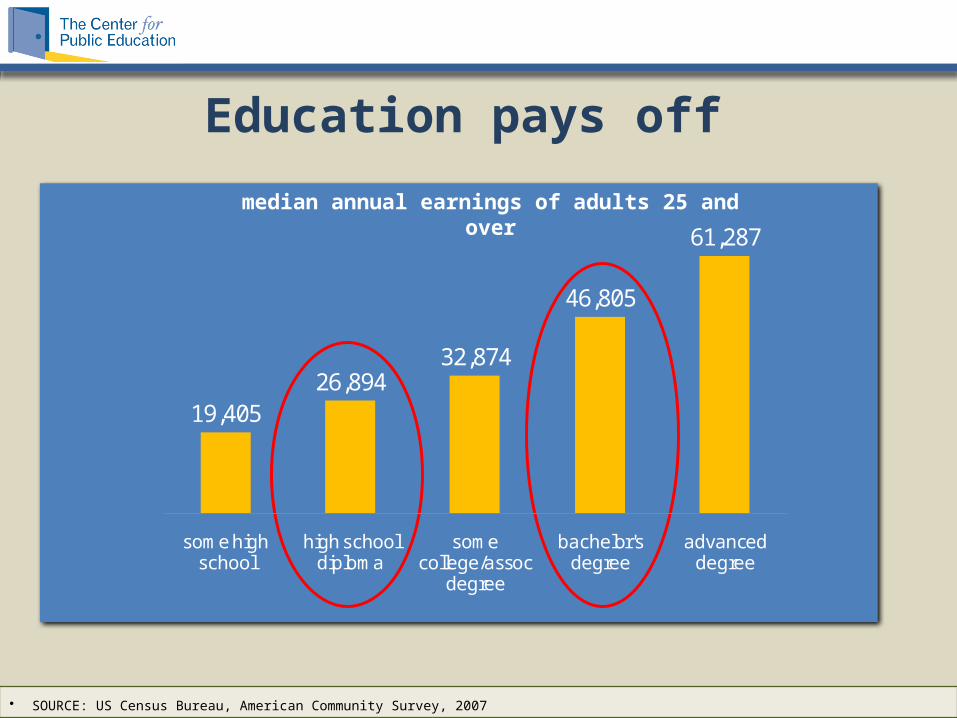
Education pays off
19,40526,894
32,874
46,805
61,287
some high school
high school diploma
some college/assoc
degree
bachelor's degree
advanced degree
median annual earnings of adults 25 and over
• SOURCE: US Census Bureau, American Community Survey, 2007
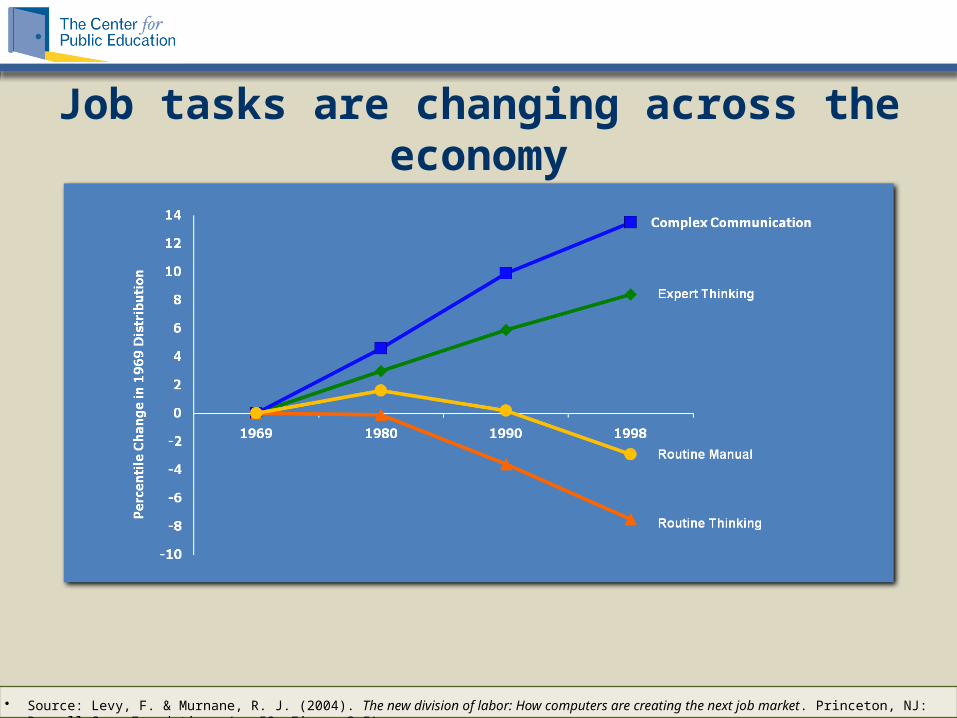
Job tasks are changing across the economy
• Source: Levy, F. & Murnane, R. J. (2004). The new division of labor: How computers are creating the next job market. Princeton, NJ: Russell Sage Foundation. (p. 50, Figure 3.5)

SOURCE: Carnavale, College for All? Change, January/February 2008
Postsecondary education means more than ever: The
‘upskilling’ of jobs
2838
63
12
5969
86
36
All jobs Office work Tech jobs Factory jobs
1973
Today
Percent of workers with some college
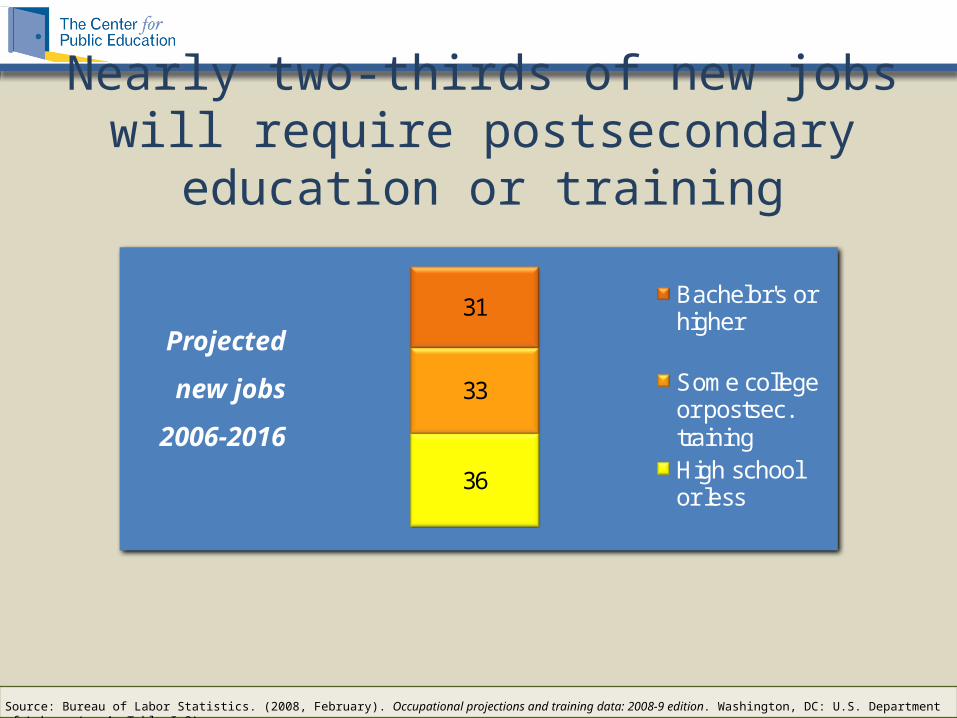
Nearly two-thirds of new jobs will require postsecondary education or
training
Source: Bureau of Labor Statistics. (2008, February). Occupational projections and training data: 2008-9 edition. Washington, DC: U.S. Department of Labor. (p. 4, Table I-3)
36
33
31 Bachelor's or higher
Some college or postsec. trainingHigh school or less
Projected
new jobs
2006-2016
Three kinds of learning are becoming increasingly important if not essential for students to succeed in work and life:
• Traditional academic knowledge and skills
• Real world application of academic knowledge & skills, or “applied literacies”
• Broader competencies, or so-called 21st century skills
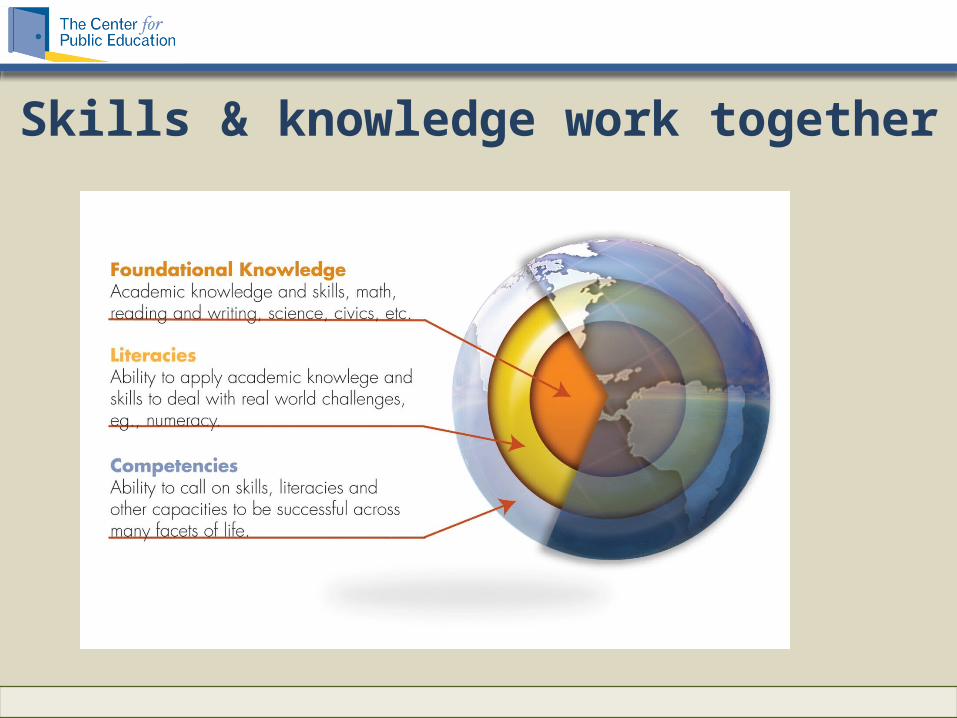
Skills & knowledge work together
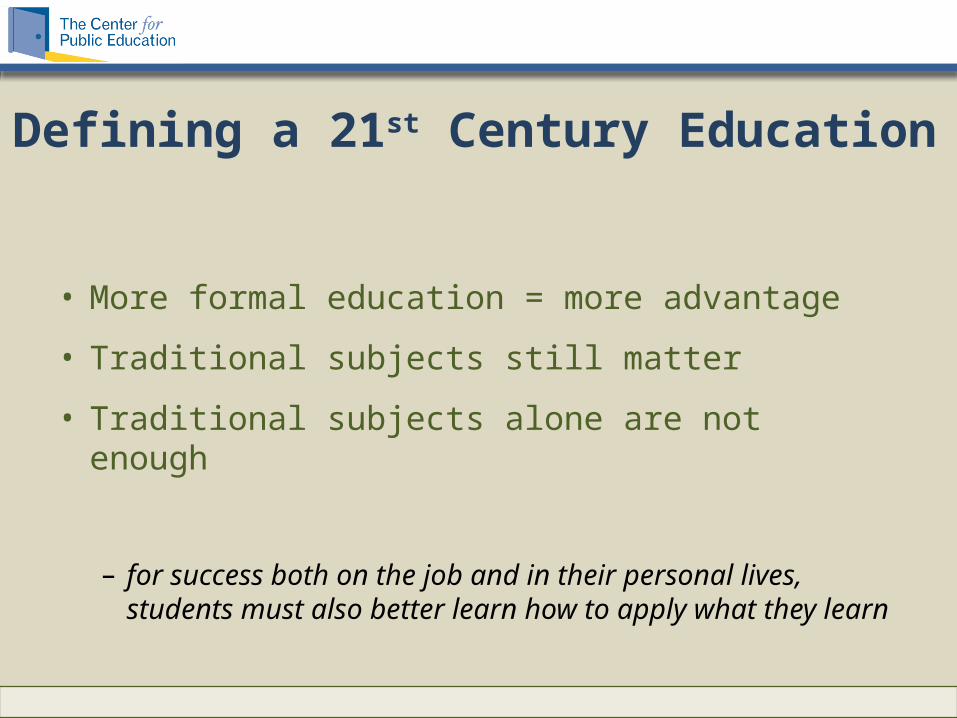
• More formal education = more advantage
• Traditional subjects still matter
• Traditional subjects alone are not enough
– for success both on the job and in their personal lives, students must also better learn how to apply what they learn
Defining a 21st Century Education
What does this mean for our students?

What does it mean for our students?
• Pat – Mechanic
• Crystal – Electrician
• Brittney – Nurse
• Ricky – Teacher

GETTING INTO A GOOD COLLEGE
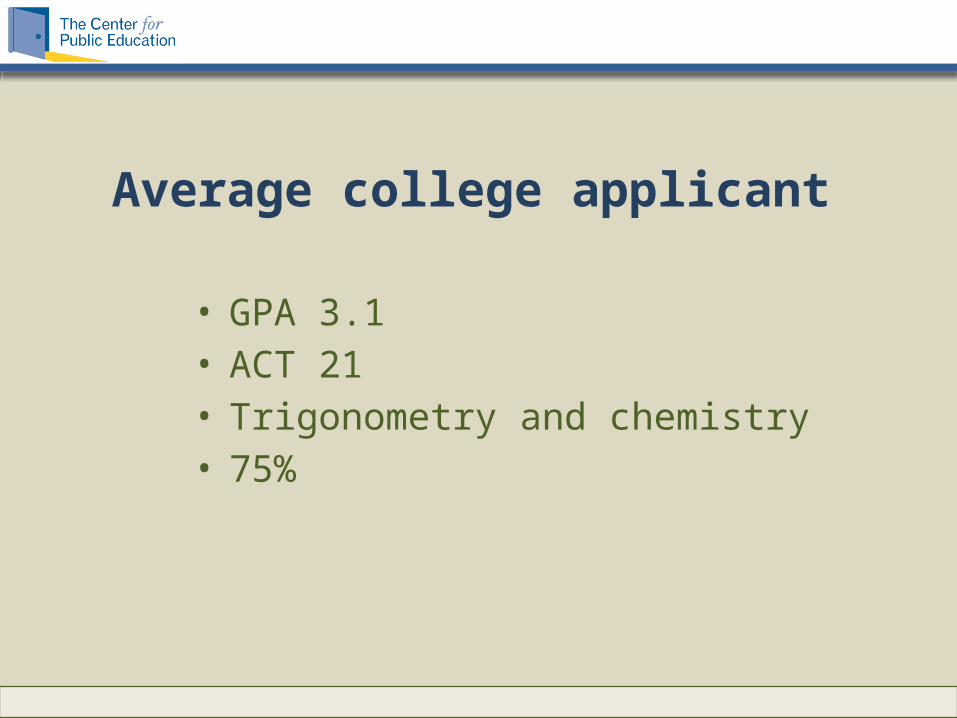
Average college applicant • GPA 3.1• ACT 21• Trigonometry and chemistry• 75%
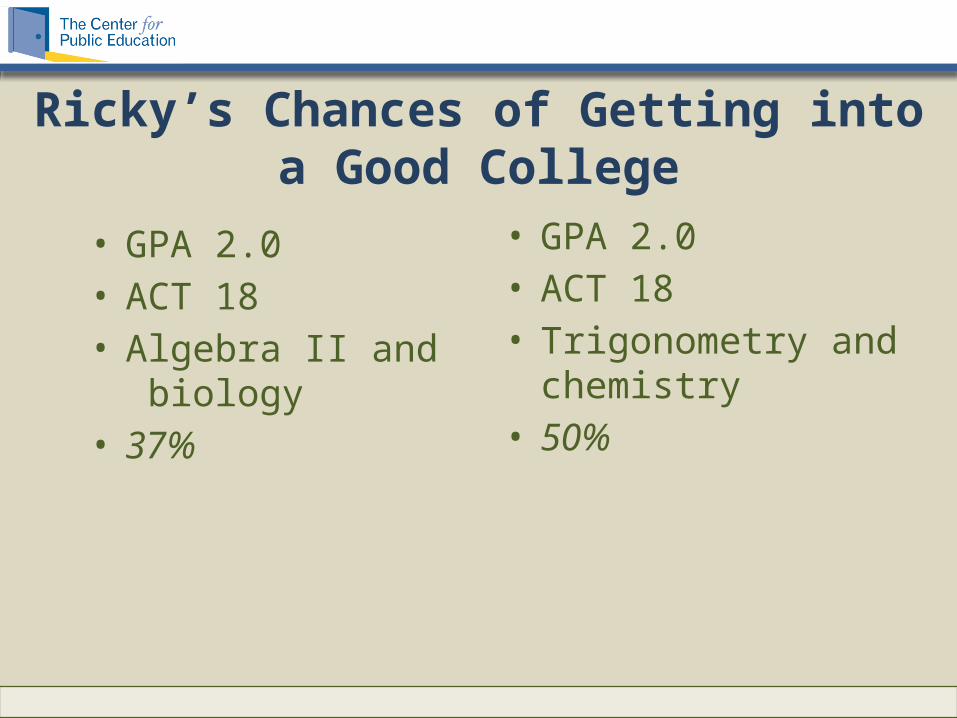
Ricky’s Chances of Getting into a Good College
• GPA 2.0• ACT 18• Trigonometry and
chemistry• 50%
• GPA 2.0• ACT 18• Algebra II and
biology• 37%

What would raise a student’s chances?
• More rigorous coursework– Pre-calculus 75% to 79%
• Higher ACT– 22 over 21 75% to 78%
• Increase GPA– 3.1 to 3.6 75% to 79%
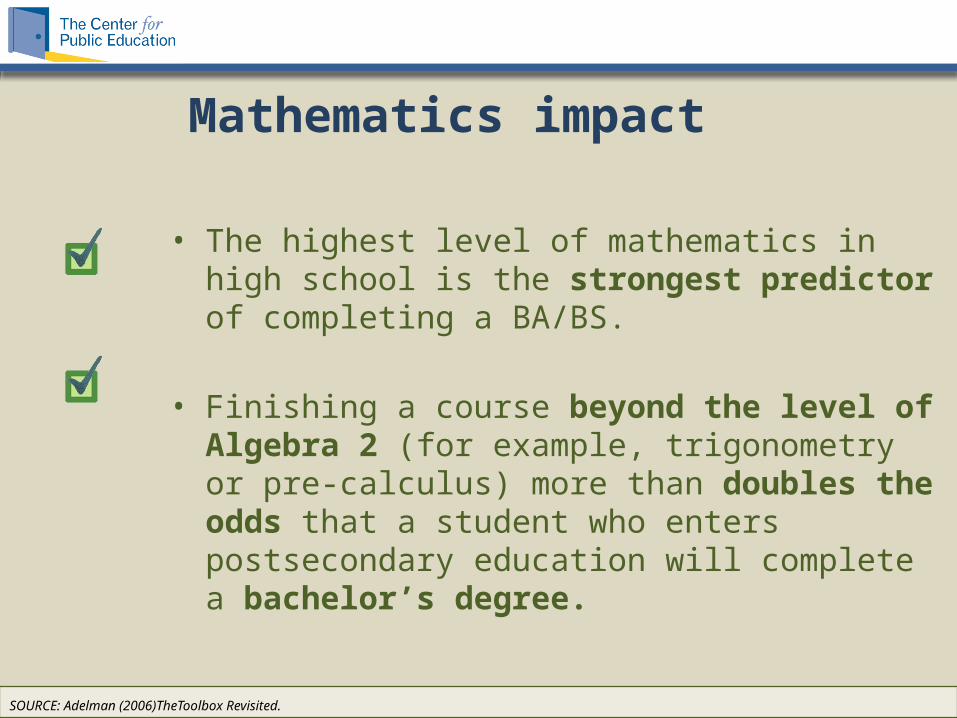
• The highest level of mathematics in high school is the strongest predictor of completing a BA/BS.
• Finishing a course beyond the level of Algebra 2 (for example, trigonometry or pre-calculus) more than doubles the odds that a student who enters postsecondary education will complete a bachelor’s degree.
Mathematics impact
SOURCE: Adelman (2006)TheToolbox Revisited.

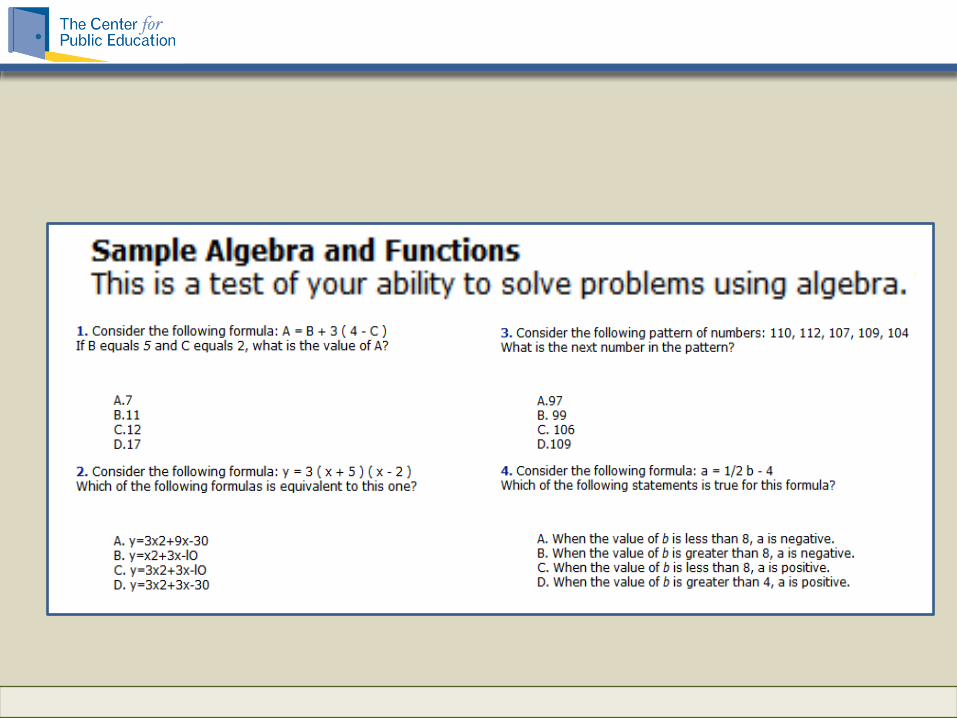
What is the likelihood of each of our students being able to
solve this problem?
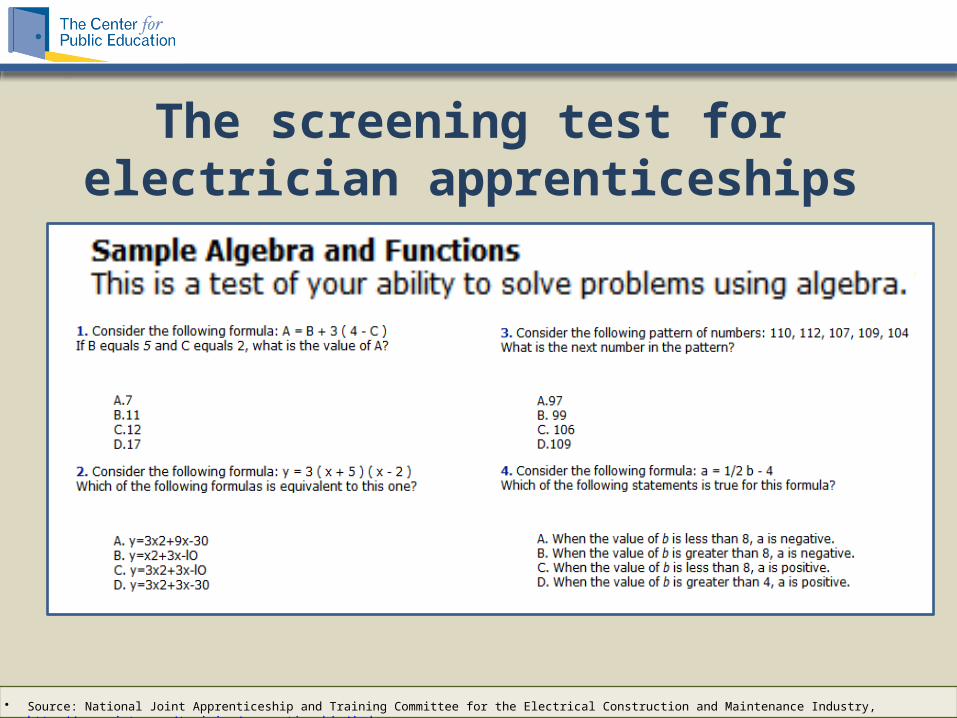
The screening test for electrician apprenticeships
• Source: National Joint Apprenticeship and Training Committee for the Electrical Construction and Maintenance Industry, http://www.njatc.org/training/apprenticeship/index.aspx
IT’S NOT JUST ABOUT GETTING STUDENTS INTO
COLLEGE
Trades becoming more technical, requiring stronger
math & readingThe math and reading skills
required for electricians,
construction workers,
upholsterers and plumbers are
the same as what’s necessary to
succeed in first-year college
courses.
SOURCE: ACT, Readiness for College and Readiness for Work: Same or Different, Iowa City, IA. 2006
Ready for College and Ready for Work:Same or Different?
ACT study answered question by:
• Identifying the level of reading and mathematics skills students need to be ready for entry-level jobs that require less than a bachelor’s degree, pay a wage sufficient to support a family, and offer the potential for career advancement
• Comparing student performance on ACT tests that measure workforce readiness with those that measure college readiness
• Determining if the levels of performance needed for college and workforce readiness are the same or different
SOURCE: ACT, Readiness for College and Readiness for Work: Same or Different, Iowa City, IA. 2006
• The high school curriculum matters
• Challenges:
Providing rigorous curriculum to all students, not just some
Providing relevance and support so all students learn it
Key Lesson

ARE YOUR GRADUATES PREPARED FOR
POSTSECONDARY SUCCESS?
What data would you use?

Student outcome datafor high school and beyond
• Graduation rates– by race, ethnicity, family income– by special program
• Local targets– AP, IB tests– ACT, SAT– Curriculum rigor completion
• Postsecondary success

• College acceptance• College enrollment• College remediation• College proficiency (persistence)• College completion• Career success
What data can we gather?
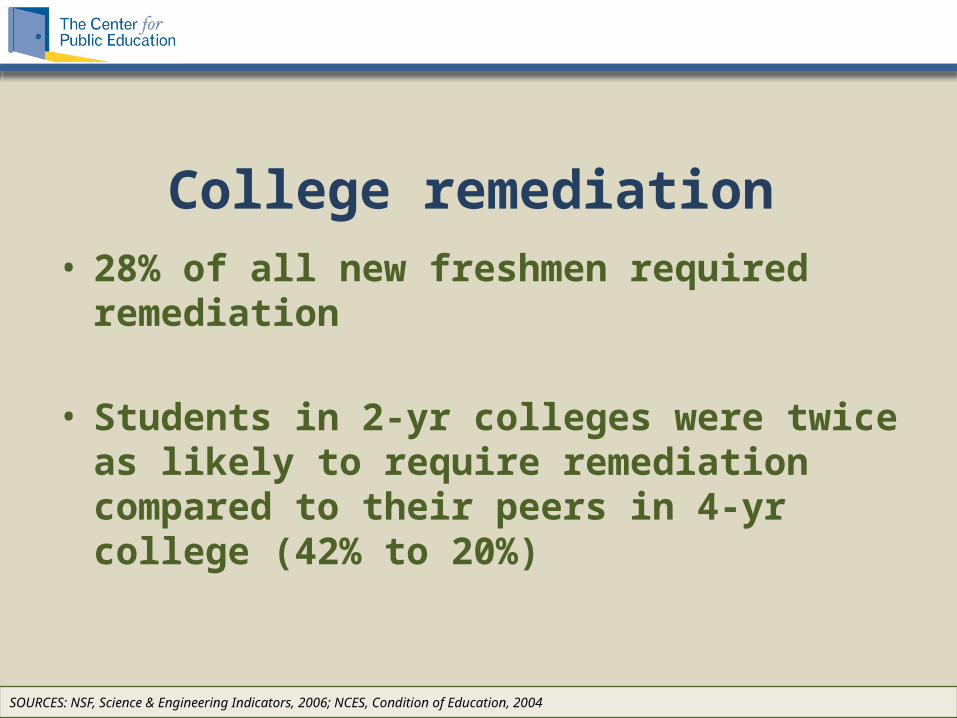
College remediation• 28% of all new freshmen required
remediation
• Students in 2-yr colleges were twice as likely to require remediation compared to their peers in 4-yr college (42% to 20%)
SOURCES: NSF, Science & Engineering Indicators, 2006; NCES, Condition of Education, 2004

NSC: National Student Clearinghouse
• Their database contains records for 92 percent of all students enrolled in postsecondary institutions in the U.S.
• Through their High School Tracker program, NSC offers data services for $425 per year per high school so schools can track the performance of their graduates through postsecondary education.

These services will show:– How many graduates enroll in postsecondary
education? – Whether they attend two- or four-year colleges? – How many of them persist to a credential or
degree? – How much time it took to college graduation?
www.studentclearinghouse.org
NSC: National Student Clearinghouse
• Survey graduates
• Survey parents of graduates
• Survey business community
Other Data to Collect
WHAT CAN SCHOOL BOARDS DO?
Look at the data
What happens to our graduates after they leave our schools?
– Longitudinal data• State data systems • National Student Clearinghouse
– Meet with your local community college– Survey local businesses and trades
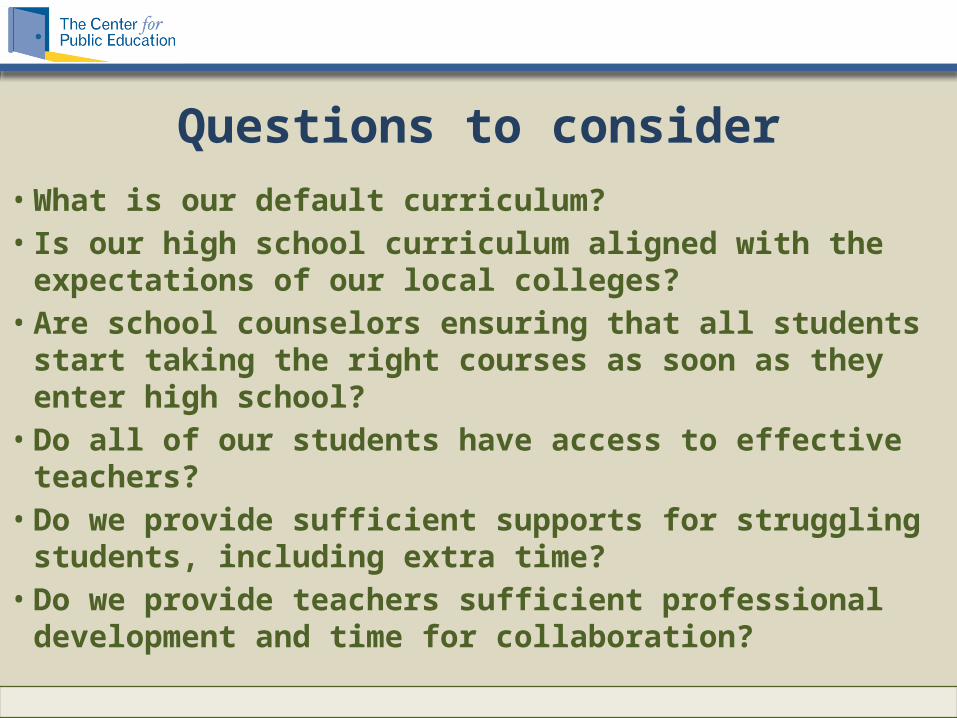
Questions to consider• What is our default curriculum? • Is our high school curriculum aligned with the
expectations of our local colleges?• Are school counselors ensuring that all students start
taking the right courses as soon as they enter high school?
• Do all of our students have access to effective teachers? • Do we provide sufficient supports for struggling
students, including extra time?• Do we provide teachers sufficient professional
development and time for collaboration?
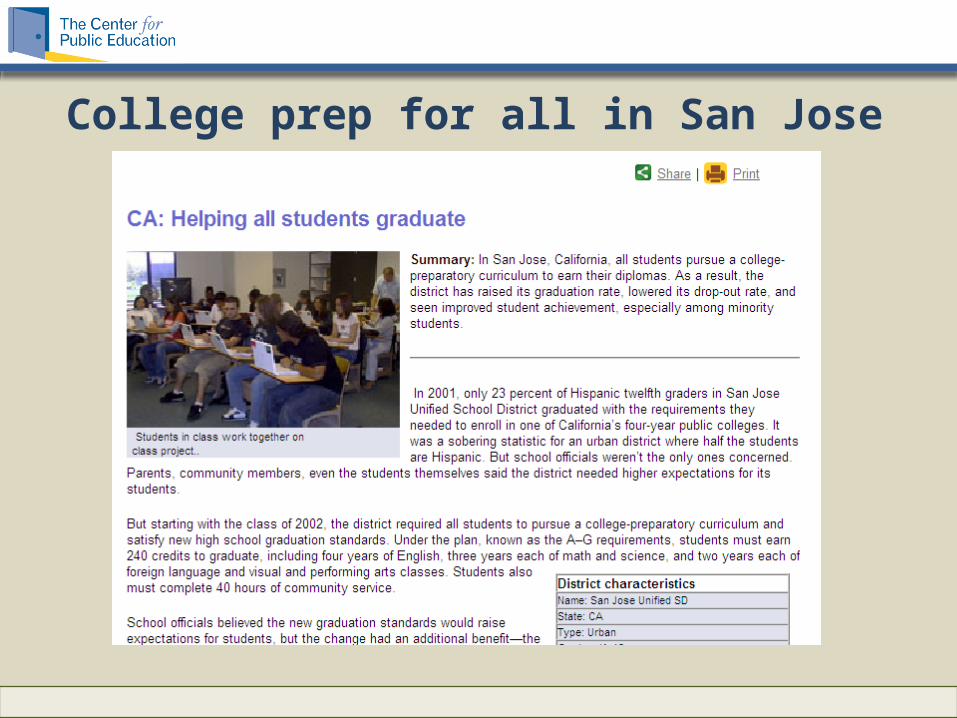
College prep for all in San Jose
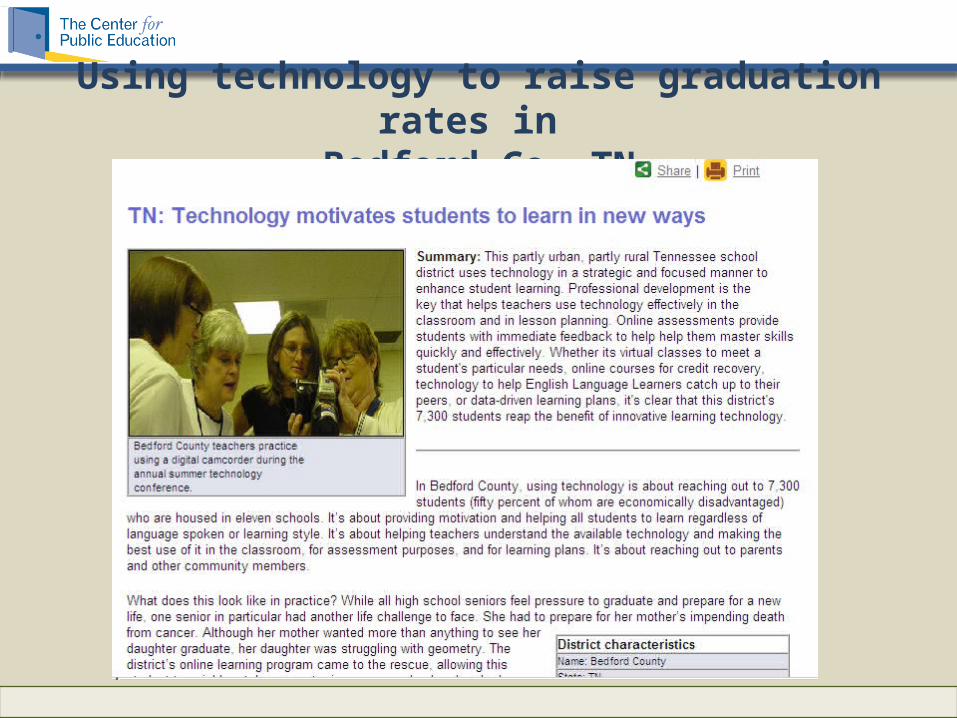
Using technology to raise graduation rates in
Bedford Co, TN
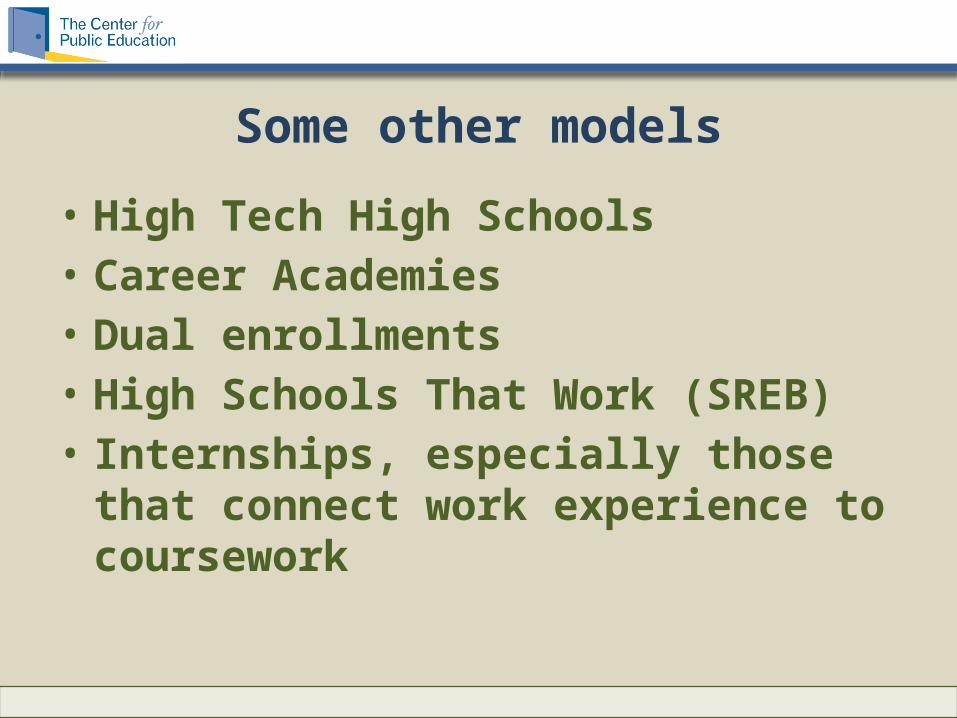
Some other models
• High Tech High Schools• Career Academies• Dual enrollments• High Schools That Work (SREB)• Internships, especially those that
connect work experience to coursework
More information on these topicswww.centerforpubliceducation.org
• Keeping kids in school: What research says about
preventing dropouts
• Better late than never: Examining late high school
graduates
• Defining a 21st Century Education
• Chasing the college acceptance letter: Is it harder
to get into college?
• Pre-K Toolkit

Give us your feedback!
www.centerforpubliceducation.org
or send me an email:Jim Hull, [email protected]