Prepared for Transit Cooperative Research Program...
111
Project No. B-44 STATE-BY-STATE PROFILES FOR EXAMINING THE EFFECTS OF NON-EMERGENCY MEDICAL TRANSPORTATION BROKERAGES ON TRANSPORTATION COORDINATION Prepared for Transit Cooperative Research Program Transportation Research Board of The National Academies of Sciences, Engineering, and Medicine TRANSPORTATION RESEARCH BOARD OF THE NATIONAL ACADEMIES PRIVILEGED DOCUMENT This report, not released for publication, is furnished only for review to members of or participants in the work of the CRP. This report is to be regarded as fully privileged, and dissemination of the information included herein must be approved by the CRP. Suzie Edrington Linda Cherrington Texas A&M Transportation Institute Jon Burkhardt, SkyCastle Enterprises, in association with Richard Garrity, RLS Consulting David Raphael, Community Mobility Solutions, in association with Stephen Borders, Ph.D., Coastal Carolina University Ross Peterson, GridWorks Jeremy Dalton, GridWorks Patricia Weaver Collette University of Kansas Transportation Research Institute April 2018
Transcript of Prepared for Transit Cooperative Research Program...

Project No. B-44
STATE-BY-STATE PROFILES FOR EXAMINING THE EFFECTS OF NON-EMERGENCY MEDICAL TRANSPORTATION BROKERAGES ON
TRANSPORTATION COORDINATION
Prepared for Transit Cooperative Research Program
Transportation Research Board of
The National Academies of Sciences, Engineering, and Medicine
TRANSPORTATION RESEARCH BOARD OF THE NATIONAL ACADEMIES
PRIVILEGED DOCUMENT
This report, not released for publication, is furnished only for review to members of or participants in the work of the CRP. This report is to be regarded as fully
privileged, and dissemination of the information included herein must be approved by the CRP.
Suzie Edrington Linda Cherrington
Texas A&M Transportation Institute
Jon Burkhardt, SkyCastle Enterprises, in association with
Richard Garrity, RLS Consulting
David Raphael, Community Mobility Solutions, in association with
Stephen Borders, Ph.D., Coastal Carolina University Ross Peterson, GridWorks Jeremy Dalton, GridWorks
Patricia Weaver Collette University of Kansas Transportation Research Institute
April 2018

ACKNOWLEDGMENT OF SPONSORSHIP
This work was sponsored by one or more of the following as noted:
� American Association of State Highway and Transportation Officials, in cooperation with theFederal Highway Administration, and was conducted in the National Cooperative HighwayResearch Program,
X Federal Transit Administration and was conducted in the Transit Cooperative Research Program,
� Federal Aviation Administration and was conducted in the Airport Cooperative ResearchProgram,
� Research and Innovative Technology Administration and was conducted in the NationalCooperative Freight Research Program,
� Pipeline and Hazardous Materials Safety Administration and was conducted in the HazardousMaterials Cooperative Research Program,
which is administered by the Transportation Research Board of the National Academies.
DISCLAIMER
This is an uncorrected draft as submitted by the research agency. The opinions and conclusions expressed or implied in the report are those of the research agency. They are not necessarily those of the Transportation Research Board, the National Academies, or the program sponsors.
ii | P a g e
Author Acknowledgments The state profiles were developed as part of TCRP Project B-44. The principal authors were Suzie Edrington of the Texas A&M Transportation Institute (TTI), David Raphael of Community Mobility Solutions, and Stephen Borders, Ph.D., of Coastal Carolina University. Shuman Tan and Jinuk Hwang of TTI provided data analysis and graphics design.
Additional researchers that contributed information for the profiles were Linda Cherrington of TTI; Jon Burkhardt of SkyCastle Enterprises; Patricia Weaver Collette of the University of Kansas Transportation Research Institute; Ross Peterson and Jeremy Dalton of GridWorks; and Richard Garrity of RLS Consulting.
The researchers wish to thank the state Medicaid agency staff who shared information and responded to requests for information.

iii | P a g e
Table of Contents
State-by-State NEMT Profiles ......................................................................................................................... 1 Introduction .................................................................................................................................................... 1 Purpose ............................................................................................................................................................ 1 NEMT Models ............................................................................................................................................... 2 Operating Authority ...................................................................................................................................... 2 Description ..................................................................................................................................................... 3 Demographics ................................................................................................................................................ 3 Cumulative Medicaid/CHIP Enrollment ................................................................................................... 3 Key Statistics................................................................................................................................................... 4 Recent or Future Changes ............................................................................................................................ 4 Sources of Data .............................................................................................................................................. 4
Alabama ............................................................................................................................................................... 5 Alaska ................................................................................................................................................................... 7 Arizona ................................................................................................................................................................ 9 Arkansas ............................................................................................................................................................ 11 California ........................................................................................................................................................... 13 Colorado ............................................................................................................................................................ 15 Connecticut ....................................................................................................................................................... 17 Delaware ............................................................................................................................................................ 19 District of Columbia ........................................................................................................................................ 21 Florida ................................................................................................................................................................ 23 Georgia .............................................................................................................................................................. 25 Hawaii ................................................................................................................................................................ 27 Idaho .................................................................................................................................................................. 29 Illinois ................................................................................................................................................................ 31 Indiana ............................................................................................................................................................... 33 Iowa ................................................................................................................................................................... 35 Kansas ................................................................................................................................................................ 37 Kentucky ........................................................................................................................................................... 39 Louisiana ........................................................................................................................................................... 41 Maine ................................................................................................................................................................. 43 Maryland ............................................................................................................................................................ 45 Massachusetts ................................................................................................................................................... 47 Michigan ............................................................................................................................................................ 49 Minnesota .......................................................................................................................................................... 51 Mississippi ......................................................................................................................................................... 53 Missouri ............................................................................................................................................................. 55 Montana ............................................................................................................................................................ 57 Nebraska ............................................................................................................................................................ 59 Nevada ............................................................................................................................................................... 61 New Hampshire ............................................................................................................................................... 63 New Jersey ........................................................................................................................................................ 65 New Mexico ...................................................................................................................................................... 67

iv | P a g e
New York .......................................................................................................................................................... 69 North Carolina ................................................................................................................................................. 71 North Dakota ................................................................................................................................................... 73 Ohio ................................................................................................................................................................... 75 Oklahoma .......................................................................................................................................................... 77 Oregon ............................................................................................................................................................... 79 Pennsylvania ..................................................................................................................................................... 81 Rhode Island ..................................................................................................................................................... 83 South Carolina .................................................................................................................................................. 85 South Dakota .................................................................................................................................................... 87 Tennessee .......................................................................................................................................................... 89 Texas .................................................................................................................................................................. 91 Utah .................................................................................................................................................................... 93 Vermont ............................................................................................................................................................ 95 Virginia .............................................................................................................................................................. 97 Washington ....................................................................................................................................................... 99 West Virginia ................................................................................................................................................. 101 Wisconsin ....................................................................................................................................................... 103 Wyoming ........................................................................................................................................................ 105
1 | P a g e
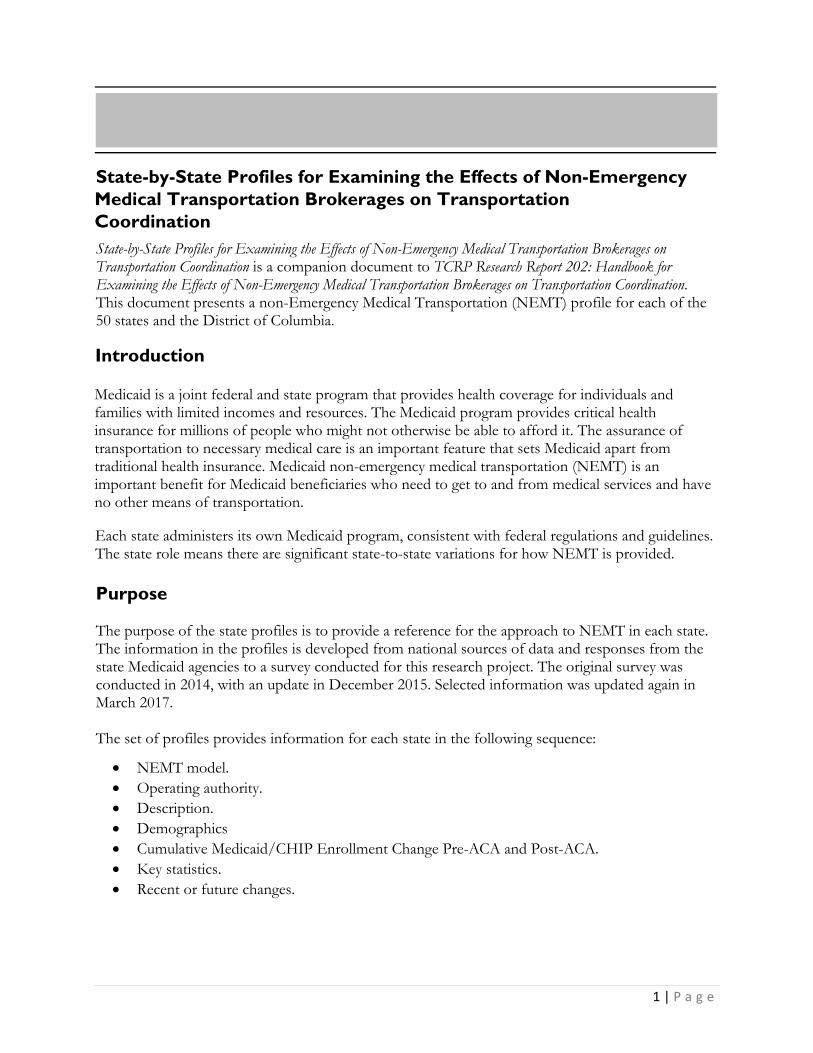
State-by-State Profiles for Examining the Effects of Non-Emergency Medical Transportation Brokerages on Transportation Coordination State-by-State Profiles for Examining the Effects of Non-Emergency Medical Transportation Brokerages on Transportation Coordination is a companion document to TCRP Research Report 202: Handbook for Examining the Effects of Non-Emergency Medical Transportation Brokerages on Transportation Coordination. This document presents a non-Emergency Medical Transportation (NEMT) profile for each of the 50 states and the District of Columbia.
Introduction
Medicaid is a joint federal and state program that provides health coverage for individuals and families with limited incomes and resources. The Medicaid program provides critical health insurance for millions of people who might not otherwise be able to afford it. The assurance of transportation to necessary medical care is an important feature that sets Medicaid apart from traditional health insurance. Medicaid non-emergency medical transportation (NEMT) is an important benefit for Medicaid beneficiaries who need to get to and from medical services and have no other means of transportation.
Each state administers its own Medicaid program, consistent with federal regulations and guidelines. The state role means there are significant state-to-state variations for how NEMT is provided.
Purpose
The purpose of the state profiles is to provide a reference for the approach to NEMT in each state. The information in the profiles is developed from national sources of data and responses from the state Medicaid agencies to a survey conducted for this research project. The original survey was conducted in 2014, with an update in December 2015. Selected information was updated again in March 2017.
The set of profiles provides information for each state in the following sequence:
NEMT model. Operating authority. Description. Demographics Cumulative Medicaid/CHIP Enrollment Change Pre-ACA and Post-ACA. Key statistics. Recent or future changes.

2 | P a g e
NEMT Models
The research identified the following principal NEMT models available to state Medicaid agencies for providing NEMT:
In-house management. The in-house management model is when a state Medicaid agencyadministers NEMT for beneficiaries at a state, regional, or county level. States using the in-house management NEMT model usually contract on a fee-for-service basis.
Managed care organizations (MCO). Managed care is an organized health care deliverysystem designed to manage health care cost, use, and quality. Through contractedarrangements with state Medicaid agencies, MCOs seek to improve health care for apopulation of Medicaid beneficiaries, often with chronic and complex conditions, while alsomanaging the cost of that care. The MCO may integrate NEMT in the health care system(i.e., carved in).
Brokers. Some state Medicaid agencies contract with a broker to provide NEMT service.Brokers qualify and authorize beneficiaries for transportation and then contract withtransportation providers to perform the NEMT service.
o Statewide broker. Under a statewide broker NEMT model, the broker manages servicestatewide, centralizing call centers, eligibility determination, and trip authorization.Statewide brokers are typically for-profit, national brokers.
o Regional broker. A regional broker is responsible for eligibility determination and tripauthorization at a regional level. A broker may operate in one region or several regions,as the state Medicaid agency may specify. Regional brokers may be for-profit or not-for-profit brokers. Not-for-profit brokers may be human services agencies, public transitagencies, government agencies, or other nonprofit organizations.
Mixed NEMT models. Some state Medicaid agencies use more than one model to provideNEMT. In-house management, MCOs, and statewide or regional brokers often coexist in astate to provide NEMT service.
Operating Authority
Federal Medicaid law requires a state to have an approved state plan to operate its Medicaid program including NEMT. State Medicaid agencies can implement NEMT using one or more of the following basic types of federal operating authorities provided under the Social Security Act:
NEMT assurance under the State Medicaid Plan. States are required to make NEMTavailable to Medicaid beneficiaries to assure their access to medically necessary services.States have the option to provide NEMT as a State Medicaid Plan service.
Federal Section 1902(a)(70)) State Plan Amendment. The Deficit Reduction Act of 2005amended Section 1902(a) of the Social Security Act by adding a new section 1902(a)(70) thatprovides states the authority to establish NEMT brokerages.
3 | P a g e
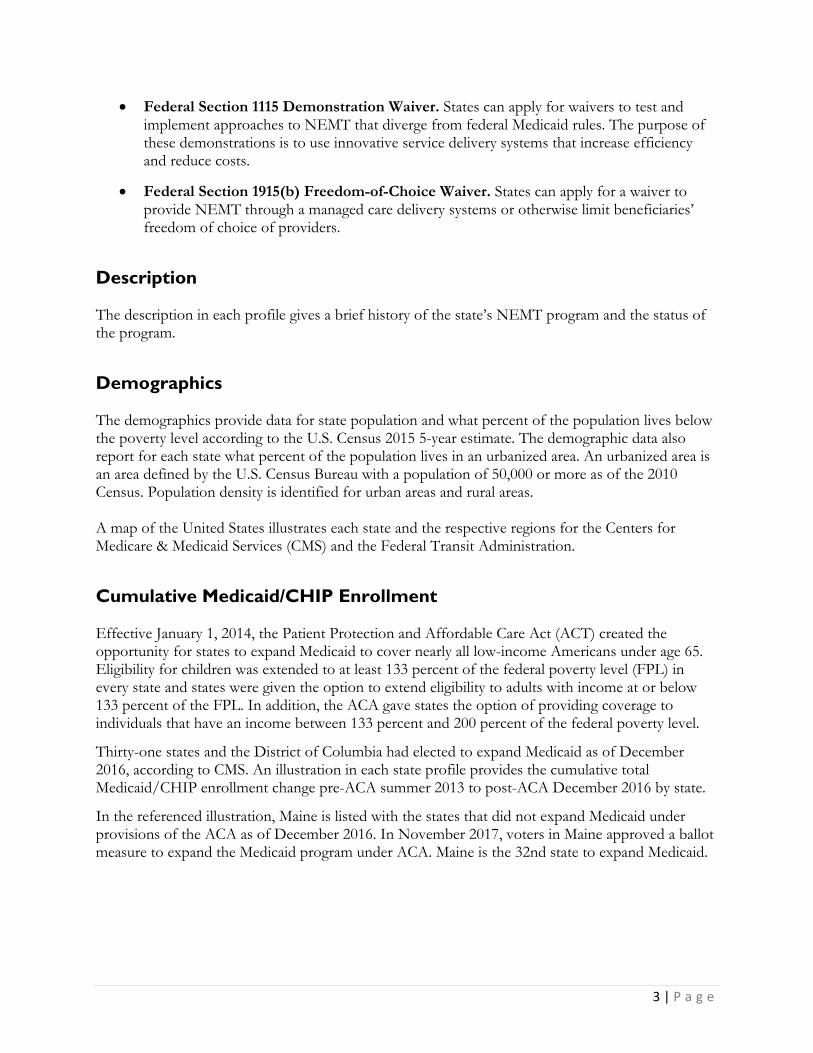
Federal Section 1115 Demonstration Waiver. States can apply for waivers to test andimplement approaches to NEMT that diverge from federal Medicaid rules. The purpose ofthese demonstrations is to use innovative service delivery systems that increase efficiencyand reduce costs.
Federal Section 1915(b) Freedom-of-Choice Waiver. States can apply for a waiver toprovide NEMT through a managed care delivery systems or otherwise limit beneficiaries’freedom of choice of providers.
Description
The description in each profile gives a brief history of the state’s NEMT program and the status of the program.
Demographics
The demographics provide data for state population and what percent of the population lives below the poverty level according to the U.S. Census 2015 5-year estimate. The demographic data also report for each state what percent of the population lives in an urbanized area. An urbanized area is an area defined by the U.S. Census Bureau with a population of 50,000 or more as of the 2010 Census. Population density is identified for urban areas and rural areas.
A map of the United States illustrates each state and the respective regions for the Centers for Medicare & Medicaid Services (CMS) and the Federal Transit Administration.
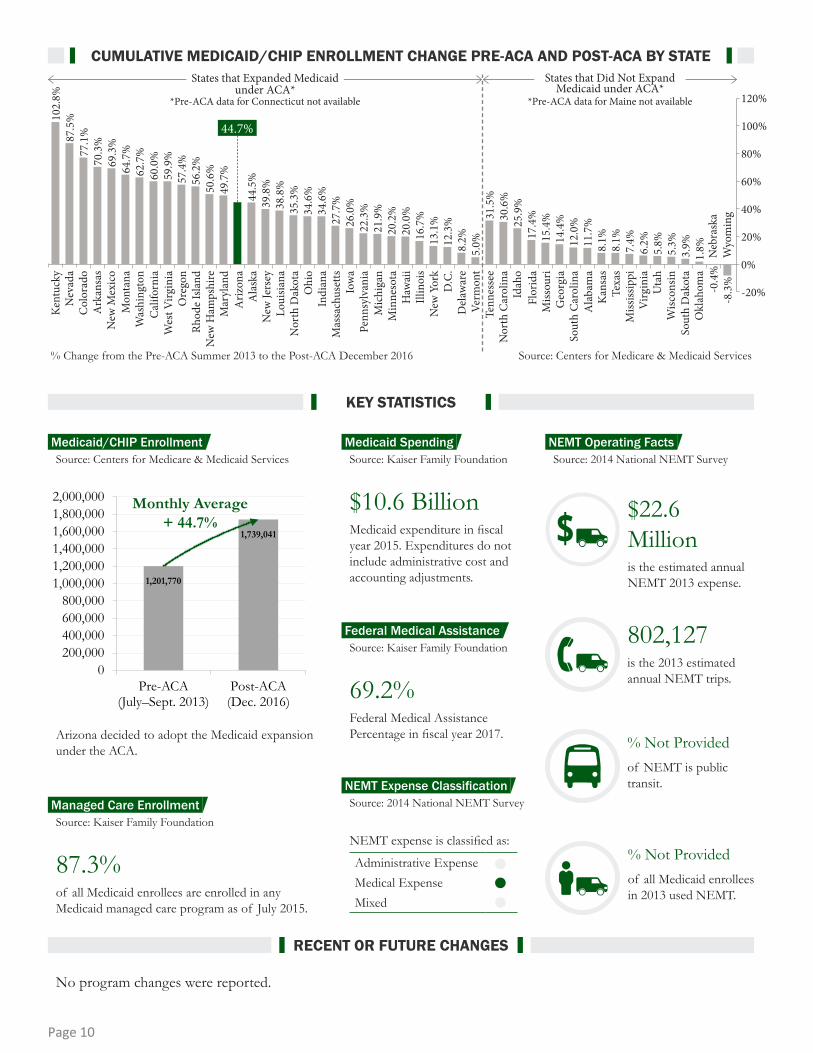
Cumulative Medicaid/CHIP Enrollment
Effective January 1, 2014, the Patient Protection and Affordable Care Act (ACT) created the opportunity for states to expand Medicaid to cover nearly all low-income Americans under age 65. Eligibility for children was extended to at least 133 percent of the federal poverty level (FPL) in every state and states were given the option to extend eligibility to adults with income at or below 133 percent of the FPL. In addition, the ACA gave states the option of providing coverage to individuals that have an income between 133 percent and 200 percent of the federal poverty level.
Thirty-one states and the District of Columbia had elected to expand Medicaid as of December 2016, according to CMS. An illustration in each state profile provides the cumulative total Medicaid/CHIP enrollment change pre-ACA summer 2013 to post-ACA December 2016 by state.
In the referenced illustration, Maine is listed with the states that did not expand Medicaid under provisions of the ACA as of December 2016. In November 2017, voters in Maine approved a ballot measure to expand the Medicaid program under ACA. Maine is the 32nd state to expand Medicaid.

4 | P a g e
Key Statistics
Key statistics for each state profile include state specific data for Medicaid/Chip enrollment increase pre-ACA summer 2013 to post-ACA December 2016; managed care enrollment; Medicaid spending; the Federal Medical Assistance Percentage (FMAP); and data reported by each state in the 2014 national NEMT survey for TCRP B-44 (or updated on the date indicated in the profile).
Recent or Future Changes
Any recent or future changes in NEMT are noted as relevant in each state profile.
Sources of Data
The sources for key data for each state profile are listed in the table below. Researchers attempted to document the most current source of data; however, this means that data are not from the same fiscal year. Many data points for NEMT are not reported to a single national database. To determine how states are providing NEMT and the changes that have occurred in recent years, the researchers conducted a survey of the Medicaid agencies in the 50 states and the District of Columbia.
Key Data Source
Demographics Population Density
Urban U.S. Census 2010 Rural U.S. Census 2010
State Population (2015) U.S. Census 2015 5-Year Estimate Population Below Poverty (2015) U.S. Census 2015 5-Year Estimate Population in Urbanized Area U.S. Census 2010 Key Statistics Cumulative Medicaid/CHIP Enrollment CMS Medicaid & NEMT Enrollment Data (by State)
Medicaid & CHIP Enrollment (December 2013) CMS, July–September 2013 Medicaid & CHIP Enrollment (December 2016) CMS, December 2016 Percent Increase 2013–2016 CMS, calculated
Expanded Medicaid under Affordable Care Act (2016) CMS Medicaid Enrollees in a Managed Care Program (2015 Kaiser Family Foundation Annual Medicaid Expenses (2015) Kaiser Family Foundation FMAP (2017) Kaiser Family Foundation NEMT Expenses & Activity Data TCRP B-44 2014 National NEMT Survey *
NEMT Expense Classification Estimate Annual NEMT Expenses Estimate Annual NEMT Passenger Trips % of NEMT Trips on Public Transit Medicaid Enrollees that Used NEMT (2013)
*Selected data may have been updated during case study research or other direct discussion with the state Medicaidagency for an update.

ALABAMAIn-House ManagementManaged Care OrganizationStatewide BrokerRegional Broker
NEMT Assurance under the State Medicaid Plan1902(a)(70) State Plan AmendmentFederal Section 1115 Demonstration WaiverFederal Section 1915(b) Freedom-of-Choice Waiver
4.8 Million
1,054People
per Sq. Mile
Urban
Rural
50.2People
per Sq. Mile
Source: U.S. Census 2015 5-Year Estimates
The Alabama Medicaid Administration (AMA) operates using an in-house model for providing NEMT, relying on mileage reimbursement to volunteers and other drivers of private automobiles. The state’s 67 counties have been organized into 10 regional NEMT districts. Medicaid recipients contact the NEMT program coordinator in their region to schedule a ride. Recipients can choose among a list of approved providers.
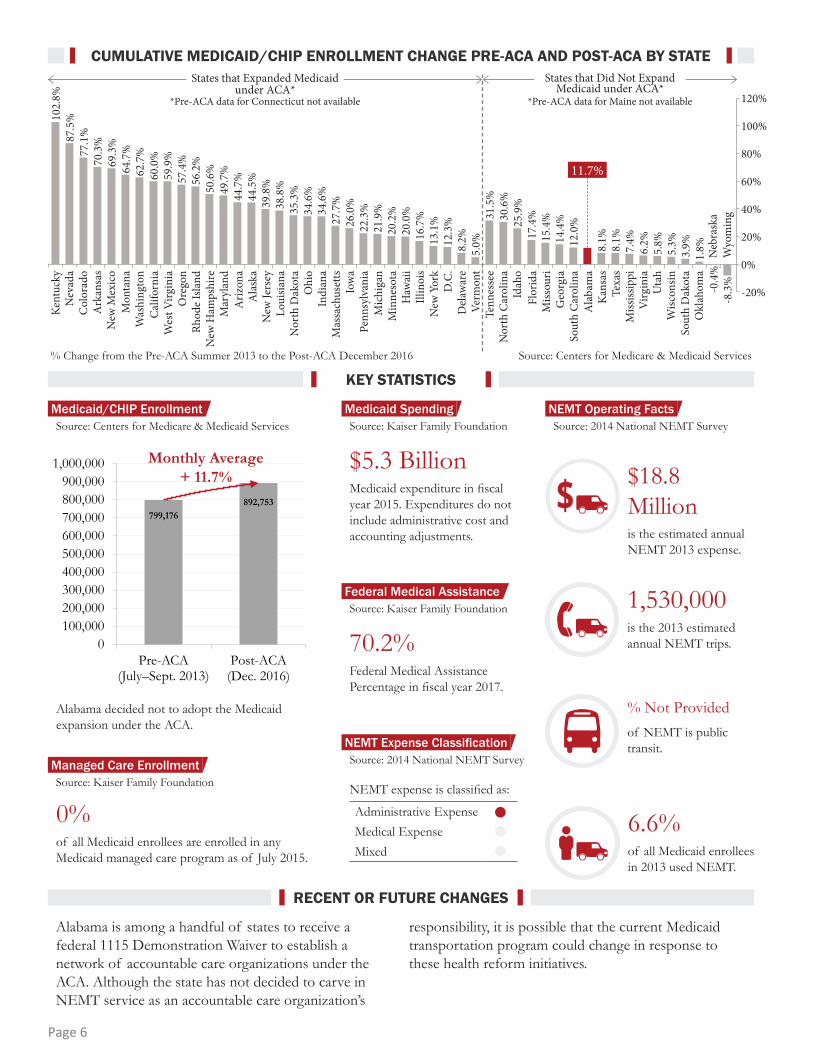
Alabama has one of the lowest NEMT utilization rates. In fiscal year 2013, AMA spent $18.8 million on Medicaid transportation, roughly 4/10 of 1 percent of the state’s Medicaid budget. These NEMT services were used by an estimated 53,000 unique riders, approximately
6.6 percent of all Medicaid enrollees in 2013.
Alabama began providing NEMT services in 1995 as a result of a federal court order that found that the state had “failed to ensure necessary, non-emergency transportation to Medicaid recipients.”
In October 2011, AMA issued a request for information, inviting transportation brokers to submit proposals to “improve the [state’s] existing NEMT program.” After receiving four proposals, the state decided against a broker model, citing the high service costs proposed by proposers.
March 2017
Source: U.S. Census 2010
Below PovertyThe individual income is less than the official poverty threshold.
Source: U.S. Census 2015 5-Year Estimates
Live in Urbanized Areasof 50,000 or more people in Census 2010.
Source: U.S. Census 2010
18%49%
DEMOGRAPHICS
OPERATING AUTHORITYNEMT MODEL
Population Density
State Population
FTA Region 4
CMS Region 4
Page 5
Administrative ExpenseMedical ExpenseMixed
NEMT expense is classified as:
Alabama is among a handful of states to receive a federal 1115 Demonstration Waiver to establish a network of accountable care organizations under the ACA. Although the state has not decided to carve in NEMT service as an accountable care organization’s
responsibility, it is possible that the current Medicaid transportation program could change in response to these health reform initiatives.
70.2% Federal Medical Assistance Percentage in fiscal year 2017.
0% of all Medicaid enrollees are enrolled in any Medicaid managed care program as of July 2015.
$5.3 Billion Medicaid expenditure in fiscal year 2015. Expenditures do not include administrative cost and accounting adjustments.
$18.8 Millionis the estimated annual NEMT 2013 expense.
1,530,000is the 2013 estimated annual NEMT trips.
6.6% of all Medicaid enrollees in 2013 used NEMT.
% Not Providedof NEMT is public transit.
Source: 2014 National NEMT Survey
Source: Kaiser Family Foundation
Source: Kaiser Family Foundation
Source: Kaiser Family Foundation
Source: 2014 National NEMT Survey
Source: Centers for Medicare & Medicaid Services
11.7%
Kent
ucky
102.
8%87
.5%
69.3
%
50.6
%
34.6
%
20.0
% 30.6
%
8.1%
60.0
%
44.5
%
26.0
%
12.3
%
15.4
%
6.2%
77.1
%
64.7
%
49.7
%
34.6
%
16.7
% 25.9
%
8.1%
59.9
%
39.8
%
22.3
%
8.2% 14
.4%
5.8%
70.3
%
56.2
%
35.3
%
20.2
% 31.5
%
62.7
%
44.7
%
27.7
%
13.1
%
17.4
%
7.4%
57.4
%
38.8
%
21.9
%
5.0% 12
.0%
5.3%
3.9%
1.8%
-0.4
%-8
.3%
Nev
ada
Col
orad
oA
rkan
sas
New
Mex
ico
Mon
tana
Was
hing
ton
Cal
iforn
iaW
est V
irgin
iaO
rego
nRh
ode
Isla
ndN
ew H
amps
hire
Mar
ylan
dA
rizon
aA
lask
aN
ew Je
rsey
Loui
siana
Nor
th D
akot
aO
hio
Indi
ana
Mas
sach
uset
tsIo
wa
Penn
sylv
ania
Mic
higa
nM
inne
sota
Haw
aii
Illin
ois
New
Yor
kD
.C.
Del
awar
eVe
rmon
tTe
nnes
see
Nor
th C
arol
ina
Idah
oFl
orid
aM
issou
riG
eorg
iaSo
uth
Car
olin
aA
laba
ma
Kan
sas
Texa
sM
ississ
ippi
Virg
inia
Uta
hW
iscon
sinSo
uth
Dak
ota
Okl
ahom
aN
ebra
ska
Wyo
min
g
States that Expanded Medicaid under ACA*
States that Did Not Expand Medicaid under ACA*
120%
100%
-20%
0%
20%
40%
60%
80%
% Change from the Pre-ACA Summer 2013 to the Post-ACA December 2016 Source: Centers for Medicare & Medicaid Services
*Pre-ACA data for Connecticut not available *Pre-ACA data for Maine not available
799,176892,753
0100,000200,000300,000400,000500,000600,000700,000800,000900,000
1,000,000
Pre-ACA(July–Sept. 2013)
Post-ACA(Dec. 2016)
Alabama decided not to adopt the Medicaid expansion under the ACA.
Monthly Average + 11.7%
KEY STATISTICS
RECENT OR FUTURE CHANGES
CUMULATIVE MEDICAID/CHIP ENROLLMENT CHANGE PRE-ACA AND POST-ACA BY STATE
Medicaid/CHIP Enrollment Medicaid Spending
Federal Medical Assistance
NEMT Expense Classification
NEMT Operating Facts
Managed Care Enrollment
Page 6
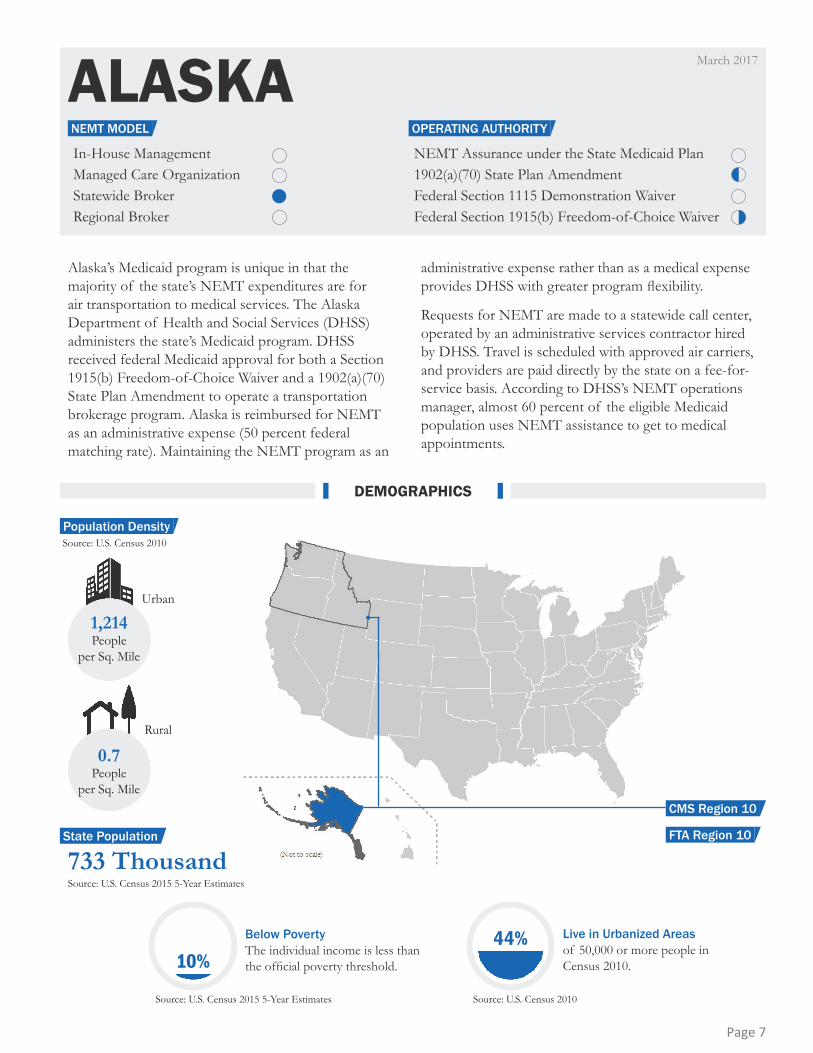
ALASKAIn-House ManagementManaged Care OrganizationStatewide BrokerRegional Broker
NEMT Assurance under the State Medicaid Plan1902(a)(70) State Plan AmendmentFederal Section 1115 Demonstration WaiverFederal Section 1915(b) Freedom-of-Choice Waiver
733 Thousand
1,214People
per Sq. Mile
Urban
Rural
0.7People
per Sq. Mile
Source: U.S. Census 2010
Source: U.S. Census 2015 5-Year Estimates
Below PovertyThe individual income is less than the official poverty threshold.
Source: U.S. Census 2015 5-Year Estimates
Live in Urbanized Areasof 50,000 or more people in Census 2010.
Source: U.S. Census 2010
10%44%
Alaska’s Medicaid program is unique in that the majority of the state’s NEMT expenditures are for air transportation to medical services. The Alaska Department of Health and Social Services (DHSS) administers the state’s Medicaid program. DHSS received federal Medicaid approval for both a Section 1915(b) Freedom-of-Choice Waiver and a 1902(a)(70) State Plan Amendment to operate a transportation brokerage program. Alaska is reimbursed for NEMT as an administrative expense (50 percent federal matching rate). Maintaining the NEMT program as an
administrative expense rather than as a medical expense provides DHSS with greater program flexibility.
Requests for NEMT are made to a statewide call center, operated by an administrative services contractor hired by DHSS. Travel is scheduled with approved air carriers, and providers are paid directly by the state on a fee-for-service basis. According to DHSS’s NEMT operations manager, almost 60 percent of the eligible Medicaid population uses NEMT assistance to get to medical appointments.
March 2017
DEMOGRAPHICS
OPERATING AUTHORITYNEMT MODEL
Population Density
State Population FTA Region 10
CMS Region 10
Page 7

Administrative ExpenseMedical ExpenseMixed
44.5%
Source: Centers for Medicare & Medicaid Services
122,334
176,799
020,00040,00060,00080,000
100,000120,000140,000160,000180,000200,000
Pre-ACA(July–Sept. 2013)
Post-ACA(Dec. 2016)
11.7
%
No program changes were reported.
NEMT expense is classified as:
50% Federal Medical Assistance Percentage in fiscal year 2017.
0% of all Medicaid enrollees are enrolled in any Medicaid managed care program as of July 2015.
$1.4 Billion Medicaid expenditure in fiscal year 2015. Expenditures do not include administrative cost and accounting adjustments.
Alaska decided to adopt the Medicaid expansion under the ACA.
$35Millionis the estimated annual NEMT 2013 expense.
100,000is the 2013 estimated annual NEMT trips.
60% of all Medicaid enrollees in 2013 used NEMT.
% Not Providedof NEMT is public transit.
Source: 2014 National NEMT Survey
Source: Kaiser Family Foundation
Source: Kaiser Family Foundation
Source: Kaiser Family Foundation
Source: 2014 National NEMT Survey
Kent
ucky
102.
8%87
.5%
69.3
%
50.6
%
34.6
%
20.0
% 30.6
%
8.1%
60.0
%
26.0
%
12.3
%
15.4
%
6.2%
77.1
%
64.7
%
49.7
%
34.6
%
16.7
% 25.9
%
8.1%
59.9
%
39.8
%
22.3
%
8.2% 14
.4%
5.8%
70.3
%
56.2
%
35.3
%
20.2
% 31.5
%
62.7
%
44.7
%
27.7
%
13.1
%
17.4
%
7.4%
57.4
%
38.8
%
21.9
%
5.0% 12
.0%
5.3%
3.9%
1.8%
-0.4
%-8
.3%
Nev
ada
Col
orad
oA
rkan
sas
New
Mex
ico
Mon
tana
Was
hing
ton
Cal
iforn
iaW
est V
irgin
iaO
rego
nRh
ode
Isla
ndN
ew H
amps
hire
Mar
ylan
dA
rizon
aA
lask
aN
ew Je
rsey
Loui
siana
Nor
th D
akot
aO
hio
Indi
ana
Mas
sach
uset
tsIo
wa
Penn
sylv
ania
Mic
higa
nM
inne
sota
Haw
aii
Illin
ois
New
Yor
kD
.C.
Del
awar
eVe
rmon
tTe
nnes
see
Nor
th C
arol
ina
Idah
oFl
orid
aM
issou
riG
eorg
iaSo
uth
Car
olin
aA
laba
ma
Kan
sas
Texa
sM
ississ
ippi
Virg
inia
Uta
hW
iscon
sinSo
uth
Dak
ota
Okl
ahom
aN
ebra
ska
Wyo
min
g
States that Expanded Medicaid under ACA*
States that Did Not Expand Medicaid under ACA*
120%
100%
-20%
0%
20%
40%
60%
80%
% Change from the Pre-ACA Summer 2013 to the Post-ACA December 2016 Source: Centers for Medicare & Medicaid Services
*Pre-ACA data for Connecticut not available *Pre-ACA data for Maine not available
Monthly Average + 44.5%
KEY STATISTICS
RECENT OR FUTURE CHANGES
CUMULATIVE MEDICAID/CHIP ENROLLMENT CHANGE PRE-ACA AND POST-ACA BY STATE
Medicaid/CHIP Enrollment Medicaid Spending
Federal Medical Assistance
NEMT Expense Classification
NEMT Operating Facts
Managed Care Enrollment
Page 8
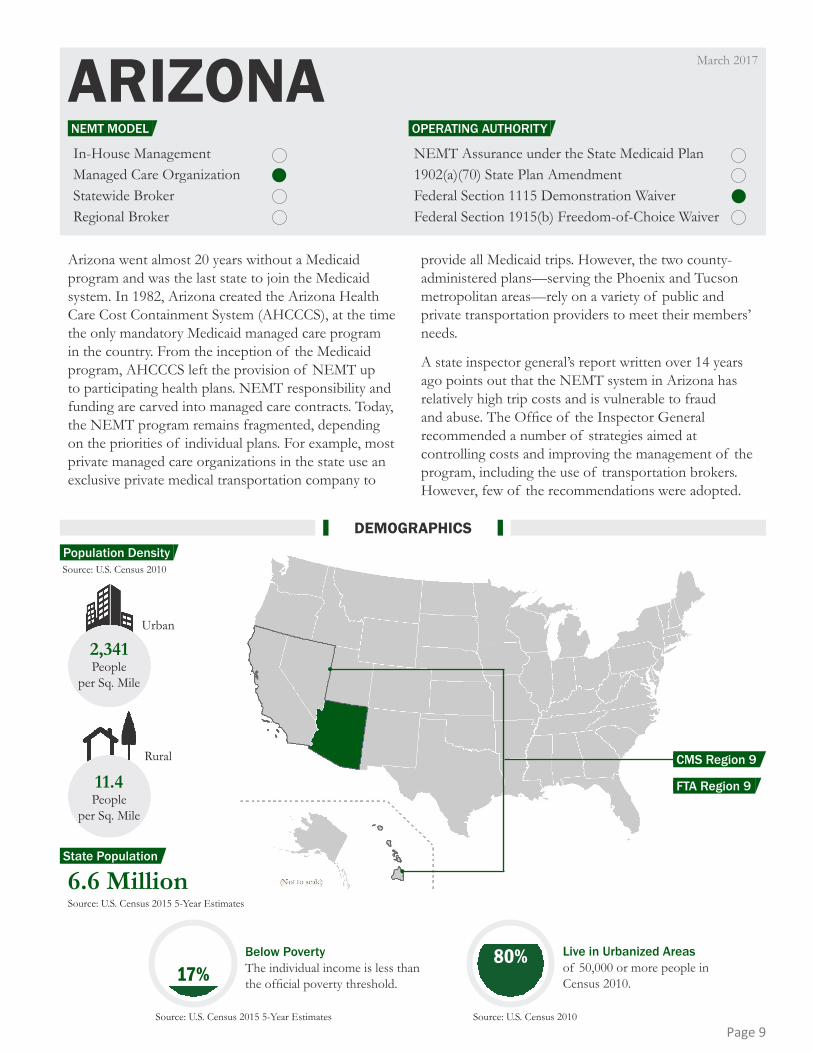
ARIZONAIn-House ManagementManaged Care OrganizationStatewide BrokerRegional Broker
NEMT Assurance under the State Medicaid Plan1902(a)(70) State Plan AmendmentFederal Section 1115 Demonstration WaiverFederal Section 1915(b) Freedom-of-Choice Waiver
6.6 Million
2,341People
per Sq. Mile
Urban
Rural
11.4People
per Sq. Mile
Source: U.S. Census 2010
Source: U.S. Census 2015 5-Year Estimates
Below PovertyThe individual income is less than the official poverty threshold.
Source: U.S. Census 2015 5-Year Estimates
Live in Urbanized Areasof 50,000 or more people in Census 2010.
Source: U.S. Census 2010
17%80%
Arizona went almost 20 years without a Medicaid program and was the last state to join the Medicaid system. In 1982, Arizona created the Arizona Health Care Cost Containment System (AHCCCS), at the time the only mandatory Medicaid managed care program in the country. From the inception of the Medicaid program, AHCCCS left the provision of NEMT up to participating health plans. NEMT responsibility and funding are carved into managed care contracts. Today, the NEMT program remains fragmented, depending on the priorities of individual plans. For example, most private managed care organizations in the state use an exclusive private medical transportation company to
provide all Medicaid trips. However, the two county-administered plans—serving the Phoenix and Tucson metropolitan areas—rely on a variety of public and private transportation providers to meet their members’ needs.
A state inspector general’s report written over 14 years ago points out that the NEMT system in Arizona has relatively high trip costs and is vulnerable to fraud and abuse. The Office of the Inspector General recommended a number of strategies aimed at controlling costs and improving the management of the program, including the use of transportation brokers. However, few of the recommendations were adopted.
March 2017
DEMOGRAPHICS
OPERATING AUTHORITYNEMT MODEL
Population Density
State Population
FTA Region 9
CMS Region 9
Page 9
Administrative ExpenseMedical ExpenseMixed
1,201,770
1,739,041
0200,000400,000600,000800,000
1,000,0001,200,0001,400,0001,600,0001,800,0002,000,000
Pre-ACA(July–Sept. 2013)
Post-ACA(Dec. 2016)
No program changes were reported.
NEMT expense is classified as:
69.2% Federal Medical Assistance Percentage in fiscal year 2017.
87.3% of all Medicaid enrollees are enrolled in any Medicaid managed care program as of July 2015.
$10.6 Billion Medicaid expenditure in fiscal year 2015. Expenditures do not include administrative cost and accounting adjustments.
Arizona decided to adopt the Medicaid expansion under the ACA.
$22.6 Millionis the estimated annual NEMT 2013 expense.
802,127is the 2013 estimated annual NEMT trips.
% Not Providedof all Medicaid enrollees in 2013 used NEMT.
% Not Providedof NEMT is public transit.
Source: Centers for Medicare & Medicaid Services Source: 2014 National NEMT Survey
Source: Kaiser Family Foundation
Source: Kaiser Family Foundation
Source: Kaiser Family Foundation
Source: 2014 National NEMT Survey
44.7%
Kent
ucky
102.
8%87
.5%
69.3
%
50.6
%
34.6
%
20.0
% 30.6
%
8.1%
60.0
%
44.5
%
26.0
%
12.3
%
15.4
%
6.2%
77.1
%
64.7
%
49.7
%
34.6
%
16.7
% 25.9
%
8.1%
59.9
%
39.8
%
22.3
%
8.2% 14
.4%
5.8%
70.3
%
56.2
%
35.3
%
20.2
% 31.5
%
11.7
%
62.7
%
27.7
%
13.1
%
17.4
%
7.4%
57.4
%
38.8
%
21.9
%
5.0% 12
.0%
5.3%
3.9%
1.8%
-0.4
%-8
.3%
Nev
ada
Col
orad
oA
rkan
sas
New
Mex
ico
Mon
tana
Was
hing
ton
Cal
iforn
iaW
est V
irgin
iaO
rego
nRh
ode
Isla
ndN
ew H
amps
hire
Mar
ylan
dA
rizon
aA
lask
aN
ew Je
rsey
Loui
siana
Nor
th D
akot
aO
hio
Indi
ana
Mas
sach
uset
tsIo
wa
Penn
sylv
ania
Mic
higa
nM
inne
sota
Haw
aii
Illin
ois
New
Yor
kD
.C.
Del
awar
eVe
rmon
tTe
nnes
see
Nor
th C
arol
ina
Idah
oFl
orid
aM
issou
riG
eorg
iaSo
uth
Car
olin
aA
laba
ma
Kan
sas
Texa
sM
ississ
ippi
Virg
inia
Uta
hW
iscon
sinSo
uth
Dak
ota
Okl
ahom
aN
ebra
ska
Wyo
min
g
States that Expanded Medicaid under ACA*
States that Did Not Expand Medicaid under ACA*
120%
100%
-20%
0%
20%
40%
60%
80%
% Change from the Pre-ACA Summer 2013 to the Post-ACA December 2016 Source: Centers for Medicare & Medicaid Services
*Pre-ACA data for Connecticut not available *Pre-ACA data for Maine not available
Monthly Average + 44.7%
KEY STATISTICS
RECENT OR FUTURE CHANGES
CUMULATIVE MEDICAID/CHIP ENROLLMENT CHANGE PRE-ACA AND POST-ACA BY STATE
Medicaid/CHIP Enrollment Medicaid Spending
Federal Medical Assistance
NEMT Expense Classification
NEMT Operating Facts
Managed Care Enrollment
Page 10

ARKANSASIn-House ManagementManaged Care OrganizationStatewide BrokerRegional Broker
NEMT Assurance under the State Medicaid Plan1902(a)(70) State Plan AmendmentFederal Section 1115 Demonstration WaiverFederal Section 1915(b) Freedom-of-Choice Waiver
3.0 Million
1,051People
per Sq. Mile
Urban
Rural
34.4People
per Sq. Mile
Source: U.S. Census 2010
Source: U.S. Census 2015 5-Year Estimates
Below PovertyThe individual income is less than the official poverty threshold.
Source: U.S. Census 2015 5-Year Estimates
Live in Urbanized Areasof 50,000 or more people in Census 2010.
Source: U.S. Census 2010
19%40%
The Arkansas Department of Human Services, Division of Medicaid Services (DMS) assures transportation for eligible Medicaid beneficiaries through the Non-Emergency Transportation (NET) program. DMS contracts with regional transportation brokers to provide NET. A regional broker can also contract with qualified subcontractors in the respective region and serve as
a gatekeeper, processing transportation requests and monitoring complaints to ensure quality. DMS conducts periodic broker reviews for quality assurance. The regional brokers are a combination of for-profit national companies and Arkansas-based human services brokers (e.g. development councils, area agencies on aging, community action agencies, etc.).
March 2018
DEMOGRAPHICS
OPERATING AUTHORITYNEMT MODEL
Population Density
State Population
FTA Region 6
CMS Region 6
Page 11

Administrative ExpenseMedical ExpenseMixed
No program changes were reported.
NEMT expense is classified as:
69.7% Federal Medical Assistance Percentage in fiscal year 2017.
0% of all Medicaid enrollees are enrolled in any Medicaid managed care program as of July 2015.
$5.5 Billion Medicaid expenditure in fiscal year 2015. Expenditures do not include administrative cost and accounting adjustments.
Arkansas decided to adopt the Medicaid expansion under the ACA.
$33.9 Millionis the estimated annual NEMT 2013 expense.
1,088,117is the 2013 estimated annual NEMT trips.
4.8% of all Medicaid enrollees in 2013 used NEMT.
% Not Providedof NEMT is public transit.
70.3%
Source: Centers for Medicare & Medicaid Services Source: 2014 National NEMT Survey
Source: Kaiser Family Foundation
Source: Kaiser Family Foundation
Source: Kaiser Family Foundation
Source: 2014 National NEMT Survey
Kent
ucky
102.
8%87
.5%
69.3
%
50.6
%
34.6
%
20.0
% 30.6
%
8.1%
60.0
%
44.5
%
26.0
%
12.3
%
15.4
%
6.2%
77.1
%
64.7
%
49.7
%
34.6
%
16.7
% 25.9
%
8.1%
59.9
%
39.8
%
22.3
%
8.2% 14
.4%
5.8%
56.2
%
35.3
%
20.2
% 31.5
%
11.7
%
62.7
%
44.7
%
27.7
%
13.1
%
17.4
%
7.4%
57.4
%
38.8
%
21.9
%
5.0% 12
.0%
5.3%
3.9%
1.8%
-0.4
%-8
.3%
Nev
ada
Col
orad
oA
rkan
sas
New
Mex
ico
Mon
tana
Was
hing
ton
Cal
iforn
iaW
est V
irgin
iaO
rego
nRh
ode
Isla
ndN
ew H
amps
hire
Mar
ylan
dA
rizon
aA
lask
aN
ew Je
rsey
Loui
siana
Nor
th D
akot
aO
hio
Indi
ana
Mas
sach
uset
tsIo
wa
Penn
sylv
ania
Mic
higa
nM
inne
sota
Haw
aii
Illin
ois
New
Yor
kD
.C.
Del
awar
eVe
rmon
tTe
nnes
see
Nor
th C
arol
ina
Idah
oFl
orid
aM
issou
riG
eorg
iaSo
uth
Car
olin
aA
laba
ma
Kan
sas
Texa
sM
ississ
ippi
Virg
inia
Uta
hW
iscon
sinSo
uth
Dak
ota
Okl
ahom
aN
ebra
ska
Wyo
min
g
States that Expanded Medicaid under ACA*
States that Did Not Expand Medicaid under ACA*
120%
100%
-20%
0%
20%
40%
60%
80%
% Change from the Pre-ACA Summer 2013 to the Post-ACA December 2016 Source: Centers for Medicare & Medicaid Services
*Pre-ACA data for Connecticut not available *Pre-ACA data for Maine not available
556,851
948,181
0100,000200,000300,000400,000500,000600,000700,000800,000900,000
1,000,000
Pre-ACA(July–Sept. 2013)
Post-ACA(Dec. 2016)
Monthly Average + 70.3%
KEY STATISTICS
RECENT OR FUTURE CHANGES
CUMULATIVE MEDICAID/CHIP ENROLLMENT CHANGE PRE-ACA AND POST-ACA BY STATE
Medicaid/CHIP Enrollment Medicaid Spending
Federal Medical Assistance
NEMT Expense Classification
NEMT Operating Facts
Managed Care Enrollment
Page 12
CALIFORNIAIn-House ManagementManaged Care OrganizationStatewide BrokerRegional Broker
NEMT Assurance under the State Medicaid Plan1902(a)(70) State Plan AmendmentFederal Section 1115 Demonstration WaiverFederal Section 1915(b) Freedom-of-Choice Waiver
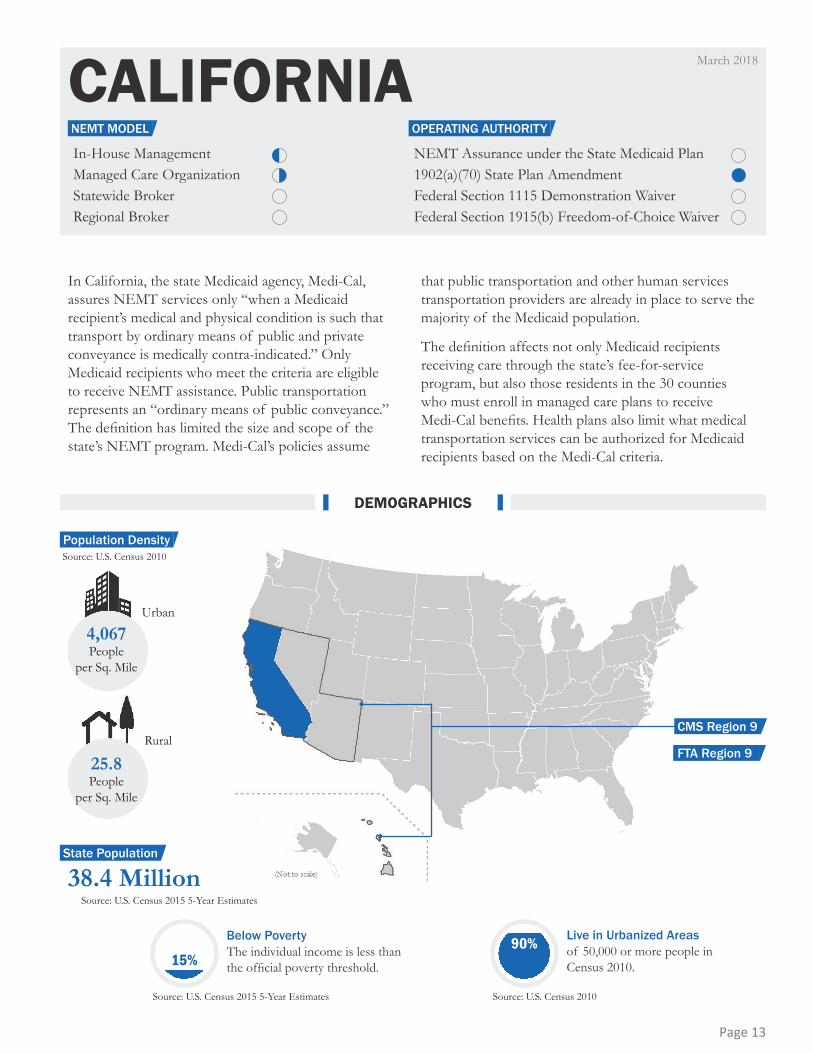
4,067People
per Sq. Mile
Urban
Rural
25.8People
per Sq. Mile
Source: U.S. Census 2010
Below PovertyThe individual income is less than the official poverty threshold.
Source: U.S. Census 2015 5-Year Estimates
Live in Urbanized Areasof 50,000 or more people in Census 2010.
Source: U.S. Census 2010
15%90%
In California, the state Medicaid agency, Medi-Cal, assures NEMT services only “when a Medicaid recipient’s medical and physical condition is such that transport by ordinary means of public and private conveyance is medically contra-indicated.” Only Medicaid recipients who meet the criteria are eligible to receive NEMT assistance. Public transportation represents an “ordinary means of public conveyance.” The definition has limited the size and scope of the state’s NEMT program. Medi-Cal’s policies assume
that public transportation and other human services transportation providers are already in place to serve the majority of the Medicaid population.
The definition affects not only Medicaid recipients receiving care through the state’s fee-for-service program, but also those residents in the 30 counties who must enroll in managed care plans to receive Medi-Cal benefits. Health plans also limit what medical transportation services can be authorized for Medicaid recipients based on the Medi-Cal criteria.
March 2018
DEMOGRAPHICS
OPERATING AUTHORITYNEMT MODEL
Population Density
38.4 MillionSource: U.S. Census 2015 5-Year Estimates
State Population
FTA Region 9
CMS Region 9
Page 13

Administrative ExpenseMedical ExpenseMixed
7,755,381
12,405,352
0
2,000,000
4,000,000
6,000,000
8,000,000
10,000,000
12,000,000
14,000,000
Pre-ACA(July–Sept. 2013)
Post-ACA(Dec. 2016)
California may expand its Medicaid managed care program. More Medi-Cal recipients may be enrolled in one of the designated health plans in the future.
NEMT expense is classified as:
50% Federal Medical Assistance Percentage in fiscal year 2017.
77.0% of all Medicaid enrollees are enrolled in any Medicaid managed care program as of July 2015.
$85.4 Billion Medicaid expenditure in fiscal year 2015. Expenditures do not include administrative cost and accounting adjustments.
California decided to adopt the Medicaid expansion under the ACA.
$136.1 Millionis the estimated annual NEMT 2013 expense.
4,823,202is the 2013 estimated annual NEMT trips.
0.9% of all Medicaid enrollees in 2013 used NEMT.
% Not Providedof NEMT is public transit.
60.0%
Source: Centers for Medicare & Medicaid Services Source: 2014 National NEMT Survey
Source: Kaiser Family Foundation
Source: Kaiser Family Foundation
Source: Kaiser Family Foundation
Source: 2014 National NEMT Survey
Kent
ucky
102.
8%87
.5%
69.3
%
50.6
%
34.6
%
20.0
% 30.6
%
8.1%
44.5
%
26.0
%
12.3
%
15.4
%
6.2%
77.1
%
64.7
%
49.7
%
34.6
%
16.7
% 25.9
%
8.1%
59.9
%
39.8
%
22.3
%
8.2% 14
.4%
5.8%
70.3
%
56.2
%
35.3
%
20.2
% 31.5
%
11.7
%
62.7
%
44.7
%
27.7
%
13.1
%
17.4
%
7.4%
57.4
%
38.8
%
21.9
%
5.0% 12
.0%
5.3%
3.9%
1.8%
-0.4
%-8
.3%
Nev
ada
Col
orad
oA
rkan
sas
New
Mex
ico
Mon
tana
Was
hing
ton
Cal
iforn
iaW
est V
irgin
iaO
rego
nRh
ode
Isla
ndN
ew H
amps
hire
Mar
ylan
dA
rizon
aA
lask
aN
ew Je
rsey
Loui
siana
Nor
th D
akot
aO
hio
Indi
ana
Mas
sach
uset
tsIo
wa
Penn
sylv
ania
Mic
higa
nM
inne
sota
Haw
aii
Illin
ois
New
Yor
kD
.C.
Del
awar
eVe
rmon
tTe
nnes
see
Nor
th C
arol
ina
Idah
oFl
orid
aM
issou
riG
eorg
iaSo
uth
Car
olin
aA
laba
ma
Kan
sas
Texa
sM
ississ
ippi
Virg
inia
Uta
hW
iscon
sinSo
uth
Dak
ota
Okl
ahom
aN
ebra
ska
Wyo
min
g
States that Expanded Medicaid under ACA*
States that Did Not Expand Medicaid under ACA*
120%
100%
-20%
0%
20%
40%
60%
80%
% Change from the Pre-ACA Summer 2013 to the Post-ACA December 2016 Source: Centers for Medicare & Medicaid Services
*Pre-ACA data for Connecticut not available *Pre-ACA data for Maine not available
Monthly Average + 60.0%
KEY STATISTICS
RECENT OR FUTURE CHANGES
CUMULATIVE MEDICAID/CHIP ENROLLMENT CHANGE PRE-ACA AND POST-ACA BY STATE
Medicaid/CHIP Enrollment Medicaid Spending
Federal Medical Assistance
NEMT Expense Classification
NEMT Operating Facts
Managed Care Enrollment
Page 14

COLORADOIn-House ManagementManaged Care OrganizationStatewide BrokerRegional Broker
NEMT Assurance under the State Medicaid Plan1902(a)(70) State Plan AmendmentFederal Section 1115 Demonstration WaiverFederal Section 1915(b) Freedom-of-Choice Waiver
5.3 Million
2,530People
per Sq. Mile
Urban
Rural
11.4People
per Sq. Mile
Source: U.S. Census 2010
Source: U.S. Census 2015 5-Year Estimates
Below PovertyThe individual income is less than the official poverty threshold.
Source: U.S. Census 2015 5-Year Estimates
Live in Urbanized Areasof 50,000 or more people in Census 2010.
Source: U.S. Census 2010
11%77%
Colorado’s Department of Health Care Policy and Financing (HCPF) operates a mixed NEMT model, involving a regional broker in the Denver metro region and decentralized in-house management in the rest of the state. LogistiCare was awarded the first regional brokerage contract in 2006, covering the eight-county Denver region. In 2013, Weld County was added to the Denver regional brokerage for a nine-county service region. First Transit replaced LogistiCare in 2011, and First Transit was replaced by Total Transit—an Arizona-based company—in 2014.
In the rest of the state, NEMT is provided by county departments of social services. Of the 55 remaining counties, 43 operate independently, and the remaining 12 have contracted with two local mobility managers— a for-profit private company and a nonprofit agency— each operating in six counties.
The state encourages the utilization of public transit providers in the NEMT program by offering a financial incentive to its regional broker in any month when more than 20 percent of the trips are assigned to public transportation.
March 2017
DEMOGRAPHICS
OPERATING AUTHORITYNEMT MODEL
Population Density
State Population
FTA Region 8
CMS Region 8
Page 15

Administrative ExpenseMedical ExpenseMixed
783,420
1,387,165
0200,000400,000600,000800,000
1,000,0001,200,0001,400,0001,600,000
Pre-ACA(July–Sept. 2013)
Post-ACA(Dec. 2016)
In 2014, a request for proposal was issued with a number of possible changes including expanding a broker model to the entire state; adding non-medical transportation provided through home and community-based service waivers to the broker’s responsibilities; adding dental services to Medicaid recipients, and expanding Medicaid eligibility under the ACA. Total Transit was awarded the
Denver regional brokerage contract in 2014 introducing an Uber-like component to its NEMT brokerage operation and relying on independent drivers to provide some trips to Medicaid customers in the Denver region. HCPF did not add non-medical transportation to the broker’s responsibilities and a state-wide broker was not implemented.
NEMT expense is classified as:
50% Federal Medical Assistance Percentage in fiscal year 2017.
8.5% of all Medicaid enrollees are enrolled in any Medicaid managed care program as of July 2015.
$7.4 Billion Medicaid expenditure in fiscal year 2015. Expenditures do not include administrative cost and accounting adjustments.
Colorado decided to adopt the Medicaid expansion under the ACA.
$9.3Millionis the estimated annual NEMT 2013 expense.
642,804is the 2013 estimated annual NEMT trips.
2% of all Medicaid enrollees in 2013 used NEMT.
% Not Providedof NEMT is public transit.
77.1%
Kent
ucky
102.
8%87
.5%
69.3
%
50.6
%
34.6
%
20.0
% 30.6
%
8.1%
60.0
%
44.5
%
26.0
%
12.3
%
15.4
%
6.2%
64.7
%
49.7
%
34.6
%
16.7
% 25.9
%
8.1%
59.9
%
39.8
%
22.3
%
8.2% 14
.4%
5.8%
70.3
%
56.2
%
35.3
%
20.2
% 31.5
%
11.7
%
62.7
%
44.7
%
27.7
%
13.1
%
17.4
%
7.4%
57.4
%
38.8
%
21.9
%
5.0% 12
.0%
5.3%
3.9%
1.8%
-0.4
%-8
.3%
Nev
ada
Col
orad
oA
rkan
sas
New
Mex
ico
Mon
tana
Was
hing
ton
Cal
iforn
iaW
est V
irgin
iaO
rego
nRh
ode
Isla
ndN
ew H
amps
hire
Mar
ylan
dA
rizon
aA
lask
aN
ew Je
rsey
Loui
siana
Nor
th D
akot
aO
hio
Indi
ana
Mas
sach
uset
tsIo
wa
Penn
sylv
ania
Mic
higa
nM
inne
sota
Haw
aii
Illin
ois
New
Yor
kD
.C.
Del
awar
eVe
rmon
tTe
nnes
see
Nor
th C
arol
ina
Idah
oFl
orid
aM
issou
riG
eorg
iaSo
uth
Car
olin
aA
laba
ma
Kan
sas
Texa
sM
ississ
ippi
Virg
inia
Uta
hW
iscon
sinSo
uth
Dak
ota
Okl
ahom
aN
ebra
ska
Wyo
min
g
States that Expanded Medicaid under ACA*
States that Did Not Expand Medicaid under ACA*
120%
100%
-20%
0%
20%
40%
60%
80%
% Change from the Pre-ACA Summer 2013 to the Post-ACA December 2016 Source: Centers for Medicare & Medicaid Services
*Pre-ACA data for Connecticut not available *Pre-ACA data for Maine not available
Monthly Average + 77.1%
Source: Centers for Medicare & Medicaid Services Source: 2014 National NEMT Survey
Source: Kaiser Family Foundation
Source: Kaiser Family Foundation
Source: Kaiser Family Foundation
Source: 2014 National NEMT Survey
KEY STATISTICS
RECENT OR FUTURE CHANGES
CUMULATIVE MEDICAID/CHIP ENROLLMENT CHANGE PRE-ACA AND POST-ACA BY STATE
Medicaid/CHIP Enrollment Medicaid Spending
Federal Medical Assistance
NEMT Expense Classification
NEMT Operating Facts
Managed Care Enrollment
Page 16

CONNECTICUTIn-House ManagementManaged Care OrganizationStatewide BrokerRegional Broker
NEMT Assurance under the State Medicaid Plan1902(a)(70) State Plan AmendmentFederal Section 1115 Demonstration WaiverFederal Section 1915(b) Freedom-of-Choice Waiver
1,660People
per Sq. Mile
Urban
Rural
174.6People
per Sq. Mile
Source: U.S. Census 2010
Below PovertyThe individual income is less than the official poverty threshold.
Source: U.S. Census 2015 5-Year Estimates
Live in Urbanized Areasof 50,000 or more people in Census 2010.
Source: U.S. Census 2010
11% 85%
Until 2011, most Medicaid recipients in Connecticut received NEMT services through their managed care organizations (MCOs). The Department of Social Services (DSS) operated a brokerage program to serve Medicaid recipients who remained in the fee-for-service Medicaid program.
A sizeable portion of the state’s Medicaid population was assigned to a regionally based MCO. The state adopted a carved-in NEMT model for Medicaid recipients in the managed care program. Each health plan was responsible for assuring that its enrollees could get to and from covered Medicaid services. Most MCOs contracted with brokers to manage their NEMT responsibilities. For the Medicaid population that was not assigned to an MCO, DSS operated a NEMT brokerage program.
In 2011, DSS moved to an administrative services Medicaid model in which the regional MCOs were replaced by three contractors, one each to serve the physical, behavioral, and dental health needs of the state’s 500,000 Medicaid recipients. Management of the NEMT program was consolidated through the establishment of a fourth administrative services organization to manage all NEMT for the entire Medicaid population. DSS consolidated the NEMT benefit under one program, carving out this benefit from the MCOs that provided medical coverage.
DSS created one statewide comprehensive NEMT program to serve all Medicaid recipients. In 2012, DSS awarded a statewide brokerage contract to a for-profit national broker. The current structure is basically a fee-for-service system with a statewide administrator/contractor. The fee structure is fixed by the state.
March 2017
DEMOGRAPHICS
OPERATING AUTHORITYNEMT MODEL
Population Density
3.6 MillionSource: U.S. Census 2015 5-Year Estimates
State Population
FTA Region 1
CMS Region 1
Page 17

Administrative ExpenseMedical ExpenseMixed
DSS will execute a three-year contract for NEMT services for a statewide broker effective January 1, 2018, through December 31, 2020. The program is being restructured based on a capitated payment system.
NEMT expense is classified as:
50% Federal Medical Assistance Percentage in fiscal year 2017.
0% of all Medicaid enrollees are enrolled in any Medicaid managed care program as of July 2015.
$7.9 Billion Medicaid expenditure in fiscal year 2015. Expenditures do not include administrative cost and accounting adjustments.
Connecticut expanded Medicaid under ACA. Connecticut did not report pre-ACA data to CMS. Based on data compiled by Health Management Associates for the Kaiser Commission, Medicaid enrollment in Connecticut as of June 2013 was 613,600. Compared to data reported to CMS in December 2016, Medicaid enrollment increased 24%.
3,600,000is the 2013 estimated annual NEMT trips.
% Not Providedof all Medicaid enrollees in 2013 used NEMT.
% Not Providedof NEMT is public transit.
Source: Centers for Medicare & Medicaid Services Source: 2014 National NEMT Survey
Source: Kaiser Family Foundation
Source: Kaiser Family Foundation
Source: Kaiser Family Foundation
Source: 2014 National NEMT Survey
Kent
ucky
102.
8%87
.5%
69.3
%
50.6
%
34.6
%
20.0
% 30.6
%
8.1%
60.0
%
44.5
%
26.0
%
12.3
%
15.4
%
6.2%
77.1
%
64.7
%
49.7
%
34.6
%
16.7
% 25.9
%
8.1%
59.9
%
39.8
%
22.3
%
8.2% 14
.4%
5.8%
70.3
%
56.2
%
35.3
%
20.2
% 31.5
%
11.7
%
62.7
%
44.7
%
27.7
%
13.1
%
17.4
%
7.4%
57.4
%
38.8
%
21.9
%
5.0% 12
.0%
5.3%
3.9%
1.8%
-0.4
%-8
.3%
Nev
ada
Col
orad
oA
rkan
sas
New
Mex
ico
Mon
tana
Was
hing
ton
Cal
iforn
iaW
est V
irgin
iaO
rego
nRh
ode
Isla
ndN
ew H
amps
hire
Mar
ylan
dA
rizon
aA
lask
aN
ew Je
rsey
Loui
siana
Nor
th D
akot
aO
hio
Indi
ana
Mas
sach
uset
tsIo
wa
Penn
sylv
ania
Mic
higa
nM
inne
sota
Haw
aii
Illin
ois
New
Yor
kD
.C.
Del
awar
eVe
rmon
tTe
nnes
see
Nor
th C
arol
ina
Idah
oFl
orid
aM
issou
riG
eorg
iaSo
uth
Car
olin
aA
laba
ma
Kan
sas
Texa
sM
ississ
ippi
Virg
inia
Uta
hW
iscon
sinSo
uth
Dak
ota
Okl
ahom
aN
ebra
ska
Wyo
min
g
States that Expanded Medicaid under ACA*
States that Did Not Expand Medicaid under ACA*
120%
100%
-20%
0%
20%
40%
60%
80%
% Change from the Pre-ACA Summer 2013 to the Post-ACA December 2016 Source: Centers for Medicare & Medicaid Services
*Pre-ACA data for Connecticut not available *Pre-ACA data for Maine not available
$57.8 Millionis the estimated annual NEMT 2013 expense.
761,310
0100,000200,000300,000400,000500,000600,000700,000800,000
Pre-ACA(July–Sept. 2013)
Post-ACA(Dec. 2016)
KEY STATISTICS
RECENT OR FUTURE CHANGES
CUMULATIVE MEDICAID/CHIP ENROLLMENT CHANGE PRE-ACA AND POST-ACA BY STATE
Medicaid/CHIP Enrollment Medicaid Spending
Federal Medical Assistance
NEMT Expense Classification
NEMT Operating Facts
Managed Care Enrollment
Page 18
NEMT Assurance under the State Medicaid Plan1902(a)(70) State Plan AmendmentFederal Section 1115 Demonstration WaiverFederal Section 1915(b) Freedom-of-Choice Waiver
DELAWAREIn-House ManagementManaged Care OrganizationStatewide BrokerRegional Broker
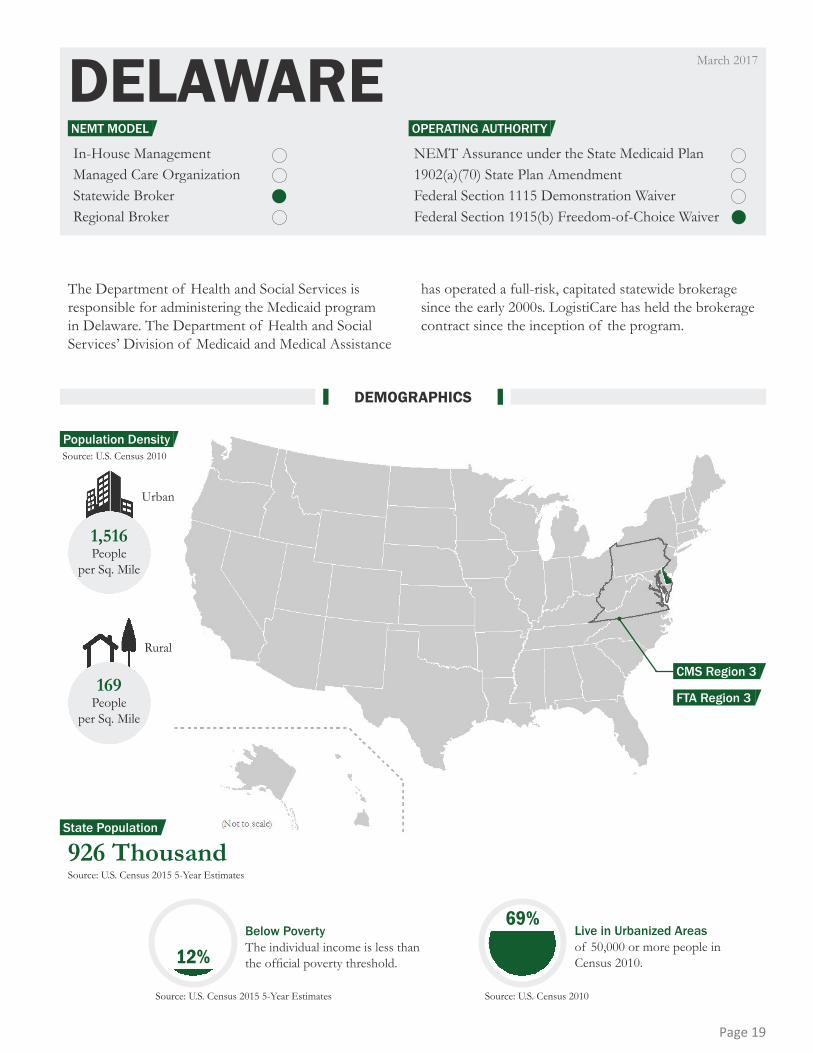
926 Thousand
1,516People
per Sq. Mile
Urban
Rural
169People
per Sq. Mile
Source: U.S. Census 2015 5-Year Estimates
Below PovertyThe individual income is less than the official poverty threshold.
Source: U.S. Census 2015 5-Year Estimates
Live in Urbanized Areasof 50,000 or more people in Census 2010.
Source: U.S. Census 2010
12%
69%
The Department of Health and Social Services is responsible for administering the Medicaid program in Delaware. The Department of Health and Social Services’ Division of Medicaid and Medical Assistance
has operated a full-risk, capitated statewide brokerage since the early 2000s. LogistiCare has held the brokerage contract since the inception of the program.
March 2017
DEMOGRAPHICS
Source: U.S. Census 2010
OPERATING AUTHORITYNEMT MODEL
Population Density
State Population
FTA Region 3
CMS Region 3
Page 19

Administrative ExpenseMedical ExpenseMixed
223,324241,664
0
50,000
100,000
150,000
200,000
250,000
300,000
Pre-ACA(July–Sept. 2013)
Post-ACA(Dec. 2016)
No program changes were reported.
NEMT expense is classified as:
54.2% Federal Medical Assistance Percentage in fiscal year 2017.
90.0% of all Medicaid enrollees are enrolled in any Medicaid managed care program as of July 2015.
$1.9 Billion Medicaid expenditure in fiscal year 2015. Expenditures do not include administrative cost and accounting adjustments.
Delaware decided to adopt the Medicaid expansion under the ACA.
$11.2 Millionis the estimated annual NEMT 2013 expense.
398,254is the 2013 estimated annual NEMT trips.
% Not Providedof all Medicaid enrollees in 2013 used NEMT.
% Not Providedof NEMT is public transit.
8.2%
Source: Centers for Medicare & Medicaid Services Source: 2014 National NEMT Survey
Source: Kaiser Family Foundation
Source: Kaiser Family Foundation
Source: Kaiser Family Foundation
Source: 2014 National NEMT Survey
Kent
ucky
102.
8%87
.5%
69.3
%
50.6
%
34.6
%
20.0
% 30.6
%
8.1%
60.0
%
44.5
%
26.0
%
12.3
%
15.4
%
6.2%
77.1
%
64.7
%
49.7
%
34.6
%
16.7
% 25.9
%
8.1%
59.9
%
39.8
%
22.3
%
14.4
%
5.8%
70.3
%
56.2
%
35.3
%
20.2
% 31.5
%
11.7
%
62.7
%
44.7
%
27.7
%
13.1
%
17.4
%
7.4%
57.4
%
38.8
%
21.9
%
5.0% 12
.0%
5.3%
3.9%
1.8%
-0.4
%-8
.3%
Nev
ada
Col
orad
oA
rkan
sas
New
Mex
ico
Mon
tana
Was
hing
ton
Cal
iforn
iaW
est V
irgin
iaO
rego
nRh
ode
Isla
ndN
ew H
amps
hire
Mar
ylan
dA
rizon
aA
lask
aN
ew Je
rsey
Loui
siana
Nor
th D
akot
aO
hio
Indi
ana
Mas
sach
uset
tsIo
wa
Penn
sylv
ania
Mic
higa
nM
inne
sota
Haw
aii
Illin
ois
New
Yor
kD
.C.
Del
awar
eVe
rmon
tTe
nnes
see
Nor
th C
arol
ina
Idah
oFl
orid
aM
issou
riG
eorg
iaSo
uth
Car
olin
aA
laba
ma
Kan
sas
Texa
sM
ississ
ippi
Virg
inia
Uta
hW
iscon
sinSo
uth
Dak
ota
Okl
ahom
aN
ebra
ska
Wyo
min
g
States that Expanded Medicaid under ACA*
States that Did Not Expand Medicaid under ACA*
120%
100%
-20%
0%
20%
40%
60%
80%
% Change from the Pre-ACA Summer 2013 to the Post-ACA December 2016 Source: Centers for Medicare & Medicaid Services
*Pre-ACA data for Connecticut not available *Pre-ACA data for Maine not available
Monthly Average + 8.2%
KEY STATISTICS
RECENT OR FUTURE CHANGES
CUMULATIVE MEDICAID/CHIP ENROLLMENT CHANGE PRE-ACA AND POST-ACA BY STATE
Medicaid/CHIP Enrollment Medicaid Spending
Federal Medical Assistance
NEMT Expense Classification
NEMT Operating Facts
Managed Care Enrollment
Page 20

DISTRICT OF COLUMBIAIn-House ManagementManaged Care OrganizationStatewide BrokerRegional Broker
NEMT Assurance under the State Medicaid Plan1902(a)(70) State Plan AmendmentFederal Section 1115 Demonstration WaiverFederal Section 1915(b) Freedom-of-Choice Waiver
647 Thousand
9,856People
per Sq. Mile
Urban
Rural
0People
per Sq. Mile
Source: U.S. Census 2010
Source: U.S. Census 2015 5-Year Estimates
Below PovertyThe individual income is less than the official poverty threshold.
Source: U.S. Census 2015 5-Year Estimates
Live in Urbanized Areasof 50,000 or more people in Census 2010.
Source: U.S. Census 2010
17% 100%
In 2007, Washington, D.C.’s Department of Health Care Finance (DHCF) introduced a full-risk brokerage model to assure NEMT services for Medicaid recipients in the district’s fee-for-service program. Transportation was already included in capitation rates paid to managed care organizations for the managed care population.
The broker provides SmarTrip fare cards to eligible NEMT riders to be used for bus and rail service. The broker also provides funds to the ADA paratransit EZ pay system that flow into the accounts of ADA-eligible
NEMT riders based on the number of scheduled medical trips. Travel training is provided to Medicaid recipients to encourage use of bus and rail service by the Washington Metropolitan Area Transit Authority.
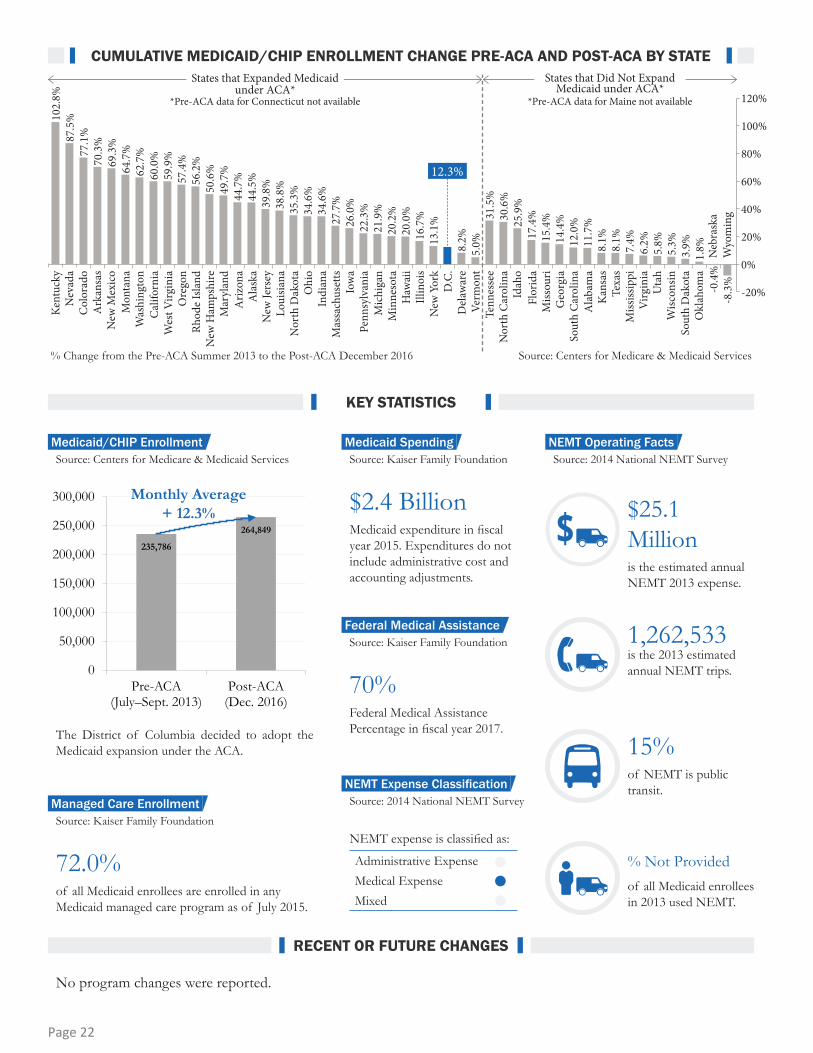
In 2014, DHCF reported that 15 percent of NEMT trips were taken on public buses or the rail system. Total trip counts and expenditures may be underreported because the managed care portion of the Medicaid program is not reported.
March 2018
DEMOGRAPHICS
OPERATING AUTHORITYNEMT MODEL
Population Density
State Population
FTA Region 3
CMS Region 3
Page 21
Administrative ExpenseMedical ExpenseMixed
235,786
264,849
0
50,000
100,000
150,000
200,000
250,000
300,000
Pre-ACA(July–Sept. 2013)
Post-ACA(Dec. 2016)
No program changes were reported.
NEMT expense is classified as:
70% Federal Medical Assistance Percentage in fiscal year 2017.
72.0% of all Medicaid enrollees are enrolled in any Medicaid managed care program as of July 2015.
$2.4 Billion Medicaid expenditure in fiscal year 2015. Expenditures do not include administrative cost and accounting adjustments.
The District of Columbia decided to adopt the Medicaid expansion under the ACA.
$25.1Millionis the estimated annual NEMT 2013 expense.
1,262,533is the 2013 estimated annual NEMT trips.
% Not Provided of all Medicaid enrollees in 2013 used NEMT.
15%of NEMT is public transit.
12.3%
Source: Centers for Medicare & Medicaid Services Source: 2014 National NEMT Survey
Source: Kaiser Family Foundation
Source: Kaiser Family Foundation
Source: Kaiser Family Foundation
Source: 2014 National NEMT Survey
Kent
ucky
102.
8%87
.5%
69.3
%
50.6
%
34.6
%
20.0
% 30.6
%
8.1%
60.0
%
44.5
%
26.0
%
15.4
%
6.2%
77.1
%
64.7
%
49.7
%
34.6
%
16.7
% 25.9
%
8.1%
59.9
%
39.8
%
22.3
%
8.2% 14
.4%
5.8%
70.3
%
56.2
%
35.3
%
20.2
% 31.5
%
11.7
%
62.7
%
44.7
%
27.7
%
13.1
%
17.4
%
7.4%
57.4
%
38.8
%
21.9
%
5.0% 12
.0%
5.3%
3.9%
1.8%
-0.4
%-8
.3%
Nev
ada
Col
orad
oA
rkan
sas
New
Mex
ico
Mon
tana
Was
hing
ton
Cal
iforn
iaW
est V
irgin
iaO
rego
nRh
ode
Isla
ndN
ew H
amps
hire
Mar
ylan
dA
rizon
aA
lask
aN
ew Je
rsey
Loui
siana
Nor
th D
akot
aO
hio
Indi
ana
Mas
sach
uset
tsIo
wa
Penn
sylv
ania
Mic
higa
nM
inne
sota
Haw
aii
Illin
ois
New
Yor
kD
.C.
Del
awar
eVe
rmon
tTe
nnes
see
Nor
th C
arol
ina
Idah
oFl
orid
aM
issou
riG
eorg
iaSo
uth
Car
olin
aA
laba
ma
Kan
sas
Texa
sM
ississ
ippi
Virg
inia
Uta
hW
iscon
sinSo
uth
Dak
ota
Okl
ahom
aN
ebra
ska
Wyo
min
g
States that Expanded Medicaid under ACA*
States that Did Not Expand Medicaid under ACA*
120%
100%
-20%
0%
20%
40%
60%
80%
% Change from the Pre-ACA Summer 2013 to the Post-ACA December 2016 Source: Centers for Medicare & Medicaid Services
*Pre-ACA data for Connecticut not available *Pre-ACA data for Maine not available
Monthly Average + 12.3%
KEY STATISTICS
RECENT OR FUTURE CHANGES
CUMULATIVE MEDICAID/CHIP ENROLLMENT CHANGE PRE-ACA AND POST-ACA BY STATE
Medicaid/CHIP Enrollment Medicaid Spending
Federal Medical Assistance
NEMT Expense Classification
NEMT Operating Facts
Managed Care Enrollment
Page 22

FLORIDAIn-House ManagementManaged Care OrganizationStatewide BrokerRegional Broker
NEMT Assurance under the State Medicaid Plan1902(a)(70) State Plan AmendmentFederal Section 1115 Demonstration WaiverFederal Section 1915(b) Freedom-of-Choice Waiver
2,221People
per Sq. Mile
Urban
Rural50.5People
per Sq. Mile
Below PovertyThe individual income is less than the official poverty threshold.
Source: U.S. Census 2015 5-Year Estimates
Live in Urbanized AreasOf 50,000 or more people in Census 2010.
Source: U.S. Census 2010
16%87%
Prior to May 2014, Florida’s state Medicaid agency, the Agency for Health Care Administration (AHCA), contracted with the Commission for the Transportation Disadvantaged (CTD) to manage all NEMT services in the state. CTD is an independent commission housed administratively within the Florida Department of Transportation. The CTD’s mission is to ensure the availability of efficient, cost-effective, and quality transportation services for transportation-disadvantaged persons. CTD contracted with over 65 county-based community transportation coordinators to provide travel assistance to Medicaid recipients. Prior to 2014, 55 of the 67 counties in Florida coordinated NEMT with human services transportation and public transportation.
The remaining 12 counties provided NEMT as a separate service.
The Florida Legislature established the Managed Medical Assistance program in 2011. As part of the program, it required managed care organizations (MCO) to provide covered services, including NEMT. As of May 2014, each MCO contracts with one of three for-profit national brokers to provide NEMT for Medicaid recipients under the managed care plans. The brokers each contract with a variety of transportation providers including taxicabs, public transit, human services transportation providers, and in some counties, the community transportation coordinator.
March 2018
DEMOGRAPHICS
Source: U.S. Census 2010
OPERATING AUTHORITYNEMT MODEL
Population Density
19.7 MillionSource: U.S. Census 2015 5-Year Estimates
State Population
FTA Region 4
CMS Region 4
Page 23

Administrative ExpenseMedical ExpenseMixed
CUMULATIVE MEDICAID/CHIP ENROLLMENT CHANGE PRE-ACA AND POST-ACA BY STATE
3,695,306
4,337,514
0500,000
1,000,0001,500,0002,000,0002,500,0003,000,0003,500,0004,000,0004,500,0005,000,000
Pre-ACA(July–Sept. 2013)
Post-ACA(Dec. 2016)
NEMT expense is classified as:
61.1% Federal Medical Assistance Percentage in fiscal year 2017.
79.0% of all Medicaid enrollees are enrolled in any Medicaid managed care program as of July 2015.
$21.5 Billion Medicaid expenditure in fiscal year 2015. Expenditures do not include administrative cost and accounting adjustments.
Florida decided not to adopt the Medicaid expansion under the ACA.
$61.1 Millionis the estimated annual NEMT 2013 expense.
2,815,811is the 2013 estimated annual NEMT trips.
2.5% of all Medicaid enrollees in 2013 used NEMT.
9.2%of NEMT is public transit.
No program changes were reported.
17.4%
Source: Centers for Medicare & Medicaid Services Source: 2014 National NEMT Survey
Source: Kaiser Family Foundation
Source: Kaiser Family Foundation
Source: Kaiser Family Foundation
Source: 2014 National NEMT Survey
Kent
ucky
102.
8%87
.5%
69.3
%
50.6
%
34.6
%
20.0
% 30.6
%
8.1%
60.0
%
44.5
%
26.0
%
12.3
%
15.4
%
6.2%
77.1
%
64.7
%
49.7
%
34.6
%
16.7
% 25.9
%
8.1%
59.9
%
39.8
%
22.3
%
8.2% 14
.4%
5.8%
70.3
%
56.2
%
35.3
%
20.2
% 31.5
%
11.7
%
62.7
%
44.7
%
27.7
%
13.1
%
7.4%
57.4
%
38.8
%
21.9
%
5.0% 12
.0%
5.3%
3.9%
1.8%
-0.4
%-8
.3%
Nev
ada
Col
orad
oA
rkan
sas
New
Mex
ico
Mon
tana
Was
hing
ton
Cal
iforn
iaW
est V
irgin
iaO
rego
nRh
ode
Isla
ndN
ew H
amps
hire
Mar
ylan
dA
rizon
aA
lask
aN
ew Je
rsey
Loui
siana
Nor
th D
akot
aO
hio
Indi
ana
Mas
sach
uset
tsIo
wa
Penn
sylv
ania
Mic
higa
nM
inne
sota
Haw
aii
Illin
ois
New
Yor
kD
.C.
Del
awar
eVe
rmon
tTe
nnes
see
Nor
th C
arol
ina
Idah
oFl
orid
aM
issou
riG
eorg
iaSo
uth
Car
olin
aA
laba
ma
Kan
sas
Texa
sM
ississ
ippi
Virg
inia
Uta
hW
iscon
sinSo
uth
Dak
ota
Okl
ahom
aN
ebra
ska
Wyo
min
g
States that Expanded Medicaid under ACA*
States that Did Not Expand Medicaid under ACA*
120%
100%
-20%
0%
20%
40%
60%
80%
% Change from the Pre-ACA Summer 2013 to the Post-ACA December 2016 Source: Centers for Medicare & Medicaid Services
*Pre-ACA data for Connecticut not available *Pre-ACA data for Maine not available
Monthly Average + 17.4%
KEY STATISTICS
RECENT OR FUTURE CHANGES
Medicaid/CHIP Enrollment Medicaid Spending
Federal Medical Assistance
NEMT Expense Classification
NEMT Operating Facts
Managed Care Enrollment
Page 24

GEORGIAIn-House ManagementManaged Care OrganizationStatewide BrokerRegional Broker
NEMT Assurance under the State Medicaid Plan1902(a)(70) State Plan AmendmentFederal Section 1115 Demonstration WaiverFederal Section 1915(b) Freedom-of-Choice Waiver
10.0 Million
1,321People
per Sq. Mile
Urban
Rural
62.6People
per Sq. Mile
Source: U.S. Census 2010
Source: U.S. Census 2015 5-Year Estimates
Below PovertyThe individual income is less than the official poverty threshold.
Source: U.S. Census 2015 5-Year Estimates
Live in Urbanized Areasof 50,000 or more people in Census 2010.
Source: U.S. Census 2010
17%65%
In 1997, the Georgia Department of Community Health created a regional transportation brokerage program to serve its Medicaid clients. Two private brokers—LogistiCare and Southeastrans—have managed NEMT services in the state’s five regions since the inception of the program.
Georgia and Virginia were the first two states to develop Request for Proposals and invite outside brokers to manage the state NEMT programs.
March 2017
DEMOGRAPHICS
OPERATING AUTHORITYNEMT MODEL
Population Density
State Population
FTA Region 4
CMS Region 4
Page 25
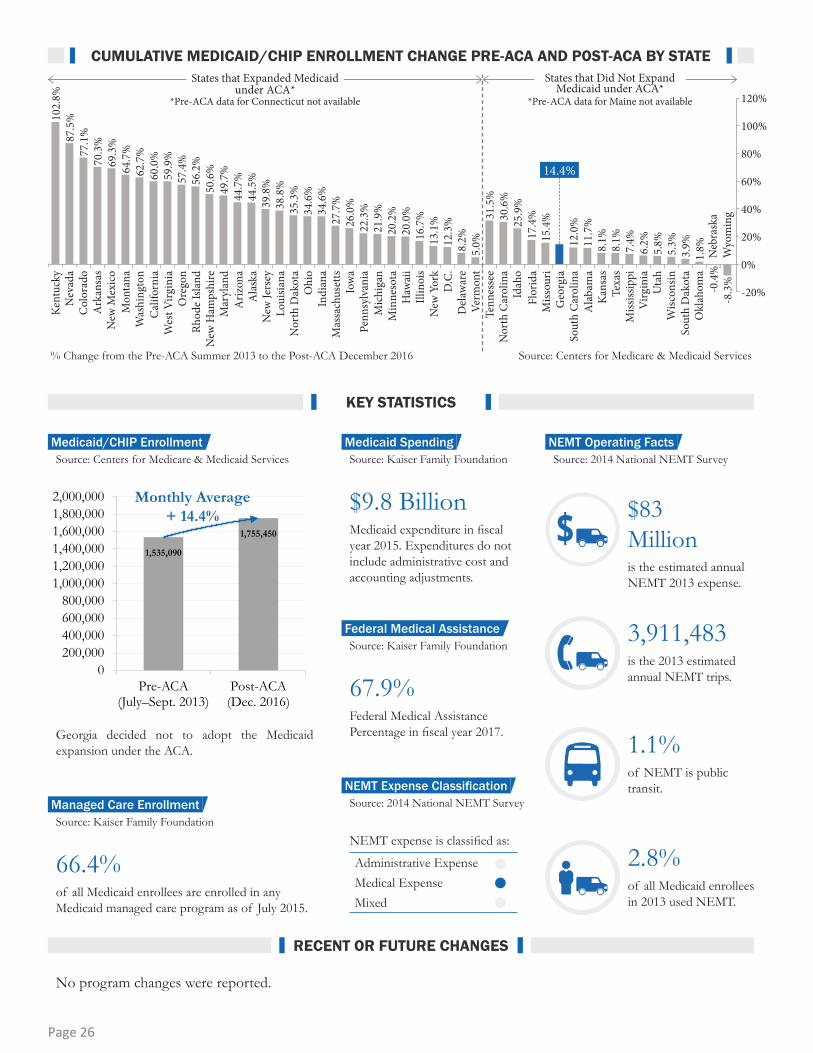
Administrative ExpenseMedical ExpenseMixed
1,535,090
1,755,450
0200,000400,000600,000800,000
1,000,0001,200,0001,400,0001,600,0001,800,0002,000,000
Pre-ACA(July–Sept. 2013)
Post-ACA(Dec. 2016)
No program changes were reported.
NEMT expense is classified as:
67.9% Federal Medical Assistance Percentage in fiscal year 2017.
66.4% of all Medicaid enrollees are enrolled in any Medicaid managed care program as of July 2015.
$9.8 Billion Medicaid expenditure in fiscal year 2015. Expenditures do not include administrative cost and accounting adjustments.
Georgia decided not to adopt the Medicaid expansion under the ACA.
$83Millionis the estimated annual NEMT 2013 expense.
3,911,483is the 2013 estimated annual NEMT trips.
2.8% of all Medicaid enrollees in 2013 used NEMT.
1.1%of NEMT is public transit.
14.4%
Source: Centers for Medicare & Medicaid Services Source: 2014 National NEMT Survey
Source: Kaiser Family Foundation
Source: Kaiser Family Foundation
Source: Kaiser Family Foundation
Source: 2014 National NEMT Survey
Kent
ucky
102.
8%87
.5%
69.3
%
50.6
%
34.6
%
20.0
% 30.6
%
8.1%
60.0
%
44.5
%
26.0
%
12.3
%
15.4
%
6.2%
77.1
%
64.7
%
49.7
%
34.6
%
16.7
% 25.9
%
8.1%
59.9
%
39.8
%
22.3
%
8.2%
5.8%
70.3
%
56.2
%
35.3
%
20.2
% 31.5
%
11.7
%
62.7
%
44.7
%
27.7
%
13.1
%
17.4
%
7.4%
57.4
%
38.8
%
21.9
%
5.0% 12
.0%
5.3%
3.9%
1.8%
-0.4
%-8
.3%
Nev
ada
Col
orad
oA
rkan
sas
New
Mex
ico
Mon
tana
Was
hing
ton
Cal
iforn
iaW
est V
irgin
iaO
rego
nRh
ode
Isla
ndN
ew H
amps
hire
Mar
ylan
dA
rizon
aA
lask
aN
ew Je
rsey
Loui
siana
Nor
th D
akot
aO
hio
Indi
ana
Mas
sach
uset
tsIo
wa
Penn
sylv
ania
Mic
higa
nM
inne
sota
Haw
aii
Illin
ois
New
Yor
kD
.C.
Del
awar
eVe
rmon
tTe
nnes
see
Nor
th C
arol
ina
Idah
oFl
orid
aM
issou
riG
eorg
iaSo
uth
Car
olin
aA
laba
ma
Kan
sas
Texa
sM
ississ
ippi
Virg
inia
Uta
hW
iscon
sinSo
uth
Dak
ota
Okl
ahom
aN
ebra
ska
Wyo
min
g
States that Expanded Medicaid under ACA*
States that Did Not Expand Medicaid under ACA*
120%
100%
-20%
0%
20%
40%
60%
80%
% Change from the Pre-ACA Summer 2013 to the Post-ACA December 2016 Source: Centers for Medicare & Medicaid Services
*Pre-ACA data for Connecticut not available *Pre-ACA data for Maine not available
Monthly Average + 14.4%
KEY STATISTICS
RECENT OR FUTURE CHANGES
CUMULATIVE MEDICAID/CHIP ENROLLMENT CHANGE PRE-ACA AND POST-ACA BY STATE
Medicaid/CHIP Enrollment Medicaid Spending
Federal Medical Assistance
NEMT Expense Classification
NEMT Operating Facts
Managed Care Enrollment
Page 26
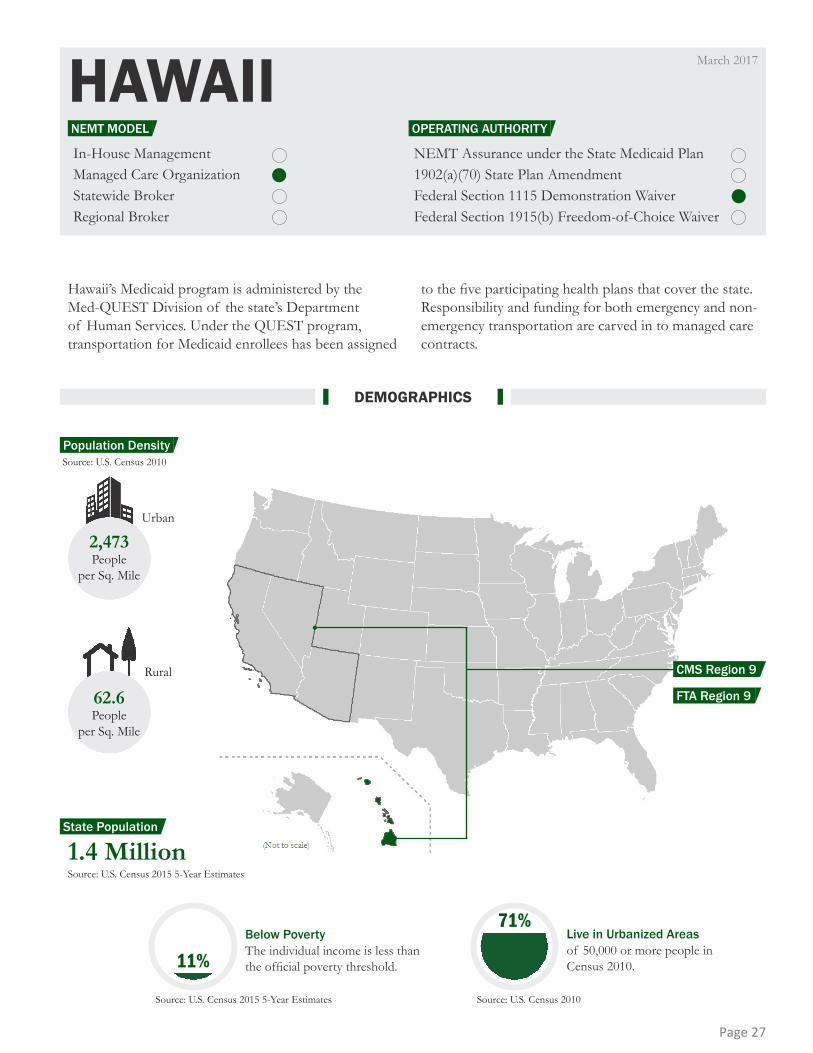
HAWAIINEMT Assurance under the State Medicaid Plan1902(a)(70) State Plan AmendmentFederal Section 1115 Demonstration WaiverFederal Section 1915(b) Freedom-of-Choice Waiver
In-House ManagementManaged Care OrganizationStatewide BrokerRegional Broker
1.4 Million
2,473People
per Sq. Mile
Urban
Rural
62.6People
per Sq. Mile
Source: U.S. Census 2015 5-Year Estimates
Below PovertyThe individual income is less than the official poverty threshold.
Source: U.S. Census 2015 5-Year Estimates
Live in Urbanized Areasof 50,000 or more people in Census 2010.
Source: U.S. Census 2010
11%
71%
Hawaii’s Medicaid program is administered by the Med-QUEST Division of the state’s Department of Human Services. Under the QUEST program, transportation for Medicaid enrollees has been assigned
to the five participating health plans that cover the state. Responsibility and funding for both emergency and non-emergency transportation are carved in to managed care contracts.
March 2017
DEMOGRAPHICS
OPERATING AUTHORITYNEMT MODEL
Population Density
State Population
FTA Region 9
CMS Region 9
Source: U.S. Census 2010
Page 27

Administrative ExpenseMedical ExpenseMixed
288,357
345,975
050,000
100,000150,000200,000250,000300,000350,000400,000
Pre-ACA(July–Sept. 2013)
Post-ACA(Dec. 2016)
No program changes were reported.
NEMT expense is classified as:
54.9% Federal Medical Assistance Percentage in fiscal year 2017.
99.9% of all Medicaid enrollees are enrolled in any Medicaid managed care program as of July 2015.
$2.0 Billion Medicaid expenditure in fiscal year 2015. Expenditures do not include administrative cost and accounting adjustments.
Hawaii decided to adopt the Medicaid expansion under the ACA.
$23.5 Millionis the estimated annual NEMT 2013 expense.
831,493is the 2013 estimated annual NEMT trips.
% Not Providedof all Medicaid enrollees in 2013 used NEMT.
% Not Providedof NEMT is public transit.
20.0%
Source: Centers for Medicare & Medicaid Services Source: 2014 National NEMT Survey
Source: Kaiser Family Foundation
Source: Kaiser Family Foundation
Source: Kaiser Family Foundation
Source: 2014 National NEMT Survey
Kent
ucky
102.
8%87
.5%
69.3
%
50.6
%
34.6
%
30.6
%
8.1%
60.0
%
44.5
%
26.0
%
12.3
%
15.4
%
6.2%
77.1
%
64.7
%
49.7
%
34.6
%
16.7
% 25.9
%
8.1%
59.9
%
39.8
%
22.3
%
8.2% 14
.4%
5.8%
70.3
%
56.2
%
35.3
%
20.2
% 31.5
%
11.7
%
62.7
%
44.7
%
27.7
%
13.1
%
17.4
%
7.4%
57.4
%
38.8
%
21.9
%
5.0% 12
.0%
5.3%
3.9%
1.8%
-0.4
%-8
.3%
Nev
ada
Col
orad
oA
rkan
sas
New
Mex
ico
Mon
tana
Was
hing
ton
Cal
iforn
iaW
est V
irgin
iaO
rego
nRh
ode
Isla
ndN
ew H
amps
hire
Mar
ylan
dA
rizon
aA
lask
aN
ew Je
rsey
Loui
siana
Nor
th D
akot
aO
hio
Indi
ana
Mas
sach
uset
tsIo
wa
Penn
sylv
ania
Mic
higa
nM
inne
sota
Haw
aii
Illin
ois
New
Yor
kD
.C.
Del
awar
eVe
rmon
tTe
nnes
see
Nor
th C
arol
ina
Idah
oFl
orid
aM
issou
riG
eorg
iaSo
uth
Car
olin
aA
laba
ma
Kan
sas
Texa
sM
ississ
ippi
Virg
inia
Uta
hW
iscon
sinSo
uth
Dak
ota
Okl
ahom
aN
ebra
ska
Wyo
min
g
States that Expanded Medicaid under ACA*
States that Did Not Expand Medicaid under ACA*
120%
100%
-20%
0%
20%
40%
60%
80%
% Change from the Pre-ACA Summer 2013 to the Post-ACA December 2016 Source: Centers for Medicare & Medicaid Services
*Pre-ACA data for Connecticut not available *Pre-ACA data for Maine not available
Monthly Average + 20.0%
KEY STATISTICS
RECENT OR FUTURE CHANGES
CUMULATIVE MEDICAID/CHIP ENROLLMENT CHANGE PRE-ACA AND POST-ACA BY STATE
Medicaid/CHIP Enrollment Medicaid Spending
Federal Medical Assistance
NEMT Expense Classification
NEMT Operating Facts
Managed Care Enrollment
Page 28

IDAHOIn-House ManagementManaged Care OrganizationStatewide BrokerRegional Broker
NEMT Assurance under the State Medicaid Plan1902(a)(70) State Plan AmendmentFederal Section 1115 Demonstration WaiverFederal Section 1915(b) Freedom-of-Choice Waiver
1.6 Million
1,587People
per Sq. Mile
Urban
Rural
9.4People
per Sq. Mile
Source: U.S. Census 2015 5-Year Estimates
Below PovertyThe individual income is less than the official poverty threshold.
Source: U.S. Census 2015 5-Year Estimates
Live in Urbanized Areasof 50,000 or more people in Census 2010.
Source: U.S. Census 2010
15%51%
Idaho’s Medicaid program is administered by the Department of Health and Welfare (DHW). All of the state’s Medicaid population is enrolled in designated managed care plans; however, the health plans are not responsible for providing transportation for their Medicaid members.
Until 2010, Idaho operated a region-based fee-for-service NEMT program. As of September 2010, DHW contracted with Access2Care to manage a statewide
brokerage. In July 2016, DHW named Veyo as the new statewide broker. Veyo is a transportation company that uses a ride-hailing service as part of its NEMT program. Veyo’s contract was to run three years, with an option to extend up to a total of eight years.
On March 6, 2018, DHW transferred NEMT services to a new statewide broker. The new broker is MTM, a private company with NEMT experience nationwide.
March 2018
DEMOGRAPHICS
OPERATING AUTHORITYNEMT MODEL
Population Density
State Population
FTA Region 10
CMS Region 10
Source: U.S. Census 2010
Page 29

Administrative ExpenseMedical ExpenseMixed
238,150
299,841
0
50,000
100,000
150,000
200,000
250,000
300,000
350,000
Pre-ACA(July–Sept. 2013)
Post-ACA(Dec. 2016)
DHW transferred the Idaho Medicaid NEMT statewide brokerage from Veyo to MTM on March 6, 2018. MTM
is taking over the remaining term of Veyo’s contract through June 2019.
NEMT expense is classified as:
71.5% Federal Medical Assistance Percentage in fiscal year 2017.
0% of all Medicaid enrollees are enrolled in any Medicaid managed care program as of July 2015.
$1.7 Billion Medicaid expenditure in fiscal year 2015. Expenditures do not include administrative cost and accounting adjustments.
Idaho decided not to adopt the Medicaid expansion under the ACA.
$20Millionis the estimated annual NEMT 2013 expense.
1,195,000is the 2013 estimated annual NEMT trips.
3% of all Medicaid enrollees in 2013 used NEMT.
1.5%of NEMT is public transit.
Source: Centers for Medicare & Medicaid Services Source: 2014 National NEMT Survey
Source: Kaiser Family Foundation
Source: Kaiser Family Foundation
Source: Kaiser Family Foundation
Source: 2014 National NEMT Survey
25.9%
Kent
ucky
102.
8%87
.5%
69.3
%
50.6
%
34.6
%
20.0
% 30.6
%
8.1%
60.0
%
44.5
%
26.0
%
12.3
%
15.4
%
6.2%
77.1
%
64.7
%
49.7
%
34.6
%
16.7
%
8.1%
59.9
%
39.8
%
22.3
%
8.2% 14
.4%
5.8%
70.3
%
56.2
%
35.3
%
20.2
% 31.5
%
11.7
%
62.7
%
44.7
%
27.7
%
13.1
%
17.4
%
7.4%
57.4
%
38.8
%
21.9
%
5.0% 12
.0%
5.3%
3.9%
1.8%
-0.4
%-8
.3%
Nev
ada
Col
orad
oA
rkan
sas
New
Mex
ico
Mon
tana
Was
hing
ton
Cal
iforn
iaW
est V
irgin
iaO
rego
nRh
ode
Isla
ndN
ew H
amps
hire
Mar
ylan
dA
rizon
aA
lask
aN
ew Je
rsey
Loui
siana
Nor
th D
akot
aO
hio
Indi
ana
Mas
sach
uset
tsIo
wa
Penn
sylv
ania
Mic
higa
nM
inne
sota
Haw
aii
Illin
ois
New
Yor
kD
.C.
Del
awar
eVe
rmon
tTe
nnes
see
Nor
th C
arol
ina
Idah
oFl
orid
aM
issou
riG
eorg
iaSo
uth
Car
olin
aA
laba
ma
Kan
sas
Texa
sM
ississ
ippi
Virg
inia
Uta
hW
iscon
sinSo
uth
Dak
ota
Okl
ahom
aN
ebra
ska
Wyo
min
g
States that Expanded Medicaid under ACA*
States that Did Not Expand Medicaid under ACA*
120%
100%
-20%
0%
20%
40%
60%
80%
% Change from the Pre-ACA Summer 2013 to the Post-ACA December 2016 Source: Centers for Medicare & Medicaid Services
*Pre-ACA data for Connecticut not available *Pre-ACA data for Maine not available
Monthly Average + 25.9%
KEY STATISTICS
RECENT OR FUTURE CHANGES
CUMULATIVE MEDICAID/CHIP ENROLLMENT CHANGE PRE-ACA AND POST-ACA BY STATE
Medicaid/CHIP Enrollment Medicaid Spending
Federal Medical Assistance
NEMT Expense Classification
NEMT Operating Facts
Managed Care Enrollment
Page 30
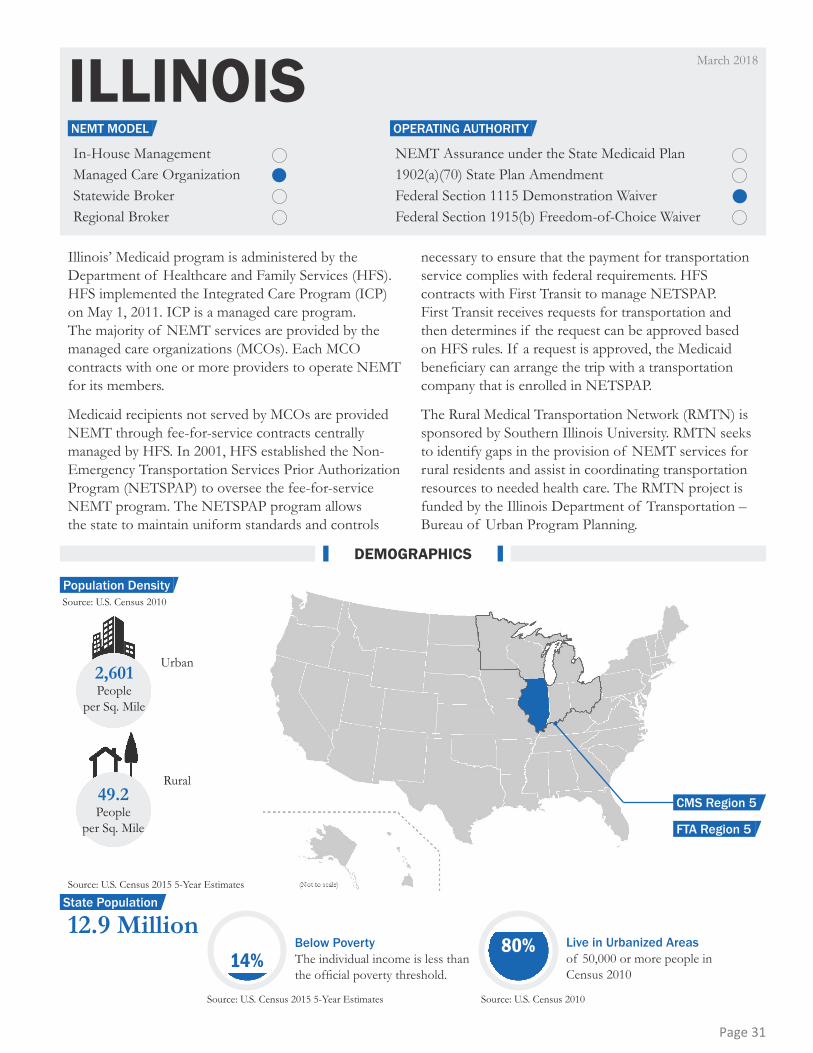
ILLINOISIn-House ManagementManaged Care OrganizationStatewide BrokerRegional Broker
NEMT Assurance under the State Medicaid Plan1902(a)(70) State Plan AmendmentFederal Section 1115 Demonstration WaiverFederal Section 1915(b) Freedom-of-Choice Waiver
12.9 Million
2,601People
per Sq. Mile
Urban
Rural49.2People
per Sq. Mile
Source: U.S. Census 2015 5-Year Estimates
Below PovertyThe individual income is less than the official poverty threshold.
Source: U.S. Census 2015 5-Year Estimates
Live in Urbanized Areasof 50,000 or more people in Census 2010
Source: U.S. Census 2010
14%80%
Illinois’ Medicaid program is administered by the Department of Healthcare and Family Services (HFS). HFS implemented the Integrated Care Program (ICP) on May 1, 2011. ICP is a managed care program. The majority of NEMT services are provided by the managed care organizations (MCOs). Each MCO contracts with one or more providers to operate NEMT for its members.
Medicaid recipients not served by MCOs are provided NEMT through fee-for-service contracts centrally managed by HFS. In 2001, HFS established the Non-Emergency Transportation Services Prior Authorization Program (NETSPAP) to oversee the fee-for-service NEMT program. The NETSPAP program allows the state to maintain uniform standards and controls
necessary to ensure that the payment for transportation service complies with federal requirements. HFS contracts with First Transit to manage NETSPAP. First Transit receives requests for transportation and then determines if the request can be approved based on HFS rules. If a request is approved, the Medicaid beneficiary can arrange the trip with a transportation company that is enrolled in NETSPAP.
The Rural Medical Transportation Network (RMTN) is sponsored by Southern Illinois University. RMTN seeks to identify gaps in the provision of NEMT services for rural residents and assist in coordinating transportation resources to needed health care. The RMTN project is funded by the Illinois Department of Transportation – Bureau of Urban Program Planning.
March 2018
DEMOGRAPHICS
Source: U.S. Census 2010
OPERATING AUTHORITYNEMT MODEL
Population Density
State Population
FTA Region 5
CMS Region 5
Page 31
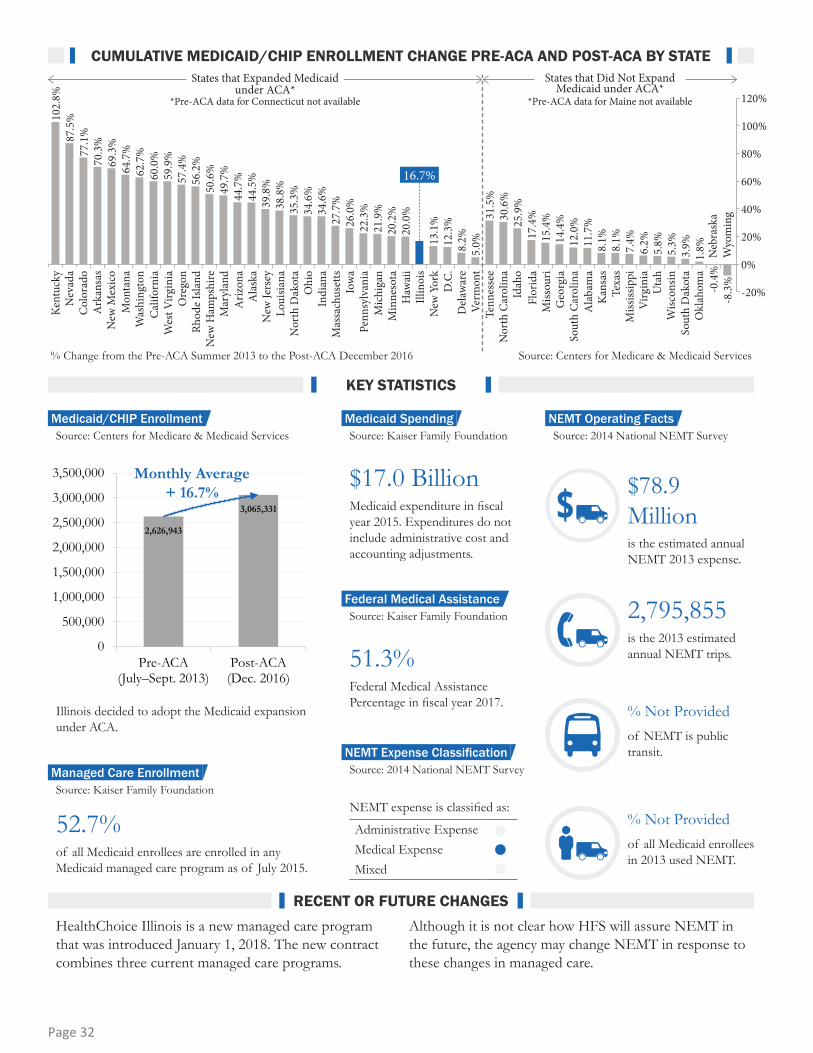
Administrative ExpenseMedical ExpenseMixed
2,626,943
3,065,331
0
500,000
1,000,000
1,500,000
2,000,000
2,500,000
3,000,000
3,500,000
Pre-ACA(July–Sept. 2013)
Post-ACA(Dec. 2016)
HealthChoice Illinois is a new managed care program that was introduced January 1, 2018. The new contract combines three current managed care programs.
Although it is not clear how HFS will assure NEMT in the future, the agency may change NEMT in response to these changes in managed care.
NEMT expense is classified as:
51.3% Federal Medical Assistance Percentage in fiscal year 2017.
52.7% of all Medicaid enrollees are enrolled in any Medicaid managed care program as of July 2015.
$17.0 Billion Medicaid expenditure in fiscal year 2015. Expenditures do not include administrative cost and accounting adjustments.
Illinois decided to adopt the Medicaid expansion under ACA.
$78.9 Millionis the estimated annual NEMT 2013 expense.
2,795,855is the 2013 estimated annual NEMT trips.
% Not Providedof all Medicaid enrollees in 2013 used NEMT.
% Not Providedof NEMT is public transit.
Source: Centers for Medicare & Medicaid Services Source: 2014 National NEMT Survey
Source: Kaiser Family Foundation
Source: Kaiser Family Foundation
Source: Kaiser Family Foundation
Source: 2014 National NEMT Survey
16.7%
Kent
ucky
102.
8%87
.5%
69.3
%
50.6
%
34.6
%
20.0
% 30.6
%
8.1%
60.0
%
44.5
%
26.0
%
12.3
%
15.4
%
6.2%
77.1
%
64.7
%
49.7
%
34.6
%
25.9
%
8.1%
59.9
%
39.8
%
22.3
%
8.2% 14
.4%
5.8%
70.3
%
56.2
%
35.3
%
20.2
% 31.5
%
11.7
%
62.7
%
44.7
%
27.7
%
13.1
%
17.4
%
7.4%
57.4
%
38.8
%
21.9
%
5.0% 12
.0%
5.3%
3.9%
1.8%
-0.4
%-8
.3%
Nev
ada
Col
orad
oA
rkan
sas
New
Mex
ico
Mon
tana
Was
hing
ton
Cal
iforn
iaW
est V
irgin
iaO
rego
nRh
ode
Isla
ndN
ew H
amps
hire
Mar
ylan
dA
rizon
aA
lask
aN
ew Je
rsey
Loui
siana
Nor
th D
akot
aO
hio
Indi
ana
Mas
sach
uset
tsIo
wa
Penn
sylv
ania
Mic
higa
nM
inne
sota
Haw
aii
Illin
ois
New
Yor
kD
.C.
Del
awar
eVe
rmon
tTe
nnes
see
Nor
th C
arol
ina
Idah
oFl
orid
aM
issou
riG
eorg
iaSo
uth
Car
olin
aA
laba
ma
Kan
sas
Texa
sM
ississ
ippi
Virg
inia
Uta
hW
iscon
sinSo
uth
Dak
ota
Okl
ahom
aN
ebra
ska
Wyo
min
g
States that Expanded Medicaid under ACA*
States that Did Not Expand Medicaid under ACA*
120%
100%
-20%
0%
20%
40%
60%
80%
% Change from the Pre-ACA Summer 2013 to the Post-ACA December 2016 Source: Centers for Medicare & Medicaid Services
*Pre-ACA data for Connecticut not available *Pre-ACA data for Maine not available
Monthly Average + 16.7%
KEY STATISTICS
RECENT OR FUTURE CHANGES
CUMULATIVE MEDICAID/CHIP ENROLLMENT CHANGE PRE-ACA AND POST-ACA BY STATE
Medicaid/CHIP Enrollment Medicaid Spending
Federal Medical Assistance
NEMT Expense Classification
NEMT Operating Facts
Managed Care Enrollment
Page 32
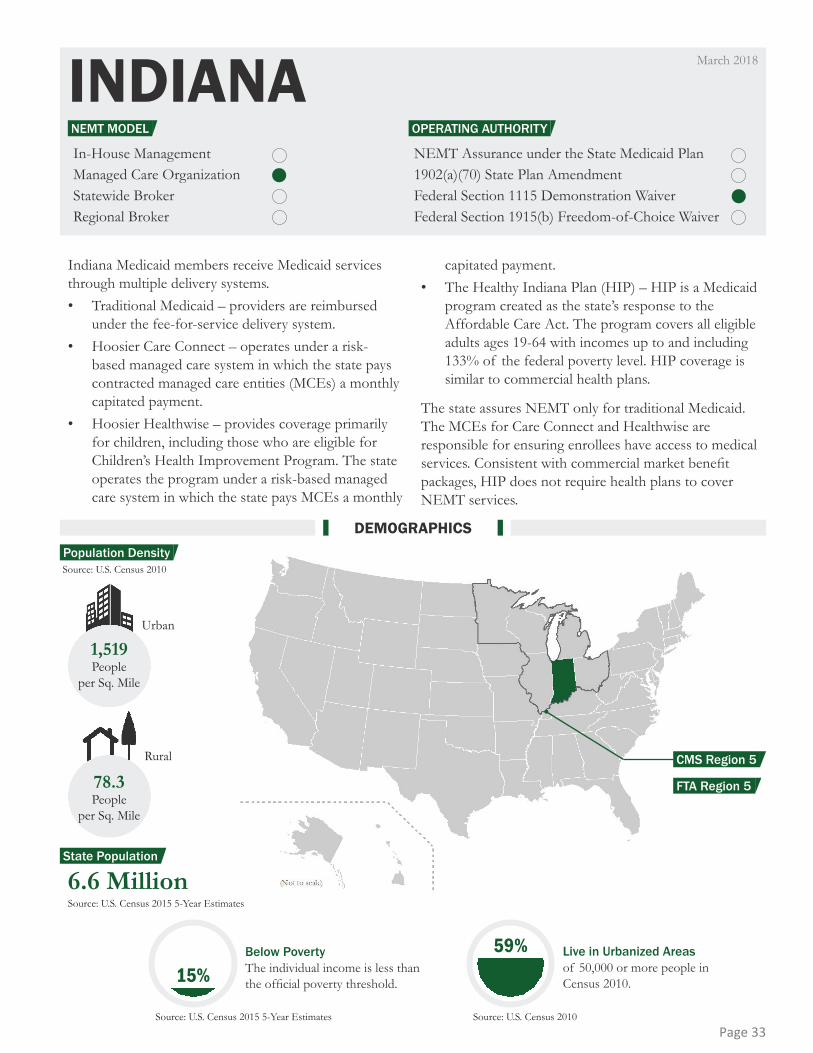
INDIANAIn-House ManagementManaged Care OrganizationStatewide BrokerRegional Broker
NEMT Assurance under the State Medicaid Plan1902(a)(70) State Plan AmendmentFederal Section 1115 Demonstration WaiverFederal Section 1915(b) Freedom-of-Choice Waiver
6.6 Million
Below PovertyThe individual income is less than the official poverty threshold.
1,519People
per Sq. Mile
Urban
Rural
78.3People
per Sq. Mile
Source: U.S. Census 2010
Source: U.S. Census 2015 5-Year Estimates
Source: U.S. Census 2015 5-Year Estimates
Live in Urbanized Areasof 50,000 or more people in Census 2010.
Source: U.S. Census 2010
15%59%
Indiana Medicaid members receive Medicaid services through multiple delivery systems. • Traditional Medicaid – providers are reimbursed
under the fee-for-service delivery system. • Hoosier Care Connect – operates under a risk-
based managed care system in which the state pays contracted managed care entities (MCEs) a monthly capitated payment.
• Hoosier Healthwise – provides coverage primarily for children, including those who are eligible for Children’s Health Improvement Program. The state operates the program under a risk-based managed care system in which the state pays MCEs a monthly
capitated payment. • The Healthy Indiana Plan (HIP) – HIP is a Medicaid
program created as the state’s response to the Affordable Care Act. The program covers all eligible adults ages 19-64 with incomes up to and including 133% of the federal poverty level. HIP coverage is similar to commercial health plans.
The state assures NEMT only for traditional Medicaid. The MCEs for Care Connect and Healthwise are responsible for ensuring enrollees have access to medical services. Consistent with commercial market benefit packages, HIP does not require health plans to cover NEMT services.
March 2018
DEMOGRAPHICS
OPERATING AUTHORITYNEMT MODEL
Population Density
State Population
FTA Region 5
CMS Region 5
Page 33

Administrative ExpenseMedical ExpenseMixed
1,120,674
1,508,219
0200,000400,000600,000800,000
1,000,0001,200,0001,400,0001,600,000
Pre-ACA(July–Sept. 2013)
Post-ACA(Dec. 2016)
No program changes were reported.
NEMT expense is classified as:
66.7% Federal Medical Assistance Percentage in fiscal year 2017.
77.9% of all Medicaid enrollees are enrolled in any Medicaid managed care program as of July 2015.
$9.3 Billion Medicaid expenditure in fiscal year 2015. Expenditures do not include administrative cost and accounting adjustments.
Indiana decided to adopt the Medicaid expansion under the ACA.
$41.9 Millionis the estimated annual NEMT 2013 expense.
1,485,904is the 2013 estimated annual NEMT trips.
% Not Provided of all Medicaid enrollees in 2013 used NEMT.
% Not Providedof NEMT is public transit.
Source: Centers for Medicare & Medicaid Services Source: 2014 National NEMT Survey
Source: Kaiser Family Foundation
Source: Kaiser Family Foundation
Source: Kaiser Family Foundation
Source: 2014 National NEMT Survey
34.6%
Kent
ucky
102.
8%87
.5%
69.3
%
50.6
%
34.6
%
20.0
% 30.6
%
8.1%
60.0
%
44.5
%
26.0
%
12.3
%
15.4
%
6.2%
77.1
%
64.7
%
49.7
%
16.7
% 25.9
%
8.1%
59.9
%
39.8
%
22.3
%
8.2% 14
.4%
5.8%
70.3
%
56.2
%
35.3
%
20.2
% 31.5
%
11.7
%
62.7
%
44.7
%
27.7
%
13.1
%
17.4
%
7.4%
57.4
%
38.8
%
21.9
%
5.0% 12
.0%
5.3%
3.9%
1.8%
-0.4
%-8
.3%
Nev
ada
Col
orad
oA
rkan
sas
New
Mex
ico
Mon
tana
Was
hing
ton
Cal
iforn
iaW
est V
irgin
iaO
rego
nRh
ode
Isla
ndN
ew H
amps
hire
Mar
ylan
dA
rizon
aA
lask
aN
ew Je
rsey
Loui
siana
Nor
th D
akot
aO
hio
Indi
ana
Mas
sach
uset
tsIo
wa
Penn
sylv
ania
Mic
higa
nM
inne
sota
Haw
aii
Illin
ois
New
Yor
kD
.C.
Del
awar
eVe
rmon
tTe
nnes
see
Nor
th C
arol
ina
Idah
oFl
orid
aM
issou
riG
eorg
iaSo
uth
Car
olin
aA
laba
ma
Kan
sas
Texa
sM
ississ
ippi
Virg
inia
Uta
hW
iscon
sinSo
uth
Dak
ota
Okl
ahom
aN
ebra
ska
Wyo
min
g
States that Expanded Medicaid under ACA*
States that Did Not Expand Medicaid under ACA*
120%
100%
-20%
0%
20%
40%
60%
80%
% Change from the Pre-ACA Summer 2013 to the Post-ACA December 2016 Source: Centers for Medicare & Medicaid Services
*Pre-ACA data for Connecticut not available *Pre-ACA data for Maine not available
Monthly Average + 34.6%
KEY STATISTICS
RECENT OR FUTURE CHANGES
CUMULATIVE MEDICAID/CHIP ENROLLMENT CHANGE PRE-ACA AND POST-ACA BY STATE
Medicaid/CHIP Enrollment Medicaid Spending
Federal Medical Assistance
NEMT Expense Classification
NEMT Operating Facts
Managed Care Enrollment
Page 34

IOWAIn-House ManagementManaged Care OrganizationStatewide BrokerRegional Broker
NEMT Assurance under the State Medicaid Plan1902(a)(70) State Plan AmendmentFederal Section 1115 Demonstration WaiverFederal Section 1915(b) Freedom-of-Choice Waiver
3.1 Million
1,331People
per Sq. Mile
Urban
Rural
32.2People
per Sq. Mile
Source: U.S. Census 2010
Source: U.S. Census 2015 5-Year Estimates
Below PovertyThe individual income is less than the official poverty threshold.
Source: U.S. Census 2015 5-Year Estimates
Live in Urbanized Areasof 50,000 or more people in Census 2010.
Source: U.S. Census 2010
12%42%
The Iowa Medicaid Enterprise (IME) is the division of the Iowa Department of Human Services (DHS) that administers the Iowa Medicaid program. On April 1, 2016, the DHS transitioned most Iowa Medicaid members to a managed care program called IA Health Link. Some Medicaid members continue to be served through Iowa Medicaid Fee-for-Service. The IA Health Link program is administered by three contracted managed care organizations (MCOs) which provide members with comprehensive health care services, including NEMT.
Iowa’s NEMT services are for members with full Medicaid benefits, who need travel reimbursement or a ride to get to medical appointments. Eligible members
receive NEMT services through different NEMT brokers depending on eligibility status and whether coverage is provided directly from Iowa Medicaid Fee-for-Service or an IA Health Link MCO. The appropriate broker checks member and trip eligibility and follows up on trips and claims.
The Iowa Health and Wellness Plan (IHAWP) is a Medicaid program created as the state’s response to the Affordable Care Act. Benefits of the IHAWP are based on the state employees’ commercial health insurance plan and do not contain the benefits traditionally associated with Medicaid under the state plan. This approach specifically excludes NEMT for the IHAWP members.
March 2018
DEMOGRAPHICS
OPERATING AUTHORITYNEMT MODEL
Population Density
State Population
FTA Region 7
CMS Region 7
Page 35
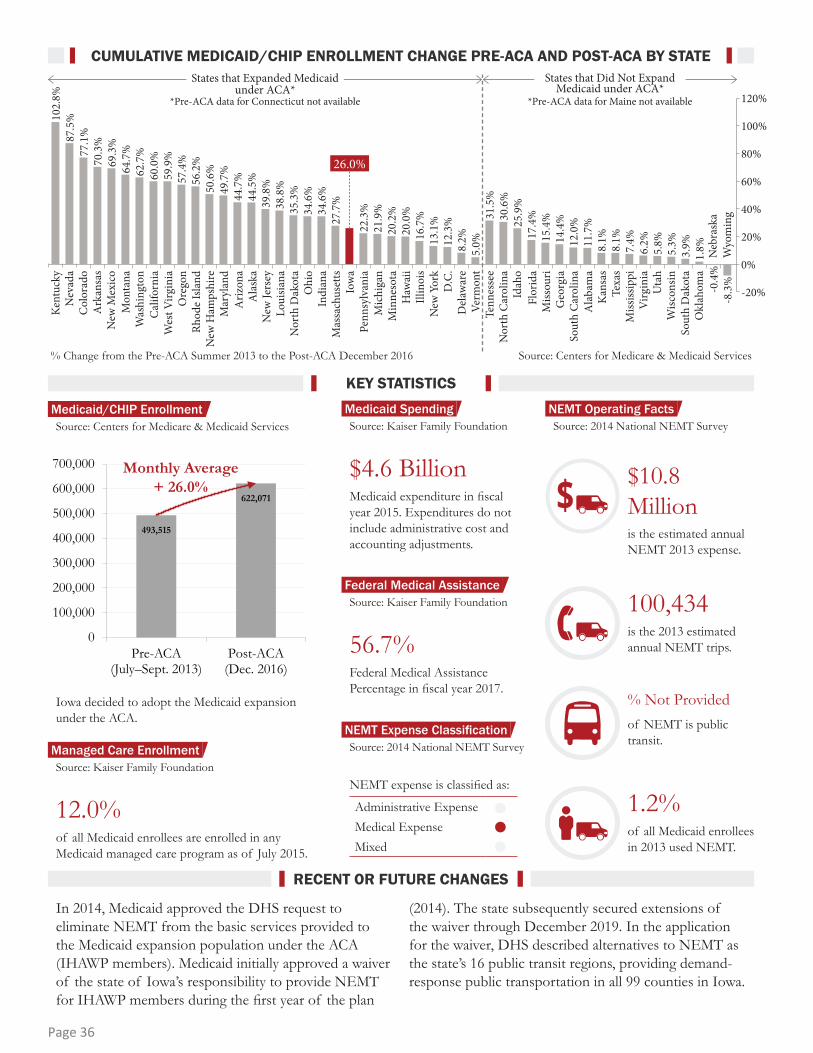
Administrative ExpenseMedical ExpenseMixed
In 2014, Medicaid approved the DHS request to eliminate NEMT from the basic services provided to the Medicaid expansion population under the ACA (IHAWP members). Medicaid initially approved a waiver of the state of Iowa’s responsibility to provide NEMT for IHAWP members during the first year of the plan
(2014). The state subsequently secured extensions of the waiver through December 2019. In the application for the waiver, DHS described alternatives to NEMT as the state’s 16 public transit regions, providing demand-response public transportation in all 99 counties in Iowa.
NEMT expense is classified as:
56.7% Federal Medical Assistance Percentage in fiscal year 2017.
12.0% of all Medicaid enrollees are enrolled in any Medicaid managed care program as of July 2015.
Source: 2014 National NEMT Survey
Source: Kaiser Family Foundation
Source: Kaiser Family Foundation
Source: 2014 National NEMT Survey
26.0%
Kent
ucky
102.
8%87
.5%
69.3
%
50.6
%
34.6
%
20.0
% 30.6
%
8.1%
60.0
%
44.5
%
12.3
%
15.4
%
6.2%
77.1
%
64.7
%
49.7
%
34.6
%
16.7
% 25.9
%
8.1%
59.9
%
39.8
%
22.3
%
8.2% 14
.4%
5.8%
70.3
%
56.2
%
35.3
%
20.2
% 31.5
%
11.7
%
62.7
%
44.7
%
27.7
%
13.1
%
17.4
%
7.4%
57.4
%
38.8
%
21.9
%
5.0% 12
.0%
5.3%
3.9%
1.8%
-0.4
%-8
.3%
Nev
ada
Col
orad
oA
rkan
sas
New
Mex
ico
Mon
tana
Was
hing
ton
Cal
iforn
iaW
est V
irgin
iaO
rego
nRh
ode
Isla
ndN
ew H
amps
hire
Mar
ylan
dA
rizon
aA
lask
aN
ew Je
rsey
Loui
siana
Nor
th D
akot
aO
hio
Indi
ana
Mas
sach
uset
tsIo
wa
Penn
sylv
ania
Mic
higa
nM
inne
sota
Haw
aii
Illin
ois
New
Yor
kD
.C.
Del
awar
eVe
rmon
tTe
nnes
see
Nor
th C
arol
ina
Idah
oFl
orid
aM
issou
riG
eorg
iaSo
uth
Car
olin
aA
laba
ma
Kan
sas
Texa
sM
ississ
ippi
Virg
inia
Uta
hW
iscon
sinSo
uth
Dak
ota
Okl
ahom
aN
ebra
ska
Wyo
min
g
States that Expanded Medicaid under ACA*
States that Did Not Expand Medicaid under ACA*
120%
100%
-20%
0%
20%
40%
60%
80%
% Change from the Pre-ACA Summer 2013 to the Post-ACA December 2016 Source: Centers for Medicare & Medicaid Services
*Pre-ACA data for Connecticut not available *Pre-ACA data for Maine not available
$10.8 Millionis the estimated annual NEMT 2013 expense.
100,434is the 2013 estimated annual NEMT trips.
1.2% of all Medicaid enrollees in 2013 used NEMT.
% Not Providedof NEMT is public transit.
KEY STATISTICS
RECENT OR FUTURE CHANGES
CUMULATIVE MEDICAID/CHIP ENROLLMENT CHANGE PRE-ACA AND POST-ACA BY STATE
493,515
622,071
0
100,000
200,000
300,000
400,000
500,000
600,000
700,000
Pre-ACA(July–Sept. 2013)
Post-ACA(Dec. 2016)
Iowa decided to adopt the Medicaid expansion under the ACA.
Source: Centers for Medicare & Medicaid Services
Monthly Average + 26.0%
Medicaid/CHIP Enrollment
$4.6 Billion Medicaid expenditure in fiscal year 2015. Expenditures do not include administrative cost and accounting adjustments.
Source: Kaiser Family FoundationMedicaid Spending
Federal Medical Assistance
NEMT Expense Classification
NEMT Operating Facts
Managed Care Enrollment
Page 36

KANSASIn-House ManagementManaged Care OrganizationStatewide BrokerRegional Broker
NEMT Assurance under the State Medicaid Plan1902(a)(70) State Plan AmendmentFederal Section 1115 Demonstration WaiverFederal Section 1915(b) Freedom-of-Choice Waiver
2.9 Million
1,472People
per Sq. Mile
Urban
Rural
17.5People
per Sq. Mile
Source: U.S. Census 2010
Source: U.S. Census 2015 5-Year Estimates
Below PovertyThe individual income is less than the official poverty threshold.
Source: U.S. Census 2015 5-Year Estimates
Live in Urbanized Areasof 50,000 or more people in Census 2010.
Source: U.S. Census 2010
13%50%
KanCare is the program through which the State of Kansas administers Medicaid. Prior to January 2013, the Kansas Department of Health and Environment assured transportation for Medicaid beneficiares through a statewide broker. Beginning in January 2013, the state moved to a mandatory managed care approach under a Section 1115 Demonstration Waiver. All Medicaid recipients in the state must enroll in one of three designated health plans. The managed care model, which grew out of the Affordable Care Act, is similar
to the approaches adopted by Florida, New Mexico, and Oregon.
Under Kansas’ redesigned NEMT program, each of the managed care organizations has employed a contract broker to manage medical transportation services. Two of the health plans contract with LogistiCare, and the third employs Access2Care, a subsidiary of American Medical Response. Brokers operate under full-risk, competitively bid contracts.
March 2018
DEMOGRAPHICS
OPERATING AUTHORITYNEMT MODEL
Population Density
State Population
FTA Region 7
CMS Region 7
Page 37
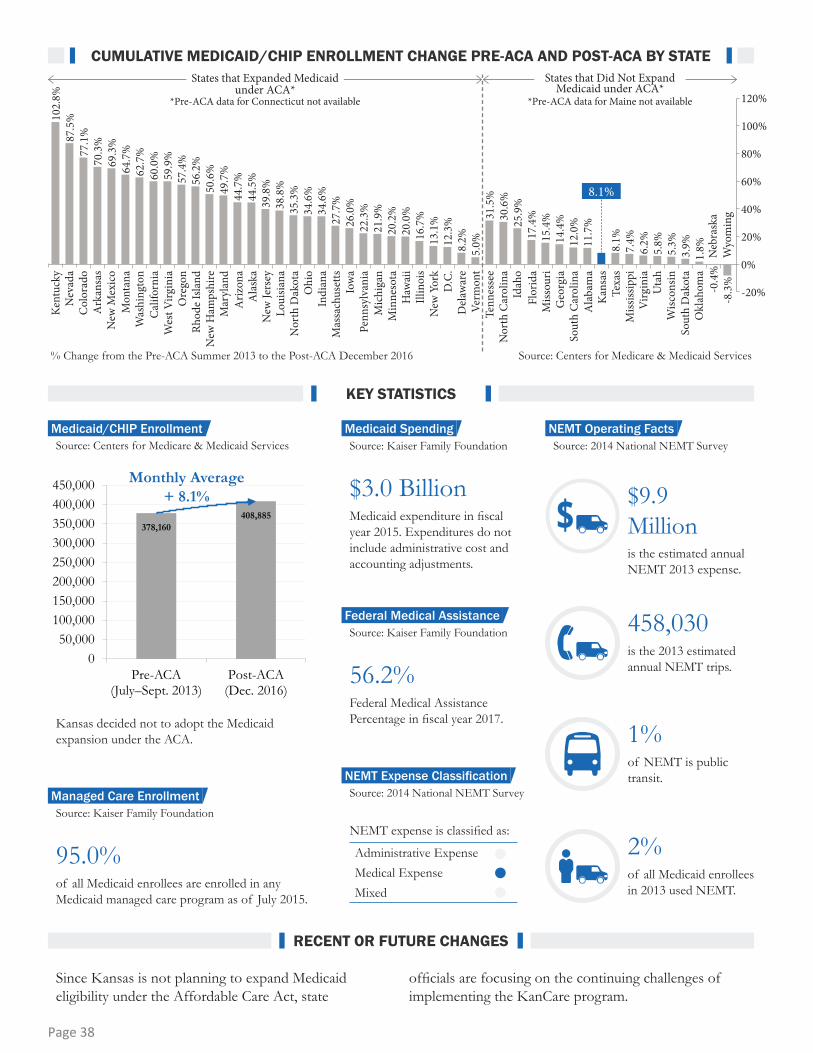
Administrative ExpenseMedical ExpenseMixed
378,160408,885
050,000
100,000150,000200,000250,000300,000350,000400,000450,000
Pre-ACA(July–Sept. 2013)
Post-ACA(Dec. 2016)
Since Kansas is not planning to expand Medicaid eligibility under the Affordable Care Act, state
officials are focusing on the continuing challenges of implementing the KanCare program.
NEMT expense is classified as:
56.2% Federal Medical Assistance Percentage in fiscal year 2017.
95.0% of all Medicaid enrollees are enrolled in any Medicaid managed care program as of July 2015.
$3.0 Billion Medicaid expenditure in fiscal year 2015. Expenditures do not include administrative cost and accounting adjustments.
Kansas decided not to adopt the Medicaid expansion under the ACA.
$9.9 Millionis the estimated annual NEMT 2013 expense.
458,030is the 2013 estimated annual NEMT trips.
2% of all Medicaid enrollees in 2013 used NEMT.
1%of NEMT is public transit.
Source: Centers for Medicare & Medicaid Services Source: 2014 National NEMT Survey
Source: Kaiser Family Foundation
Source: Kaiser Family Foundation
Source: Kaiser Family Foundation
Source: 2014 National NEMT Survey
8.1%
Kent
ucky
102.
8%87
.5%
69.3
%
50.6
%
34.6
%
20.0
% 30.6
%
60.0
%
44.5
%
26.0
%
12.3
%
15.4
%
6.2%
77.1
%
64.7
%
49.7
%
34.6
%
16.7
% 25.9
%
8.1%
59.9
%
39.8
%
22.3
%
8.2% 14
.4%
5.8%
70.3
%
56.2
%
35.3
%
20.2
% 31.5
%
11.7
%
62.7
%
44.7
%
27.7
%
13.1
%
17.4
%
7.4%
57.4
%
38.8
%
21.9
%
5.0% 12
.0%
5.3%
3.9%
1.8%
-0.4
%-8
.3%
Nev
ada
Col
orad
oA
rkan
sas
New
Mex
ico
Mon
tana
Was
hing
ton
Cal
iforn
iaW
est V
irgin
iaO
rego
nRh
ode
Isla
ndN
ew H
amps
hire
Mar
ylan
dA
rizon
aA
lask
aN
ew Je
rsey
Loui
siana
Nor
th D
akot
aO
hio
Indi
ana
Mas
sach
uset
tsIo
wa
Penn
sylv
ania
Mic
higa
nM
inne
sota
Haw
aii
Illin
ois
New
Yor
kD
.C.
Del
awar
eVe
rmon
tTe
nnes
see
Nor
th C
arol
ina
Idah
oFl
orid
aM
issou
riG
eorg
iaSo
uth
Car
olin
aA
laba
ma
Kan
sas
Texa
sM
ississ
ippi
Virg
inia
Uta
hW
iscon
sinSo
uth
Dak
ota
Okl
ahom
aN
ebra
ska
Wyo
min
g
States that Expanded Medicaid under ACA*
States that Did Not Expand Medicaid under ACA*
120%
100%
-20%
0%
20%
40%
60%
80%
% Change from the Pre-ACA Summer 2013 to the Post-ACA December 2016 Source: Centers for Medicare & Medicaid Services
*Pre-ACA data for Connecticut not available *Pre-ACA data for Maine not available
Monthly Average + 8.1%
KEY STATISTICS
RECENT OR FUTURE CHANGES
CUMULATIVE MEDICAID/CHIP ENROLLMENT CHANGE PRE-ACA AND POST-ACA BY STATE
Medicaid/CHIP Enrollment Medicaid Spending
Federal Medical Assistance
NEMT Expense Classification
NEMT Operating Facts
Managed Care Enrollment
Page 38
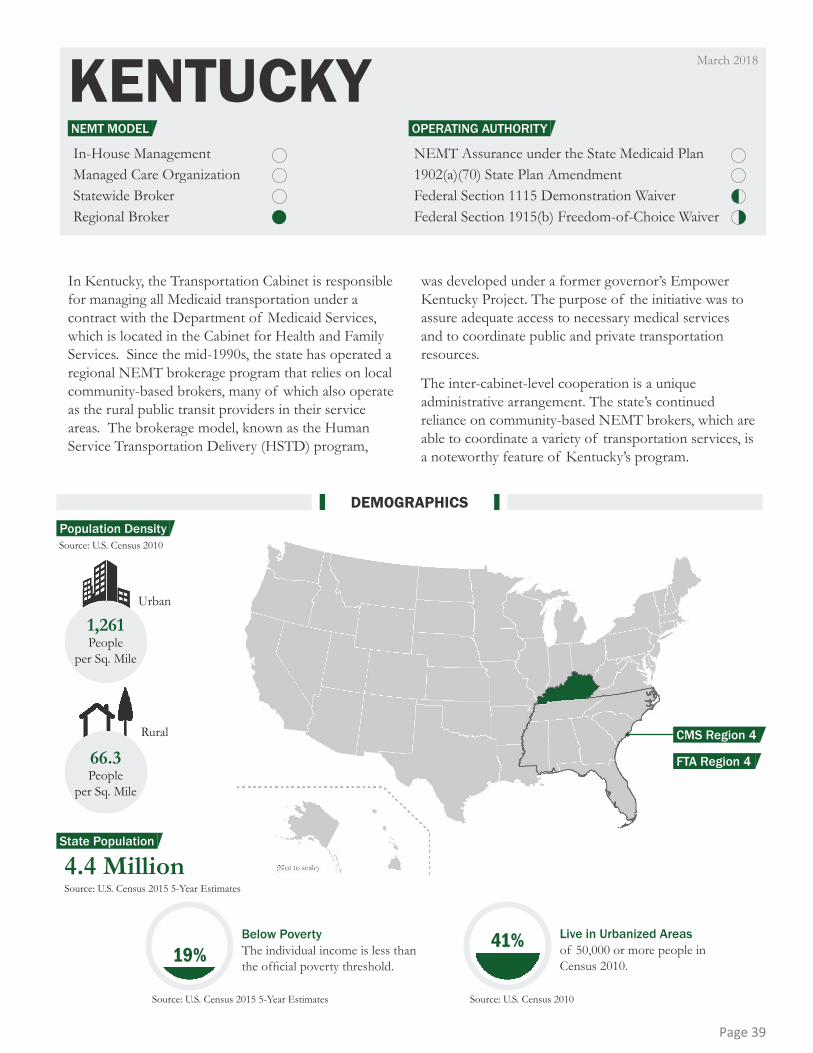
KENTUCKYIn-House ManagementManaged Care OrganizationStatewide BrokerRegional Broker
NEMT Assurance under the State Medicaid Plan1902(a)(70) State Plan AmendmentFederal Section 1115 Demonstration WaiverFederal Section 1915(b) Freedom-of-Choice Waiver
4.4 Million
1,261People
per Sq. Mile
Urban
Rural
66.3People
per Sq. Mile
Source: U.S. Census 2010
Source: U.S. Census 2015 5-Year Estimates
Below PovertyThe individual income is less than the official poverty threshold.
Source: U.S. Census 2015 5-Year Estimates
Live in Urbanized Areasof 50,000 or more people in Census 2010.
Source: U.S. Census 2010
19%41%
In Kentucky, the Transportation Cabinet is responsible for managing all Medicaid transportation under a contract with the Department of Medicaid Services, which is located in the Cabinet for Health and Family Services. Since the mid-1990s, the state has operated a regional NEMT brokerage program that relies on local community-based brokers, many of which also operate as the rural public transit providers in their service areas. The brokerage model, known as the Human Service Transportation Delivery (HSTD) program,
was developed under a former governor’s Empower Kentucky Project. The purpose of the initiative was to assure adequate access to necessary medical services and to coordinate public and private transportation resources.
The inter-cabinet-level cooperation is a unique administrative arrangement. The state’s continued reliance on community-based NEMT brokers, which are able to coordinate a variety of transportation services, is a noteworthy feature of Kentucky’s program.
March 2018
DEMOGRAPHICS
OPERATING AUTHORITYNEMT MODEL
Population Density
State Population
FTA Region 4
CMS Region 4
Page 39

Administrative ExpenseMedical ExpenseMixed
606,805
1,230,475
0
200,000
400,000
600,000
800,000
1,000,000
1,200,000
1,400,000
Pre-ACA(July–Sept. 2013)
Post-ACA(Dec. 2016)
Medicaid approved the KY HEALTH Section 1115 Demonstration, effective January 2018 and expiring September 2023. There are two waivers of NEMT in the KY HEALTH demonstration. One is a waiver of NEMT with respect to methadone treatment. Separately,
Kentucky is not obligated to provide NEMT for beneficiaries enrolled under the Medicaid expansion provisions of the Affordable Care Act, with a few exceptions for the medically frail, etc.
NEMT expense is classified as:
70.5% Federal Medical Assistance Percentage in fiscal year 2017.
91.0% of all Medicaid enrollees are enrolled in any Medicaid managed care program as of July 2015.
$9.5 Billion Medicaid expenditure in fiscal year 2015. Expenditures do not include administrative cost and accounting adjustments.
Kentucky decided to adopt the Medicaid expansion under the ACA.
$65 Millionis the estimated annual NEMT 2013 expense.
3,264,495is the 2013 estimated annual NEMT trips.
3% of all Medicaid enrollees in 2013 used NEMT.
3% of NEMT is public transit.
Source: Centers for Medicare & Medicaid Services Source: 2014 National NEMT Survey
Source: Kaiser Family Foundation
Source: Kaiser Family Foundation
Source: Kaiser Family Foundation
Source: 2014 National NEMT Survey
102.8%
Kent
ucky
87.5
%
69.3
%
50.6
%
34.6
%
20.0
% 30.6
%
8.1%
60.0
%
44.5
%
26.0
%
12.3
%
15.4
%
6.2%
77.1
%
64.7
%
49.7
%
34.6
%
16.7
% 25.9
%
8.1%
59.9
%
39.8
%
22.3
%
8.2% 14
.4%
5.8%
70.3
%
56.2
%
35.3
%
20.2
% 31.5
%
11.7
%
62.7
%
44.7
%
27.7
%
13.1
%
17.4
%
7.4%
57.4
%
38.8
%
21.9
%
5.0% 12
.0%
5.3%
3.9%
1.8%
-0.4
%-8
.3%
Nev
ada
Col
orad
oA
rkan
sas
New
Mex
ico
Mon
tana
Was
hing
ton
Cal
iforn
iaW
est V
irgin
iaO
rego
nRh
ode
Isla
ndN
ew H
amps
hire
Mar
ylan
dA
rizon
aA
lask
aN
ew Je
rsey
Loui
siana
Nor
th D
akot
aO
hio
Indi
ana
Mas
sach
uset
tsIo
wa
Penn
sylv
ania
Mic
higa
nM
inne
sota
Haw
aii
Illin
ois
New
Yor
kD
.C.
Del
awar
eVe
rmon
tTe
nnes
see
Nor
th C
arol
ina
Idah
oFl
orid
aM
issou
riG
eorg
iaSo
uth
Car
olin
aA
laba
ma
Kan
sas
Texa
sM
ississ
ippi
Virg
inia
Uta
hW
iscon
sinSo
uth
Dak
ota
Okl
ahom
aN
ebra
ska
Wyo
min
g
States that Expanded Medicaid under ACA*
States that Did Not Expand Medicaid under ACA*
120%
100%
-20%
0%
20%
40%
60%
80%
% Change from the Pre-ACA Summer 2013 to the Post-ACA December 2016 Source: Centers for Medicare & Medicaid Services
*Pre-ACA data for Connecticut not available *Pre-ACA data for Maine not available
Monthly Average + 102.8%
KEY STATISTICS
RECENT OR FUTURE CHANGES
CUMULATIVE MEDICAID/CHIP ENROLLMENT CHANGE PRE-ACA AND POST-ACA BY STATE
Medicaid/CHIP Enrollment Medicaid Spending
Federal Medical Assistance
NEMT Expense Classification
NEMT Operating Facts
Managed Care Enrollment
Page 40

LOUISIANAIn-House ManagementManaged Care OrganizationStatewide BrokerRegional Broker
NEMT Assurance under the State Medicaid Plan1902(a)(70) State Plan AmendmentFederal Section 1115 Demonstration WaiverFederal Section 1915(b) Freedom-of-Choice Waiver
4.6 Million
1,413People
per Sq. Mile
Urban
Rural
42.1People
per Sq. Mile
State Population
DEMOGRAPHICS
Source: U.S. Census 2015 5-Year Estimates
Below PovertyThe individual income is less than the official poverty threshold.
Source: U.S. Census 2015 5-Year Estimates
Live in Urbanized Areasof 50,000 or more people in Census 2010.
Source: U.S. Census 2010
20%61%
Medicaid in Louisiana is managed by the Department of Health and Hospitals and is in the midst of a transition from a traditional in-house management program to a coordinated care model known as Bayou Health. Louisiana now operates two distinct NEMT programs: managed care carved-in and administrative contractor.
Managed Care carved-in: Health plans in the Bayou Health network are responsible for providing NEMT services
to their members and each contracts to a broker.
Administrative Contractor: A separate administrative contractor is responsible for handling non-emergency, non-ambulance trips for the rest of the state’s Medicaid population. That population includes Medicaid recipients remaining in the state’s fee-for-service program.
March 2018
Source: U.S. Census 2010
OPERATING AUTHORITYNEMT MODEL
Population Density
FTA Region 6
CMS Region 6
Page 41

Administrative ExpenseMedical ExpenseMixed
1,019,787
1,415,385
0200,000400,000600,000800,000
1,000,0001,200,0001,400,0001,600,000
Pre-ACA(July–Sept. 2013)
Post-ACA(Dec. 2016)
NEMT expense is classified as:
62.3% Federal Medical Assistance Percentage in fiscal year 2017.
71.0% of all Medicaid enrollees are enrolled in any Medicaid managed care program as of July 2015.
$8.1 Billion Medicaid expenditure in fiscal year 2015. Expenditures do not include administrative cost and accounting adjustments.
Louisiana decided to adopt the Medicaid expansion under the ACA.
$21Millionis the estimated annual NEMT 2013 expense.
% Not Provided of all Medicaid enrollees in 2013 used NEMT.
% Not Providedof NEMT is public transit.
No program changes were reported.
Source: Centers for Medicare & Medicaid Services Source: 2014 National NEMT Survey
Source: Kaiser Family Foundation
Source: Kaiser Family Foundation
Source: Kaiser Family Foundation
Source: 2014 National NEMT Survey
745,879is the 2013 estimated annual NEMT trips.
38.8%
Kent
ucky
102.
8%87
.5%
69.3
%
50.6
%
34.6
%
20.0
% 30.6
%
8.1%
60.0
%
44.5
%
26.0
%
12.3
%
15.4
%
6.2%
77.1
%
64.7
%
49.7
%
34.6
%
16.7
% 25.9
%
8.1%
59.9
%
39.8
%
22.3
%
8.2% 14
.4%
5.8%
70.3
%
56.2
%
35.3
%
20.2
% 31.5
%
11.7
%
62.7
%
44.7
%
27.7
%
13.1
%
17.4
%
7.4%
57.4
%
21.9
%
5.0% 12
.0%
5.3%
3.9%
1.8%
-0.4
%-8
.3%
Nev
ada
Col
orad
oA
rkan
sas
New
Mex
ico
Mon
tana
Was
hing
ton
Cal
iforn
iaW
est V
irgin
iaO
rego
nRh
ode
Isla
ndN
ew H
amps
hire
Mar
ylan
dA
rizon
aA
lask
aN
ew Je
rsey
Loui
siana
Nor
th D
akot
aO
hio
Indi
ana
Mas
sach
uset
tsIo
wa
Penn
sylv
ania
Mic
higa
nM
inne
sota
Haw
aii
Illin
ois
New
Yor
kD
.C.
Del
awar
eVe
rmon
tTe
nnes
see
Nor
th C
arol
ina
Idah
oFl
orid
aM
issou
riG
eorg
iaSo
uth
Car
olin
aA
laba
ma
Kan
sas
Texa
sM
ississ
ippi
Virg
inia
Uta
hW
iscon
sinSo
uth
Dak
ota
Okl
ahom
aN
ebra
ska
Wyo
min
g
States that Expanded Medicaid under ACA*
States that Did Not Expand Medicaid under ACA*
120%
100%
-20%
0%
20%
40%
60%
80%
% Change from the Pre-ACA Summer 2013 to the Post-ACA December 2016 Source: Centers for Medicare & Medicaid Services
*Pre-ACA data for Connecticut not available *Pre-ACA data for Maine not available
Monthly Average + 38.8%
KEY STATISTICS
RECENT OR FUTURE CHANGES
CUMULATIVE MEDICAID/CHIP ENROLLMENT CHANGE PRE-ACA AND POST-ACA BY STATE
Medicaid/CHIP Enrollment Medicaid Spending
Federal Medical Assistance
NEMT Expense Classification
NEMT Operating Facts
Managed Care Enrollment
Page 42
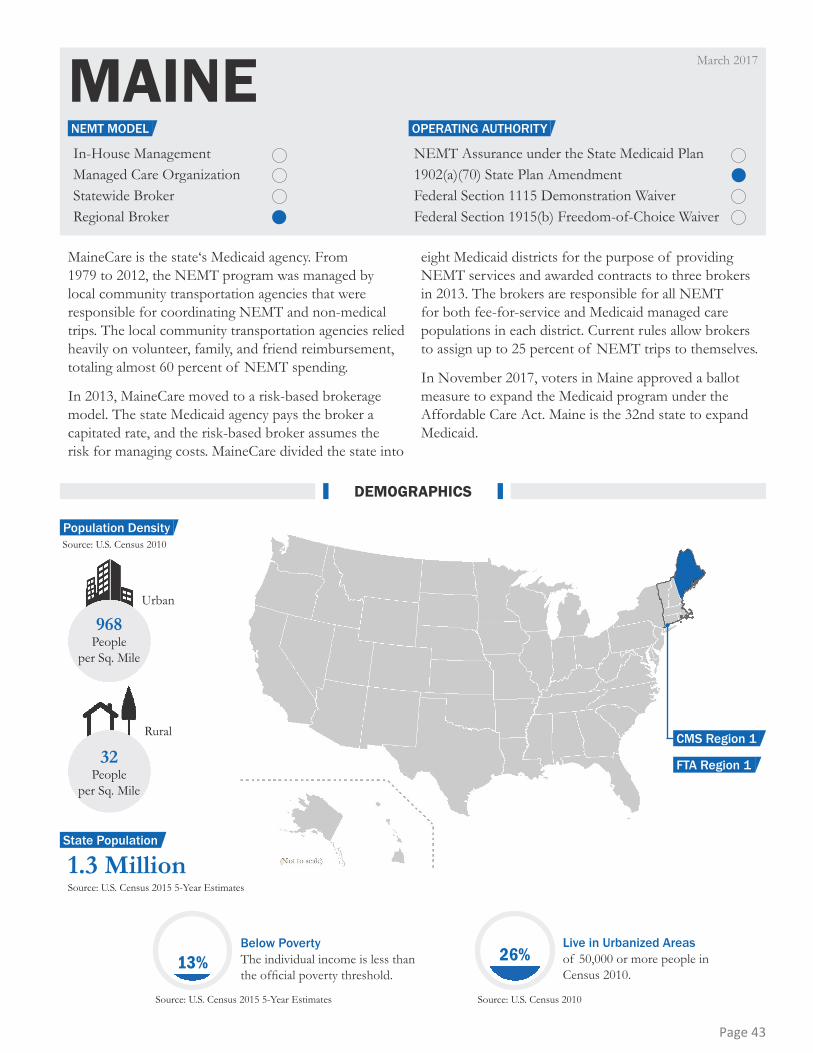
MAINEIn-House ManagementManaged Care OrganizationStatewide BrokerRegional Broker
NEMT Assurance under the State Medicaid Plan1902(a)(70) State Plan AmendmentFederal Section 1115 Demonstration WaiverFederal Section 1915(b) Freedom-of-Choice Waiver
1.3 Million
968People
per Sq. Mile
Urban
Rural
32People
per Sq. Mile
Source: U.S. Census 2015 5-Year Estimates
Below PovertyThe individual income is less than the official poverty threshold.
Source: U.S. Census 2015 5-Year Estimates
Live in Urbanized Areasof 50,000 or more people in Census 2010.
Source: U.S. Census 2010
13% 26%
MaineCare is the state‘s Medicaid agency. From 1979 to 2012, the NEMT program was managed by local community transportation agencies that were responsible for coordinating NEMT and non-medical trips. The local community transportation agencies relied heavily on volunteer, family, and friend reimbursement, totaling almost 60 percent of NEMT spending.
In 2013, MaineCare moved to a risk-based brokerage model. The state Medicaid agency pays the broker a capitated rate, and the risk-based broker assumes the risk for managing costs. MaineCare divided the state into
eight Medicaid districts for the purpose of providing NEMT services and awarded contracts to three brokers in 2013. The brokers are responsible for all NEMT for both fee-for-service and Medicaid managed care populations in each district. Current rules allow brokers to assign up to 25 percent of NEMT trips to themselves.
In November 2017, voters in Maine approved a ballot measure to expand the Medicaid program under the Affordable Care Act. Maine is the 32nd state to expand Medicaid.
March 2017
DEMOGRAPHICS
OPERATING AUTHORITYNEMT MODEL
Population Density
State Population
FTA Region 1
CMS Region 1
Source: U.S. Census 2010
Page 43
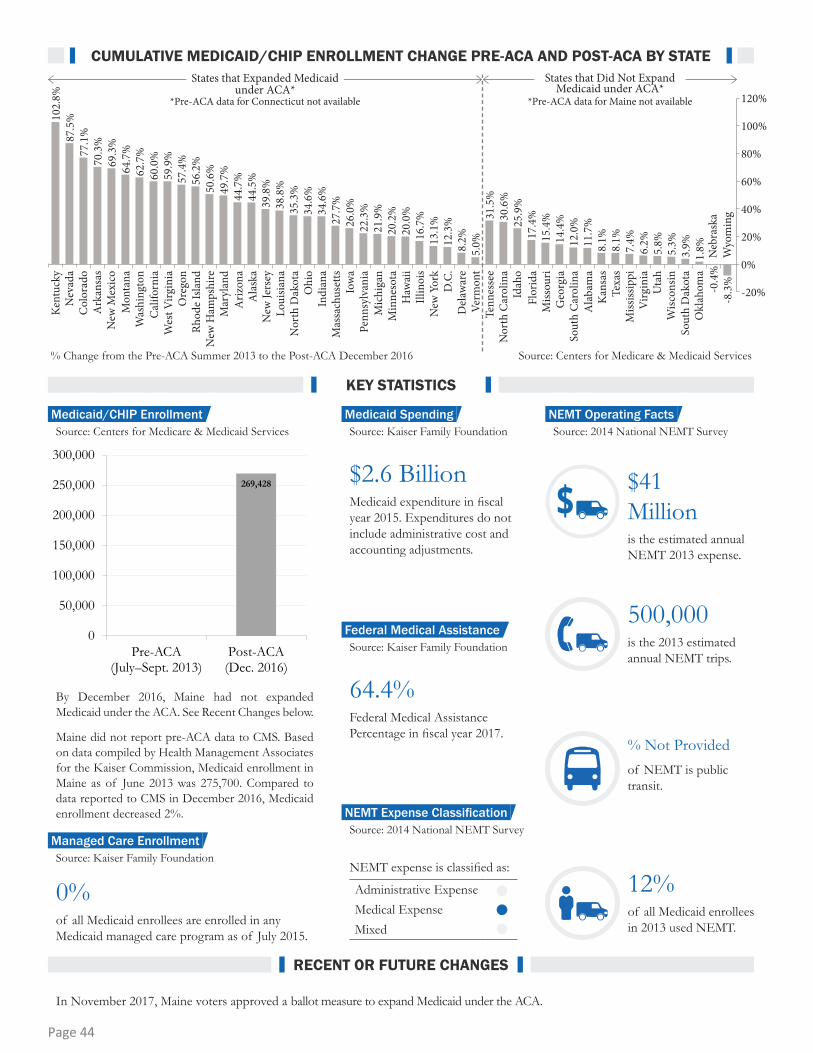
Administrative ExpenseMedical ExpenseMixed
In November 2017, Maine voters approved a ballot measure to expand Medicaid under the ACA.
NEMT expense is classified as:
64.4% Federal Medical Assistance Percentage in fiscal year 2017.
0% of all Medicaid enrollees are enrolled in any Medicaid managed care program as of July 2015.
$2.6 Billion Medicaid expenditure in fiscal year 2015. Expenditures do not include administrative cost and accounting adjustments.
Source: Centers for Medicare & Medicaid Services Source: 2014 National NEMT Survey
Source: Kaiser Family Foundation
Source: Kaiser Family Foundation
Source: Kaiser Family Foundation
Source: 2014 National NEMT Survey
Kent
ucky
102.
8%87
.5%
69.3
%
50.6
%
34.6
%
20.0
% 30.6
%
8.1%
60.0
%
44.5
%
26.0
%
12.3
%
15.4
%
6.2%
77.1
%
64.7
%
49.7
%
34.6
%
16.7
% 25.9
%
8.1%
59.9
%
39.8
%
22.3
%
8.2% 14
.4%
5.8%
70.3
%
56.2
%
35.3
%
20.2
% 31.5
%
11.7
%
62.7
%
44.7
%
27.7
%
13.1
%
17.4
%
7.4%
57.4
%
38.8
%
21.9
%
5.0% 12
.0%
5.3%
3.9%
1.8%
-0.4
%-8
.3%
Nev
ada
Col
orad
oA
rkan
sas
New
Mex
ico
Mon
tana
Was
hing
ton
Cal
iforn
iaW
est V
irgin
iaO
rego
nRh
ode
Isla
ndN
ew H
amps
hire
Mar
ylan
dA
rizon
aA
lask
aN
ew Je
rsey
Loui
siana
Nor
th D
akot
aO
hio
Indi
ana
Mas
sach
uset
tsIo
wa
Penn
sylv
ania
Mic
higa
nM
inne
sota
Haw
aii
Illin
ois
New
Yor
kD
.C.
Del
awar
eVe
rmon
tTe
nnes
see
Nor
th C
arol
ina
Idah
oFl
orid
aM
issou
riG
eorg
iaSo
uth
Car
olin
aA
laba
ma
Kan
sas
Texa
sM
ississ
ippi
Virg
inia
Uta
hW
iscon
sinSo
uth
Dak
ota
Okl
ahom
aN
ebra
ska
Wyo
min
g
States that Expanded Medicaid under ACA*
States that Did Not Expand Medicaid under ACA*
120%
100%
-20%
0%
20%
40%
60%
80%
% Change from the Pre-ACA Summer 2013 to the Post-ACA December 2016 Source: Centers for Medicare & Medicaid Services
*Pre-ACA data for Connecticut not available *Pre-ACA data for Maine not available
$41 Millionis the estimated annual NEMT 2013 expense.
500,000is the 2013 estimated annual NEMT trips.
12% of all Medicaid enrollees in 2013 used NEMT.
% Not Providedof NEMT is public transit.
By December 2016, Maine had not expanded Medicaid under the ACA. See Recent Changes below.
Maine did not report pre-ACA data to CMS. Based on data compiled by Health Management Associates for the Kaiser Commission, Medicaid enrollment in Maine as of June 2013 was 275,700. Compared to data reported to CMS in December 2016, Medicaid enrollment decreased 2%.
269,428
0
50,000
100,000
150,000
200,000
250,000
300,000
Pre-ACA(July–Sept. 2013)
Post-ACA(Dec. 2016)
KEY STATISTICS
RECENT OR FUTURE CHANGES
CUMULATIVE MEDICAID/CHIP ENROLLMENT CHANGE PRE-ACA AND POST-ACA BY STATE
Medicaid/CHIP Enrollment Medicaid Spending
Federal Medical Assistance
NEMT Expense Classification
NEMT Operating Facts
Managed Care Enrollment
Page 44
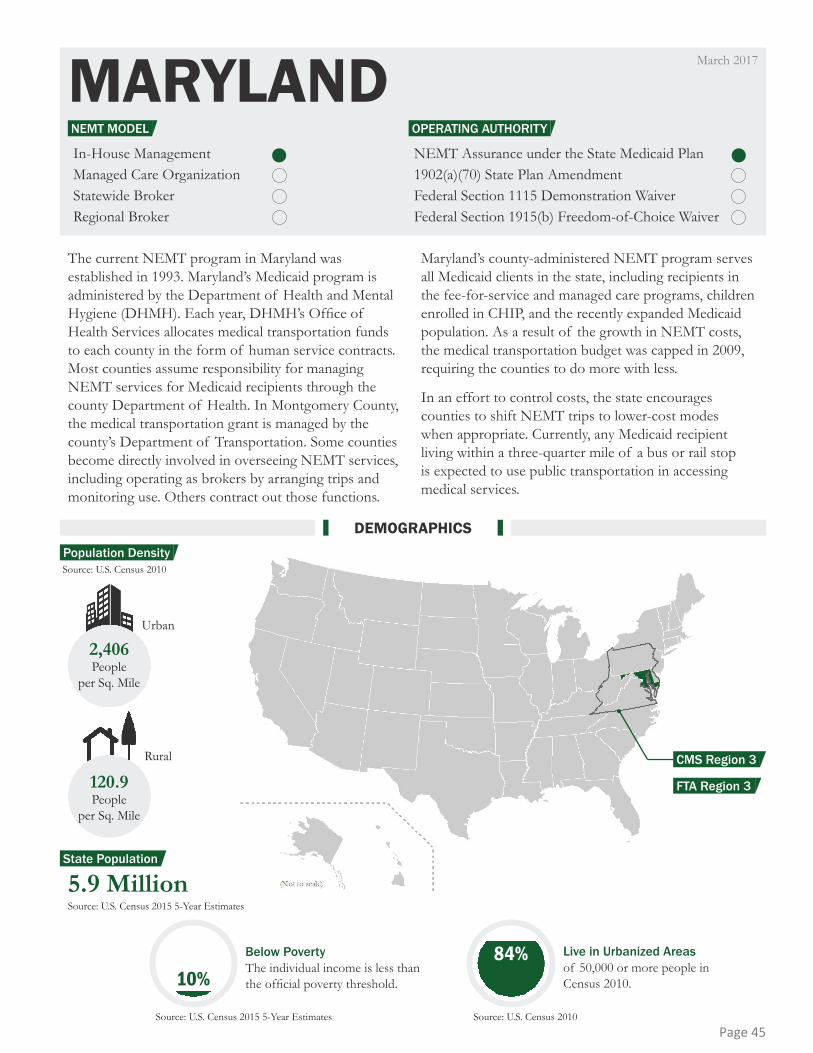
MARYLANDIn-House ManagementManaged Care OrganizationStatewide BrokerRegional Broker
NEMT Assurance under the State Medicaid Plan1902(a)(70) State Plan AmendmentFederal Section 1115 Demonstration WaiverFederal Section 1915(b) Freedom-of-Choice Waiver
5.9 Million
2,406People
per Sq. Mile
Urban
Rural
120.9People
per Sq. Mile
Source: U.S. Census 2010
Source: U.S. Census 2015 5-Year Estimates
Below PovertyThe individual income is less than the official poverty threshold.
Source: U.S. Census 2015 5-Year Estimates
Live in Urbanized Areasof 50,000 or more people in Census 2010.
Source: U.S. Census 2010
10%84%
The current NEMT program in Maryland was established in 1993. Maryland’s Medicaid program is administered by the Department of Health and Mental Hygiene (DHMH). Each year, DHMH’s Office of Health Services allocates medical transportation funds to each county in the form of human service contracts. Most counties assume responsibility for managing NEMT services for Medicaid recipients through the county Department of Health. In Montgomery County, the medical transportation grant is managed by the county’s Department of Transportation. Some counties become directly involved in overseeing NEMT services, including operating as brokers by arranging trips and monitoring use. Others contract out those functions.
Maryland’s county-administered NEMT program serves all Medicaid clients in the state, including recipients in the fee-for-service and managed care programs, children enrolled in CHIP, and the recently expanded Medicaid population. As a result of the growth in NEMT costs, the medical transportation budget was capped in 2009, requiring the counties to do more with less.
In an effort to control costs, the state encourages counties to shift NEMT trips to lower-cost modes when appropriate. Currently, any Medicaid recipient living within a three-quarter mile of a bus or rail stop is expected to use public transportation in accessing medical services.
March 2017
DEMOGRAPHICS
OPERATING AUTHORITYNEMT MODEL
Population Density
State Population
FTA Region 3
CMS Region 3
Page 45
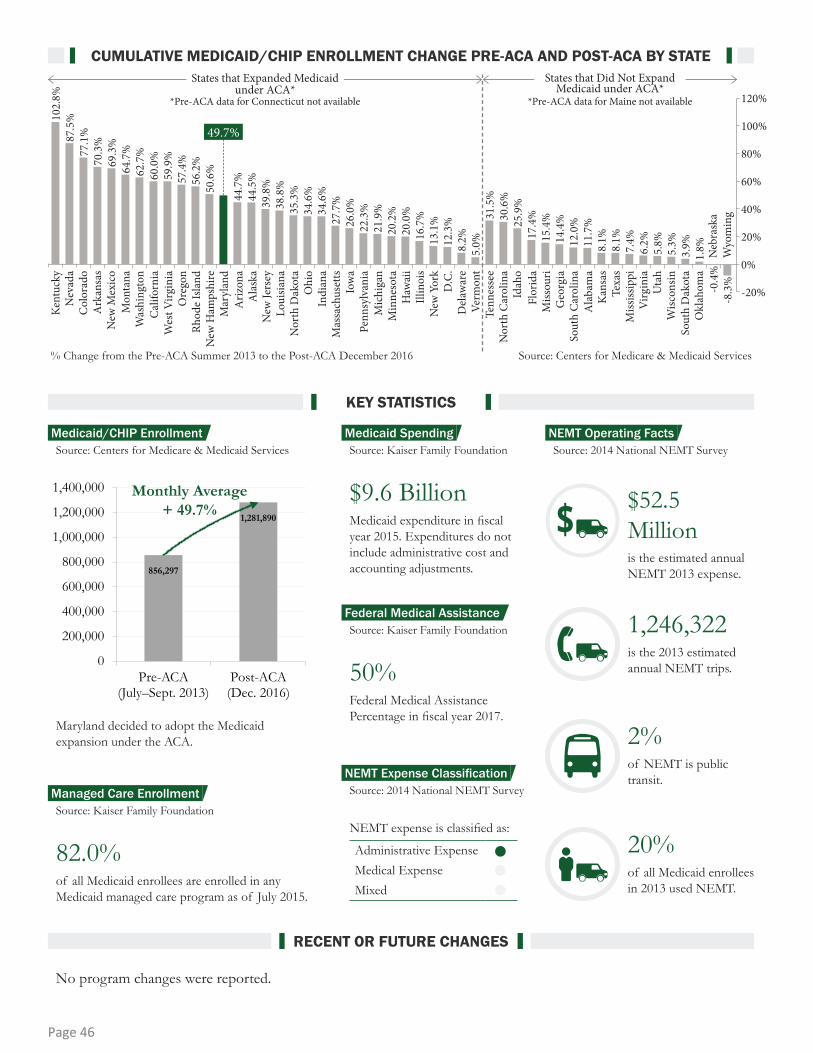
Administrative ExpenseMedical ExpenseMixed
856,297
1,281,890
0
200,000
400,000
600,000
800,000
1,000,000
1,200,000
1,400,000
Pre-ACA(July–Sept. 2013)
Post-ACA(Dec. 2016)
No program changes were reported.
NEMT expense is classified as:
50% Federal Medical Assistance Percentage in fiscal year 2017.
82.0% of all Medicaid enrollees are enrolled in any Medicaid managed care program as of July 2015.
$9.6 Billion Medicaid expenditure in fiscal year 2015. Expenditures do not include administrative cost and accounting adjustments.
Maryland decided to adopt the Medicaid expansion under the ACA.
$52.5 Millionis the estimated annual NEMT 2013 expense.
1,246,322is the 2013 estimated annual NEMT trips.
20%of all Medicaid enrollees in 2013 used NEMT.
2%of NEMT is public transit.
Source: Centers for Medicare & Medicaid Services Source: 2014 National NEMT Survey
Source: Kaiser Family Foundation
Source: Kaiser Family Foundation
Source: Kaiser Family Foundation
Source: 2014 National NEMT Survey
49.7%
Kent
ucky
102.
8%87
.5%
69.3
%
50.6
%
34.6
%
20.0
% 30.6
%
8.1%
60.0
%
44.5
%
26.0
%
12.3
%
15.4
%
6.2%
77.1
%
64.7
%
34.6
%
16.7
% 25.9
%
8.1%
59.9
%
39.8
%
22.3
%
8.2% 14
.4%
5.8%
70.3
%
56.2
%
35.3
%
20.2
% 31.5
%
11.7
%
62.7
%
44.7
%
27.7
%
13.1
%
17.4
%
7.4%
57.4
%
38.8
%
21.9
%
5.0% 12
.0%
5.3%
3.9%
1.8%
-0.4
%-8
.3%
Nev
ada
Col
orad
oA
rkan
sas
New
Mex
ico
Mon
tana
Was
hing
ton
Cal
iforn
iaW
est V
irgin
iaO
rego
nRh
ode
Isla
ndN
ew H
amps
hire
Mar
ylan
dA
rizon
aA
lask
aN
ew Je
rsey
Loui
siana
Nor
th D
akot
aO
hio
Indi
ana
Mas
sach
uset
tsIo
wa
Penn
sylv
ania
Mic
higa
nM
inne
sota
Haw
aii
Illin
ois
New
Yor
kD
.C.
Del
awar
eVe
rmon
tTe
nnes
see
Nor
th C
arol
ina
Idah
oFl
orid
aM
issou
riG
eorg
iaSo
uth
Car
olin
aA
laba
ma
Kan
sas
Texa
sM
ississ
ippi
Virg
inia
Uta
hW
iscon
sinSo
uth
Dak
ota
Okl
ahom
aN
ebra
ska
Wyo
min
g
States that Expanded Medicaid under ACA*
States that Did Not Expand Medicaid under ACA*
120%
100%
-20%
0%
20%
40%
60%
80%
% Change from the Pre-ACA Summer 2013 to the Post-ACA December 2016 Source: Centers for Medicare & Medicaid Services
*Pre-ACA data for Connecticut not available *Pre-ACA data for Maine not available
Monthly Average + 49.7%
KEY STATISTICS
RECENT OR FUTURE CHANGES
CUMULATIVE MEDICAID/CHIP ENROLLMENT CHANGE PRE-ACA AND POST-ACA BY STATE
Medicaid/CHIP Enrollment Medicaid Spending
Federal Medical Assistance
NEMT Expense Classification
NEMT Operating Facts
Managed Care Enrollment
Page 46
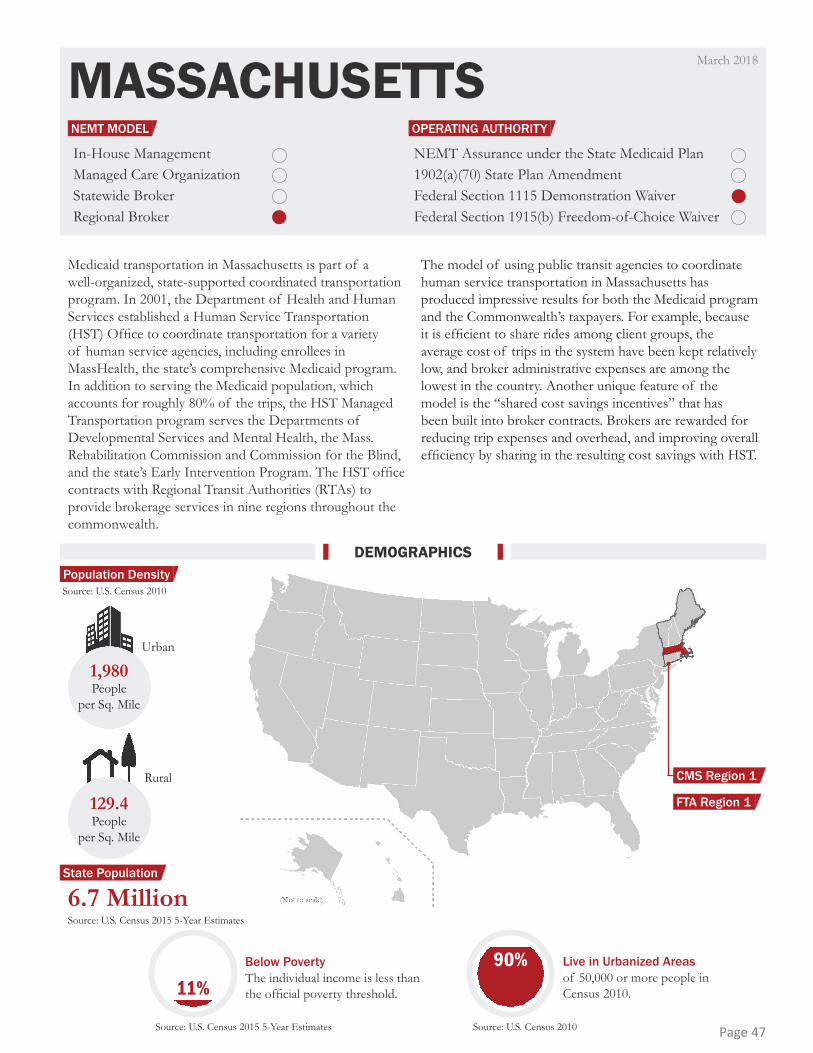
MASSACHUSETTSIn-House ManagementManaged Care OrganizationStatewide BrokerRegional Broker
NEMT Assurance under the State Medicaid Plan1902(a)(70) State Plan AmendmentFederal Section 1115 Demonstration WaiverFederal Section 1915(b) Freedom-of-Choice Waiver
1,980People
per Sq. Mile
Urban
Rural
129.4People
per Sq. Mile
6.7 Million
Source: U.S. Census 2010
Source: U.S. Census 2015 5-Year Estimates
Below PovertyThe individual income is less than the official poverty threshold.
Source: U.S. Census 2015 5-Year Estimates
Live in Urbanized Areasof 50,000 or more people in Census 2010.
Source: U.S. Census 2010
11%90%
Medicaid transportation in Massachusetts is part of a well-organized, state-supported coordinated transportation program. In 2001, the Department of Health and Human Services established a Human Service Transportation (HST) Office to coordinate transportation for a variety of human service agencies, including enrollees in MassHealth, the state’s comprehensive Medicaid program. In addition to serving the Medicaid population, which accounts for roughly 80% of the trips, the HST Managed Transportation program serves the Departments of Developmental Services and Mental Health, the Mass. Rehabilitation Commission and Commission for the Blind, and the state’s Early Intervention Program. The HST office contracts with Regional Transit Authorities (RTAs) to provide brokerage services in nine regions throughout the commonwealth.
The model of using public transit agencies to coordinate human service transportation in Massachusetts has produced impressive results for both the Medicaid program and the Commonwealth’s taxpayers. For example, because it is efficient to share rides among client groups, the average cost of trips in the system have been kept relatively low, and broker administrative expenses are among the lowest in the country. Another unique feature of the model is the “shared cost savings incentives” that has been built into broker contracts. Brokers are rewarded for reducing trip expenses and overhead, and improving overall efficiency by sharing in the resulting cost savings with HST.
March 2018
DEMOGRAPHICS
OPERATING AUTHORITYNEMT MODEL
Population Density
FTA Region 1
CMS Region 1
State Population
Page 47
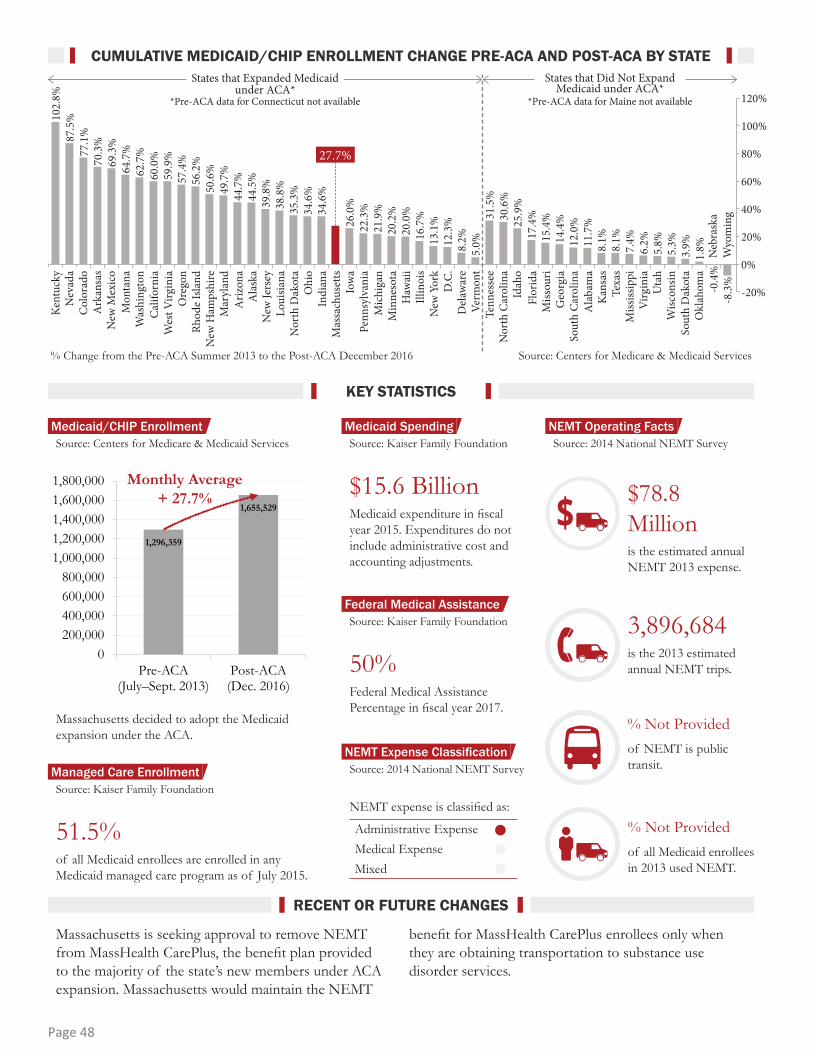
Administrative ExpenseMedical ExpenseMixed
Massachusetts is seeking approval to remove NEMT from MassHealth CarePlus, the benefit plan provided to the majority of the state’s new members under ACA expansion. Massachusetts would maintain the NEMT
benefit for MassHealth CarePlus enrollees only when they are obtaining transportation to substance use disorder services.
NEMT expense is classified as:
50% Federal Medical Assistance Percentage in fiscal year 2017.
51.5% of all Medicaid enrollees are enrolled in any Medicaid managed care program as of July 2015.
$15.6 Billion Medicaid expenditure in fiscal year 2015. Expenditures do not include administrative cost and accounting adjustments.
Massachusetts decided to adopt the Medicaid expansion under the ACA.
$78.8 Millionis the estimated annual NEMT 2013 expense.
3,896,684is the 2013 estimated annual NEMT trips.
% Not Provided of all Medicaid enrollees in 2013 used NEMT.
% Not Providedof NEMT is public transit.
Source: Centers for Medicare & Medicaid Services Source: 2014 National NEMT Survey
Source: Kaiser Family Foundation
Source: Kaiser Family Foundation
Source: Kaiser Family Foundation
Source: 2014 National NEMT Survey
27.7%
Kent
ucky
102.
8%87
.5%
69.3
%
50.6
%
34.6
%
20.0
% 30.6
%
8.1%
60.0
%
44.5
%
26.0
%
12.3
%
15.4
%
6.2%
77.1
%
64.7
%
49.7
%
34.6
%
16.7
% 25.9
%
8.1%
59.9
%
39.8
%
22.3
%
8.2% 14
.4%
5.8%
70.3
%
56.2
%
35.3
%
20.2
% 31.5
%
11.7
%
62.7
%
44.7
%
13.1
%
17.4
%
7.4%
57.4
%
38.8
%
21.9
%
5.0% 12
.0%
5.3%
3.9%
1.8%
-0.4
%-8
.3%
Nev
ada
Col
orad
oA
rkan
sas
New
Mex
ico
Mon
tana
Was
hing
ton
Cal
iforn
iaW
est V
irgin
iaO
rego
nRh
ode
Isla
ndN
ew H
amps
hire
Mar
ylan
dA
rizon
aA
lask
aN
ew Je
rsey
Loui
siana
Nor
th D
akot
aO
hio
Indi
ana
Mas
sach
uset
tsIo
wa
Penn
sylv
ania
Mic
higa
nM
inne
sota
Haw
aii
Illin
ois
New
Yor
kD
.C.
Del
awar
eVe
rmon
tTe
nnes
see
Nor
th C
arol
ina
Idah
oFl
orid
aM
issou
riG
eorg
iaSo
uth
Car
olin
aA
laba
ma
Kan
sas
Texa
sM
ississ
ippi
Virg
inia
Uta
hW
iscon
sinSo
uth
Dak
ota
Okl
ahom
aN
ebra
ska
Wyo
min
g
States that Expanded Medicaid under ACA*
States that Did Not Expand Medicaid under ACA*
120%
100%
-20%
0%
20%
40%
60%
80%
% Change from the Pre-ACA Summer 2013 to the Post-ACA December 2016 Source: Centers for Medicare & Medicaid Services
*Pre-ACA data for Connecticut not available *Pre-ACA data for Maine not available
1,296,359
1,655,529
0200,000400,000600,000800,000
1,000,0001,200,0001,400,0001,600,0001,800,000
Pre-ACA(July–Sept. 2013)
Post-ACA(Dec. 2016)
Monthly Average + 27.7%
KEY STATISTICS
RECENT OR FUTURE CHANGES
CUMULATIVE MEDICAID/CHIP ENROLLMENT CHANGE PRE-ACA AND POST-ACA BY STATE
Medicaid/CHIP Enrollment Medicaid Spending
Federal Medical Assistance
NEMT Expense Classification
NEMT Operating Facts
Managed Care Enrollment
Page 48
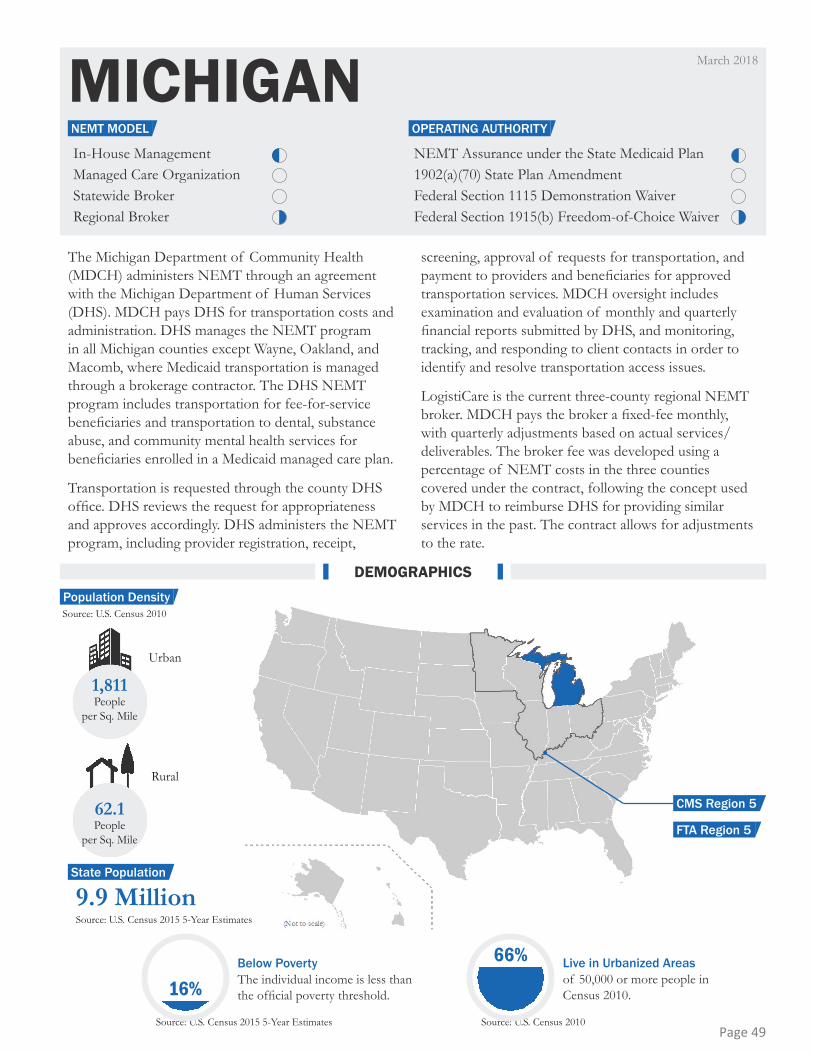
MICHIGANIn-House ManagementManaged Care OrganizationStatewide BrokerRegional Broker
NEMT Assurance under the State Medicaid Plan1902(a)(70) State Plan AmendmentFederal Section 1115 Demonstration WaiverFederal Section 1915(b) Freedom-of-Choice Waiver
9.9 Million
1,811People
per Sq. Mile
Urban
Rural
62.1People
per Sq. Mile
Source: U.S. Census 2010
Source: U.S. Census 2015 5-Year Estimates
Below PovertyThe individual income is less than the official poverty threshold.
Source: U.S. Census 2015 5-Year Estimates
Live in Urbanized Areasof 50,000 or more people in Census 2010.
Source: U.S. Census 2010
16%
66%
The Michigan Department of Community Health (MDCH) administers NEMT through an agreement with the Michigan Department of Human Services (DHS). MDCH pays DHS for transportation costs and administration. DHS manages the NEMT program in all Michigan counties except Wayne, Oakland, and Macomb, where Medicaid transportation is managed through a brokerage contractor. The DHS NEMT program includes transportation for fee-for-service beneficiaries and transportation to dental, substance abuse, and community mental health services for beneficiaries enrolled in a Medicaid managed care plan.
Transportation is requested through the county DHS office. DHS reviews the request for appropriateness and approves accordingly. DHS administers the NEMT program, including provider registration, receipt,
screening, approval of requests for transportation, and payment to providers and beneficiaries for approved transportation services. MDCH oversight includes examination and evaluation of monthly and quarterly financial reports submitted by DHS, and monitoring, tracking, and responding to client contacts in order to identify and resolve transportation access issues.
LogistiCare is the current three-county regional NEMT broker. MDCH pays the broker a fixed-fee monthly, with quarterly adjustments based on actual services/deliverables. The broker fee was developed using a percentage of NEMT costs in the three counties covered under the contract, following the concept used by MDCH to reimburse DHS for providing similar services in the past. The contract allows for adjustments to the rate.
March 2018
DEMOGRAPHICS
OPERATING AUTHORITYNEMT MODEL
Population Density
State Population
FTA Region 5
CMS Region 5
Page 49

Administrative ExpenseMedical ExpenseMixed
1,912,009
2,330,154
0
500,000
1,000,000
1,500,000
2,000,000
2,500,000
Pre-ACA(July–Sept. 2013)
Post-ACA(Dec. 2016)
In November 2013, a coalition of transportation and human service agencies developed a study to improve mobility management and NEMT coordination within the state. One of the recommendations from the project team was to implement a brokerage model focusing on
finding the most cost-efficient and appropriate ride for each client. The team recommended that the brokerage model be operated by a nonprofit or government entity, such as the Michigan Public Transit Association.
NEMT expense is classified as:
65.2% Federal Medical Assistance Percentage in fiscal year 2017.
77.0% of all Medicaid enrollees are enrolled in any Medicaid managed care program as of July 2015.
$16.0 Billion Medicaid expenditure in fiscal year 2015. Expenditures do not include administrative cost and accounting adjustments.
Michigan decided to adopt the Medicaid expansion under the ACA.
$14.8 Millionis the estimated annual NEMT 2013 expense.
711,000is the 2013 estimated annual NEMT trips.
3.8% of all Medicaid enrollees in 2013 used NEMT.
10%of NEMT is public transit.
Source: Centers for Medicare & Medicaid Services Source: 2014 National NEMT Survey
Source: Kaiser Family Foundation
Source: Kaiser Family Foundation
Source: Kaiser Family Foundation
Source: 2014 National NEMT Survey
21.9%
Kent
ucky
102.
8%87
.5%
69.3
%
50.6
%
34.6
%
20.0
% 30.6
%
8.1%
60.0
%
44.5
%
26.0
%
12.3
%
15.4
%
6.2%
77.1
%
64.7
%
49.7
%
34.6
%
16.7
% 25.9
%
8.1%
59.9
%
39.8
%
22.3
%
8.2% 14
.4%
5.8%
70.3
%
56.2
%
35.3
%
20.2
% 31.5
%
11.7
%
62.7
%
44.7
%
27.7
%
13.1
%
17.4
%
7.4%
57.4
%
38.8
%
5.0% 12
.0%
5.3%
3.9%
1.8%
-0.4
%-8
.3%
Nev
ada
Col
orad
oA
rkan
sas
New
Mex
ico
Mon
tana
Was
hing
ton
Cal
iforn
iaW
est V
irgin
iaO
rego
nRh
ode
Isla
ndN
ew H
amps
hire
Mar
ylan
dA
rizon
aA
lask
aN
ew Je
rsey
Loui
siana
Nor
th D
akot
aO
hio
Indi
ana
Mas
sach
uset
tsIo
wa
Penn
sylv
ania
Mic
higa
nM
inne
sota
Haw
aii
Illin
ois
New
Yor
kD
.C.
Del
awar
eVe
rmon
tTe
nnes
see
Nor
th C
arol
ina
Idah
oFl
orid
aM
issou
riG
eorg
iaSo
uth
Car
olin
aA
laba
ma
Kan
sas
Texa
sM
ississ
ippi
Virg
inia
Uta
hW
iscon
sinSo
uth
Dak
ota
Okl
ahom
aN
ebra
ska
Wyo
min
g
States that Expanded Medicaid under ACA*
States that Did Not Expand Medicaid under ACA*
120%
100%
-20%
0%
20%
40%
60%
80%
% Change from the Pre-ACA Summer 2013 to the Post-ACA December 2016 Source: Centers for Medicare & Medicaid Services
*Pre-ACA data for Connecticut not available *Pre-ACA data for Maine not available
Monthly Average + 21.9%
KEY STATISTICS
RECENT OR FUTURE CHANGES
CUMULATIVE MEDICAID/CHIP ENROLLMENT CHANGE PRE-ACA AND POST-ACA BY STATE
Medicaid/CHIP Enrollment Medicaid Spending
Federal Medical Assistance
NEMT Expense Classification
NEMT Operating Facts
Managed Care Enrollment
Page 50
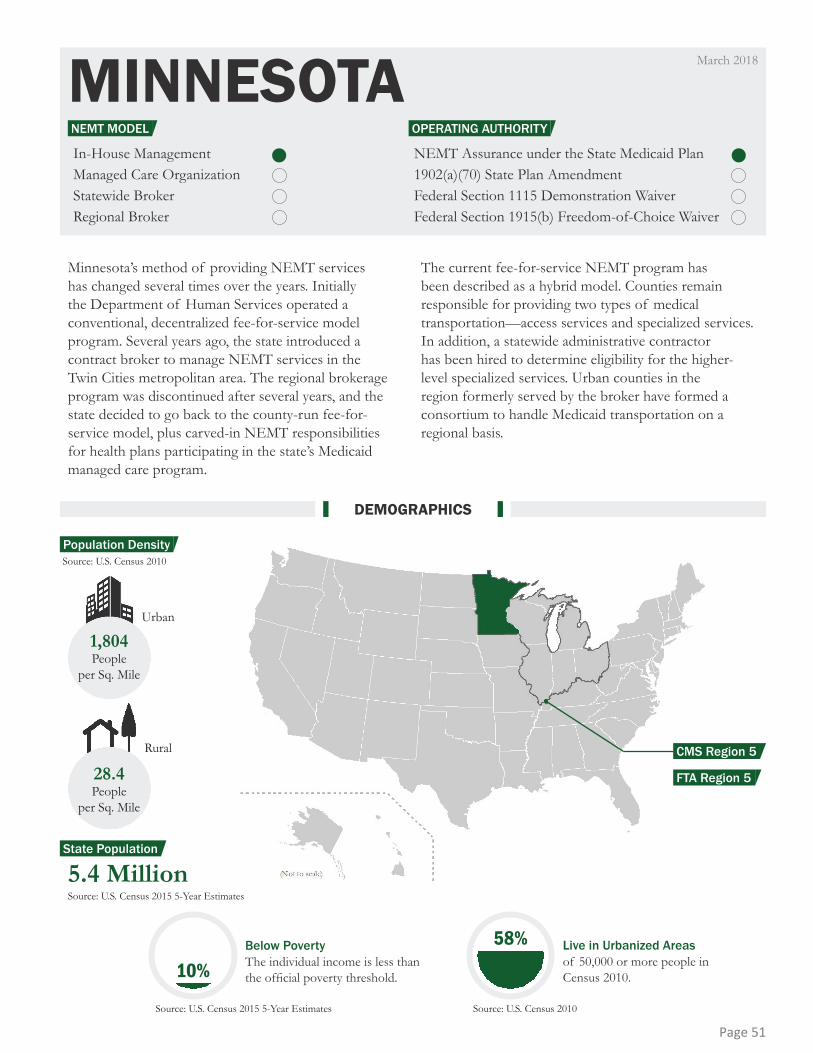
MINNESOTAIn-House ManagementManaged Care OrganizationStatewide BrokerRegional Broker
NEMT Assurance under the State Medicaid Plan1902(a)(70) State Plan AmendmentFederal Section 1115 Demonstration WaiverFederal Section 1915(b) Freedom-of-Choice Waiver
5.4 Million
1,804People
per Sq. Mile
Urban
Rural
28.4People
per Sq. Mile
Source: U.S. Census 2010
Source: U.S. Census 2015 5-Year Estimates
Below PovertyThe individual income is less than the official poverty threshold.
Source: U.S. Census 2015 5-Year Estimates
Live in Urbanized Areasof 50,000 or more people in Census 2010.
Source: U.S. Census 2010
10%58%
Minnesota’s method of providing NEMT services has changed several times over the years. Initially the Department of Human Services operated a conventional, decentralized fee-for-service model program. Several years ago, the state introduced a contract broker to manage NEMT services in the Twin Cities metropolitan area. The regional brokerage program was discontinued after several years, and the state decided to go back to the county-run fee-for-service model, plus carved-in NEMT responsibilities for health plans participating in the state’s Medicaid managed care program.
The current fee-for-service NEMT program has been described as a hybrid model. Counties remain responsible for providing two types of medical transportation—access services and specialized services. In addition, a statewide administrative contractor has been hired to determine eligibility for the higher-level specialized services. Urban counties in the region formerly served by the broker have formed a consortium to handle Medicaid transportation on a regional basis.
March 2018
DEMOGRAPHICS
OPERATING AUTHORITYNEMT MODEL
Population Density
State Population
FTA Region 5
CMS Region 5
Page 51
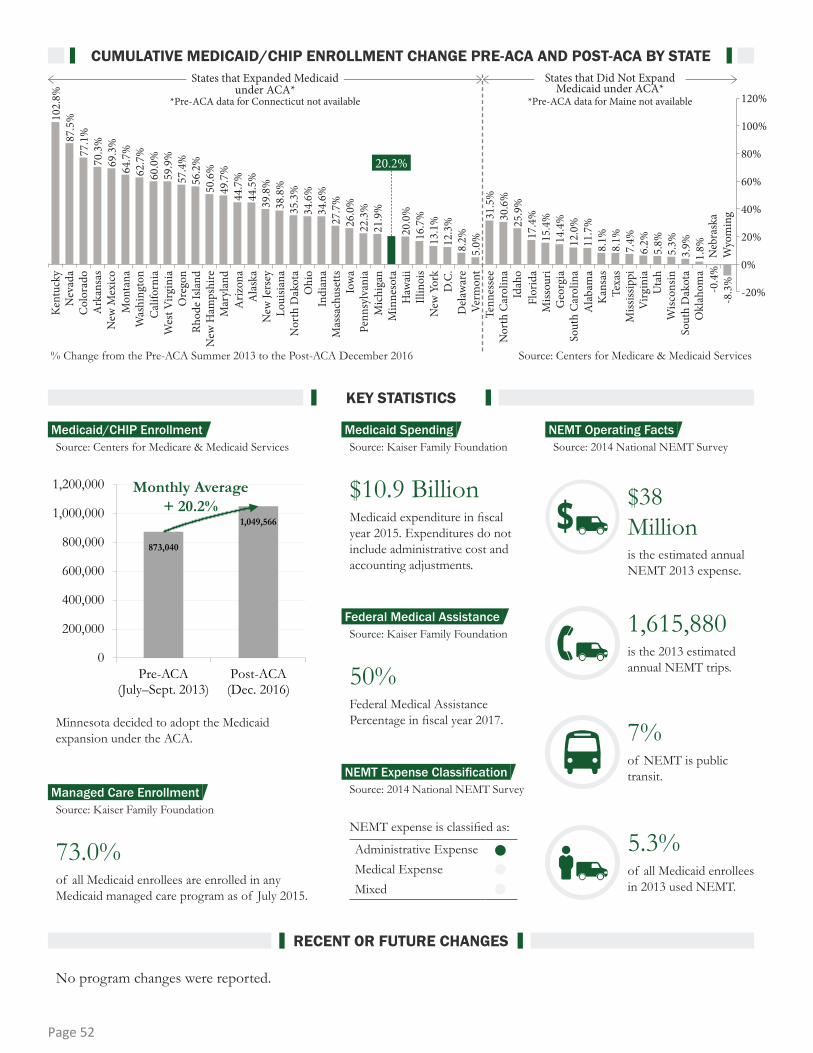
Administrative ExpenseMedical ExpenseMixed
873,040
1,049,566
0
200,000
400,000
600,000
800,000
1,000,000
1,200,000
Pre-ACA(July–Sept. 2013)
Post-ACA(Dec. 2016)
No program changes were reported.
NEMT expense is classified as:
50% Federal Medical Assistance Percentage in fiscal year 2017.
73.0% of all Medicaid enrollees are enrolled in any Medicaid managed care program as of July 2015.
$10.9 Billion Medicaid expenditure in fiscal year 2015. Expenditures do not include administrative cost and accounting adjustments.
Minnesota decided to adopt the Medicaid expansion under the ACA.
$38Millionis the estimated annual NEMT 2013 expense.
1,615,880is the 2013 estimated annual NEMT trips.
5.3% of all Medicaid enrollees in 2013 used NEMT.
7% of NEMT is public transit.
Source: Centers for Medicare & Medicaid Services Source: 2014 National NEMT Survey
Source: Kaiser Family Foundation
Source: Kaiser Family Foundation
Source: Kaiser Family Foundation
Source: 2014 National NEMT Survey
20.2%
Kent
ucky
102.
8%87
.5%
69.3
%
50.6
%
34.6
%
20.0
% 30.6
%
8.1%
60.0
%
44.5
%
26.0
%
12.3
%
15.4
%
6.2%
77.1
%
64.7
%
49.7
%
34.6
%
16.7
% 25.9
%
8.1%
59.9
%
39.8
%
22.3
%
8.2% 14
.4%
5.8%
70.3
%
56.2
%
35.3
%
31.5
%
11.7
%
62.7
%
44.7
%
27.7
%
13.1
%
17.4
%
7.4%
57.4
%
38.8
%
21.9
%
5.0% 12
.0%
5.3%
3.9%
1.8%
-0.4
%-8
.3%
Nev
ada
Col
orad
oA
rkan
sas
New
Mex
ico
Mon
tana
Was
hing
ton
Cal
iforn
iaW
est V
irgin
iaO
rego
nRh
ode
Isla
ndN
ew H
amps
hire
Mar
ylan
dA
rizon
aA
lask
aN
ew Je
rsey
Loui
siana
Nor
th D
akot
aO
hio
Indi
ana
Mas
sach
uset
tsIo
wa
Penn
sylv
ania
Mic
higa
nM
inne
sota
Haw
aii
Illin
ois
New
Yor
kD
.C.
Del
awar
eVe
rmon
tTe
nnes
see
Nor
th C
arol
ina
Idah
oFl
orid
aM
issou
riG
eorg
iaSo
uth
Car
olin
aA
laba
ma
Kan
sas
Texa
sM
ississ
ippi
Virg
inia
Uta
hW
iscon
sinSo
uth
Dak
ota
Okl
ahom
aN
ebra
ska
Wyo
min
g
States that Expanded Medicaid under ACA*
States that Did Not Expand Medicaid under ACA*
120%
100%
-20%
0%
20%
40%
60%
80%
% Change from the Pre-ACA Summer 2013 to the Post-ACA December 2016 Source: Centers for Medicare & Medicaid Services
*Pre-ACA data for Connecticut not available *Pre-ACA data for Maine not available
Monthly Average + 20.2%
KEY STATISTICS
RECENT OR FUTURE CHANGES
CUMULATIVE MEDICAID/CHIP ENROLLMENT CHANGE PRE-ACA AND POST-ACA BY STATE
Medicaid/CHIP Enrollment Medicaid Spending
Federal Medical Assistance
NEMT Expense Classification
NEMT Operating Facts
Managed Care Enrollment
Page 52

MISSISSIPPIIn-House ManagementManaged Care OrganizationStatewide BrokerRegional Broker
NEMT Assurance under the State Medicaid Plan1902(a)(70) State Plan AmendmentFederal Section 1115 Demonstration WaiverFederal Section 1915(b) Freedom-of-Choice Waiver
3.0 Million
741People
per Sq. Mile
Urban
Rural
46.4People
per Sq. Mile
Source: U.S. Census 2010
Source: U.S. Census 2015 5-Year Estimates
Below PovertyThe individual income is less than the official poverty threshold.
Source: U.S. Census 2015 5-Year Estimates
Live in Urbanized Areasof 50,000 or more people in Census 2010.
Source: U.S. Census 2010
22% 28%
Since 2006, Mississippi’s Division of Medicaid has operated a statewide full-risk NEMT broker model. The broker is paid a monthly capitated rate based on
the number of eligible Medicaid recipients. Mississippi’s original and long-time broker, LogistiCare, recently lost the contract rebid to MTM.
March 2017
DEMOGRAPHICS
OPERATING AUTHORITYNEMT MODEL
Population Density
State Population
FTA Region 4
CMS Region 4
Page 53

Administrative ExpenseMedical ExpenseMixed
637,229684,094
0100,000200,000300,000400,000500,000600,000700,000800,000
Pre-ACA(July–Sept. 2013)
Post-ACA(Dec. 2016)
No program changes were reported.
NEMT expense is classified as:
74.6% Federal Medical Assistance Percentage in fiscal year 2017.
67.0% of all Medicaid enrollees are enrolled in any Medicaid managed care program as of July 2015.
$5.2 Billion Medicaid expenditure in fiscal year 2015. Expenditures do not include administrative cost and accounting adjustments.
Mississippi decided not to adopt the Medicaid expansion under the ACA.
$35Millionis the estimated annual NEMT 2013 expense.
1,440,000is the 2013 estimated annual NEMT trips.
% Not Providedof all Medicaid enrollees in 2013 used NEMT.
% Not Providedof NEMT is public transit.
Source: Centers for Medicare & Medicaid Services Source: 2014 National NEMT Survey
Source: Kaiser Family Foundation
Source: Kaiser Family Foundation
Source: Kaiser Family Foundation
Source: 2014 National NEMT Survey
7.4%
Kent
ucky
102.
8%87
.5%
69.3
%
50.6
%
34.6
%
20.0
% 30.6
%
8.1%
60.0
%
44.5
%
26.0
%
12.3
%
15.4
%
6.2%
77.1
%
64.7
%
49.7
%
34.6
%
16.7
% 25.9
%
8.1%
59.9
%
39.8
%
22.3
%
8.2% 14
.4%
5.8%
70.3
%
56.2
%
35.3
%
20.2
% 31.5
%
11.7
%
62.7
%
44.7
%
27.7
%
13.1
%
17.4
%
57.4
%
38.8
%
21.9
%
5.0% 12
.0%
5.3%
3.9%
1.8%
-0.4
%-8
.3%
Nev
ada
Col
orad
oA
rkan
sas
New
Mex
ico
Mon
tana
Was
hing
ton
Cal
iforn
iaW
est V
irgin
iaO
rego
nRh
ode
Isla
ndN
ew H
amps
hire
Mar
ylan
dA
rizon
aA
lask
aN
ew Je
rsey
Loui
siana
Nor
th D
akot
aO
hio
Indi
ana
Mas
sach
uset
tsIo
wa
Penn
sylv
ania
Mic
higa
nM
inne
sota
Haw
aii
Illin
ois
New
Yor
kD
.C.
Del
awar
eVe
rmon
tTe
nnes
see
Nor
th C
arol
ina
Idah
oFl
orid
aM
issou
riG
eorg
iaSo
uth
Car
olin
aA
laba
ma
Kan
sas
Texa
sM
ississ
ippi
Virg
inia
Uta
hW
iscon
sinSo
uth
Dak
ota
Okl
ahom
aN
ebra
ska
Wyo
min
g
States that Expanded Medicaid under ACA*
States that Did Not Expand Medicaid under ACA*
120%
100%
-20%
0%
20%
40%
60%
80%
% Change from the Pre-ACA Summer 2013 to the Post-ACA December 2016 Source: Centers for Medicare & Medicaid Services
*Pre-ACA data for Connecticut not available *Pre-ACA data for Maine not available
Monthly Average + 7.4%
KEY STATISTICS
RECENT OR FUTURE CHANGES
CUMULATIVE MEDICAID/CHIP ENROLLMENT CHANGE PRE-ACA AND POST-ACA BY STATE
Medicaid/CHIP Enrollment Medicaid Spending
Federal Medical Assistance
NEMT Expense Classification
NEMT Operating Facts
Managed Care Enrollment
Page 54
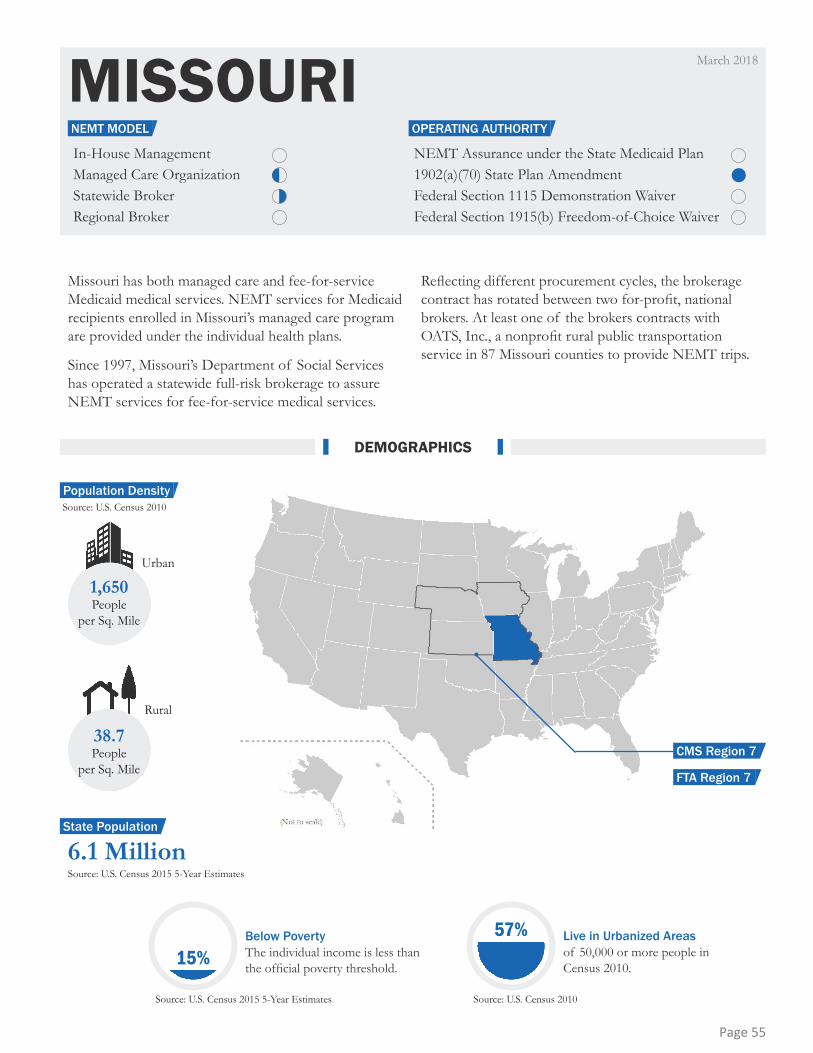
MISSOURIIn-House ManagementManaged Care OrganizationStatewide BrokerRegional Broker
NEMT Assurance under the State Medicaid Plan1902(a)(70) State Plan AmendmentFederal Section 1115 Demonstration WaiverFederal Section 1915(b) Freedom-of-Choice Waiver
6.1 Million
1,650People
per Sq. Mile
Urban
Rural
38.7People
per Sq. Mile
Source: U.S. Census 2010
Source: U.S. Census 2015 5-Year Estimates
Below PovertyThe individual income is less than the official poverty threshold.
Source: U.S. Census 2015 5-Year Estimates
Live in Urbanized Areasof 50,000 or more people in Census 2010.
Source: U.S. Census 2010
15%57%
Missouri has both managed care and fee-for-service Medicaid medical services. NEMT services for Medicaid recipients enrolled in Missouri’s managed care program are provided under the individual health plans.
Since 1997, Missouri’s Department of Social Services has operated a statewide full-risk brokerage to assure NEMT services for fee-for-service medical services.
Reflecting different procurement cycles, the brokerage contract has rotated between two for-profit, national brokers. At least one of the brokers contracts with OATS, Inc., a nonprofit rural public transportation service in 87 Missouri counties to provide NEMT trips.
March 2018
DEMOGRAPHICS
OPERATING AUTHORITYNEMT MODEL
Population Density
State Population
FTA Region 7
CMS Region 7
Page 55
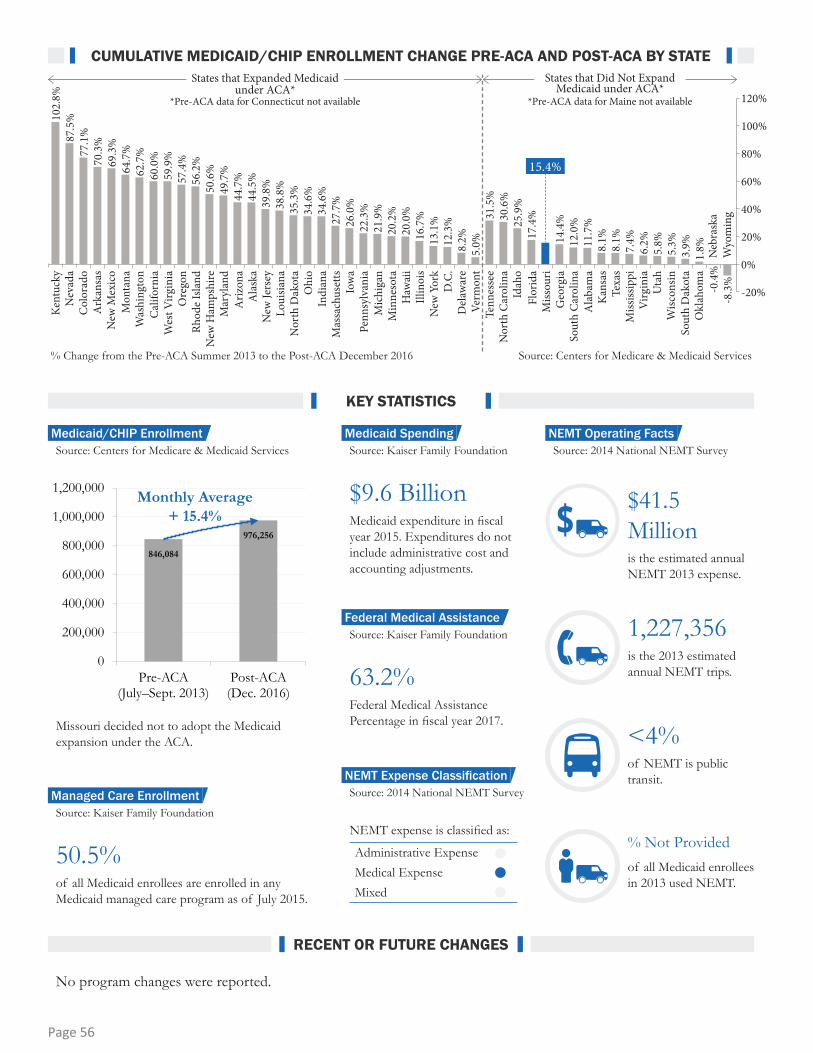
Administrative ExpenseMedical ExpenseMixed
846,084
976,256
0
200,000
400,000
600,000
800,000
1,000,000
1,200,000
Pre-ACA(July–Sept. 2013)
Post-ACA(Dec. 2016)
No program changes were reported.
NEMT expense is classified as:
63.2% Federal Medical Assistance Percentage in fiscal year 2017.
50.5% of all Medicaid enrollees are enrolled in any Medicaid managed care program as of July 2015.
$9.6 Billion Medicaid expenditure in fiscal year 2015. Expenditures do not include administrative cost and accounting adjustments.
Missouri decided not to adopt the Medicaid expansion under the ACA.
$41.5Millionis the estimated annual NEMT 2013 expense.
1,227,356is the 2013 estimated annual NEMT trips.
% Not Providedof all Medicaid enrollees in 2013 used NEMT.
<4%of NEMT is public transit.
Source: Centers for Medicare & Medicaid Services Source: 2014 National NEMT Survey
Source: Kaiser Family Foundation
Source: Kaiser Family Foundation
Source: Kaiser Family Foundation
Source: 2014 National NEMT Survey
15.4%
Kent
ucky
102.
8%87
.5%
69.3
%
50.6
%
34.6
%
20.0
% 30.6
%
8.1%
60.0
%
44.5
%
26.0
%
12.3
%
6.2%
77.1
%
64.7
%
49.7
%
34.6
%
16.7
% 25.9
%
8.1%
59.9
%
39.8
%
22.3
%
8.2% 14
.4%
5.8%
70.3
%
56.2
%
35.3
%
20.2
% 31.5
%
11.7
%
62.7
%
44.7
%
27.7
%
13.1
%
17.4
%
7.4%
57.4
%
38.8
%
21.9
%
5.0% 12
.0%
5.3%
3.9%
1.8%
-0.4
%-8
.3%
Nev
ada
Col
orad
oA
rkan
sas
New
Mex
ico
Mon
tana
Was
hing
ton
Cal
iforn
iaW
est V
irgin
iaO
rego
nRh
ode
Isla
ndN
ew H
amps
hire
Mar
ylan
dA
rizon
aA
lask
aN
ew Je
rsey
Loui
siana
Nor
th D
akot
aO
hio
Indi
ana
Mas
sach
uset
tsIo
wa
Penn
sylv
ania
Mic
higa
nM
inne
sota
Haw
aii
Illin
ois
New
Yor
kD
.C.
Del
awar
eVe
rmon
tTe
nnes
see
Nor
th C
arol
ina
Idah
oFl
orid
aM
issou
riG
eorg
iaSo
uth
Car
olin
aA
laba
ma
Kan
sas
Texa
sM
ississ
ippi
Virg
inia
Uta
hW
iscon
sinSo
uth
Dak
ota
Okl
ahom
aN
ebra
ska
Wyo
min
g
States that Expanded Medicaid under ACA*
States that Did Not Expand Medicaid under ACA*
120%
100%
-20%
0%
20%
40%
60%
80%
% Change from the Pre-ACA Summer 2013 to the Post-ACA December 2016 Source: Centers for Medicare & Medicaid Services
*Pre-ACA data for Connecticut not available *Pre-ACA data for Maine not available
Monthly Average + 15.4%
KEY STATISTICS
RECENT OR FUTURE CHANGES
CUMULATIVE MEDICAID/CHIP ENROLLMENT CHANGE PRE-ACA AND POST-ACA BY STATE
Medicaid/CHIP Enrollment Medicaid Spending
Federal Medical Assistance
NEMT Expense Classification
NEMT Operating Facts
Managed Care Enrollment
Page 56
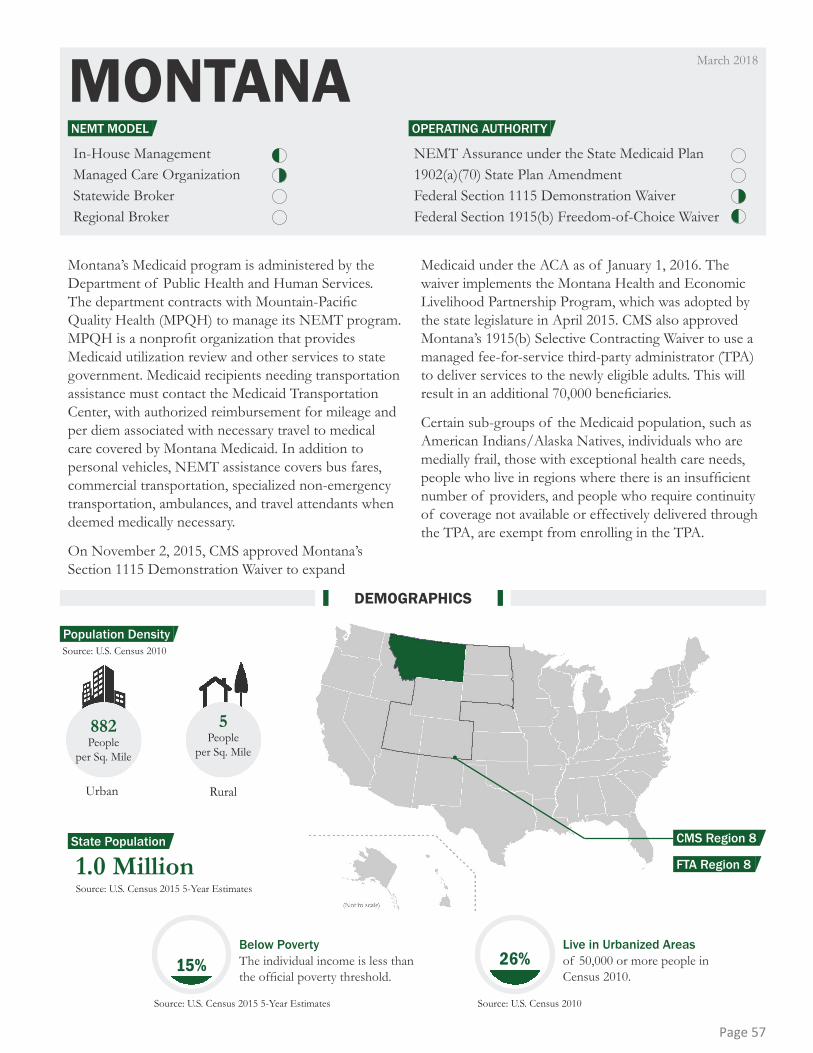
NEMT Assurance under the State Medicaid Plan1902(a)(70) State Plan AmendmentFederal Section 1115 Demonstration WaiverFederal Section 1915(b) Freedom-of-Choice Waiver
MONTANAIn-House ManagementManaged Care OrganizationStatewide BrokerRegional Broker
1.0 Million
882People
per Sq. Mile
Urban Rural
5People
per Sq. Mile
Source: U.S. Census 2010
Source: U.S. Census 2015 5-Year Estimates
Below PovertyThe individual income is less than the official poverty threshold.
Source: U.S. Census 2015 5-Year Estimates
Live in Urbanized Areasof 50,000 or more people in Census 2010.
Source: U.S. Census 2010
15% 26%
Montana’s Medicaid program is administered by the Department of Public Health and Human Services. The department contracts with Mountain-Pacific Quality Health (MPQH) to manage its NEMT program. MPQH is a nonprofit organization that provides Medicaid utilization review and other services to state government. Medicaid recipients needing transportation assistance must contact the Medicaid Transportation Center, with authorized reimbursement for mileage and per diem associated with necessary travel to medical care covered by Montana Medicaid. In addition to personal vehicles, NEMT assistance covers bus fares, commercial transportation, specialized non-emergency transportation, ambulances, and travel attendants when deemed medically necessary.
On November 2, 2015, CMS approved Montana’s Section 1115 Demonstration Waiver to expand
Medicaid under the ACA as of January 1, 2016. The waiver implements the Montana Health and Economic Livelihood Partnership Program, which was adopted by the state legislature in April 2015. CMS also approved Montana’s 1915(b) Selective Contracting Waiver to use a managed fee-for-service third-party administrator (TPA) to deliver services to the newly eligible adults. This will result in an additional 70,000 beneficiaries.
Certain sub-groups of the Medicaid population, such as American Indians/Alaska Natives, individuals who are medially frail, those with exceptional health care needs, people who live in regions where there is an insufficient number of providers, and people who require continuity of coverage not available or effectively delivered through the TPA, are exempt from enrolling in the TPA.
March 2018
DEMOGRAPHICS
OPERATING AUTHORITYNEMT MODEL
Population Density
State Population
FTA Region 8
CMS Region 8
Page 57

Administrative ExpenseMedical ExpenseMixed
148,974
245,360
0
50,000
100,000
150,000
200,000
250,000
300,000
Pre-ACA(July–Sept. 2013)
Post-ACA(Dec. 2016)
No program changes were reported.
NEMT expense is classified as:
65.6% Federal Medical Assistance Percentage in fiscal year 2017.
0% of all Medicaid enrollees are enrolled in any Medicaid managed care program as of July 2015.
$1.1 Billion Medicaid expenditure in fiscal year 2015. Expenditures do not include administrative cost and accounting adjustments.
Montana decided to adopt the Medicaid expansion under the ACA.
$4.5 Millionis the estimated annual NEMT 2013 expense.
159,861is the 2013 estimated annual NEMT trips.
3.1% of all Medicaid enrollees in 2013 used NEMT.
<1% of NEMT is public transit.
Source: Centers for Medicare & Medicaid Services Source: 2014 National NEMT Survey
Source: Kaiser Family Foundation
Source: Kaiser Family Foundation
Source: Kaiser Family Foundation
Source: 2014 National NEMT Survey
64.7%
Kent
ucky
102.
8%87
.5%
50.6
%
34.6
%
20.0
% 30.6
%
8.1%
60.0
%
44.5
%
26.0
%
12.3
%
15.4
%
6.2%
77.1
%
49.7
%
34.6
%
16.7
% 25.9
%
8.1%
59.9
%
39.8
%
22.3
%
8.2% 14
.4%
5.8%
70.3
%69
.3%
56.2
%
35.3
%
20.2
% 31.5
%
11.7
%
62.7
%
44.7
%
27.7
%
13.1
%
17.4
%
7.4%
57.4
%
38.8
%
21.9
%
5.0% 12
.0%
5.3%
3.9%
1.8%
-0.4
%-8
.3%
Nev
ada
Col
orad
oA
rkan
sas
New
Mex
ico
Mon
tana
Was
hing
ton
Cal
iforn
iaW
est V
irgin
iaO
rego
nRh
ode
Isla
ndN
ew H
amps
hire
Mar
ylan
dA
rizon
aA
lask
aN
ew Je
rsey
Loui
siana
Nor
th D
akot
aO
hio
Indi
ana
Mas
sach
uset
tsIo
wa
Penn
sylv
ania
Mic
higa
nM
inne
sota
Haw
aii
Illin
ois
New
Yor
kD
.C.
Del
awar
eVe
rmon
tTe
nnes
see
Nor
th C
arol
ina
Idah
oFl
orid
aM
issou
riG
eorg
iaSo
uth
Car
olin
aA
laba
ma
Kan
sas
Texa
sM
ississ
ippi
Virg
inia
Uta
hW
iscon
sinSo
uth
Dak
ota
Okl
ahom
aN
ebra
ska
Wyo
min
g
States that Expanded Medicaid under ACA*
States that Did Not Expand Medicaid under ACA*
120%
100%
-20%
0%
20%
40%
60%
80%
% Change from the Pre-ACA Summer 2013 to the Post-ACA December 2016 Source: Centers for Medicare & Medicaid Services
*Pre-ACA data for Connecticut not available *Pre-ACA data for Maine not available
Monthly Average + 64.7%
KEY STATISTICS
RECENT OR FUTURE CHANGES
CUMULATIVE MEDICAID/CHIP ENROLLMENT CHANGE PRE-ACA AND POST-ACA BY STATE
Medicaid/CHIP Enrollment Medicaid Spending
Federal Medical Assistance
NEMT Expense Classification
NEMT Operating Facts
Managed Care Enrollment
Page 58
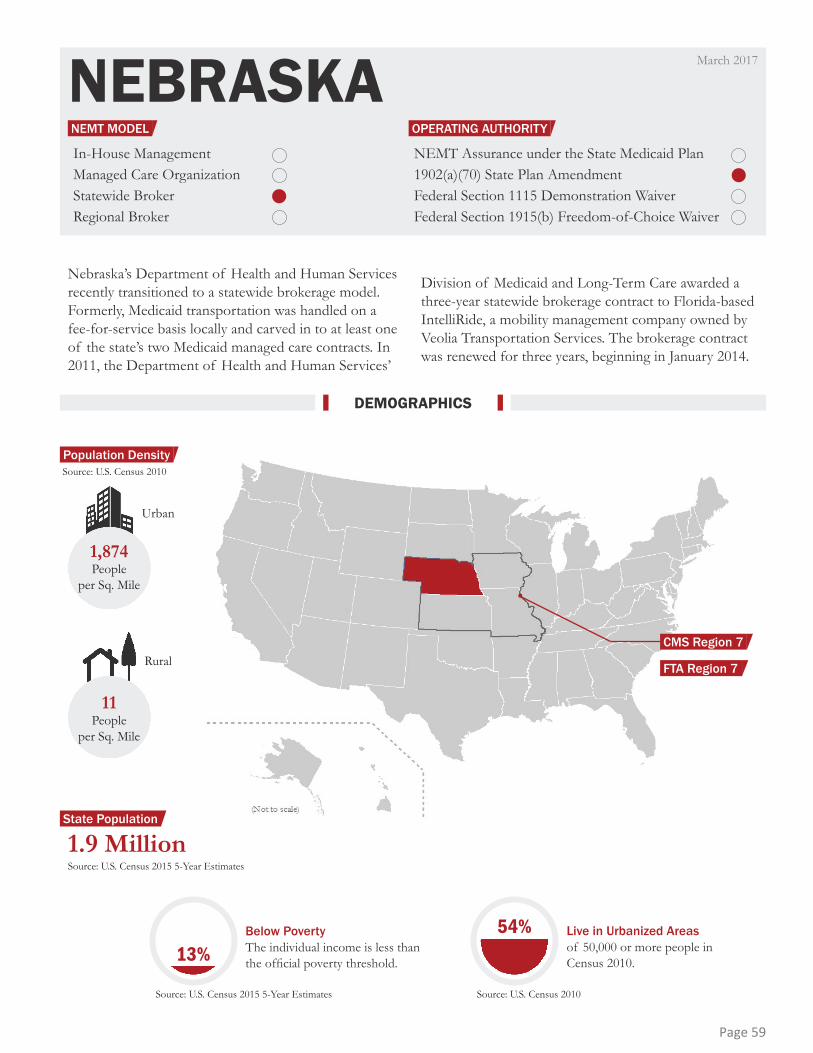
NEBRASKAIn-House ManagementManaged Care OrganizationStatewide BrokerRegional Broker
NEMT Assurance under the State Medicaid Plan1902(a)(70) State Plan AmendmentFederal Section 1115 Demonstration WaiverFederal Section 1915(b) Freedom-of-Choice Waiver
1.9 Million
1,874People
per Sq. Mile
Urban
Rural
11People
per Sq. Mile
Source: U.S. Census 2010
Source: U.S. Census 2015 5-Year Estimates
Below PovertyThe individual income is less than the official poverty threshold.
Source: U.S. Census 2015 5-Year Estimates
Live in Urbanized Areasof 50,000 or more people in Census 2010.
Source: U.S. Census 2010
13%54%
Nebraska’s Department of Health and Human Services recently transitioned to a statewide brokerage model. Formerly, Medicaid transportation was handled on a fee-for-service basis locally and carved in to at least one of the state’s two Medicaid managed care contracts. In 2011, the Department of Health and Human Services’
Division of Medicaid and Long-Term Care awarded a three-year statewide brokerage contract to Florida-based IntelliRide, a mobility management company owned by Veolia Transportation Services. The brokerage contract was renewed for three years, beginning in January 2014.
March 2017
DEMOGRAPHICS
OPERATING AUTHORITYNEMT MODEL
Population Density
State Population
FTA Region 7
CMS Region 7
Page 59

Administrative ExpenseMedical ExpenseMixed
244,600 243,657
0
50,000
100,000
150,000
200,000
250,000
300,000
Pre-ACA(July–Sept. 2013)
Post-ACA(Dec. 2016)
No program changes were reported.
NEMT expense is classified as:
51.9% Federal Medical Assistance Percentage in fiscal year 2017.
74.0% of all Medicaid enrollees are enrolled in any Medicaid managed care program as of July 2015.
$1.9 Billion Medicaid expenditure in fiscal year 2015. Expenditures do not include administrative cost and accounting adjustments.
Nebraska decided not to adopt the Medicaid expansion under the ACA.
$18.9 Millionis the estimated annual NEMT 2013 expense.
400,000is the 2013 estimated annual NEMT trips.
5.1% of all Medicaid enrollees in 2013 used NEMT.
% Not Providedof NEMT is public transit.
Source: Centers for Medicare & Medicaid Services Source: 2014 National NEMT Survey
Source: Kaiser Family Foundation
Source: Kaiser Family Foundation
Source: Kaiser Family Foundation
Source: 2014 National NEMT Survey
-0.4%
Kent
ucky
102.
8%87
.5%
69.3
%
50.6
%
34.6
%
20.0
% 30.6
%
8.1%
60.0
%
44.5
%
26.0
%
12.3
%
15.4
%
6.2%
77.1
%
64.7
%
49.7
%
34.6
%
16.7
% 25.9
%
8.1%
59.9
%
39.8
%
22.3
%
8.2% 14
.4%
5.8%
70.3
%
56.2
%
35.3
%
20.2
% 31.5
%
11.7
%
62.7
%
44.7
%
27.7
%
13.1
%
17.4
%
7.4%
57.4
%
38.8
%
21.9
%
5.0% 12
.0%
5.3%
3.9%
1.8%
-8.3
%
Nev
ada
Col
orad
oA
rkan
sas
New
Mex
ico
Mon
tana
Was
hing
ton
Cal
iforn
iaW
est V
irgin
iaO
rego
nRh
ode
Isla
ndN
ew H
amps
hire
Mar
ylan
dA
rizon
aA
lask
aN
ew Je
rsey
Loui
siana
Nor
th D
akot
aO
hio
Indi
ana
Mas
sach
uset
tsIo
wa
Penn
sylv
ania
Mic
higa
nM
inne
sota
Haw
aii
Illin
ois
New
Yor
kD
.C.
Del
awar
eVe
rmon
tTe
nnes
see
Nor
th C
arol
ina
Idah
oFl
orid
aM
issou
riG
eorg
iaSo
uth
Car
olin
aA
laba
ma
Kan
sas
Texa
sM
ississ
ippi
Virg
inia
Uta
hW
iscon
sinSo
uth
Dak
ota
Okl
ahom
aN
ebra
ska
Wyo
min
g
States that Expanded Medicaid under ACA*
States that Did Not Expand Medicaid under ACA*
120%
100%
-20%
0%
20%
40%
60%
80%
% Change from the Pre-ACA Summer 2013 to the Post-ACA December 2016 Source: Centers for Medicare & Medicaid Services
*Pre-ACA data for Connecticut not available *Pre-ACA data for Maine not available
KEY STATISTICS
RECENT OR FUTURE CHANGES
CUMULATIVE MEDICAID/CHIP ENROLLMENT CHANGE PRE-ACA AND POST-ACA BY STATE
Medicaid/CHIP Enrollment Medicaid Spending
Federal Medical Assistance
NEMT Expense Classification
NEMT Operating Facts
Managed Care Enrollment
Monthly Average - 0.4%
Page 60

NEVADAIn-House ManagementManaged Care OrganizationStatewide BrokerRegional Broker
NEMT Assurance under the State Medicaid Plan1902(a)(70) State Plan AmendmentFederal Section 1115 Demonstration WaiverFederal Section 1915(b) Freedom-of-Choice Waiver
2.8 Million
3,044People
per Sq. Mile
Urban
Rural
3.3People
per Sq. Mile
Source: U.S. Census 2010
Source: U.S. Census 2015 5-Year Estimates
Below PovertyThe individual income is less than the official poverty threshold.
Source: U.S. Census 2015 5-Year Estimates
Live in Urbanized Areasof 50,000 or more people in Census 2010.
Source: U.S. Census 2010
15%87%
Since 2005, Nevada’s Division of Health Care Financing and Policy has operated a somewhat traditional statewide NEMT brokerage program. The state’s overall investment in Medicaid is minimal, and it ranks toward the bottom in terms of per-capita spending on medical transportation.
The state’s contract with LogistiCare requires the broker to break even without realizing a profit before requesting a rate increase. Conversely, the broker must
also return excess profits if actual costs dip below the contracted rate.
Nevada reports to have moved to a cost-based reimbursement—or an intergovernmental transfer method. The counties pay the state share, and the state obtains a federal match, returning all of the money to the county’s regional transportation commissions (RTCs). The NEMT broker now has direct access to the county’s transportation system, and the broker schedules and monitors rides directly within that RTC’s system.
March 2017
DEMOGRAPHICS
OPERATING AUTHORITYNEMT MODEL
Population Density
State Population FTA Region 9
CMS Region 9
Page 61
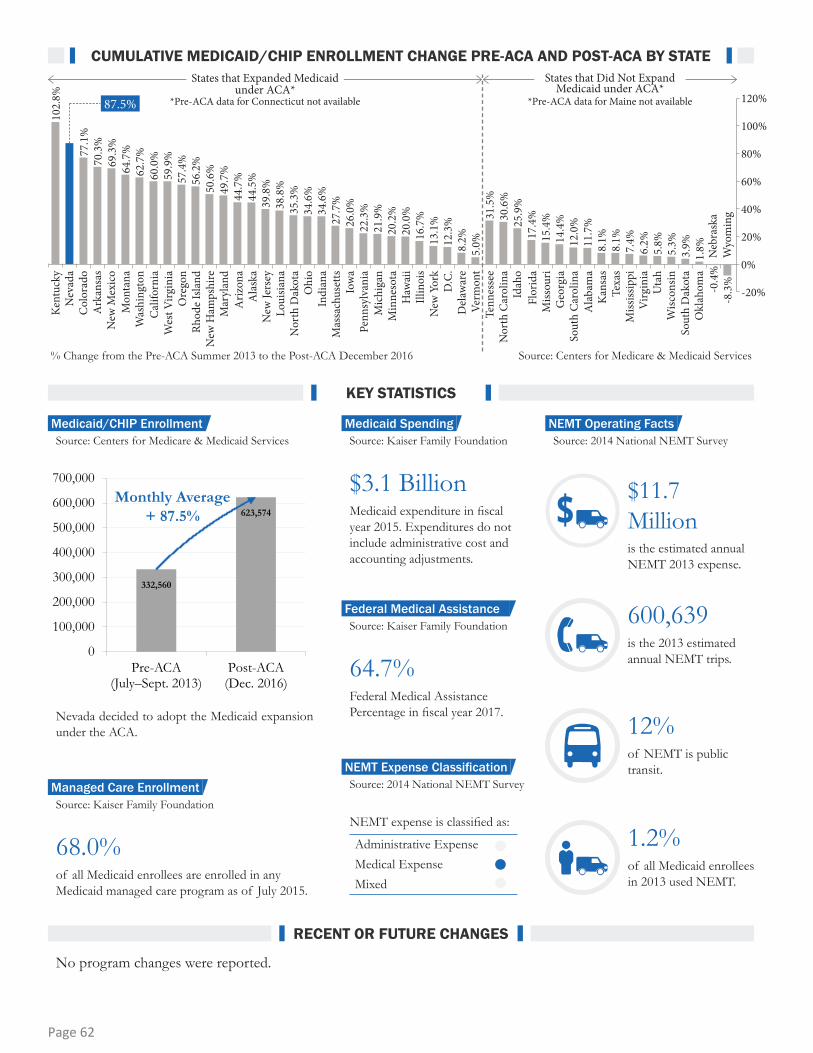
Administrative ExpenseMedical ExpenseMixed
NEMT expense is classified as:
NEMT Expense Classification
332,560
623,574
0
100,000
200,000
300,000
400,000
500,000
600,000
700,000
Pre-ACA(July–Sept. 2013)
Post-ACA(Dec. 2016)
No program changes were reported.
64.7% Federal Medical Assistance Percentage in fiscal year 2017.
68.0% of all Medicaid enrollees are enrolled in any Medicaid managed care program as of July 2015.
$3.1 Billion Medicaid expenditure in fiscal year 2015. Expenditures do not include administrative cost and accounting adjustments.
Nevada decided to adopt the Medicaid expansion under the ACA.
$11.7 Millionis the estimated annual NEMT 2013 expense.
600,639is the 2013 estimated annual NEMT trips.
1.2% of all Medicaid enrollees in 2013 used NEMT.
12%of NEMT is public transit.
Source: Centers for Medicare & Medicaid Services Source: 2014 National NEMT Survey
Source: Kaiser Family Foundation
Source: Kaiser Family Foundation
Source: Kaiser Family Foundation
Source: 2014 National NEMT Survey
87.5%
Kent
ucky
102.
8%
69.3
%
50.6
%
34.6
%
20.0
% 30.6
%
8.1%
60.0
%
44.5
%
26.0
%
12.3
%
15.4
%
6.2%
77.1
%
64.7
%
49.7
%
34.6
%
16.7
% 25.9
%
8.1%
59.9
%
39.8
%
22.3
%
8.2% 14
.4%
5.8%
70.3
%
56.2
%
35.3
%
20.2
% 31.5
%
11.7
%
62.7
%
44.7
%
27.7
%
13.1
%
17.4
%
7.4%
57.4
%
38.8
%
21.9
%
5.0% 12
.0%
5.3%
3.9%
1.8%
-0.4
%-8
.3%
Nev
ada
Col
orad
oA
rkan
sas
New
Mex
ico
Mon
tana
Was
hing
ton
Cal
iforn
iaW
est V
irgin
iaO
rego
nRh
ode
Isla
ndN
ew H
amps
hire
Mar
ylan
dA
rizon
aA
lask
aN
ew Je
rsey
Loui
siana
Nor
th D
akot
aO
hio
Indi
ana
Mas
sach
uset
tsIo
wa
Penn
sylv
ania
Mic
higa
nM
inne
sota
Haw
aii
Illin
ois
New
Yor
kD
.C.
Del
awar
eVe
rmon
tTe
nnes
see
Nor
th C
arol
ina
Idah
oFl
orid
aM
issou
riG
eorg
iaSo
uth
Car
olin
aA
laba
ma
Kan
sas
Texa
sM
ississ
ippi
Virg
inia
Uta
hW
iscon
sinSo
uth
Dak
ota
Okl
ahom
aN
ebra
ska
Wyo
min
g
States that Expanded Medicaid under ACA*
States that Did Not Expand Medicaid under ACA*
120%
100%
-20%
0%
20%
40%
60%
80%
% Change from the Pre-ACA Summer 2013 to the Post-ACA December 2016 Source: Centers for Medicare & Medicaid Services
*Pre-ACA data for Connecticut not available *Pre-ACA data for Maine not available
KEY STATISTICS
RECENT OR FUTURE CHANGES
CUMULATIVE MEDICAID/CHIP ENROLLMENT CHANGE PRE-ACA AND POST-ACA BY STATE
Medicaid/CHIP Enrollment Medicaid Spending
Federal Medical Assistance
NEMT Operating Facts
Managed Care Enrollment
Monthly Average + 87.5%
Page 62
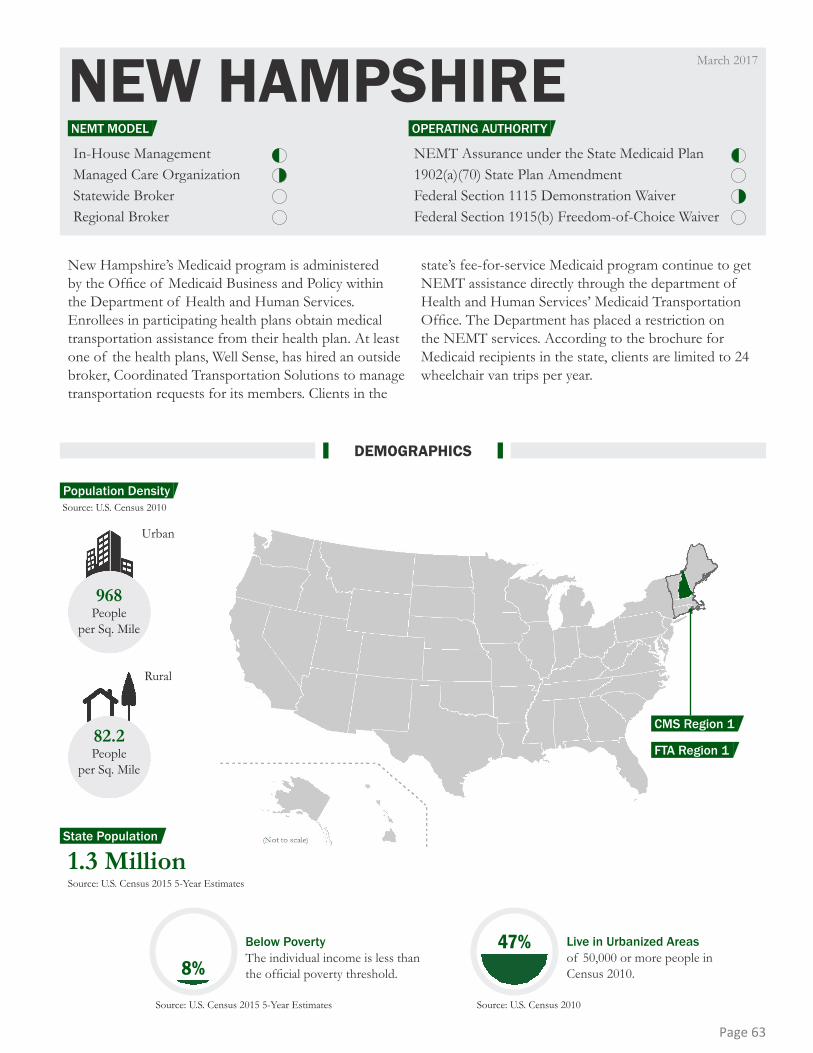
NEW HAMPSHIREIn-House ManagementManaged Care OrganizationStatewide BrokerRegional Broker
NEMT Assurance under the State Medicaid Plan1902(a)(70) State Plan AmendmentFederal Section 1115 Demonstration WaiverFederal Section 1915(b) Freedom-of-Choice Waiver
968People
per Sq. Mile
Urban
Rural
82.2People
per Sq. Mile
1.3 Million
Source: U.S. Census 2010
Source: U.S. Census 2015 5-Year Estimates
Below PovertyThe individual income is less than the official poverty threshold.
Source: U.S. Census 2015 5-Year Estimates
Live in Urbanized Areasof 50,000 or more people in Census 2010.
Source: U.S. Census 2010
8%47%
New Hampshire’s Medicaid program is administered by the Office of Medicaid Business and Policy within the Department of Health and Human Services. Enrollees in participating health plans obtain medical transportation assistance from their health plan. At least one of the health plans, Well Sense, has hired an outside broker, Coordinated Transportation Solutions to manage transportation requests for its members. Clients in the
state’s fee-for-service Medicaid program continue to get NEMT assistance directly through the department of Health and Human Services’ Medicaid Transportation Office. The Department has placed a restriction on the NEMT services. According to the brochure for Medicaid recipients in the state, clients are limited to 24 wheelchair van trips per year.
March 2017
DEMOGRAPHICS
OPERATING AUTHORITYNEMT MODEL
Population Density
State Population
FTA Region 1
CMS Region 1
Page 63
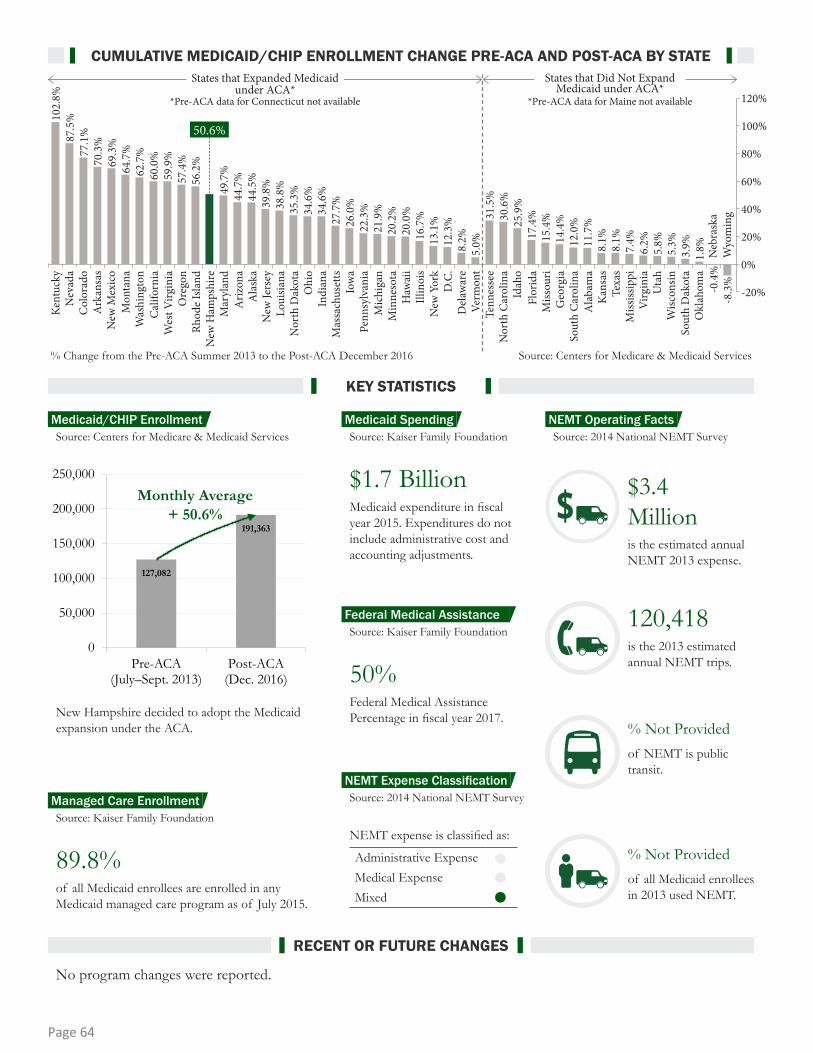
Administrative ExpenseMedical ExpenseMixed
No program changes were reported.
NEMT expense is classified as:
50% Federal Medical Assistance Percentage in fiscal year 2017.
89.8% of all Medicaid enrollees are enrolled in any Medicaid managed care program as of July 2015.
$1.7 Billion Medicaid expenditure in fiscal year 2015. Expenditures do not include administrative cost and accounting adjustments.
$3.4Millionis the estimated annual NEMT 2013 expense.
120,418is the 2013 estimated annual NEMT trips.
% Not Providedof all Medicaid enrollees in 2013 used NEMT.
% Not Providedof NEMT is public transit.
Source: Centers for Medicare & Medicaid Services Source: 2014 National NEMT Survey
Source: Kaiser Family Foundation
Source: Kaiser Family Foundation
Source: Kaiser Family Foundation
Source: 2014 National NEMT Survey
50.6%
Kent
ucky
102.
8%87
.5%
69.3
%
34.6
%
20.0
% 30.6
%
8.1%
60.0
%
44.5
%
26.0
%
12.3
%
15.4
%
6.2%
77.1
%
64.7
%
49.7
%
34.6
%
16.7
% 25.9
%
8.1%
59.9
%
39.8
%
22.3
%
8.2% 14
.4%
5.8%
70.3
%
56.2
%
35.3
%
20.2
% 31.5
%
11.7
%
62.7
%
44.7
%
27.7
%
13.1
%
17.4
%
7.4%
57.4
%
38.8
%
21.9
%
5.0% 12
.0%
5.3%
3.9%
1.8%
-0.4
%-8
.3%
Nev
ada
Col
orad
oA
rkan
sas
New
Mex
ico
Mon
tana
Was
hing
ton
Cal
iforn
iaW
est V
irgin
iaO
rego
nRh
ode
Isla
ndN
ew H
amps
hire
Mar
ylan
dA
rizon
aA
lask
aN
ew Je
rsey
Loui
siana
Nor
th D
akot
aO
hio
Indi
ana
Mas
sach
uset
tsIo
wa
Penn
sylv
ania
Mic
higa
nM
inne
sota
Haw
aii
Illin
ois
New
Yor
kD
.C.
Del
awar
eVe
rmon
tTe
nnes
see
Nor
th C
arol
ina
Idah
oFl
orid
aM
issou
riG
eorg
iaSo
uth
Car
olin
aA
laba
ma
Kan
sas
Texa
sM
ississ
ippi
Virg
inia
Uta
hW
iscon
sinSo
uth
Dak
ota
Okl
ahom
aN
ebra
ska
Wyo
min
g
States that Expanded Medicaid under ACA*
States that Did Not Expand Medicaid under ACA*
120%
100%
-20%
0%
20%
40%
60%
80%
% Change from the Pre-ACA Summer 2013 to the Post-ACA December 2016 Source: Centers for Medicare & Medicaid Services
*Pre-ACA data for Connecticut not available *Pre-ACA data for Maine not available
KEY STATISTICS
RECENT OR FUTURE CHANGES
CUMULATIVE MEDICAID/CHIP ENROLLMENT CHANGE PRE-ACA AND POST-ACA BY STATE
Medicaid/CHIP Enrollment Medicaid Spending
Federal Medical Assistance
NEMT Expense Classification
NEMT Operating Facts
Managed Care Enrollment
New Hampshire decided to adopt the Medicaid expansion under the ACA.
127,082
191,363
0
50,000
100,000
150,000
200,000
250,000
Pre-ACA(July–Sept. 2013)
Post-ACA(Dec. 2016)
Monthly Average + 50.6%
Page 64

NEW JERSEYIn-House ManagementManaged Care OrganizationStatewide BrokerRegional Broker
NEMT Assurance under the State Medicaid Plan1902(a)(70) State Plan AmendmentFederal Section 1115 Demonstration WaiverFederal Section 1915(b) Freedom-of-Choice Waiver
8.9 Million
2,778People
per Sq. Mile
Urban
Rural
148.8People
per Sq. Mile
Source: U.S. Census 2010
Source: U.S. Census 2015 5-Year Estimates
Below PovertyThe individual income is less than the official poverty threshold.
Source: U.S. Census 2015 5-Year Estimates
Live in Urbanized Areasof 50,000 or more people in Census 2010.
Source: U.S. Census 2010
92%11%
Until fairly recently, the NEMT program operated by New Jersey’s Division of Medical Assistance and Health Services was administered at the county level. Because of the availability of casino revenues to support local specialized transportation service, there was a considerable amount of coordination of transportation resources in the state, and public and community transit providers were coordinating NEMT services for Medicaid clients.
That fee-for-service Medicaid model ended in 2010 when the state opted for a statewide contract broker to manage NEMT services. LogistiCare is the current statewide
broker. Many community and public transportation providers opted not to participate in the program when the transition was made. Recent efforts to negotiate agreements between community and public transportation providers and LogistiCare are reported. The effort is meant to negotiate agreements to reimburse community and public transit providers’ marginal rather than fully allocated costs, which would more adequately compensate community and public transit agencies and encourage Medicaid NEMT participation.
March 2017
DEMOGRAPHICS
OPERATING AUTHORITYNEMT MODEL
Population Density
State Population
FTA Region 2
CMS Region 2
Page 65

Administrative ExpenseMedical ExpenseMixed
1,283,851
1,795,251
0200,000400,000600,000800,000
1,000,0001,200,0001,400,0001,600,0001,800,0002,000,000
Pre-ACA(July–Sept. 2013)
Post-ACA(Dec. 2016)
No program changes were reported.
NEMT expense is classified as:
50% Federal Medical Assistance Percentage in fiscal year 2017.
93.0% of all Medicaid enrollees are enrolled in any Medicaid managed care program as of July 2015.
$14.2 Billion Medicaid expenditure in fiscal year 2015. Expenditures do not include administrative cost and accounting adjustments.
New Jersey decided to adopt the Medicaid expansion under the ACA.
$140 Millionis the estimated annual NEMT 2013 expense.
4.5 Millionis the 2013 estimated annual NEMT trips.
4% of all Medicaid enrollees in 2013 used NEMT.
20%of NEMT is public transit.
Source: Centers for Medicare & Medicaid Services Source: 2014 National NEMT Survey
Source: Kaiser Family Foundation
Source: Kaiser Family Foundation
Source: Kaiser Family Foundation
Source: 2014 National NEMT Survey
39.8%
Kent
ucky
102.
8%87
.5%
69.3
%
50.6
%
34.6
%
20.0
% 30.6
%
8.1%
60.0
%
44.5
%
26.0
%
12.3
%
15.4
%
6.2%
77.1
%
64.7
%
49.7
%
34.6
%
16.7
% 25.9
%
8.1%
59.9
%
22.3
%
8.2% 14
.4%
5.8%
70.3
%
56.2
%
35.3
%
20.2
% 31.5
%
11.7
%
62.7
%
44.7
%
27.7
%
13.1
%
17.4
%
7.4%
57.4
%
38.8
%
21.9
%
5.0% 12
.0%
5.3%
3.9%
1.8%
-0.4
%-8
.3%
Nev
ada
Col
orad
oA
rkan
sas
New
Mex
ico
Mon
tana
Was
hing
ton
Cal
iforn
iaW
est V
irgin
iaO
rego
nRh
ode
Isla
ndN
ew H
amps
hire
Mar
ylan
dA
rizon
aA
lask
aN
ew Je
rsey
Loui
siana
Nor
th D
akot
aO
hio
Indi
ana
Mas
sach
uset
tsIo
wa
Penn
sylv
ania
Mic
higa
nM
inne
sota
Haw
aii
Illin
ois
New
Yor
kD
.C.
Del
awar
eVe
rmon
tTe
nnes
see
Nor
th C
arol
ina
Idah
oFl
orid
aM
issou
riG
eorg
iaSo
uth
Car
olin
aA
laba
ma
Kan
sas
Texa
sM
ississ
ippi
Virg
inia
Uta
hW
iscon
sinSo
uth
Dak
ota
Okl
ahom
aN
ebra
ska
Wyo
min
g
States that Expanded Medicaid under ACA*
States that Did Not Expand Medicaid under ACA*
120%
100%
-20%
0%
20%
40%
60%
80%
% Change from the Pre-ACA Summer 2013 to the Post-ACA December 2016 Source: Centers for Medicare & Medicaid Services
*Pre-ACA data for Connecticut not available *Pre-ACA data for Maine not available
KEY STATISTICS
RECENT OR FUTURE CHANGES
CUMULATIVE MEDICAID/CHIP ENROLLMENT CHANGE PRE-ACA AND POST-ACA BY STATE
Medicaid/CHIP Enrollment Medicaid Spending
Federal Medical Assistance
NEMT Expense Classification
NEMT Operating Facts
Managed Care Enrollment
Monthly Average + 39.8%
Page 66

NEW MEXICOIn-House ManagementManaged Care OrganizationStatewide BrokerRegional Broker
NEMT Assurance under the State Medicaid Plan1902(a)(70) State Plan AmendmentFederal Section 1115 Demonstration WaiverFederal Section 1915(b) Freedom-of-Choice Waiver
2.1 Million
1,339People
per Sq. Mile
Urban
Rural
7.9People
per Sq. Mile
Source: U.S. Census 2010
Source: U.S. Census 2015 5-Year Estimates
Below PovertyThe individual income is less than the official poverty threshold.
Source: U.S. Census 2015 5-Year Estimates
Live in Urbanized Areasof 50,000 or more people in Census 2010.
Source: U.S. Census 2010
20%54%
Until the beginning of 2014, New Mexico’s Department of Human Services operated a mixed NEMT program that included a carved-in managed care model for some Medicaid recipients and a fee-for-service model for others. Under the Salud Health Initiative, four health plans participated in the state’s Medicaid managed care program. Each health plan contracted with a separate transportation broker or provider to
manage its members’ transportation needs. Two plans used private brokers, while the other two contracted with transportation companies to provide exclusive transportation services for their members. Clients enrolled in the fee-for-service Medicaid program were eligible to call state-certified medical transportation providers serving their county.
March 2017
DEMOGRAPHICS
OPERATING AUTHORITYNEMT MODEL
Population Density
State PopulationFTA Region 6
CMS Region 6
Page 67
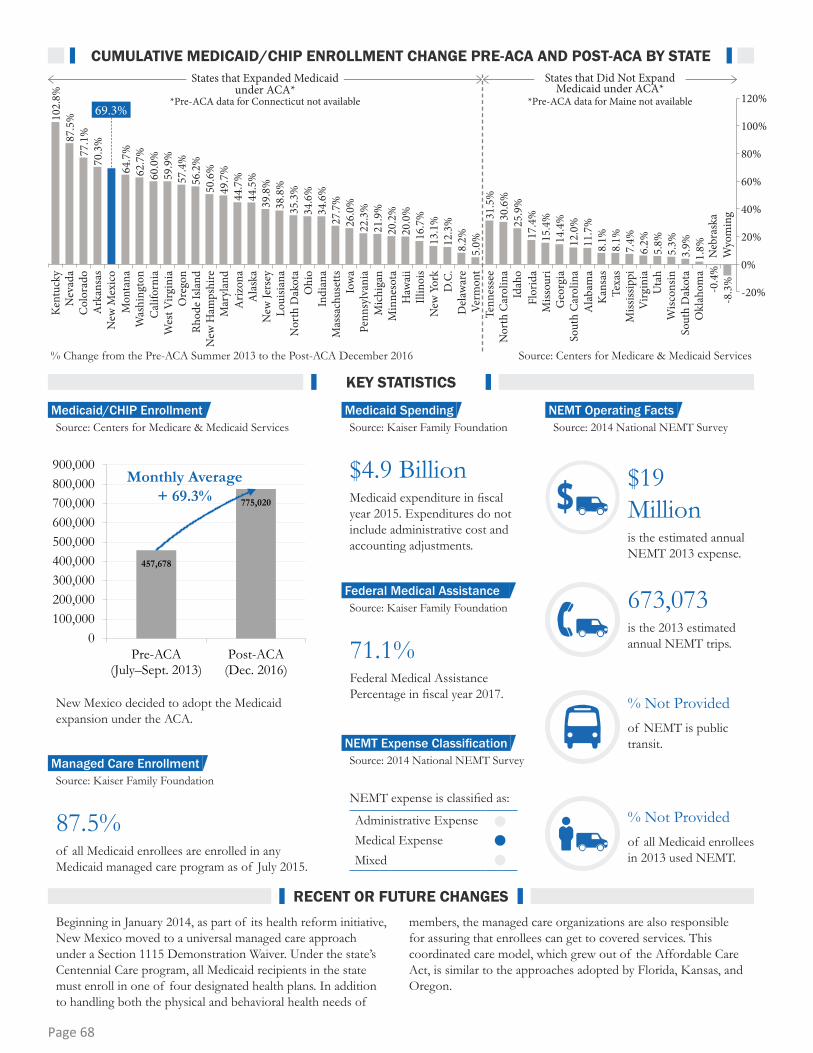
Administrative ExpenseMedical ExpenseMixed
457,678
775,020
0100,000200,000300,000400,000500,000600,000700,000800,000900,000
Pre-ACA(July–Sept. 2013)
Post-ACA(Dec. 2016)
Beginning in January 2014, as part of its health reform initiative, New Mexico moved to a universal managed care approach under a Section 1115 Demonstration Waiver. Under the state’s Centennial Care program, all Medicaid recipients in the state must enroll in one of four designated health plans. In addition to handling both the physical and behavioral health needs of
members, the managed care organizations are also responsible for assuring that enrollees can get to covered services. This coordinated care model, which grew out of the Affordable Care Act, is similar to the approaches adopted by Florida, Kansas, and Oregon.
NEMT expense is classified as:
71.1% Federal Medical Assistance Percentage in fiscal year 2017.
87.5% of all Medicaid enrollees are enrolled in any Medicaid managed care program as of July 2015.
$4.9 Billion Medicaid expenditure in fiscal year 2015. Expenditures do not include administrative cost and accounting adjustments.
New Mexico decided to adopt the Medicaid expansion under the ACA.
$19Millionis the estimated annual NEMT 2013 expense.
673,073is the 2013 estimated annual NEMT trips.
% Not Provided of all Medicaid enrollees in 2013 used NEMT.
% Not Providedof NEMT is public transit.
Source: Centers for Medicare & Medicaid Services Source: 2014 National NEMT Survey
Source: Kaiser Family Foundation
Source: Kaiser Family Foundation
Source: Kaiser Family Foundation
Source: 2014 National NEMT Survey
69.3%
Kent
ucky
102.
8%87
.5%
50.6
%
34.6
%
20.0
% 30.6
%
8.1%
60.0
%
44.5
%
26.0
%
12.3
%
15.4
%
6.2%
77.1
%
64.7
%
49.7
%
34.6
%
16.7
% 25.9
%
8.1%
59.9
%
39.8
%
22.3
%
8.2% 14
.4%
5.8%
70.3
%
56.2
%
35.3
%
20.2
% 31.5
%
11.7
%
62.7
%
44.7
%
27.7
%
13.1
%
17.4
%
7.4%
57.4
%
38.8
%
21.9
%
5.0% 12
.0%
5.3%
3.9%
1.8%
-0.4
%-8
.3%
Nev
ada
Col
orad
oA
rkan
sas
New
Mex
ico
Mon
tana
Was
hing
ton
Cal
iforn
iaW
est V
irgin
iaO
rego
nRh
ode
Isla
ndN
ew H
amps
hire
Mar
ylan
dA
rizon
aA
lask
aN
ew Je
rsey
Loui
siana
Nor
th D
akot
aO
hio
Indi
ana
Mas
sach
uset
tsIo
wa
Penn
sylv
ania
Mic
higa
nM
inne
sota
Haw
aii
Illin
ois
New
Yor
kD
.C.
Del
awar
eVe
rmon
tTe
nnes
see
Nor
th C
arol
ina
Idah
oFl
orid
aM
issou
riG
eorg
iaSo
uth
Car
olin
aA
laba
ma
Kan
sas
Texa
sM
ississ
ippi
Virg
inia
Uta
hW
iscon
sinSo
uth
Dak
ota
Okl
ahom
aN
ebra
ska
Wyo
min
g
States that Expanded Medicaid under ACA*
States that Did Not Expand Medicaid under ACA*
120%
100%
-20%
0%
20%
40%
60%
80%
% Change from the Pre-ACA Summer 2013 to the Post-ACA December 2016 Source: Centers for Medicare & Medicaid Services
*Pre-ACA data for Connecticut not available *Pre-ACA data for Maine not available
KEY STATISTICS
RECENT OR FUTURE CHANGES
CUMULATIVE MEDICAID/CHIP ENROLLMENT CHANGE PRE-ACA AND POST-ACA BY STATE
Medicaid/CHIP Enrollment Medicaid Spending
Federal Medical Assistance
NEMT Expense Classification
NEMT Operating Facts
Managed Care Enrollment
Monthly Average + 69.3%
Page 68
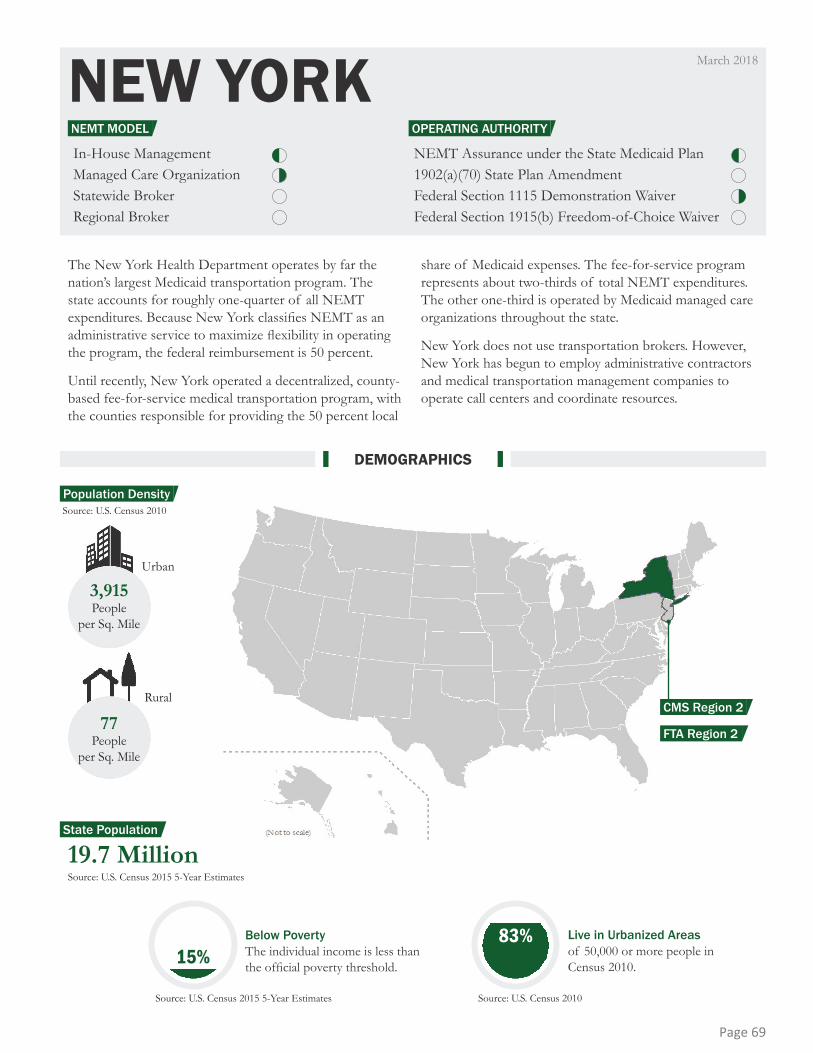
NEW YORKIn-House ManagementManaged Care OrganizationStatewide BrokerRegional Broker
NEMT Assurance under the State Medicaid Plan1902(a)(70) State Plan AmendmentFederal Section 1115 Demonstration WaiverFederal Section 1915(b) Freedom-of-Choice Waiver
19.7 Million
3,915People
per Sq. Mile
Urban
Rural
77People
per Sq. Mile
Source: U.S. Census 2010
Source: U.S. Census 2015 5-Year Estimates
Below PovertyThe individual income is less than the official poverty threshold.
Source: U.S. Census 2015 5-Year Estimates
Live in Urbanized Areasof 50,000 or more people in Census 2010.
Source: U.S. Census 2010
15%83%
The New York Health Department operates by far the nation’s largest Medicaid transportation program. The state accounts for roughly one-quarter of all NEMT expenditures. Because New York classifies NEMT as an administrative service to maximize flexibility in operating the program, the federal reimbursement is 50 percent.
Until recently, New York operated a decentralized, county-based fee-for-service medical transportation program, with the counties responsible for providing the 50 percent local
share of Medicaid expenses. The fee-for-service program represents about two-thirds of total NEMT expenditures. The other one-third is operated by Medicaid managed care organizations throughout the state.
New York does not use transportation brokers. However, New York has begun to employ administrative contractors and medical transportation management companies to operate call centers and coordinate resources.
March 2018
DEMOGRAPHICS
OPERATING AUTHORITYNEMT MODEL
Population Density
State Population
FTA Region 2
CMS Region 2
Page 69

Administrative ExpenseMedical ExpenseMixed
5,678,417
6,420,227
0
1,000,000
2,000,000
3,000,000
4,000,000
5,000,000
6,000,000
7,000,000
Pre-ACA(July–Sept. 2013)
Post-ACA(Dec. 2016)
Beginning in 2011, the state began taking over the management of NEMT services from the counties. Responsibility for NEMT has transferred from the county to the regional level through the use of regional transportation management companies. By 2015, all Medicaid transportation
services were expected to be shifted to the state program. The purpose of the change has been to relieve local districts of administering the NEMT program, consolidate administrative functions, provide more consistent management and policy oversight, and improve coordination.
NEMT expense is classified as:
50% Federal Medical Assistance Percentage in fiscal year 2017.
77.8% of all Medicaid enrollees are enrolled in any Medicaid managed care program as of July 2015.
$59.8 Billion Medicaid expenditure in fiscal year 2015. Expenditures do not include administrative cost and accounting adjustments.
New York decided to adopt the Medicaid expansion under the ACA.
$646.9 Millionis the estimated annual NEMT 2013 expense.
10,701,315is the 2013 estimated annual NEMT trips.
% Not Provided of all Medicaid enrollees in 2013 used NEMT.
% Not Providedof NEMT is public transit.
Source: Centers for Medicare & Medicaid Services Source: 2014 National NEMT Survey
Source: Kaiser Family Foundation
Source: Kaiser Family Foundation
Source: Kaiser Family Foundation
Source: 2014 National NEMT Survey
13.1%
Kent
ucky
102.
8%87
.5%
69.3
%
50.6
%
34.6
%
20.0
% 30.6
%
8.1%
60.0
%
44.5
%
26.0
%
12.3
%
15.4
%
6.2%
77.1
%
64.7
%
49.7
%
34.6
%
16.7
% 25.9
%
8.1%
59.9
%
39.8
%
22.3
%
8.2% 14
.4%
5.8%
70.3
%
56.2
%
35.3
%
20.2
% 31.5
%
11.7
%
62.7
%
44.7
%
27.7
%
17.4
%
7.4%
57.4
%
38.8
%
21.9
%
5.0% 12
.0%
5.3%
3.9%
1.8%
-0.4
%-8
.3%
Nev
ada
Col
orad
oA
rkan
sas
New
Mex
ico
Mon
tana
Was
hing
ton
Cal
iforn
iaW
est V
irgin
iaO
rego
nRh
ode
Isla
ndN
ew H
amps
hire
Mar
ylan
dA
rizon
aA
lask
aN
ew Je
rsey
Loui
siana
Nor
th D
akot
aO
hio
Indi
ana
Mas
sach
uset
tsIo
wa
Penn
sylv
ania
Mic
higa
nM
inne
sota
Haw
aii
Illin
ois
New
Yor
kD
.C.
Del
awar
eVe
rmon
tTe
nnes
see
Nor
th C
arol
ina
Idah
oFl
orid
aM
issou
riG
eorg
iaSo
uth
Car
olin
aA
laba
ma
Kan
sas
Texa
sM
ississ
ippi
Virg
inia
Uta
hW
iscon
sinSo
uth
Dak
ota
Okl
ahom
aN
ebra
ska
Wyo
min
g
States that Expanded Medicaid under ACA*
States that Did Not Expand Medicaid under ACA*
120%
100%
-20%
0%
20%
40%
60%
80%
% Change from the Pre-ACA Summer 2013 to the Post-ACA December 2016 Source: Centers for Medicare & Medicaid Services
*Pre-ACA data for Connecticut not available *Pre-ACA data for Maine not available
KEY STATISTICS
RECENT OR FUTURE CHANGES
CUMULATIVE MEDICAID/CHIP ENROLLMENT CHANGE PRE-ACA AND POST-ACA BY STATE
Medicaid/CHIP Enrollment Medicaid Spending
Federal Medical Assistance
NEMT Expense Classification
NEMT Operating Facts
Managed Care Enrollment
Monthly Average + 13.1%
Page 70

NORTH CAROLINAIn-House ManagementManaged Care OrganizationStatewide BrokerRegional Broker
NEMT Assurance under the State Medicaid Plan1902(a)(70) State Plan AmendmentFederal Section 1115 Demonstration WaiverFederal Section 1915(b) Freedom-of-Choice Waiver
9.9 Million
1,135People
per Sq. Mile
Urban
Rural
95.5People
per Sq. Mile
Source: U.S. Census 2010
Source: U.S. Census 2015 5-Year Estimates
Below PovertyThe individual income is less than the official poverty threshold.
Source: U.S. Census 2015 5-Year Estimates
Live in Urbanized Areasof 50,000 or more people in Census 2010
Source: U.S. Census 2010
16%55%
In North Carolina, responsibility for managing Medicaid transportation is delegated by the Department of Health and Human Services to the 100 county departments of social services. Individual county Departments of Social Services purchase, on a fee-for-service basis, transportation. Use of waivers has permitted purchase from a network of 81 community transportation
providers that provide coverage in all of the state’s 100 counties. Six counties purchase NEMT services from private operators or use mileage reimbursements to pay clients, families, or friend to provide medical transportation in private automobiles. The counties assess recipients’ needs for transportation and arrange transport to and from covered medical services.
March 2017
DEMOGRAPHICS
OPERATING AUTHORITYNEMT MODEL
Population Density
State Population
FTA Region 4
CMS Region 4
Page 71
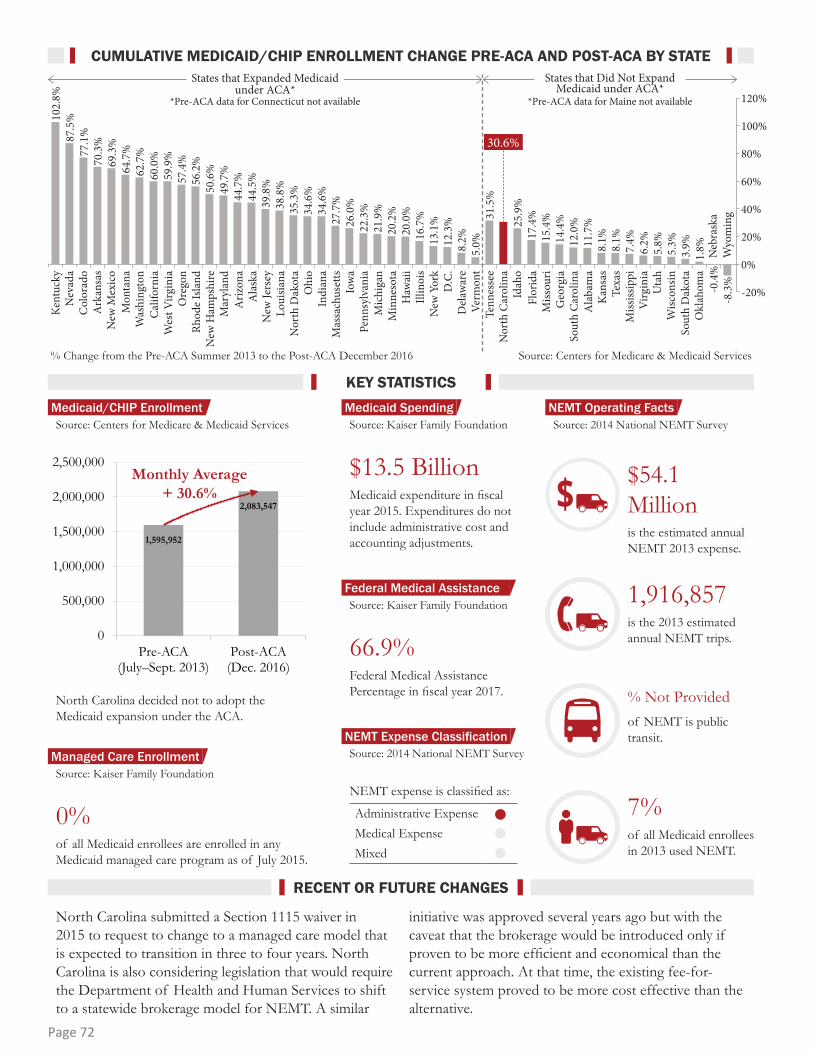
Administrative ExpenseMedical ExpenseMixed
1,595,952
2,083,547
0
500,000
1,000,000
1,500,000
2,000,000
2,500,000
Pre-ACA(July–Sept. 2013)
Post-ACA(Dec. 2016)
North Carolina submitted a Section 1115 waiver in 2015 to request to change to a managed care model that is expected to transition in three to four years. North Carolina is also considering legislation that would require the Department of Health and Human Services to shift to a statewide brokerage model for NEMT. A similar
initiative was approved several years ago but with the caveat that the brokerage would be introduced only if proven to be more efficient and economical than the current approach. At that time, the existing fee-for-service system proved to be more cost effective than the alternative.
NEMT expense is classified as:
66.9% Federal Medical Assistance Percentage in fiscal year 2017.
0% of all Medicaid enrollees are enrolled in any Medicaid managed care program as of July 2015.
$13.5 Billion Medicaid expenditure in fiscal year 2015. Expenditures do not include administrative cost and accounting adjustments.
North Carolina decided not to adopt the Medicaid expansion under the ACA.
$54.1 Millionis the estimated annual NEMT 2013 expense.
1,916,857is the 2013 estimated annual NEMT trips.
7% of all Medicaid enrollees in 2013 used NEMT.
% Not Providedof NEMT is public transit.
Source: Centers for Medicare & Medicaid Services Source: 2014 National NEMT Survey
Source: Kaiser Family Foundation
Source: Kaiser Family Foundation
Source: Kaiser Family Foundation
Source: 2014 National NEMT Survey
30.6%
Kent
ucky
102.
8%87
.5%
69.3
%
50.6
%
34.6
%
20.0
%
8.1%
60.0
%
44.5
%
26.0
%
12.3
%
15.4
%
6.2%
77.1
%
64.7
%
49.7
%
34.6
%
16.7
% 25.9
%
8.1%
59.9
%
39.8
%
22.3
%
8.2% 14
.4%
5.8%
70.3
%
56.2
%
35.3
%
20.2
% 31.5
%
11.7
%
62.7
%
44.7
%
27.7
%
13.1
%
17.4
%
7.4%
57.4
%
38.8
%
21.9
%
5.0% 12
.0%
5.3%
3.9%
1.8%
-0.4
%-8
.3%
Nev
ada
Col
orad
oA
rkan
sas
New
Mex
ico
Mon
tana
Was
hing
ton
Cal
iforn
iaW
est V
irgin
iaO
rego
nRh
ode
Isla
ndN
ew H
amps
hire
Mar
ylan
dA
rizon
aA
lask
aN
ew Je
rsey
Loui
siana
Nor
th D
akot
aO
hio
Indi
ana
Mas
sach
uset
tsIo
wa
Penn
sylv
ania
Mic
higa
nM
inne
sota
Haw
aii
Illin
ois
New
Yor
kD
.C.
Del
awar
eVe
rmon
tTe
nnes
see
Nor
th C
arol
ina
Idah
oFl
orid
aM
issou
riG
eorg
iaSo
uth
Car
olin
aA
laba
ma
Kan
sas
Texa
sM
ississ
ippi
Virg
inia
Uta
hW
iscon
sinSo
uth
Dak
ota
Okl
ahom
aN
ebra
ska
Wyo
min
g
States that Expanded Medicaid under ACA*
States that Did Not Expand Medicaid under ACA*
120%
100%
-20%
0%
20%
40%
60%
80%
% Change from the Pre-ACA Summer 2013 to the Post-ACA December 2016 Source: Centers for Medicare & Medicaid Services
*Pre-ACA data for Connecticut not available *Pre-ACA data for Maine not available
KEY STATISTICS
RECENT OR FUTURE CHANGES
CUMULATIVE MEDICAID/CHIP ENROLLMENT CHANGE PRE-ACA AND POST-ACA BY STATE
Medicaid/CHIP Enrollment Medicaid Spending
Federal Medical Assistance
NEMT Expense Classification
NEMT Operating Facts
Managed Care Enrollment
Monthly Average + 30.6%
Page 72
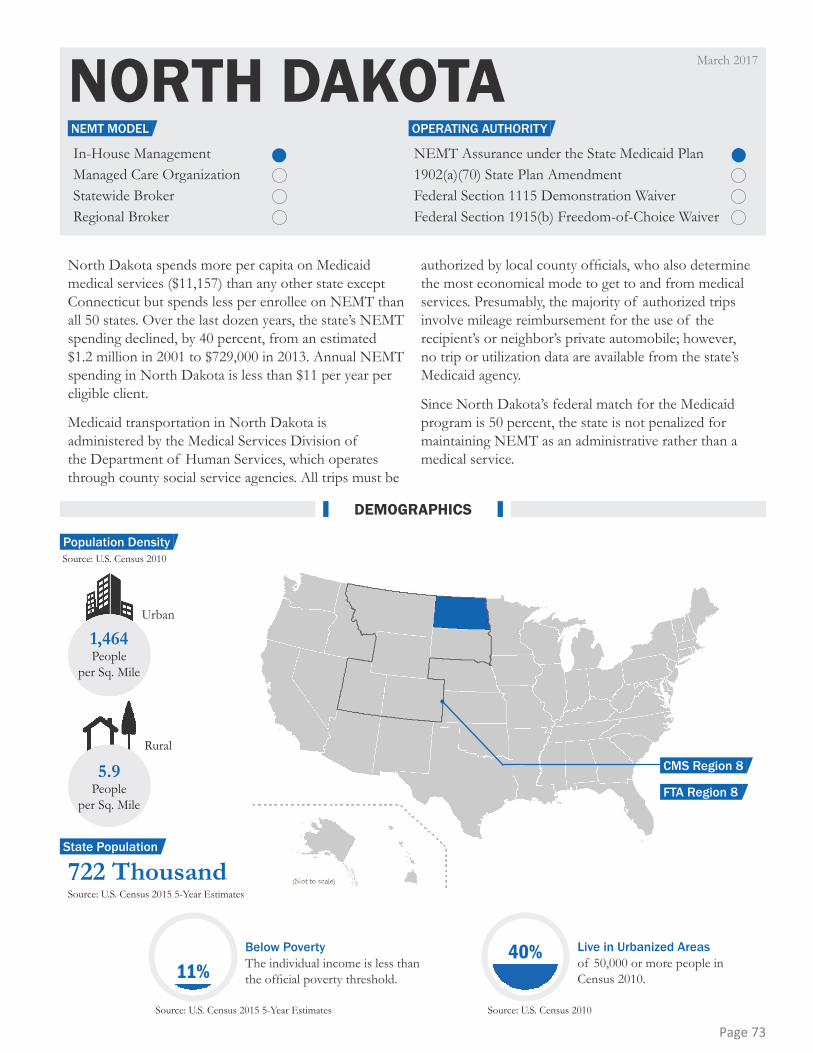
NORTH DAKOTAIn-House ManagementManaged Care OrganizationStatewide BrokerRegional Broker
NEMT Assurance under the State Medicaid Plan1902(a)(70) State Plan AmendmentFederal Section 1115 Demonstration WaiverFederal Section 1915(b) Freedom-of-Choice Waiver
1,464People
per Sq. Mile
Urban
Rural
5.9People
per Sq. Mile
722 Thousand
Source: U.S. Census 2010
Source: U.S. Census 2015 5-Year Estimates
Below PovertyThe individual income is less than the official poverty threshold.
Source: U.S. Census 2015 5-Year Estimates
Live in Urbanized Areasof 50,000 or more people in Census 2010.
Source: U.S. Census 2010
11%40%
North Dakota spends more per capita on Medicaid medical services ($11,157) than any other state except Connecticut but spends less per enrollee on NEMT than all 50 states. Over the last dozen years, the state’s NEMT spending declined, by 40 percent, from an estimated $1.2 million in 2001 to $729,000 in 2013. Annual NEMT spending in North Dakota is less than $11 per year per eligible client.
Medicaid transportation in North Dakota is administered by the Medical Services Division of the Department of Human Services, which operates through county social service agencies. All trips must be
authorized by local county officials, who also determine the most economical mode to get to and from medical services. Presumably, the majority of authorized trips involve mileage reimbursement for the use of the recipient’s or neighbor’s private automobile; however, no trip or utilization data are available from the state’s Medicaid agency.
Since North Dakota’s federal match for the Medicaid program is 50 percent, the state is not penalized for maintaining NEMT as an administrative rather than a medical service.
March 2017
DEMOGRAPHICS
OPERATING AUTHORITYNEMT MODEL
Population Density
State Population
FTA Region 8
CMS Region 8
Page 73

Administrative ExpenseMedical ExpenseMixed
No program changes were reported.
NEMT expense is classified as:
50% Federal Medical Assistance Percentage in fiscal year 2017.
21.0% of all Medicaid enrollees are enrolled in any Medicaid managed care program as of July 2015.
$1.1 Billion Medicaid expenditure in fiscal year 2015. Expenditures do not include administrative cost and accounting adjustments.
$729 Thousandis the estimated annual NEMT 2013 expense.
25,834is the 2013 estimated annual NEMT trips.
% Not Provided of all Medicaid enrollees in 2013 used NEMT.
% Not Providedof NEMT is public transit.
Source: Centers for Medicare & Medicaid Services Source: 2014 National NEMT Survey
Source: Kaiser Family Foundation
Source: Kaiser Family Foundation
Source: Kaiser Family Foundation
Source: 2014 National NEMT Survey
35.3%
Kent
ucky
102.
8%87
.5%
69.3
%
50.6
%
34.6
%
20.0
% 30.6
%
8.1%
60.0
%
44.5
%
26.0
%
12.3
%
15.4
%
6.2%
77.1
%
64.7
%
49.7
%
34.6
%
16.7
% 25.9
%
8.1%
59.9
%
39.8
%
22.3
%
8.2% 14
.4%
5.8%
70.3
%
56.2
%
20.2
% 31.5
%
11.7
%
62.7
%
44.7
%
27.7
%
13.1
%
17.4
%
7.4%
57.4
%
38.8
%
21.9
%
5.0% 12
.0%
5.3%
3.9%
1.8%
-0.4
%-8
.3%
Nev
ada
Col
orad
oA
rkan
sas
New
Mex
ico
Mon
tana
Was
hing
ton
Cal
iforn
iaW
est V
irgin
iaO
rego
nRh
ode
Isla
ndN
ew H
amps
hire
Mar
ylan
dA
rizon
aA
lask
aN
ew Je
rsey
Loui
siana
Nor
th D
akot
aO
hio
Indi
ana
Mas
sach
uset
tsIo
wa
Penn
sylv
ania
Mic
higa
nM
inne
sota
Haw
aii
Illin
ois
New
Yor
kD
.C.
Del
awar
eVe
rmon
tTe
nnes
see
Nor
th C
arol
ina
Idah
oFl
orid
aM
issou
riG
eorg
iaSo
uth
Car
olin
aA
laba
ma
Kan
sas
Texa
sM
ississ
ippi
Virg
inia
Uta
hW
iscon
sinSo
uth
Dak
ota
Okl
ahom
aN
ebra
ska
Wyo
min
g
States that Expanded Medicaid under ACA*
States that Did Not Expand Medicaid under ACA*
120%
100%
-20%
0%
20%
40%
60%
80%
% Change from the Pre-ACA Summer 2013 to the Post-ACA December 2016 Source: Centers for Medicare & Medicaid Services
*Pre-ACA data for Connecticut not available *Pre-ACA data for Maine not available
KEY STATISTICS
RECENT OR FUTURE CHANGES
CUMULATIVE MEDICAID/CHIP ENROLLMENT CHANGE PRE-ACA AND POST-ACA BY STATE
Medicaid/CHIP Enrollment Medicaid Spending
Federal Medical Assistance
NEMT Expense Classification
NEMT Operating Facts
Managed Care Enrollment
69,980
94,681
010,00020,00030,00040,00050,00060,00070,00080,00090,000
100,000
Pre-ACA(July–Sept. 2013)
Post-ACA(Dec. 2016)
North Dakota decided to adopt the Medicaid expansion under the ACA.
Monthly Average + 35.3%
Page 74

OHIOIn-House ManagementManaged Care OrganizationStatewide BrokerRegional Broker
NEMT Assurance under the State Medicaid Plan1902(a)(70) State Plan AmendmentFederal Section 1115 Demonstration WaiverFederal Section 1915(b) Freedom-of-Choice Waiver
11.6 Million
1,705People
per Sq. Mile
Urban
Rural
107.4People
per Sq. Mile
Source: U.S. Census 2010
Source: U.S. Census 2015 5-Year Estimates
Below PovertyThe individual income is less than the official poverty threshold.
Source: U.S. Census 2015 5-Year Estimates
Live in Urbanized Areasof 50,000 or more people in Census 2010.
Source: U.S. Census 2010
15%
65%
March 2017
The Ohio Department of Medicaid has overall respon-sibility for overseeing the state’s Medicaid program. However, the actual management of NEMT services has been delegated to the Department of Jobs and Family Services (DJFS), which has a decentralized structure. Actual NEMT services are handled at the local level by county DJFS offices. As a result, each county operates its own unique program. Some counties contract with a network of public and private transportation agencies and negotiate special rates for NEMT services. In Hamilton County, for example, the local DJFS office has contracted with a national broker, MTM.
Ohio’s NEMT program recognizes two levels of public transit service—fare rate and premium rate. The fare rate is simply the same price the general public pays for a ride. County DJFSs are encouraged to buy and distribute bus passes and tokens. But state policy also recognizes that some recipients and trips may require a higher level of service, and so local DJFS offices can negotiate with public transit systems for a premium rate for premium service, which could be significantly higher than the fare rate, up to the fully allocated cost of providing the trip.
DEMOGRAPHICS
OPERATING AUTHORITYNEMT MODEL
Population Density
State Population
FTA Region 5
CMS Region 5
Page 75
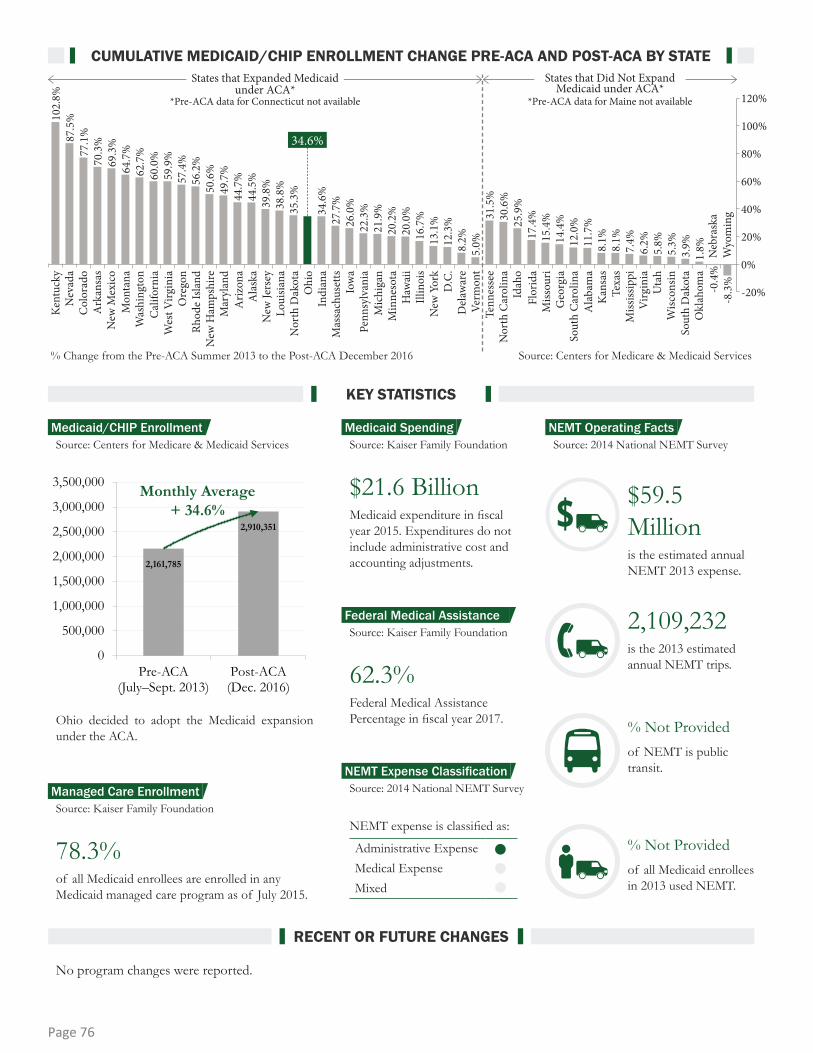
Administrative ExpenseMedical ExpenseMixed
No program changes were reported.
NEMT expense is classified as:
62.3% Federal Medical Assistance Percentage in fiscal year 2017.
78.3% of all Medicaid enrollees are enrolled in any Medicaid managed care program as of July 2015.
$21.6 Billion Medicaid expenditure in fiscal year 2015. Expenditures do not include administrative cost and accounting adjustments.
$59.5Millionis the estimated annual NEMT 2013 expense.
2,109,232is the 2013 estimated annual NEMT trips.
% Not Providedof all Medicaid enrollees in 2013 used NEMT.
% Not Providedof NEMT is public transit.
Source: Centers for Medicare & Medicaid Services Source: 2014 National NEMT Survey
Source: Kaiser Family Foundation
Source: Kaiser Family Foundation
Source: Kaiser Family Foundation
Source: 2014 National NEMT Survey
34.6%
Kent
ucky
102.
8%87
.5%
69.3
%
50.6
%
20.0
% 30.6
%
8.1%
60.0
%
44.5
%
26.0
%
12.3
%
15.4
%
6.2%
77.1
%
64.7
%
49.7
%
34.6
%
16.7
% 25.9
%
8.1%
59.9
%
39.8
%
22.3
%
8.2% 14
.4%
5.8%
70.3
%
56.2
%
35.3
%
20.2
% 31.5
%
11.7
%
62.7
%
44.7
%
27.7
%
13.1
%
17.4
%
7.4%
57.4
%
38.8
%
21.9
%
5.0% 12
.0%
5.3%
3.9%
1.8%
-0.4
%-8
.3%
Nev
ada
Col
orad
oA
rkan
sas
New
Mex
ico
Mon
tana
Was
hing
ton
Cal
iforn
iaW
est V
irgin
iaO
rego
nRh
ode
Isla
ndN
ew H
amps
hire
Mar
ylan
dA
rizon
aA
lask
aN
ew Je
rsey
Loui
siana
Nor
th D
akot
aO
hio
Indi
ana
Mas
sach
uset
tsIo
wa
Penn
sylv
ania
Mic
higa
nM
inne
sota
Haw
aii
Illin
ois
New
Yor
kD
.C.
Del
awar
eVe
rmon
tTe
nnes
see
Nor
th C
arol
ina
Idah
oFl
orid
aM
issou
riG
eorg
iaSo
uth
Car
olin
aA
laba
ma
Kan
sas
Texa
sM
ississ
ippi
Virg
inia
Uta
hW
iscon
sinSo
uth
Dak
ota
Okl
ahom
aN
ebra
ska
Wyo
min
g
States that Expanded Medicaid under ACA*
States that Did Not Expand Medicaid under ACA*
120%
100%
-20%
0%
20%
40%
60%
80%
% Change from the Pre-ACA Summer 2013 to the Post-ACA December 2016 Source: Centers for Medicare & Medicaid Services
*Pre-ACA data for Connecticut not available *Pre-ACA data for Maine not available
KEY STATISTICS
RECENT OR FUTURE CHANGES
CUMULATIVE MEDICAID/CHIP ENROLLMENT CHANGE PRE-ACA AND POST-ACA BY STATE
Medicaid/CHIP Enrollment Medicaid Spending
Federal Medical Assistance
NEMT Expense Classification
NEMT Operating Facts
Managed Care Enrollment
2,161,785
2,910,351
0
500,000
1,000,000
1,500,000
2,000,000
2,500,000
3,000,000
3,500,000
Pre-ACA(July–Sept. 2013)
Post-ACA(Dec. 2016)
Ohio decided to adopt the Medicaid expansion under the ACA.
Monthly Average + 34.6%
Page 76

OKLAHOMAIn-House ManagementManaged Care OrganizationStatewide BrokerRegional Broker
NEMT Assurance under the State Medicaid Plan1902(a)(70) State Plan AmendmentFederal Section 1115 Demonstration WaiverFederal Section 1915(b) Freedom-of-Choice Waiver
3.9 Million
1,314People
per Sq. Mile
Urban
Rural
30People
per Sq. Mile
Source: U.S. Census 2010
Source: U.S. Census 2015 5-Year Estimates
Below PovertyThe individual income is less than the official poverty threshold.
Source: U.S. Census 2015 5-Year Estimates
Live in Urbanized Areasof 50,000 or more people in Census 2010.
Source: U.S. Census 2010
16%46%
Oklahoma’s SoonerRide program is managed by the Oklahoma Health Care Authority. For more than a decade, the state has had a statewide NEMT brokerage program. In early 1999, Tulsa Transit began operating as a statewide broker under an arrangement with the state. Tulsa Transit contracted with rural and community transit providers throughout Oklahoma. The arrangement was changed to a conventional risk-based broker model in 2002. Since 2002, a for-profit national
company has operated the statewide brokerage for SoonerRide.
When the national broker was awarded the brokerage contract, local community transportation providers and public transportation providers formed a modified bargaining group for negotiating trip fees with the broker.
March 2017
DEMOGRAPHICS
OPERATING AUTHORITYNEMT MODEL
Population Density
State Population
FTA Region 6
CMS Region 6
Page 77
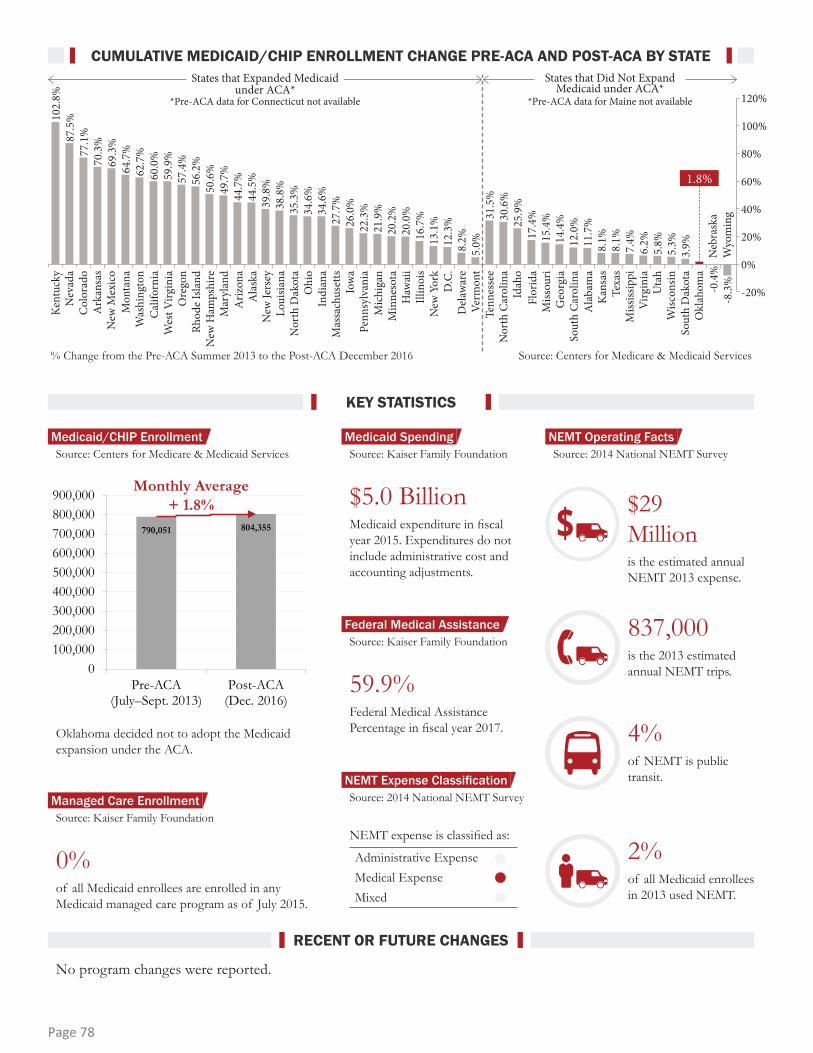
Administrative ExpenseMedical ExpenseMixed
No program changes were reported.
NEMT expense is classified as:
59.9% Federal Medical Assistance Percentage in fiscal year 2017.
0% of all Medicaid enrollees are enrolled in any Medicaid managed care program as of July 2015.
$5.0 Billion Medicaid expenditure in fiscal year 2015. Expenditures do not include administrative cost and accounting adjustments.
$29Millionis the estimated annual NEMT 2013 expense.
837,000is the 2013 estimated annual NEMT trips.
2% of all Medicaid enrollees in 2013 used NEMT.
4%of NEMT is public transit.
Source: Centers for Medicare & Medicaid Services Source: 2014 National NEMT Survey
Source: Kaiser Family Foundation
Source: Kaiser Family Foundation
Source: Kaiser Family Foundation
Source: 2014 National NEMT Survey
1.8%
Kent
ucky
102.
8%87
.5%
69.3
%
50.6
%
34.6
%
20.0
% 30.6
%
8.1%
60.0
%
44.5
%
26.0
%
12.3
%
15.4
%
6.2%
77.1
%
64.7
%
49.7
%
34.6
%
16.7
% 25.9
%
8.1%
59.9
%
39.8
%
22.3
%
8.2% 14
.4%
5.8%
70.3
%
56.2
%
35.3
%
20.2
% 31.5
%
11.7
%
62.7
%
44.7
%
27.7
%
13.1
%
17.4
%
7.4%
57.4
%
38.8
%
21.9
%
5.0% 12
.0%
5.3%
3.9%
-0.4
%-8
.3%
Nev
ada
Col
orad
oA
rkan
sas
New
Mex
ico
Mon
tana
Was
hing
ton
Cal
iforn
iaW
est V
irgin
iaO
rego
nRh
ode
Isla
ndN
ew H
amps
hire
Mar
ylan
dA
rizon
aA
lask
aN
ew Je
rsey
Loui
siana
Nor
th D
akot
aO
hio
Indi
ana
Mas
sach
uset
tsIo
wa
Penn
sylv
ania
Mic
higa
nM
inne
sota
Haw
aii
Illin
ois
New
Yor
kD
.C.
Del
awar
eVe
rmon
tTe
nnes
see
Nor
th C
arol
ina
Idah
oFl
orid
aM
issou
riG
eorg
iaSo
uth
Car
olin
aA
laba
ma
Kan
sas
Texa
sM
ississ
ippi
Virg
inia
Uta
hW
iscon
sinSo
uth
Dak
ota
Okl
ahom
aN
ebra
ska
Wyo
min
g
States that Expanded Medicaid under ACA*
States that Did Not Expand Medicaid under ACA*
120%
100%
-20%
0%
20%
40%
60%
80%
% Change from the Pre-ACA Summer 2013 to the Post-ACA December 2016 Source: Centers for Medicare & Medicaid Services
*Pre-ACA data for Connecticut not available *Pre-ACA data for Maine not available
790,051 804,355
0100,000200,000300,000400,000500,000600,000700,000800,000900,000
Pre-ACA(July–Sept. 2013)
Post-ACA(Dec. 2016)
Oklahoma decided not to adopt the Medicaid expansion under the ACA.
Monthly Average + 1.8%
KEY STATISTICS
RECENT OR FUTURE CHANGES
CUMULATIVE MEDICAID/CHIP ENROLLMENT CHANGE PRE-ACA AND POST-ACA BY STATE
Medicaid/CHIP Enrollment Medicaid Spending
Federal Medical Assistance
NEMT Expense Classification
NEMT Operating Facts
Managed Care Enrollment
Page 78

In-House ManagementManaged Care OrganizationStatewide BrokerRegional Broker
OREGONNEMT Assurance under the State Medicaid Plan1902(a)(70) State Plan AmendmentFederal Section 1115 Demonstration WaiverFederal Section 1915(b) Freedom-of-Choice Waiver
3.9 Million
2,163People
per Sq. Mile
Urban
Rural
15.1People
per Sq. Mile
Source: U.S. Census 2010
Source: U.S. Census 2015 5-Year Estimates
Below PovertyThe individual income is less than the official poverty threshold.
Source: U.S. Census 2015 5-Year Estimates
Live in Urbanized Areasof 50,000 or more people in Census 2010.
Source: U.S. Census 2010
15%62%
Oregon was the second state in the nation to introduce a regional community brokerage model between 1994 and 2001. The Oregon Division of Medical Assistance Programs borrowed heavily from its neighbor, Washington State. The Oregon NEMT program was created under a Section 1915(b) Freedom-of-Choice Waiver. Eight community brokers operated in as many regions. All of the regional brokers were public entities, and the majority of the regional brokers were public transportation providers.
In 2013, Oregon changed Medicaid to a managed care model—called coordinated care organizations (CCOs)
under a Section 1115 Demonstration Waiver. Ninety-three percent of Medicaid recipients are enrolled in one of the 16 CCOs that contract with 11 brokers to provide NEMT service. The NEMT brokers are represented by three public transit agencies, three councils of governments, and five private companies. CCOs have different approaches to providing NEMT, and some have overlapping service areas.
For Medicaid recipients not enrolled in a CCO, the state contracts with brokers through fee-for-service contracts to provide NEMT.
March 2017
DEMOGRAPHICS
OPERATING AUTHORITYNEMT MODEL
Population Density
State Population
FTA Region 10
CMS Region 10
Page 79
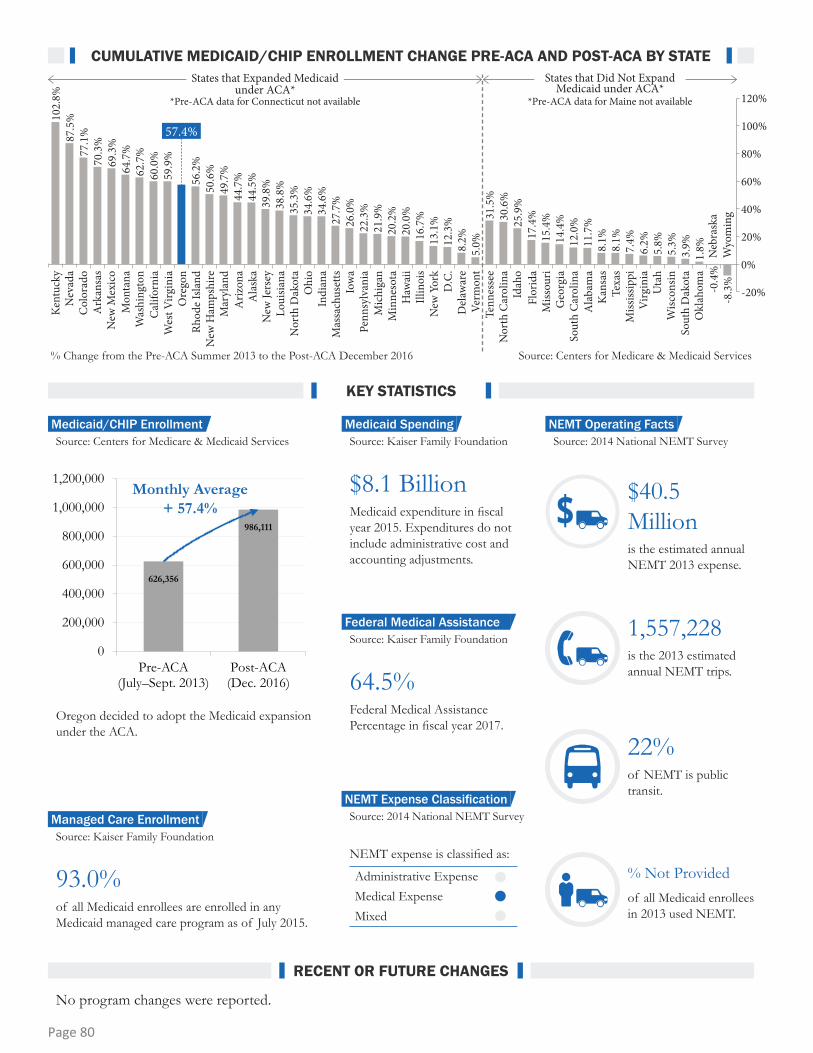
Administrative ExpenseMedical ExpenseMixed
626,356
986,111
0
200,000
400,000
600,000
800,000
1,000,000
1,200,000
Pre-ACA(July–Sept. 2013)
Post-ACA(Dec. 2016)
No program changes were reported.
NEMT expense is classified as:
64.5% Federal Medical Assistance Percentage in fiscal year 2017.
93.0% of all Medicaid enrollees are enrolled in any Medicaid managed care program as of July 2015.
$8.1 Billion Medicaid expenditure in fiscal year 2015. Expenditures do not include administrative cost and accounting adjustments.
Oregon decided to adopt the Medicaid expansion under the ACA.
$40.5 Millionis the estimated annual NEMT 2013 expense.
1,557,228is the 2013 estimated annual NEMT trips.
% Not Provided of all Medicaid enrollees in 2013 used NEMT.
22%of NEMT is public transit.
Source: Centers for Medicare & Medicaid Services Source: 2014 National NEMT Survey
Source: Kaiser Family Foundation
Source: Kaiser Family Foundation
Source: Kaiser Family Foundation
Source: 2014 National NEMT Survey
57.4%
Kent
ucky
102.
8%87
.5%
69.3
%
50.6
%
34.6
%
20.0
% 30.6
%
8.1%
60.0
%
44.5
%
26.0
%
12.3
%
15.4
%
6.2%
77.1
%
64.7
%
49.7
%
34.6
%
16.7
% 25.9
%
8.1%
59.9
%
39.8
%
22.3
%
8.2% 14
.4%
5.8%
70.3
%
56.2
%
35.3
%
20.2
% 31.5
%
11.7
%
62.7
%
44.7
%
27.7
%
13.1
%
17.4
%
7.4%
38.8
%
21.9
%
5.0% 12
.0%
5.3%
3.9%
1.8%
-0.4
%-8
.3%
Nev
ada
Col
orad
oA
rkan
sas
New
Mex
ico
Mon
tana
Was
hing
ton
Cal
iforn
iaW
est V
irgin
iaO
rego
nRh
ode
Isla
ndN
ew H
amps
hire
Mar
ylan
dA
rizon
aA
lask
aN
ew Je
rsey
Loui
siana
Nor
th D
akot
aO
hio
Indi
ana
Mas
sach
uset
tsIo
wa
Penn
sylv
ania
Mic
higa
nM
inne
sota
Haw
aii
Illin
ois
New
Yor
kD
.C.
Del
awar
eVe
rmon
tTe
nnes
see
Nor
th C
arol
ina
Idah
oFl
orid
aM
issou
riG
eorg
iaSo
uth
Car
olin
aA
laba
ma
Kan
sas
Texa
sM
ississ
ippi
Virg
inia
Uta
hW
iscon
sinSo
uth
Dak
ota
Okl
ahom
aN
ebra
ska
Wyo
min
g
States that Expanded Medicaid under ACA*
States that Did Not Expand Medicaid under ACA*
120%
100%
-20%
0%
20%
40%
60%
80%
% Change from the Pre-ACA Summer 2013 to the Post-ACA December 2016 Source: Centers for Medicare & Medicaid Services
*Pre-ACA data for Connecticut not available *Pre-ACA data for Maine not available
KEY STATISTICS
RECENT OR FUTURE CHANGES
CUMULATIVE MEDICAID/CHIP ENROLLMENT CHANGE PRE-ACA AND POST-ACA BY STATE
Medicaid/CHIP Enrollment Medicaid Spending
Federal Medical Assistance
NEMT Expense Classification
NEMT Operating Facts
Managed Care Enrollment
Monthly Average + 57.4%
Page 80

PENNSYLVANIAIn-House ManagementManaged Care OrganizationStatewide BrokerRegional Broker
NEMT Assurance under the State Medicaid Plan1902(a)(70) State Plan AmendmentFederal Section 1115 Demonstration WaiverFederal Section 1915(b) Freedom-of-Choice Waiver
12.8 Million
1,908People
per Sq. Mile
Urban
Rural
91.5People
per Sq. Mile
Source: U.S. Census 2010
Source: U.S. Census 2015 5-Year Estimates
Below PovertyThe individual income is less than the official poverty threshold.
Source: U.S. Census 2015 5-Year Estimates
Live in Urbanized Areasof 50,000 or more people in Census 2010.
Source: U.S. Census 2010
13%71%
Pennsylvania’s Medical Assistance Transportation Program (MATP) is the third largest (in expenditures) in the country but provides transportation assurance for more than twice the number of medical trips of any other state. MATP in Pennsylvania is a hybrid model. In the state’s largest county, Philadelphia County, the MATP model is a full-risk, capitated broker. The current broker is Logisticare. In the
rest of the state, the MATP model is a county-run fee-for-service program.
The Pennsylvania Department of Human Services has explored changing NEMT models, including a statewide brokerage or carving NEMT services into managed care contracts. No change in NEMT has been announced.
March 2018
DEMOGRAPHICS
OPERATING AUTHORITYNEMT MODEL
Population Density
State Population
FTA Region 3
CMS Region 3
Page 81

Administrative ExpenseMedical ExpenseMixed
While the number of medical trips provided by the Philadelphia broker roughly equals the number provided in the entire rest of the state, the brokerage accounts for less than 30 percent of annual NEMT expenditures, reflecting the cost-effectiveness of having access to and
using public bus and rail services to transport Medicaid clients. In every other county in Pennsylvania, the provision of shared ride NEMT service is coordinated with other human services and state-funded paratransit.
NEMT expense is classified as:
51.8% Federal Medical Assistance Percentage in fiscal year 2017.
70.0% of all Medicaid enrollees are enrolled in any Medicaid managed care program as of July 2015.
$23.4 Billion Medicaid expenditure in fiscal year 2015. Expenditures do not include administrative cost and accounting adjustments.
$148.6 Millionis the estimated annual NEMT 2013 expense.
11,468,394is the 2013 estimated annual NEMT trips.
7.2% of all Medicaid enrollees in 2013 used NEMT.
41%of NEMT is public transit.
Source: Centers for Medicare & Medicaid Services Source: 2014 National NEMT Survey
Source: Kaiser Family Foundation
Source: Kaiser Family Foundation
Source: Kaiser Family Foundation
Source: 2014 National NEMT Survey
22.3%
Kent
ucky
102.
8%87
.5%
69.3
%
50.6
%
34.6
%
20.0
% 30.6
%
8.1%
60.0
%
44.5
%
26.0
%
12.3
%
15.4
%
6.2%
77.1
%
64.7
%
49.7
%
34.6
%
16.7
% 25.9
%
8.1%
59.9
%
39.8
%
8.2% 14
.4%
5.8%
70.3
%
56.2
%
35.3
%
20.2
% 31.5
%
11.7
%
62.7
%
44.7
%
27.7
%
13.1
%
17.4
%
7.4%
57.4
%
38.8
%
21.9
%
5.0% 12
.0%
5.3%
3.9%
1.8%
-0.4
%-8
.3%
Nev
ada
Col
orad
oA
rkan
sas
New
Mex
ico
Mon
tana
Was
hing
ton
Cal
iforn
iaW
est V
irgin
iaO
rego
nRh
ode
Isla
ndN
ew H
amps
hire
Mar
ylan
dA
rizon
aA
lask
aN
ew Je
rsey
Loui
siana
Nor
th D
akot
aO
hio
Indi
ana
Mas
sach
uset
tsIo
wa
Penn
sylv
ania
Mic
higa
nM
inne
sota
Haw
aii
Illin
ois
New
Yor
kD
.C.
Del
awar
eVe
rmon
tTe
nnes
see
Nor
th C
arol
ina
Idah
oFl
orid
aM
issou
riG
eorg
iaSo
uth
Car
olin
aA
laba
ma
Kan
sas
Texa
sM
ississ
ippi
Virg
inia
Uta
hW
iscon
sinSo
uth
Dak
ota
Okl
ahom
aN
ebra
ska
Wyo
min
g
States that Expanded Medicaid under ACA*
States that Did Not Expand Medicaid under ACA*
120%
100%
-20%
0%
20%
40%
60%
80%
% Change from the Pre-ACA Summer 2013 to the Post-ACA December 2016 Source: Centers for Medicare & Medicaid Services
*Pre-ACA data for Connecticut not available *Pre-ACA data for Maine not available
KEY STATISTICS
RECENT OR FUTURE CHANGES
CUMULATIVE MEDICAID/CHIP ENROLLMENT CHANGE PRE-ACA AND POST-ACA BY STATE
Medicaid/CHIP Enrollment Medicaid Spending
Federal Medical Assistance
NEMT Expense Classification
NEMT Operating Facts
Managed Care Enrollment
2,386,046
2,918,260
0
500,000
1,000,000
1,500,000
2,000,000
2,500,000
3,000,000
3,500,000
Pre-ACA(July–Sept. 2013)
Post-ACA(Dec. 2016)
Pennsylvania decided to adopt the Medicaid expansion under the ACA.
Monthly Average + 22.3%
Page 82

RHODE ISLANDIn-House ManagementManaged Care OrganizationStatewide BrokerRegional Broker
NEMT Assurance under the State Medicaid Plan1902(a)(70) State Plan AmendmentFederal Section 1115 Demonstration WaiverFederal Section 1915(b) Freedom-of-Choice Waiver
1.1 Million
2,376People
per Sq. Mile
Urban
Rural
157.6People
per Sq. Mile
Source: U.S. Census 2010
Source: U.S. Census 2015 5-Year Estimates
Below PovertyThe individual income is less than the official poverty threshold.
Source: U.S. Census 2015 5-Year Estimates
Live in Urbanized Areasof 50,000 or more people in Census 2010.
Source: U.S. Census 2010
14%90%
In the 1990s, Rhode Island’s Executive Office of Health and Human Services (EOHHS) required nearly all Medicaid recipients in the state to enroll in one of five health plans. Under the carved-in model of the RIte Care initiative, NEMT services were included in the responsibilities assumed by Medicaid managed care organizations. In an unusual arrangement—with the agreement of the state—all five participating health plans jointly contracted with the Rhode Island Public Transit Authority (RIPTA) to serve as a statewide NEMT broker. Since the creation of the RIte Care
program, public transportation has been the default transportation service.
RIPTA’s management of the state’s NEMT program produced a high volume of trips provided by public transit. According to EOHHS’s published information, under RIPTA, 78 percent of all Medicaid trips were provided on fixed-route public transit, most paid for with bus passes. As a result, Rhode Island’s average cost per NEMT trip today is still the lowest in the nation—just a little over $5.
March 2017
DEMOGRAPHICS
OPERATING AUTHORITYNEMT MODEL
Population Density
State Population
FTA Region 1
CMS Region 1
Page 83

Administrative ExpenseMedical ExpenseMixed
Today, RIPTA no longer serves as the broker in Rhode Island. CMS challenged RIPTA’s widespread use and distribution of bus passes to Medicaid recipients. As a part of reforms adopted in the RIte Care program, responsibility for providing NEMT services has been withdrawn from the MCOs and returned to
the state. Beginning in May 2014, LogistiCare began operations as EOHHS’s statewide contract broker of NEMT services. According to the state’s NEMT program coordinator, the broker will coordinate transportation, including medical trips, under Rhode Island’s senior services program.
NEMT expense is classified as:
51.0% Federal Medical Assistance Percentage in fiscal year 2017.
87.7% of all Medicaid enrollees are enrolled in any Medicaid managed care program as of July 2015.
$2.6 Billion Medicaid expenditure in fiscal year 2015. Expenditures do not include administrative cost and accounting adjustments.
$22.3 Millionis the estimated annual NEMT 2013 expense.
4,400,000is the 2013 estimated annual NEMT trips.
% Not Provided of all Medicaid enrollees in 2013 used NEMT.
78%of NEMT is public transit.
Source: Centers for Medicare & Medicaid Services Source: 2014 National NEMT Survey
Source: Kaiser Family Foundation
Source: Kaiser Family Foundation
Source: Kaiser Family Foundation
Source: 2014 National NEMT Survey
56.2%
Kent
ucky
102.
8%87
.5%
69.3
%
50.6
%
34.6
%
20.0
% 30.6
%
8.1%
60.0
%
44.5
%
26.0
%
12.3
%
15.4
%
6.2%
77.1
%
64.7
%
49.7
%
34.6
%
16.7
% 25.9
%
8.1%
59.9
%
39.8
%
22.3
%
8.2% 14
.4%
5.8%
70.3
%
35.3
%
20.2
% 31.5
%
11.7
%
62.7
%
44.7
%
27.7
%
13.1
%
17.4
%
7.4%
57.4
%
38.8
%
21.9
%
5.0% 12
.0%
5.3%
3.9%
1.8%
-0.4
%-8
.3%
Nev
ada
Col
orad
oA
rkan
sas
New
Mex
ico
Mon
tana
Was
hing
ton
Cal
iforn
iaW
est V
irgin
iaO
rego
nRh
ode
Isla
ndN
ew H
amps
hire
Mar
ylan
dA
rizon
aA
lask
aN
ew Je
rsey
Loui
siana
Nor
th D
akot
aO
hio
Indi
ana
Mas
sach
uset
tsIo
wa
Penn
sylv
ania
Mic
higa
nM
inne
sota
Haw
aii
Illin
ois
New
Yor
kD
.C.
Del
awar
eVe
rmon
tTe
nnes
see
Nor
th C
arol
ina
Idah
oFl
orid
aM
issou
riG
eorg
iaSo
uth
Car
olin
aA
laba
ma
Kan
sas
Texa
sM
ississ
ippi
Virg
inia
Uta
hW
iscon
sinSo
uth
Dak
ota
Okl
ahom
aN
ebra
ska
Wyo
min
g
States that Expanded Medicaid under ACA*
States that Did Not Expand Medicaid under ACA*
120%
100%
-20%
0%
20%
40%
60%
80%
% Change from the Pre-ACA Summer 2013 to the Post-ACA December 2016 Source: Centers for Medicare & Medicaid Services
*Pre-ACA data for Connecticut not available *Pre-ACA data for Maine not available
KEY STATISTICS
RECENT OR FUTURE CHANGES
CUMULATIVE MEDICAID/CHIP ENROLLMENT CHANGE PRE-ACA AND POST-ACA BY STATE
Medicaid/CHIP Enrollment Medicaid Spending
Federal Medical Assistance
NEMT Expense Classification
NEMT Operating Facts
Managed Care Enrollment
190,833
298,148
0
50,000
100,000
150,000
200,000
250,000
300,000
350,000
Pre-ACA(July–Sept. 2013)
Post-ACA(Dec. 2016)
Rhode Island decided to adopt the Medicaid expansion under the ACA.
Monthly Average + 56.2%
Page 84
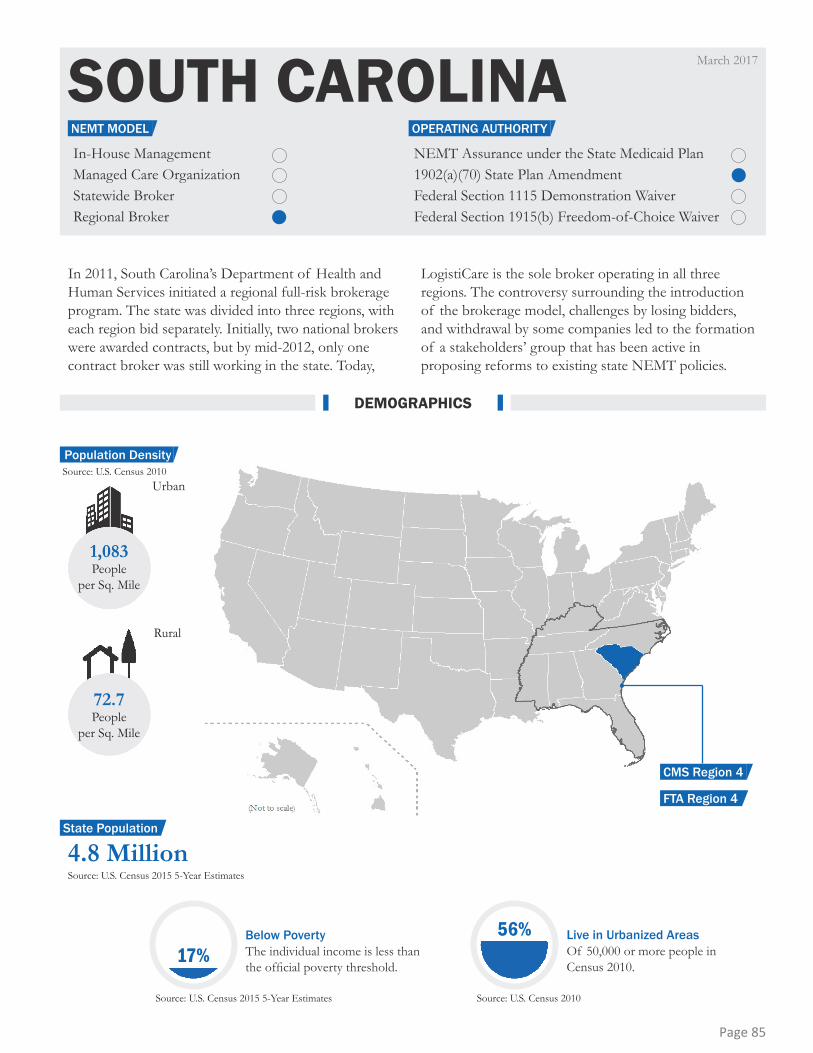
SOUTH CAROLINAIn-House ManagementManaged Care OrganizationStatewide BrokerRegional Broker
NEMT Assurance under the State Medicaid Plan1902(a)(70) State Plan AmendmentFederal Section 1115 Demonstration WaiverFederal Section 1915(b) Freedom-of-Choice Waiver
4.8 Million
1,083People
per Sq. Mile
Urban
Rural
72.7People
per Sq. Mile
Source: U.S. Census 2010
Source: U.S. Census 2015 5-Year Estimates
Below PovertyThe individual income is less than the official poverty threshold.
Source: U.S. Census 2015 5-Year Estimates
Live in Urbanized AreasOf 50,000 or more people in Census 2010.
Source: U.S. Census 2010
17%56%
In 2011, South Carolina’s Department of Health and Human Services initiated a regional full-risk brokerage program. The state was divided into three regions, with each region bid separately. Initially, two national brokers were awarded contracts, but by mid-2012, only one contract broker was still working in the state. Today,
LogistiCare is the sole broker operating in all three regions. The controversy surrounding the introduction of the brokerage model, challenges by losing bidders, and withdrawal by some companies led to the formation of a stakeholders’ group that has been active in proposing reforms to existing state NEMT policies.
March 2017
DEMOGRAPHICS
OPERATING AUTHORITYNEMT MODEL
Population Density
State Population
FTA Region 4
CMS Region 4
Page 85

Administrative ExpenseMedical ExpenseMixed
889,744996,551
0
200,000
400,000
600,000
800,000
1,000,000
1,200,000
Pre-ACA(July–Sept. 2013)
Post-ACA(Dec. 2016)
One of the proposals recommended by the stakeholders’ group included evaluating the efficiency and cost-effectiveness of carving in NEMT services and funding under the Department of Health and Human Services’ Medicaid managed care program. No program changes were reported..
NEMT expense is classified as:
71.3% Federal Medical Assistance Percentage in fiscal year 2017.
75.0% of all Medicaid enrollees are enrolled in any Medicaid managed care program as of July 2015.
$6.0 Billion Medicaid expenditure in fiscal year 2015. Expenditures do not include administrative cost and accounting adjustments.
South Carolina decided not to adopt the Medicaid expansion under the ACA.
$62 Millionis the estimated annual NEMT 2013 expense.
1,850,000is the 2013 estimated annual NEMT trips.
8% of all Medicaid enrollees in 2013 used NEMT.
<1% of NEMT is public transit.
Source: Centers for Medicare & Medicaid Services Source: 2014 National NEMT Survey
Source: Kaiser Family Foundation
Source: Kaiser Family Foundation
Source: Kaiser Family Foundation
Source: 2014 National NEMT Survey
12.0%
Kent
ucky
102.
8%87
.5%
69.3
%
50.6
%
34.6
%
20.0
% 30.6
%
8.1%
60.0
%
44.5
%
26.0
%
12.3
%
15.4
%
6.2%
77.1
%
64.7
%
49.7
%
34.6
%
16.7
% 25.9
%
8.1%
59.9
%
39.8
%
22.3
%
8.2% 14
.4%
5.8%
70.3
%
56.2
%
35.3
%
20.2
% 31.5
%
11.7
%
62.7
%
44.7
%
27.7
%
13.1
%
17.4
%
7.4%
57.4
%
38.8
%
21.9
%
5.0%
5.3%
3.9%
1.8%
-0.4
%-8
.3%
Nev
ada
Col
orad
oA
rkan
sas
New
Mex
ico
Mon
tana
Was
hing
ton
Cal
iforn
iaW
est V
irgin
iaO
rego
nRh
ode
Isla
ndN
ew H
amps
hire
Mar
ylan
dA
rizon
aA
lask
aN
ew Je
rsey
Loui
siana
Nor
th D
akot
aO
hio
Indi
ana
Mas
sach
uset
tsIo
wa
Penn
sylv
ania
Mic
higa
nM
inne
sota
Haw
aii
Illin
ois
New
Yor
kD
.C.
Del
awar
eVe
rmon
tTe
nnes
see
Nor
th C
arol
ina
Idah
oFl
orid
aM
issou
riG
eorg
iaSo
uth
Car
olin
aA
laba
ma
Kan
sas
Texa
sM
ississ
ippi
Virg
inia
Uta
hW
iscon
sinSo
uth
Dak
ota
Okl
ahom
aN
ebra
ska
Wyo
min
g
States that Expanded Medicaid under ACA*
States that Did Not Expand Medicaid under ACA*
120%
100%
-20%
0%
20%
40%
60%
80%
% Change from the Pre-ACA Summer 2013 to the Post-ACA December 2016 Source: Centers for Medicare & Medicaid Services
*Pre-ACA data for Connecticut not available *Pre-ACA data for Maine not available
KEY STATISTICS
RECENT OR FUTURE CHANGES
CUMULATIVE MEDICAID/CHIP ENROLLMENT CHANGE PRE-ACA AND POST-ACA BY STATE
Medicaid/CHIP Enrollment Medicaid Spending
Federal Medical Assistance
NEMT Expense Classification
NEMT Operating Facts
Managed Care Enrollment
Monthly Average + 12.0%
Page 86

South Dakota’s Department of Social Services operates a traditional fee-for-service NEMT model. Over 90 percent of NEMT trips are provided in privately owned vehicles. Under the current program, Medicaid recipients are reimbursed for mileage to medical appointments directly by Department of Social Services staff.
South Dakota’s investment in NEMT services is less than $2.5 million annually. The Department of Social Services reports relatively high use of NEMT services by Medicaid recipients —12.3 percent of all eligible recipients.
SOUTH DAKOTAIn-House ManagementManaged Care OrganizationStatewide BrokerRegional Broker
NEMT Assurance under the State Medicaid Plan1902(a)(70) State Plan AmendmentFederal Section 1115 Demonstration WaiverFederal Section 1915(b) Freedom-of-Choice Waiver
1,076People
per Sq. Mile
Urban
Rural
7.5People
per Sq. Mile
843 Thousand
Source: U.S. Census 2010
Source: U.S. Census 2015 5-Year Estimates
Below PovertyThe individual income is less than the official poverty threshold.
Source: U.S. Census 2015 5-Year Estimates
Live in Urbanized Areasof 50,000 or more people in Census 2010.
Source: U.S. Census 2010
March 2017
14% 30%
DEMOGRAPHICS
OPERATING AUTHORITYNEMT MODEL
Population Density
State PopulationFTA Region 8CMS Region 8
Page 87

No program changes were reported.
54.9% Federal Medical Assistance Percentage in fiscal year 2017.
0% of all Medicaid enrollees are enrolled in any Medicaid managed care program as of July 2015.
$813 Million Medicaid expenditure in fiscal year 2015. Expenditures do not include administrative cost and accounting adjustments.
South Dakota decided not to adopt the Medicaid expansion under the ACA.
$2.5 Millionis the estimated annual NEMT 2013 expense.
57,858is the 2013 estimated annual NEMT trips.
12.3% of all Medicaid enrollees in 2013 used NEMT.
0.5%of NEMT is public transit.
Source: Centers for Medicare & Medicaid Services Source: 2014 National NEMT Survey
Source: Kaiser Family Foundation
Source: Kaiser Family Foundation
Source: Kaiser Family Foundation
Source: 2014 National NEMT Survey
Administrative ExpenseMedical ExpenseMixed
NEMT expense is classified as:
NEMT Expense Classification
Kent
ucky
102.
8%87
.5%
69.3
%
50.6
%
34.6
%
20.0
% 30.6
%
8.1%
60.0
%
44.5
%
26.0
%
12.3
%
15.4
%
6.2%
77.1
%
64.7
%
49.7
%
34.6
%
16.7
% 25.9
%
8.1%
59.9
%
39.8
%
22.3
%
8.2% 14
.4%
5.8%
70.3
%
56.2
%
35.3
%
20.2
% 31.5
%
11.7
%
62.7
%
44.7
%
27.7
%
13.1
%
17.4
%
7.4%
57.4
%
38.8
%
21.9
%
5.0% 12
.0%
5.3%
1.8%
-0.4
%-8
.3%
Nev
ada
Col
orad
oA
rkan
sas
New
Mex
ico
Mon
tana
Was
hing
ton
Cal
iforn
iaW
est V
irgin
iaO
rego
nRh
ode
Isla
ndN
ew H
amps
hire
Mar
ylan
dA
rizon
aA
lask
aN
ew Je
rsey
Loui
siana
Nor
th D
akot
aO
hio
Indi
ana
Mas
sach
uset
tsIo
wa
Penn
sylv
ania
Mic
higa
nM
inne
sota
Haw
aii
Illin
ois
New
Yor
kD
.C.
Del
awar
eVe
rmon
tTe
nnes
see
Nor
th C
arol
ina
Idah
oFl
orid
aM
issou
riG
eorg
iaSo
uth
Car
olin
aA
laba
ma
Kan
sas
Texa
sM
ississ
ippi
Virg
inia
Uta
hW
iscon
sinSo
uth
Dak
ota
Okl
ahom
aN
ebra
ska
Wyo
min
g
States that Expanded Medicaid under ACA*
States that Did Not Expand Medicaid under ACA*
120%
100%
-20%
0%
20%
40%
60%
80%
% Change from the Pre-ACA Summer 2013 to the Post-ACA December 2016 Source: Centers for Medicare & Medicaid Services
*Pre-ACA data for Connecticut not available *Pre-ACA data for Maine not available
3.9%
115,501 119,956
0
20,000
40,000
60,000
80,000
100,000
120,000
140,000
Pre-ACA(July–Sept. 2013)
Post-ACA(Dec. 2016)
KEY STATISTICS
RECENT OR FUTURE CHANGES
CUMULATIVE MEDICAID/CHIP ENROLLMENT CHANGE PRE-ACA AND POST-ACA BY STATE
Medicaid/CHIP Enrollment Medicaid Spending
Federal Medical Assistance
NEMT Operating Facts
Managed Care Enrollment
Monthly Average + 3.9%
Page 88

TENNESSEEIn-House ManagementManaged Care OrganizationStatewide BrokerRegional Broker
NEMT Assurance under the State Medicaid Plan1902(a)(70) State Plan AmendmentFederal Section 1115 Demonstration WaiverFederal Section 1915(b) Freedom-of-Choice Waiver
6.5 Million
1,188People
per Sq. Mile
Urban
Rural
74.2People
per Sq. Mile
Source: U.S. Census 2010
Source: U.S. Census 2015 5-Year Estimates
Below PovertyThe individual income is less than the official poverty threshold.
Source: U.S. Census 2015 5-Year Estimates
Live in Urbanized Areasof 50,000 or more people in Census 2010.
Source: U.S. Census 2010
17%54%
Tennessee has adopted a mandatory managed care model for serving its Medicaid population, with NEMT responsibility carved in to state contracts with participating health plans. TennCare was created in 1994 under a federal Section 1115 Demonstration Waiver. Tennessee claims to be the only state in the nation that enrolls 100 percent of its Medicaid population in a managed care plan.
In 2006, TennCare introduced a transportation brokerage feature into its NEMT program. Citing that the former approach had been fragmented and
inefficient, the state now requires each of its three participating managed care organizations to employ a transportation broker to manage all NEMT services provided to their Medicaid enrollees. In June 2013, the three transportation brokers employed under the TennCare program included one nonprofit human service agency, one Memphis-based private transportation company, and one out-of-state transportation broker.
March 2017
DEMOGRAPHICS
OPERATING AUTHORITYNEMT MODEL
Population Density
State Population
FTA Region 4
CMS Region 4
Page 89

Administrative ExpenseMedical ExpenseMixed
1,244,516
1,636,770
0200,000400,000600,000800,000
1,000,0001,200,0001,400,0001,600,0001,800,000
Pre-ACA(July–Sept. 2013)
Post-ACA(Dec. 2016)
No program changes were reported.
NEMT expense is classified as:
65% Federal Medical Assistance Percentage in fiscal year 2017.
100% of all Medicaid enrollees are enrolled in any Medicaid managed care program as of July 2015.
$9.2 Billion Medicaid expenditure in fiscal year 2015. Expenditures do not include administrative cost and accounting adjustments.
Tennessee decided not to adopt the Medicaid expansion under the ACA.
$68Millionis the estimated annual NEMT 2013 expense.
1,467,000is the 2013 estimated annual NEMT trips.
6.6%of all Medicaid enrollees in 2013 used NEMT.
1.4%of NEMT is public transit.
Source: Centers for Medicare & Medicaid Services Source: 2014 National NEMT Survey
Source: Kaiser Family Foundation
Source: Kaiser Family Foundation
Source: Kaiser Family Foundation
Source: 2014 National NEMT Survey
31.5%
Kent
ucky
102.
8%87
.5%
69.3
%
50.6
%
34.6
%
20.0
% 30.6
%
8.1%
60.0
%
44.5
%
26.0
%
12.3
%
15.4
%
6.2%
77.1
%
64.7
%
49.7
%
34.6
%
16.7
% 25.9
%
8.1%
59.9
%
39.8
%
22.3
%
8.2% 14
.4%
5.8%
70.3
%
56.2
%
35.3
%
20.2
%
11.7
%
62.7
%
44.7
%
27.7
%
13.1
%
17.4
%
7.4%
57.4
%
38.8
%
21.9
%
5.0% 12
.0%
5.3%
3.9%
1.8%
-0.4
%-8
.3%
Nev
ada
Col
orad
oA
rkan
sas
New
Mex
ico
Mon
tana
Was
hing
ton
Cal
iforn
iaW
est V
irgin
iaO
rego
nRh
ode
Isla
ndN
ew H
amps
hire
Mar
ylan
dA
rizon
aA
lask
aN
ew Je
rsey
Loui
siana
Nor
th D
akot
aO
hio
Indi
ana
Mas
sach
uset
tsIo
wa
Penn
sylv
ania
Mic
higa
nM
inne
sota
Haw
aii
Illin
ois
New
Yor
kD
.C.
Del
awar
eVe
rmon
tTe
nnes
see
Nor
th C
arol
ina
Idah
oFl
orid
aM
issou
riG
eorg
iaSo
uth
Car
olin
aA
laba
ma
Kan
sas
Texa
sM
ississ
ippi
Virg
inia
Uta
hW
iscon
sinSo
uth
Dak
ota
Okl
ahom
aN
ebra
ska
Wyo
min
g
States that Expanded Medicaid under ACA*
States that Did Not Expand Medicaid under ACA*
120%
100%
-20%
0%
20%
40%
60%
80%
% Change from the Pre-ACA Summer 2013 to the Post-ACA December 2016 Source: Centers for Medicare & Medicaid Services
*Pre-ACA data for Connecticut not available *Pre-ACA data for Maine not available
KEY STATISTICS
RECENT OR FUTURE CHANGES
CUMULATIVE MEDICAID/CHIP ENROLLMENT CHANGE PRE-ACA AND POST-ACA BY STATE
Medicaid/CHIP Enrollment Medicaid Spending
Federal Medical Assistance
NEMT Expense Classification
NEMT Operating Facts
Managed Care Enrollment
Monthly Average + 31.5%
Page 90
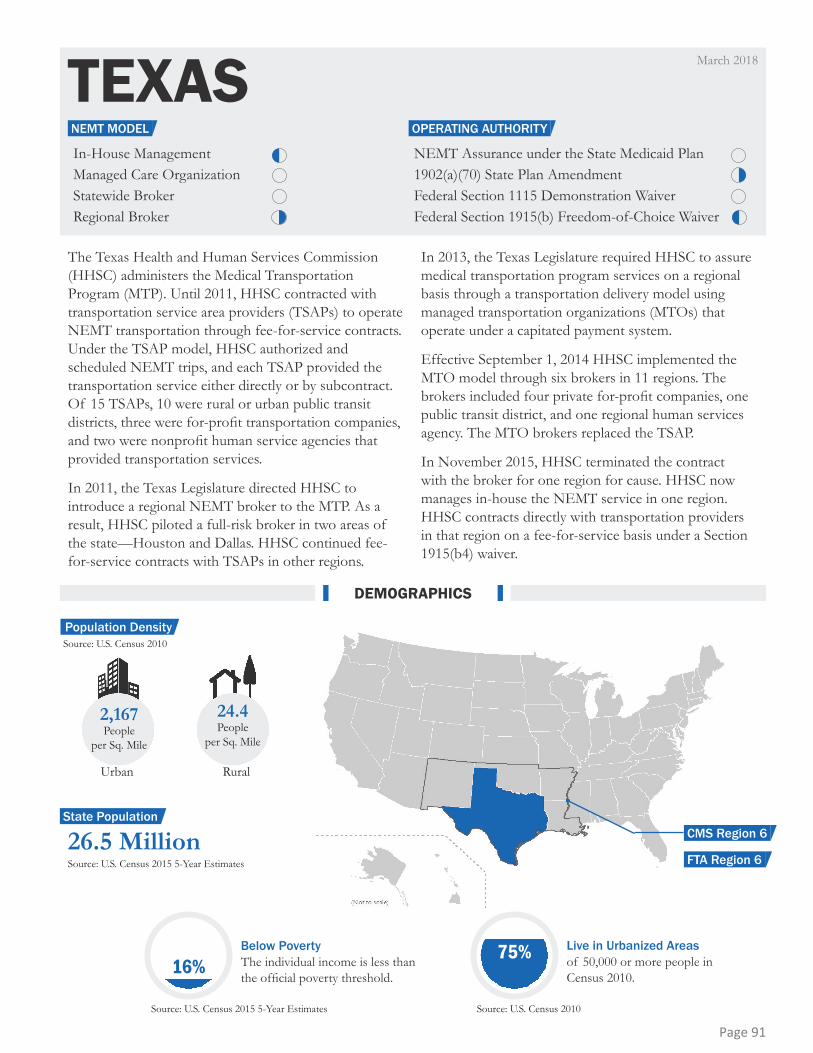
TEXASIn-House ManagementManaged Care OrganizationStatewide BrokerRegional Broker
NEMT Assurance under the State Medicaid Plan1902(a)(70) State Plan AmendmentFederal Section 1115 Demonstration WaiverFederal Section 1915(b) Freedom-of-Choice Waiver
26.5 Million
2,167People
per Sq. Mile
Urban Rural
24.4People
per Sq. Mile
Source: U.S. Census 2010
Source: U.S. Census 2015 5-Year Estimates
Below PovertyThe individual income is less than the official poverty threshold.
Source: U.S. Census 2015 5-Year Estimates
Live in Urbanized Areasof 50,000 or more people in Census 2010.
Source: U.S. Census 2010
16%75%
March 2018
The Texas Health and Human Services Commission (HHSC) administers the Medical Transportation Program (MTP). Until 2011, HHSC contracted with transportation service area providers (TSAPs) to operate NEMT transportation through fee-for-service contracts. Under the TSAP model, HHSC authorized and scheduled NEMT trips, and each TSAP provided the transportation service either directly or by subcontract. Of 15 TSAPs, 10 were rural or urban public transit districts, three were for-profit transportation companies, and two were nonprofit human service agencies that provided transportation services.
In 2011, the Texas Legislature directed HHSC to introduce a regional NEMT broker to the MTP. As a result, HHSC piloted a full-risk broker in two areas of the state—Houston and Dallas. HHSC continued fee-for-service contracts with TSAPs in other regions.
In 2013, the Texas Legislature required HHSC to assure medical transportation program services on a regional basis through a transportation delivery model using managed transportation organizations (MTOs) that operate under a capitated payment system.
Effective September 1, 2014 HHSC implemented the MTO model through six brokers in 11 regions. The brokers included four private for-profit companies, one public transit district, and one regional human services agency. The MTO brokers replaced the TSAP.
In November 2015, HHSC terminated the contract with the broker for one region for cause. HHSC now manages in-house the NEMT service in one region. HHSC contracts directly with transportation providers in that region on a fee-for-service basis under a Section 1915(b4) waiver.
DEMOGRAPHICS
OPERATING AUTHORITYNEMT MODEL
Population Density
State Population
FTA Region 6
CMS Region 6
Page 91
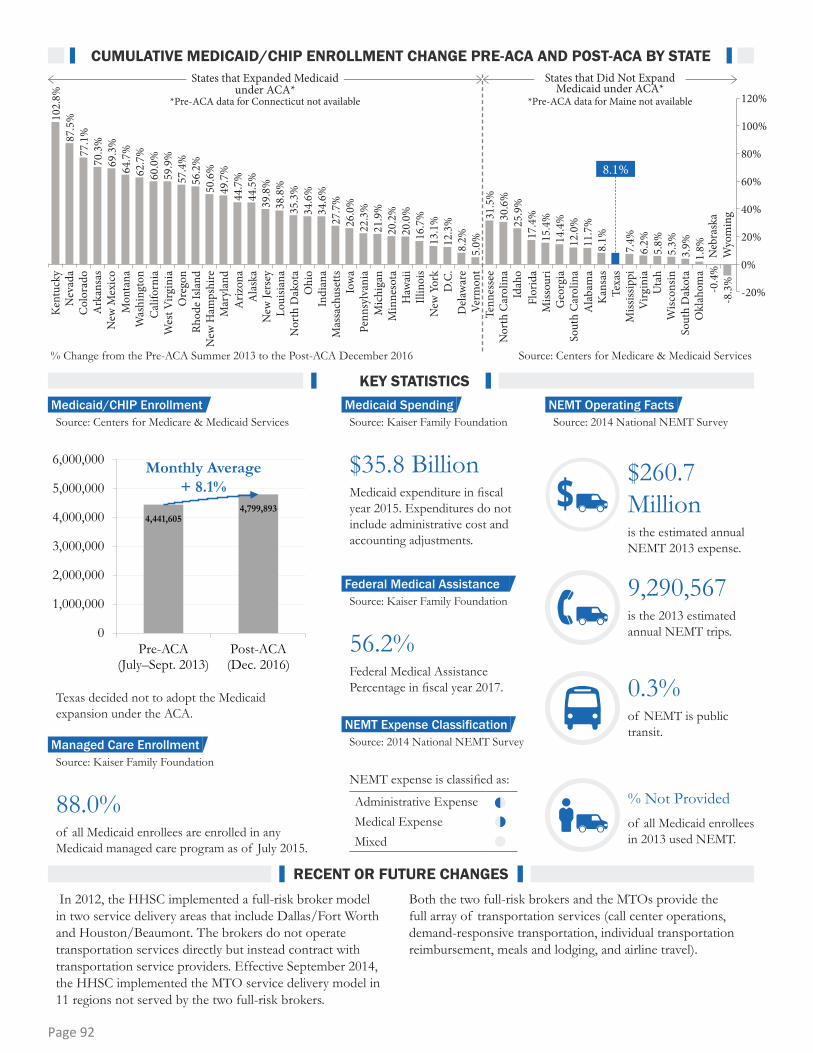
Administrative ExpenseMedical ExpenseMixed
4,441,6054,799,893
0
1,000,000
2,000,000
3,000,000
4,000,000
5,000,000
6,000,000
Pre-ACA(July–Sept. 2013)
Post-ACA(Dec. 2016)
In 2012, the HHSC implemented a full-risk broker model in two service delivery areas that include Dallas/Fort Worth and Houston/Beaumont. The brokers do not operate transportation services directly but instead contract with transportation service providers. Effective September 2014, the HHSC implemented the MTO service delivery model in 11 regions not served by the two full-risk brokers.
Both the two full-risk brokers and the MTOs provide the full array of transportation services (call center operations, demand-responsive transportation, individual transportation reimbursement, meals and lodging, and airline travel).
NEMT expense is classified as:
56.2% Federal Medical Assistance Percentage in fiscal year 2017.
88.0% of all Medicaid enrollees are enrolled in any Medicaid managed care program as of July 2015.
$35.8 Billion Medicaid expenditure in fiscal year 2015. Expenditures do not include administrative cost and accounting adjustments.
Texas decided not to adopt the Medicaid expansion under the ACA.
$260.7 Million is the estimated annual NEMT 2013 expense.
9,290,567is the 2013 estimated annual NEMT trips.
% Not Provided of all Medicaid enrollees in 2013 used NEMT.
0.3%of NEMT is public transit.
Source: Centers for Medicare & Medicaid Services Source: 2014 National NEMT Survey
Source: Kaiser Family Foundation
Source: Kaiser Family Foundation
Source: Kaiser Family Foundation
Source: 2014 National NEMT Survey
8.1%
Kent
ucky
102.
8%87
.5%
69.3
%
50.6
%
34.6
%
20.0
% 30.6
%
8.1%
60.0
%
44.5
%
26.0
%
12.3
%
15.4
%
6.2%
77.1
%
64.7
%
49.7
%
34.6
%
16.7
% 25.9
%
59.9
%
39.8
%
22.3
%
8.2% 14
.4%
5.8%
70.3
%
56.2
%
35.3
%
20.2
% 31.5
%
11.7
%
62.7
%
44.7
%
27.7
%
13.1
%
17.4
%
7.4%
57.4
%
38.8
%
21.9
%
5.0% 12
.0%
5.3%
3.9%
1.8%
-0.4
%-8
.3%
Nev
ada
Col
orad
oA
rkan
sas
New
Mex
ico
Mon
tana
Was
hing
ton
Cal
iforn
iaW
est V
irgin
iaO
rego
nRh
ode
Isla
ndN
ew H
amps
hire
Mar
ylan
dA
rizon
aA
lask
aN
ew Je
rsey
Loui
siana
Nor
th D
akot
aO
hio
Indi
ana
Mas
sach
uset
tsIo
wa
Penn
sylv
ania
Mic
higa
nM
inne
sota
Haw
aii
Illin
ois
New
Yor
kD
.C.
Del
awar
eVe
rmon
tTe
nnes
see
Nor
th C
arol
ina
Idah
oFl
orid
aM
issou
riG
eorg
iaSo
uth
Car
olin
aA
laba
ma
Kan
sas
Texa
sM
ississ
ippi
Virg
inia
Uta
hW
iscon
sinSo
uth
Dak
ota
Okl
ahom
aN
ebra
ska
Wyo
min
g
States that Expanded Medicaid under ACA*
States that Did Not Expand Medicaid under ACA*
120%
100%
-20%
0%
20%
40%
60%
80%
% Change from the Pre-ACA Summer 2013 to the Post-ACA December 2016 Source: Centers for Medicare & Medicaid Services
*Pre-ACA data for Connecticut not available *Pre-ACA data for Maine not available
KEY STATISTICS
RECENT OR FUTURE CHANGES
CUMULATIVE MEDICAID/CHIP ENROLLMENT CHANGE PRE-ACA AND POST-ACA BY STATE
Medicaid/CHIP Enrollment Medicaid Spending
Federal Medical Assistance
NEMT Expense Classification
NEMT Operating Facts
Managed Care Enrollment
Monthly Average + 8.1%
Page 92
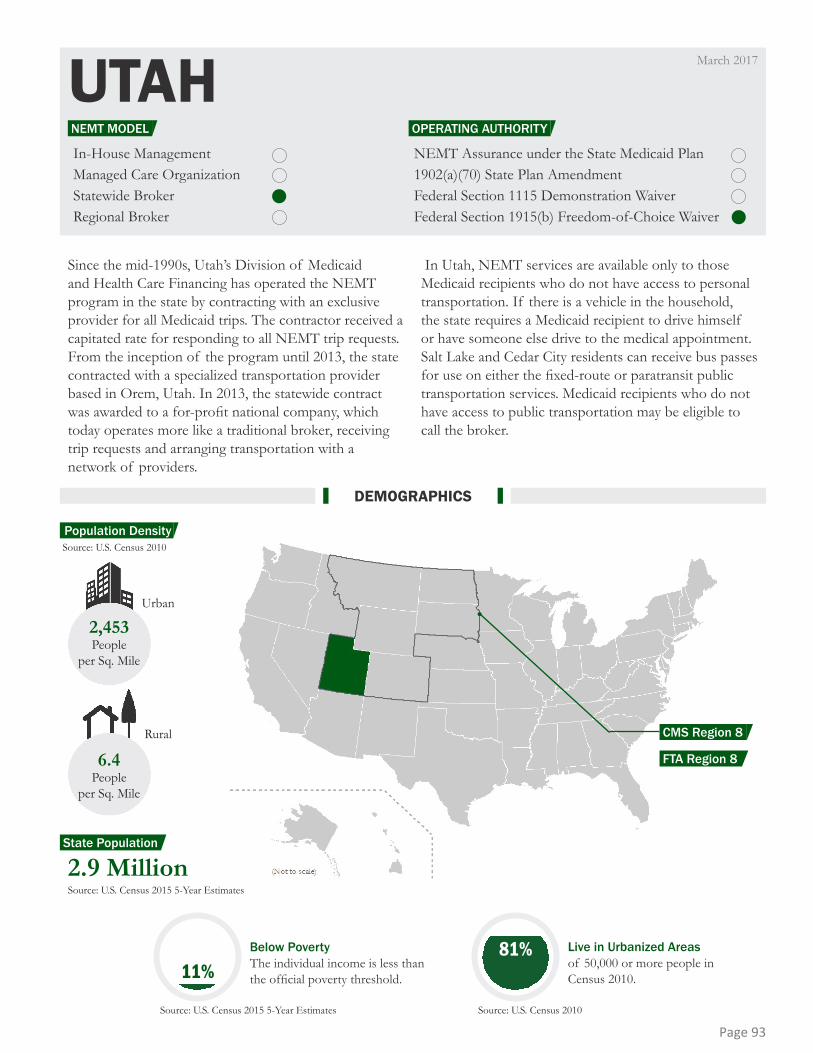
UTAHIn-House ManagementManaged Care OrganizationStatewide BrokerRegional Broker
NEMT Assurance under the State Medicaid Plan1902(a)(70) State Plan AmendmentFederal Section 1115 Demonstration WaiverFederal Section 1915(b) Freedom-of-Choice Waiver
2.9 Million
2,453People
per Sq. Mile
Urban
Rural
6.4People
per Sq. Mile
Source: U.S. Census 2010
Source: U.S. Census 2015 5-Year Estimates
Below PovertyThe individual income is less than the official poverty threshold.
Source: U.S. Census 2015 5-Year Estimates
Live in Urbanized Areasof 50,000 or more people in Census 2010.
Source: U.S. Census 2010
11%81%
Since the mid-1990s, Utah’s Division of Medicaid and Health Care Financing has operated the NEMT program in the state by contracting with an exclusive provider for all Medicaid trips. The contractor received a capitated rate for responding to all NEMT trip requests. From the inception of the program until 2013, the state contracted with a specialized transportation provider based in Orem, Utah. In 2013, the statewide contract was awarded to a for-profit national company, which today operates more like a traditional broker, receiving trip requests and arranging transportation with a network of providers.
In Utah, NEMT services are available only to those Medicaid recipients who do not have access to personal transportation. If there is a vehicle in the household, the state requires a Medicaid recipient to drive himself or have someone else drive to the medical appointment. Salt Lake and Cedar City residents can receive bus passes for use on either the fixed-route or paratransit public transportation services. Medicaid recipients who do not have access to public transportation may be eligible to call the broker.
March 2017
DEMOGRAPHICS
OPERATING AUTHORITYNEMT MODEL
Population Density
State Population
FTA Region 8
CMS Region 8
Page 93

Administrative ExpenseMedical ExpenseMixed
In addition to the recent change in the statewide contractor, Utah is among a handful of states to receive a federal Section 1115 Demonstration Waiver to establish a network of accountable care organizations under the ACA.
The state has not decided to carve in NEMT service as an accountable care organization’s responsibility. The current NEMT program could change in response to these health reform initiatives.
NEMT expense is classified as:
69.9% Federal Medical Assistance Percentage in fiscal year 2017.
62.8% of all Medicaid enrollees are enrolled in any Medicaid managed care program as of July 2015.
$2.2 Billion Medicaid expenditure in fiscal year 2015. Expenditures do not include administrative cost and accounting adjustments.
$2.5 Millionis the estimated annual NEMT 2013 expense.
70,000is the 2013 estimated annual NEMT trips.
0.6% of all Medicaid enrollees in 2013 used NEMT.
% Not Providedof NEMT is public transit.
Source: Centers for Medicare & Medicaid Services Source: 2014 National NEMT Survey
Source: Kaiser Family Foundation
Source: Kaiser Family Foundation
Source: Kaiser Family Foundation
Source: 2014 National NEMT Survey
5.8%
Kent
ucky
102.
8%87
.5%
69.3
%
50.6
%
34.6
%
20.0
% 30.6
%
8.1%
60.0
%
44.5
%
26.0
%
12.3
%
15.4
%
6.2%
77.1
%
64.7
%
49.7
%
34.6
%
16.7
% 25.9
%
8.1%
59.9
%
39.8
%
22.3
%
8.2% 14
.4%
70.3
%
56.2
%
35.3
%
20.2
% 31.5
%
11.7
%
62.7
%
44.7
%
27.7
%
13.1
%
17.4
%
7.4%
57.4
%
38.8
%
21.9
%
5.0% 12
.0%
5.3%
3.9%
1.8%
-0.4
%-8
.3%
Nev
ada
Col
orad
oA
rkan
sas
New
Mex
ico
Mon
tana
Was
hing
ton
Cal
iforn
iaW
est V
irgin
iaO
rego
nRh
ode
Isla
ndN
ew H
amps
hire
Mar
ylan
dA
rizon
aA
lask
aN
ew Je
rsey
Loui
siana
Nor
th D
akot
aO
hio
Indi
ana
Mas
sach
uset
tsIo
wa
Penn
sylv
ania
Mic
higa
nM
inne
sota
Haw
aii
Illin
ois
New
Yor
kD
.C.
Del
awar
eVe
rmon
tTe
nnes
see
Nor
th C
arol
ina
Idah
oFl
orid
aM
issou
riG
eorg
iaSo
uth
Car
olin
aA
laba
ma
Kan
sas
Texa
sM
ississ
ippi
Virg
inia
Uta
hW
iscon
sinSo
uth
Dak
ota
Okl
ahom
aN
ebra
ska
Wyo
min
g
States that Expanded Medicaid under ACA*
States that Did Not Expand Medicaid under ACA*
120%
100%
-20%
0%
20%
40%
60%
80%
% Change from the Pre-ACA Summer 2013 to the Post-ACA December 2016 Source: Centers for Medicare & Medicaid Services
*Pre-ACA data for Connecticut not available *Pre-ACA data for Maine not available
KEY STATISTICS
RECENT OR FUTURE CHANGES
CUMULATIVE MEDICAID/CHIP ENROLLMENT CHANGE PRE-ACA AND POST-ACA BY STATE
Medicaid/CHIP Enrollment Medicaid Spending
Federal Medical Assistance
NEMT Expense Classification
NEMT Operating Facts
Managed Care Enrollment
294,029311,117
0
50,000
100,000
150,000
200,000
250,000
300,000
350,000
Pre-ACA(July–Sept. 2013)
Post-ACA(Dec. 2016)
Utah decided not to adopt the Medicaid expansion under the ACA.
Monthly Average + 5.8%
Page 94

VERMONTIn-House ManagementManaged Care OrganizationStatewide BrokerRegional Broker
NEMT Assurance under the State Medicaid Plan1902(a)(70) State Plan AmendmentFederal Section 1115 Demonstration WaiverFederal Section 1915(b) Freedom-of-Choice Waiver
696People
per Sq. Mile
Urban
Rural
56.5People
per Sq. Mile
627 Thousand
Source: U.S. Census 2010
Source: U.S. Census 2015 5-Year Estimates
Below PovertyThe individual income is less than the official poverty threshold.
Source: U.S. Census 2015 5-Year Estimates
Live in Urbanized Areasof 50,000 or more people in Census 2010.
Source: U.S. Census 2010
10% 17%
In Vermont, NEMT is a covered service for members enrolled in the Medicaid and Dr. Dynasaur programs. Dr. Dynasaur is low-cost or free health coverage for children, teenagers under age 19, and pregnant women. NEMT is assured through a contract between the Department of Vermont Health Access (DVHA) and the Vermont Public Transportation Association (VPTA). VPTA is a regional network of public transportation providers.
DVHA oversees and monitors NEMT, issuing policies and procedures consistent with federal and state directives. DVHA is also responsible for authorizing trips outside of a 60-mile radius from a member’s home and out-of-state trips.
As the contracted Vermont NEMT administrator, VPTA subcontracts with a network of public transportation providers to ensure statewide access to transportation services for eligible members. VPTA must ensure that these subcontractors screen for eligibility, schedule the least-costly mode of transportation to medical appointments, and submit claims for processing. VPTA is subject to service approval by DVHA, along with claims processing and utilization review by DVHA.
DVHA pays VPTA on a per member, per week basis to administer the NEMT program. VPTA may set up any methodology to reimburse subcontractors as long as that process complies with all current tax and employment laws.
March 2018
DEMOGRAPHICS
OPERATING AUTHORITYNEMT MODEL
Population Density
State Population
FTA Region 1
CMS Region 1
Page 95

Administrative ExpenseMedical ExpenseMixed
CUMULATIVE MEDICAID/CHIP ENROLLMENT CHANGE PRE-ACA AND POST-ACA BY STATE
NEMT expense is classified as:
54.5% Federal Medical Assistance Percentage in fiscal year 2017.
0% of all Medicaid enrollees are enrolled in any Medicaid managed care program as of July 2015.
$1.6 Billion Medicaid expenditure in fiscal year 2015. Expenditures do not include administrative cost and accounting adjustments.
$11 Millionis the estimated annual NEMT 2013 expense.
390,000is the 2013 estimated annual NEMT trips.
% Not Provided of all Medicaid enrollees in 2013 used NEMT.
12% of NEMT is public transit.
Prior to July 2017, DVHA contracted with nine public transit providers in the state to serve as regional NEMT
brokers. Effective July 2017, VPTA serves as the statewide broker.
RECENT OR FUTURE CHANGES
Source: Centers for Medicare & Medicaid Services Source: 2014 National NEMT Survey
Source: Kaiser Family Foundation
Source: Kaiser Family Foundation
Source: Kaiser Family Foundation
Source: 2014 National NEMT Survey
Kent
ucky
102.
8%87
.5%
69.3
%
50.6
%
34.6
%
20.0
% 30.6
%
8.1%
60.0
%
44.5
%
26.0
%
12.3
%
15.4
%
6.2%
77.1
%
64.7
%
49.7
%
34.6
%
16.7
% 25.9
%
8.1%
59.9
%
39.8
%
22.3
%
8.2% 14
.4%
5.8%
70.3
%
56.2
%
35.3
%
20.2
% 31.5
%
11.7
%
62.7
%
44.7
%
27.7
%
13.1
%
17.4
%
7.4%
57.4
%
38.8
%
21.9
%
12.0
%
5.3%
3.9%
1.8%
-0.4
%-8
.3%
Nev
ada
Col
orad
oA
rkan
sas
New
Mex
ico
Mon
tana
Was
hing
ton
Cal
iforn
iaW
est V
irgin
iaO
rego
nRh
ode
Isla
ndN
ew H
amps
hire
Mar
ylan
dA
rizon
aA
lask
aN
ew Je
rsey
Loui
siana
Nor
th D
akot
aO
hio
Indi
ana
Mas
sach
uset
tsIo
wa
Penn
sylv
ania
Mic
higa
nM
inne
sota
Haw
aii
Illin
ois
New
Yor
kD
.C.
Del
awar
eVe
rmon
tTe
nnes
see
Nor
th C
arol
ina
Idah
oFl
orid
aM
issou
riG
eorg
iaSo
uth
Car
olin
aA
laba
ma
Kan
sas
Texa
sM
ississ
ippi
Virg
inia
Uta
hW
iscon
sinSo
uth
Dak
ota
Okl
ahom
aN
ebra
ska
Wyo
min
g
States that Expanded Medicaid under ACA*
States that Did Not Expand Medicaid under ACA*
120%
100%
-20%
0%
20%
40%
60%
80%
% Change from the Pre-ACA Summer 2013 to the Post-ACA December 2016 Source: Centers for Medicare & Medicaid Services
*Pre-ACA data for Connecticut not available *Pre-ACA data for Maine not available
5.0%
KEY STATISTICS
Medicaid/CHIP Enrollment Medicaid Spending
Federal Medical Assistance
NEMT Expense Classification
NEMT Operating Facts
Managed Care Enrollment
161,081169,092
020,00040,00060,00080,000
100,000120,000140,000160,000180,000
Pre-ACA(July–Sept. 2013)
Post-ACA(Dec. 2016)
Vermont decided to adopt the Medicaid expansion under the ACA.
Monthly Average + 5.0%
Page 96

VIRGINIAIn-House ManagementManaged Care OrganizationStatewide BrokerRegional Broker
NEMT Assurance under the State Medicaid Plan1902(a)(70) State Plan AmendmentFederal Section 1115 Demonstration WaiverFederal Section 1915(b) Freedom-of-Choice Waiver
8.3 Million
2,095People
per Sq. Mile
Urban
Rural
65People
per Sq. Mile
Source: U.S. Census 2010
Source: U.S. Census 2015 5-Year Estimates
Below PovertyThe individual income is less than the official poverty threshold.
Source: U.S. Census 2015 5-Year Estimates
Live in Urbanized Areasof 50,000 or more people in Census 2010.
Source: U.S. Census 2010
11%70%
Since the early 2000s, Virginia’s Department of Medical Assistance Programs has operated a statewide full-risk brokerage to provide NEMT services for Medicaid recipients in the state’s fee-for-sevice program. Since the inception of the brokerage program, LogistiCare has been the contracted broker. The balance of the Medicaid population is enrolled in managed care organizations,
which are responsible for providing NEMT services to their members. About 90 percent of all NEMT trips are reported to be provided by the broker in the fee-for-service Medicaid program, which accounts for between 30 and 40 percent of the state’s Medicaid population but includes a disproportionate number of older, disabled, and waivered populations.
March 2017
DEMOGRAPHICS
OPERATING AUTHORITYNEMT MODEL
Population Density
State Population
FTA Region 3
CMS Region 3
Page 97
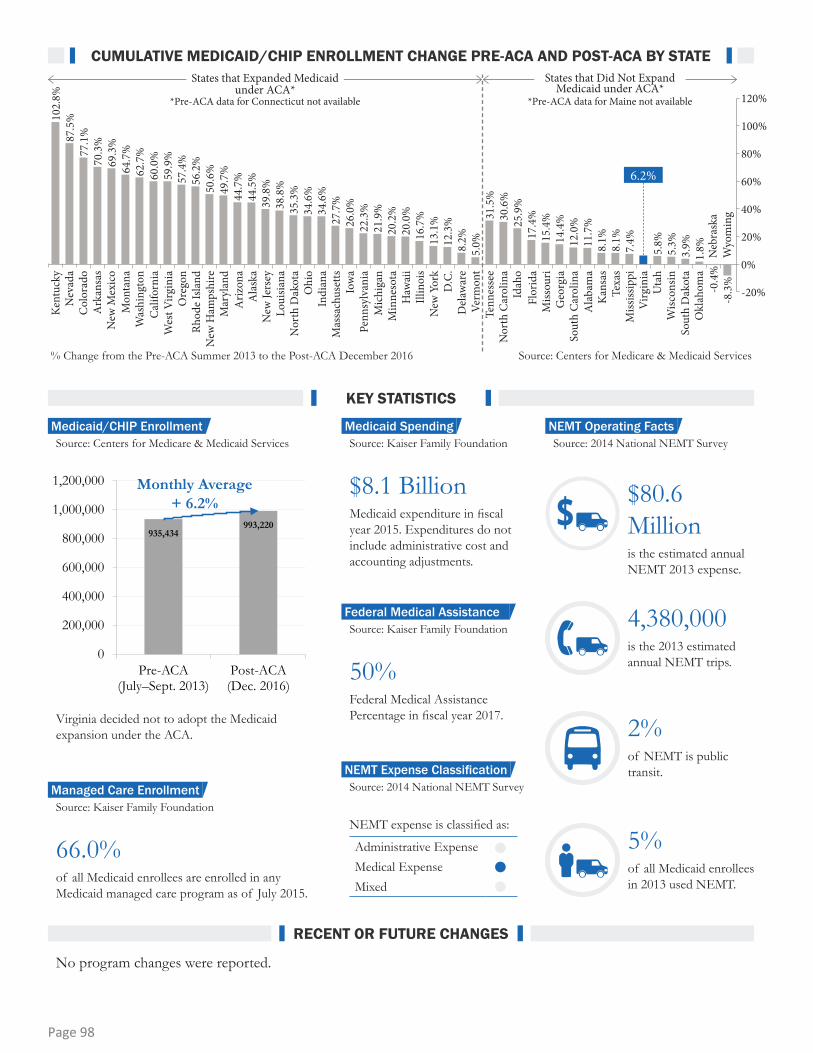
Administrative ExpenseMedical ExpenseMixed
No program changes were reported.
NEMT expense is classified as:
50% Federal Medical Assistance Percentage in fiscal year 2017.
66.0% of all Medicaid enrollees are enrolled in any Medicaid managed care program as of July 2015.
$8.1 Billion Medicaid expenditure in fiscal year 2015. Expenditures do not include administrative cost and accounting adjustments.
$80.6Millionis the estimated annual NEMT 2013 expense.
4,380,000is the 2013 estimated annual NEMT trips.
5%of all Medicaid enrollees in 2013 used NEMT.
2%of NEMT is public transit.
Source: Centers for Medicare & Medicaid Services Source: 2014 National NEMT Survey
Source: Kaiser Family Foundation
Source: Kaiser Family Foundation
Source: Kaiser Family Foundation
Source: 2014 National NEMT Survey
6.2%
Kent
ucky
102.
8%87
.5%
69.3
%
50.6
%
34.6
%
20.0
% 30.6
%
8.1%
60.0
%
44.5
%
26.0
%
12.3
%
15.4
%
77.1
%
64.7
%
49.7
%
34.6
%
16.7
% 25.9
%
8.1%
59.9
%
39.8
%
22.3
%
8.2% 14
.4%
5.8%
70.3
%
56.2
%
35.3
%
20.2
% 31.5
%
11.7
%
62.7
%
44.7
%
27.7
%
13.1
%
17.4
%
7.4%
57.4
%
38.8
%
21.9
%
5.0% 12
.0%
5.3%
3.9%
1.8%
-0.4
%-8
.3%
Nev
ada
Col
orad
oA
rkan
sas
New
Mex
ico
Mon
tana
Was
hing
ton
Cal
iforn
iaW
est V
irgin
iaO
rego
nRh
ode
Isla
ndN
ew H
amps
hire
Mar
ylan
dA
rizon
aA
lask
aN
ew Je
rsey
Loui
siana
Nor
th D
akot
aO
hio
Indi
ana
Mas
sach
uset
tsIo
wa
Penn
sylv
ania
Mic
higa
nM
inne
sota
Haw
aii
Illin
ois
New
Yor
kD
.C.
Del
awar
eVe
rmon
tTe
nnes
see
Nor
th C
arol
ina
Idah
oFl
orid
aM
issou
riG
eorg
iaSo
uth
Car
olin
aA
laba
ma
Kan
sas
Texa
sM
ississ
ippi
Virg
inia
Uta
hW
iscon
sinSo
uth
Dak
ota
Okl
ahom
aN
ebra
ska
Wyo
min
g
States that Expanded Medicaid under ACA*
States that Did Not Expand Medicaid under ACA*
120%
100%
-20%
0%
20%
40%
60%
80%
% Change from the Pre-ACA Summer 2013 to the Post-ACA December 2016 Source: Centers for Medicare & Medicaid Services
*Pre-ACA data for Connecticut not available *Pre-ACA data for Maine not available
KEY STATISTICS
RECENT OR FUTURE CHANGES
CUMULATIVE MEDICAID/CHIP ENROLLMENT CHANGE PRE-ACA AND POST-ACA BY STATE
Medicaid/CHIP Enrollment Medicaid Spending
Federal Medical Assistance
NEMT Expense Classification
NEMT Operating Facts
Managed Care Enrollment
935,434993,220
0
200,000
400,000
600,000
800,000
1,000,000
1,200,000
Pre-ACA(July–Sept. 2013)
Post-ACA(Dec. 2016)
Virginia decided not to adopt the Medicaid expansion under the ACA.
Monthly Average + 6.2%
Page 98
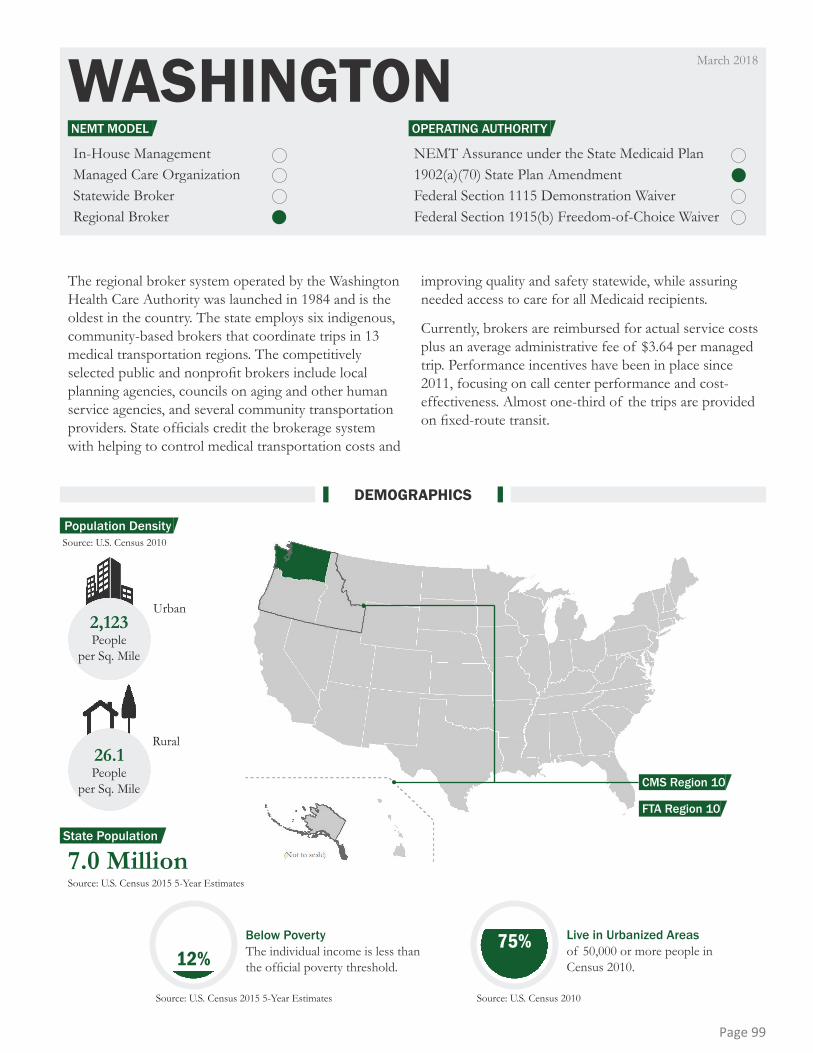
WASHINGTONIn-House ManagementManaged Care OrganizationStatewide BrokerRegional Broker
NEMT Assurance under the State Medicaid Plan1902(a)(70) State Plan AmendmentFederal Section 1115 Demonstration WaiverFederal Section 1915(b) Freedom-of-Choice Waiver
Below PovertyThe individual income is less than the official poverty threshold.
Source: U.S. Census 2015 5-Year Estimates
Live in Urbanized Areasof 50,000 or more people in Census 2010.
Source: U.S. Census 2010
2,123People
per Sq. Mile
Urban
Rural26.1People
per Sq. Mile
Source: U.S. Census 2010
7.0 MillionSource: U.S. Census 2015 5-Year Estimates
12%75%
The regional broker system operated by the Washington Health Care Authority was launched in 1984 and is the oldest in the country. The state employs six indigenous, community-based brokers that coordinate trips in 13 medical transportation regions. The competitively selected public and nonprofit brokers include local planning agencies, councils on aging and other human service agencies, and several community transportation providers. State officials credit the brokerage system with helping to control medical transportation costs and
improving quality and safety statewide, while assuring needed access to care for all Medicaid recipients.
Currently, brokers are reimbursed for actual service costs plus an average administrative fee of $3.64 per managed trip. Performance incentives have been in place since 2011, focusing on call center performance and cost-effectiveness. Almost one-third of the trips are provided on fixed-route transit.
March 2018
DEMOGRAPHICS
OPERATING AUTHORITYNEMT MODEL
FTA Region 10
Population Density
CMS Region 10
State Population
Page 99
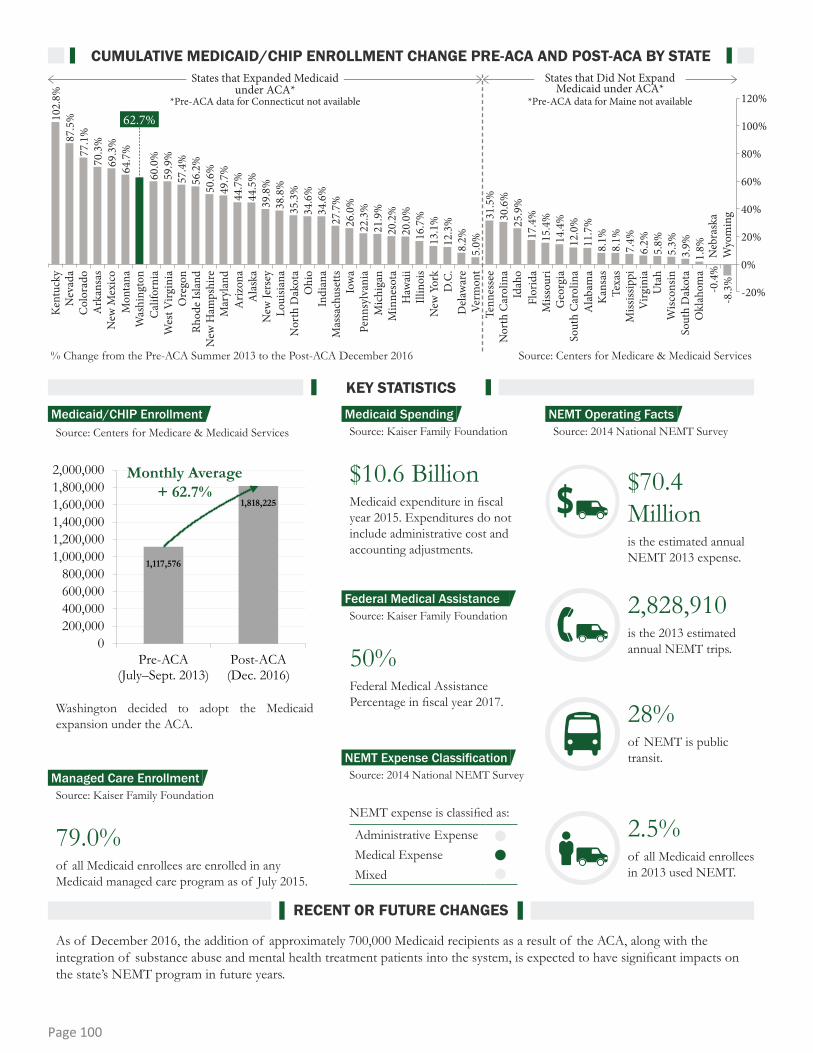
Administrative ExpenseMedical ExpenseMixed
1,117,576
1,818,225
0200,000400,000600,000800,000
1,000,0001,200,0001,400,0001,600,0001,800,0002,000,000
Pre-ACA(July–Sept. 2013)
Post-ACA(Dec. 2016)
As of December 2016, the addition of approximately 700,000 Medicaid recipients as a result of the ACA, along with the integration of substance abuse and mental health treatment patients into the system, is expected to have significant impacts on the state’s NEMT program in future years.
NEMT expense is classified as:
50% Federal Medical Assistance Percentage in fiscal year 2017.
79.0% of all Medicaid enrollees are enrolled in any Medicaid managed care program as of July 2015.
$10.6 Billion Medicaid expenditure in fiscal year 2015. Expenditures do not include administrative cost and accounting adjustments.
Washington decided to adopt the Medicaid expansion under the ACA.
$70.4 Millionis the estimated annual NEMT 2013 expense.
2,828,910is the 2013 estimated annual NEMT trips.
2.5% of all Medicaid enrollees in 2013 used NEMT.
28%of NEMT is public transit.
Source: Centers for Medicare & Medicaid Services Source: 2014 National NEMT Survey
Source: Kaiser Family Foundation
Source: Kaiser Family Foundation
Source: Kaiser Family Foundation
Source: 2014 National NEMT Survey
62.7%
Kent
ucky
102.
8%87
.5%
69.3
%
50.6
%
34.6
%
20.0
% 30.6
%
8.1%
60.0
%
44.5
%
26.0
%
12.3
%
15.4
%
6.2%
77.1
%
64.7
%
49.7
%
34.6
%
16.7
% 25.9
%
8.1%
59.9
%
39.8
%
22.3
%
8.2% 14
.4%
5.8%
70.3
%
56.2
%
35.3
%
20.2
% 31.5
%
11.7
%
44.7
%
27.7
%
13.1
%
17.4
%
7.4%
57.4
%
38.8
%
21.9
%
5.0% 12
.0%
5.3%
3.9%
1.8%
-0.4
%-8
.3%
Nev
ada
Col
orad
oA
rkan
sas
New
Mex
ico
Mon
tana
Was
hing
ton
Cal
iforn
iaW
est V
irgin
iaO
rego
nRh
ode
Isla
ndN
ew H
amps
hire
Mar
ylan
dA
rizon
aA
lask
aN
ew Je
rsey
Loui
siana
Nor
th D
akot
aO
hio
Indi
ana
Mas
sach
uset
tsIo
wa
Penn
sylv
ania
Mic
higa
nM
inne
sota
Haw
aii
Illin
ois
New
Yor
kD
.C.
Del
awar
eVe
rmon
tTe
nnes
see
Nor
th C
arol
ina
Idah
oFl
orid
aM
issou
riG
eorg
iaSo
uth
Car
olin
aA
laba
ma
Kan
sas
Texa
sM
ississ
ippi
Virg
inia
Uta
hW
iscon
sinSo
uth
Dak
ota
Okl
ahom
aN
ebra
ska
Wyo
min
g
States that Expanded Medicaid under ACA*
States that Did Not Expand Medicaid under ACA*
120%
100%
-20%
0%
20%
40%
60%
80%
% Change from the Pre-ACA Summer 2013 to the Post-ACA December 2016 Source: Centers for Medicare & Medicaid Services
*Pre-ACA data for Connecticut not available *Pre-ACA data for Maine not available
KEY STATISTICS
RECENT OR FUTURE CHANGES
CUMULATIVE MEDICAID/CHIP ENROLLMENT CHANGE PRE-ACA AND POST-ACA BY STATE
Medicaid/CHIP Enrollment Medicaid Spending
Federal Medical Assistance
NEMT Expense Classification
NEMT Operating Facts
Managed Care Enrollment
Monthly Average + 62.7%
Page 100
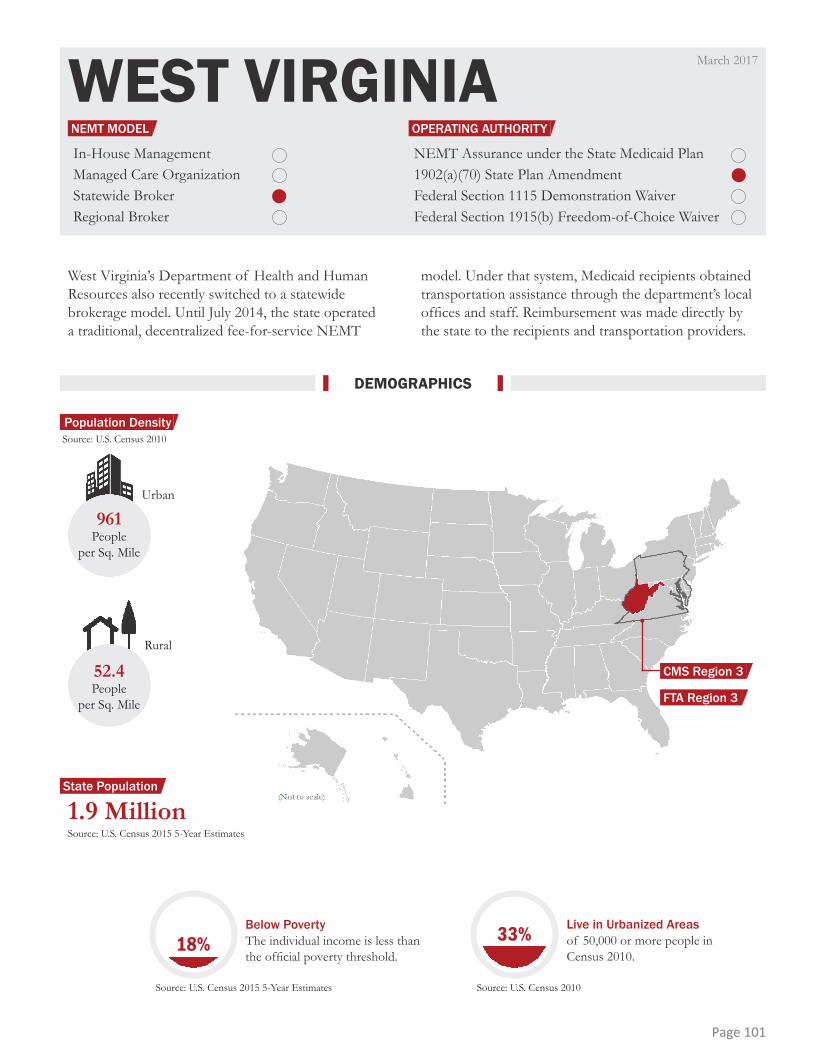
WEST VIRGINIAIn-House ManagementManaged Care OrganizationStatewide BrokerRegional Broker
NEMT Assurance under the State Medicaid Plan1902(a)(70) State Plan AmendmentFederal Section 1115 Demonstration WaiverFederal Section 1915(b) Freedom-of-Choice Waiver
1.9 Million
961People
per Sq. Mile
Urban
Rural
52.4People
per Sq. Mile
Source: U.S. Census 2010
Source: U.S. Census 2015 5-Year Estimates
Below PovertyThe individual income is less than the official poverty threshold.
Source: U.S. Census 2015 5-Year Estimates
Live in Urbanized Areasof 50,000 or more people in Census 2010.
Source: U.S. Census 2010
18% 33%
West Virginia’s Department of Health and Human Resources also recently switched to a statewide brokerage model. Until July 2014, the state operated a traditional, decentralized fee-for-service NEMT
model. Under that system, Medicaid recipients obtained transportation assistance through the department’s local offices and staff. Reimbursement was made directly by the state to the recipients and transportation providers.
March 2017
DEMOGRAPHICS
OPERATING AUTHORITYNEMT MODEL
Population Density
State Population
FTA Region 3
CMS Region 3
Page 101

Administrative ExpenseMedical ExpenseMixed
In February 2014, the Bureau for Medical Services issued a RFP for a statewide full-risk brokerage to be implemented in the state. The brokerage contract was awarded to MTM, a national private broker, that begun June 2014.
NEMT expense is classified as:
71.8% Federal Medical Assistance Percentage in fiscal year 2017.
65.0% of all Medicaid enrollees are enrolled in any Medicaid managed care program as of July 2015.
$3.7 Billion Medicaid expenditure in fiscal year 2015. Expenditures do not include administrative cost and accounting adjustments.
$25.1 Millionis the estimated annual NEMT 2013 expense.
889,495is the 2013 estimated annual NEMT trips.
15% of all Medicaid enrollees in 2013 used NEMT.
% Not Providedof NEMT is public transit.
Source: Centers for Medicare & Medicaid Services Source: 2014 National NEMT Survey
Source: Kaiser Family Foundation
Source: Kaiser Family Foundation
Source: Kaiser Family Foundation
Source: 2014 National NEMT Survey
59.9%
Kent
ucky
102.
8%87
.5%
69.3
%
50.6
%
34.6
%
20.0
% 30.6
%
8.1%
60.0
%
44.5
%
26.0
%
12.3
%
15.4
%
6.2%
77.1
%
64.7
%
49.7
%
34.6
%
16.7
% 25.9
%
8.1%
39.8
%
22.3
%
8.2% 14
.4%
5.8%
70.3
%
56.2
%
35.3
%
20.2
% 31.5
%
11.7
%
62.7
%
44.7
%
27.7
%
13.1
%
17.4
%
7.4%
57.4
%
38.8
%
21.9
%
5.0% 12
.0%
5.3%
3.9%
1.8%
-0.4
%-8
.3%
Nev
ada
Col
orad
oA
rkan
sas
New
Mex
ico
Mon
tana
Was
hing
ton
Cal
iforn
iaW
est V
irgin
iaO
rego
nRh
ode
Isla
ndN
ew H
amps
hire
Mar
ylan
dA
rizon
aA
lask
aN
ew Je
rsey
Loui
siana
Nor
th D
akot
aO
hio
Indi
ana
Mas
sach
uset
tsIo
wa
Penn
sylv
ania
Mic
higa
nM
inne
sota
Haw
aii
Illin
ois
New
Yor
kD
.C.
Del
awar
eVe
rmon
tTe
nnes
see
Nor
th C
arol
ina
Idah
oFl
orid
aM
issou
riG
eorg
iaSo
uth
Car
olin
aA
laba
ma
Kan
sas
Texa
sM
ississ
ippi
Virg
inia
Uta
hW
iscon
sinSo
uth
Dak
ota
Okl
ahom
aN
ebra
ska
Wyo
min
g
States that Expanded Medicaid under ACA*
States that Did Not Expand Medicaid under ACA*
120%
100%
-20%
0%
20%
40%
60%
80%
% Change from the Pre-ACA Summer 2013 to the Post-ACA December 2016 Source: Centers for Medicare & Medicaid Services
*Pre-ACA data for Connecticut not available *Pre-ACA data for Maine not available
KEY STATISTICS
RECENT OR FUTURE CHANGES
CUMULATIVE MEDICAID/CHIP ENROLLMENT CHANGE PRE-ACA AND POST-ACA BY STATE
Medicaid/CHIP Enrollment Medicaid Spending
Federal Medical Assistance
NEMT Expense Classification
NEMT Operating Facts
Managed Care Enrollment
354,544
567,064
0
100,000
200,000
300,000
400,000
500,000
600,000
Pre-ACA(July–Sept. 2013)
Post-ACA(Dec. 2016)
West Virginia decided to adopt the Medicaid expansion under the ACA.
Monthly Average + 59.9%
Page 102
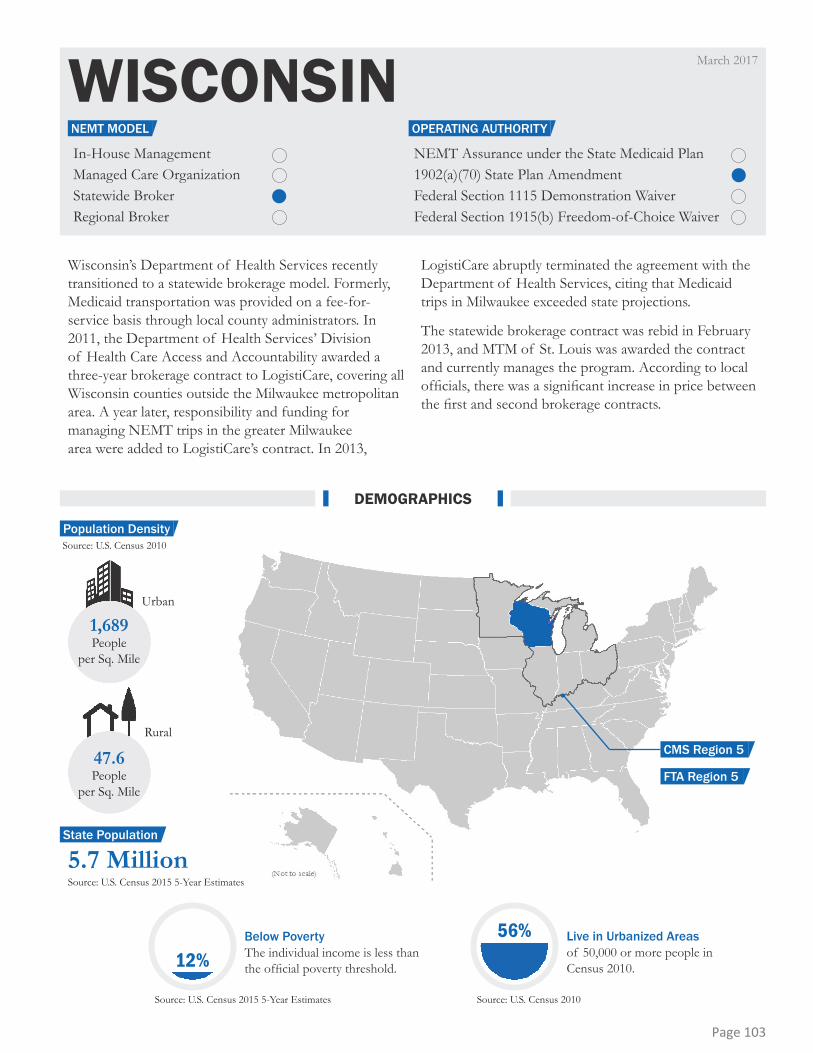
WISCONSINIn-House ManagementManaged Care OrganizationStatewide BrokerRegional Broker
5.7 Million
1,689People
per Sq. Mile
Urban
Rural
47.6People
per Sq. Mile
NEMT Assurance under the State Medicaid Plan1902(a)(70) State Plan AmendmentFederal Section 1115 Demonstration WaiverFederal Section 1915(b) Freedom-of-Choice Waiver
Source: U.S. Census 2010
Source: U.S. Census 2015 5-Year Estimates
Below PovertyThe individual income is less than the official poverty threshold.
Source: U.S. Census 2015 5-Year Estimates
Live in Urbanized Areasof 50,000 or more people in Census 2010.
Source: U.S. Census 2010
12%56%
Wisconsin’s Department of Health Services recently transitioned to a statewide brokerage model. Formerly, Medicaid transportation was provided on a fee-for-service basis through local county administrators. In 2011, the Department of Health Services’ Division of Health Care Access and Accountability awarded a three-year brokerage contract to LogistiCare, covering all Wisconsin counties outside the Milwaukee metropolitan area. A year later, responsibility and funding for managing NEMT trips in the greater Milwaukee area were added to LogistiCare’s contract. In 2013,
LogistiCare abruptly terminated the agreement with the Department of Health Services, citing that Medicaid trips in Milwaukee exceeded state projections.
The statewide brokerage contract was rebid in February 2013, and MTM of St. Louis was awarded the contract and currently manages the program. According to local officials, there was a significant increase in price between the first and second brokerage contracts.
March 2017
DEMOGRAPHICS
OPERATING AUTHORITYNEMT MODEL
Population Density
State Population
FTA Region 5
CMS Region 5
Page 103
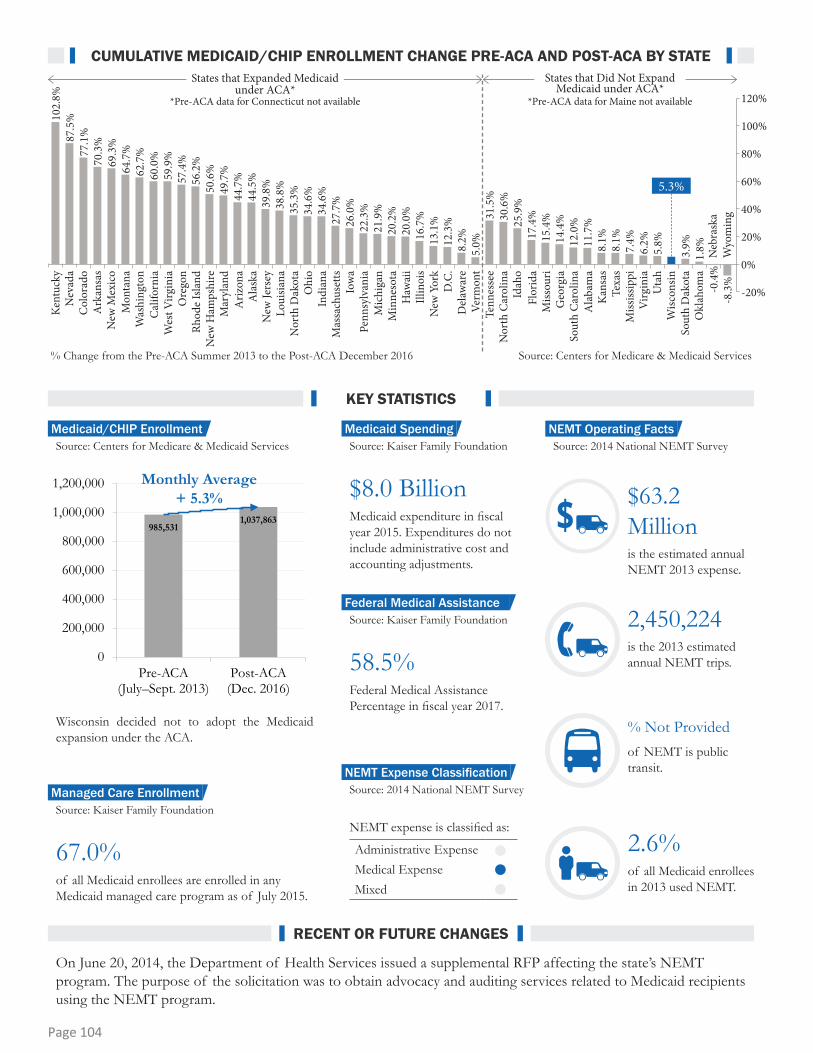
Administrative ExpenseMedical ExpenseMixed
On June 20, 2014, the Department of Health Services issued a supplemental RFP affecting the state’s NEMT program. The purpose of the solicitation was to obtain advocacy and auditing services related to Medicaid recipients using the NEMT program.
NEMT expense is classified as:
58.5% Federal Medical Assistance Percentage in fiscal year 2017.
67.0% of all Medicaid enrollees are enrolled in any Medicaid managed care program as of July 2015.
$8.0 Billion Medicaid expenditure in fiscal year 2015. Expenditures do not include administrative cost and accounting adjustments.
$63.2 Millionis the estimated annual NEMT 2013 expense.
2,450,224is the 2013 estimated annual NEMT trips.
2.6% of all Medicaid enrollees in 2013 used NEMT.
% Not Providedof NEMT is public transit.
Source: Centers for Medicare & Medicaid Services Source: 2014 National NEMT Survey
Source: Kaiser Family Foundation
Source: Kaiser Family Foundation
Source: Kaiser Family Foundation
Source: 2014 National NEMT Survey
5.3%
Kent
ucky
102.
8%87
.5%
69.3
%
50.6
%
34.6
%
20.0
% 30.6
%
8.1%
60.0
%
44.5
%
26.0
%
12.3
%
15.4
%
6.2%
77.1
%
64.7
%
49.7
%
34.6
%
16.7
% 25.9
%
8.1%
59.9
%
39.8
%
22.3
%
8.2% 14
.4%
5.8%
70.3
%
56.2
%
35.3
%
20.2
% 31.5
%
11.7
%
62.7
%
44.7
%
27.7
%
13.1
%
17.4
%
7.4%
57.4
%
38.8
%
21.9
%
5.0% 12
.0%
3.9%
1.8%
-0.4
%-8
.3%
Nev
ada
Col
orad
oA
rkan
sas
New
Mex
ico
Mon
tana
Was
hing
ton
Cal
iforn
iaW
est V
irgin
iaO
rego
nRh
ode
Isla
ndN
ew H
amps
hire
Mar
ylan
dA
rizon
aA
lask
aN
ew Je
rsey
Loui
siana
Nor
th D
akot
aO
hio
Indi
ana
Mas
sach
uset
tsIo
wa
Penn
sylv
ania
Mic
higa
nM
inne
sota
Haw
aii
Illin
ois
New
Yor
kD
.C.
Del
awar
eVe
rmon
tTe
nnes
see
Nor
th C
arol
ina
Idah
oFl
orid
aM
issou
riG
eorg
iaSo
uth
Car
olin
aA
laba
ma
Kan
sas
Texa
sM
ississ
ippi
Virg
inia
Uta
hW
iscon
sinSo
uth
Dak
ota
Okl
ahom
aN
ebra
ska
Wyo
min
g
States that Expanded Medicaid under ACA*
States that Did Not Expand Medicaid under ACA*
120%
100%
-20%
0%
20%
40%
60%
80%
% Change from the Pre-ACA Summer 2013 to the Post-ACA December 2016 Source: Centers for Medicare & Medicaid Services
*Pre-ACA data for Connecticut not available *Pre-ACA data for Maine not available
KEY STATISTICS
RECENT OR FUTURE CHANGES
CUMULATIVE MEDICAID/CHIP ENROLLMENT CHANGE PRE-ACA AND POST-ACA BY STATE
Medicaid/CHIP Enrollment Medicaid Spending
Federal Medical Assistance
NEMT Expense Classification
985,5311,037,863
0
200,000
400,000
600,000
800,000
1,000,000
1,200,000
Pre-ACA(July–Sept. 2013)
Post-ACA(Dec. 2016)
NEMT Operating Facts
Managed Care Enrollment
Wisconsin decided not to adopt the Medicaid expansion under the ACA.
Monthly Average + 5.3%
Page 104
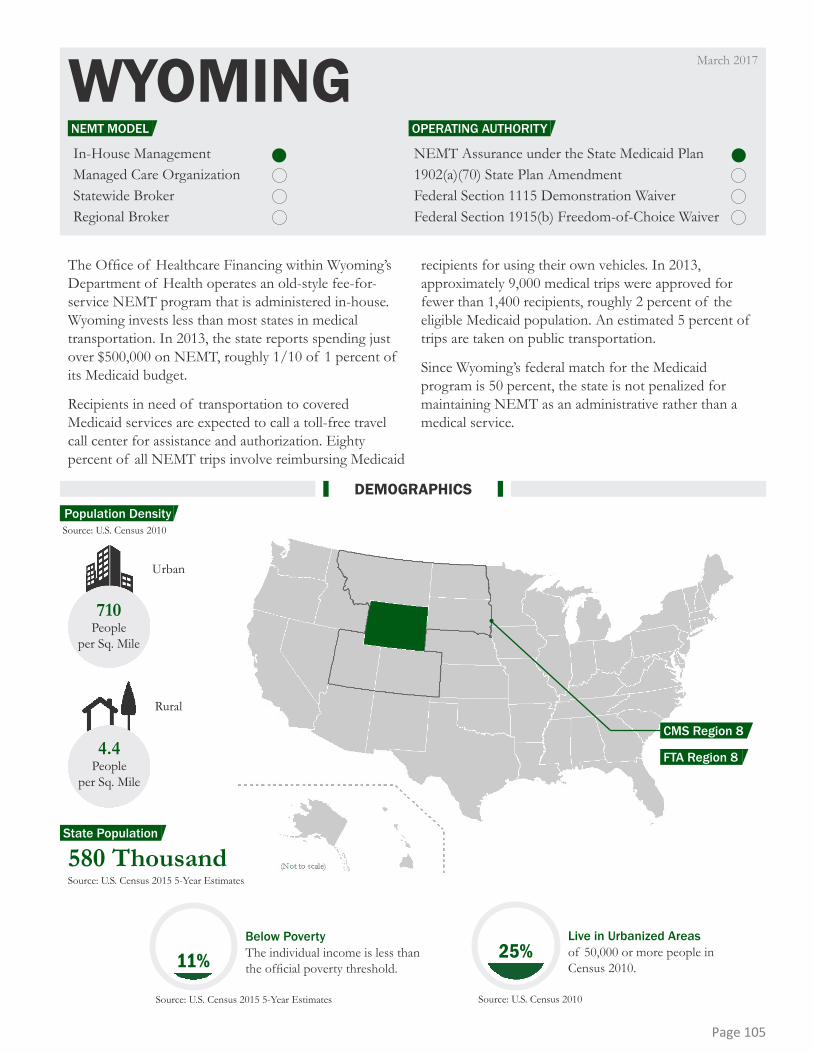
WYOMINGIn-House ManagementManaged Care OrganizationStatewide BrokerRegional Broker
710People
per Sq. Mile
Urban
Rural
4.4People
per Sq. Mile
580 Thousand
NEMT Assurance under the State Medicaid Plan1902(a)(70) State Plan AmendmentFederal Section 1115 Demonstration WaiverFederal Section 1915(b) Freedom-of-Choice Waiver
Source: U.S. Census 2010
Source: U.S. Census 2015 5-Year Estimates
Below PovertyThe individual income is less than the official poverty threshold.
Source: U.S. Census 2015 5-Year Estimates
Live in Urbanized Areasof 50,000 or more people in Census 2010.
Source: U.S. Census 2010
11% 25%
The Office of Healthcare Financing within Wyoming’s Department of Health operates an old-style fee-for-service NEMT program that is administered in-house. Wyoming invests less than most states in medical transportation. In 2013, the state reports spending just over $500,000 on NEMT, roughly 1/10 of 1 percent of its Medicaid budget.
Recipients in need of transportation to covered Medicaid services are expected to call a toll-free travel call center for assistance and authorization. Eighty percent of all NEMT trips involve reimbursing Medicaid
recipients for using their own vehicles. In 2013, approximately 9,000 medical trips were approved for fewer than 1,400 recipients, roughly 2 percent of the eligible Medicaid population. An estimated 5 percent of trips are taken on public transportation.
Since Wyoming’s federal match for the Medicaid program is 50 percent, the state is not penalized for maintaining NEMT as an administrative rather than a medical service.
March 2017
DEMOGRAPHICS
OPERATING AUTHORITYNEMT MODEL
Population Density
State Population
FTA Region 8
CMS Region 8
Page 105

Administrative ExpenseMedical ExpenseMixed
No program changes were reported.
NEMT expense is classified as:
50% Federal Medical Assistance Percentage in fiscal year 2017.
0% of all Medicaid enrollees are enrolled in any Medicaid managed care program as of July 2015.
$566 Million Medicaid expenditure in fiscal year 2015. Expenditures do not include administrative cost and accounting adjustments.
$517 Thousandis the estimated annual NEMT 2013 expense.
9,000is the 2013 estimated annual NEMT trips.
2% of all Medicaid enrollees in 2013 used NEMT.
5% of NEMT is public transit.
Source: Centers for Medicare & Medicaid Services Source: 2014 National NEMT Survey
Source: Kaiser Family Foundation
Source: Kaiser Family Foundation
Source: Kaiser Family Foundation
Source: 2014 National NEMT Survey
Kent
ucky
102.
8%87
.5%
69.3
%
50.6
%
34.6
%
20.0
% 30.6
%
8.1%
60.0
%
44.5
%
26.0
%
12.3
%
15.4
%
6.2%
77.1
%
64.7
%
49.7
%
34.6
%
16.7
% 25.9
%
8.1%
59.9
%
39.8
%
22.3
%
8.2% 14
.4%
5.8%
70.3
%
56.2
%
35.3
%
20.2
% 31.5
%
11.7
%
62.7
%
44.7
%
27.7
%
13.1
%
17.4
%
7.4%
57.4
%
38.8
%
21.9
%
5.0% 12
.0%
5.3%
3.9%
1.8%
-0.4
%
Nev
ada
Col
orad
oA
rkan
sas
New
Mex
ico
Mon
tana
Was
hing
ton
Cal
iforn
iaW
est V
irgin
iaO
rego
nRh
ode
Isla
ndN
ew H
amps
hire
Mar
ylan
dA
rizon
aA
lask
aN
ew Je
rsey
Loui
siana
Nor
th D
akot
aO
hio
Indi
ana
Mas
sach
uset
tsIo
wa
Penn
sylv
ania
Mic
higa
nM
inne
sota
Haw
aii
Illin
ois
New
Yor
kD
.C.
Del
awar
eVe
rmon
tTe
nnes
see
Nor
th C
arol
ina
Idah
oFl
orid
aM
issou
riG
eorg
iaSo
uth
Car
olin
aA
laba
ma
Kan
sas
Texa
sM
ississ
ippi
Virg
inia
Uta
hW
iscon
sinSo
uth
Dak
ota
Okl
ahom
aN
ebra
ska
Wyo
min
g
States that Expanded Medicaid under ACA*
States that Did Not Expand Medicaid under ACA*
120%
100%
-20%
0%
20%
40%
60%
80%
% Change from the Pre-ACA Summer 2013 to the Post-ACA December 2016 Source: Centers for Medicare & Medicaid Services
*Pre-ACA data for Connecticut not available *Pre-ACA data for Maine not available
-8.3%
KEY STATISTICS
RECENT OR FUTURE CHANGES
CUMULATIVE MEDICAID/CHIP ENROLLMENT CHANGE PRE-ACA AND POST-ACA BY STATE
Medicaid/CHIP Enrollment Medicaid Spending
Federal Medical Assistance
NEMT Expense Classification
NEMT Operating Facts
67,51861,925
010,00020,00030,00040,00050,00060,00070,00080,000
Pre-ACA(July–Sept. 2013)
Post-ACA(Dec. 2016)
Managed Care Enrollment
Wyoming decided not to adopt the Medicaid expansion under the ACA.
Monthly Average - 8.3%
Page 106