Premium Rate Determination in the Federal Crop Insurance...
14
Journal of Agricultural and Resource Economics, 19(2): 382-395 Copyright 1994 Western Agricultural Economics Association Premium Rate Determination in the Federal Crop Insurance Program: What Do Averages Have to Say About Risk? Barry K. Goodwin This article reviews actuarial procedures used to calculate premium rates in the federal crop insurance program. Average yields are used as an important indicator of risk under current rating practices. The strength and validity of this relationship is examined using historical yield data drawn from a large sample of Kansas farms. The results indicate that assumed relationships be- tween average yields and yield variation are tenuous and imply that rating procedures that rely on average yields may induce adverse selection. Key words: actuarial practices, federal crop insurance, yield distributions. Introduction The U.S. federal crop insurance program plays an important role in policy efforts to provide farmers protection against catastrophic yield shortfalls. Federally regulated crop insurance programs have been in existence since the 1930s, although participation gen- erally has been quite limited.' The current program has been criticized because of high costs and poor actuarial performance. Government outlays for the federal crop insurance program exceeded $9.2 billion between 1980 and 1990. Over this period, indemnity outlays totaled over $7.1 billion while premiums collected from producers were only $3.8 billion. This corresponds to net losses (excluding administrative costs) that exceed $3.3 billion and implies that, on average, farmers received $1.88 in indemnities for each $1 of premiums paid (i.e., a loss ratio of 1.88). Many critics of the federal crop insurance program point to adverse selection and moral hazard as reasons for the poor actuarial performance of the program. Both problems are intimately related to the Federal Crop Insurance Corporation's (FCIC) actuarial deter- mination of insurance premium rates. Adverse selection occurs if premiums do not ac- curately reflect an individual farmer's likelihood of loss. Because producers are better able to ascertain their likelihood of suffering losses than are insurers, adverse selection remains a serious problem affecting the actuarial soundness of the crop insurance program. Moral hazard refers to the problem that occurs if producers alter their behavior after buying insurance in order to increase their likelihood of collecting indemnities. If rates do not adjust as loss risk rises, the actuarial performance of the industry will be threatened. In any insurance market, adverse selection problems can be traced directly to the actuarial practices that are used to calculate insurance premium rates. If individual risks cannot be identified and premiums are based upon some aggregate risk measure, then low risk producers will be overcharged for their insurance and high risk producers will be The author is an associate professor in the Department of Agricultural and Resource Economics at North Carolina State University. This research was supported by the Federal Crop Insurance Corporation, the North Carolina Agricultural Research Service, and the Kansas Agricultural Experiment Station. The helpful comments of Terry Kastens, Vince Smith, Leiann Nelson, Vondie O'Conner, Jerry Skees, Myles Watts, and an anonymous reviewer are gratefully acknowledged. 382
Transcript of Premium Rate Determination in the Federal Crop Insurance...
Journal of Agricultural and Resource Economics, 19(2): 382-395Copyright 1994 Western Agricultural Economics Association
Premium Rate Determination in the Federal CropInsurance Program: What Do Averages Have toSay About Risk?
Barry K. Goodwin
This article reviews actuarial procedures used to calculate premium rates inthe federal crop insurance program. Average yields are used as an importantindicator of risk under current rating practices. The strength and validity ofthis relationship is examined using historical yield data drawn from a largesample of Kansas farms. The results indicate that assumed relationships be-tween average yields and yield variation are tenuous and imply that ratingprocedures that rely on average yields may induce adverse selection.
Key words: actuarial practices, federal crop insurance, yield distributions.
Introduction
The U.S. federal crop insurance program plays an important role in policy efforts toprovide farmers protection against catastrophic yield shortfalls. Federally regulated cropinsurance programs have been in existence since the 1930s, although participation gen-erally has been quite limited.' The current program has been criticized because of highcosts and poor actuarial performance. Government outlays for the federal crop insuranceprogram exceeded $9.2 billion between 1980 and 1990. Over this period, indemnityoutlays totaled over $7.1 billion while premiums collected from producers were only $3.8billion. This corresponds to net losses (excluding administrative costs) that exceed $3.3billion and implies that, on average, farmers received $1.88 in indemnities for each $1of premiums paid (i.e., a loss ratio of 1.88).
Many critics of the federal crop insurance program point to adverse selection and moralhazard as reasons for the poor actuarial performance of the program. Both problems areintimately related to the Federal Crop Insurance Corporation's (FCIC) actuarial deter-mination of insurance premium rates. Adverse selection occurs if premiums do not ac-curately reflect an individual farmer's likelihood of loss. Because producers are better ableto ascertain their likelihood of suffering losses than are insurers, adverse selection remainsa serious problem affecting the actuarial soundness of the crop insurance program. Moralhazard refers to the problem that occurs if producers alter their behavior after buyinginsurance in order to increase their likelihood of collecting indemnities. If rates do notadjust as loss risk rises, the actuarial performance of the industry will be threatened.
In any insurance market, adverse selection problems can be traced directly to theactuarial practices that are used to calculate insurance premium rates. If individual riskscannot be identified and premiums are based upon some aggregate risk measure, then lowrisk producers will be overcharged for their insurance and high risk producers will be
The author is an associate professor in the Department of Agricultural and Resource Economics at NorthCarolina State University.
This research was supported by the Federal Crop Insurance Corporation, the North Carolina AgriculturalResearch Service, and the Kansas Agricultural Experiment Station.
The helpful comments of Terry Kastens, Vince Smith, Leiann Nelson, Vondie O'Conner, Jerry Skees, MylesWatts, and an anonymous reviewer are gratefully acknowledged.
382
Crop Insurance Premium Rate Determination 383
undercharged. As a result, high risk producers are more likely to insure and the riskinessof the pool tends to be higher than would be the case if premiums were actuarially fair.2
The poor actuarial performance of the federal crop insurance program has led criticsto recommend that premium rates be raised to lower losses. For example, a 1992 U.S.General Accounting Office (USGAO) report noted that "... our periodic financial audits... confirm that FCIC has not charged high enough premiums to achieve actuarial sound-ness" (p. 25). However, recent research (Goodwin) has demonstrated that high risk pro-ducers are less responsive to premium increases than low risk producers. In this light,efforts to lower losses through across-the-board premium rate increases may actuallyworsen the actuarial performance of the program as high risk producers comprise an ever-increasing proportion of a smaller insurance pool. A superior solution would require thatrate-setting techniques be altered to alleviate adverse selection by charging premium ratesthat better reflect individual producers' risks.
This study considers the role of adverse selection in current premium-setting techniquesthat are used by the FCIC to rate the federal crop insurance program. The federal cropinsurance program is described briefly in the following section. In the next section, adescription is provided of the current actuarial practices used by the FCIC to calculateinsurance premium rates. Possible shortcomings of these practices are noted. The fourthand fifth sections consider an empirical analysis of loss risks and average yields usingfarm-level data for a large sample of Kansas crop farms observed between 1981 and 1991.The final section contains a brief summary of the study and some concluding remarksare offered.
The Federal Crop Insurance Program
Under current federal crop insurance programs for most field crops, producers are ableto select from three guaranteed yield levels (50%, 65%, or 75% of their insurable yield)and from a range of guaranteed price levels. Price election levels are determined fromFCIC forecasts of expected prices. The top price election level is set at 90-100% of theexpected market price. Prior to 1994, three price election levels were available for mostcrops. Recent program changes now allow price elections between 30-100% of the topprice election level. If the producer's yield falls below the elected coverage level, theproducer receives an indemnity payment equal to the product of the elected price coverageand the yield shortfall. This yield shortfall is determined by the amount that actual yieldsfall short of the farm's insured yield.
The per-acre premium is determined by the product of the price guarantee, the yieldguarantee, the FCIC's estimate of the farm's yield, and the premium rate. Under the 1980Act, subsidies were introduced to encourage participation in the program. There is a 30%subsidy on the 50% and 65% yield guarantees. The subsidy for the 75% yield guaranteeis equal to the dollar amount of the 65% guarantee level. Federal crop insurance is currentlyavailable for about 40 different crops.
FCIC's Actuarial Determination of Insurance Premium Rates3
Many believe that adverse selection is the most significant problem affecting the actuarialsoundness of the federal crop insurance program (Miranda). The presence (or absence) ofadverse selection is directly related to the extent to which insurance premiums accuratelyreflect the likelihood of losses. The FCIC adopts a number of assumptions when deter-mining insurance premium rates that may induce adverse selection in the insurance pool.The most fundamental (though not necessarily most serious) shortcoming associated withrate-setting practices is that rates are determined for a relatively large geographic area(i.e., the county in which the farm is located). Thus, all individuals with the same average
Goodwin
Journal of Agricultural and Resource Economics
yield in a county pay an identical premium rate (dollars per hundred dollars of liability)for the same crop and practice type.
Prior to 1985, insurance levels (i.e., the liability levels calculated from insurable yields)were determined using average yields (for both insurance purchasers and nonpurchasers)in the farm's geographic area. This resulted in adverse selection since farms with loss risksabove the area averages comprised an ever-increasing proportion of the insured pool. Inan attempt to address the problem of adverse selection, the FCIC revised its determinationof insurable yields in 1985 by instead examining the actual production history (APH) ofthe farm when determining insurable yield levels.
Under the APH approach, insurable yields and premium rates are calculated by ex-amining the average yield of the farm's preceding 10 years of production data. Beginningwith the 1994 crop year, producers could qualify for APH yields with only four years ofproduction data, although up to 10 years of data are used if available. If less than fouryears of actual data are available, weighted Agricultural Stabilization and ConservationService (ASCS) program yields are used in place of the missing yields. Farms purchasecoverage to insure a given proportion (50%, 65%, or 75%) of their average yields. As willbe developed in detail below, direct use of average yields without consideration of yieldvariation may poorly represent the likelihood of collecting indemnity payments.
In the actuarial determination of county-level rates, the FCIC examines a number offactors. The first step in rate determination involves an examination of the 20-year losshistory of a given county. Loss cost ratios for the preceding 20 years are examined.4 Thefour largest loss cost ratios are capped at the level of the fifth largest ratio. The cappeddata are grouped into a pool (representing a catastrophic loading factor) which later isspread over the entire state. The capped loss cost ratios plus the 16 lowest loss cost ratiosare averaged to obtain a county loss cost ratio which then is used to construct an actuariallysound rate for each county. The loss cost ratios then are smoothed across county lines.This smoothing is undertaken to soften large differences in the cost of insurance forneighboring farms. The catastrophic loading factor next is spread across the entire stateand rates are adjusted accordingly. The resulting rates are set for a given crop practice(e.g., irrigated versus dryland production) at the county level. The smoothing and loss-spreading practices may induce adverse selection into rates since high loss-risk countieslikely will see lower rates while low loss-risk counties will see higher rates.
Next, rates are adjusted according to county average yields, as represented by yield datacalculated by the National Agricultural Statistics Service (NASS). 5 Rates are adjustedinversely with county average yields. Thus, counties with high average yields realizepremium rate discounts relative to counties with low average yields, regardless of actuallosses or yield variation.
County rates are spread over a range of average yields using a proportional spanningprocedure. Under the proportional spanning procedure, nine discrete risk categories aredefined and rates in each category are inversely adjusted according to the farm's averageyield. In this way, farms with higher average yields have lower premium rates. In addition,because of the proportional nature of the discounting, as average yields increase, thepremium falls at an increasing rate.
A final constraint faced by the FCIC in its actuarial determination of premiums is arestriction imposed by legislation that limits the amount that a rate can increase fromyear to year. In most cases, premium rates may not increase by more than 20% from oneyear to the next. This constraint may bring about a reduction in the flexibility affordedto the FCIC for eliminating adverse selection through premium rate adjustments.
Average Yields and Yield Variation: What Do Averages Say About Risk?
An important assumption implicit in the FCIC's actuarial practices involves the assumedrelationship between average yields and the likelihood of loss. Botts and Boles noted thatthe FCIC's use of average yields assumes a constant relationship between mean yields
384 December 1994
Crop Insurance Premium Rate Determination 385
and the variance of yields. Specifically, they noted that the standard deviation of yieldsis assumed to be one-fourth of the mean of yields (i.e., that the coefficient of variation is25%).
Skees and Reed used yield averages and standard deviations for four relatively smallsamples collected from corn and soybean farms in Kentucky and Illinois to evaluate therelationship between yield averages and standard deviations.6 Their results indicated thatno strong relationship existed between the mean yield and the standard deviation of yields.They also evaluated the relationship between the coefficient of variation (the ratio of thestandard deviation to the average) and the mean of yields. Their results indicated thatthe coefficient of variation of yields tended to fall as average yields rise, giving supportfor rate-setting techniques that apply discounts as average yields rise.
A weakness associated with inferences drawn from such an analysis is the fact that theestimated relationship between average yields and yield variation is of an aggregate (av-erage) nature. Although Skees and Reed do not explicitly report their regression results,the lack of a significant relationship between average yields and the standard deviationof yields suggests that considerable variation in this relationship existed across the farmsin their sample. An important point to recognize is that the farms that purchase insuranceare not likely to be randomly drawn from this aggregated sample. That is, finding norelationship between the mean and standard deviation of yields in an aggregate sample(or even an imperfect relationship) suggests that the potential exists for a self-selectedsubset of the sample to be at one extreme of this relationship. In particular, it is expectedthat insurance buyers will tend to have a higher yield variance relative to their meanyields than those farms that do not insure.
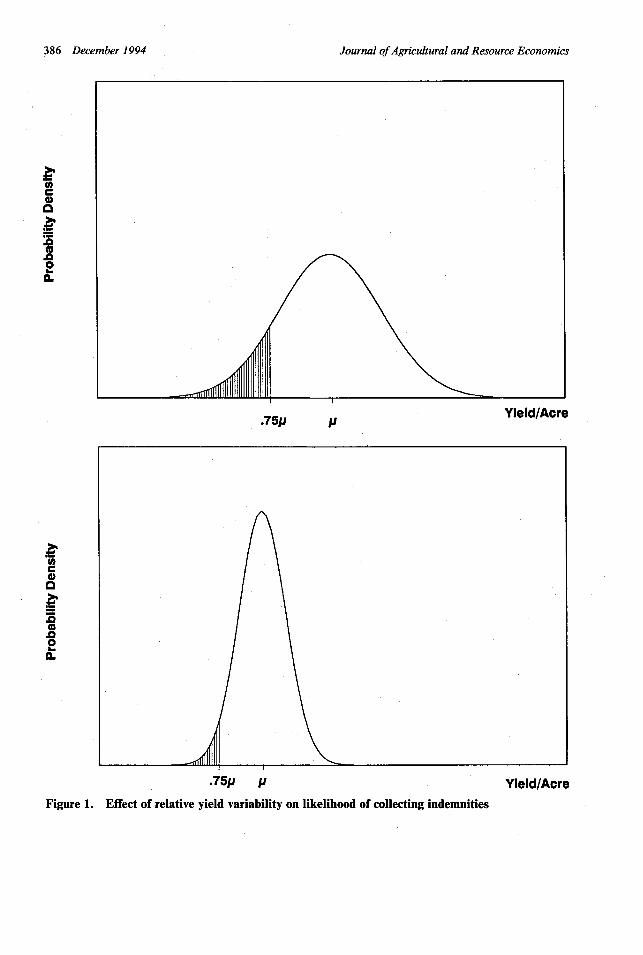
The use of average yields as an indicator of loss risk may introduce adverse selectioninto the insurance pool if the relationship between average yields and relative yield vari-ation is not strong. The important factor determining loss risk is relative yield variation(i.e., variation relative to the mean). Consider the yield distributions illustrated in figure1.7 The top panel of the figure illustrates the yield distribution for a farm with a highmean and a high relative variance of yields. The bottom panel illustrates a farm with alow average yield and a low relative yield variance. Assuming that both farms chooseinsurance coverage at the 75% yield election, indemnities are collected only when yieldsfall below 75% of the mean. The likelihood of suffering a collectable loss is illustrated bythe shaded areas of each distribution. In this case, the farm with the higher average yieldis considerably more likely to collect an indemnity payment than is the farm with thelower average yield. Further, when the farm with the higher average yield collects indem-nities, the indemnity payments will be considerably higher since the indemnity is deter-mined from a higher average yield.
In reality, considerable variation likely exists in the relationship between average yieldsand yield variation across different farms. That is, if one examines this relationship fora large sample of farms using regression analysis and finds a relatively low degree ofexplanatory power (i.e., a low R2), it is likely that there are some farms with yield distri-butions similar to the one illustrated in the first panel and others with distributions likethat given in the second panel. However, the important point to note is that farms of thesort illustrated in the first panel are much more likely to purchase insurance. If rates aredetermined using average yields, farms with high relative yield variation likely will beundercharged. Conversely, farms with relatively low relative yield variation will be over-charged for insurance and thus will be less likely to buy coverage.
An Evaluation of Yield Averages, Yield Variance, and Empirical Premium Rates
In a manner similar to that undertaken by Skees and Reed, the relationship between themean of yields and the standard deviation of yields was evaluated using data drawn from2,247 farms in the Kansas Farm Management Databank. Ten years of yield data (1981-90) were used to calculate yield averages and standard deviations.8 Table 1 illustrates the
Goodwin
Journal of Agricultural and Resource Economics
Ca,a
3
I-
a.co
m
2
.~75p p Yield/Acre.75p ji
0Ca,
(a
0inCL
.75p p- Yield/Acre
Figure 1. Effect of relative yield variability on likelihood of collecting indemnities
386 December 1994
Crop Insurance Premium Rate Determination 387
Table 1. Relationship Between Means and Standard Deviations of Yields (or = i, + 1uti) for KansasFarms (1981-90)
F-Test ofHo: ,o = 0, Average
Crop _ io /, n R2 , 1=.25 CV
Dryland Wheat 7.6868 .0809 864 .019 224.99* 31.5168(.6790)* (.0200)* (.3361)
Irrigated Wheat 12.6968 .0010 66 .001 10.13* 28.0701(3.0817)* (.0654) (1.2416)
Dryland Corn 20.2925 .0834 139 .035 61.02* 32.0720(3.3628)* (.0377)* (.7233)
Irrigated Corn 38.6819 -.1284 82 .066 437.67* 16.2294(7.4046)* (.0538)* (1.0472)
Dryland Sorghum 14.4434 .0866 629 .068 314.98* 33.3429(.8237)* (.0129)* (.4359)
Irrigated Sorghum 23.1458 -. 0352 52 .005 12.29* 21.9779(6.8575)* (.0716) (1.5419)
Dryland Soybeans 5.9383 .1559 389 .146 521.49* 40.1726(.4990)* (.0192)* (.5329)
Irrigated Soybeans 13.7560 -. 1235 39 .155 87.96* 17.5311(2.3109)* (.0481)* (1.2455)
Notes: Numbers in parentheses in [fo and f, columns are standard errors, and in Average CV column are standarderrors of the means. An asterisk (*) indicates statistical significance at the .05 level.
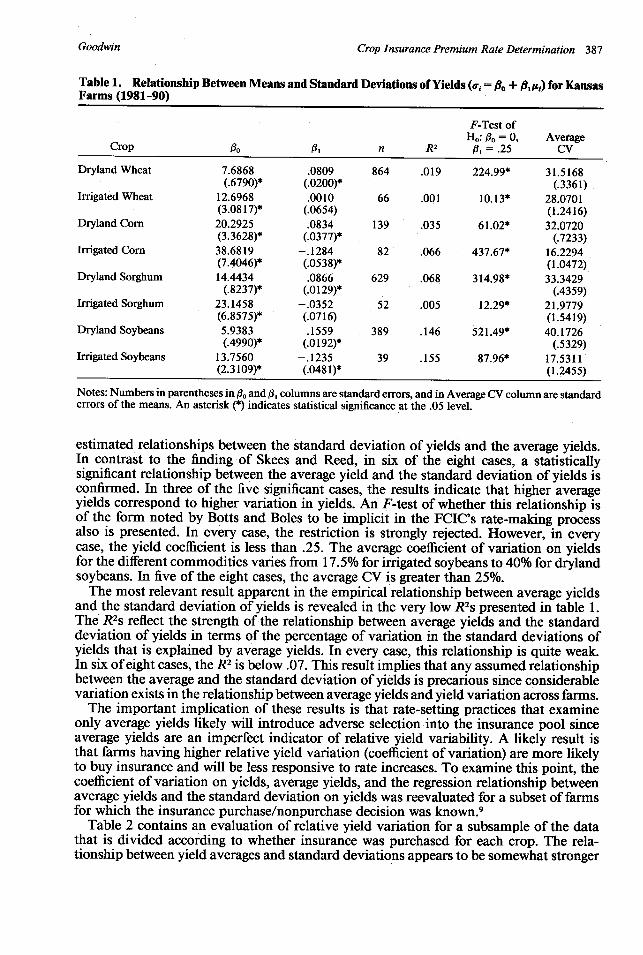
estimated relationships between the standard deviation of yields and the average yields.In contrast to the finding of Skees and Reed, in six of the eight cases, a statisticallysignificant relationship between the average yield and the standard deviation of yields isconfirmed. In three of the five significant cases, the results indicate that higher averageyields correspond to higher variation in yields. An F-test of whether this relationship isof the form noted by Botts and Boles to be implicit in the FCIC's rate-making processalso is presented. In every case, the restriction is strongly rejected. However, in everycase, the yield coefficient is less than .25. The average coefficient of variation on yieldsfor the different commodities varies from 17.5% for irrigated soybeans to 40% for drylandsoybeans. In five of the eight cases, the average CV is greater than 25%.
The most relevant result apparent in the empirical relationship between average yieldsand the standard deviation of yields is revealed in the very low R2 s presented in table 1.The R2 s reflect the strength of the relationship between average yields and the standarddeviation of yields in terms of the percentage of variation in the standard deviations ofyields that is explained by average yields. In every case, this relationship is quite weak.In six of eight cases, the R2 is below .07. This result implies that any assumed relationshipbetween the average and the standard deviation of yields is precarious since considerablevariation exists in the relationship between average yields and yield variation across farms.
The important implication of these results is that rate-setting practices that examineonly average yields likely will introduce adverse selection into the insurance pool sinceaverage yields are an imperfect indicator of relative yield variability. A likely result isthat farms having higher relative yield variation (coefficient of variation) are more likelyto buy insurance and will be less responsive to rate increases. To examine this point, thecoefficient of variation on yields, average yields, and the regression relationship betweenaverage yields and the standard deviation on yields was reevaluated for a subset of farmsfor which the insurance purchase/nonpurchase decision was known. 9
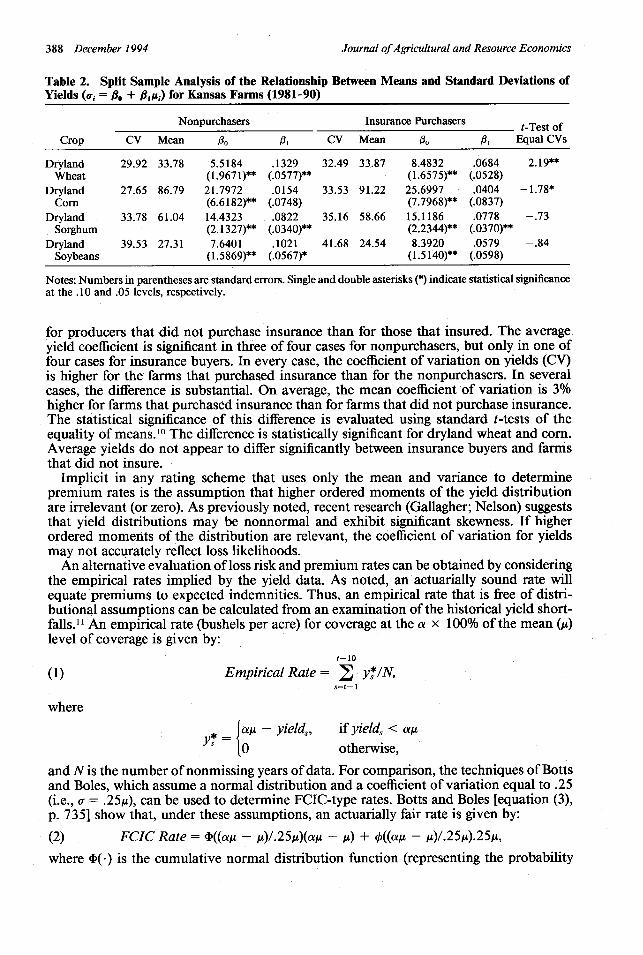
Table 2 contains an evaluation of relative yield variation for a subsample of the datathat is divided according to whether insurance was purchased for each crop. The rela-tionship between yield averages and standard deviations appears to be somewhat stronger
Goodwin
Journal of Agricultural and Resource Economics
Table 2. Split Sample Analysis of the Relationship Between Means and Standard Deviations ofYields (a, = io + f1,ij) for Kansas Farms (1981-90)
Nonpurchasers Insurance Purchasers Ttt-Test ofCrop CV Mean ,0 /I CV Mean 0 AI Equal CVs
Dryland 29.92 33.78 5.5184 .1329 32.49 33.87 8.4832 .0684 -2.19**Wheat (1.9671)** (.0577)** (1.6575)** (.0528)
Dryland 27.65 86.79 21.7972 .0154 33.53 91.22 25.6997 .0404 -1.78*Corn (6.6182)** (.0748) (7.7968)** (.0837)
Dryland 33.78 61.04 14.4323 .0822 35.16 58.66 15.1186 .0778 -.73Sorghum (2.1327)** (.0340)** (2.2344)** (.0370)**
Dryland 39.53 27.31 7.6401 .1021 41.68 24.54 8.3920 .0579 -.84Soybeans (1.5869)** (.0567)* (1.5140)** (.0598)
Notes: Numbers in parentheses are standard errors. Single and double asterisks (*) indicate statistical significanceat the .10 and .05 levels, respectively.
for producers that did not purchase insurance than for those that insured. The averageyield coefficient is significant in three of four cases for nonpurchasers, but only in one offour cases for insurance buyers. In every case, the coefficient of variation on yields (CV)is higher for the farms that purchased insurance than for the nonpurchasers. In severalcases, the difference is substantial. On average, the mean coefficient of variation is 3%higher for farms that purchased insurance than for farms that did not purchase insurance.The statistical significance of this difference is evaluated using standard t-tests of theequality of means.' ° The difference is statistically significant for dryland wheat and corn.Average yields do not appear to differ significantly between insurance buyers and farmsthat did not insure.
Implicit in any rating scheme that uses only the mean and variance to determinepremium rates is the assumption that higher ordered moments of the yield distributionare irrelevant (or zero). As previously noted, recent research (Gallagher; Nelson) suggeststhat yield distributions may be nonnormal and exhibit significant skewness. If higherordered moments of the distribution are relevant, the coefficient of variation for yieldsmay not accurately reflect loss likelihoods.
An alternative evaluation of loss risk and premium rates can be obtained by consideringthe empirical rates implied by the yield data. As noted, an actuarially sound rate willequate premiums to expected indemnities. Thus, an empirical rate that is free of distri-butional assumptions can be calculated from an examination of the historical yield short-falls." An empirical rate (bushels per acre) for coverage at the a x 100% of the mean (a)level of coverage is given by:
t-10
(1) Empirical Rate = A y*/N,s=t- 1
where
* - yield, if yields < ags ~O 0otherwise,
and N is the number of nonmissing years of data. For comparison, the techniques of Bottsand Boles, which assume a normal distribution and a coefficient of variation equal to .25(i.e., a = .25,t), can be used to determine FCIC-type rates. Botts and Boles [equation (3),p. 735] show that, under these assumptions, an actuarially fair rate is given by:
(2) FCIC Rate = b((ae - t))/.25))(at - pt) + q((a- )/ .25,).25 ,
where D(*) is the cumulative normal distribution function (representing the probability
388 December 1994
Crop Insurance Premium Rate Determination 389
Table 3. Average Empirical Premium Rates and Rates Based upon Normal Distribution with CV= 25% for .75pz Coverage Level (bu./acre): Entire Sample and Split Sample Analyses for KansasFarms (1981-90)
Insurance t-Tests ofEntire Sample Nonpurchasers Purchasers Equal Rates
Empirical FCIC Empirical FCIC Empirical FCIC Empirical FCICCrop Rate Ratea Rate Ratea Rate Ratea Rate Ratea
Dryland Wheat 1.4158 .6997 1.2488 .7035 1.5629 .7054 -2.61** -.14(.9663) (.1075) (.8774) (.0958) (.9686) (.1151)
Dryland Corn 4.0887 1.8315 2.8590 1.8079 4.3478 1.9000 -2.09** -1.52(2.2954) (.3089) (2.0034) (.3596) (1.9008) (.4033)
Dryland Sorghum 2.6314 1.3038 2.6597 1.2714 2.7628 1.2218 -.42 1.03(1.6708) (.3181) (1.6425) (.3056) (1.4990) (.3027)
Dryland Soybeans 1.6322 .5277 1.6926 .5689 1.6214 .5112 .39 1.94*(.7506) (.1209) (.8145) (.1265) (.7716) (.1301)
Notes: Entire sample refers to larger sample of 2,247 farms, while split sample analysis is conducted for 572farms for which insurance purchase decisions are known. Numbers in parentheses are standard errors. Singleand double asterisks (*) indicate statistical significance at the .10 and .05 levels, respectively.a FCIC rates are calculated using the technique described by Botts and Boles, assuming normality and a = .25t.
that a yield less than aui will be observed) and 0(-) is the unit normal density function(representing the ordinate of the normal distribution at art).
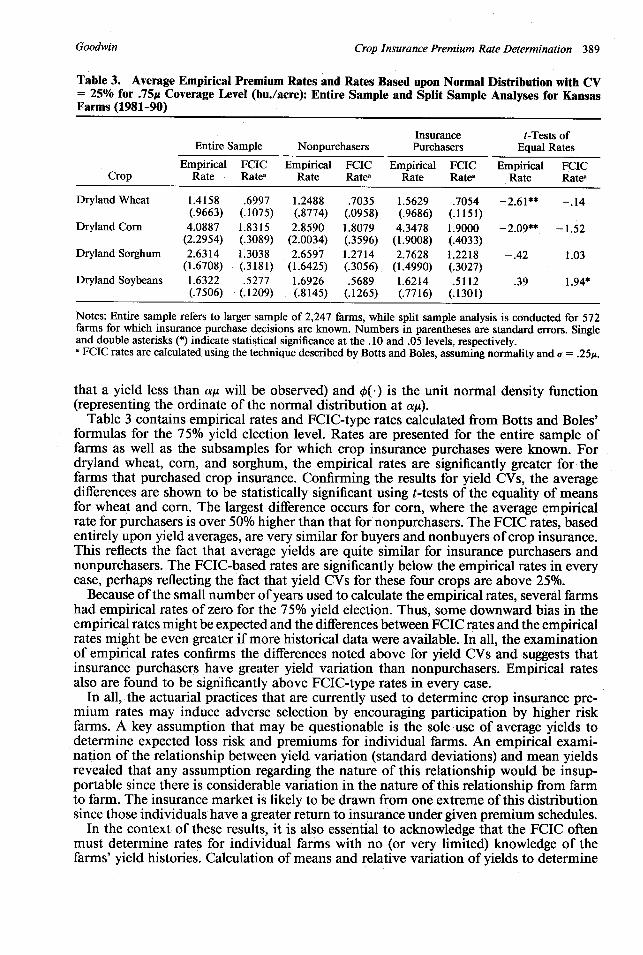
Table 3 contains empirical rates and FCIC-type rates calculated from Botts and Boles'formulas for the 75% yield election level. Rates are presented for the entire sample offarms as well as the subsamples for which crop insurance purchases were known. Fordryland wheat, corn, and sorghum, the empirical rates are significantly greater for thefarms that purchased crop insurance. Confirming the results for yield CVs, the averagedifferences are shown to be statistically significant using t-tests of the equality of meansfor wheat and corn. The largest difference occurs for corn, where the average empiricalrate for purchasers is over 50% higher than that for nonpurchasers. The FCIC rates, basedentirely upon yield averages, are very similar for buyers and nonbuyers of crop insurance.This reflects the fact that average yields are quite similar for insurance purchasers andnonpurchasers. The FCIC-based rates are significantly below the empirical rates in everycase, perhaps reflecting the fact that yield CVs for these four crops are above 25%.
Because of the small number of years used to calculate the empirical rates, several farmshad empirical rates of zero for the 75% yield election. Thus, some downward bias in theempirical rates might be expected and the differences between FCIC rates and the empiricalrates might be even greater if more historical data were available. In all, the examinationof empirical rates confirms the differences noted above for yield CVs and suggests thatinsurance purchasers have greater yield variation than nonpurchasers. Empirical ratesalso are found to be significantly above FCIC-type rates in every case.
In all, the actuarial practices that are currently used to determine crop insurance pre-mium rates may induce adverse selection by encouraging participation by higher riskfarms. A key assumption that may be questionable is the sole use of average yields todetermine expected loss risk and premiums for individual farms. An empirical exami-nation of the relationship between yield variation (standard deviations) and mean yieldsrevealed that any assumption regarding the nature of this relationship would be insup-portable since there is considerable variation in the nature of this relationship from farmto farm. The insurance market is likely to be drawn from one extreme of this distributionsince those individuals have a greater return to insurance under given premium schedules.
In the context of these results, it is also essential to acknowledge that the FCIC oftenmust determine rates for individual farms with no (or very limited) knowledge of thefarms' yield histories. Calculation of means and relative variation of yields to determine
Goodwin
390 December 1994
0
as
1-400
0\
ON
V"
W
ni
0
A4(
0
Cs
W
141.
ni0
WS~1a
u
tr
'a
u
10
10
I.'
U
'a
I
0
0
000
00
U
0-0a9
Journal ofAgricultural and Resource Economics
* *
'lC> 1. n o o en Ir mo 00 a^ ooI a -a oon en' C4 emn 00 N oo t r r000 ,or 00 ,t Cl 00 e0o 0 0 0o o\ f rn cn 00 n m n Co oo0 T en ' m 00o 000 en r o00 NCo 00 o\ -o cln -- 00- - oo - en \m 0 mo eo 0 a n 00o- , - e n - 1 0^oo00a- ' o - %o n ft 1o r. o 00 oen 0 ^ o0 o-0 o 0 N o- 0- o- en en N I0 '0 t
o
00 oo ^ o - o - - O 0 N < 0'O 0- O O - - ' 0 00-O ' 0 oo ^ o '0 O F 0%' 00^ - 00 I1 N 01 '.0 t \O l 0 O'-' " ( O- O I 0 a 00- tN 'jW 0- '04 l'
en N- '. 0 ON '.0 - ON 0% en 0 en - Cl 000 '. V - WI'e r- N I ' N kn a,% - - -tn
O -, otl r. o o',t ' N " o o' oo - \ , N t oo- ' O,"" ' o" o r 0 00 as. - N I \- o 00
Co "o rO 00 nO tn d 0 -U C) \ en 00 IT \ 0» ^ % 0 0
-L
V r 00 t t^ 00 oo en 00 en N en n
- .l I i _ -I _ I _ '* *
(7 00 %NN'.000 o - e 0 N e 00 % -000 00 O- 1 tO ' oi N C0 .0- 0o t" 0 Ooo os 0 ' -O 00 ot" -oO0 C - 0ooo ^ o NO 00 0 c ^N" 0 ' Cn O n, 00 -t
o^O ' O ^ ^- O t O O -- '-' - O O , -- O O t ^ 0 0 o 00 t' ,,
*o .o .i . 2 .- * . * . * o . ' . * * * * .*- . -.t o e. . * ho . .0%1' O,,-' ' eel e' O "0 000 N..- O-'N O'fO % 0- ' , 0o 00 00' el C- oo 0% c- NO cl
_ _ I I I O 'O
_ I _ _~~~ I_
,-. een m M 00 ooo Io eo WI -M as o\ as O, as C O Ot- ,--, 1 -. o ,M ,r ,i' (O N, ON c3M O ON oo*- oo* e * o t m _ O n o* N emo M o o oo oN o t oo --d - r CO - oo00 ^ ,c' " , O- O ' e 00 IO I , 0% T 0 'o V 00 _0 ' oor 00-o 0 - C' .
00 C4 O o0 00 rm Cl O O O 0% ( O n O " 0 Cl C- C) 0 O N t RT tn r N '.0 eM C 'W Cl ena- \ o oo o o o o -- o-0 o0 t--0 - o o 0- 0*- o 0 en.0 o o .
* [^ I I I* * *
0o o'. oo i00.
-O --O oo -o CD o N t- It . N-- ON , ' C r ,' e, N' 't '0 o Or eo 0- oo00 oo -" W 00 aoN o0o .o0 0 enr 00 00 "o C O t ^ mn oo - . 00 eM WOO t C" 0s-N oo00C CD N - e-t r- N 00 I VIm -4 enS R -i d Cl en 00 o O CD 00 - t-s , eno 't o C' O en Cl OO OO OO ' o oo oo t o a oo 'oo ft- ON t C.t C O e^ 0
I -..- _ I _ _
C" l\ tNO c O' ncW en t 00^ m oo 00 oo, ,n ' ' cn O\% cl 0 o\ o 0.- 00 'i- e 00oorC e e 'O ^ t-' ' It n I O oo C 000 o s O'O 'O O O ' T O - 'T 0 o00 O r' -- -ON,- d' e in '- tt ee , t--t- e- n N- It Wm CI 00 NC O O 00 Cl ' t t 00 N mt '.0 -o 0
"O m IO -( c. - o\ O O O , W,- O O ," en en 00 O0 O ' :! t r O W \or - - W* . . . . . . . . .. . . . . . *
I 0, , 00 O' 00 00 oclr- t- en t, , - t"4 e tO' en eo 00soo't O o^ o t ' ,%O 'o t o 0, O t' ooo00 N ' It o- 1t 'ON e 't m1 ,uO iVno ,l O O t 00 t 'o ('oo00 Ir O O el - 'tl' ~ ' oo\oo00 o- tso t" l o ,- -00 oo o 0 t- \- C -- oo ooo (m t0 , en t, e- t -- ,nO OM Co O C' N I een
t t r-.o r- oo ,, - O oo oo oo o t.- oo -O e -r u o - -. -I O. O o.i; r~i ̂7"" '" r; '^ i
~ _ I
I mega| C2° 4DZ§U k l§^i|^^§^:
k QO^^^S) Oo^^o oo§ U G i
Crop Insurance Premium Rate Determination 391
Cr en-O 00
00 \ON- \o*r
·- r-( 0 0 oo00 In\o t ' oo 00 en
WI 0 -00 " CNo 00 r4 n 0N or^i v od >n o(0 1
00 00tn 00
-
* n
00 ^-«IN _
C-4
en roo - 00o oo c oo ". c^0% 000 0%'e0 "'%
0 NO ("
* *,
0 0 00 oo 00- 4O N SO "0 .O v '0% ( 0% 0\ O -t-'r * ) od0- z
O r u
00
C*4 *00 00CS 0010 0O
-. *00'* 0If\
00
'nSO0
IRT *N (NI1 0%
0 *kn ttn 0
,..,
tn *
0O 0000 -en
*
*t co * *
'.0 *
* <
os ' ,r
00 00
Go,
(0
0
10
Cd
'U
ran
U
Cd
W
*
U,
CU
0
Cd
W
$.4
V
·(/
0
'0
'UU,
4)
,C
'U
4)cU
4)
Goodwin
W
0O
(A
0O
E0u
(A
04
U'0
-4)
U'o
0
V)
Ei
0
V)
o0u
rm
4)'-4
'4
Journal of Agricultural and Resource Economics
expected loss risk is difficult or even impossible in this case. Farms that often collectindemnities may even drop in and out of the program to prevent developing a yield historythat would result in their paying high rates. 12 In the case of farms with insufficient yieldhistories upon which to base an estimate of relative yield variation, a high expected risklevel should be assigned. To some extent, the FCIC does apply such a penalty by usingtransition yields (t-yields) which determine rates and insurable yields by using a proportionof ASCS program yield data.
Prediction of Relative Yield Variation
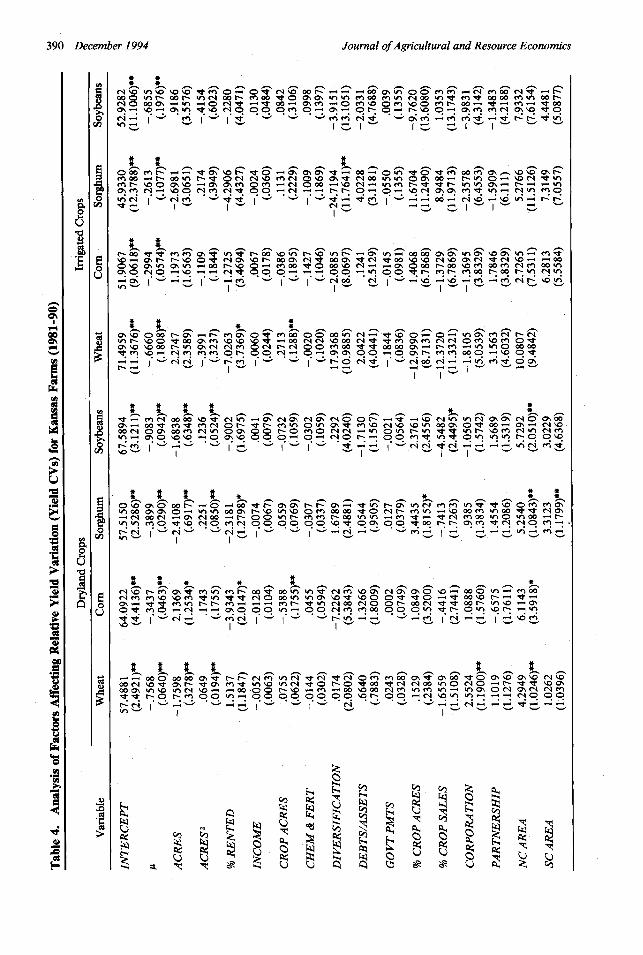
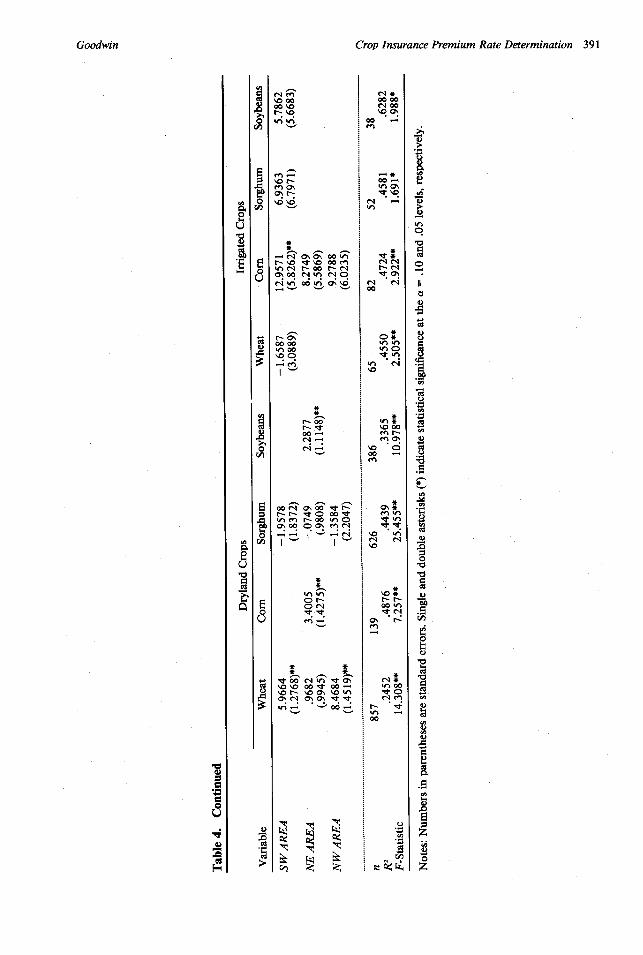
Given the tenuous nature of the relationship between yield averages and standard devi-ations, a relevant question is whether observable farm characteristics could be used toimprove measurement of yield risk in rating insurance. Private insurance contractors (e.g.,property, life, and health insurance providers) typically use observable factors which arecorrelated with risk to assign premium rates. A number of observable farm operationcharacteristics were collected from the Kansas data and used in conjunction with the yieldhistories to evaluate factors that might be useful in improving estimates of the likelihoodof yield shortfalls. In addition to average yields (u), these factors include the size of theenterprise (ACRES), size squared (ACRES 2), the percent of the operation that is rented(% RENTED), net farm income (INCOME), total crop acres (CROP ACRES), fertilizerand chemical expenditures per crop acre (CHEM & FERT), a Herfindahl index of di-versification calculated from sales shares (DIVERSIFICATION), leverage (DEBTS/AS-SETS), government payment receipts per crop acre (GOVT PMTS), the percent of totalfarm acres engaged in crop production (% CROP ACRES), the percent of total salesrepresented by crops (% CROP SALES), dummy variables representing corporate enter-prises (CORPORATION) and partnerships (PARTNERSHIP), and a series of regionaldummy variables that distinguish six different geographic regions of Kansas. Coefficientsof variation for each of the eight different crop enterprises were regressed against thesevariables. Average values of the observable farm characteristics over the 1981 through1990 period are used in the regressions. The results are presented in table 4.
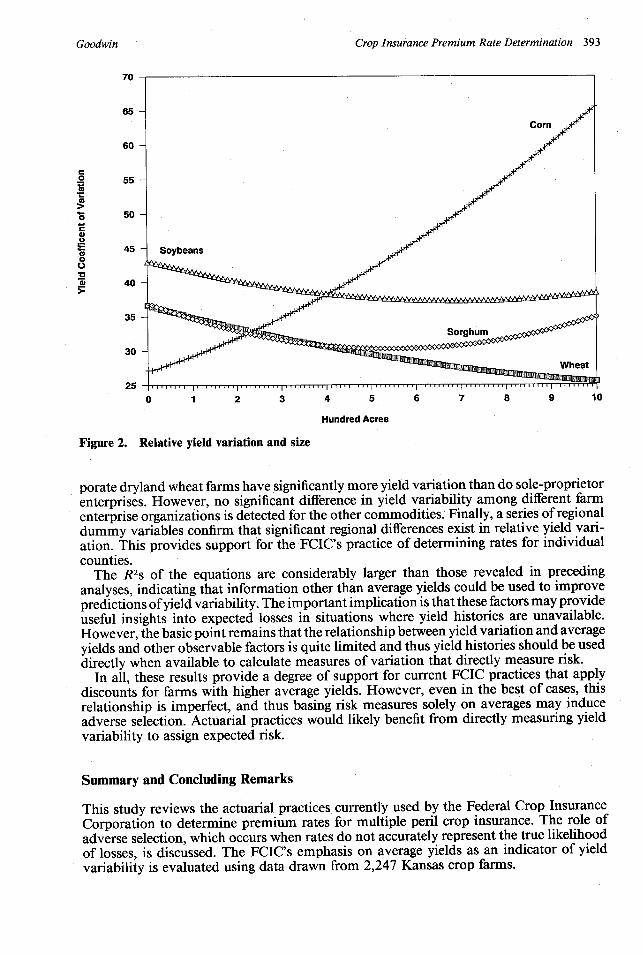
Average yields are inversely correlated with relative yield variation in every case. Thisrelationship is highly significant for every crop. Significant size effects are also revealedfor the dryland enterprises. For wheat, grain sorghum, and soybeans, relative yield vari-ation falls at a decreasing rate as enterprise size increases. Conversely, a significant positiverelationship between size and relative yield variability is revealed for dryland corn. Theimplied size effects for dryland commodities are illustrated in figure 2. It is relevant tonote that the statistical significance of the corn effect is lower than that found for othercommodities. No significant relationship between size and yield variability is revealedfor the irrigated crops.
The proportion of the enterprise that is produced on rented land is negatively correlatedwith yield variability in every case, though this effect is statistically significant only fordryland corn and soybeans and irrigated wheat. Total crop farm size, as measured by totalcrop acres, is negatively related to yield variation for dryland corn and positively relatedto yield variation for irrigated wheat. This effect is not statistically significant for theremaining enterprises.
Income, chemical and fertilizer expenditures, leverage, and government payment re-ceipts are not significantly related to relative yield variation. Diversification is negativelycorrelated with yield variability for irrigated grain sorghum, but is not significant for theremaining commodities. The proportion of total acres engaged in crop production wasincluded to represent overall land quality. Farms with lower land quality are likely tohave more waste and set-aside. This variable is significant only in the dryland sorghumequation, where, counter to expectations, it is positively correlated with relative yieldvariation. The proportion of total sales that comes from crops is significantly related toyield variability for dryland soybeans, but is not significant in any other equation. Cor-
392 December 1994
Crop Insurance Premium Rate Determination 393
70
65
60
co 55
a
"5 50
0
45o
0_ 40
35
30
25
0 1 2 3 4 5 6 7 8 9 10
Hundred Acres
Figure 2. Relative yield variation and size
porate dryland wheat farms have significantly more yield variation than do sole-proprietorenterprises. However, no significant difference in yield variability among different farmenterprise organizations is detected for the other commodities. Finally, a series of regionaldummy variables confirm that significant regional differences exist in relative yield vari-ation. This provides support for the FCIC's practice of determining rates for individualcounties.
The R2s of the equations are considerably larger than those revealed in precedinganalyses, indicating that information other than average yields could be used to improvepredictions of yield variability. The important implication is that these factors may provideuseful insights into expected losses in situations where yield histories are unavailable.However, the basic point remains that the relationship between yield variation and averageyields and other observable factors is quite limited and thus yield histories should be useddirectly when available to calculate measures of variation that directly measure risk.
In all, these results provide a degree of support for current FCIC practices that applydiscounts for farms with higher average yields. However, even in the best of cases, thisrelationship is imperfect, and thus basing risk measures solely on averages may induceadverse selection. Actuarial practices would likely benefit from directly measuring yieldvariability to assign expected risk.
Summary and Concluding Remarks
This study reviews the actuarial practices currently used by the Federal Crop InsuranceCorporation to determine premium rates for multiple peril crop insurance. The role ofadverse selection, which occurs when rates do not accurately represent the true likelihoodof losses, is discussed. The FCIC's emphasis on average yields as an indicator of yieldvariability is evaluated using data drawn from 2,247 Kansas crop farms.
Goodwin
L
I
Journal of Agricultural and Resource Economics
The results indicate that averages are indeed inversely correlated with relative yieldvariation. However, the results also indicate that this relationship is tenuous, and thatrates that depend heavily on average yields may imperfectly represent loss probabilitiesand thus cause adverse selection. A superior solution would be to directly use yield historiesto measure variation rather than just expected yields. Relative yield variability, repre-sented by the coefficient of variation of yields, offers a suitable metric for measuringexpected loss risk.
The FCIC often is constrained to working with a small number of previous yieldobservations (perhaps even zero) when attempting to assign individual producers rates.In such cases, an examination of alternative observable farm factors, including size vari-ables, tenure, and diversification may be useful. Significant scale effects are revealed fordryland crops.
[Received November 1993; final revision received May 1994.]
Notes
' Between 1980 and 1990, the average participation rate in the federal crop insurance program was about17% of eligible acres (U.S. General Accounting Office 1992).
2 An actuarially fair premium is one which equates premiums to expected indemnities. With actuarially fairpremiums, expected loss ratios (the ratio of indemnities paid out to premiums collected) are one.
3 Material in this section is based upon personal communications with the Federal Crop Insurance Corporation.4 The loss cost ratio is given by the ratio of indemnity outlays to total liability.5 The NASS dataset used to determine rates is updated rather infrequently. In some cases, a lag of five years
may occur before yields are updated.6 Skees and Reed examined yield histories drawn from four samples of 54, 54, 48, and 65 farms in Illinois
and Kentucky.7 For convenience, a normal yield distribution is illustrated. However, considerable evidence (Gallagher;
Nelson) suggests that significant skewness may exist in yield distributions. Allowing skewness may exaggeratethe effects described here. This point also is made in other research, including Just and Calvin and U.S. GeneralAccounting Office (1993).
8 Farms missing more than a single year of data were excluded from the analysis.9 Of the 2,247 farms in the sample, information regarding insurance purchases was known for 572 farms.
Irrigated crops were excluded from this portion of the analysis because of very small samples.10 The t-tests allow for differences in standard deviations in constructing the t-statistics." A limitation of using empirical rates to examine loss risk is that relatively large samples may be needed to
accurately measure risk. For example, with only 10 years of data, one may not observe yields below the proportionof the mean of interest (e.g., 65%), implying an empirical premium rate of zero. However, the probability ofloss is likely to be greater than zero for any realistic yield election.
12 Farms can "lose" their yield history by dropping coverage for a year, after which they assume ASCS transitionyields. In addition, farms also have been able to lose their yield histories by changing insurance companies ortransferring insurance among operators, although improved record keeping is eliminating such practices.
References
Botts, R. R., and J. N. Boles. "Use of Normal-Curve Theory in Crop Insurance Rate Making." J. Farm Econ.39(1957):733-40.
Gallagher, P. "U.S. Soybean Yields: Estimation and Forecasting with Nonsymmetric Yields." Amer. J. Agr.Econ. 69(1987):796-803.
Goodwin, B. K. "An Empirical Analysis of the Demand for Multiple Peril Crop Insurance." Amer. J. Agr. Econ.75(May 1993):425-34.
Just, R. E., and L. Calvin. "An Empirical Analysis of U.S. Participation in Crop Insurance." Paper presentedat the University of Maryland/Saskatchewan Conference for the Improvement of Agricultural Crop Insur-ance, 1-3 April 1990, Regina, Saskatchewan.
Miranda, M. J. "Area-Yield Crop Insurance Reconsidered." Amer. J. Agr. Econ. 73(May 1991):233-42.Nelson, C. H. "The Influence of Distributional Assumptions on the Calculation of Crop Insurance Premia." N.
Cent. J. Agr. Econ. 12(1990):71-78.Skees, J. R., and M. R. Reed. "Rate-Making and Farm-Level Crop Insurance: Implications for Adverse Se-
lection." Amer. J. Agr. Econ. 68(August 1986):653-59.
394 December 1994

Goodwin Crop Insurance Premium Rate Determination 395
U.S. General Accounting Office. "Crop Insurance: Federal Program Faces Insurability and Design Problems."Pub. No. GAO/RCED-93-98, Washington DC, May 1993.
. "Crop Insurance: Program Has Not Fostered Significant Risk Sharing by Insurance Companies." Pub.No. GAO/RCED-92-25, Washington DC, January 1992.