IS FEDERAL CROP INSURANCE POLICY LEADING …Is Federal Crop Insurance Policy Leading to Another Dust...
10
Is Federal Crop Insurance Policy Leading to Another Dust Bowl? | EWG.ORG | 1 www.EWG.org 1436 U Street N.W., Suite 100 Washington, D.C. 20009 IS FEDERAL CROP INSURANCE POLICY LEADING TO ANOTHER DUST BOWL? EWG March 2017 AUTHORS Anne Weir Schechinger, Senior Analyst, Economics Craig Cox, Senior Vice President for Agriculture and Natural Resources
Transcript of IS FEDERAL CROP INSURANCE POLICY LEADING …Is Federal Crop Insurance Policy Leading to Another Dust...
Is Federal Crop Insurance Policy Leading to Another Dust Bowl? | EWG.ORG | 1
www.EWG.org1436 U Street N.W., Suite 100Washington, D.C. 20009
IS FEDERAL CROP INSURANCE POLICY LEADING TO ANOTHER DUST BOWL?EWGMarch 2017
AUTHORS Anne Weir Schechinger, Senior Analyst, Economics
Craig Cox, Senior Vice President for Agriculture and Natural Resources
Is Federal Crop Insurance Policy Leading to Another Dust Bowl? | EWG.ORG | 2
CONTENTS 3 Is Federal Crop Insurance
Policy Leading to Another Dust Bowl?
8 References
9 Case Study: Dallam County, Texas
ABOUT EWGThe Environmental Working Group is the nation’s most effective environmental health research and advocacy organization. Our mission is to conduct original, game-changing research that inspires people, businesses and governments to take action to protect human health and the environment. With your help—and with the help of hundreds of organizations with whom we partner—we are creating a healthier and cleaner environment for the next generation and beyond.
REPRINT PERMISSIONTo request reprint permission, please email a completed request form to [email protected]
HEADQUARTERS1436 U Street N.W., Suite 100Washington, D.C. 20009(202) 667-6982
CALIFORNIA OFFICE500 Washington Street, Suite 400San Francisco, CA 94111
MIDWEST OFFICE103 E. 6th Street, Suite 201Ames, IA 50010
SACRAMENTO OFFICE1107 9th Street, Suite 625Sacramento, CA 95814
Is Federal Crop Insurance Policy Leading to Another Dust Bowl? | EWG.ORG | 3
The Dust Bowl is among the worst environmental catastrophes in U.S. history. During the Great Depression of the 1930s, the Southern Great Plains* were devastated by crop failure, erosion and choking dust storms that blew away hundreds of millions of acres of once-productive topsoil, inflicting poverty, hunger and disease on the region's people.
Could it happen again?
The disaster's cause was a deadly combination of drought, the “great plow up”—during which farmers turned more than 5 million acres of grassland into cropland—and farmers' failure to adapt to an arid climate.1 Today, drought is again parching the southern Plains, with abnormally low rainfall in seven of the 10 years between 2006 and 2015.2,3 Crops are failing, dust storms are back,4 and scientists warn that climate change could make hot and dry conditions the region's new normal. The imperative to adapt to changing weather conditions grows more and more urgent.
Yet a provision in the Federal Crop Insurance Program—snuck into the 2014 farm bill during conference negotiations—rewards farmers for not adapting to the changing climate. Instead, it encourages them to continue business as usual: planting the same crops in the same way, year after year, pretending poor harvests don't happen and repeating the mistakes of the 1930s.
"When people ask me if we'll have a Dust Bowl again, I tell them we're having one now," Millard Fowler, a 101-year-old Boise City, Okla., farmer who lived
through that earlier catastrophe, told National Geographic a few months after the latest farm bill passed. "It is just as dry now as it was then, maybe even dryer. There are going to be a lot of people out here going broke.”5
The Federal Crop Insurance Program offers farmers insurance policies that guarantee the money they make from selling their crops won’t fall below a set percentage of their usual expected earnings. Taxpayers heavily subsidize the program: the government pays more than 60 percent of the policy premiums, and the Department of Agriculture's contracts with the private companies that sell and service the policies ensure that taxpayers bear most of the losses when bad weather strikes.
The integrity of the insurance program depends on a realistic estimate of the crop yields an individual grower can expect. The government arrives at this estimate by averaging a grower's yearly per-acre crop yield over many years. This calculation, called the Actual Production History, is the basis for determining how much of a grower’s revenue will be guaranteed by an insurance policy, and whether his or her actual revenue has fallen below the guaranteed level.
The policy keeps crop insurance grounded in the real world, but a provision Congress slipped into the 2014 farm bill replaces reality with delusion. The new provision, the Actual Production History Yield Exclusion, throws bad years out of the yield calculation. For certain crops in some counties, it allows the exclusion of more than 15 years of low yields.6
* Parts of Texas, Oklahoma, Kansas, New Mexico, Colorado and Nebraska.
Is Federal Crop Insurance Policy Leading to Another Dust Bowl? | EWG.ORG | 4
The effect is dramatic. Take the hypothetical case of a wheat grower in Dallam County, Texas.
Under the new provision, up to 12 years of poor harvests between 1995 and 2014 can be thrown out of the grower's yield estimate. Between 2005 and 2015, there are seven bad years that can be excluded from a farmer’s Actual Production History while still maintaining the four-year minimum requirement. For this hypothetical farm, let’s say the yields dropped to half of the average yield for Dallam County in those seven years.7 At a price of $4.64 a bushel and a 75 percent insurance coverage level, if the actual yield of 18 bushels an acre was used, the grower's revenue guarantee under a typical policy would work out to $63 an acre. But throw out the seven bad years and the estimated yield grows to 31 bushels an acre, while the guaranteed revenue soars to $108 per acre. (See a detailed case study at the end of the paper.)
For a 500-acre farm, that's an additional $22,500 insurance guarantee. Multiply that by the 1,754 counties allowed to exclude between one and 17 bad years for non-irrigated wheat, and the cost to taxpayers could be millions of dollars a year.
In 2015, farmers nationwide claimed the bad-year exclusion on 1.12 million acres of both irrigated and non-irrigated wheat. For all causes of loss, the farmers behind these acres received almost $6.4 million in crop insurance payouts.8
The distortion resulting from the bad-year exclusion is large in the very same counties that suffered the most from the Dust Bowl. According to the National Resource Conservation Service, the Dust Bowl was most devastating in 20 counties—eight in Kansas, five in Texas, three each in Oklahoma and Colorado, and one in New Mexico.9 In each of those counties, growers of non-irrigated wheat are allowed to exclude eight years of bad yields when calculating their production
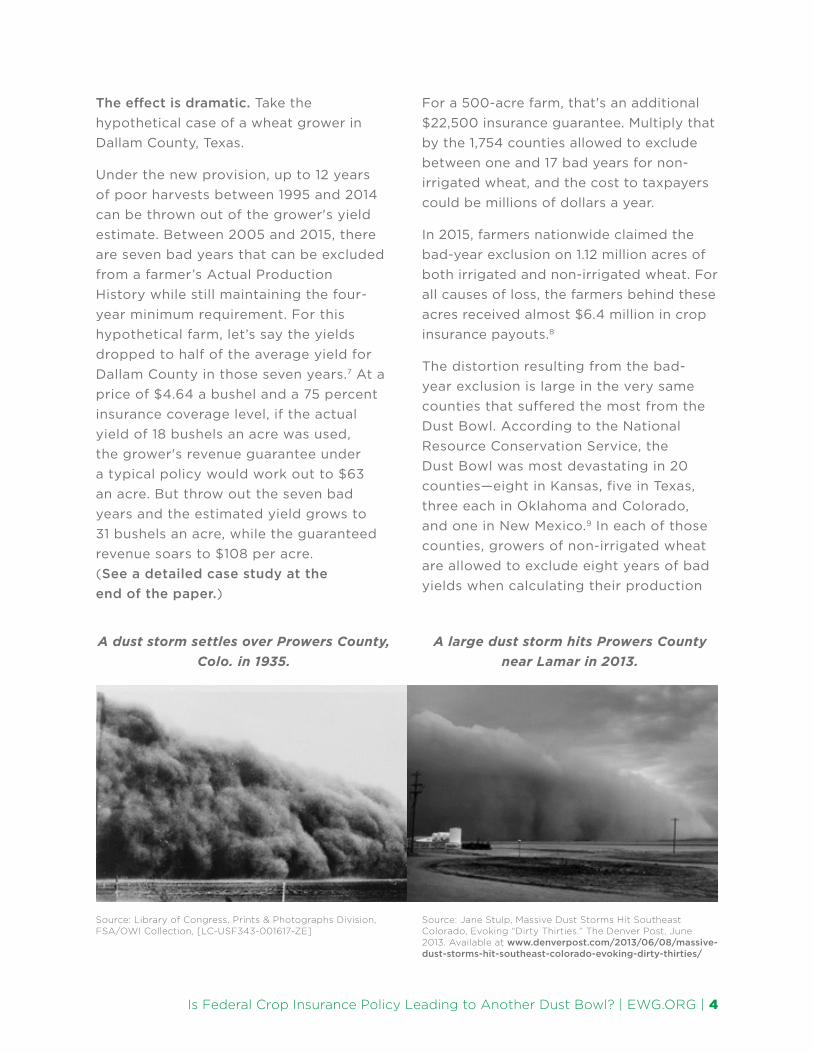
A dust storm settles over Prowers County, Colo. in 1935.
A large dust storm hits Prowers County near Lamar in 2013.
Source: Library of Congress, Prints & Photographs Division, FSA/OWI Collection, [LC-USF343-001617-ZE]
Source: Jane Stulp, Massive Dust Storms Hit Southeast Colorado, Evoking “Dirty Thirties.” The Denver Post, June 2013. Available at www.denverpost.com/2013/06/08/massive-dust-storms-hit-southeast-colorado-evoking-dirty-thirties/
Is Federal Crop Insurance Policy Leading to Another Dust Bowl? | EWG.ORG | 5
histories. In many of those counties more than eight years can be excluded, and in Baca and Las Animas counties in Colorado, up to 16 bad years can be overlooked.10 (See interactive map.)
What's worse, this delusional policy is taking hold at the same time the region faces the return of Dust Bowl-like conditions. Extreme, severe and moderate droughts have been common in the region over the last 10 years. Drought struck in May, a critical period of moisture for dryland wheat,11 in 2006, 2008 and 2009, and each year from 2011 to 2014.12 Between November 2012 and June 2013, seven major dust storms hit Prowers County, Colo., one of the counties that suffered most during the Dust Bowl.13
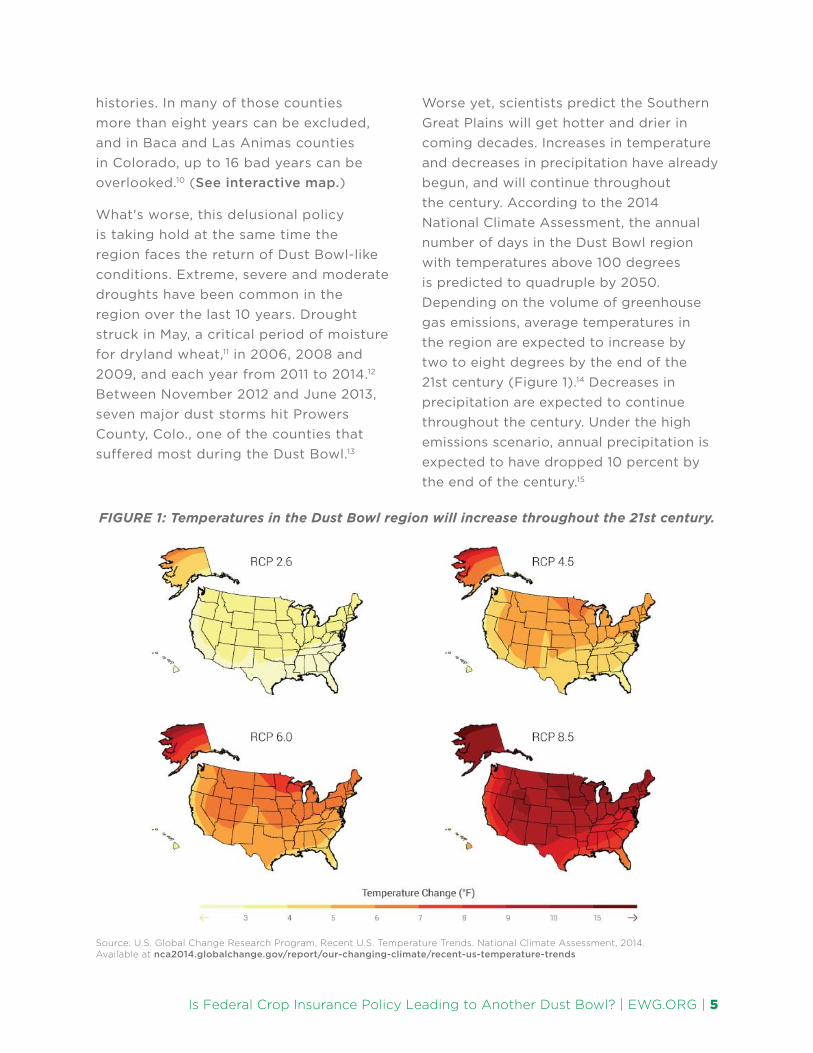
Worse yet, scientists predict the Southern Great Plains will get hotter and drier in coming decades. Increases in temperature and decreases in precipitation have already begun, and will continue throughout the century. According to the 2014 National Climate Assessment, the annual number of days in the Dust Bowl region with temperatures above 100 degrees is predicted to quadruple by 2050. Depending on the volume of greenhouse gas emissions, average temperatures in the region are expected to increase by two to eight degrees by the end of the 21st century (Figure 1).14 Decreases in precipitation are expected to continue throughout the century. Under the high emissions scenario, annual precipitation is expected to have dropped 10 percent by the end of the century.15
Source: U.S. Global Change Research Program, Recent U.S. Temperature Trends. National Climate Assessment, 2014. Available at nca2014.globalchange.gov/report/our-changing-climate/recent-us-temperature-trends
FIGURE 1: Temperatures in the Dust Bowl region will increase throughout the 21st century.
Is Federal Crop Insurance Policy Leading to Another Dust Bowl? | EWG.ORG | 6
The yield exclusion policy is not only encouraging unwise farming practices in the Dust Bowl; the policy is also being used in the Corn Belt region on corn and soybean fields.
In 2015, farmers nationwide enrolled about 13.3 million acres of corn and 3.8 million acres of soybeans in the yield exclusion program.16 In Nebraska, Kansas, Missouri and Illinois, more than 8.6 million acres, across all crops, were enrolled. Although fewer acres of wheat were excluded through the program than acres of corn and soybeans, farmers of non-irrigated wheat in some counties in the Southern Great Plains could exclude 11 to 15 years, while only two counties in the Corn Belt could exclude that many years for non-irrigated corn.17
The policy turns the fundamental concept of crop insurance on its head. Even if bad years occur more often than good years, the bad years are treated as aberrations and the good years as normal. Crop insurance becomes a form of annual income support that encourages farmers to keep planting crops that fail more often than they succeed.
It makes sense to give growers a break if one or two bad years occasionally result in payments from their crop insurance policies. But when bad years become the norm, it makes no sense to keep growers on a treadmill of failed crops and crop insurance payouts. Doing so hurts growers more than it helps them.
If farmers can continue to profit from insurance payouts, they are less likely to change their farming practices to methods better suited to droughts or other changes in weather patterns. This makes growers even more vulnerable to the new climate conditions.
It would be far better to help farmers adapt to the new, unfriendly weather regime. That’s exactly what helped them make it through the Dust Bowl and return the devastated region to productivity.
Under the administration of Franklin D. Roosevelt, the federal government instituted conservation measures that helped prevent another Dust Bowl. Federal foresters planted shelter belts of 100 million trees.18 Large portions of agricultural land were converted back into grassland and four million acres were preserved as National Grasslands.19 Contour plowing and drill seeding were mandated to reduce soil disruption. Growers also began irrigating their crops with water from the Ogallala Aquifer, which helped keep soil in place.
However, in the decades since the Dust Bowl, many of these conservation practices have been abandoned. When rain started to fall again and grain prices increased, many of the trees planted as shelterbelts were torn up and fields were once again planted with wheat. Conservation measures are even more necessary today, as water is being pumped eight times faster from the Ogallala Aquifer than it can naturally be replaced.20 Fewer and fewer growers will be able to depend on irrigation in the face of drought.21
Some good work is going on in the region to help growers adapt, but not nearly enough.
Some farmers in the region are already adopting practices to help them adapt to drought. As part of a Texas A&M University project, two dryland wheat growers in Moore County, Texas have adopted no-till

Is Federal Crop Insurance Policy Leading to Another Dust Bowl? | EWG.ORG | 7
practices, which can not only reduce soil erosion but also make the soil more fertile.22 Other growers in the Texas Panhandle and Oklahoma are implementing no-till to help keep moisture on dryland fields.23,24
Growers are also starting to plant cover crops, like Roger Ommen in Dewey County, Okla., who tried cover crops for the first time last year.
"We'll try it," Ommen told National Public Radio. "Who knows, it might be all we do in the future."25
Conservation officials in Oklahoma Panhandle counties are also encouraging growers to plant field borders to slow wind erosion,26 and to rotate crops with cover crops when growers have elected no-till to help with weed control.27
But there is still a long way to go.
Only between one-fourth and one-third of Oklahoma farm acreage makes use of no-till, and less than 1 percent of Oklahoma growers use cover crops.28,29,30 According to the USDA, for the entire Prairie Gateway farming region that includes parts of Texas, New Mexico, Colorado, Oklahoma, Nebraska and all of Kansas, only 27 percent of staple crop acres have fully adopted reduced-till or no-till, and only 2 percent are planted with cover crops.31
The dollars saved by ending the misguided yield exclusion policy should be used to help more growers put these and other conservation measures and new cropping systems in place. A major federal, state and local conservation initiative in the Southern Great Plains would do far more to keep family farmers on the land and protect the environment than a short-sighted crop insurance program that is not sustainable in the long run.

Is Federal Crop Insurance Policy Leading to Another Dust Bowl? | EWG.ORG | 8
REFERENCES
1. Ken Burns, The Dust Bowl: A Film by Ken Burns. PBS, 2012. Available at www.pbs.org/kenburns/dustbowl/
2. National Centers for Environmental Information, Historical Palmer Drought Indices. National Oceanic and Atmospheric Administration, accessed April 2016. Available at www.ncdc.noaa.gov/temp-and-precip/drought/historical-palmers/
3. The National Drought Mitigation Center, Drought in the Dust Bowl Years. University of Nebraska Lincoln, accessed May 2016. Available at drought.unl.edu/droughtbasics/dustbowl/droughtinthedustbowlyears.aspx
4. Kevin Murphy, Storms on US Plains stir memories of the Dust Bowl. Reuters, Dec. 30, 2012. Available at www.reuters.com/article/us-usa-dust-bowl-idUSBRE8BT05720121230
5. Laura Parker, Parched: A New Dust Bowl Forms in the Heartland. National Geographic, May 2014. Available at news.nationalgeographic.com/news/2014/05/140516-dust-bowl-drought-oklahoma-panhandle-food/
6. Risk Management Agency, RMA GIS Map Site. U.S. Department of Agriculture, accessed April 2016. Available at prodwebnlb.rma.usda.gov/apps/MapViewer/index.html
7. Risk Management Agency, Actuarial Information Browser Commodity Report 2016. United States Department of Agriculture, accessed April 2016. Available at webapp. rma.usda.gov/apps/actuarialinformationbrowser2016/ CropCriteria.aspx
8. Risk Management Agency, Federal Crop Insurance Summary of Business for Yield Exclusion. United States Department of Agriculture, February 2016. Available at http://www.rma.usda.gov/data/sob/ye/2015yieldexclusion.pdf
9. Natural Resources Conservation Service, Early NRCS Featured in Ken Burns Dust Bowl Documentary. United States Department of Agriculture, January 2012. Available at www.nrcs.usda.gov/wps/portal/nrcs/detail/national/home/?cid=STELPRDB1049437
10. Risk Management Agency, RMA GIS Map Site. United States Department of Agriculture, accessed April 2016. Available at prodwebnlb.rma.usda.gov/apps/MapViewer/index.html
11. Land and Water Division, Crop Water Information: Wheat. Food and Agriculture Organization, 2015. Available at www.fao.org/nr/water/cropinfo_wheat.html, and Clark Neely, Texas Wheat Crop Update. Texas A&M University AgriLife Extension, April 2014. Available at texaswheat.org/wp-content/uploads/2013/08/2014-04-Wheat-Crop-Update-Neely.pdf
12. National Centers for Environmental Information, Historical Palmer Drought Indices. National Oceanic and Atmospheric Administration, accessed April 2016. Available at www.ncdc.noaa.gov/temp-and-precip/drought/historical-palmers/
13. Colleen O’Connor, Massive Dust Storms Hit Southeast Colorado, Evoking “Dirty Thirties.” The Denver Post, June 2013. Available at www.denverpost.com/2013/06/08/massive-dust-storms-hit-southeast-colorado-evoking-dirty-thirties/
14. U.S. Global Change Research Program, Recent U.S. Temperature Trends. National Climate Assessment, 2014. Available at nca2014.globalchange.gov/report/our-changing-climate/recent-us-temperature-trends
15. U.S. Global Change Research Program, Future Climate Change. National Climate Assessment, 2014. Available at nca2014.globalchange.gov/report/our-changing-climate/future-climate-change
16. Risk Management Agency, Federal Crop Insurance Summary of Business for Yield Exclusion, op. cit.
17. Risk Management Agency, RMA GIS Map Site, op. cit.
18. Joe Wertz, Dust Bowl Worries Swirl Up As Shelterbelt Buckles. National Public Radio, Sept. 10, 2013. Available at www.npr.org/2013/09/10/220725737/dust-bowl-worries-swirl-up-as-shelterbelt-buckles
19. U.S. Forest Service, National Grasslands. Accessed July 2016. Available at www.fs.fed.us/grasslands/
20. Timothy Egan, The Worst Hard Time. 2006.
21. Brett Walton, Texas and Kansas Growers Take Different Paths to Saving Water. Circle of Blue, January 2014. Available at www.circleofblue.org/waternews/2014/choke-point-index/conservation-goals-ogallala-aquifer-run-legal-social-economic-challenges/
22. Agricultural and Food Policy Center, Climate Change Project- Texas Representative Feedgrain Farms. Texas A&M University AgriLife Extension, February 2014. Available at www.afpc.tamu.edu/pubs/2/635/ClimateWP_Texas.pdf
23. Jim Steiert, Case Closed: Soil Tests Confirm No-Till Success. No-Till Farmer, November 2015. Available at www.no-tillgrower.com/articles/5248-case-closed-soil-tests-confirm-no-till-success
24. Brian Bienkowski, Can Farming Practices in Oklahoma Solve Climate Change? Scientific American, October 2015. Available at www.scientificamerican.com/article/can-farming-practices-in-oklahoma-solve-climate-change/
25. Logan Layden, Growers School Themselves on Soil Health to Revive Oklahoma’s Dying Dirt. State Impact, September 2015. Available at stateimpact.npr.org/oklahoma/2015/09/17/farmers-school-themselves-on-soil-health-to-revive-oklahomas-dying-dirt/
26. Dee Ann Littlefield, Drought Still Has Death Grip on Oklahoma Panhandle. United States Department of Agriculture Natural Resources Conservation Service, July 2008. Available at www.nrcs.usda.gov/wps/portal/nrcs/detail/ok/newsroom/stories/?cid=nrcs142p2_000723
27. Brian Bienkowski, Can Farming Practices in Oklahoma Solve Climate Change? Scientific American, October 2015. Available at www.scientificamerican.com/article/can-farming-practices-in-oklahoma-solve-climate-change/
28. Layden, op. cit.
29. Ag Land Lease, No-Till. Oklahoma State University, 2012. Available at aglandlease.info/production-practices/no-till/
30. Layden, op. cit.
31. Tara Wade et al., Conservation-Practice Adoption Rates Vary Widely by Crop and Region. United States Department of Agriculture Economic Research Service, December 2015. Available at www.ers.usda.gov/media/1979972/eib147.pdf

Is Federal Crop Insurance Policy Leading to Another Dust Bowl? | EWG.ORG | 9
CASE STUDY: DALLAM COUNTY, TEXASA credible calculation of what’s called Actual Production History, or APH, is vital to the federal crop insurance program. To protect farms against risk, it is necessary to estimate their potential production. Evaluating historic yields is the most accurate way of assessing this.1 By starting with an accurate picture of what growers actually produce each year, APH keeps crop insurance grounded in reality.
It also determines the revenue guaranteed by a grower's crop insurance policy. Revenue guarantees are calculated by multiplying the crop price by the APH and then the selected coverage level. The resulting number dictates insurance payouts and program costs.2
The new crop insurance provision in the 2014 farm bill, called Actual Production History Yield Exclusion, excludes years with low yields when making this calculation.
Bad years can be excluded if the county yield is at least 50 percent below the average yield for the county over the last 10 consecutive years. The federal Risk Management Agency determines the number of years that can be excluded in each eligible county by crop and irrigation status, going back to 1995. Bad years are also excluded in contiguous counties.3
For some crops grown in certain counties, more than 15 bad years can be ignored when calculating APH.4 Since APH usually only includes up to 10 years of yields, not all those bad years can be excluded. But farmers often do not produce the same crop year after year.
For example, over 20 years a farmer may grow corn every other year. If the grower’s county is eligible for 15 years of yield exclusions over that 20-year period, the grower could exclude most of his corn yields while still maintaining the four-year minimum.
Before the 2014 farm bill was passed, 60 percent of the average county yield for a bad year was used to calculate APH. Now bad years can be completely ignored if they fit into the guidelines described above.
The table below looks at a hypothetical non-irrigated wheat farm in Dallam County, Texas. Seven bad years between 2005 and 2015 can be excluded in Dallam County when calculating the APH, while still maintaining the required four-year minimum.
In the table, the county transitional yield is the 10-year average yield for the county, provided by the USDA's Risk Management Agency.5
The grower’s actual yield is the yield a grower actually produces in the designated crop year. In this hypothetical case, we used half of the county transitional yield in the years eligible for exclusion.
Yield used to calculate APH before 2014 is 60 percent of the county transitional yield, which compensated for bad years before the 2014 farm bill.
Yield used to calculate APH now is the grower’s actual yield in good years, minus yields in bad years that are eligible for exclusion.
In Dallam County, seven bad years are excluded when calculating APH. The effect is dramatic.

Is Federal Crop Insurance Policy Leading to Another Dust Bowl? | EWG.ORG | 10
The APH used for crop insurance is set at 31 bushels of wheat per acre, compared to the actual yield of 18 bushels per acre, while the yield under the old law was 19 bushels. At a price of $4.64 per bushel and given a 75 percent crop insurance coverage level, this policy’s revenue insurance guarantee would have been $63 per acre with the actual yield, $66 under the old law, and, now, $108 under the new provision. The current guarantee is 71 percent higher than if actual yields were used to set the insurance guarantee, and 64 percent higher than if the old law was used.
The yield exclusion provision turns the fundamental concept of crop insurance on its head. The crop insurance program now pretends bad years don’t happen, even if bad years are more frequent than good years. Being able to pretend that more than 15 bad years didn't happen turns crop
insurance into annual income support that encourages producers to keep planting crops that fail more often than they succeed, instead of motivating growers to adapt to changing weather.
REFERENCES
1. Alejandro Plastina, Proven Yields and Insurance Units for Crop Insurance. Iowa State University, September 2014. Available at www.extension.iastate.edu/agdm/crops/html/a1-55.html
2. Alejandro Plastina, Revenue Protection Crop Insurance. Iowa State University, September 2014. Available at www.extension.iastate.edu/agdm/crops/html/a1-54.html
3. Risk Management Agency, Frequently Asked Questions, Actual Production History (APH) Yield Exclusion. United States Department of Agriculture, December 2014. Available at www.rma.usda.gov/help/faq/aphyieldexclusion.html
4. Risk Management Agency, RMA GIS Map Site. United States Department of Agriculture, accessed April 2016. Available at prodwebnlb.rma.usda.gov/apps/MapViewer/index.html
5. Risk Management Agency, Actuarial Information Browser Commodity Report 2016. United States Department of Agriculture, accessed April 2016. Available at webapp.rma.usda.gov/apps/actuarialinformationbrowser2016/CropCriteria.aspx
Year
County Transitional
YieldGrower’s
Actual Yield
Yield Used to Calculate APH Before 2014
Yield Used to Calculate APH Now
2005 23 34 34 34
2006 23 11 14 EXCLUDED
2007 23 35 35 35
2008 23 11 14 EXCLUDED
2009 22 11 13 EXCLUDED
2010 22 30 30 30
2011 22 11 13 EXCLUDED
2012 22 11 13 EXCLUDED
2013 18 9 11 EXCLUDED
2014 18 9 11 EXCLUDED
2015 18 25 25 25
APH: 18 19 31
TABLE 1: The yield exclusion provision pretends bad years never happen.
Source: EWG, from USDA RMA, Actuarial Information Browser Commodity Report 2016 and GIS Map Site