PREMIERE MENSWEAR BRAND
78
PREMIERE MENSWEAR BRAND —TAILORED FOR SUCCESS— ANNUAL REPORT 2005
Transcript of PREMIERE MENSWEAR BRAND

PREMIERE
MENSWEAR BRAND
—TA I LO R E D F O R S U C C E S S—
ANNUAL REPORT 2005

A MESSAGE FROM OUR CEO
TO OUR STOCKHOLDERS . . .

RECOGNIT ION
In Fiscal 2005 we celebrated another milestone towards
our goal to become the DOMINANT MENSWEAR BRAND
IN THE UNITED STATES . Our brand has become nationally
recognized as we now operate over 325 stores in 40 states
and the District of Columbia and have a nationwide
catalog and internet business. We were recognized in
numerous articles by premier business news publications
that were judging brand awareness and financial results,
including:
• DNR “Best Specialty Brands Very Well Known by American Men”–Ranked #11
• FORBES “Top 200 Best Small Companies” –Ranked #44
• BUSINESS WEEK “Hot Growth Companies” –(third consecutive year)–Ranked #52 in 2005
• WALL STREET JOURNAL “Best Overall” Wrinkle Resistant Dress Shirt
FINANCIAL HIGHLIGHTS
Our brand continued to deliver outstanding financial
results, producing record earnings for the fifth consecutive
year. Among the many financial achievements in fiscal
2005 were:
• Net sales increased over 24% to a record $465 million,
including a 10.6% comparable store sales gain
• Diluted earnings per share increased 41% to a
record $1.95
• Operating income improved to a record 13.3% of sales
• After-tax return on stockholders’ equity reached a record
of over 26%
• Retail store locations expanded by 20%
• Cash provided by operations was $37 million and we
had no outstanding debt under our $100 million bank
credit agreement at year end
• The Nasdaq Stock Market price of JOSB shares gained
53% during calendar year 2005
STORE PERFORMANCE
We opened 56 new stores in 28 states across the United
States during the fiscal year ended January 28, 2006
(“Fiscal 2005” or “2005”), in both new and existing
markets. Our future real estate opportunities are two-fold;
namely a) to “back-fill” stores into existing markets and
b) to open stores in new markets where we have no stores
within approximately 50 miles. Our store expansion
program will continue in 2006, when we expect to add at
least 50 new locations to our retail network as part of our
plan to expand the chain to approximately 500 stores.
As we continue to enhance our marketing database,
we have been able to analyze our new store customers.
One exciting development is that, despite opening over
two-thirds of our stores within 50 miles of another
store, over 70% of our 2005 new store customers were
first-time buyers at Jos. A. Bank. This amount increases
to approximately 85% when we analyze new stores in
markets such as California. We believe this indicates that
there continue to be untapped markets to open our stores
and we can expect to be able to increase the density of
our stores throughout the country.
I am pleased to report that operating profit of 23.2%
for all full-line stores improved in 2005 for the sixth
consecutive year. This is quite an achievement, considering
half of our stores have been opened in the last three years,
and new stores are generally less profitable in the earlier
years of their development. As our new stores mature,
they will help drive increases in overall operating profit
percent in future years.
MARKETING
Our marketing efforts once again have proven to be
a testament to our outstanding management team.
We continued to optimize the strategy that has been
L E T T E R T O S T O C K H O L D E R S
P A G E 2
consistently working for us for several years, primarily
direct mail. In addition, the branding campaign which
uses magazines and national cable television has been
extremely successful and we plan to build upon that
strategy in 2006. The branding campaign is designed
to benefit the multi-channel retailing strategy that has
proven so successful for our Company in recent years.
We also aggressively expanded our Corporate Card
in 2005, which is our loyalty program. The Corporate
Card program currently has over 130,000 companies
that participate with us and is driving a substantial
portion of total sales.
MERCHANDISING AND SOURCING
All major merchandise categories generated positive
comparable store sales gains in 2005. Merchandise
trends were marked by strong sales in the casual business,
particularly in sportswear, lead by strong performances
in basic core programs and strength in our performance
products, such as the Traveler all cotton stain-resistant
pants and our Traveler all cotton wrinkle-free sport shirts.
Seasonal basic core items such as our camel hair blazers
sold very well, particularly in the fourth quarter. The
investment we made in basic core inventory paid off
nicely with the strong sales gains in 2005.
We continued to evolve our worldwide merchandise
sourcing strategy which is to “find the best cost for
our merchandise at the high quality standards that we
demand.” We made purchases in over 20 countries in
2005, with the highest percentage coming from China
(34%, including Hong Kong) and Mexico (20%).
FINANCIAL PERFORMANCE
From a balance sheet perspective, we ended 2005 in a
very strong position. The Company generated over $37
million of cash from operations during 2005, which
allowed us to open 56 new stores, renovate several existing
stores, invest in inventory, and expand our distribution
center. We ended the year with less than $6 million of debt
with no outstanding borrowings under our $100 million
bank credit agreement. The Company is well-positioned
to finance additional store expansion in Fiscal 2006.
During 2005, JoS. A. Bank Clothiers once again posted
record operating results. Our earnings per diluted share
(“EPS”) rose 41% to a record $1.95, when compared
with EPS of $1.38 in the previous fiscal year. This was
our fifth consecutive year of record annual earnings, and
quarterly profits have risen in each of the past 18 quarters
when compared with the corresponding prior year period.
Our operating income margins and return on equity
also reached record levels.
Our common stock, which trades on the Nasdaq National
Market system under the symbol “JOSB,” appreciated
approximately 53% during the calendar year 2005.
This increase exceeded gains of approximately 1% in the
Nasdaq Composite Index and decreases of 1% in the
Dow-Jones Industrial Average. In addition, the JOSB
common stock price performance has ranked among the
top 2% of all Nasdaq-listed companies during the five-
year calendar period 2001 to 2005, rising over 1700%
as the 31st best performer.
Our management team has delivered outstanding results
since we came together about six years ago. We set a
plan for growth and have executed it with great skill.
We enter Fiscal 2006 very enthusiastic about continuing
the growth, as we execute our plan to grow the store base
to an estimated 500 stores over the next several years.
As I have stated in the past, our primary goal is for
JoS. A. Bank Clothiers to become recognized as the
DOMINANT MENSWEAR BRAND IN THE UNITED STATES,
and I believe we are well on our way to accomplishing
this objective. On behalf of our management team and
the Board of Directors, I would like to thank all of our
customers, vendors, and stockholders for their continued
support, and I look forward to reporting further upon
our progress during 2006.
Sincerely,
ROBERT N. WILDRICK, CEO AND PRESIDENT
P A G E 3


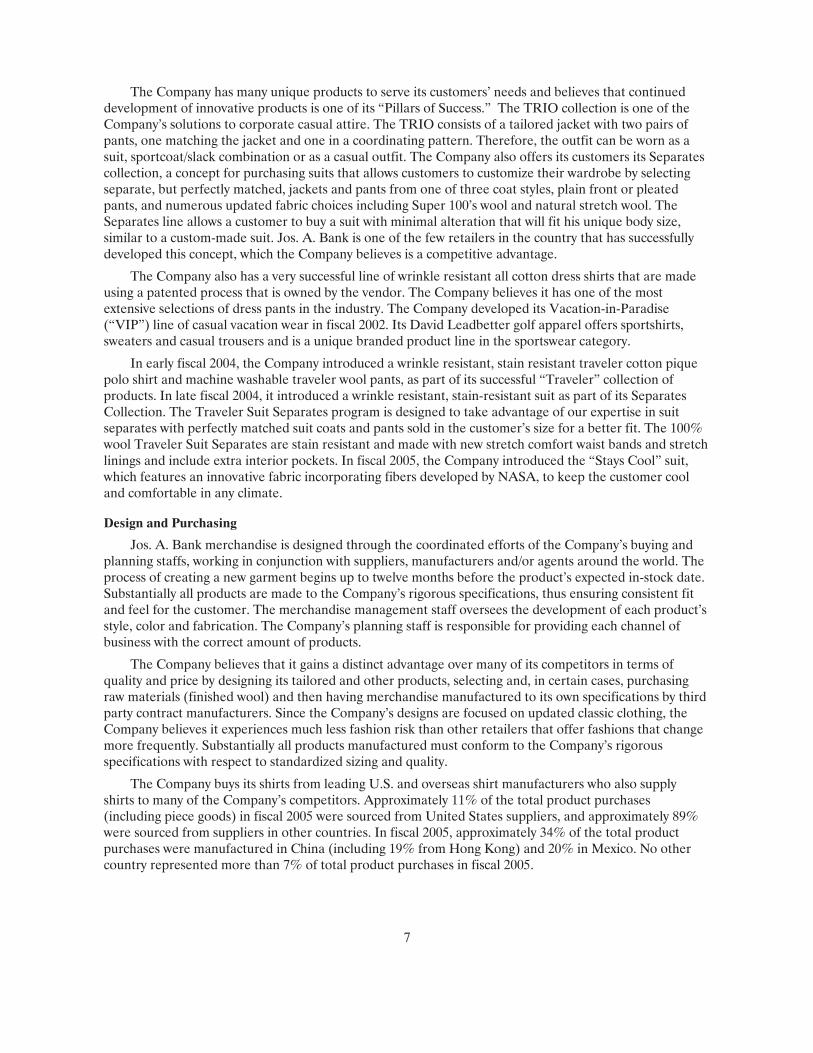
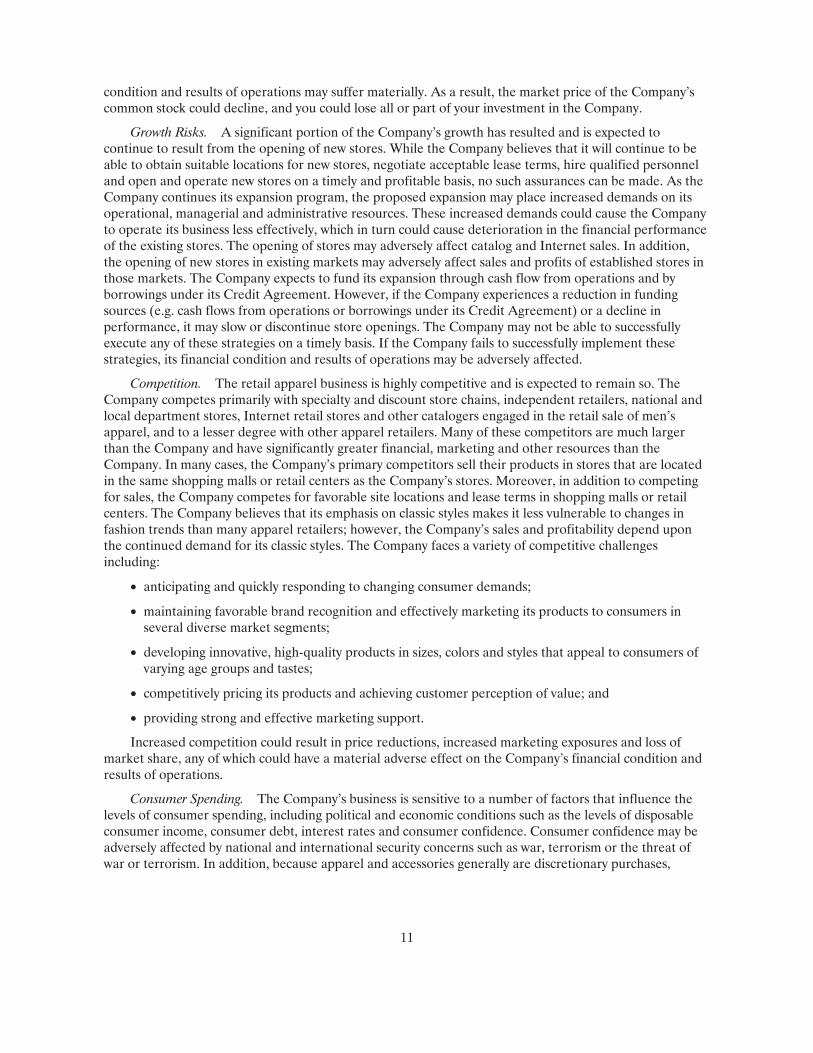
THE COMPANY’S COMMON STOCK ( “JOSB” )
price performance has ranked among the top 2% of all
Nasdaq-listed companies during the five-year calendar
period 2001 to 2005, rising over 1700% as the 31st best
performer on Nasdaq.
G R O W T H I N S T O C K P R I C E *
2001
$3.02
2002
$9.10
2003
$14.80
2004
$22.64
2005
$34.73
P A G E 5
* ALL EARNINGS PER SHARE AMOUNTS AND STOCK PRICES ARE
ADJUSTED FOR THE 25% STOCK DIVIDEND THAT THE COMPANY
ANNOUNCED ON DECEMBER 14 , 2005 , UNDER WHICH SHARE-
HOLDERS OF RECORD AS OF JANUARY 27, 2006 RECEIVED
ONE ADDITIONAL SHARE OF COMMON STOCK FOR EACH FOUR
SHARES THEN OWNED.
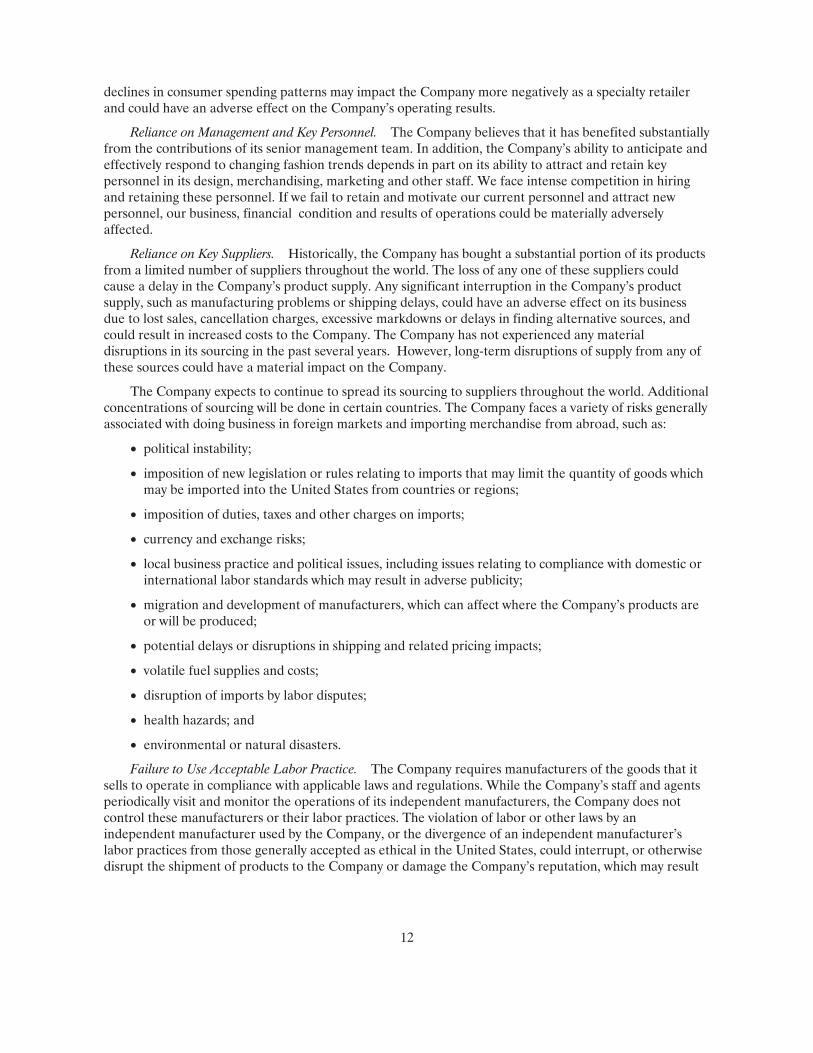
20001999
$1.92$1 .28
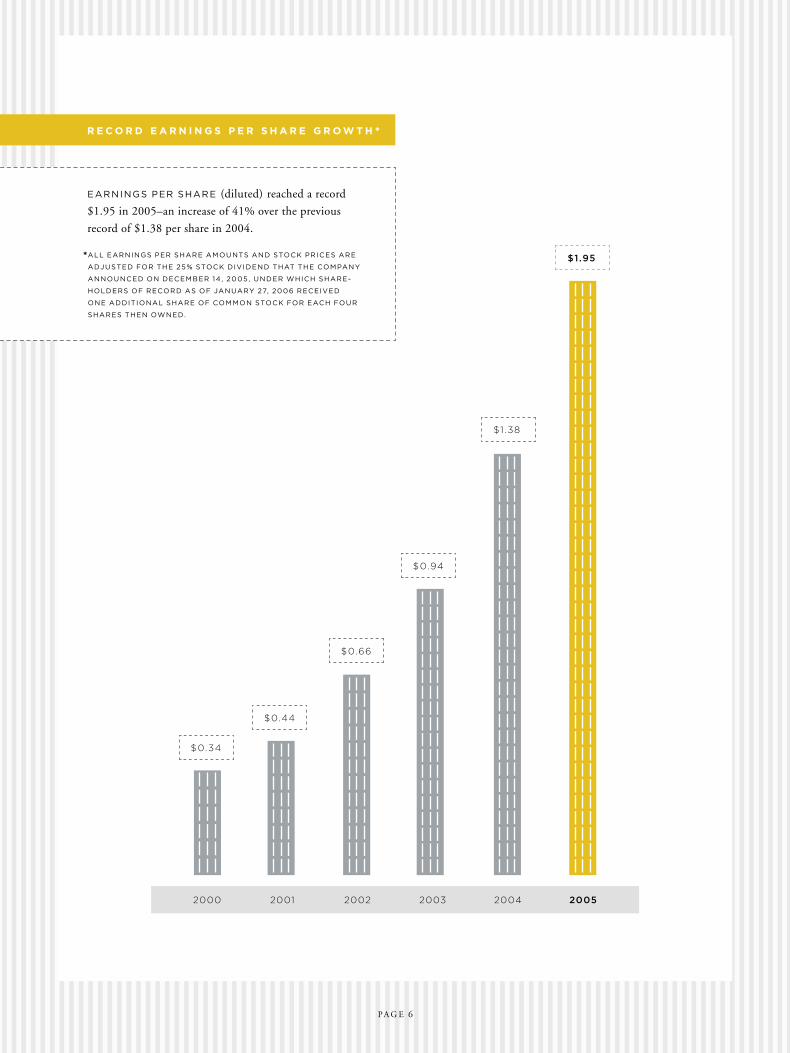
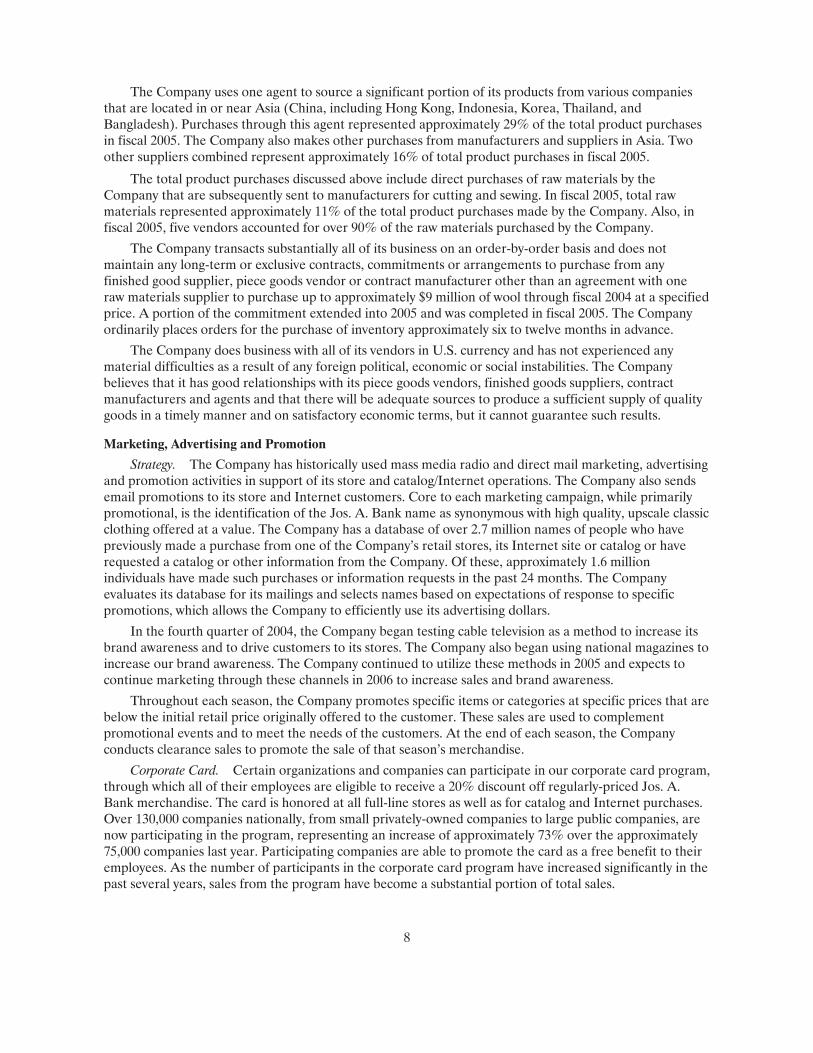
EARNINGS PER SHARE (diluted) reached a record
$1.95 in 2005–an increase of 41% over the previous
record of $1.38 per share in 2004.
R E C O R D E A R N I N G S P E R S H A R E G R O W T H *
2001
$0.44
2002
$0.66
2003
$0.94
2004
$1.38
2005
$1.95
P A G E 6
* ALL EARNINGS PER SHARE AMOUNTS AND STOCK PRICES ARE
ADJUSTED FOR THE 25% STOCK DIVIDEND THAT THE COMPANY
ANNOUNCED ON DECEMBER 14 , 2005 , UNDER WHICH SHARE-
HOLDERS OF RECORD AS OF JANUARY 27, 2006 RECEIVED
ONE ADDITIONAL SHARE OF COMMON STOCK FOR EACH FOUR
SHARES THEN OWNED.
2000
$0.34


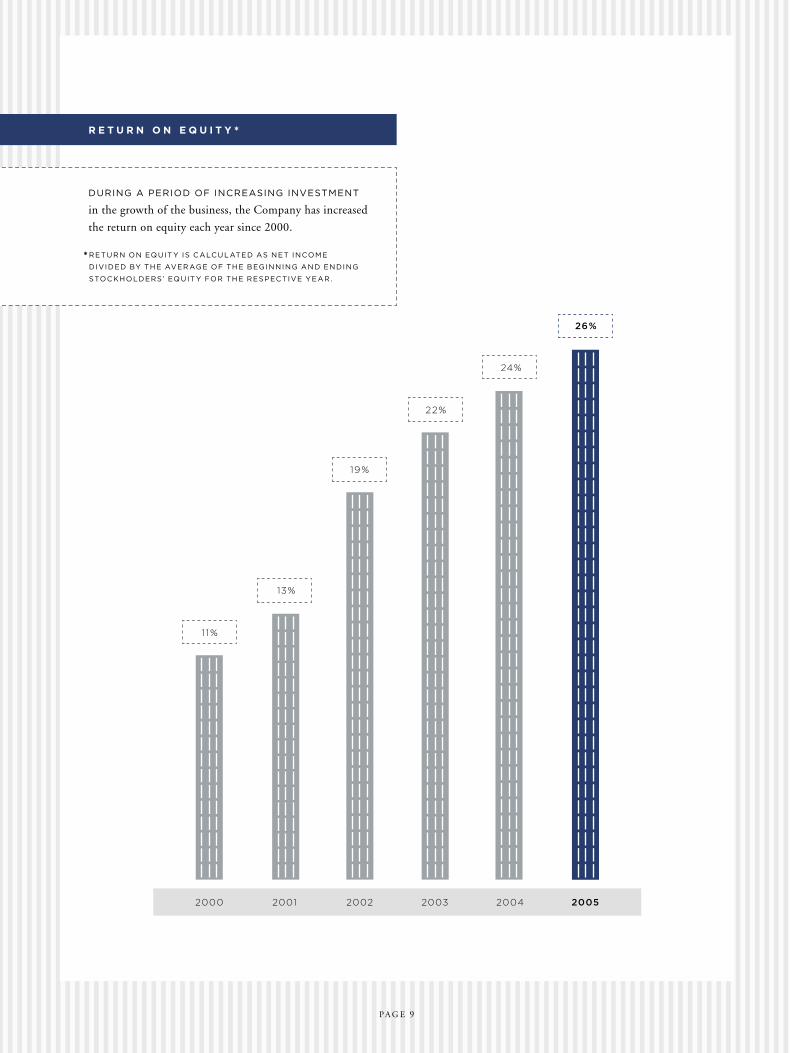
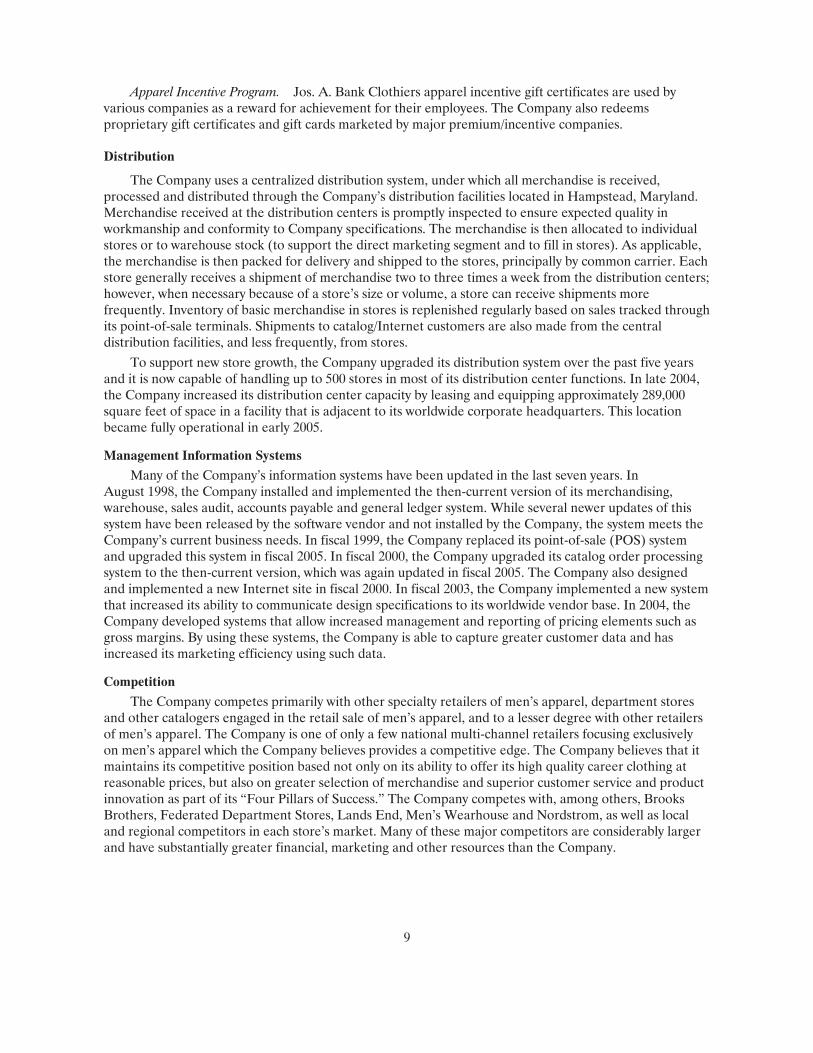
DURING A PERIOD OF INCREASING INVESTMENT
in the growth of the business, the Company has increased
the return on equity each year since 2000.
R E T U R N O N E Q U I T Y *
13%
19%
22%
24%
26%
P A G E 9
* RETURN ON EQUITY IS CALCULATED AS NET INCOME
DIVIDED BY THE AVERAGE OF THE BEGINNING AND ENDING
STOCKHOLDERS’ EQUITY FOR THE RESPECTIVE YEAR.
2001 2002 2003 2004 20052000
11%
2001 2002 2003 2004 20052000
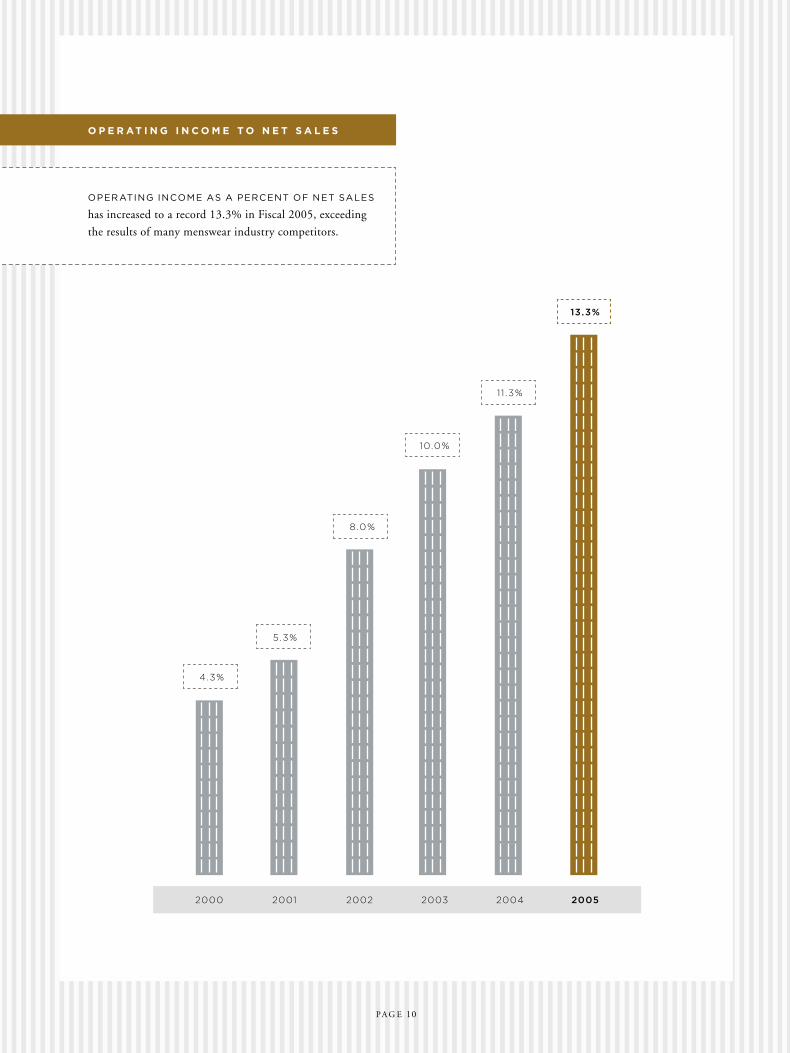
OPERATING INCOME AS A PERCENT OF NET SALES
has increased to a record 13.3% in Fiscal 2005, exceeding
the results of many menswear industry competitors.
O P E R AT I N G I N C O M E T O N E T S A L E S
5.3%
8.0%
10.0%
11 .3%
13.3%
P A G E 10
4.3%


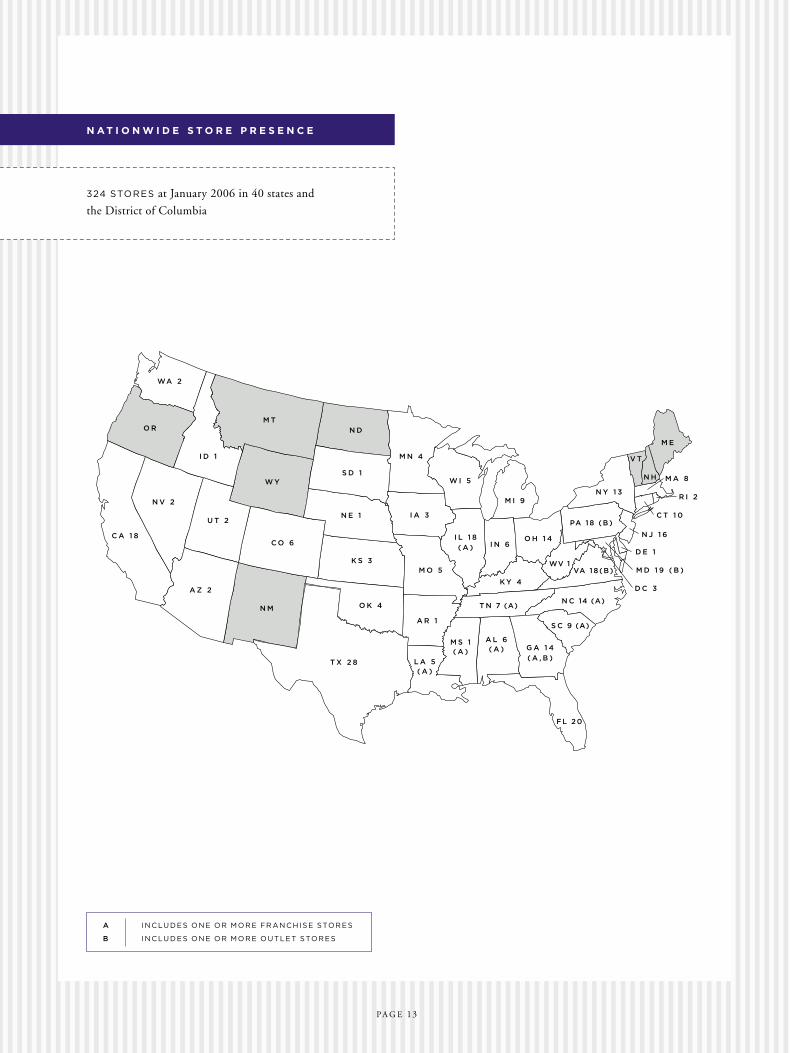
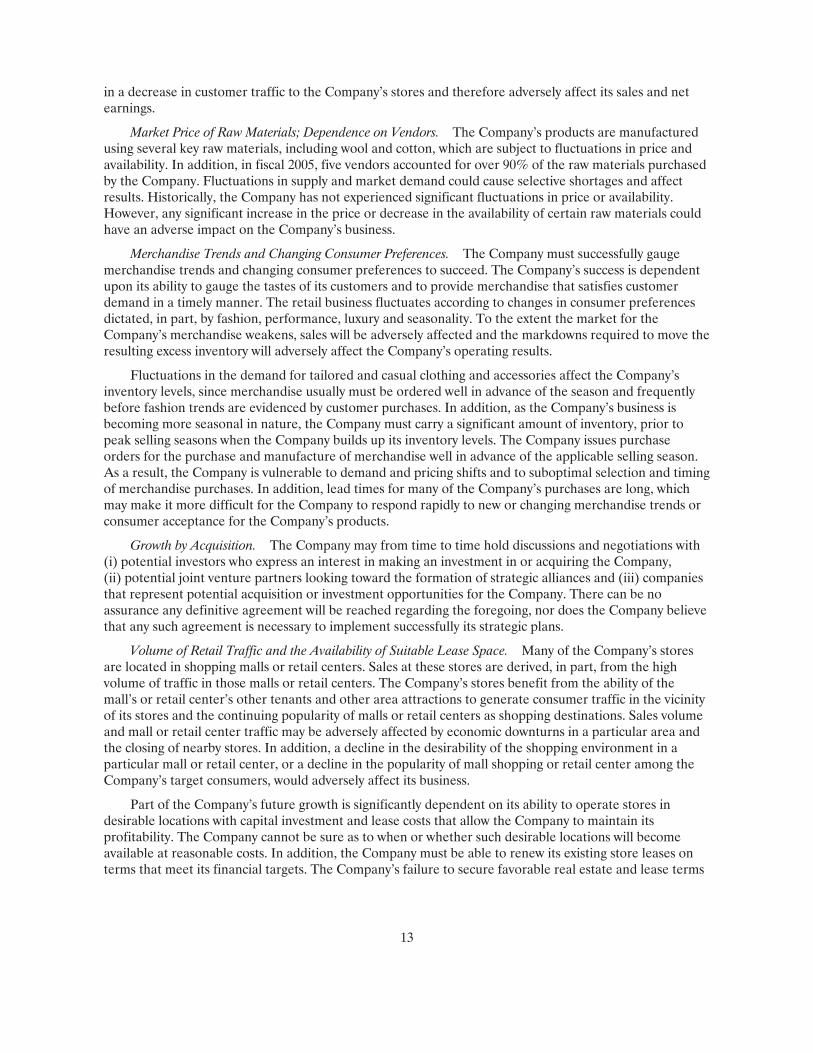
N A T I O N W I D E S T O R E P R E S E N C E
M A 8
R I 2
C T 1 0
N Y 1 3
O H 1 4
M I 9
M N 4
W I 5
U T 2
C O 6
K S 3
T X 2 8
M O 5
I L 1 8
( A ) I N 6
K Y 4
T N 7 (A)
L A 5( A )
M S 1( A )
A L 6( A ) G A 1 4
( A , B )
FL 20
S C 9 (A)
N C 14 (A)
VA 1 8 ( B)
D C 3
N J 1 6
D E 1
M D 1 9 ( B )
PA 18 (B )
WA 2
I D 1
M T
N D
S D 1
O R
C A 1 8
N V 2
W Y
A Z 2
N M
N E 1 I A 3
O K 4
A R 1
WV 1
M E
V T
N H
324 STORES at January 2006 in 40 states and
the District of Columbia
A INCLU DES ON E OR MORE FR ANCHISE STORES
B INCLU DES ON E OR MORE OUTLE T STORES
P A G E 13
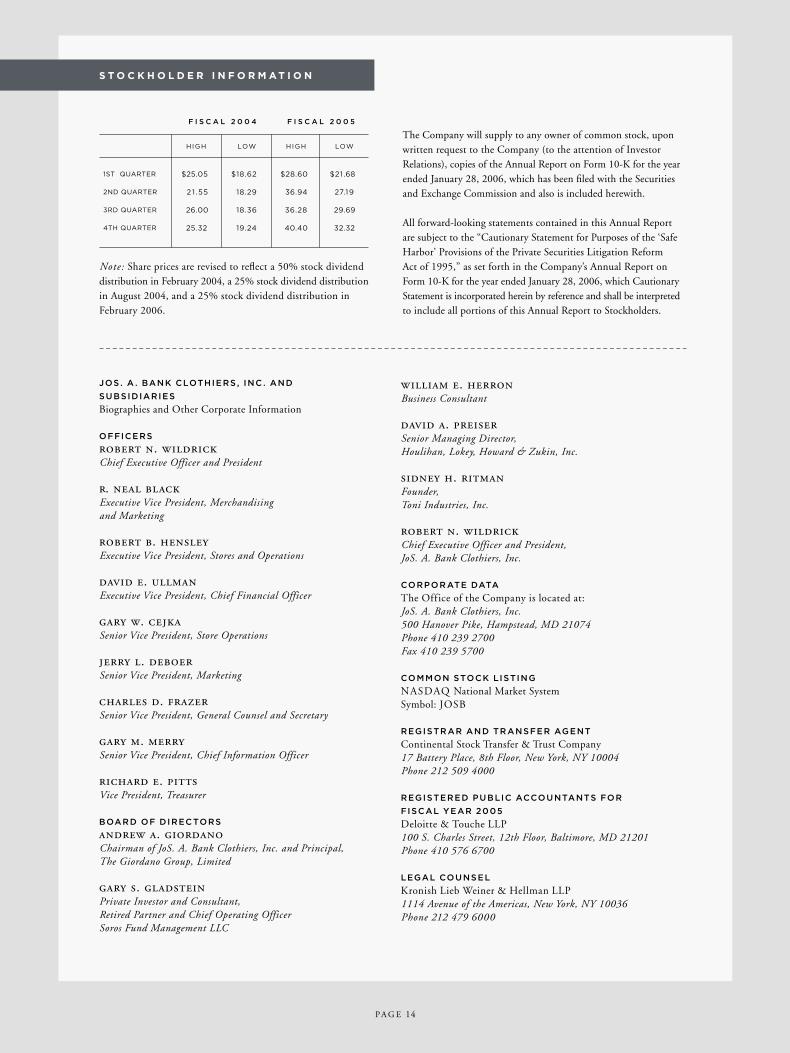
The Company will supply to any owner of common stock, upon written request to the Company (to the attention of Investor Relations), copies of the Annual Report on Form 10-K for the year ended January 28, 2006, which has been filed with the Securities and Exchange Commission and also is included herewith.
All forward-looking statements contained in this Annual Report are subject to the “Cautionary Statement for Purposes of the ‘Safe Harbor’ Provisions of the Private Securities Litigation Reform Act of 1995,” as set forth in the Company’s Annual Report on Form 10-K for the year ended January 28, 2006, which Cautionary Statement is incorporated herein by reference and shall be interpreted to include all portions of this Annual Report to Stockholders.
HIGH LOW
F I S C A L 2 0 0 5
HIGH LOW
F I S C A L 2 0 0 4
1ST QUARTER $25.05 $18.62 $28.60 $21 .68
2ND QUARTER 2 1 .55 18.29 36.94 27.19
3RD QUARTER 26.00 18.36 36.28 29.69
4TH QUARTER 25.32 19.24 40.40 32.32
Note: Share prices are revised to reflect a 50% stock dividend distribution in February 2004, a 25% stock dividend distribution in August 2004, and a 25% stock dividend distribution in February 2006.
JOS . A . BANK CLOTHIERS , INC . AND
SUBSIDIARIES
Biographies and Other Corporate Information
OFFICERS
robert n. wildrickChief Executive Officer and President
r. neal blackExecutive Vice President, Merchandising and Marketing
robert b. hensleyExecutive Vice President, Stores and Operations
david e. ullmanExecutive Vice President, Chief Financial Officer
gary w. cejkaSenior Vice President, Store Operations
jerry l. deboerSenior Vice President, Marketing
charles d. frazerSenior Vice President, General Counsel and Secretary
gary m. merrySenior Vice President, Chief Information Officer
richard e. pittsVice President, Treasurer
BOARD OF DIRECTORS
andrew a. giordanoChairman of JoS. A. Bank Clothiers, Inc. and Principal,The Giordano Group, Limited
gary s. gladsteinPrivate Investor and Consultant,Retired Partner and Chief Operating OfficerSoros Fund Management LLC
william e. herronBusiness Consultant
david a. preiserSenior Managing Director,Houlihan, Lokey, Howard & Zukin, Inc.
sidney h. ritmanFounder,Toni Industries, Inc.
robert n. wildrickChief Executive Officer and President,JoS. A. Bank Clothiers, Inc.
CORPORATE DATA
The Office of the Company is located at:JoS. A. Bank Clothiers, Inc.500 Hanover Pike, Hampstead, MD 21074Phone 410 239 2700Fax 410 239 5700
COMMON STOCK LISTING
NASDAQ National Market SystemSymbol: JOSB
REGISTRAR AND TRANSFER AGENT
Continental Stock Transfer & Trust Company17 Battery Place, 8th Floor, New York, NY 10004Phone 212 509 4000
REGISTERED PUBLIC ACCOUNTANTS FOR
FISCAL YEAR 2005
Deloitte & Touche LLP100 S. Charles Street, 12th Floor, Baltimore, MD 21201Phone 410 576 6700
LEGAL COUNSEL
Kronish Lieb Weiner & Hellman LLP1114 Avenue of the Americas, New York, NY 10036Phone 212 479 6000
S T O C K H O L D E R I N F O R M A T I O N
P A G E 14
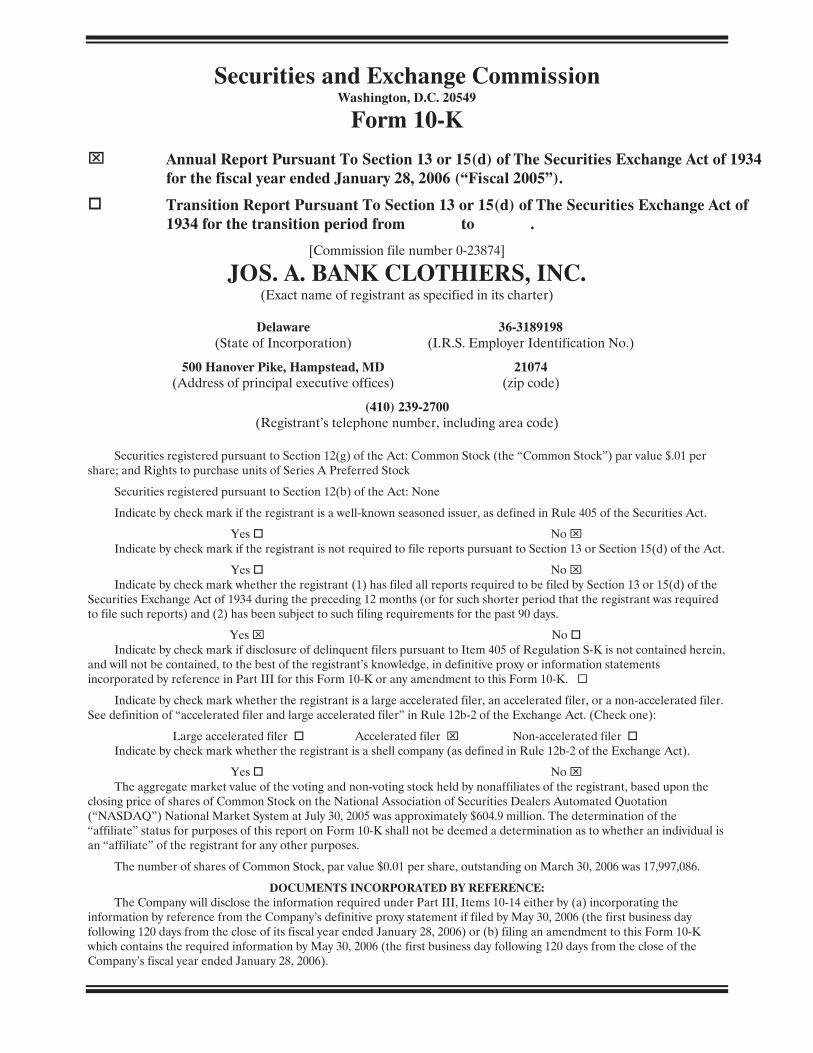
Securities and Exchange Commission Washington, D.C. 20549
Form 10-K
⌧ Annual Report Pursuant To Section 13 or 15(d) of The Securities Exchange Act of 1934 for the fiscal year ended January 28, 2006 (“Fiscal 2005”).
Transition Report Pursuant To Section 13 or 15(d) of The Securities Exchange Act of 1934 for the transition period from to .
[Commission file number 0-23874]
JOS. A. BANK CLOTHIERS, INC. (Exact name of registrant as specified in its charter)
Delaware 36-3189198 (State of Incorporation) (I.R.S. Employer Identification No.)
500 Hanover Pike, Hampstead, MD 21074 (Address of principal executive offices) (zip code)
(410) 239-2700 (Registrant’s telephone number, including area code)
Securities registered pursuant to Section 12(g) of the Act: Common Stock (the “Common Stock”) par value $.01 per share; and Rights to purchase units of Series A Preferred Stock
Securities registered pursuant to Section 12(b) of the Act: None
Indicate by check mark if the registrant is a well-known seasoned issuer, as defined in Rule 405 of the Securities Act.
Yes No ⌧ Indicate by check mark if the registrant is not required to file reports pursuant to Section 13 or Section 15(d) of the Act.
Yes No ⌧ Indicate by check mark whether the registrant (1) has filed all reports required to be filed by Section 13 or 15(d) of the
Securities Exchange Act of 1934 during the preceding 12 months (or for such shorter period that the registrant was required to file such reports) and (2) has been subject to such filing requirements for the past 90 days.
Yes ⌧ No Indicate by check mark if disclosure of delinquent filers pursuant to Item 405 of Regulation S-K is not contained herein,
and will not be contained, to the best of the registrant’s knowledge, in definitive proxy or information statements incorporated by reference in Part III for this Form 10-K or any amendment to this Form 10-K.
Indicate by check mark whether the registrant is a large accelerated filer, an accelerated filer, or a non-accelerated filer. See definition of “accelerated filer and large accelerated filer” in Rule 12b-2 of the Exchange Act. (Check one):
Large accelerated filer Accelerated filer ⌧ Non-accelerated filer Indicate by check mark whether the registrant is a shell company (as defined in Rule 12b-2 of the Exchange Act).
Yes No ⌧ The aggregate market value of the voting and non-voting stock held by nonaffiliates of the registrant, based upon the
closing price of shares of Common Stock on the National Association of Securities Dealers Automated Quotation (“NASDAQ”) National Market System at July 30, 2005 was approximately $604.9 million. The determination of the “affiliate” status for purposes of this report on Form 10-K shall not be deemed a determination as to whether an individual is an “affiliate” of the registrant for any other purposes.
The number of shares of Common Stock, par value $0.01 per share, outstanding on March 30, 2006 was 17,997,086.
DOCUMENTS INCORPORATED BY REFERENCE: The Company will disclose the information required under Part III, Items 10-14 either by (a) incorporating the
information by reference from the Company’s definitive proxy statement if filed by May 30, 2006 (the first business day following 120 days from the close of its fiscal year ended January 28, 2006) or (b) filing an amendment to this Form 10-K which contains the required information by May 30, 2006 (the first business day following 120 days from the close of the Company’s fiscal year ended January 28, 2006).
1
CAUTIONARY STATEMENT FOR PURPOSES OF THE “SAFE HARBOR” PROVISIONS OF THE PRIVATE SECURITIES LITIGATION REFORM ACT OF 1995 AND OTHER INFORMATION
This Annual Report on Form 10-K includes and incorporates by reference certain statements that may be deemed to be forward-looking statements within the meaning of the Private Securities Litigation Reform Act of 1995. The Private Securities Litigation Reform Act of 1995 provides a “safe harbor” for certain forward-looking statements so long as such information is identified as forward-looking and is accompanied by meaningful cautionary statements identifying important factors that could cause actual results to differ materially from those projected in the information. When used in this Annual Report on Form 10-K, the words “estimate,” “project,” “plan,” “will,” “anticipate,” “expect,” “intend,” “outlook,” “may,” “believe,” and other similar expressions are intended to identify forward-looking statements and information. Actual results may differ materially from those forecast due to a variety of factors outside of the Company’s control that can affect the Company’s operating results, liquidity and financial condition. Such factors include risks associated with economic, weather, public health and other factors affecting consumer spending, the successful implementation of the Company’s growth strategy including the ability of the Company to finance its expansion plans, the mix and pricing of goods sold, the effectiveness and profitability of new concepts, the market price of key raw materials such as wool and cotton, seasonality, fashion trends and changing consumer preferences, the effectiveness of the Company’s marketing programs, the availability of lease sites for new stores, the ability to source product from its global supplier base and other factors as described under “Item 1A. Risk Factors.” These cautionary statements qualify all of the forward-looking statements the Company makes herein. The Company cannot assure you that the results or developments anticipated by the Company will be realized or, even if substantially realized, that those results or developments will result in the expected consequences for the Company or affect the Company, its business or its operations in the way the Company expects. The Company cautions you not to place undue reliance on these forward-looking statements, which speak only as of their respective dates. The Company does not undertake an obligation to update or revise any forward-looking statements to reflect actual results or changes in the Company’s assumptions, estimates or projections. The identified risk factors and others are more fully described under the caption “Item 1A. Risk Factors.”
Common Stock Dividends. On December 14, 2005, the Company’s Board of Directors declared a 25% common stock dividend payable on February 15, 2006 to stockholders of record as of January 27, 2006. In conjunction with the distribution of the stock dividend, the Company retired all of its previously held shares of treasury stock. Unless otherwise indicated, all historical weighted average share and per share amounts and all references to the number of common shares elsewhere in the consolidated financial statements, and notes thereto, have been restated to reflect the stock dividend.
Restatements. The consolidated financial statements for fiscal years ended February 2, 2002, February 1, 2003 and January 31, 2004 were restated in fiscal year ended January 29, 2005 (fiscal 2004) in connection with the Company’s Annual Report on Form 10-K, which was filed with the Securities and Exchange Commission on April 14, 2005, to correct certain errors in the accounting for leases.
PART I
Item 1. BUSINESS
General
Jos. A. Bank Clothiers, Inc., a Delaware corporation (the “Company” or “Jos. A. Bank”), is a designer, retailer and direct marketer (through stores, catalog and Internet) of men’s tailored and casual clothing and accessories. The Company sells substantially all of its products exclusively under the Jos. A. Bank label through its 324 retail stores (as of January 28, 2006, which includes seven outlet stores and eleven franchise stores) located throughout 40 states and the District of Columbia in the United States, as well as through the Company’s nationwide catalog and Internet (www.josbank.com) operations.
2
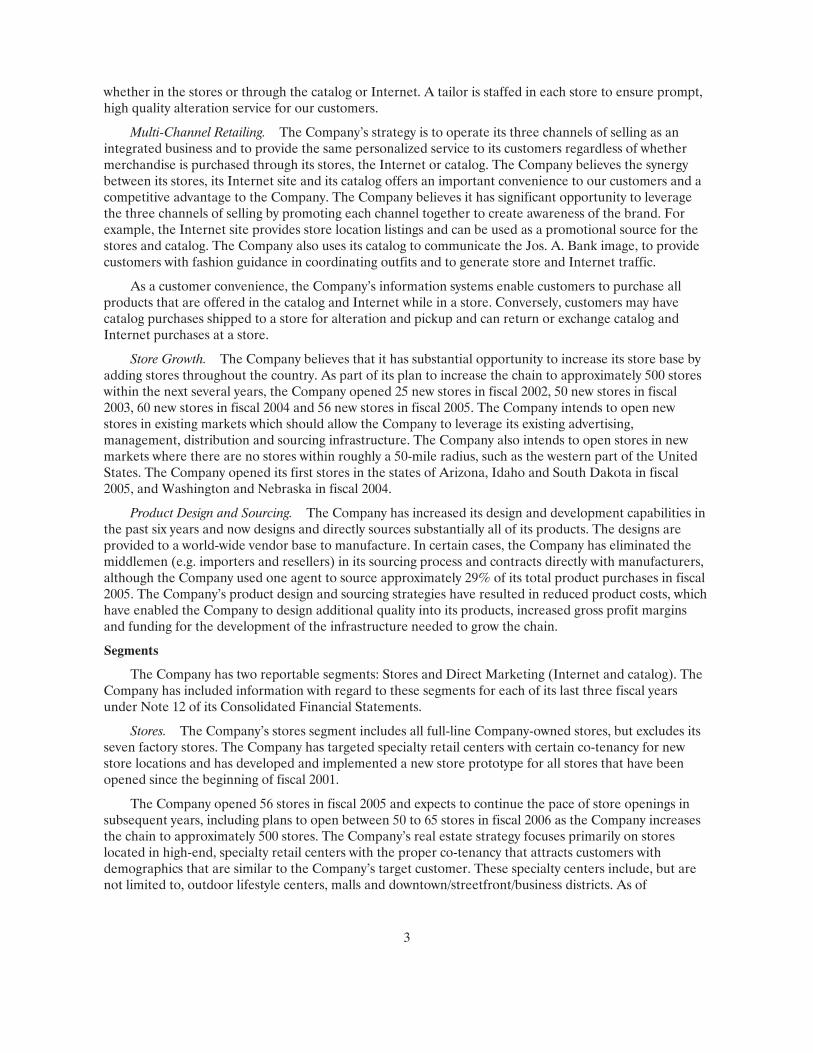
The Company’s products are targeted at the male career professional and emphasize the Jos. A. Bank brand of high quality tailored and casual clothing and accessories. The Company’s products are offered at “Three Levels of Luxury,” which include the opening Jos. A. Bank collection as well as the more luxurious Signature and Signature Gold collections. The Company sources all of its products through third party suppliers, manufacturers and/or agents using Jos. A. Bank designs and specifications.
The Company operates on a 52-53 week fiscal year ending on the Saturday closest to January 31. Information presented for the fiscal years ended January 31, 2004, January 29, 2005 and January 28, 2006 are hereinafter referred to as fiscal 2003, fiscal 2004 and fiscal 2005, respectively. The fiscal year ending February 3, 2007 (fiscal 2006) will be a 53-week year.
Strategy
The Company, established in 1905, has reinvented itself over the past six years by focusing on its “Four Pillars of Success,” which consist of:
1. Quality
2. Service
3. Inventory In-stock
4. Product Innovation
The Company instills these four factors into all aspects of its operation and believes they help create a unique specialty retail environment that develops customer loyalty. Examples of the Company’s commitment to this strategy include:
• continually increasing the already high level of quality of its products by developing and maintaining stringent design and manufacturing specifications;
• developing its multi-channel retailing concept by opening more stores and expanding the catalog and Internet operation, thus offering multiple convenient channels for customers to shop;
• providing outstanding customer service and emphasizing high levels of inventory fulfillment for its customers;
• expanding its product assortment, including developing the “Three Levels of Luxury” and continuing to add innovative new products; and
• increasing its product design and development capabilities while eliminating the middleman in the sourcing of its products.
The Brand. The Company’s branding emphasizes very high levels of quality in all aspects of its interactions with customers, including merchandise and service. The Company has developed very stringent specifications in its product designs to ensure consistency in the fit and quality of the product. The merchandise assortment has “Three Levels of Luxury” and one unwavering level of quality. The “Three Levels of Luxury” range from the original Jos. A. Bank collection to the more luxurious Signature collection to the exclusive Signature Gold collection. Examples of the different levels of luxury include the wool used in suits, sport coats and slacks, ranging from Super 100’s fine wool to the rare 150’s wool, and the uniqueness of tie swatches, some of which are offered in pre-numbered, limited editions.
The Company emphasizes customer service in all aspects of the business. Sales associates focus on developing close business relations with their customers to help serve all of the customer’s clothing needs. Inventory availability is a key focus to ensure customers can purchase merchandise when requested,
3
whether in the stores or through the catalog or Internet. A tailor is staffed in each store to ensure prompt, high quality alteration service for our customers.
Multi-Channel Retailing. The Company’s strategy is to operate its three channels of selling as an integrated business and to provide the same personalized service to its customers regardless of whether merchandise is purchased through its stores, the Internet or catalog. The Company believes the synergy between its stores, its Internet site and its catalog offers an important convenience to our customers and a competitive advantage to the Company. The Company believes it has significant opportunity to leverage the three channels of selling by promoting each channel together to create awareness of the brand. For example, the Internet site provides store location listings and can be used as a promotional source for the stores and catalog. The Company also uses its catalog to communicate the Jos. A. Bank image, to provide customers with fashion guidance in coordinating outfits and to generate store and Internet traffic.
As a customer convenience, the Company’s information systems enable customers to purchase all products that are offered in the catalog and Internet while in a store. Conversely, customers may have catalog purchases shipped to a store for alteration and pickup and can return or exchange catalog and Internet purchases at a store.
Store Growth. The Company believes that it has substantial opportunity to increase its store base by adding stores throughout the country. As part of its plan to increase the chain to approximately 500 stores within the next several years, the Company opened 25 new stores in fiscal 2002, 50 new stores in fiscal 2003, 60 new stores in fiscal 2004 and 56 new stores in fiscal 2005. The Company intends to open new stores in existing markets which should allow the Company to leverage its existing advertising, management, distribution and sourcing infrastructure. The Company also intends to open stores in new markets where there are no stores within roughly a 50-mile radius, such as the western part of the United States. The Company opened its first stores in the states of Arizona, Idaho and South Dakota in fiscal 2005, and Washington and Nebraska in fiscal 2004.
Product Design and Sourcing. The Company has increased its design and development capabilities in the past six years and now designs and directly sources substantially all of its products. The designs are provided to a world-wide vendor base to manufacture. In certain cases, the Company has eliminated the middlemen (e.g. importers and resellers) in its sourcing process and contracts directly with manufacturers, although the Company used one agent to source approximately 29% of its total product purchases in fiscal 2005. The Company’s product design and sourcing strategies have resulted in reduced product costs, which have enabled the Company to design additional quality into its products, increased gross profit margins and funding for the development of the infrastructure needed to grow the chain.
Segments
The Company has two reportable segments: Stores and Direct Marketing (Internet and catalog). The Company has included information with regard to these segments for each of its last three fiscal years under Note 12 of its Consolidated Financial Statements.
Stores. The Company’s stores segment includes all full-line Company-owned stores, but excludes its seven factory stores. The Company has targeted specialty retail centers with certain co-tenancy for new store locations and has developed and implemented a new store prototype for all stores that have been opened since the beginning of fiscal 2001.
The Company opened 56 stores in fiscal 2005 and expects to continue the pace of store openings in subsequent years, including plans to open between 50 to 65 stores in fiscal 2006 as the Company increases the chain to approximately 500 stores. The Company’s real estate strategy focuses primarily on stores located in high-end, specialty retail centers with the proper co-tenancy that attracts customers with demographics that are similar to the Company’s target customer. These specialty centers include, but are not limited to, outdoor lifestyle centers, malls and downtown/streetfront/business districts. As of
4
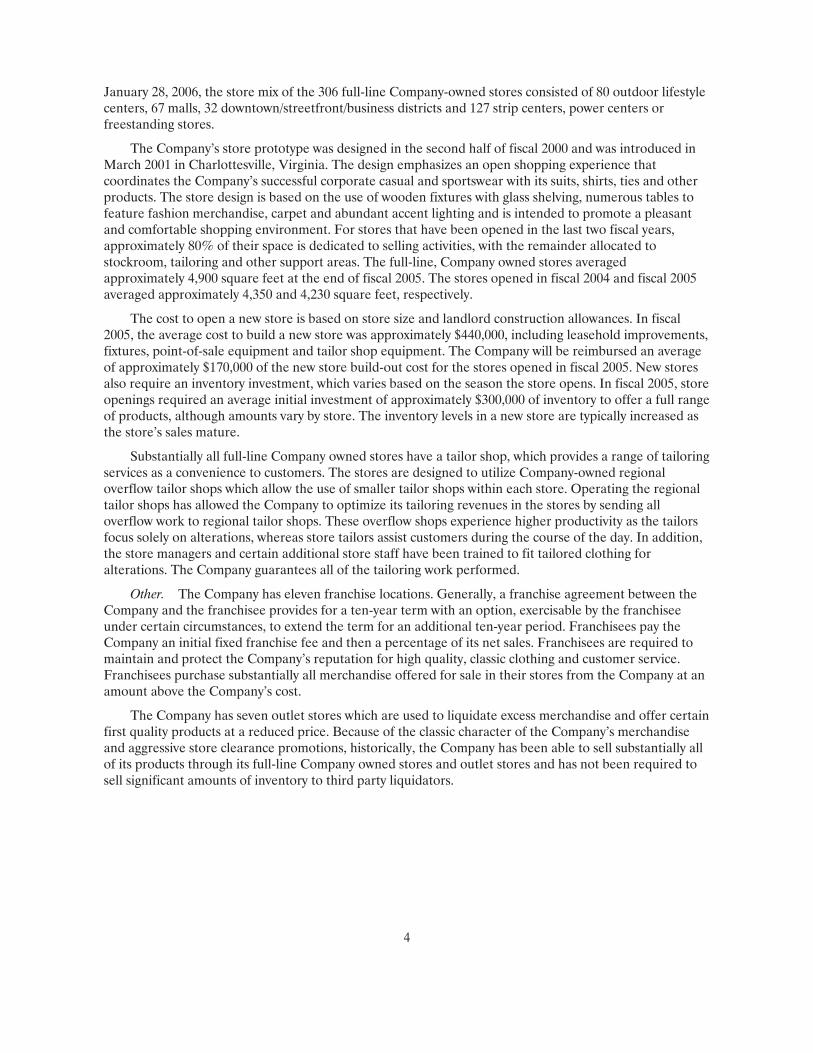
January 28, 2006, the store mix of the 306 full-line Company-owned stores consisted of 80 outdoor lifestyle centers, 67 malls, 32 downtown/streetfront/business districts and 127 strip centers, power centers or freestanding stores.
The Company’s store prototype was designed in the second half of fiscal 2000 and was introduced in March 2001 in Charlottesville, Virginia. The design emphasizes an open shopping experience that coordinates the Company’s successful corporate casual and sportswear with its suits, shirts, ties and other products. The store design is based on the use of wooden fixtures with glass shelving, numerous tables to feature fashion merchandise, carpet and abundant accent lighting and is intended to promote a pleasant and comfortable shopping environment. For stores that have been opened in the last two fiscal years, approximately 80% of their space is dedicated to selling activities, with the remainder allocated to stockroom, tailoring and other support areas. The full-line, Company owned stores averaged approximately 4,900 square feet at the end of fiscal 2005. The stores opened in fiscal 2004 and fiscal 2005 averaged approximately 4,350 and 4,230 square feet, respectively.
The cost to open a new store is based on store size and landlord construction allowances. In fiscal 2005, the average cost to build a new store was approximately $440,000, including leasehold improvements, fixtures, point-of-sale equipment and tailor shop equipment. The Company will be reimbursed an average of approximately $170,000 of the new store build-out cost for the stores opened in fiscal 2005. New stores also require an inventory investment, which varies based on the season the store opens. In fiscal 2005, store openings required an average initial investment of approximately $300,000 of inventory to offer a full range of products, although amounts vary by store. The inventory levels in a new store are typically increased as the store’s sales mature.
Substantially all full-line Company owned stores have a tailor shop, which provides a range of tailoring services as a convenience to customers. The stores are designed to utilize Company-owned regional overflow tailor shops which allow the use of smaller tailor shops within each store. Operating the regional tailor shops has allowed the Company to optimize its tailoring revenues in the stores by sending all overflow work to regional tailor shops. These overflow shops experience higher productivity as the tailors focus solely on alterations, whereas store tailors assist customers during the course of the day. In addition, the store managers and certain additional store staff have been trained to fit tailored clothing for alterations. The Company guarantees all of the tailoring work performed.
Other. The Company has eleven franchise locations. Generally, a franchise agreement between the Company and the franchisee provides for a ten-year term with an option, exercisable by the franchisee under certain circumstances, to extend the term for an additional ten-year period. Franchisees pay the Company an initial fixed franchise fee and then a percentage of its net sales. Franchisees are required to maintain and protect the Company’s reputation for high quality, classic clothing and customer service. Franchisees purchase substantially all merchandise offered for sale in their stores from the Company at an amount above the Company’s cost.
The Company has seven outlet stores which are used to liquidate excess merchandise and offer certain first quality products at a reduced price. Because of the classic character of the Company’s merchandise and aggressive store clearance promotions, historically, the Company has been able to sell substantially all of its products through its full-line Company owned stores and outlet stores and has not been required to sell significant amounts of inventory to third party liquidators.
5
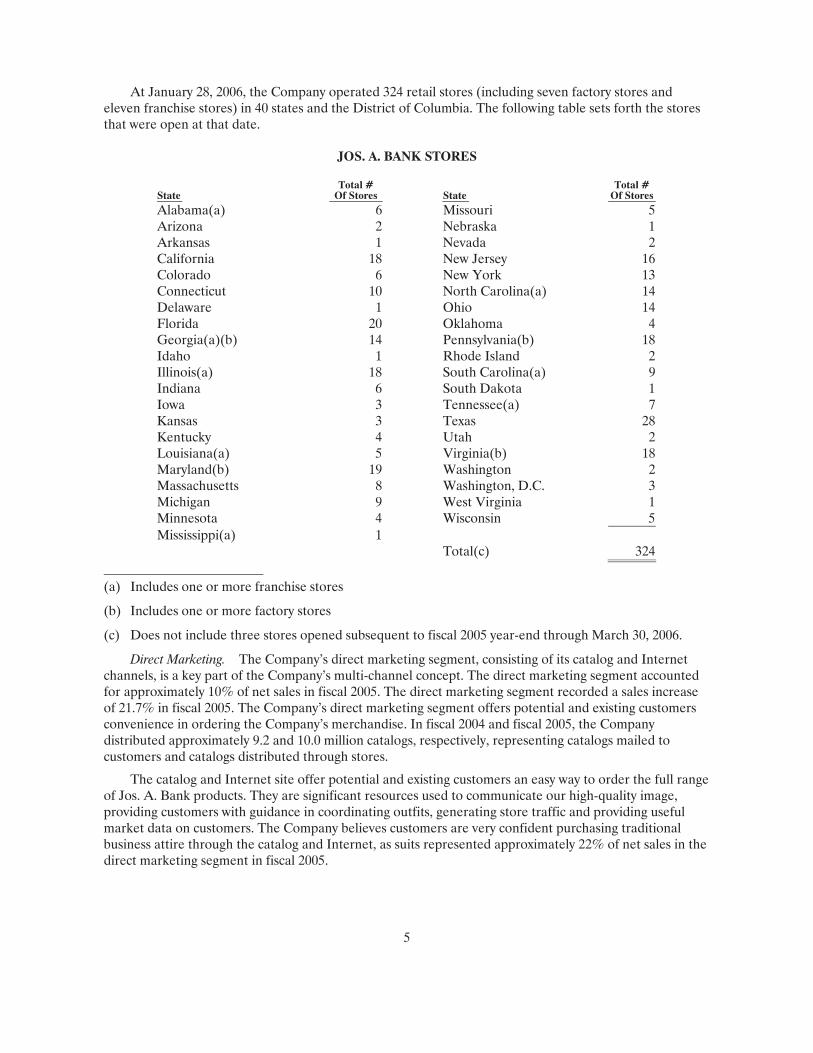
At January 28, 2006, the Company operated 324 retail stores (including seven factory stores and eleven franchise stores) in 40 states and the District of Columbia. The following table sets forth the stores that were open at that date.
JOS. A. BANK STORES
State Total #
Of Stores State Total #
Of Stores Alabama(a) 6 Missouri 5Arizona 2 Nebraska 1Arkansas 1 Nevada 2California 18 New Jersey 16Colorado 6 New York 13Connecticut 10 North Carolina(a) 14Delaware 1 Ohio 14Florida 20 Oklahoma 4Georgia(a)(b) 14 Pennsylvania(b) 18Idaho 1 Rhode Island 2Illinois(a) 18 South Carolina(a) 9Indiana 6 South Dakota 1Iowa 3 Tennessee(a) 7Kansas 3 Texas 28Kentucky 4 Utah 2Louisiana(a) 5 Virginia(b) 18Maryland(b) 19 Washington 2Massachusetts 8 Washington, D.C. 3Michigan 9 West Virginia 1Minnesota 4 Wisconsin 5Mississippi(a) 1 Total(c) 324
(a) Includes one or more franchise stores
(b) Includes one or more factory stores
(c) Does not include three stores opened subsequent to fiscal 2005 year-end through March 30, 2006.
Direct Marketing. The Company’s direct marketing segment, consisting of its catalog and Internet channels, is a key part of the Company’s multi-channel concept. The direct marketing segment accounted for approximately 10% of net sales in fiscal 2005. The direct marketing segment recorded a sales increase of 21.7% in fiscal 2005. The Company’s direct marketing segment offers potential and existing customers convenience in ordering the Company’s merchandise. In fiscal 2004 and fiscal 2005, the Company distributed approximately 9.2 and 10.0 million catalogs, respectively, representing catalogs mailed to customers and catalogs distributed through stores.
The catalog and Internet site offer potential and existing customers an easy way to order the full range of Jos. A. Bank products. They are significant resources used to communicate our high-quality image, providing customers with guidance in coordinating outfits, generating store traffic and providing useful market data on customers. The Company believes customers are very confident purchasing traditional business attire through the catalog and Internet, as suits represented approximately 22% of net sales in the direct marketing segment in fiscal 2005.
6
To make catalog and online shopping as convenient as possible, the Company maintains a toll-free telephone number accessible 24 hours a day, seven days a week. Catalog sales associates can help customers select merchandise and can provide detailed information regarding size, color, fit and other merchandise features. In most cases, sample merchandise is available for catalog sales associates to view, thereby allowing them to better assist customers. Merchandise purchased from the catalog or online may be returned to any of the Company’s stores or to the Company by mail.
The Company has experienced strong growth in its Internet sales in each of the past three fiscal years. The Company has established approximately 5,000 affiliate arrangements which have helped increase Internet sales. The Company typically pays a fee to the affiliate based on a percentage of net sales generated through such affiliate. The Company expects to continue to pursue affiliate arrangements to help fuel future Internet sales increases.
The Company’s Internet site has many customer-friendly features such as high processing speed, real-time inventory status, order confirmation, product search capabilities and an online catalog, among others. The site has enabled the Company to be responsive to trends thereby affording the Company an opportunity to increase sales.
To process catalog orders, sales associates enter orders online into a computerized catalog order entry system, while Internet orders are placed by the customer and are linked to the same order entry system. After an order is placed, it automatically updates files and permits the Company to measure the response to individual catalog mailings and Internet email promotions. Computer processing of orders is performed by the warehouse management system which permits efficient picking of inventory from the warehouses. The Company’s order entry and fulfillment systems permit the shipment of most orders no later than the day after the order is placed (assuming the merchandise is in stock). Orders are shipped primarily by second day delivery or, if requested, by expedited delivery services, such as United Parcel Service priority. Sales and inventory information is available to the Company’s merchants the next day after the transaction.
Merchandising
The Company believes it fills a niche of providing upscale classic, professional men’s clothing with superior quality at a reasonable price. The Company’s merchandising strategy focuses on achieving an updated classic look with extreme attention to detail in quality materials and workmanship. The Company offers a distinctive collection of clothing and accessories necessary to dress the career man from head to toe, including formal, business and business casual, as well as sportswear and golf apparel, all sold under the Jos. A. Bank label. Its product offering includes tuxedos, suits, shirts, vests, ties, sport coats, pants, sportswear, overcoats, sweaters, belts and braces, socks and underwear, among other items. The Company also sells branded shoes from several vendors, which are the only major products it sells not using the Jos. A. Bank brand. In fiscal 2005, the Company introduced shoes under the Jos. A. Bank brand, which are available for sale through the catalog and Internet channels and in selected stores.
The Company’s branding emphasizes very high levels of quality in all aspects of its interactions with customers, including merchandise and service. The Company has developed very stringent specifications in its product designs to ensure consistency in the fit and quality of the product. The merchandise assortment has “Three Levels of Luxury” and one unwavering level of quality. The “Three Levels of Luxury” range from the Company’s original Jos. A. Bank collection, to the more luxurious Signature collection to the exclusive Signature Gold collection. Examples of the different levels of luxury include the wool used in suits, sport coats and slacks, ranging from Super 100’s fine wool to the rare 150’s wool, and the uniqueness of tie swatches, some of which are offered in pre-numbered, limited editions.
The Company believes its merchandise offering is well positioned to meet the changing trends of business dress for its target customer. Suits accounted for 25% of the Company’s net sales in fiscal 2005 and 26% in fiscal 2004, and serve as the foundation of the Company’s extensive offering of other products. When the corporate work environment trended to casual wear several years ago, the Company’s product offerings were modified to meet the needs of the Jos. A. Bank customer.
7
The Company has many unique products to serve its customers’ needs and believes that continued development of innovative products is one of its “Pillars of Success.” The TRIO collection is one of the Company’s solutions to corporate casual attire. The TRIO consists of a tailored jacket with two pairs of pants, one matching the jacket and one in a coordinating pattern. Therefore, the outfit can be worn as a suit, sportcoat/slack combination or as a casual outfit. The Company also offers its customers its Separates collection, a concept for purchasing suits that allows customers to customize their wardrobe by selecting separate, but perfectly matched, jackets and pants from one of three coat styles, plain front or pleated pants, and numerous updated fabric choices including Super 100’s wool and natural stretch wool. The Separates line allows a customer to buy a suit with minimal alteration that will fit his unique body size, similar to a custom-made suit. Jos. A. Bank is one of the few retailers in the country that has successfully developed this concept, which the Company believes is a competitive advantage.
The Company also has a very successful line of wrinkle resistant all cotton dress shirts that are made using a patented process that is owned by the vendor. The Company believes it has one of the most extensive selections of dress pants in the industry. The Company developed its Vacation-in-Paradise (“VIP”) line of casual vacation wear in fiscal 2002. Its David Leadbetter golf apparel offers sportshirts, sweaters and casual trousers and is a unique branded product line in the sportswear category.
In early fiscal 2004, the Company introduced a wrinkle resistant, stain resistant traveler cotton pique polo shirt and machine washable traveler wool pants, as part of its successful “Traveler” collection of products. In late fiscal 2004, it introduced a wrinkle resistant, stain-resistant suit as part of its Separates Collection. The Traveler Suit Separates program is designed to take advantage of our expertise in suit separates with perfectly matched suit coats and pants sold in the customer’s size for a better fit. The 100% wool Traveler Suit Separates are stain resistant and made with new stretch comfort waist bands and stretch linings and include extra interior pockets. In fiscal 2005, the Company introduced the “Stays Cool” suit, which features an innovative fabric incorporating fibers developed by NASA, to keep the customer cool and comfortable in any climate.
Design and Purchasing
Jos. A. Bank merchandise is designed through the coordinated efforts of the Company’s buying and planning staffs, working in conjunction with suppliers, manufacturers and/or agents around the world. The process of creating a new garment begins up to twelve months before the product’s expected in-stock date. Substantially all products are made to the Company’s rigorous specifications, thus ensuring consistent fit and feel for the customer. The merchandise management staff oversees the development of each product’s style, color and fabrication. The Company’s planning staff is responsible for providing each channel of business with the correct amount of products.
The Company believes that it gains a distinct advantage over many of its competitors in terms of quality and price by designing its tailored and other products, selecting and, in certain cases, purchasing raw materials (finished wool) and then having merchandise manufactured to its own specifications by third party contract manufacturers. Since the Company’s designs are focused on updated classic clothing, the Company believes it experiences much less fashion risk than other retailers that offer fashions that change more frequently. Substantially all products manufactured must conform to the Company’s rigorous specifications with respect to standardized sizing and quality.
The Company buys its shirts from leading U.S. and overseas shirt manufacturers who also supply shirts to many of the Company’s competitors. Approximately 11% of the total product purchases (including piece goods) in fiscal 2005 were sourced from United States suppliers, and approximately 89% were sourced from suppliers in other countries. In fiscal 2005, approximately 34% of the total product purchases were manufactured in China (including 19% from Hong Kong) and 20% in Mexico. No other country represented more than 7% of total product purchases in fiscal 2005.
8
The Company uses one agent to source a significant portion of its products from various companies that are located in or near Asia (China, including Hong Kong, Indonesia, Korea, Thailand, and Bangladesh). Purchases through this agent represented approximately 29% of the total product purchases in fiscal 2005. The Company also makes other purchases from manufacturers and suppliers in Asia. Two other suppliers combined represent approximately 16% of total product purchases in fiscal 2005.
The total product purchases discussed above include direct purchases of raw materials by the Company that are subsequently sent to manufacturers for cutting and sewing. In fiscal 2005, total raw materials represented approximately 11% of the total product purchases made by the Company. Also, in fiscal 2005, five vendors accounted for over 90% of the raw materials purchased by the Company.
The Company transacts substantially all of its business on an order-by-order basis and does not maintain any long-term or exclusive contracts, commitments or arrangements to purchase from any finished good supplier, piece goods vendor or contract manufacturer other than an agreement with one raw materials supplier to purchase up to approximately $9 million of wool through fiscal 2004 at a specified price. A portion of the commitment extended into 2005 and was completed in fiscal 2005. The Company ordinarily places orders for the purchase of inventory approximately six to twelve months in advance.
The Company does business with all of its vendors in U.S. currency and has not experienced any material difficulties as a result of any foreign political, economic or social instabilities. The Company believes that it has good relationships with its piece goods vendors, finished goods suppliers, contract manufacturers and agents and that there will be adequate sources to produce a sufficient supply of quality goods in a timely manner and on satisfactory economic terms, but it cannot guarantee such results.
Marketing, Advertising and Promotion
Strategy. The Company has historically used mass media radio and direct mail marketing, advertising and promotion activities in support of its store and catalog/Internet operations. The Company also sends email promotions to its store and Internet customers. Core to each marketing campaign, while primarily promotional, is the identification of the Jos. A. Bank name as synonymous with high quality, upscale classic clothing offered at a value. The Company has a database of over 2.7 million names of people who have previously made a purchase from one of the Company’s retail stores, its Internet site or catalog or have requested a catalog or other information from the Company. Of these, approximately 1.6 million individuals have made such purchases or information requests in the past 24 months. The Company evaluates its database for its mailings and selects names based on expectations of response to specific promotions, which allows the Company to efficiently use its advertising dollars.
In the fourth quarter of 2004, the Company began testing cable television as a method to increase its brand awareness and to drive customers to its stores. The Company also began using national magazines to increase our brand awareness. The Company continued to utilize these methods in 2005 and expects to continue marketing through these channels in 2006 to increase sales and brand awareness.
Throughout each season, the Company promotes specific items or categories at specific prices that are below the initial retail price originally offered to the customer. These sales are used to complement promotional events and to meet the needs of the customers. At the end of each season, the Company conducts clearance sales to promote the sale of that season’s merchandise.
Corporate Card. Certain organizations and companies can participate in our corporate card program, through which all of their employees are eligible to receive a 20% discount off regularly-priced Jos. A. Bank merchandise. The card is honored at all full-line stores as well as for catalog and Internet purchases. Over 130,000 companies nationally, from small privately-owned companies to large public companies, are now participating in the program, representing an increase of approximately 73% over the approximately 75,000 companies last year. Participating companies are able to promote the card as a free benefit to their employees. As the number of participants in the corporate card program have increased significantly in the past several years, sales from the program have become a substantial portion of total sales.
9
Apparel Incentive Program. Jos. A. Bank Clothiers apparel incentive gift certificates are used by various companies as a reward for achievement for their employees. The Company also redeems proprietary gift certificates and gift cards marketed by major premium/incentive companies.
Distribution
The Company uses a centralized distribution system, under which all merchandise is received, processed and distributed through the Company’s distribution facilities located in Hampstead, Maryland. Merchandise received at the distribution centers is promptly inspected to ensure expected quality in workmanship and conformity to Company specifications. The merchandise is then allocated to individual stores or to warehouse stock (to support the direct marketing segment and to fill in stores). As applicable, the merchandise is then packed for delivery and shipped to the stores, principally by common carrier. Each store generally receives a shipment of merchandise two to three times a week from the distribution centers; however, when necessary because of a store’s size or volume, a store can receive shipments more frequently. Inventory of basic merchandise in stores is replenished regularly based on sales tracked through its point-of-sale terminals. Shipments to catalog/Internet customers are also made from the central distribution facilities, and less frequently, from stores.
To support new store growth, the Company upgraded its distribution system over the past five years and it is now capable of handling up to 500 stores in most of its distribution center functions. In late 2004, the Company increased its distribution center capacity by leasing and equipping approximately 289,000 square feet of space in a facility that is adjacent to its worldwide corporate headquarters. This location became fully operational in early 2005.
Management Information Systems
Many of the Company’s information systems have been updated in the last seven years. In August 1998, the Company installed and implemented the then-current version of its merchandising, warehouse, sales audit, accounts payable and general ledger system. While several newer updates of this system have been released by the software vendor and not installed by the Company, the system meets the Company’s current business needs. In fiscal 1999, the Company replaced its point-of-sale (POS) system and upgraded this system in fiscal 2005. In fiscal 2000, the Company upgraded its catalog order processing system to the then-current version, which was again updated in fiscal 2005. The Company also designed and implemented a new Internet site in fiscal 2000. In fiscal 2003, the Company implemented a new system that increased its ability to communicate design specifications to its worldwide vendor base. In 2004, the Company developed systems that allow increased management and reporting of pricing elements such as gross margins. By using these systems, the Company is able to capture greater customer data and has increased its marketing efficiency using such data.
Competition
The Company competes primarily with other specialty retailers of men’s apparel, department stores and other catalogers engaged in the retail sale of men’s apparel, and to a lesser degree with other retailers of men’s apparel. The Company is one of only a few national multi-channel retailers focusing exclusively on men’s apparel which the Company believes provides a competitive edge. The Company believes that it maintains its competitive position based not only on its ability to offer its high quality career clothing at reasonable prices, but also on greater selection of merchandise and superior customer service and product innovation as part of its “Four Pillars of Success.” The Company competes with, among others, Brooks Brothers, Federated Department Stores, Lands End, Men’s Wearhouse and Nordstrom, as well as local and regional competitors in each store’s market. Many of these major competitors are considerably larger and have substantially greater financial, marketing and other resources than the Company.
10
Trademarks
The Company is the owner or exclusive licensee in the United States of the marks “Jos. A. Bank,” “The Miracle Collection,” and “Vacation-in-Paradise.” These trademarks are registered in the United States Patent and Trademark Office. A Federal registration is renewable indefinitely if the trademark is still in use at the time of renewal. The Company’s rights in the Jos. A. Bank trademark are a material part of the Company’s business. Accordingly, the Company intends to maintain its use of the trademark. The Company is not aware of any claims of infringement or other material challenges to the Company’s right to use its marks in the United States.
In addition, the Company has registered “josbank.com” and various other Internet domain names. The Company intends to renew its registration of domain names from time to time for the conduct and protection of its e-commerce business.
The Company’s net sales, net income and inventory levels fluctuate on a seasonal basis. The Company has increased its marketing efforts during peak selling times and expanded its inventory to include more Corporate Casual and Sportswear, resulting in profits generated during the fourth quarter holiday season becoming a larger portion of annual profits. Seasonality is also impacted by growth as more new stores are opened in the second half of the year. Seasonal fluctuations typically affect the Company’s inventory levels, with higher inventory carried in advance of peak selling periods, including the holiday season. In the fourth quarters of fiscal years 2003, 2004 and 2005, the Company generated approximately 59%, 51% and 53%, respectively, of its annual net income.
Employees
As of March 30, 2006, the Company had approximately 2,995 employees, consisting of 582 part-time employees and 2,413 full-time employees.
As of March 30, 2006, approximately 225 employees worked in the tailoring overflow shop and distribution center, most of whom are represented by the union, UNITE-HERE. The current collective bargaining agreement was recently negotiated to extend to February 28, 2009. The Company believes that union relations are good, as there have been no work stoppages in more than 20 years. The Company believes that its relations with its non-union employees are also good.
Approximately 50 sales associates are union members under a separate contract which extends to April 30, 2006. The Company maintains a good relationship with these employees and their union and does not anticipate any significant disruption in its operating workforce.
Available Information
The Company’s principal executive offices are located at 500 Hanover Pike, Hampstead, Maryland 21074. The Company’s telephone number is (410) 239-2700 and its website address is www.josbank.com. The Company makes its annual reports on Form 10-K, quarterly reports on Form 10-Q, current reports on Form 8-K, and amendments to these reports available on its website free of charge as soon as practicable after they are filed with the Securities and Exchange Commission. In addition, the public may read and copy any materials filed by the Company with the SEC at the SEC’s public reference room at 450 Fifth Street, N.W., Washington D.C. 20549. The public may obtain information on the operation of the Public Reference Room by calling the SEC at 1-800-SEC-0330. Also, the SEC maintains an Internet Site that contains reports, proxy and information statements. Its web address is www.sec.gov.
Item 1A. RISK FACTORS
You should consider carefully the risks described below, together with the other information contained in this report. If any of the following events actually occurs, the Company’s business, financial
11
condition and results of operations may suffer materially. As a result, the market price of the Company’s common stock could decline, and you could lose all or part of your investment in the Company.
Growth Risks. A significant portion of the Company’s growth has resulted and is expected to continue to result from the opening of new stores. While the Company believes that it will continue to be able to obtain suitable locations for new stores, negotiate acceptable lease terms, hire qualified personnel and open and operate new stores on a timely and profitable basis, no such assurances can be made. As the Company continues its expansion program, the proposed expansion may place increased demands on its operational, managerial and administrative resources. These increased demands could cause the Company to operate its business less effectively, which in turn could cause deterioration in the financial performance of the existing stores. The opening of stores may adversely affect catalog and Internet sales. In addition, the opening of new stores in existing markets may adversely affect sales and profits of established stores in those markets. The Company expects to fund its expansion through cash flow from operations and by borrowings under its Credit Agreement. However, if the Company experiences a reduction in funding sources (e.g. cash flows from operations or borrowings under its Credit Agreement) or a decline in performance, it may slow or discontinue store openings. The Company may not be able to successfully execute any of these strategies on a timely basis. If the Company fails to successfully implement these strategies, its financial condition and results of operations may be adversely affected.
Competition. The retail apparel business is highly competitive and is expected to remain so. The Company competes primarily with specialty and discount store chains, independent retailers, national and local department stores, Internet retail stores and other catalogers engaged in the retail sale of men’s apparel, and to a lesser degree with other apparel retailers. Many of these competitors are much larger than the Company and have significantly greater financial, marketing and other resources than the Company. In many cases, the Company’s primary competitors sell their products in stores that are located in the same shopping malls or retail centers as the Company’s stores. Moreover, in addition to competing for sales, the Company competes for favorable site locations and lease terms in shopping malls or retail centers. The Company believes that its emphasis on classic styles makes it less vulnerable to changes in fashion trends than many apparel retailers; however, the Company’s sales and profitability depend upon the continued demand for its classic styles. The Company faces a variety of competitive challenges including:
• anticipating and quickly responding to changing consumer demands;
• maintaining favorable brand recognition and effectively marketing its products to consumers in several diverse market segments;
• developing innovative, high-quality products in sizes, colors and styles that appeal to consumers of varying age groups and tastes;
• competitively pricing its products and achieving customer perception of value; and
• providing strong and effective marketing support.
Increased competition could result in price reductions, increased marketing exposures and loss of market share, any of which could have a material adverse effect on the Company’s financial condition and results of operations.
Consumer Spending. The Company’s business is sensitive to a number of factors that influence the levels of consumer spending, including political and economic conditions such as the levels of disposable consumer income, consumer debt, interest rates and consumer confidence. Consumer confidence may be adversely affected by national and international security concerns such as war, terrorism or the threat of war or terrorism. In addition, because apparel and accessories generally are discretionary purchases,
12
declines in consumer spending patterns may impact the Company more negatively as a specialty retailer and could have an adverse effect on the Company’s operating results.
Reliance on Management and Key Personnel. The Company believes that it has benefited substantially from the contributions of its senior management team. In addition, the Company’s ability to anticipate and effectively respond to changing fashion trends depends in part on its ability to attract and retain key personnel in its design, merchandising, marketing and other staff. We face intense competition in hiring and retaining these personnel. If we fail to retain and motivate our current personnel and attract new personnel, our business, financial condition and results of operations could be materially adversely affected.
Reliance on Key Suppliers. Historically, the Company has bought a substantial portion of its products from a limited number of suppliers throughout the world. The loss of any one of these suppliers could cause a delay in the Company’s product supply. Any significant interruption in the Company’s product supply, such as manufacturing problems or shipping delays, could have an adverse effect on its business due to lost sales, cancellation charges, excessive markdowns or delays in finding alternative sources, and could result in increased costs to the Company. The Company has not experienced any material disruptions in its sourcing in the past several years. However, long-term disruptions of supply from any of these sources could have a material impact on the Company.
The Company expects to continue to spread its sourcing to suppliers throughout the world. Additional concentrations of sourcing will be done in certain countries. The Company faces a variety of risks generally associated with doing business in foreign markets and importing merchandise from abroad, such as:
• political instability;
• imposition of new legislation or rules relating to imports that may limit the quantity of goods which may be imported into the United States from countries or regions;
• imposition of duties, taxes and other charges on imports;
• currency and exchange risks;
• local business practice and political issues, including issues relating to compliance with domestic or international labor standards which may result in adverse publicity;
• migration and development of manufacturers, which can affect where the Company’s products are or will be produced;
• potential delays or disruptions in shipping and related pricing impacts;
• volatile fuel supplies and costs;
• disruption of imports by labor disputes;
• health hazards; and
• environmental or natural disasters.
Failure to Use Acceptable Labor Practice. The Company requires manufacturers of the goods that it sells to operate in compliance with applicable laws and regulations. While the Company’s staff and agents periodically visit and monitor the operations of its independent manufacturers, the Company does not control these manufacturers or their labor practices. The violation of labor or other laws by an independent manufacturer used by the Company, or the divergence of an independent manufacturer’s labor practices from those generally accepted as ethical in the United States, could interrupt, or otherwise disrupt the shipment of products to the Company or damage the Company’s reputation, which may result
13
in a decrease in customer traffic to the Company’s stores and therefore adversely affect its sales and net earnings.
Market Price of Raw Materials; Dependence on Vendors. The Company’s products are manufactured using several key raw materials, including wool and cotton, which are subject to fluctuations in price and availability. In addition, in fiscal 2005, five vendors accounted for over 90% of the raw materials purchased by the Company. Fluctuations in supply and market demand could cause selective shortages and affect results. Historically, the Company has not experienced significant fluctuations in price or availability. However, any significant increase in the price or decrease in the availability of certain raw materials could have an adverse impact on the Company’s business.
Merchandise Trends and Changing Consumer Preferences. The Company must successfully gauge merchandise trends and changing consumer preferences to succeed. The Company’s success is dependent upon its ability to gauge the tastes of its customers and to provide merchandise that satisfies customer demand in a timely manner. The retail business fluctuates according to changes in consumer preferences dictated, in part, by fashion, performance, luxury and seasonality. To the extent the market for the Company’s merchandise weakens, sales will be adversely affected and the markdowns required to move the resulting excess inventory will adversely affect the Company’s operating results.
Fluctuations in the demand for tailored and casual clothing and accessories affect the Company’s inventory levels, since merchandise usually must be ordered well in advance of the season and frequently before fashion trends are evidenced by customer purchases. In addition, as the Company’s business is becoming more seasonal in nature, the Company must carry a significant amount of inventory, prior to peak selling seasons when the Company builds up its inventory levels. The Company issues purchase orders for the purchase and manufacture of merchandise well in advance of the applicable selling season. As a result, the Company is vulnerable to demand and pricing shifts and to suboptimal selection and timing of merchandise purchases. In addition, lead times for many of the Company’s purchases are long, which may make it more difficult for the Company to respond rapidly to new or changing merchandise trends or consumer acceptance for the Company’s products.
Growth by Acquisition. The Company may from time to time hold discussions and negotiations with (i) potential investors who express an interest in making an investment in or acquiring the Company, (ii) potential joint venture partners looking toward the formation of strategic alliances and (iii) companies that represent potential acquisition or investment opportunities for the Company. There can be no assurance any definitive agreement will be reached regarding the foregoing, nor does the Company believe that any such agreement is necessary to implement successfully its strategic plans.
Volume of Retail Traffic and the Availability of Suitable Lease Space. Many of the Company’s stores are located in shopping malls or retail centers. Sales at these stores are derived, in part, from the high volume of traffic in those malls or retail centers. The Company’s stores benefit from the ability of the mall’s or retail center’s other tenants and other area attractions to generate consumer traffic in the vicinity of its stores and the continuing popularity of malls or retail centers as shopping destinations. Sales volume and mall or retail center traffic may be adversely affected by economic downturns in a particular area and the closing of nearby stores. In addition, a decline in the desirability of the shopping environment in a particular mall or retail center, or a decline in the popularity of mall shopping or retail center among the Company’s target consumers, would adversely affect its business.
Part of the Company’s future growth is significantly dependent on its ability to operate stores in desirable locations with capital investment and lease costs that allow the Company to maintain its profitability. The Company cannot be sure as to when or whether such desirable locations will become available at reasonable costs. In addition, the Company must be able to renew its existing store leases on terms that meet its financial targets. The Company’s failure to secure favorable real estate and lease terms
14
generally and upon renewal could cause the Company to lose market share which would reduce its revenues and gross profit.
Delivery Failures. The success of the Company’s stores depends on their timely receipt of merchandise from the distribution facilities, and the success of the Company’s direct marketing segment depends on the timely delivery of merchandise to the customers. Independent third party transportation companies deliver the Company’s merchandise to substantially all of the stores and to the customers. Some of these third parties employ personnel represented by a labor union. Disruptions in the delivery of merchandise or work stoppages by employees of these third parties could delay the timely receipt of merchandise, which could result in cancelled sales, a loss of loyalty to the Company’s brand and excess inventory. The Company may be required to respond in a number of ways, many of which could decrease its gross profits and net income.
Costs of Mailing, Paper and Printing. Postal rate increases and paper and printing costs will affect the cost of the Company’s catalog and promotional mailings and sales and marketing expenses. The Company relies on discounts from the basic postal rate structure, such as discounts for bulk mailings and sorting by zip code and carrier routes. Future paper and postal rate increases could adversely impact the Company’s earnings if it was unable to offset such increases by raising prices or by implementing more efficient printing, mailing, delivery and order fulfillment systems.
Intellectual Property Rights Risks. The Company’s trademarks are important to its success and competitive position. The Company is the owner or exclusive licensee in the United States of the marks “Jos. A. Bank,” “The Miracle Collection,” and “Vacation-in-Paradise.” These trademarks are registered in the United States Patent and Trademark Office. The Company is susceptible to others imitating its products and infringing on its intellectual property rights. Imitation or counterfeiting of the Company’s products or other infringement of its intellectual property rights could diminish the value of its brand or otherwise adversely affect its revenues. The actions the Company has taken to establish and protect its trademarks may not be adequate to prevent imitation of its products by others or to prevent others from seeking to invalidate the Company’s trademarks or block sales of its products as a violation of the trademarks and intellectual property rights of others. In addition, others may assert rights in, or ownership of, the Company’s trademarks and other intellectual property rights or in marks that are similar to the Company’s or marks that the Company licenses and/or market and the Company may not be able to successfully resolve these types of conflicts to its satisfaction. In some cases, there may be trademark owners who have prior rights to the Company’s marks because the laws of certain foreign countries may not protect intellectual property rights to the same extent as do the laws of the United States. In other cases, there may be holders who have prior rights to similar marks. Failure to protect the Company’s trademarks could result in a material adverse effect on its business. The Company is not aware of any claims of infringement or other material challenges to the Company’s right to use its marks in the United States.
Use of Consumer Information. The Company uses its customer database to market to its customers. Any limitations imposed on the use of such consumer data, whether imposed by federal or state governments or business partners, could have an adverse effect on the Company’s future marketing activity. In addition, to the extent the Company’s security procedures and protection of customer information prove to be insufficient or inadequate, the Company may become subject to litigation, which could expose the Company to liability and cause damage to its reputation or brand.
Centralized Distribution Centers. The distribution of the Company’s products is centralized in two distribution centers in Hampstead, Maryland. All of the merchandise the Company purchases is shipped directly to its distribution centers, where it is prepared for shipment to the appropriate stores. If the distribution centers were to shut down or lose significant capacity for any reason, the Company’s operations would likely be seriously disrupted. As a result, the Company could incur significantly higher
15
costs and longer lead times associated with distributing its products to its stores during the time it takes for the Company to reopen or replace the distribution centers.
Seasonality. The Company’s net sales, net income and inventory levels fluctuate on a seasonal basis. The Company has increased its marketing efforts during peak selling times and expanded its inventory to include more Corporate Casual and Sportswear, resulting in profits generated during the fourth quarter holiday season becoming a larger portion of annual profits. Seasonality is also impacted by growth as more new stores are opened in the second half of the year. Seasonal fluctuations typically affect the Company’s inventory levels, with higher inventory carried in advance of peak selling periods, including the holiday season. In the fourth quarters of fiscal years 2003, 2004 and 2005, the Company generated approximately 59%, 51% and 53%, respectively, of its annual net income. Any decrease in sales or margins during this period could have a disproportionate effect on the Company’s financial condition and results of operations. In addition, major winter storms could negatively impact the Company’s sales.
Item 1B. UNRESOLVED STAFF COMMENTS
None.
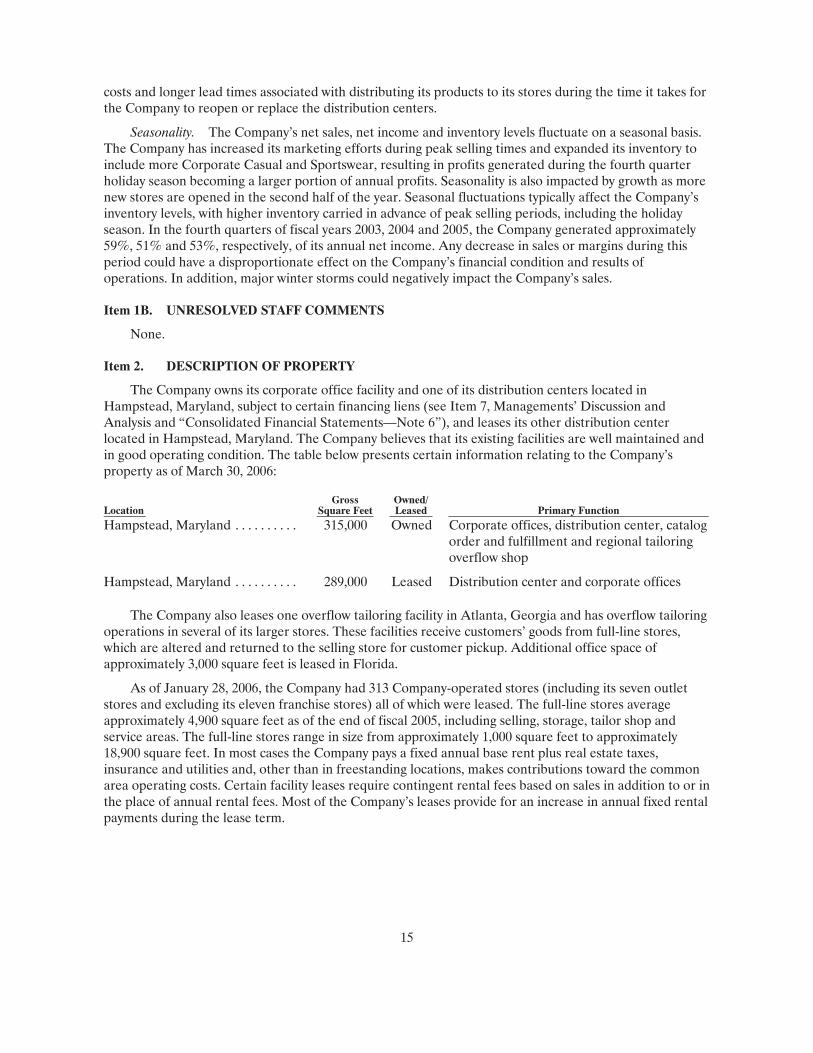
Item 2. DESCRIPTION OF PROPERTY
The Company owns its corporate office facility and one of its distribution centers located in Hampstead, Maryland, subject to certain financing liens (see Item 7, Managements’ Discussion and Analysis and “Consolidated Financial Statements—Note 6”), and leases its other distribution center located in Hampstead, Maryland. The Company believes that its existing facilities are well maintained and in good operating condition. The table below presents certain information relating to the Company’s property as of March 30, 2006:
Location Gross
Square Feet Owned/Leased Primary Function
Hampstead, Maryland . . . . . . . . . .
315,000
Owned
Corporate offices, distribution center, catalogorder and fulfillment and regional tailoring overflow shop
Hampstead, Maryland . . . . . . . . . . 289,000 Leased Distribution center and corporate offices
The Company also leases one overflow tailoring facility in Atlanta, Georgia and has overflow tailoring operations in several of its larger stores. These facilities receive customers’ goods from full-line stores, which are altered and returned to the selling store for customer pickup. Additional office space of approximately 3,000 square feet is leased in Florida.
As of January 28, 2006, the Company had 313 Company-operated stores (including its seven outlet stores and excluding its eleven franchise stores) all of which were leased. The full-line stores average approximately 4,900 square feet as of the end of fiscal 2005, including selling, storage, tailor shop and service areas. The full-line stores range in size from approximately 1,000 square feet to approximately 18,900 square feet. In most cases the Company pays a fixed annual base rent plus real estate taxes, insurance and utilities and, other than in freestanding locations, makes contributions toward the common area operating costs. Certain facility leases require contingent rental fees based on sales in addition to or in the place of annual rental fees. Most of the Company’s leases provide for an increase in annual fixed rental payments during the lease term.
16
Item 3. LEGAL PROCEEDINGS
The Company has been named as a defendant in legal actions arising from its normal business activities. Although the outcome of these lawsuits or other proceedings against the Company cannot be accurately predicted, the Company does not expect that any such liability will have a material adverse effect on the business, net assets or financial position of the Company.
In its Quarterly Reports on Form 10-Q for the second and third quarters of fiscal 2005, the Company reported that certain claims against the Company had been made arising from the allegedly improper storage of credit card data. The matter has since been resolved in favor of the Company and during the fourth quarter of fiscal 2005 the Company reversed the $285,000 previously accrued. The Company does not anticipate that further claims, if any, in this matter would have a material adverse effect on the business, net assets or financial position of the Company.
Item 4. SUBMISSION OF MATTERS TO A VOTE OF SECURITY HOLDERS
No matters were submitted to a vote of the Company’s security holders during the quarter ended January 28, 2006.
17
PART II
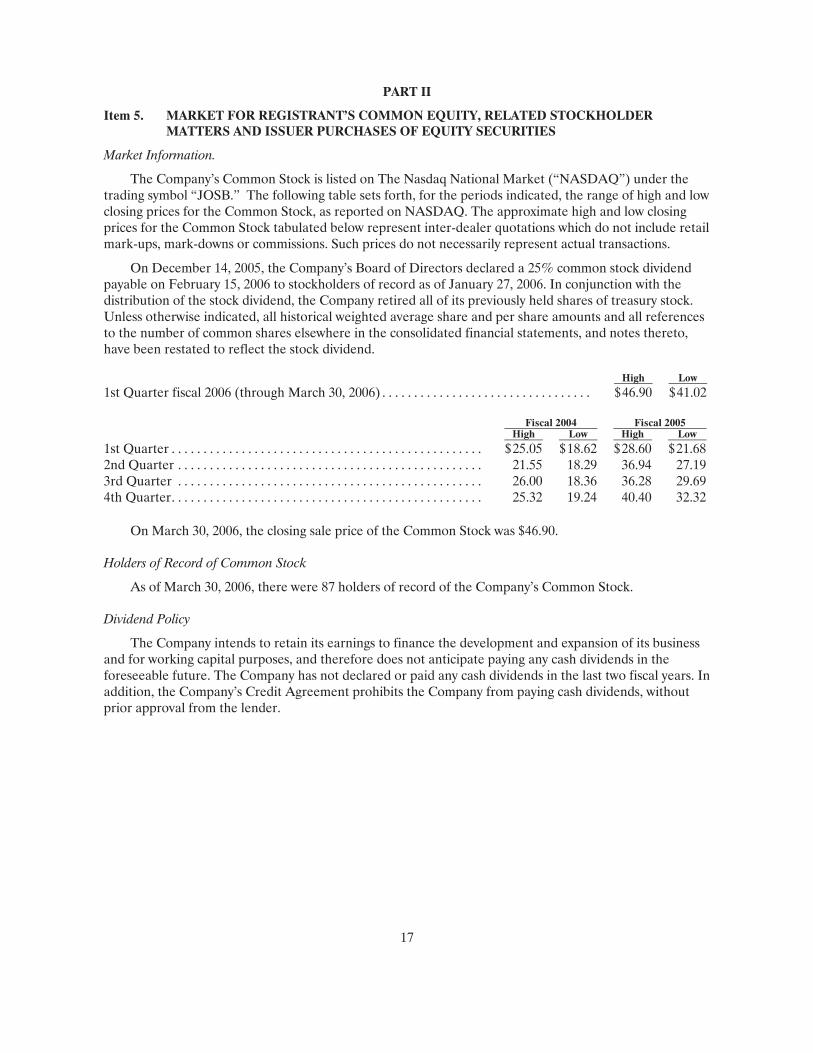
Item 5. MARKET FOR REGISTRANT’S COMMON EQUITY, RELATED STOCKHOLDER MATTERS AND ISSUER PURCHASES OF EQUITY SECURITIES
Market Information.
The Company’s Common Stock is listed on The Nasdaq National Market (“NASDAQ”) under the trading symbol “JOSB.” The following table sets forth, for the periods indicated, the range of high and low closing prices for the Common Stock, as reported on NASDAQ. The approximate high and low closing prices for the Common Stock tabulated below represent inter-dealer quotations which do not include retail mark-ups, mark-downs or commissions. Such prices do not necessarily represent actual transactions.
On December 14, 2005, the Company’s Board of Directors declared a 25% common stock dividend payable on February 15, 2006 to stockholders of record as of January 27, 2006. In conjunction with the distribution of the stock dividend, the Company retired all of its previously held shares of treasury stock. Unless otherwise indicated, all historical weighted average share and per share amounts and all references to the number of common shares elsewhere in the consolidated financial statements, and notes thereto, have been restated to reflect the stock dividend.
High Low 1st Quarter fiscal 2006 (through March 30, 2006) . . . . . . . . . . . . . . . . . . . . . . . . . . . . . . . . . $ 46.90 $ 41.02
Fiscal 2004 Fiscal 2005 High Low High Low
1st Quarter . . . . . . . . . . . . . . . . . . . . . . . . . . . . . . . . . . . . . . . . . . . . . . . . . $ 25.05 $ 18.62 $ 28.60 $ 21.682nd Quarter . . . . . . . . . . . . . . . . . . . . . . . . . . . . . . . . . . . . . . . . . . . . . . . . 21.55 18.29 36.94 27.193rd Quarter . . . . . . . . . . . . . . . . . . . . . . . . . . . . . . . . . . . . . . . . . . . . . . . . 26.00 18.36 36.28 29.694th Quarter. . . . . . . . . . . . . . . . . . . . . . . . . . . . . . . . . . . . . . . . . . . . . . . . . 25.32 19.24 40.40 32.32
On March 30, 2006, the closing sale price of the Common Stock was $46.90.
Holders of Record of Common Stock
As of March 30, 2006, there were 87 holders of record of the Company’s Common Stock.
Dividend Policy
The Company intends to retain its earnings to finance the development and expansion of its business and for working capital purposes, and therefore does not anticipate paying any cash dividends in the foreseeable future. The Company has not declared or paid any cash dividends in the last two fiscal years. In addition, the Company’s Credit Agreement prohibits the Company from paying cash dividends, without prior approval from the lender.
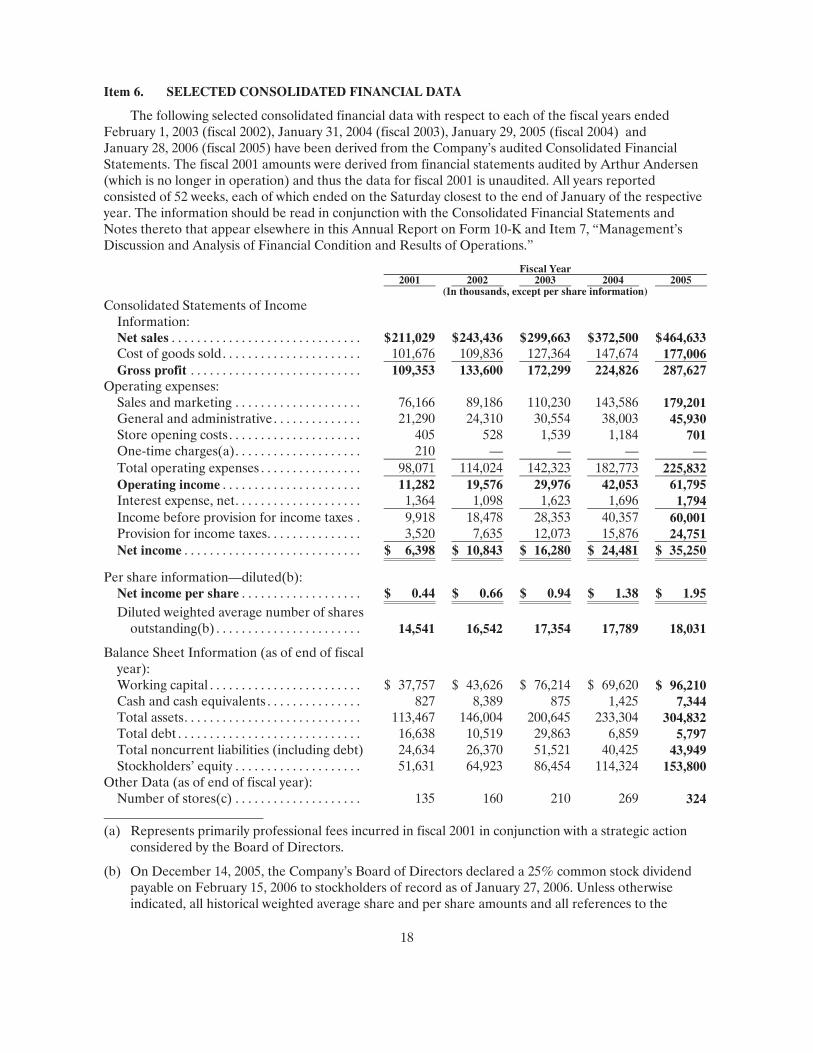
18
Item 6. SELECTED CONSOLIDATED FINANCIAL DATA
The following selected consolidated financial data with respect to each of the fiscal years ended February 1, 2003 (fiscal 2002), January 31, 2004 (fiscal 2003), January 29, 2005 (fiscal 2004) and January 28, 2006 (fiscal 2005) have been derived from the Company’s audited Consolidated Financial Statements. The fiscal 2001 amounts were derived from financial statements audited by Arthur Andersen (which is no longer in operation) and thus the data for fiscal 2001 is unaudited. All years reported consisted of 52 weeks, each of which ended on the Saturday closest to the end of January of the respective year. The information should be read in conjunction with the Consolidated Financial Statements and Notes thereto that appear elsewhere in this Annual Report on Form 10-K and Item 7, “Management’s Discussion and Analysis of Financial Condition and Results of Operations.”
Fiscal Year 2001 2002 2003 2004 2005 (In thousands, except per share information)
Consolidated Statements of Income Information: Net sales . . . . . . . . . . . . . . . . . . . . . . . . . . . . . . $ 211,029 $ 243,436 $ 299,663 $ 372,500 $ 464,633Cost of goods sold. . . . . . . . . . . . . . . . . . . . . . 101,676 109,836 127,364 147,674 177,006Gross profit . . . . . . . . . . . . . . . . . . . . . . . . . . . 109,353 133,600 172,299 224,826 287,627
Operating expenses: Sales and marketing . . . . . . . . . . . . . . . . . . . . 76,166 89,186 110,230 143,586 179,201General and administrative . . . . . . . . . . . . . . 21,290 24,310 30,554 38,003 45,930Store opening costs . . . . . . . . . . . . . . . . . . . . . 405 528 1,539 1,184 701One-time charges(a). . . . . . . . . . . . . . . . . . . . 210 — — — —Total operating expenses . . . . . . . . . . . . . . . . 98,071 114,024 142,323 182,773 225,832Operating income . . . . . . . . . . . . . . . . . . . . . . 11,282 19,576 29,976 42,053 61,795Interest expense, net. . . . . . . . . . . . . . . . . . . . 1,364 1,098 1,623 1,696 1,794Income before provision for income taxes . 9,918 18,478 28,353 40,357 60,001Provision for income taxes. . . . . . . . . . . . . . . 3,520 7,635 12,073 15,876 24,751Net income . . . . . . . . . . . . . . . . . . . . . . . . . . . . $ 6,398 $ 10,843 $ 16,280 $ 24,481 $ 35,250
Per share information—diluted(b): Net income per share . . . . . . . . . . . . . . . . . . . $ 0.44 $ 0.66 $ 0.94 $ 1.38 $ 1.95Diluted weighted average number of shares
outstanding(b) . . . . . . . . . . . . . . . . . . . . . . . 14,541 16,542 17,354 17,789 18,031
Balance Sheet Information (as of end of fiscal year): Working capital . . . . . . . . . . . . . . . . . . . . . . . . $ 37,757 $ 43,626 $ 76,214 $ 69,620 $ 96,210Cash and cash equivalents . . . . . . . . . . . . . . . 827 8,389 875 1,425 7,344Total assets. . . . . . . . . . . . . . . . . . . . . . . . . . . . 113,467 146,004 200,645 233,304 304,832Total debt . . . . . . . . . . . . . . . . . . . . . . . . . . . . . 16,638 10,519 29,863 6,859 5,797Total noncurrent liabilities (including debt) 24,634 26,370 51,521 40,425 43,949Stockholders’ equity . . . . . . . . . . . . . . . . . . . . 51,631 64,923 86,454 114,324 153,800
Other Data (as of end of fiscal year): Number of stores(c) . . . . . . . . . . . . . . . . . . . . 135 160 210 269 324
(a) Represents primarily professional fees incurred in fiscal 2001 in conjunction with a strategic action
considered by the Board of Directors.
(b) On December 14, 2005, the Company’s Board of Directors declared a 25% common stock dividend payable on February 15, 2006 to stockholders of record as of January 27, 2006. Unless otherwise indicated, all historical weighted average share and per share amounts and all references to the
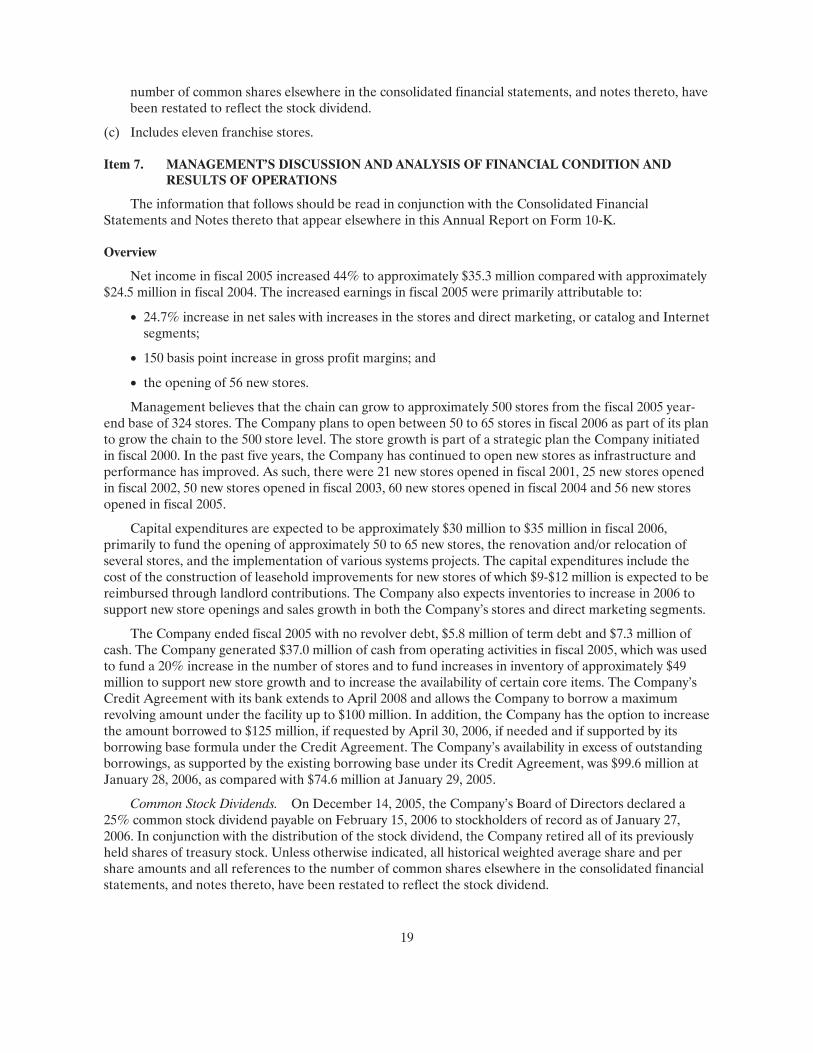
19
number of common shares elsewhere in the consolidated financial statements, and notes thereto, have been restated to reflect the stock dividend.
(c) Includes eleven franchise stores.
Item 7. MANAGEMENT’S DISCUSSION AND ANALYSIS OF FINANCIAL CONDITION AND RESULTS OF OPERATIONS
The information that follows should be read in conjunction with the Consolidated Financial Statements and Notes thereto that appear elsewhere in this Annual Report on Form 10-K.
Overview
Net income in fiscal 2005 increased 44% to approximately $35.3 million compared with approximately $24.5 million in fiscal 2004. The increased earnings in fiscal 2005 were primarily attributable to:
• 24.7% increase in net sales with increases in the stores and direct marketing, or catalog and Internet segments;
• 150 basis point increase in gross profit margins; and
• the opening of 56 new stores.
Management believes that the chain can grow to approximately 500 stores from the fiscal 2005 year-end base of 324 stores. The Company plans to open between 50 to 65 stores in fiscal 2006 as part of its plan to grow the chain to the 500 store level. The store growth is part of a strategic plan the Company initiated in fiscal 2000. In the past five years, the Company has continued to open new stores as infrastructure and performance has improved. As such, there were 21 new stores opened in fiscal 2001, 25 new stores opened in fiscal 2002, 50 new stores opened in fiscal 2003, 60 new stores opened in fiscal 2004 and 56 new stores opened in fiscal 2005.
Capital expenditures are expected to be approximately $30 million to $35 million in fiscal 2006, primarily to fund the opening of approximately 50 to 65 new stores, the renovation and/or relocation of several stores, and the implementation of various systems projects. The capital expenditures include the cost of the construction of leasehold improvements for new stores of which $9-$12 million is expected to be reimbursed through landlord contributions. The Company also expects inventories to increase in 2006 to support new store openings and sales growth in both the Company’s stores and direct marketing segments.
The Company ended fiscal 2005 with no revolver debt, $5.8 million of term debt and $7.3 million of cash. The Company generated $37.0 million of cash from operating activities in fiscal 2005, which was used to fund a 20% increase in the number of stores and to fund increases in inventory of approximately $49 million to support new store growth and to increase the availability of certain core items. The Company’s Credit Agreement with its bank extends to April 2008 and allows the Company to borrow a maximum revolving amount under the facility up to $100 million. In addition, the Company has the option to increase the amount borrowed to $125 million, if requested by April 30, 2006, if needed and if supported by its borrowing base formula under the Credit Agreement. The Company’s availability in excess of outstanding borrowings, as supported by the existing borrowing base under its Credit Agreement, was $99.6 million at January 28, 2006, as compared with $74.6 million at January 29, 2005.
Common Stock Dividends. On December 14, 2005, the Company’s Board of Directors declared a 25% common stock dividend payable on February 15, 2006 to stockholders of record as of January 27, 2006. In conjunction with the distribution of the stock dividend, the Company retired all of its previously held shares of treasury stock. Unless otherwise indicated, all historical weighted average share and per share amounts and all references to the number of common shares elsewhere in the consolidated financial statements, and notes thereto, have been restated to reflect the stock dividend.
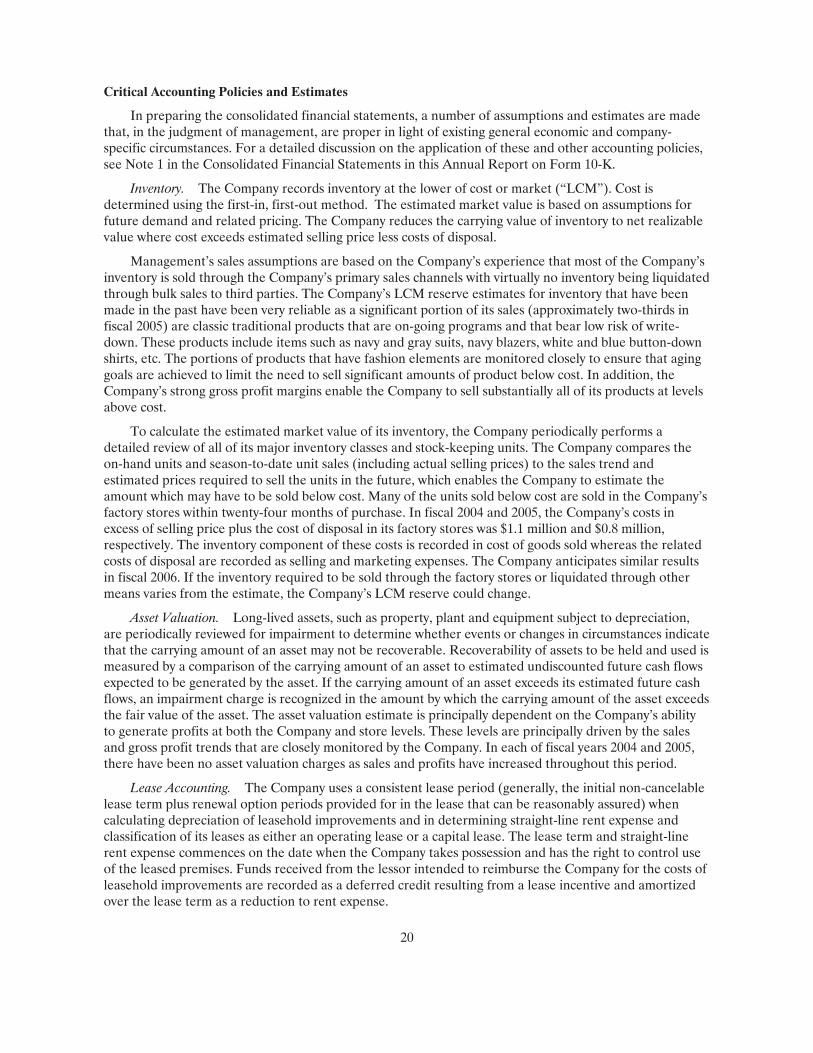
20
Critical Accounting Policies and Estimates
In preparing the consolidated financial statements, a number of assumptions and estimates are made that, in the judgment of management, are proper in light of existing general economic and company-specific circumstances. For a detailed discussion on the application of these and other accounting policies, see Note 1 in the Consolidated Financial Statements in this Annual Report on Form 10-K.
Inventory. The Company records inventory at the lower of cost or market (“LCM”). Cost is determined using the first-in, first-out method. The estimated market value is based on assumptions for future demand and related pricing. The Company reduces the carrying value of inventory to net realizable value where cost exceeds estimated selling price less costs of disposal.
Management’s sales assumptions are based on the Company’s experience that most of the Company’s inventory is sold through the Company’s primary sales channels with virtually no inventory being liquidated through bulk sales to third parties. The Company’s LCM reserve estimates for inventory that have been made in the past have been very reliable as a significant portion of its sales (approximately two-thirds in fiscal 2005) are classic traditional products that are on-going programs and that bear low risk of write-down. These products include items such as navy and gray suits, navy blazers, white and blue button-down shirts, etc. The portions of products that have fashion elements are monitored closely to ensure that aging goals are achieved to limit the need to sell significant amounts of product below cost. In addition, the Company’s strong gross profit margins enable the Company to sell substantially all of its products at levels above cost.
To calculate the estimated market value of its inventory, the Company periodically performs a detailed review of all of its major inventory classes and stock-keeping units. The Company compares the on-hand units and season-to-date unit sales (including actual selling prices) to the sales trend and estimated prices required to sell the units in the future, which enables the Company to estimate the amount which may have to be sold below cost. Many of the units sold below cost are sold in the Company’s factory stores within twenty-four months of purchase. In fiscal 2004 and 2005, the Company’s costs in excess of selling price plus the cost of disposal in its factory stores was $1.1 million and $0.8 million, respectively. The inventory component of these costs is recorded in cost of goods sold whereas the related costs of disposal are recorded as selling and marketing expenses. The Company anticipates similar results in fiscal 2006. If the inventory required to be sold through the factory stores or liquidated through other means varies from the estimate, the Company’s LCM reserve could change.
Asset Valuation. Long-lived assets, such as property, plant and equipment subject to depreciation, are periodically reviewed for impairment to determine whether events or changes in circumstances indicate that the carrying amount of an asset may not be recoverable. Recoverability of assets to be held and used is measured by a comparison of the carrying amount of an asset to estimated undiscounted future cash flows expected to be generated by the asset. If the carrying amount of an asset exceeds its estimated future cash flows, an impairment charge is recognized in the amount by which the carrying amount of the asset exceeds the fair value of the asset. The asset valuation estimate is principally dependent on the Company’s ability to generate profits at both the Company and store levels. These levels are principally driven by the sales and gross profit trends that are closely monitored by the Company. In each of fiscal years 2004 and 2005, there have been no asset valuation charges as sales and profits have increased throughout this period.
Lease Accounting. The Company uses a consistent lease period (generally, the initial non-cancelable lease term plus renewal option periods provided for in the lease that can be reasonably assured) when calculating depreciation of leasehold improvements and in determining straight-line rent expense and classification of its leases as either an operating lease or a capital lease. The lease term and straight-line rent expense commences on the date when the Company takes possession and has the right to control use of the leased premises. Funds received from the lessor intended to reimburse the Company for the costs of leasehold improvements are recorded as a deferred credit resulting from a lease incentive and amortized over the lease term as a reduction to rent expense.
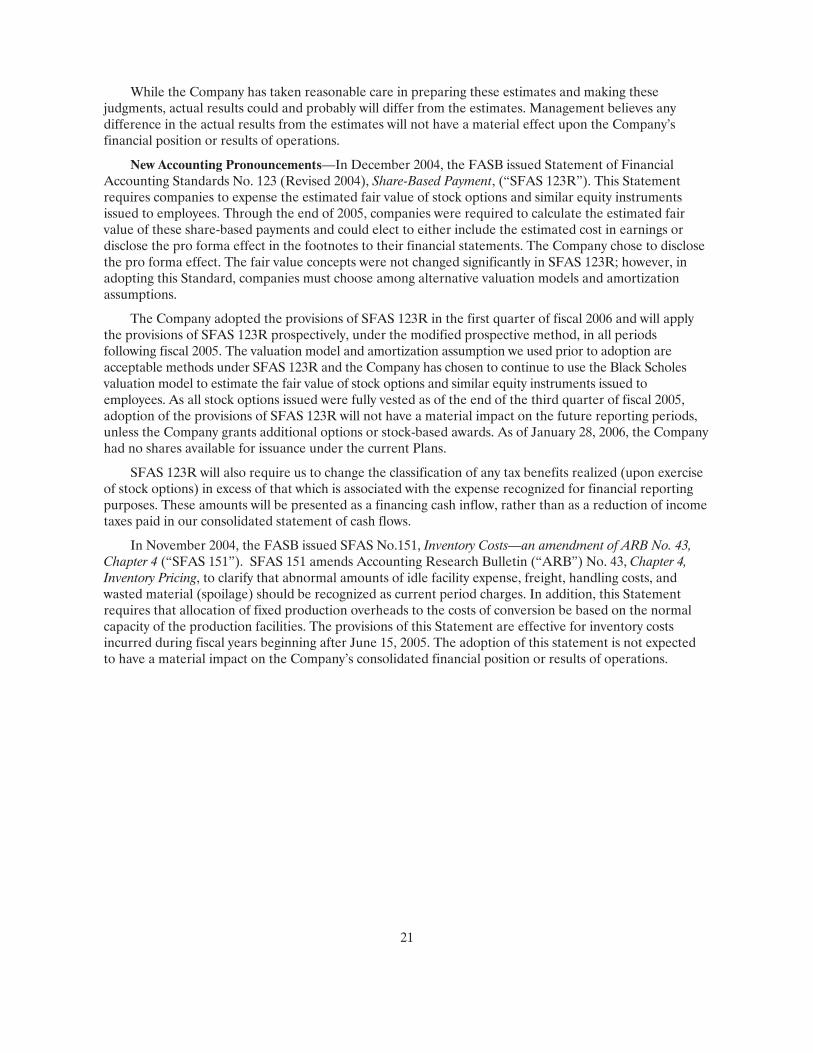
21
While the Company has taken reasonable care in preparing these estimates and making these judgments, actual results could and probably will differ from the estimates. Management believes any difference in the actual results from the estimates will not have a material effect upon the Company’s financial position or results of operations.
New Accounting Pronouncements—In December 2004, the FASB issued Statement of Financial Accounting Standards No. 123 (Revised 2004), Share-Based Payment, (“SFAS 123R”). This Statement requires companies to expense the estimated fair value of stock options and similar equity instruments issued to employees. Through the end of 2005, companies were required to calculate the estimated fair value of these share-based payments and could elect to either include the estimated cost in earnings or disclose the pro forma effect in the footnotes to their financial statements. The Company chose to disclose the pro forma effect. The fair value concepts were not changed significantly in SFAS 123R; however, in adopting this Standard, companies must choose among alternative valuation models and amortization assumptions.
The Company adopted the provisions of SFAS 123R in the first quarter of fiscal 2006 and will apply the provisions of SFAS 123R prospectively, under the modified prospective method, in all periods following fiscal 2005. The valuation model and amortization assumption we used prior to adoption are acceptable methods under SFAS 123R and the Company has chosen to continue to use the Black Scholes valuation model to estimate the fair value of stock options and similar equity instruments issued to employees. As all stock options issued were fully vested as of the end of the third quarter of fiscal 2005, adoption of the provisions of SFAS 123R will not have a material impact on the future reporting periods, unless the Company grants additional options or stock-based awards. As of January 28, 2006, the Company had no shares available for issuance under the current Plans.
SFAS 123R will also require us to change the classification of any tax benefits realized (upon exercise of stock options) in excess of that which is associated with the expense recognized for financial reporting purposes. These amounts will be presented as a financing cash inflow, rather than as a reduction of income taxes paid in our consolidated statement of cash flows.
In November 2004, the FASB issued SFAS No.151, Inventory Costs—an amendment of ARB No. 43, Chapter 4 (“SFAS 151”). SFAS 151 amends Accounting Research Bulletin (“ARB”) No. 43, Chapter 4, Inventory Pricing, to clarify that abnormal amounts of idle facility expense, freight, handling costs, and wasted material (spoilage) should be recognized as current period charges. In addition, this Statement requires that allocation of fixed production overheads to the costs of conversion be based on the normal capacity of the production facilities. The provisions of this Statement are effective for inventory costs incurred during fiscal years beginning after June 15, 2005. The adoption of this statement is not expected to have a material impact on the Company’s consolidated financial position or results of operations.
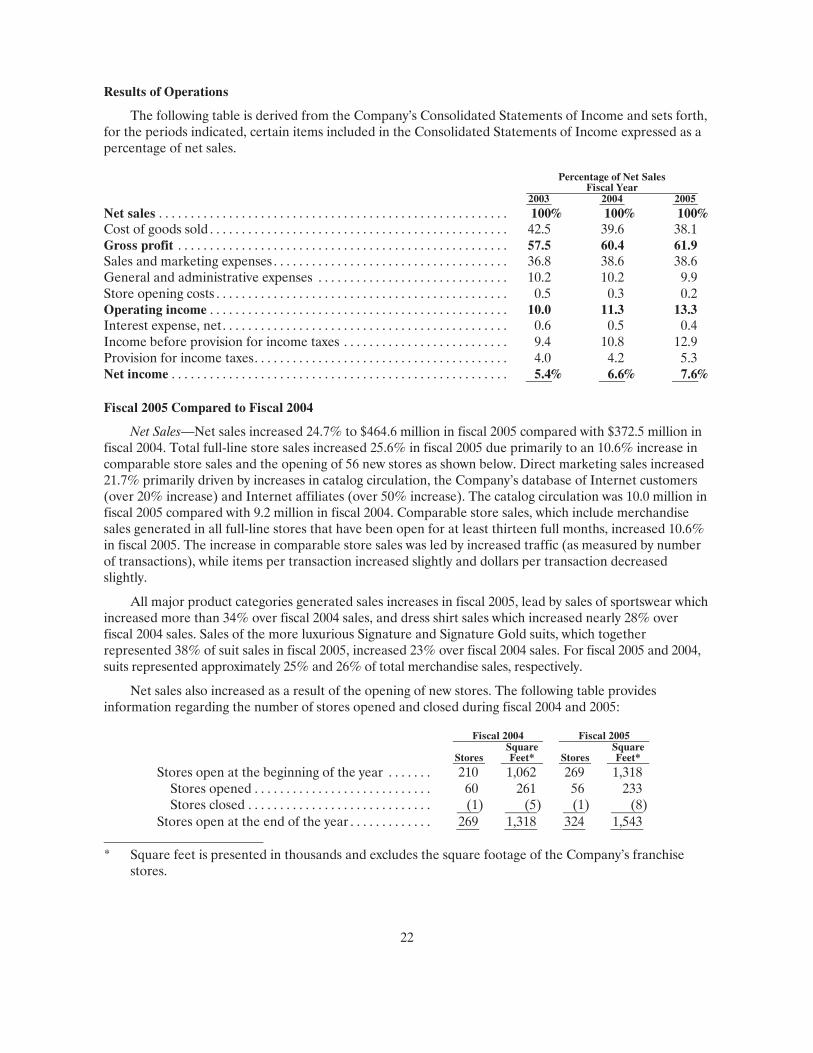
22
Results of Operations
The following table is derived from the Company’s Consolidated Statements of Income and sets forth, for the periods indicated, certain items included in the Consolidated Statements of Income expressed as a percentage of net sales.
Percentage of Net Sales
Fiscal Year 2003 2004 2005
Net sales . . . . . . . . . . . . . . . . . . . . . . . . . . . . . . . . . . . . . . . . . . . . . . . . . . . . . . . 100% 100 % 100%Cost of goods sold . . . . . . . . . . . . . . . . . . . . . . . . . . . . . . . . . . . . . . . . . . . . . . . 42.5 39.6 38.1 Gross profit . . . . . . . . . . . . . . . . . . . . . . . . . . . . . . . . . . . . . . . . . . . . . . . . . . . . 57.5 60.4 61.9 Sales and marketing expenses . . . . . . . . . . . . . . . . . . . . . . . . . . . . . . . . . . . . . 36.8 38.6 38.6 General and administrative expenses . . . . . . . . . . . . . . . . . . . . . . . . . . . . . . 10.2 10.2 9.9 Store opening costs . . . . . . . . . . . . . . . . . . . . . . . . . . . . . . . . . . . . . . . . . . . . . . 0.5 0.3 0.2 Operating income . . . . . . . . . . . . . . . . . . . . . . . . . . . . . . . . . . . . . . . . . . . . . . . 10.0 11.3 13.3 Interest expense, net. . . . . . . . . . . . . . . . . . . . . . . . . . . . . . . . . . . . . . . . . . . . . 0.6 0.5 0.4 Income before provision for income taxes . . . . . . . . . . . . . . . . . . . . . . . . . . 9.4 10.8 12.9 Provision for income taxes. . . . . . . . . . . . . . . . . . . . . . . . . . . . . . . . . . . . . . . . 4.0 4.2 5.3 Net income . . . . . . . . . . . . . . . . . . . . . . . . . . . . . . . . . . . . . . . . . . . . . . . . . . . . . 5.4% 6.6 % 7.6%
Fiscal 2005 Compared to Fiscal 2004
Net Sales—Net sales increased 24.7% to $464.6 million in fiscal 2005 compared with $372.5 million in fiscal 2004. Total full-line store sales increased 25.6% in fiscal 2005 due primarily to an 10.6% increase in comparable store sales and the opening of 56 new stores as shown below. Direct marketing sales increased 21.7% primarily driven by increases in catalog circulation, the Company’s database of Internet customers (over 20% increase) and Internet affiliates (over 50% increase). The catalog circulation was 10.0 million in fiscal 2005 compared with 9.2 million in fiscal 2004. Comparable store sales, which include merchandise sales generated in all full-line stores that have been open for at least thirteen full months, increased 10.6% in fiscal 2005. The increase in comparable store sales was led by increased traffic (as measured by number of transactions), while items per transaction increased slightly and dollars per transaction decreased slightly.
All major product categories generated sales increases in fiscal 2005, lead by sales of sportswear which increased more than 34% over fiscal 2004 sales, and dress shirt sales which increased nearly 28% over fiscal 2004 sales. Sales of the more luxurious Signature and Signature Gold suits, which together represented 38% of suit sales in fiscal 2005, increased 23% over fiscal 2004 sales. For fiscal 2005 and 2004, suits represented approximately 25% and 26% of total merchandise sales, respectively.
Net sales also increased as a result of the opening of new stores. The following table provides information regarding the number of stores opened and closed during fiscal 2004 and 2005:
Fiscal 2004 Fiscal 2005
Stores SquareFeet* Stores
Square Feet*
Stores open at the beginning of the year . . . . . . . 210 1,062 269 1,318 Stores opened . . . . . . . . . . . . . . . . . . . . . . . . . . . . 60 261 56 233 Stores closed . . . . . . . . . . . . . . . . . . . . . . . . . . . . . (1) (5) (1 ) (8 )
Stores open at the end of the year . . . . . . . . . . . . . 269 1,318 324 1,543
* Square feet is presented in thousands and excludes the square footage of the Company’s franchise
stores.
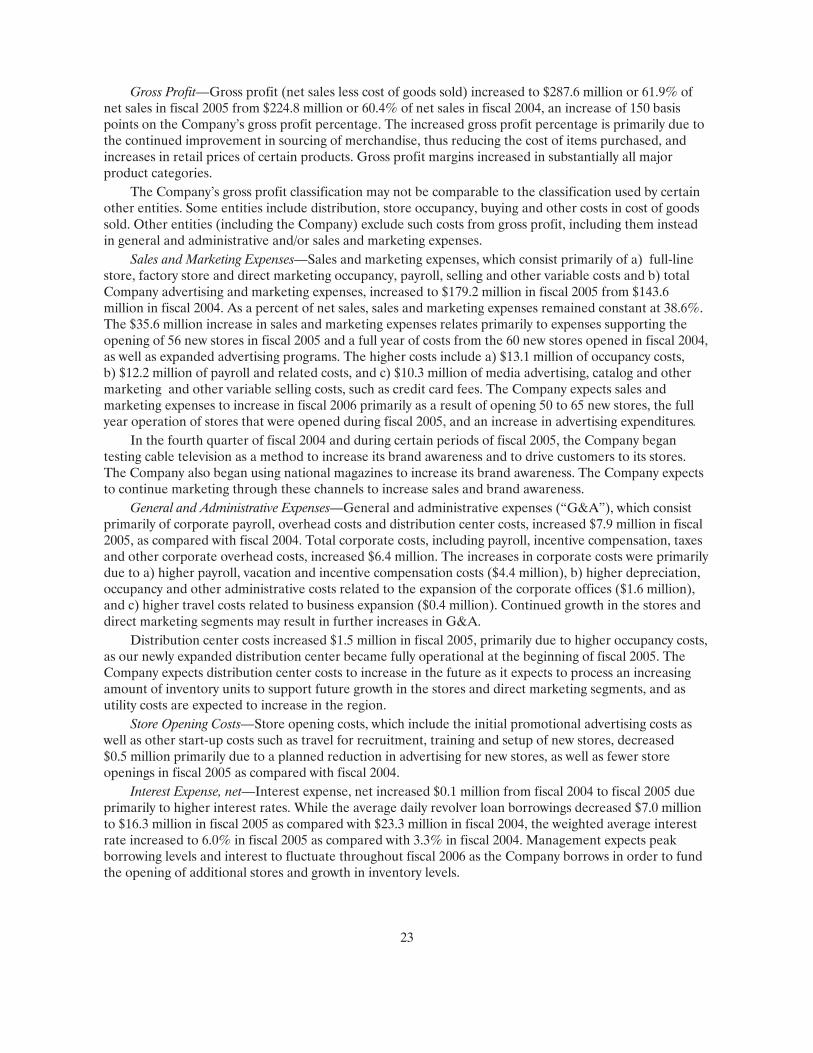
23
Gross Profit—Gross profit (net sales less cost of goods sold) increased to $287.6 million or 61.9% of net sales in fiscal 2005 from $224.8 million or 60.4% of net sales in fiscal 2004, an increase of 150 basis points on the Company’s gross profit percentage. The increased gross profit percentage is primarily due to the continued improvement in sourcing of merchandise, thus reducing the cost of items purchased, and increases in retail prices of certain products. Gross profit margins increased in substantially all major product categories.
The Company’s gross profit classification may not be comparable to the classification used by certain other entities. Some entities include distribution, store occupancy, buying and other costs in cost of goods sold. Other entities (including the Company) exclude such costs from gross profit, including them instead in general and administrative and/or sales and marketing expenses.
Sales and Marketing Expenses—Sales and marketing expenses, which consist primarily of a) full-line store, factory store and direct marketing occupancy, payroll, selling and other variable costs and b) total Company advertising and marketing expenses, increased to $179.2 million in fiscal 2005 from $143.6 million in fiscal 2004. As a percent of net sales, sales and marketing expenses remained constant at 38.6%. The $35.6 million increase in sales and marketing expenses relates primarily to expenses supporting the opening of 56 new stores in fiscal 2005 and a full year of costs from the 60 new stores opened in fiscal 2004, as well as expanded advertising programs. The higher costs include a) $13.1 million of occupancy costs, b) $12.2 million of payroll and related costs, and c) $10.3 million of media advertising, catalog and other marketing and other variable selling costs, such as credit card fees. The Company expects sales and marketing expenses to increase in fiscal 2006 primarily as a result of opening 50 to 65 new stores, the full year operation of stores that were opened during fiscal 2005, and an increase in advertising expenditures.
In the fourth quarter of fiscal 2004 and during certain periods of fiscal 2005, the Company began testing cable television as a method to increase its brand awareness and to drive customers to its stores. The Company also began using national magazines to increase its brand awareness. The Company expects to continue marketing through these channels to increase sales and brand awareness.
General and Administrative Expenses—General and administrative expenses (“G&A”), which consist primarily of corporate payroll, overhead costs and distribution center costs, increased $7.9 million in fiscal 2005, as compared with fiscal 2004. Total corporate costs, including payroll, incentive compensation, taxes and other corporate overhead costs, increased $6.4 million. The increases in corporate costs were primarily due to a) higher payroll, vacation and incentive compensation costs ($4.4 million), b) higher depreciation, occupancy and other administrative costs related to the expansion of the corporate offices ($1.6 million), and c) higher travel costs related to business expansion ($0.4 million). Continued growth in the stores and direct marketing segments may result in further increases in G&A.
Distribution center costs increased $1.5 million in fiscal 2005, primarily due to higher occupancy costs, as our newly expanded distribution center became fully operational at the beginning of fiscal 2005. The Company expects distribution center costs to increase in the future as it expects to process an increasing amount of inventory units to support future growth in the stores and direct marketing segments, and as utility costs are expected to increase in the region.
Store Opening Costs—Store opening costs, which include the initial promotional advertising costs as well as other start-up costs such as travel for recruitment, training and setup of new stores, decreased $0.5 million primarily due to a planned reduction in advertising for new stores, as well as fewer store openings in fiscal 2005 as compared with fiscal 2004.
Interest Expense, net—Interest expense, net increased $0.1 million from fiscal 2004 to fiscal 2005 due primarily to higher interest rates. While the average daily revolver loan borrowings decreased $7.0 million to $16.3 million in fiscal 2005 as compared with $23.3 million in fiscal 2004, the weighted average interest rate increased to 6.0% in fiscal 2005 as compared with 3.3% in fiscal 2004. Management expects peak borrowing levels and interest to fluctuate throughout fiscal 2006 as the Company borrows in order to fund the opening of additional stores and growth in inventory levels.
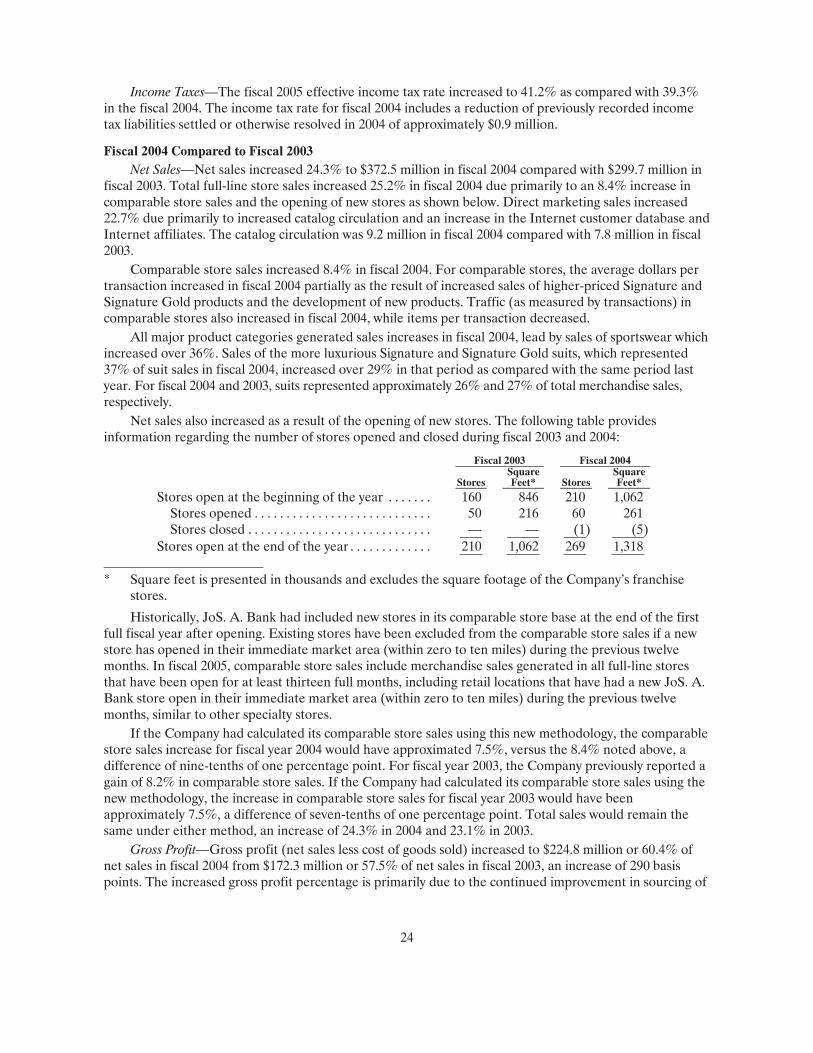
24
Income Taxes—The fiscal 2005 effective income tax rate increased to 41.2% as compared with 39.3% in the fiscal 2004. The income tax rate for fiscal 2004 includes a reduction of previously recorded income tax liabilities settled or otherwise resolved in 2004 of approximately $0.9 million.
Fiscal 2004 Compared to Fiscal 2003 Net Sales—Net sales increased 24.3% to $372.5 million in fiscal 2004 compared with $299.7 million in
fiscal 2003. Total full-line store sales increased 25.2% in fiscal 2004 due primarily to an 8.4% increase in comparable store sales and the opening of new stores as shown below. Direct marketing sales increased 22.7% due primarily to increased catalog circulation and an increase in the Internet customer database and Internet affiliates. The catalog circulation was 9.2 million in fiscal 2004 compared with 7.8 million in fiscal 2003.
Comparable store sales increased 8.4% in fiscal 2004. For comparable stores, the average dollars per transaction increased in fiscal 2004 partially as the result of increased sales of higher-priced Signature and Signature Gold products and the development of new products. Traffic (as measured by transactions) in comparable stores also increased in fiscal 2004, while items per transaction decreased.
All major product categories generated sales increases in fiscal 2004, lead by sales of sportswear which increased over 36%. Sales of the more luxurious Signature and Signature Gold suits, which represented 37% of suit sales in fiscal 2004, increased over 29% in that period as compared with the same period last year. For fiscal 2004 and 2003, suits represented approximately 26% and 27% of total merchandise sales, respectively.
Net sales also increased as a result of the opening of new stores. The following table provides information regarding the number of stores opened and closed during fiscal 2003 and 2004:
Fiscal 2003 Fiscal 2004
Stores SquareFeet* Stores
Square Feet*
Stores open at the beginning of the year . . . . . . . 160 846 210 1,062 Stores opened . . . . . . . . . . . . . . . . . . . . . . . . . . . . 50 216 60 261 Stores closed . . . . . . . . . . . . . . . . . . . . . . . . . . . . . — — (1 ) (5 )
Stores open at the end of the year . . . . . . . . . . . . . 210 1,062 269 1,318
* Square feet is presented in thousands and excludes the square footage of the Company’s franchise stores.
Historically, JoS. A. Bank had included new stores in its comparable store base at the end of the first full fiscal year after opening. Existing stores have been excluded from the comparable store sales if a new store has opened in their immediate market area (within zero to ten miles) during the previous twelve months. In fiscal 2005, comparable store sales include merchandise sales generated in all full-line stores that have been open for at least thirteen full months, including retail locations that have had a new JoS. A. Bank store open in their immediate market area (within zero to ten miles) during the previous twelve months, similar to other specialty stores.
If the Company had calculated its comparable store sales using this new methodology, the comparable store sales increase for fiscal year 2004 would have approximated 7.5%, versus the 8.4% noted above, a difference of nine-tenths of one percentage point. For fiscal year 2003, the Company previously reported a gain of 8.2% in comparable store sales. If the Company had calculated its comparable store sales using the new methodology, the increase in comparable store sales for fiscal year 2003 would have been approximately 7.5%, a difference of seven-tenths of one percentage point. Total sales would remain the same under either method, an increase of 24.3% in 2004 and 23.1% in 2003.
Gross Profit—Gross profit (net sales less cost of goods sold) increased to $224.8 million or 60.4% of net sales in fiscal 2004 from $172.3 million or 57.5% of net sales in fiscal 2003, an increase of 290 basis points. The increased gross profit percentage is primarily due to the continued improvement in sourcing of
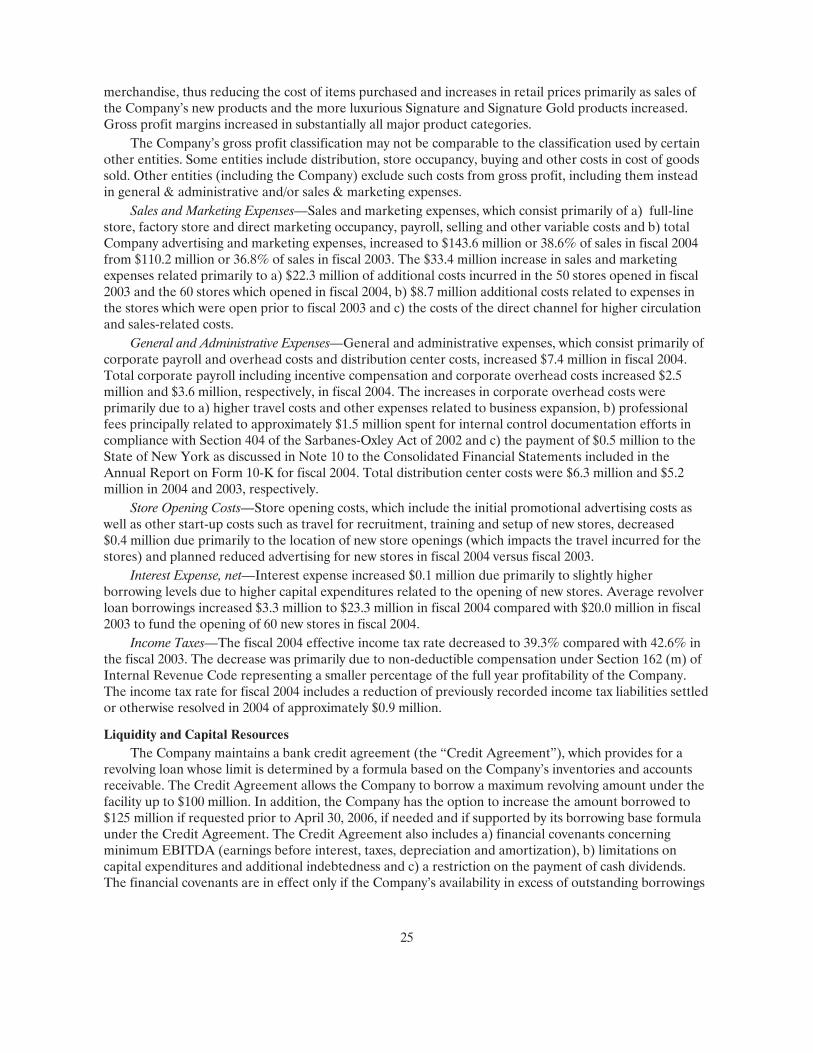
25
merchandise, thus reducing the cost of items purchased and increases in retail prices primarily as sales of the Company’s new products and the more luxurious Signature and Signature Gold products increased. Gross profit margins increased in substantially all major product categories.
The Company’s gross profit classification may not be comparable to the classification used by certain other entities. Some entities include distribution, store occupancy, buying and other costs in cost of goods sold. Other entities (including the Company) exclude such costs from gross profit, including them instead in general & administrative and/or sales & marketing expenses.
Sales and Marketing Expenses—Sales and marketing expenses, which consist primarily of a) full-line store, factory store and direct marketing occupancy, payroll, selling and other variable costs and b) total Company advertising and marketing expenses, increased to $143.6 million or 38.6% of sales in fiscal 2004 from $110.2 million or 36.8% of sales in fiscal 2003. The $33.4 million increase in sales and marketing expenses related primarily to a) $22.3 million of additional costs incurred in the 50 stores opened in fiscal 2003 and the 60 stores which opened in fiscal 2004, b) $8.7 million additional costs related to expenses in the stores which were open prior to fiscal 2003 and c) the costs of the direct channel for higher circulation and sales-related costs.
General and Administrative Expenses—General and administrative expenses, which consist primarily of corporate payroll and overhead costs and distribution center costs, increased $7.4 million in fiscal 2004. Total corporate payroll including incentive compensation and corporate overhead costs increased $2.5 million and $3.6 million, respectively, in fiscal 2004. The increases in corporate overhead costs were primarily due to a) higher travel costs and other expenses related to business expansion, b) professional fees principally related to approximately $1.5 million spent for internal control documentation efforts in compliance with Section 404 of the Sarbanes-Oxley Act of 2002 and c) the payment of $0.5 million to the State of New York as discussed in Note 10 to the Consolidated Financial Statements included in the Annual Report on Form 10-K for fiscal 2004. Total distribution center costs were $6.3 million and $5.2 million in 2004 and 2003, respectively.
Store Opening Costs—Store opening costs, which include the initial promotional advertising costs as well as other start-up costs such as travel for recruitment, training and setup of new stores, decreased $0.4 million due primarily to the location of new store openings (which impacts the travel incurred for the stores) and planned reduced advertising for new stores in fiscal 2004 versus fiscal 2003.
Interest Expense, net—Interest expense increased $0.1 million due primarily to slightly higher borrowing levels due to higher capital expenditures related to the opening of new stores. Average revolver loan borrowings increased $3.3 million to $23.3 million in fiscal 2004 compared with $20.0 million in fiscal 2003 to fund the opening of 60 new stores in fiscal 2004.
Income Taxes—The fiscal 2004 effective income tax rate decreased to 39.3% compared with 42.6% in the fiscal 2003. The decrease was primarily due to non-deductible compensation under Section 162 (m) of Internal Revenue Code representing a smaller percentage of the full year profitability of the Company. The income tax rate for fiscal 2004 includes a reduction of previously recorded income tax liabilities settled or otherwise resolved in 2004 of approximately $0.9 million.
Liquidity and Capital Resources The Company maintains a bank credit agreement (the “Credit Agreement”), which provides for a
revolving loan whose limit is determined by a formula based on the Company’s inventories and accounts receivable. The Credit Agreement allows the Company to borrow a maximum revolving amount under the facility up to $100 million. In addition, the Company has the option to increase the amount borrowed to $125 million if requested prior to April 30, 2006, if needed and if supported by its borrowing base formula under the Credit Agreement. The Credit Agreement also includes a) financial covenants concerning minimum EBITDA (earnings before interest, taxes, depreciation and amortization), b) limitations on capital expenditures and additional indebtedness and c) a restriction on the payment of cash dividends. The financial covenants are in effect only if the Company’s availability in excess of outstanding borrowings
26
is less than $7.5 million. The Company’s availability in excess of borrowings did not drop below $7.5 million during fiscal 2005 and the Company does not anticipate that it will be less than $7.5 million at any point during fiscal 2006. As of January 28, 2006, the Company was in compliance with all loan covenants. Interest rates under the Credit Agreement are either at the prime rate or at LIBOR plus an amount that is determined based on the Company’s availability in excess of borrowings (which amount was 1.25% during fiscal 2005). Additionally, the Company has $5.8 million of term debt to be repaid as noted in the contractual obligations table below.
The Company’s availability in excess of outstanding borrowings, as supported by the existing borrowing base under its Credit Agreement, was $99.6 million at January 28, 2006, as compared with $74.6 million at January 29, 2005.
The following table summarizes the Company’s sources and uses of funds as reflected in the Consolidated Statements of Cash Flows (in thousands):
Fiscal 2003 Fiscal 2004 Fiscal 2005 Cash provided by (used in): Operating activities . . . . . . . . . . . . . . . . . . . . . . $ (7,336) $ 51,453 $ 37,026 Investing activities . . . . . . . . . . . . . . . . . . . . . . . (23,245) (29,032) (31,577 ) Financing activities. . . . . . . . . . . . . . . . . . . . . . . 23,067 (21,871) 470 Net increase (decrease) in cash and cash
equivalents. . . . . . . . . . . . . . . . . . . . . . . . . . . . $ (7,514) $ 550 $ 5,919
Cash provided by the Company’s operating activities in fiscal 2005 was generated primarily by increased net income and was used to support a $49 million increase in inventory to support new store growth and to increase availability of certain core items. Cash used in investing activities in fiscal 2005 relates primarily to capital expenditures for new stores, distribution center and systems projects. Cash provided by financing activities relates primarily to $1.6 million of proceeds from the issuance of common stock in connection with stock option exercises, offset by $1.1 million of repayments of long term debt.
Cash provided by the Company’s operating activities in fiscal 2004 increased compared with fiscal 2003 primarily due to lower expenditures for inventory compared with the same period of fiscal 2003 and increased net income. The net increase in inventory was $6.9 million in fiscal 2004 compared with $42.5 million for fiscal 2003. Cash used in investing activities in fiscal 2004 relates primarily to capital expenditures for new stores and renovations of existing stores, distribution center and systems projects and was partially offset by the proceeds from the disposal of certain equipment. Cash used by financing activities relates primarily to $23 million of net payments under the Company’s revolving loan under the Credit Agreement, offset by $1.1 million from the proceeds of the exercise of stock options.
Cash used by the Company’s operating activities in fiscal 2003 was primarily the result of higher inventory levels offset, in part, by higher net income before depreciation and amortization. Finished goods inventories increased by $39.8 million primarily to support new store expansion. Raw material inventories (wool) increased $2.7 million as a result of the Company’s continuing effort to contract directly with clothing manufacturers and cut out the middleman. Cash used in investing activities in fiscal 2003 relates to capital expenditures in 50 new stores, renovating four major stores, and the expanding of the distribution center. In fiscal 2003, $23.1 million of cash was provided by financing activities primarily to support the increase in inventories necessitated by the Company’s expansion and to build the basic inventory levels. The source of these funds was $20.5 million from the Company’s revolving loan under the Credit Agreement and $3.7 million from the proceeds of the exercise of stock options. Also, the Company used $1.1 million for the repayment of long-term debt.
For fiscal 2006, the Company expects to spend approximately $30 million to $35 million on capital expenditures, primarily to fund the opening of approximately 50 to 65 new stores, the renovation and/or relocation of several stores and the implementation of various systems initiatives. Management believes

27
that the Company’s cash flow from operating activities and availability under its Credit Agreement will be sufficient to fund its planned capital expenditures and operating expenses for fiscal 2006. The capital expenditures include the cost of the construction of leasehold improvements for new stores of which $9-$12 million is expected to be reimbursed through landlord contributions. These amounts are typically paid by the landlords after the completion of construction by the Company and the receipt of appropriate lien waivers from contractors. For the stores opened and renovated in 2005, the Company negotiated approximately $10.2 million of landlord contributions, of which $4.0 million were collected by year-end. The balance is expected to be received in fiscal 2006. Also, in fiscal 2005, the Company collected approximately $7.4 million of landlord contributions related to fiscal 2004 store openings, which was recorded within the operating activities section of the Consolidated Statement of Cash Flows.
Off-Balance Sheet Arrangements—The Company has no off-balance sheet arrangements other than its operating lease agreements and letters of credit outstanding under its Credit Agreement as discussed below.
Disclosures about Contractual Obligations and Commercial Commitments
The Company’s principal commitments are non-cancelable operating leases in connection with its retail stores, certain tailoring spaces and equipment. Under the terms of certain of these leases, the Company is required to pay a base annual rent plus a contingent amount based on sales. In addition, many of these leases include scheduled rent increases.
The following table reflects a summary of the Company’s contractual cash obligations and other commercial commitments as of January 28, 2006:
Payments Due by Fiscal Year (in thousands) 2006 2007-2009 2010-2011 Beyond 2011 Total
Long-term debt . . . . . . . . . . . . . . . . . $ 971 $ 2,820 $ 1,205 $ 801 $ 5,797Operating leases(a) . . . . . . . . . . . . . $ 38,689 $ 105,477 $ 59,284 $ 69,028 $ 272,478Stand-by Letter-of-credit(b) . . . . . . — $ 400 — — $ 400Scheduled Interest Payments(c). . . $ 791 $ 1,641 $ 235 $ 240 $ 2,907License Agreement. . . . . . . . . . . . . . $ 165 $ 495 $ 165 — $ 825
(a) Includes various lease agreements for stores to be opened and equipment placed in service subsequent
to January 28, 2006. See Note 9 to the Consolidated Financial Statements.
(b) To secure the payment of rent at one leased location included in “Operating Leases” above and is renewable each year through the end of the lease term (2009).
(c) These scheduled interest payments consist of interest payments on the outstanding long term debt. For borrowings under the Company’s revolving loan agreement, projected interest is calculated based on the outstanding principal balance as of January 28, 2006. For borrowings under the Company’s variable rate debt instruments (including the revolving loan agreement), interest is calculated based on the interest rates in effect on January 28, 2006. The principal balance of the revolver and all variable interest rates may, and probably will, vary in future periods.
Item 7A. QUANTITATIVE AND QUALITATIVE DISCLOSURES ABOUT MARKET RISK
At January 28, 2006, there were no derivative financial instruments. In addition, the Company does not believe it is materially at risk for changes in market interest rates or foreign currency fluctuations. The Company’s interest on borrowings under its Credit Agreement is at a variable rate based on the prime rate or a spread over the LIBOR. A 100 basis point change in interest rate would have changed interest expense by approximately $0.2 million in fiscal 2005.
Item 8. FINANCIAL STATEMENTS AND SUPPLEMENTARY DATA
Refer to pages F-1 to F-24 of this Annual Report on Form 10-K, which are incorporated by reference.
28
Item 9. CHANGES IN AND DISAGREEMENTS WITH ACCOUNTANTS ON ACCOUNTING AND FINANCIAL DISCLOSURE
None.
Item 9A. CONTROLS AND PROCEDURES
Disclosure Controls and Procedures and Changes in Internal Control Over Financial Reporting
Limitations on Controls and Procedures. Because of their inherent limitations, disclosure controls and procedures and internal control over financial reporting (collectively, “Control Systems”) may not prevent or detect all failures or misstatements of the type sought to be avoided by Control Systems. Also, projections of any evaluation of the effectiveness of the Company’s Control Systems to future periods are subject to the risk that controls may become inadequate because of changes in conditions, or that the degree of compliance with the policies or procedures may deteriorate. Management, including the Company’s Chief Executive Officer (the “CEO”) and Chief Financial Officer (the “CFO”), does not expect that the Company’s Control Systems will prevent all error or all fraud. A Control System, no matter how well conceived and operated, can provide only reasonable, not absolute, assurance that the objectives of the Control System are met. Further, the design of a Control System must reflect the fact that there are resource constraints, and the benefits of controls must be considered relative to their costs. Because of the inherent limitations in all Control Systems, no evaluation can provide absolute assurance that all control issues and instances of fraud, if any, within the Company have been detected. These reports by management, including the CEO and CFO, on the effectiveness of the Company’s Control Systems express only reasonable assurance of the conclusions reached.
Disclosure Controls and Procedures—The Company maintains disclosure controls and procedures that are designed to ensure that information required to be disclosed in the Company’s reports under the Securities Exchange Act of 1934, as amended (the “Exchange Act”), is recorded, processed, summarized, and reported within the time periods specified in the SEC’s rules and forms, and that such information is accumulated and communicated to management, including the CEO and CFO, as appropriate, to allow timely decisions regarding required disclosure.
Management, with the participation of the CEO and CFO, has evaluated the effectiveness, as of January 28, 2006, of the Company’s disclosure controls and procedures (as defined in Rule 13a—15(e) and 15d—15(e) under the Exchange Act). Based on that evaluation, the CEO and CFO have concluded that the Company’s disclosure controls and procedures were effective as of January 28, 2006.
Management’s Annual Report on Internal Control over Financial Reporting—Management is responsible for establishing and maintaining adequate internal control over financial reporting (as defined in Rule 13a-15(f) and 15d-15(f) under the Exchange Act). Management, with the participation of the CEO and CFO, has evaluated the effectiveness, as of January 28, 2006, of the Company’s internal control over financial reporting. In making this evaluation, management used the criteria set forth by the Committee of Sponsoring Organizations of the Treadway Commission in its publication Internal Control-Integrated Framework. Based on that evaluation, the CEO and CFO have concluded that the Company’s internal control over financial reporting was effective as of January 28, 2006.
Changes in Internal Control over Financial Reporting—There were no changes in the Company’s internal control over financial reporting identified in connection with the evaluation required by paragraph (d) of Section 240.13a-15 of the Exchange Act that occurred during the Company’s last fiscal quarter (the Company’s fourth quarter in the case of an annual report) that have materially affected, or are reasonably likely to materially affect, the Company’s internal control over financial reporting.
Attestation Report of the Registered Public Accounting Firm—The Company’s independent registered public accounting firm, Deloitte & Touche, LLP, has issued the following attestation report on the Company’s assessment and opinion on the effectiveness of the Company’s internal control over financial reporting:
29
REPORT OF INDEPENDENT REGISTERED PUBLIC ACCOUNTING FIRM
To the Board of Directors and Stockholders of Jos. A. Bank Clothiers, Inc.:
We have audited management’s assessment, included in the accompanying Management’s Annual Report on Internal Control over Financial Reporting, that Jos. A. Bank Clothiers, Inc. and subsidiaries (the “Company”) maintained effective internal control over financial reporting as of January 28, 2006 based on criteria established in Internal Control—Integrated Framework issued by the Committee of Sponsoring Organizations of the Treadway Commission. The Company’s management is responsible for maintaining effective internal control over financial reporting and for its assessment of the effectiveness of internal control over financial reporting. Our responsibility is to express an opinion on management’s assessment and an opinion on the effectiveness of the Company’s internal control over financial reporting based on our audit.
We conducted our audit in accordance with the standards of the Public Company Accounting Oversight Board (United States). Those standards require that we plan and perform the audit to obtain reasonable assurance about whether effective internal control over financial reporting was maintained in all material respects. Our audit included obtaining an understanding of internal control over financial reporting, evaluating management’s assessment, testing and evaluating the design and operating effectiveness of internal control, and performing such other procedures as we considered necessary in the circumstances. We believe that our audit provides a reasonable basis for our opinions.
A company’s internal control over financial reporting is a process designed by, or under the supervision of, the company’s principal executive and principal financial officers, or persons performing similar functions, and effected by the company’s board of directors, management, and other personnel to provide reasonable assurance regarding the reliability of financial reporting and the preparation of financial statements for external purposes in accordance with generally accepted accounting principles. A company’s internal control over financial reporting includes those policies and procedures that (1) pertain to the maintenance of records that, in reasonable detail, accurately and fairly reflect the transactions and dispositions of the assets of the company; (2) provide reasonable assurance that transactions are recorded as necessary to permit preparation of financial statements in accordance with generally accepted accounting principles, and that receipts and expenditures of the company are being made only in accordance with authorizations of management and directors of the company; and (3) provide reasonable assurance regarding prevention or timely detection of unauthorized acquisition, use, or disposition of the company’s assets that could have a material effect on the financial statements.
Because of the inherent limitations of internal control over financial reporting, including the possibility of collusion or improper management override of controls, material misstatements due to error or fraud may not be prevented or detected on a timely basis. Also, projections of any evaluation of the effectiveness of the internal control over financial reporting to future periods are subject to the risk that the controls may become inadequate because of changes in conditions, or that the degree of compliance with the policies or procedures may deteriorate.
In our opinion, management’s assessment that the Company maintained effective internal control over financial reporting as of January 28, 2006, is fairly stated, in all material respects, based upon the criteria established in Internal Control—Integrated Framework issued by the Committee of Sponsoring Organizations of the Treadway Commission. Also, in our opinion, the Company maintained, in all material respects, effective internal control over financial reporting as of January 28, 2006, based upon the criteria established in Internal Control—Integrated Framework issued by the Committee of Sponsoring Organizations of the Treadway Commission.
We have also audited, in accordance with the standards of the Public Company Accounting Oversight Board (United States), the consolidated financial statements as of and for the year ended January 28, 2006,

30
of the Company and our report dated April 11, 2006 expressed an unqualified opinion on those financial statements.
/s/ DELOITTE & TOUCHE LLP
Baltimore, MD April 11, 2006
31
Item 9B. OTHER INFORMATION
None.
PART III
Item 10. DIRECTORS AND EXECUTIVE OFFICERS OF THE REGISTRANT
Item 10, other than the following information concerning the Company’s code of ethics, is omitted by the Company in accordance with General Instruction G to Form 10-K. The Company will disclose the information required under this item either by (a) incorporating the information by reference from the Company’s definitive proxy statement if filed by May 30, 2006 (the first business day following 120 days from the close of its fiscal year ended January 28, 2006) or (b) filing an amendment to this Form 10-K which contains the required information by May 30, 2006.
The Company has adopted a “code of ethics” as defined by applicable rules of the Securities and Exchange Commission and the NASDAQ Stock Market, which is applicable to, among others, its chief executive officer, chief financial officer, principal accounting officer and other senior financial and reporting persons and its directors. If the Company makes any amendments to the code of ethics for its senior officers, financial and reporting persons or directors (other than technical, administrative, or other non-substantive amendments), or grants any waivers, including implicit waivers, from a provision of this code to such persons, the Company will disclose the nature of the amendment or waiver, its effective date and to whom it applies on its website or in a report on Form 8-K filed with the Securities and Exchange Commission. The Company has posted its code of ethics on its Internet website at www.josbank.com.
Item 11. EXECUTIVE COMPENSATION
Item 11 is omitted by the Company in accordance with General Instruction G to Form 10-K. The Company will disclose the information required under this item either by (a) incorporating the information by reference from the Company’s definitive proxy statement if filed by May 30, 2006 (the first business day following 120 days from the close of its fiscal year ended January 28, 2006) or (b) filing an amendment to this Form 10-K which contains the required information by May 30, 2006.
Item 12. SECURITY OWNERSHIP OF CERTAIN BENEFICIAL OWNERS AND MANAGEMENT AND RELATED STOCKHOLDER MATTERS
Item 12 is omitted by the Company in accordance with General Instruction G to Form 10-K. The Company will disclose the information required under this item either by (a) incorporating the information by reference from the Company’s definitive proxy statement if filed by May 30, 2006 (the first business day following 120 days from the close of its fiscal year ended January 28, 2006) or (b) filing an amendment to this Form 10-K which contains the required information by May 30, 2006.
Item 13. CERTAIN RELATIONSHIPS AND RELATED TRANSACTIONS
Item 13 is omitted by the Company in accordance with General Instruction G to Form 10-K. The Company will disclose the information required under this item either by (a) incorporating the information by reference from the Company’s definitive proxy statement if filed by May 30, 2006 (the first business day following 120 days from the close of its fiscal year ended January 28, 2006) or (b) filing an amendment to this Form 10-K which contains the required information by May 30, 2006.
Item 14. PRINCIPAL ACCOUNTANT FEES AND SERVICES
Item 14 is omitted by the Company in accordance with General Instruction G to Form 10-K. The Company will disclose the information required under this item either by (a) incorporating the information by reference from the Company’s definitive proxy statement if filed by May 30, 2006 (the first business day following 120 days from the close of its fiscal year ended January 28, 2006) or (b) filing an amendment to this Form 10-K which contains the required information by May 30, 2006.
32
PART IV
Item 15. EXHIBITS AND FINANCIAL STATEMENTS SCHEDULES
(a) (3) List of Exhibits
3.1 — Restated Certificate of Incorporation of the Company.*(1)
3.2 — Amended and Restated By-Laws of the Company as of April 15, 2003.*(15)
4.1 — Form of Common Stock certificate.*(1)
4.2 — Rights Agreement, dated as of September 19, 1997, including Exhibit C thereto (the Certificate of Designation governing the Company’s Series A Preferred Stock).*(4)
10.1 — 1994 Incentive Plan.*(1)†
10.1(a) — Amendments, dated as of October 6, 1997, to Incentive Plan.*(5)†
10.2 — Amended and Restated Credit Agreement, dated as of January 6, 2004, by and among the Company, certain Lenders which are signatories thereto and Wells Fargo Retail Finance II, LLC, as agent for such Lenders.*(17)
10.3 — Amended and Restated Employment Agreement, dated as of May 15, 2002, between David E. Ullman and Jos. A. Bank Clothiers, Inc.*(12)†
10.3(a) — First Amendment, dated April 30, 2003, to Amended and Restated Employment Agreement, dated as of May 15, 2002, by and between David E. Ullman and Jos. A. Bank Clothiers, Inc.*(15)†
10.3(b) — Second Amendment, dated as of April 4, 2005, to Amended and Restated Employment Agreement, dated as of May 15, 2002, by and between David E. Ullman and Jos. A. Bank Clothiers, Inc.*(20)†
10.3(c) — Third Amendment, dated as of April 5, 2006, to Amended and Restated Employment Agreement, dated as of May 15, 2002, by and between David E. Ullman and Jos. A. Bank Clothiers, Inc.*(22)†
10.4 — Jos. A. Bank Clothiers, Inc. Nonqualified Deferred Compensation Trust Agreement, dated January 20, 2004.*(21)†
10.5 — Employment Agreement, dated as of September 19, 1997, between Gary W. Cejka and Jos. A. Bank Clothiers, Inc.*(5)†
10.6 — Amended and Restated Employment Agreement, dated May 15, 2002, by and between Charles D. Frazer and Jos. A. Bank Clothiers, Inc.*(12)†
10.6(a) — First Amendment, dated as of April 30, 2003, to Amended and Restated Employment Agreement, dated as of May 15, 2002, by and between Charles D. Frazer and Jos. A. Bank Clothiers, Inc.*(15)†
10.6(b) — Second Amendment, dated as of April 4, 2005, to Amended and Restated Employment Agreement, dated as of May 15, 2002, by and between Charles D. Frazer and Jos. A. Bank Clothiers, Inc.*(21)†
10.6(c) — Third Amendment, dated as of April 5, 2006, to Amended and Restated Employment Agreement, dated as of May 15, 2002, by and between Charles D. Frazer and Jos. A. Bank Clothiers, Inc.*(22)†
10.7 — Employment Agreement, dated as of November 1, 1999, between Robert N. Wildrick and Jos. A. Bank Clothiers, Inc.*(7)†
33
10.7(a) — First Amendment, dated as of March 6, 2000, to Employment Agreement, dated as of November 1, 1999, by and between Robert N. Wildrick and Jos. A. Bank Clothiers, Inc.*(8)†
10.7(b) — Second Amendment, dated as of May 25, 2001, to Employment Agreement, dated as of November 1, 1999, by and between Robert N. Wildrick and Jos. A. Bank Clothiers, Inc.*(10)†
10.7(c) — Third Amendment, dated as of October 2, 2003, to Employment Agreement, dated as of November 1, 1999, by and between Robert N. Wildrick and Jos. A. Bank Clothiers, Inc.*(16)†
10.8 — Employment Agreement, dated as of November 30, 1999, by and between Robert Hensley and Jos. A. Bank Clothiers, Inc.*(7)†
10.8(a) — First Amendment, dated as of January 1, 2000, to Employment Agreement, dated as of November 30, 1999, by and between Robert Hensley and Jos. A. Bank Clothiers, Inc.*(9)†
10.8(b) — Second Amendment, dated as of March 16, 2001, to Employment Agreement, dated as of November 30, 1999, by and between Robert Hensley and Jos. A. Bank Clothiers, Inc.*(9)†
10.8(c) — Third Amendment, dated as of April 15, 2002, to Employment Agreement, dated as of November 30, 1999, by and between Robert Hensley and Jos. A. Bank Clothiers, Inc.*(11)†
10.8(d) — Fourth Amendment, dated as of May 28, 2002, to Employment Agreement, dated as of November 30, 1999, by and between Robert Hensley and Jos. A. Bank Clothiers, Inc.*(12)†
10.8(e) — Fifth Amendment, dated as of April 30, 2003, to Employment Agreement, dated as of November 30, 1999, by and between Robert Hensley and Jos. A. Bank Clothiers, Inc.*(15)†
10.8(f) — Sixth Amendment, dated as of April 4, 2005, to Employment Agreement, dated as of November 30, 1999, by and between Robert Hensley and Jos. A. Bank Clothiers, Inc.*(20)†
10.8(g) — Seventh Amendment, dated as of April 5, 2006, to Employment Agreement, dated as of November 30, 1999, by and between Robert Hensley and Jos. A. Bank Clothiers, Inc.*(22)†
10.9 — Employment Agreement, dated as of December 21, 1999, by and between R. Neal Black and Jos. A. Bank Clothiers, Inc.*(8)†
10.9(a) — First Amendment, dated as of March 16, 2001, to Employment Agreement, dated as of December 21, 1999, by and between R. Neal Black and Jos. A. Bank Clothiers, Inc.*(9)†
10.9(b) — Second Amendment, dated as of April 15, 2002, to Employment Agreement, dated as of December 21, 1999, by and between Neal Black and Jos. A. Bank Clothiers, Inc.*(11)†
10.9(c) — Third Amendment, dated as of May 29, 2002, to Employment Agreement, dated as of December 21, 1999, by and between R. Neal Black and Jos. A. Bank Clothiers, Inc.*(12)†
10.9(d) — Fourth Amendment, dated as of April 30, 2003, to Employment Agreement, dated as of December 21, 1999, by and between R. Neal Black and Jos. A. Bank Clothiers, Inc.*(15)†
10.9(e) — Fifth Amendment, dated as of April 4, 2005 to Employment Agreement, dated as of December 21, 1999, by and between R. Neal Black and Jos. A. Bank Clothiers, Inc.*(20)†
10.9(f) — Sixth Amendment, dated as of April 5, 2006 to Employment Agreement, dated as of December 21, 1999, by and between R. Neal Black and Jos. A. Bank Clothiers, Inc.*(22)†
10.10 — Employment offer letter, dated November 20, 2000, from Jos. A. Bank Clothiers, Inc. to Jerry DeBoer.*(9)†
10.10(a) — Written description of 2006 base salary for Jerry DeBoer.*(22)†
10.11 — Employment offer letter, dated September 18, 2000, from Jos. A. Bank Clothiers, Inc. to Gary Merry.*(12)†
34
10.12 — 2002 Long-Term Incentive Plan.*(14)†
10.13 — Form of stock option agreement under the 2002 Long-Term Incentive Plan.*(20)†
10.14 — Collective Bargaining Agreement, dated March 1, 2003, by and between Joseph A. Bank Mfg. Co., Inc. and Baltimore Regional Joint Board, UNITE.*(23)†
10.15 — Descriptions of Basic Bonus Plan, Incentive Bonus Plan and Contractual Bonus Plan.*(23)†
16.1 — Letter from Arthur Andersen, LLP to the Securities and Exchange Commission, dated May 1, 2002.*(13)
16.2 — Letter from KPMG, LLP to the Securities and Exchange Commission, dated April 20, 2004.*(18)
16.3 — Letter from Ernst & Young, LLP to the Securities and Exchange Commission, dated May 14, 2004.*(19)
21.1 — Company subsidiaries.*(21)
23.1 — Consent of Deloitte & Touche LLP.*(23)
23.2 — Consent of KPMG, LLP.*(23)
31.1 — Certification of Principal Executive Officer Pursuant to Section 302 of the Sarbanes-Oxley Act of 2002.*(23)
31.2 — Certification of Principal Financial Officer Pursuant to Section 302 of the Sarbanes-Oxley Act of 2002.*(23)
32.1 — Certification of Principal Executive Officer Pursuant to Section 906 of the Sarbanes-Oxley Act of 2002.*(23)
32.2 — Certification of Principal Financial Officer Pursuant to Section 906 of the Sarbanes-Oxley Act of 2002.*(23)
*(1) — Incorporated by reference to the Company’s Registration Statement on Form S-1 filed May 3,
1994.
*(2) — Incorporated by reference to the Company’s Annual Report on Form 10-K for the year ended February 3, 1996.
*(3) — Incorporated by reference to the Company’s Annual Report on Form 10-K for the year ended February 1, 1997.
*(4) — Incorporated by reference to the Company’s Form 8-K dated September 22, 1997.
*(5) — Incorporated by reference to the Company’s Annual Report on Form 10-K for the year ended January 31, 1998.
*(6) — Incorporated by reference to the Company’s Annual Report on Form 10-K for the year ended January 30, 1999.
*(7) — Incorporated by reference to the Company’s Quarterly Report on Form 10-Q for the quarter ended October 30, 1999.
*(8) — Incorporated by reference to the Company’s Annual Report on Form 10-K for the year ended January 29, 2000.
*(9) — Incorporated by reference to the Company’s Annual Report on Form 10-K for the year ended February 3, 2001.
35
*(10) — Incorporated by reference to the Company’s Quarterly Report on Form 10-Q for the quarter ended May 5, 2001.
*(11) — Incorporated by reference to the Company’s Annual Report on Form 10-K for the year ended February 2, 2002.
*(12) — Incorporated by reference to the Company’s Quarterly Report on Form 10-Q for the quarter ended May 4, 2002.
*(13) — Incorporated by reference to the Company’s Current Report on Form 8-K, dated May 8, 2002.
*(14) — Incorporated by reference to the Company’s Definitive Proxy Statement on Schedule 14(A) filed May 20, 2002.
*(15) — Incorporated by reference to the Company’s Annual Report on Form 10-K for the year ended February 1, 2003.
*(16) — Incorporated by reference to the Company’s Quarterly Report on Form 10-Q for the quarter ended November 1, 2003
*(17) — Incorporated by reference to the Company’s Annual Report on Form 10-K for the year ended January 31, 2004.
*(18) — Incorporated by reference to the Company’s Current Report on Form 8-K, dated April 20, 2004.
*(19) — Incorporated by reference to the Company’s Current Report on Form 8-K, dated May 14, 2004.
*(20) — Incorporated by reference to the Company’s Current Report on Form 8-K, dated April 7, 2005.
*(21) — Incorporated by reference to the Company’s Annual Report on Form 10-K for the year ended January 29, 2005.
*(22) — Incorporated by reference to the Company’s Current Report on Form 8-K, dated April 6, 2006.
*(23) — Filed herewith.
† — Exhibit represents a management contract or compensatory plan or arrangement.
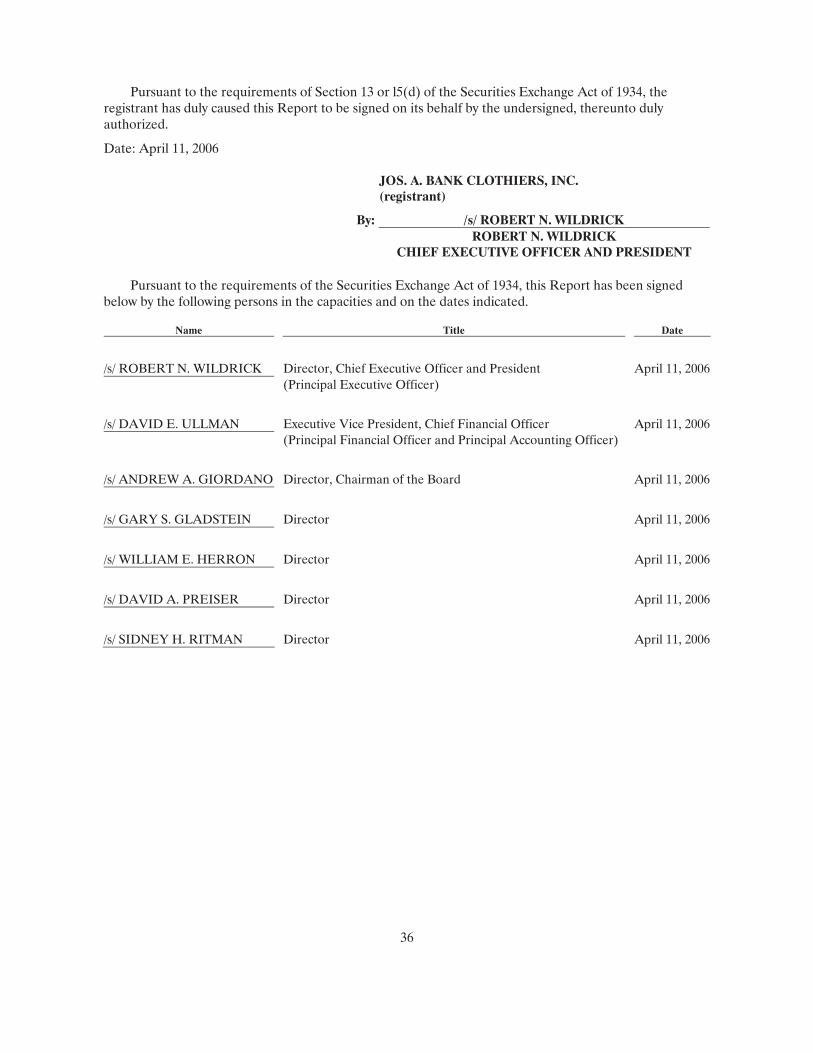
36
Pursuant to the requirements of Section 13 or l5(d) of the Securities Exchange Act of 1934, the registrant has duly caused this Report to be signed on its behalf by the undersigned, thereunto duly authorized.
Date: April 11, 2006
JOS. A. BANK CLOTHIERS, INC. (registrant)
By: /s/ ROBERT N. WILDRICK ROBERT N. WILDRICK CHIEF EXECUTIVE OFFICER AND PRESIDENT
Pursuant to the requirements of the Securities Exchange Act of 1934, this Report has been signed below by the following persons in the capacities and on the dates indicated.
Name Title Date
/s/ ROBERT N. WILDRICK Director, Chief Executive Officer and President April 11, 2006 (Principal Executive Officer)
/s/ DAVID E. ULLMAN Executive Vice President, Chief Financial Officer April 11, 2006 (Principal Financial Officer and Principal Accounting Officer)
/s/ ANDREW A. GIORDANO Director, Chairman of the Board April 11, 2006
/s/ GARY S. GLADSTEIN Director April 11, 2006
/s/ WILLIAM E. HERRON Director April 11, 2006
/s/ DAVID A. PREISER Director April 11, 2006
/s/ SIDNEY H. RITMAN Director April 11, 2006
37
Draft v7—For Management Discussion Only
REPORT OF INDEPENDENT REGISTERED PUBLIC ACCOUNTING FIRM
To the Board of Directors and Stockholders of Jos. A. Bank Clothiers, Inc.:
We have audited the accompanying consolidated balance sheets of Jos. A. Bank Clothiers, Inc. and subsidiaries (the “Company”) as of January 28, 2006 and January 29, 2005 and the related consolidated statements of income, stockholders’ equity, and cash flows for year ended January 28, 2006 (“fiscal 2005”) and for the year ended January 29, 2005 (“fiscal 2004”). These financial statements are the responsibility of the Company’s management. Our responsibility is to express an opinion on the consolidated financial statements based on our audits. The financial statements of the Company for the year ended January 31, 2004 were audited by other auditors whose report, dated March 25, 2004 (except as to the effects of the eighth paragraph of Note 1, which is as of April 13, 2005) expressed an unqualified opinion on those statements.
We conducted our audits in accordance with the standards of the Public Company Accounting Oversight Board (United States). Those standards require that we plan and perform the audit to obtain reasonable assurance about whether the financial statements are free of material misstatement. An audit includes examining, on a test basis, evidence supporting the amounts and disclosures in the financial statements. An audit also includes assessing the accounting principles used and significant estimates made by management, as well as evaluating the overall financial statement presentation. We believe that our audits provide a reasonable basis for our opinion.
In our opinion, such fiscal 2005 and fiscal 2004 consolidated financial statements present fairly, in all material respects, the financial position of Jos. A. Bank Clothiers, Inc. and subsidiaries as of January 28, 2006 and January 29, 2005, and the results of its operations and its cash flows for the years then ended, in conformity with accounting principles generally accepted in the United States of America.
We have also audited, in accordance with the standards of the Public Company Accounting Oversight Board (United States), the effectiveness of the Company’s internal control over financial reporting as of January 28, 2006, based on the criteria established in Internal Control—Integrated Framework issued by the Committee of Sponsoring Organizations of the Treadway Commission and our report dated April 11, 2006, expressed an unqualified opinion on management’s assessment of the effectiveness of the Company’s internal control over financial reporting and an unqualified opinion on the effectiveness of the Company’s internal control over financial reporting.
/s/ DELOITTE & TOUCHE LLP
Baltimore, MD April 11, 2006
38
Report of Independent Registered Public Accountant
The Board of Directors Jos. A. Bank Clothiers, Inc.:
We have audited the accompanying consolidated statements of income, stockholders’ equity and cash flows of Jos. A. Bank Clothiers, Inc. and subsidiaries for the year ended January 31, 2004. These consolidated financial statements are the responsibility of the Company’s management. Our responsibility is to express an opinion on these consolidated financial statements based on our audit.
We conducted our audit in accordance with the standards of the Public Company Accounting Oversight Board (United States). Those standards require that we plan and perform the audit to obtain reasonable assurance about whether the financial statements are free of material misstatement. An audit includes examining, on a test basis, evidence supporting the amounts and disclosures in the financial statements. An audit also includes assessing the accounting principles used and significant estimates made by management, as well as evaluating the overall financial statement presentation. We believe that our audit provides a reasonable basis for our opinion.
In our opinion, the consolidated financial statements referred to above present fairly, in all material respects, the results of operations and cash flows of Jos. A. Bank Clothiers, Inc. and subsidiaries for the year ended January 31, 2004, in conformity with U.S. generally accepted accounting principles.
/s/ KPMG LLP
March 25, 2004, except as to the effects of the eighth paragraph of note 1, which is as of April 13, 2005
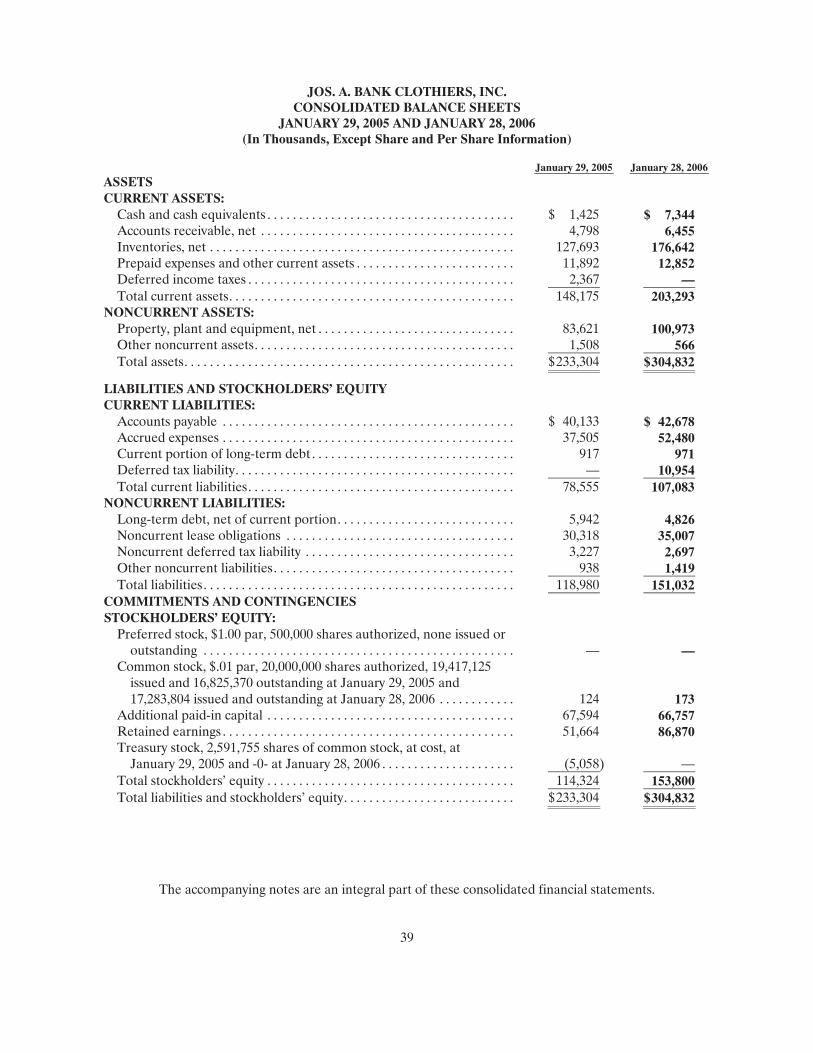
The accompanying notes are an integral part of these consolidated financial statements.
39
JOS. A. BANK CLOTHIERS, INC. CONSOLIDATED BALANCE SHEETS
JANUARY 29, 2005 AND JANUARY 28, 2006 (In Thousands, Except Share and Per Share Information)
January 29, 2005 January 28, 2006ASSETS CURRENT ASSETS:
Cash and cash equivalents . . . . . . . . . . . . . . . . . . . . . . . . . . . . . . . . . . . . . . . $ 1,425 $ 7,344 Accounts receivable, net . . . . . . . . . . . . . . . . . . . . . . . . . . . . . . . . . . . . . . . . 4,798 6,455 Inventories, net . . . . . . . . . . . . . . . . . . . . . . . . . . . . . . . . . . . . . . . . . . . . . . . . 127,693 176,642 Prepaid expenses and other current assets . . . . . . . . . . . . . . . . . . . . . . . . . 11,892 12,852 Deferred income taxes . . . . . . . . . . . . . . . . . . . . . . . . . . . . . . . . . . . . . . . . . . 2,367 — Total current assets. . . . . . . . . . . . . . . . . . . . . . . . . . . . . . . . . . . . . . . . . . . . . 148,175 203,293
NONCURRENT ASSETS: Property, plant and equipment, net . . . . . . . . . . . . . . . . . . . . . . . . . . . . . . . 83,621 100,973 Other noncurrent assets. . . . . . . . . . . . . . . . . . . . . . . . . . . . . . . . . . . . . . . . . 1,508 566 Total assets. . . . . . . . . . . . . . . . . . . . . . . . . . . . . . . . . . . . . . . . . . . . . . . . . . . . $ 233,304 $ 304,832
LIABILITIES AND STOCKHOLDERS’ EQUITY CURRENT LIABILITIES:
Accounts payable . . . . . . . . . . . . . . . . . . . . . . . . . . . . . . . . . . . . . . . . . . . . . . $ 40,133 $ 42,678 Accrued expenses . . . . . . . . . . . . . . . . . . . . . . . . . . . . . . . . . . . . . . . . . . . . . . 37,505 52,480 Current portion of long-term debt . . . . . . . . . . . . . . . . . . . . . . . . . . . . . . . . 917 971 Deferred tax liability. . . . . . . . . . . . . . . . . . . . . . . . . . . . . . . . . . . . . . . . . . . . — 10,954 Total current liabilities. . . . . . . . . . . . . . . . . . . . . . . . . . . . . . . . . . . . . . . . . . 78,555 107,083
NONCURRENT LIABILITIES: Long-term debt, net of current portion. . . . . . . . . . . . . . . . . . . . . . . . . . . . 5,942 4,826 Noncurrent lease obligations . . . . . . . . . . . . . . . . . . . . . . . . . . . . . . . . . . . . 30,318 35,007 Noncurrent deferred tax liability . . . . . . . . . . . . . . . . . . . . . . . . . . . . . . . . . 3,227 2,697 Other noncurrent liabilities. . . . . . . . . . . . . . . . . . . . . . . . . . . . . . . . . . . . . . 938 1,419 Total liabilities. . . . . . . . . . . . . . . . . . . . . . . . . . . . . . . . . . . . . . . . . . . . . . . . . 118,980 151,032
COMMITMENTS AND CONTINGENCIES STOCKHOLDERS’ EQUITY:
Preferred stock, $1.00 par, 500,000 shares authorized, none issued or outstanding . . . . . . . . . . . . . . . . . . . . . . . . . . . . . . . . . . . . . . . . . . . . . . . . . — —
Common stock, $.01 par, 20,000,000 shares authorized, 19,417,125 issued and 16,825,370 outstanding at January 29, 2005 and 17,283,804 issued and outstanding at January 28, 2006 . . . . . . . . . . . . 124 173
Additional paid-in capital . . . . . . . . . . . . . . . . . . . . . . . . . . . . . . . . . . . . . . . 67,594 66,757 Retained earnings . . . . . . . . . . . . . . . . . . . . . . . . . . . . . . . . . . . . . . . . . . . . . . 51,664 86,870 Treasury stock, 2,591,755 shares of common stock, at cost, at
January 29, 2005 and -0- at January 28, 2006 . . . . . . . . . . . . . . . . . . . . . (5,058 ) — Total stockholders’ equity . . . . . . . . . . . . . . . . . . . . . . . . . . . . . . . . . . . . . . . 114,324 153,800 Total liabilities and stockholders’ equity. . . . . . . . . . . . . . . . . . . . . . . . . . . $ 233,304 $ 304,832
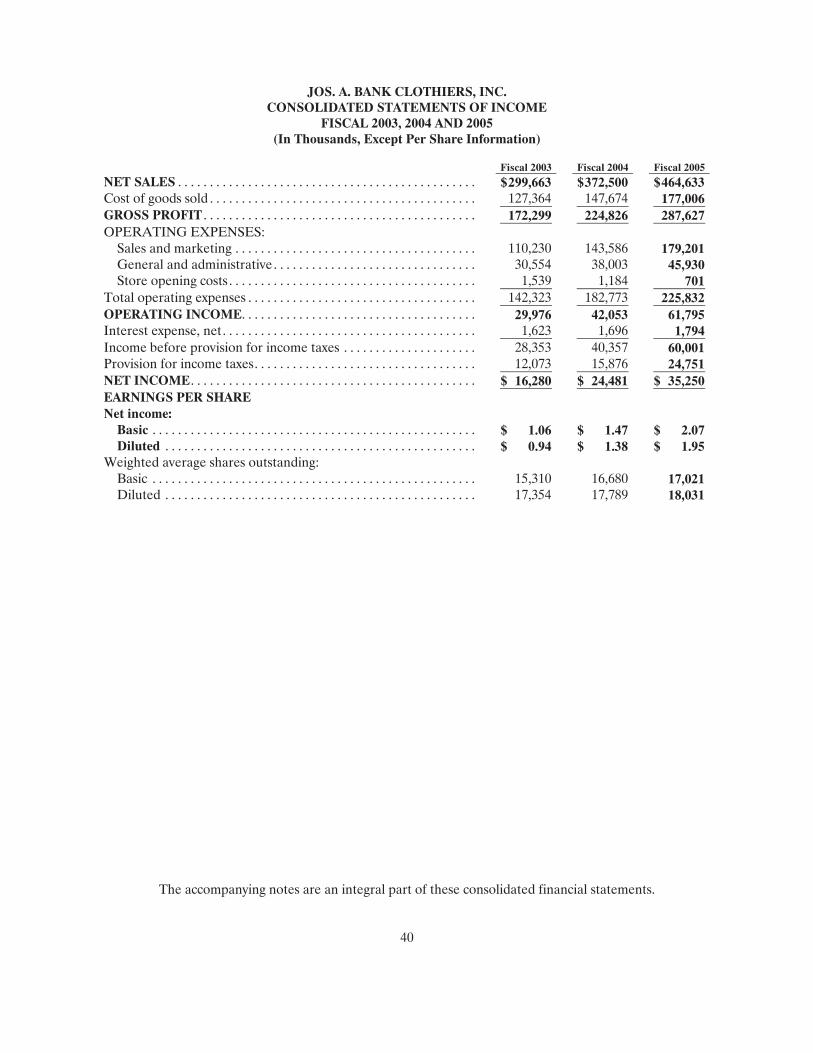
The accompanying notes are an integral part of these consolidated financial statements.
40
JOS. A. BANK CLOTHIERS, INC. CONSOLIDATED STATEMENTS OF INCOME
FISCAL 2003, 2004 AND 2005 (In Thousands, Except Per Share Information)
Fiscal 2003 Fiscal 2004 Fiscal 2005NET SALES . . . . . . . . . . . . . . . . . . . . . . . . . . . . . . . . . . . . . . . . . . . . . . . $ 299,663 $ 372,500 $ 464,633Cost of goods sold . . . . . . . . . . . . . . . . . . . . . . . . . . . . . . . . . . . . . . . . . . 127,364 147,674 177,006GROSS PROFIT . . . . . . . . . . . . . . . . . . . . . . . . . . . . . . . . . . . . . . . . . . . 172,299 224,826 287,627OPERATING EXPENSES:
Sales and marketing . . . . . . . . . . . . . . . . . . . . . . . . . . . . . . . . . . . . . . 110,230 143,586 179,201General and administrative . . . . . . . . . . . . . . . . . . . . . . . . . . . . . . . . 30,554 38,003 45,930Store opening costs . . . . . . . . . . . . . . . . . . . . . . . . . . . . . . . . . . . . . . . 1,539 1,184 701
Total operating expenses . . . . . . . . . . . . . . . . . . . . . . . . . . . . . . . . . . . . 142,323 182,773 225,832OPERATING INCOME. . . . . . . . . . . . . . . . . . . . . . . . . . . . . . . . . . . . . 29,976 42,053 61,795Interest expense, net. . . . . . . . . . . . . . . . . . . . . . . . . . . . . . . . . . . . . . . . 1,623 1,696 1,794Income before provision for income taxes . . . . . . . . . . . . . . . . . . . . . 28,353 40,357 60,001Provision for income taxes. . . . . . . . . . . . . . . . . . . . . . . . . . . . . . . . . . . 12,073 15,876 24,751NET INCOME. . . . . . . . . . . . . . . . . . . . . . . . . . . . . . . . . . . . . . . . . . . . . $ 16,280 $ 24,481 $ 35,250EARNINGS PER SHARE Net income:
Basic . . . . . . . . . . . . . . . . . . . . . . . . . . . . . . . . . . . . . . . . . . . . . . . . . . . $ 1.06 $ 1.47 $ 2.07Diluted . . . . . . . . . . . . . . . . . . . . . . . . . . . . . . . . . . . . . . . . . . . . . . . . . $ 0.94 $ 1.38 $ 1.95
Weighted average shares outstanding: Basic . . . . . . . . . . . . . . . . . . . . . . . . . . . . . . . . . . . . . . . . . . . . . . . . . . . 15,310 16,680 17,021Diluted . . . . . . . . . . . . . . . . . . . . . . . . . . . . . . . . . . . . . . . . . . . . . . . . . 17,354 17,789 18,031
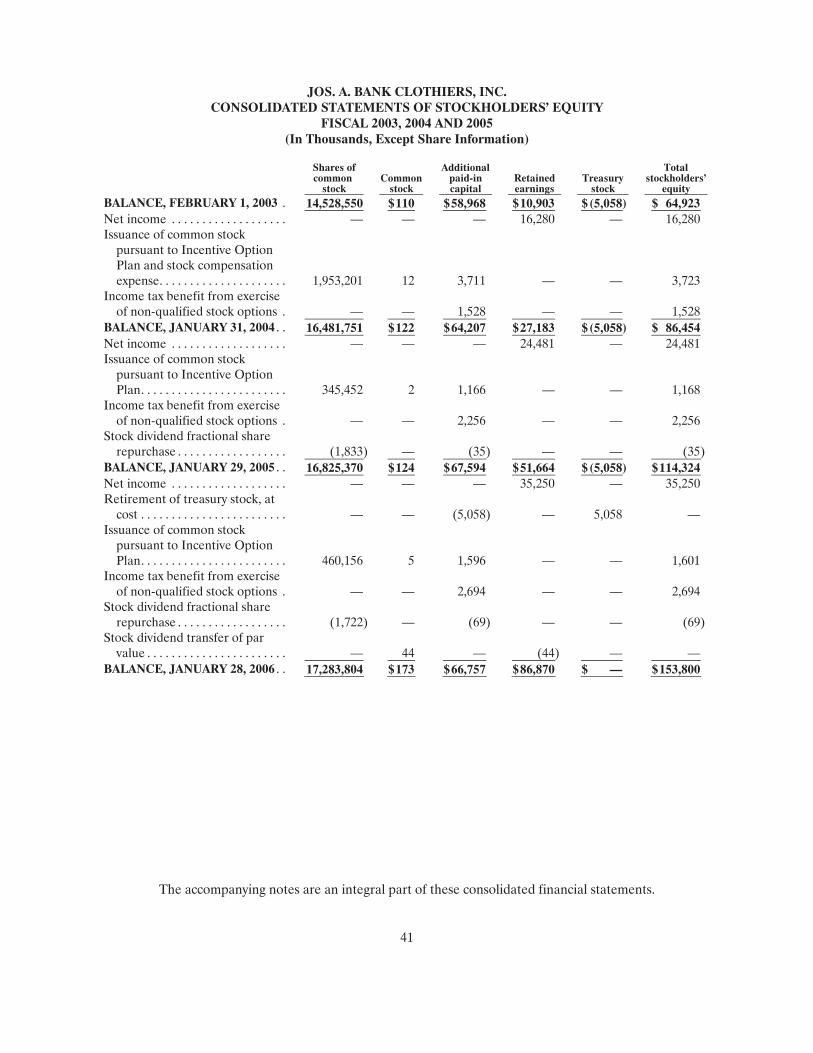
The accompanying notes are an integral part of these consolidated financial statements.
41
JOS. A. BANK CLOTHIERS, INC. CONSOLIDATED STATEMENTS OF STOCKHOLDERS’ EQUITY
FISCAL 2003, 2004 AND 2005 (In Thousands, Except Share Information)
Shares ofcommon
stock Common
stock
Additionalpaid-incapital
Retainedearnings
Treasury stock
Total stockholders’
equity BALANCE, FEBRUARY 1, 2003 . 14,528,550 $ 110 $ 58,968 $ 10,903 $ (5,058 ) $ 64,923 Net income . . . . . . . . . . . . . . . . . . . — — — 16,280 — 16,280 Issuance of common stock
pursuant to Incentive Option Plan and stock compensation expense. . . . . . . . . . . . . . . . . . . . . 1,953,201 12 3,711 — — 3,723
Income tax benefit from exercise of non-qualified stock options . — — 1,528 — — 1,528
BALANCE, JANUARY 31, 2004 . . 16,481,751 $ 122 $ 64,207 $ 27,183 $ (5,058 ) $ 86,454 Net income . . . . . . . . . . . . . . . . . . . — — — 24,481 — 24,481 Issuance of common stock
pursuant to Incentive Option Plan. . . . . . . . . . . . . . . . . . . . . . . . 345,452 2 1,166 — — 1,168
Income tax benefit from exercise of non-qualified stock options . — — 2,256 — — 2,256
Stock dividend fractional share repurchase . . . . . . . . . . . . . . . . . . (1,833) — (35) — — (35)
BALANCE, JANUARY 29, 2005 . . 16,825,370 $ 124 $ 67,594 $ 51,664 $ (5,058 ) $ 114,324 Net income . . . . . . . . . . . . . . . . . . . — — — 35,250 — 35,250 Retirement of treasury stock, at
cost . . . . . . . . . . . . . . . . . . . . . . . . — — (5,058) — 5,058 — Issuance of common stock
pursuant to Incentive Option Plan. . . . . . . . . . . . . . . . . . . . . . . . 460,156 5 1,596 — — 1,601
Income tax benefit from exercise of non-qualified stock options . — — 2,694 — — 2,694
Stock dividend fractional share repurchase . . . . . . . . . . . . . . . . . . (1,722) — (69) — — (69)
Stock dividend transfer of par value . . . . . . . . . . . . . . . . . . . . . . . — 44 — (44) — —
BALANCE, JANUARY 28, 2006 . . 17,283,804 $ 173 $ 66,757 $ 86,870 $ — $ 153,800
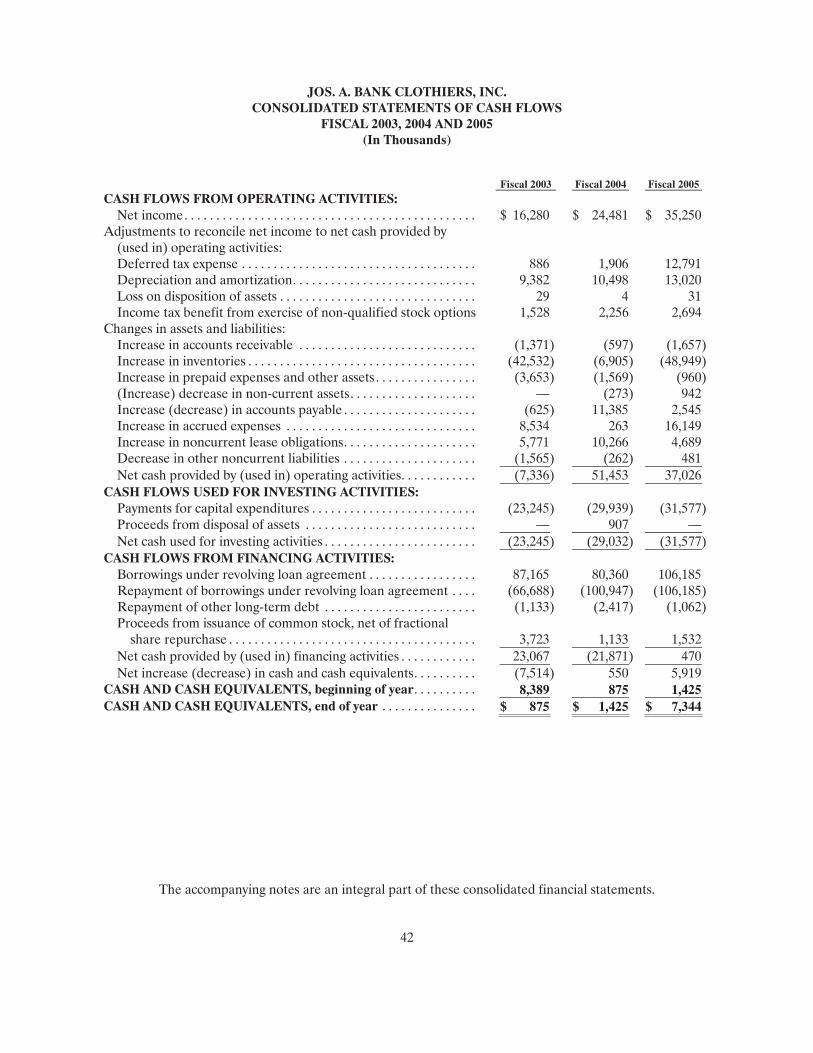
The accompanying notes are an integral part of these consolidated financial statements.
42
JOS. A. BANK CLOTHIERS, INC. CONSOLIDATED STATEMENTS OF CASH FLOWS
FISCAL 2003, 2004 AND 2005 (In Thousands)
Fiscal 2003 Fiscal 2004 Fiscal 2005CASH FLOWS FROM OPERATING ACTIVITIES:
Net income. . . . . . . . . . . . . . . . . . . . . . . . . . . . . . . . . . . . . . . . . . . . . . $ 16,280 $ 24,481 $ 35,250Adjustments to reconcile net income to net cash provided by
(used in) operating activities: Deferred tax expense . . . . . . . . . . . . . . . . . . . . . . . . . . . . . . . . . . . . . 886 1,906 12,791Depreciation and amortization. . . . . . . . . . . . . . . . . . . . . . . . . . . . . 9,382 10,498 13,020Loss on disposition of assets . . . . . . . . . . . . . . . . . . . . . . . . . . . . . . . 29 4 31Income tax benefit from exercise of non-qualified stock options 1,528 2,256 2,694
Changes in assets and liabilities: Increase in accounts receivable . . . . . . . . . . . . . . . . . . . . . . . . . . . . (1,371) (597 ) (1,657)Increase in inventories . . . . . . . . . . . . . . . . . . . . . . . . . . . . . . . . . . . . (42,532) (6,905 ) (48,949)Increase in prepaid expenses and other assets . . . . . . . . . . . . . . . . (3,653) (1,569 ) (960)(Increase) decrease in non-current assets. . . . . . . . . . . . . . . . . . . . — (273 ) 942Increase (decrease) in accounts payable . . . . . . . . . . . . . . . . . . . . . (625) 11,385 2,545Increase in accrued expenses . . . . . . . . . . . . . . . . . . . . . . . . . . . . . . 8,534 263 16,149Increase in noncurrent lease obligations. . . . . . . . . . . . . . . . . . . . . 5,771 10,266 4,689Decrease in other noncurrent liabilities . . . . . . . . . . . . . . . . . . . . . (1,565) (262 ) 481Net cash provided by (used in) operating activities. . . . . . . . . . . . (7,336) 51,453 37,026
CASH FLOWS USED FOR INVESTING ACTIVITIES: Payments for capital expenditures . . . . . . . . . . . . . . . . . . . . . . . . . . (23,245) (29,939 ) (31,577)Proceeds from disposal of assets . . . . . . . . . . . . . . . . . . . . . . . . . . . — 907 —Net cash used for investing activities . . . . . . . . . . . . . . . . . . . . . . . . (23,245) (29,032 ) (31,577)
CASH FLOWS FROM FINANCING ACTIVITIES: Borrowings under revolving loan agreement . . . . . . . . . . . . . . . . . 87,165 80,360 106,185Repayment of borrowings under revolving loan agreement . . . . (66,688) (100,947 ) (106,185)Repayment of other long-term debt . . . . . . . . . . . . . . . . . . . . . . . . (1,133) (2,417 ) (1,062)Proceeds from issuance of common stock, net of fractional
share repurchase . . . . . . . . . . . . . . . . . . . . . . . . . . . . . . . . . . . . . . . 3,723 1,133 1,532Net cash provided by (used in) financing activities . . . . . . . . . . . . 23,067 (21,871 ) 470Net increase (decrease) in cash and cash equivalents. . . . . . . . . . (7,514) 550 5,919
CASH AND CASH EQUIVALENTS, beginning of year. . . . . . . . . . 8,389 875 1,425CASH AND CASH EQUIVALENTS, end of year . . . . . . . . . . . . . . . $ 875 $ 1,425 $ 7,344
JOS. A. BANK CLOTHIERS, INC. AND SUBSIDIARIES NOTES TO CONSOLIDATED FINANCIAL STATEMENTS
FISCAL 2003, 2004 AND 2005 (Amounts in Thousands, Except Per Share Amounts or as Otherwise Noted)
43
1. SUMMARY OF SIGNIFICANT ACCOUNTING POLICIES:
Description of Business—Jos. A. Bank Clothiers, Inc. is a nationwide retailer of classic men’s clothing through conventional retail stores, catalog and Internet direct marketing and franchisees.
Principles of Consolidation—The consolidated financial statements include the accounts of Jos. A. Bank Clothiers, Inc. and its wholly-owned subsidiaries (collectively referred to as the “Company”). All significant intercompany balances and transactions have been eliminated in consolidation.
Common Stock Dividend—On December 14, 2005, the Company’s Board of Directors declared a 25% common stock dividend payable on February 15, 2006 to stockholders of record as of January 27, 2006. In conjunction with the distribution of the stock dividend, the Company retired all of its previously held shares of treasury stock. Unless otherwise indicated, all historical weighted average share and per share amounts and all references to the number of common shares elsewhere in the consolidated financial statements, and notes thereto, have been restated to reflect the stock dividend.
Fiscal Year—The Company maintains its accounts on a fifty-two/fifty-three week fiscal year ending on the Saturday nearest to January 31. The fiscal years ended January 31, 2004 (fiscal 2003), January 29, 2005 (fiscal 2004) and January 28, 2006 (fiscal 2005) each contained fifty-two weeks.
Seasonality—The Company’s net sales, net income and inventory levels fluctuate on a seasonal basis. The Company has increased its marketing efforts during peak selling times and expanded its inventory to include more Corporate Casual and Sportswear, resulting in profits generated during the fourth quarter holiday season becoming a larger portion of annual profits. Seasonality is also impacted by growth as more new stores are opened in the second half of the year. Seasonal fluctuations typically affect the Company’s inventory levels, with higher inventory carried in advance of peak selling periods, including the holiday season. In the fourth quarters of fiscal years 2003, 2004 and 2005, the Company generated approximately 59%, 51% and 53%, respectively, of its annual net income.
Use of Estimates—The preparation of the consolidated financial statements in conformity with accounting principles generally accepted in the United States of America requires management to make estimates and assumptions that affect the reported amounts of assets and liabilities and disclosure of contingent assets and liabilities at the date of the financial statements and the reported amounts of revenues and expenses during the reporting period. Estimates have been prepared on the basis of the most current and best information and actual results could differ from those estimates. Significant estimates in these financial statements include net realizable value of inventory, estimates of future cash flows associated with asset impairments and useful lives for depreciation and amortization.
Reclassifications—Certain amounts for fiscal 2004 have been reclassified to conform with the presentation in fiscal 2005. The Company reclassified certain deferred taxes in the accompanying Consolidated Balance Sheets and certain sales and related costs for new stores between the stores and direct marketing segments in Note 12 to the Consolidated Financial Statements.
Restatements—The consolidated financial statements for fiscal years ended February 2, 2002, February 1, 2003 and January 31, 2004 were restated in fiscal year ended January 29, 2005 in connection with the Company’s Annual Report on Form 10-K, which was filed with the Securities and Exchange Commission on April 14, 2005, to correct certain errors in the accounting for leases.
JOS. A. BANK CLOTHIERS, INC. AND SUBSIDIARIES NOTES TO CONSOLIDATED FINANCIAL STATEMENTS (Continued)
FISCAL 2003, 2004 AND 2005 (Amounts in Thousands, Except Per Share Amounts or as Otherwise Noted)
44
1. SUMMARY OF SIGNIFICANT ACCOUNTING POLICIES: (Continued)
Cash and Cash Equivalents—Cash and cash equivalents include overnight investments with maturities of 90 days or less at the date of acquisition.
Interest Expense—Interest expense, net includes interest income of approximately $16, $129 and $135 in fiscal 2003, 2004 and 2005, respectively.
Supplemental Cash Flow Information—Interest and income taxes paid were as follows: Fiscal 2003 Fiscal 2004 Fiscal 2005
Interest paid . . . . . . . . . . . . . . . . . . . . . . . . . . . . . . . . $ 1,474 $ 1,616 $ 1,809 Income taxes paid. . . . . . . . . . . . . . . . . . . . . . . . . . . . $ 6,785 $ 13,918 $ 6,828
Inventories—The Company records inventory at the lower of cost or market (“LCM”). Cost is determined using the first-in, first-out method. The Company capitalizes into inventory certain warehousing and freight delivery costs associated with shipping its merchandise to the point of sale. The Company periodically reviews quantities of inventories on hand and compares these amounts to the expected sales of each product. The Company records a charge to cost of goods sold for the amount required to reduce the carrying value of inventory to net realizable value.
Franchise Fees—Monthly franchise fees are recognized when earned under the franchise agreements, which is at the time the franchisee generates a sale. The fees are based on a percentage of sales generated by the franchise stores and are included in net sales in the Consolidated Statements of Income. Initial franchise fees are fully earned upon execution of the franchise agreements and there are no further obligations on the part of the Company in order to earn the initial franchise fee.
The Company does not have any controlling interest in any of its franchisees through voting rights or any other means and, in accordance with the revised Financial Accounting Standards Board Interpretation No. 46, “Consolidation of Variable Interest Entities,” does not consolidate these entities. The Company sells inventory to its franchise stores at prices above cost and the franchise stores have the right to return inventory to the Company.
Gift Cards and Certificates—The Company sells gift cards to individuals and companies in its stores segment and through its direct marketing segment. The Company’s apparel incentive gift certificates are used by various companies as a reward for achievement for their employees. The Company also redeems proprietary gift cards and gift certificates marketed by major premium/incentive companies. The Company records a liability when a gift card/certificate is purchased by the customer. As the gift card/certificate is redeemed by a customer, the Company reduces the liability and records revenue.
Vendor Rebates—The Company receives credits from vendors in connection with inventory purchases. The credits are separately negotiated with each vendor. Substantially all of these credits are earned in one of two ways: a) as a fixed percentage of purchases when an invoice is paid or b) as an agreed-upon amount in the month a new store is opened. There are no contingent minimum purchase amounts, milestones or other contingencies that are required to be met to earn the credits. The credits described in a) above are recorded as a reduction to inventories in the Consolidated Balance Sheet as the inventories are purchased and the credits described in b) above are recorded as a reduction to inventories as new stores are opened. In both cases, the credits are recognized as reductions to cost of goods sold as the product is sold.
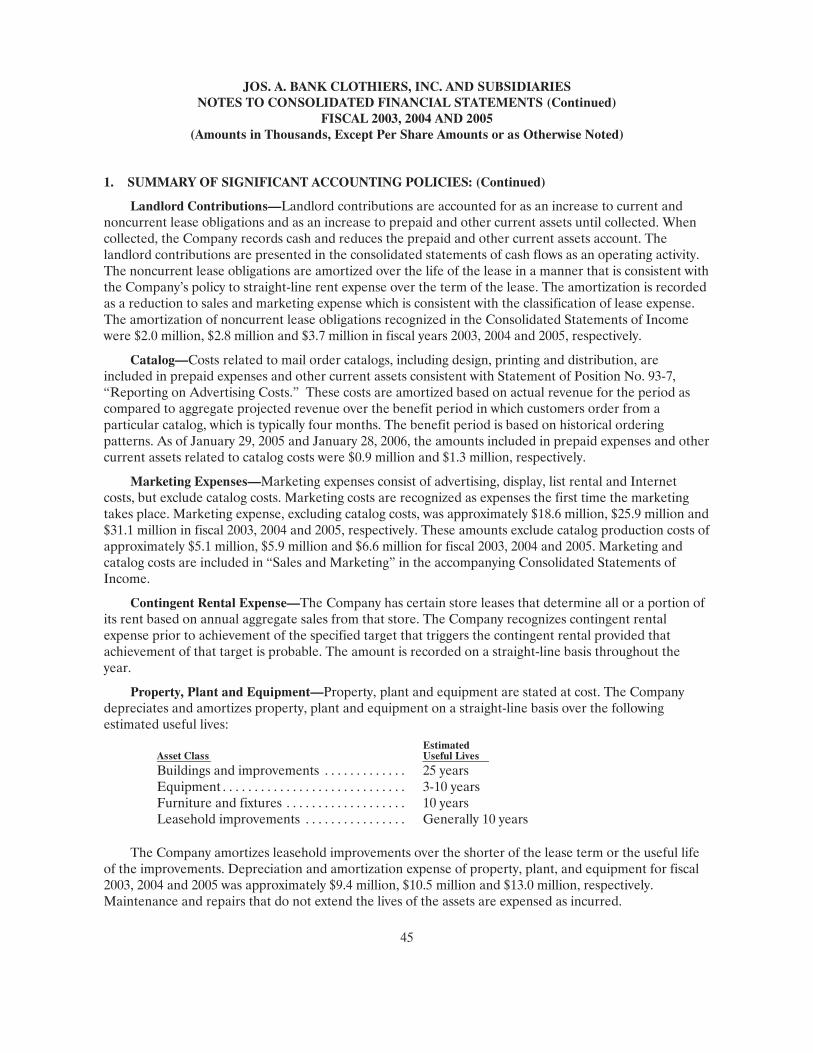
JOS. A. BANK CLOTHIERS, INC. AND SUBSIDIARIES NOTES TO CONSOLIDATED FINANCIAL STATEMENTS (Continued)
FISCAL 2003, 2004 AND 2005 (Amounts in Thousands, Except Per Share Amounts or as Otherwise Noted)
45
1. SUMMARY OF SIGNIFICANT ACCOUNTING POLICIES: (Continued)
Landlord Contributions—Landlord contributions are accounted for as an increase to current and noncurrent lease obligations and as an increase to prepaid and other current assets until collected. When collected, the Company records cash and reduces the prepaid and other current assets account. The landlord contributions are presented in the consolidated statements of cash flows as an operating activity. The noncurrent lease obligations are amortized over the life of the lease in a manner that is consistent with the Company’s policy to straight-line rent expense over the term of the lease. The amortization is recorded as a reduction to sales and marketing expense which is consistent with the classification of lease expense. The amortization of noncurrent lease obligations recognized in the Consolidated Statements of Income were $2.0 million, $2.8 million and $3.7 million in fiscal years 2003, 2004 and 2005, respectively.
Catalog—Costs related to mail order catalogs, including design, printing and distribution, are included in prepaid expenses and other current assets consistent with Statement of Position No. 93-7, “Reporting on Advertising Costs.” These costs are amortized based on actual revenue for the period as compared to aggregate projected revenue over the benefit period in which customers order from a particular catalog, which is typically four months. The benefit period is based on historical ordering patterns. As of January 29, 2005 and January 28, 2006, the amounts included in prepaid expenses and other current assets related to catalog costs were $0.9 million and $1.3 million, respectively.
Marketing Expenses—Marketing expenses consist of advertising, display, list rental and Internet costs, but exclude catalog costs. Marketing costs are recognized as expenses the first time the marketing takes place. Marketing expense, excluding catalog costs, was approximately $18.6 million, $25.9 million and $31.1 million in fiscal 2003, 2004 and 2005, respectively. These amounts exclude catalog production costs of approximately $5.1 million, $5.9 million and $6.6 million for fiscal 2003, 2004 and 2005. Marketing and catalog costs are included in “Sales and Marketing” in the accompanying Consolidated Statements of Income.
Contingent Rental Expense—The Company has certain store leases that determine all or a portion of its rent based on annual aggregate sales from that store. The Company recognizes contingent rental expense prior to achievement of the specified target that triggers the contingent rental provided that achievement of that target is probable. The amount is recorded on a straight-line basis throughout the year.
Property, Plant and Equipment—Property, plant and equipment are stated at cost. The Company depreciates and amortizes property, plant and equipment on a straight-line basis over the following estimated useful lives:
Asset Class Estimated Useful Lives
Buildings and improvements . . . . . . . . . . . . . 25 years Equipment . . . . . . . . . . . . . . . . . . . . . . . . . . . . . 3-10 years Furniture and fixtures . . . . . . . . . . . . . . . . . . . 10 years Leasehold improvements . . . . . . . . . . . . . . . . Generally 10 years
The Company amortizes leasehold improvements over the shorter of the lease term or the useful life of the improvements. Depreciation and amortization expense of property, plant, and equipment for fiscal 2003, 2004 and 2005 was approximately $9.4 million, $10.5 million and $13.0 million, respectively. Maintenance and repairs that do not extend the lives of the assets are expensed as incurred.
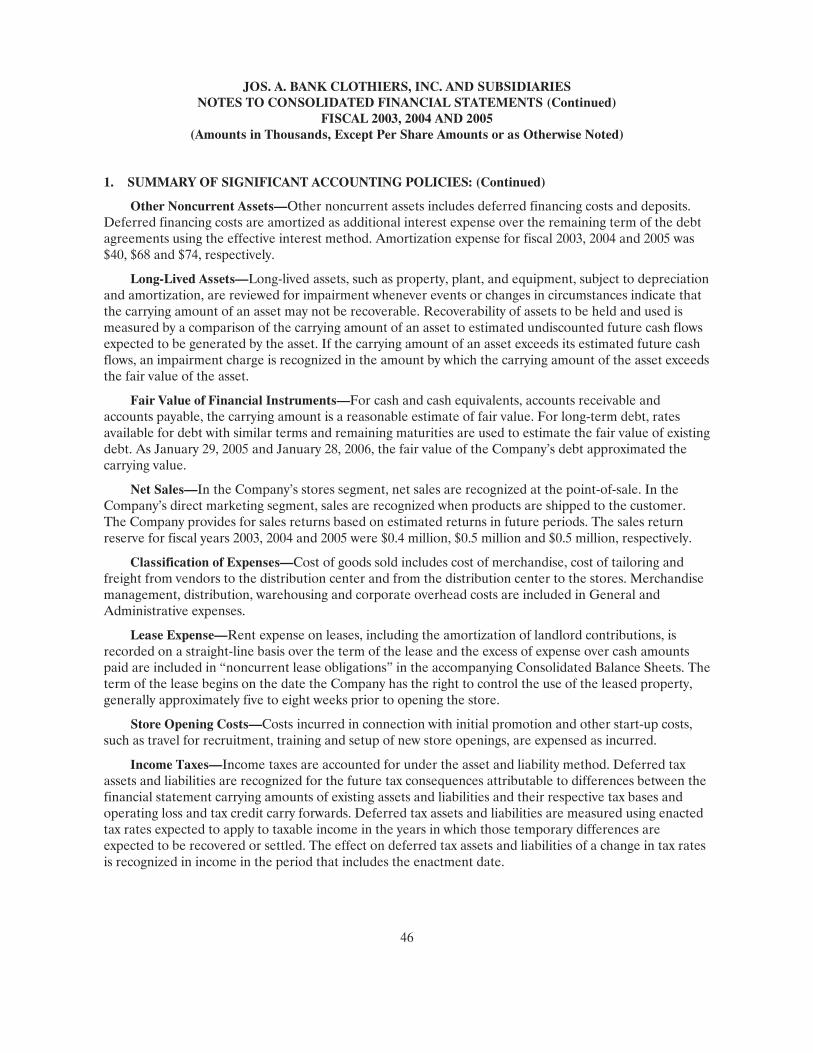
JOS. A. BANK CLOTHIERS, INC. AND SUBSIDIARIES NOTES TO CONSOLIDATED FINANCIAL STATEMENTS (Continued)
FISCAL 2003, 2004 AND 2005 (Amounts in Thousands, Except Per Share Amounts or as Otherwise Noted)
46
1. SUMMARY OF SIGNIFICANT ACCOUNTING POLICIES: (Continued)
Other Noncurrent Assets—Other noncurrent assets includes deferred financing costs and deposits. Deferred financing costs are amortized as additional interest expense over the remaining term of the debt agreements using the effective interest method. Amortization expense for fiscal 2003, 2004 and 2005 was $40, $68 and $74, respectively.
Long-Lived Assets—Long-lived assets, such as property, plant, and equipment, subject to depreciation and amortization, are reviewed for impairment whenever events or changes in circumstances indicate that the carrying amount of an asset may not be recoverable. Recoverability of assets to be held and used is measured by a comparison of the carrying amount of an asset to estimated undiscounted future cash flows expected to be generated by the asset. If the carrying amount of an asset exceeds its estimated future cash flows, an impairment charge is recognized in the amount by which the carrying amount of the asset exceeds the fair value of the asset.
Fair Value of Financial Instruments—For cash and cash equivalents, accounts receivable and accounts payable, the carrying amount is a reasonable estimate of fair value. For long-term debt, rates available for debt with similar terms and remaining maturities are used to estimate the fair value of existing debt. As January 29, 2005 and January 28, 2006, the fair value of the Company’s debt approximated the carrying value.
Net Sales—In the Company’s stores segment, net sales are recognized at the point-of-sale. In the Company’s direct marketing segment, sales are recognized when products are shipped to the customer. The Company provides for sales returns based on estimated returns in future periods. The sales return reserve for fiscal years 2003, 2004 and 2005 were $0.4 million, $0.5 million and $0.5 million, respectively.
Classification of Expenses—Cost of goods sold includes cost of merchandise, cost of tailoring and freight from vendors to the distribution center and from the distribution center to the stores. Merchandise management, distribution, warehousing and corporate overhead costs are included in General and Administrative expenses.
Lease Expense—Rent expense on leases, including the amortization of landlord contributions, is recorded on a straight-line basis over the term of the lease and the excess of expense over cash amounts paid are included in “noncurrent lease obligations” in the accompanying Consolidated Balance Sheets. The term of the lease begins on the date the Company has the right to control the use of the leased property, generally approximately five to eight weeks prior to opening the store.
Store Opening Costs—Costs incurred in connection with initial promotion and other start-up costs, such as travel for recruitment, training and setup of new store openings, are expensed as incurred.
Income Taxes—Income taxes are accounted for under the asset and liability method. Deferred tax assets and liabilities are recognized for the future tax consequences attributable to differences between the financial statement carrying amounts of existing assets and liabilities and their respective tax bases and operating loss and tax credit carry forwards. Deferred tax assets and liabilities are measured using enacted tax rates expected to apply to taxable income in the years in which those temporary differences are expected to be recovered or settled. The effect on deferred tax assets and liabilities of a change in tax rates is recognized in income in the period that includes the enactment date.
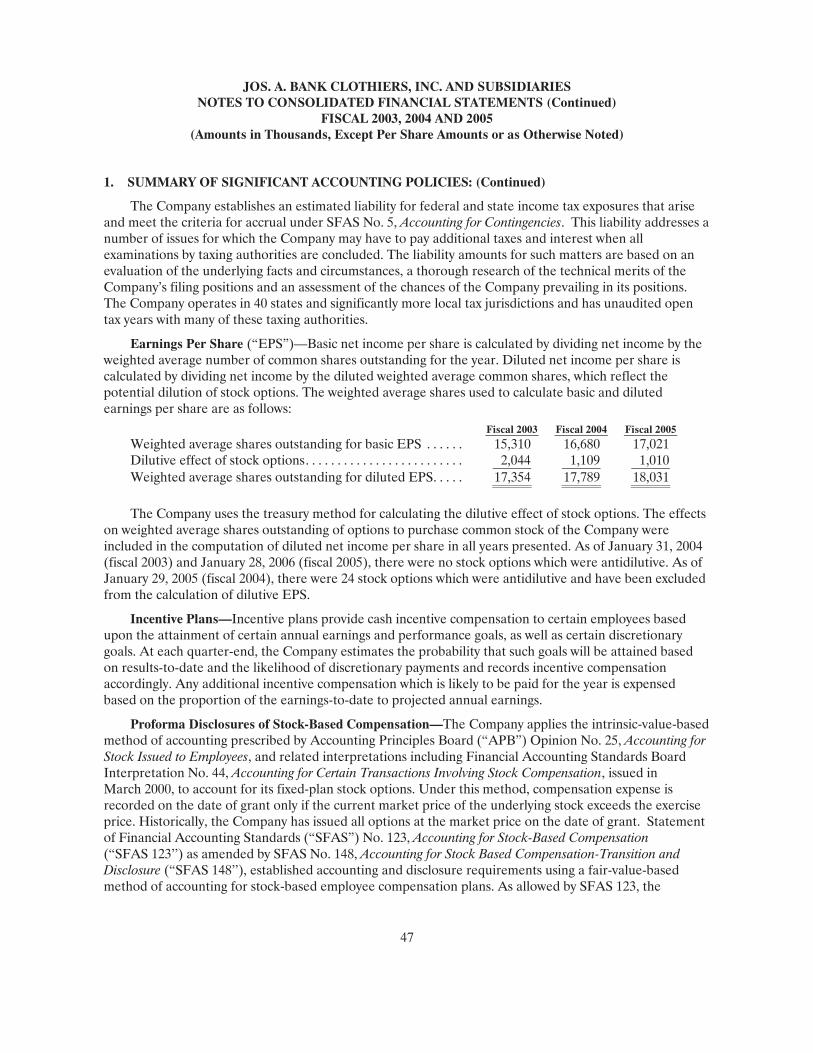
JOS. A. BANK CLOTHIERS, INC. AND SUBSIDIARIES NOTES TO CONSOLIDATED FINANCIAL STATEMENTS (Continued)
FISCAL 2003, 2004 AND 2005 (Amounts in Thousands, Except Per Share Amounts or as Otherwise Noted)
47
1. SUMMARY OF SIGNIFICANT ACCOUNTING POLICIES: (Continued)
The Company establishes an estimated liability for federal and state income tax exposures that arise and meet the criteria for accrual under SFAS No. 5, Accounting for Contingencies. This liability addresses a number of issues for which the Company may have to pay additional taxes and interest when all examinations by taxing authorities are concluded. The liability amounts for such matters are based on an evaluation of the underlying facts and circumstances, a thorough research of the technical merits of the Company’s filing positions and an assessment of the chances of the Company prevailing in its positions. The Company operates in 40 states and significantly more local tax jurisdictions and has unaudited open tax years with many of these taxing authorities.
Earnings Per Share (“EPS”)—Basic net income per share is calculated by dividing net income by the weighted average number of common shares outstanding for the year. Diluted net income per share is calculated by dividing net income by the diluted weighted average common shares, which reflect the potential dilution of stock options. The weighted average shares used to calculate basic and diluted earnings per share are as follows:
Fiscal 2003 Fiscal 2004 Fiscal 2005Weighted average shares outstanding for basic EPS . . . . . . 15,310 16,680 17,021 Dilutive effect of stock options. . . . . . . . . . . . . . . . . . . . . . . . . 2,044 1,109 1,010 Weighted average shares outstanding for diluted EPS. . . . . 17,354 17,789 18,031
The Company uses the treasury method for calculating the dilutive effect of stock options. The effects on weighted average shares outstanding of options to purchase common stock of the Company were included in the computation of diluted net income per share in all years presented. As of January 31, 2004 (fiscal 2003) and January 28, 2006 (fiscal 2005), there were no stock options which were antidilutive. As of January 29, 2005 (fiscal 2004), there were 24 stock options which were antidilutive and have been excluded from the calculation of dilutive EPS.
Incentive Plans—Incentive plans provide cash incentive compensation to certain employees based upon the attainment of certain annual earnings and performance goals, as well as certain discretionary goals. At each quarter-end, the Company estimates the probability that such goals will be attained based on results-to-date and the likelihood of discretionary payments and records incentive compensation accordingly. Any additional incentive compensation which is likely to be paid for the year is expensed based on the proportion of the earnings-to-date to projected annual earnings.
Proforma Disclosures of Stock-Based Compensation—The Company applies the intrinsic-value-based method of accounting prescribed by Accounting Principles Board (“APB”) Opinion No. 25, Accounting for Stock Issued to Employees, and related interpretations including Financial Accounting Standards Board Interpretation No. 44, Accounting for Certain Transactions Involving Stock Compensation, issued in March 2000, to account for its fixed-plan stock options. Under this method, compensation expense is recorded on the date of grant only if the current market price of the underlying stock exceeds the exercise price. Historically, the Company has issued all options at the market price on the date of grant. Statement of Financial Accounting Standards (“SFAS”) No. 123, Accounting for Stock-Based Compensation (“SFAS 123’’) as amended by SFAS No. 148, Accounting for Stock Based Compensation-Transition and Disclosure (“SFAS 148’’), established accounting and disclosure requirements using a fair-value-based method of accounting for stock-based employee compensation plans. As allowed by SFAS 123, the
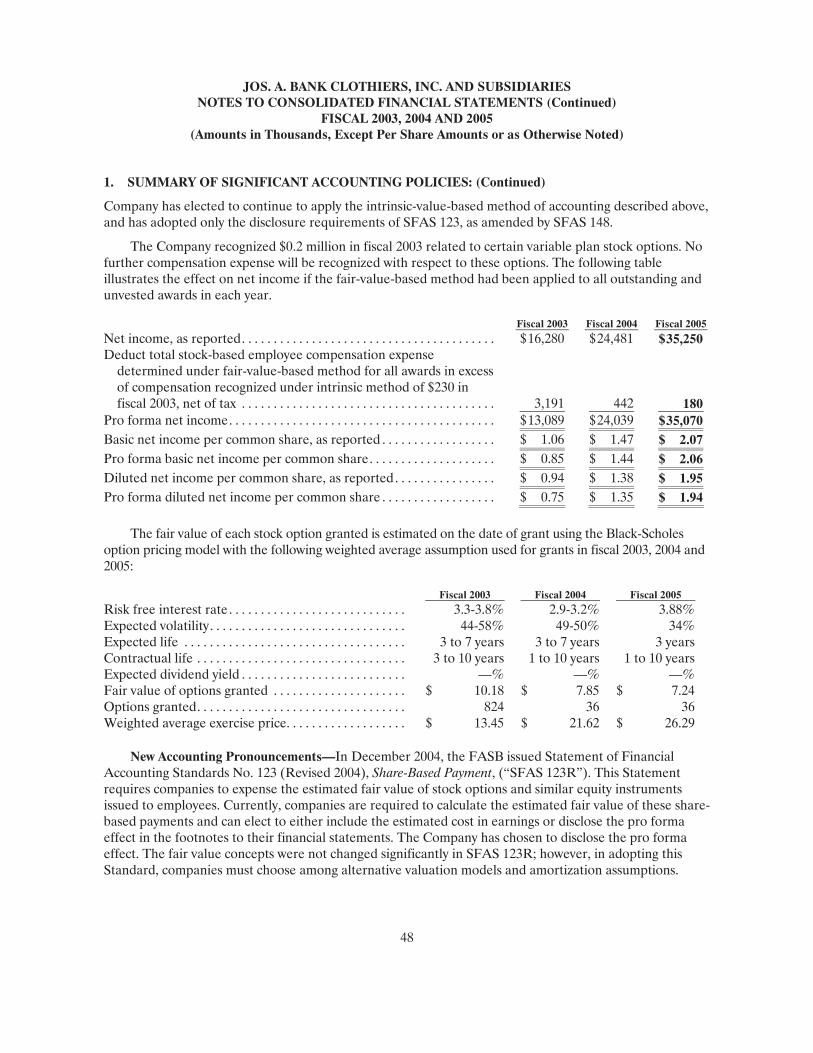
JOS. A. BANK CLOTHIERS, INC. AND SUBSIDIARIES NOTES TO CONSOLIDATED FINANCIAL STATEMENTS (Continued)
FISCAL 2003, 2004 AND 2005 (Amounts in Thousands, Except Per Share Amounts or as Otherwise Noted)
48
1. SUMMARY OF SIGNIFICANT ACCOUNTING POLICIES: (Continued)
Company has elected to continue to apply the intrinsic-value-based method of accounting described above, and has adopted only the disclosure requirements of SFAS 123, as amended by SFAS 148.
The Company recognized $0.2 million in fiscal 2003 related to certain variable plan stock options. No further compensation expense will be recognized with respect to these options. The following table illustrates the effect on net income if the fair-value-based method had been applied to all outstanding and unvested awards in each year.
Fiscal 2003 Fiscal 2004 Fiscal 2005Net income, as reported. . . . . . . . . . . . . . . . . . . . . . . . . . . . . . . . . . . . . . . . $ 16,280 $ 24,481 $ 35,250Deduct total stock-based employee compensation expense
determined under fair-value-based method for all awards in excess of compensation recognized under intrinsic method of $230 in fiscal 2003, net of tax . . . . . . . . . . . . . . . . . . . . . . . . . . . . . . . . . . . . . . . . 3,191 442 180
Pro forma net income. . . . . . . . . . . . . . . . . . . . . . . . . . . . . . . . . . . . . . . . . . $ 13,089 $ 24,039 $ 35,070Basic net income per common share, as reported . . . . . . . . . . . . . . . . . . $ 1.06 $ 1.47 $ 2.07Pro forma basic net income per common share. . . . . . . . . . . . . . . . . . . . $ 0.85 $ 1.44 $ 2.06Diluted net income per common share, as reported. . . . . . . . . . . . . . . . $ 0.94 $ 1.38 $ 1.95Pro forma diluted net income per common share . . . . . . . . . . . . . . . . . . $ 0.75 $ 1.35 $ 1.94
The fair value of each stock option granted is estimated on the date of grant using the Black-Scholes option pricing model with the following weighted average assumption used for grants in fiscal 2003, 2004 and 2005:
Fiscal 2003 Fiscal 2004 Fiscal 2005 Risk free interest rate . . . . . . . . . . . . . . . . . . . . . . . . . . . . 3.3-3.8% 2.9-3.2% 3.88% Expected volatility. . . . . . . . . . . . . . . . . . . . . . . . . . . . . . . 44-58% 49-50% 34% Expected life . . . . . . . . . . . . . . . . . . . . . . . . . . . . . . . . . . . 3 to 7 years 3 to 7 years 3 years Contractual life . . . . . . . . . . . . . . . . . . . . . . . . . . . . . . . . . 3 to 10 years 1 to 10 years 1 to 10 years Expected dividend yield . . . . . . . . . . . . . . . . . . . . . . . . . . —% —% —% Fair value of options granted . . . . . . . . . . . . . . . . . . . . . $ 10.18 $ 7.85 $ 7.24 Options granted. . . . . . . . . . . . . . . . . . . . . . . . . . . . . . . . . 824 36 36 Weighted average exercise price. . . . . . . . . . . . . . . . . . . $ 13.45 $ 21.62 $ 26.29
New Accounting Pronouncements—In December 2004, the FASB issued Statement of Financial Accounting Standards No. 123 (Revised 2004), Share-Based Payment, (“SFAS 123R”). This Statement requires companies to expense the estimated fair value of stock options and similar equity instruments issued to employees. Currently, companies are required to calculate the estimated fair value of these share-based payments and can elect to either include the estimated cost in earnings or disclose the pro forma effect in the footnotes to their financial statements. The Company has chosen to disclose the pro forma effect. The fair value concepts were not changed significantly in SFAS 123R; however, in adopting this Standard, companies must choose among alternative valuation models and amortization assumptions.
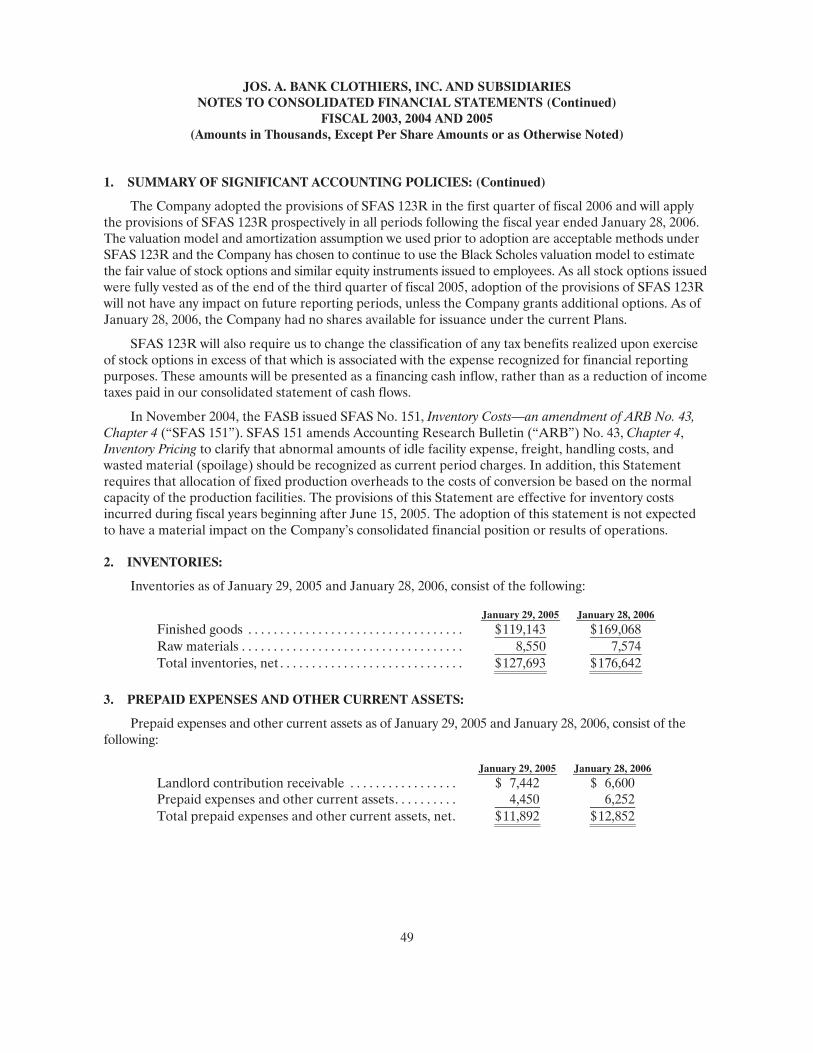
JOS. A. BANK CLOTHIERS, INC. AND SUBSIDIARIES NOTES TO CONSOLIDATED FINANCIAL STATEMENTS (Continued)
FISCAL 2003, 2004 AND 2005 (Amounts in Thousands, Except Per Share Amounts or as Otherwise Noted)
49
1. SUMMARY OF SIGNIFICANT ACCOUNTING POLICIES: (Continued)
The Company adopted the provisions of SFAS 123R in the first quarter of fiscal 2006 and will apply the provisions of SFAS 123R prospectively in all periods following the fiscal year ended January 28, 2006. The valuation model and amortization assumption we used prior to adoption are acceptable methods under SFAS 123R and the Company has chosen to continue to use the Black Scholes valuation model to estimate the fair value of stock options and similar equity instruments issued to employees. As all stock options issued were fully vested as of the end of the third quarter of fiscal 2005, adoption of the provisions of SFAS 123R will not have any impact on future reporting periods, unless the Company grants additional options. As of January 28, 2006, the Company had no shares available for issuance under the current Plans.
SFAS 123R will also require us to change the classification of any tax benefits realized upon exercise of stock options in excess of that which is associated with the expense recognized for financial reporting purposes. These amounts will be presented as a financing cash inflow, rather than as a reduction of income taxes paid in our consolidated statement of cash flows.
In November 2004, the FASB issued SFAS No. 151, Inventory Costs—an amendment of ARB No. 43, Chapter 4 (“SFAS 151”). SFAS 151 amends Accounting Research Bulletin (“ARB”) No. 43, Chapter 4, Inventory Pricing to clarify that abnormal amounts of idle facility expense, freight, handling costs, and wasted material (spoilage) should be recognized as current period charges. In addition, this Statement requires that allocation of fixed production overheads to the costs of conversion be based on the normal capacity of the production facilities. The provisions of this Statement are effective for inventory costs incurred during fiscal years beginning after June 15, 2005. The adoption of this statement is not expected to have a material impact on the Company’s consolidated financial position or results of operations.
2. INVENTORIES:
Inventories as of January 29, 2005 and January 28, 2006, consist of the following:
January 29, 2005 January 28, 2006Finished goods . . . . . . . . . . . . . . . . . . . . . . . . . . . . . . . . . . $ 119,143 $ 169,068 Raw materials . . . . . . . . . . . . . . . . . . . . . . . . . . . . . . . . . . . 8,550 7,574 Total inventories, net . . . . . . . . . . . . . . . . . . . . . . . . . . . . . $ 127,693 $ 176,642
3. PREPAID EXPENSES AND OTHER CURRENT ASSETS:
Prepaid expenses and other current assets as of January 29, 2005 and January 28, 2006, consist of the following:
January 29, 2005 January 28, 2006 Landlord contribution receivable . . . . . . . . . . . . . . . . . $ 7,442 $ 6,600 Prepaid expenses and other current assets. . . . . . . . . . 4,450 6,252 Total prepaid expenses and other current assets, net. $ 11,892 $ 12,852
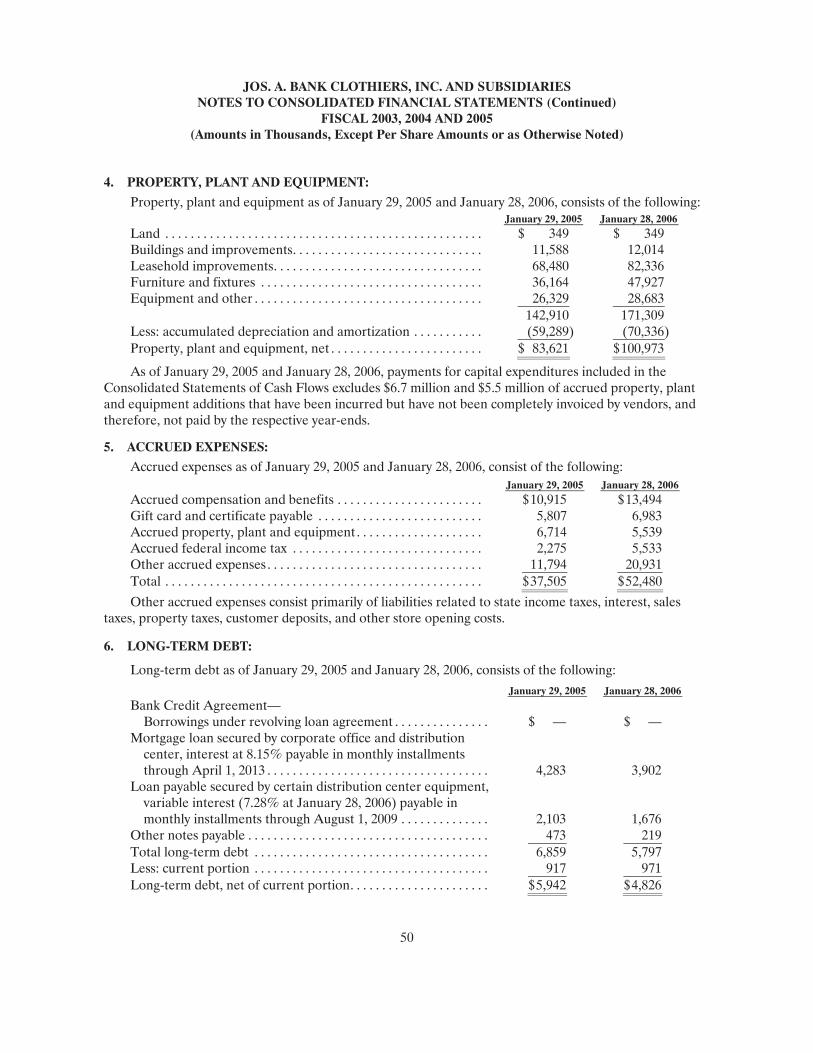
JOS. A. BANK CLOTHIERS, INC. AND SUBSIDIARIES NOTES TO CONSOLIDATED FINANCIAL STATEMENTS (Continued)
FISCAL 2003, 2004 AND 2005 (Amounts in Thousands, Except Per Share Amounts or as Otherwise Noted)
50
4. PROPERTY, PLANT AND EQUIPMENT:
Property, plant and equipment as of January 29, 2005 and January 28, 2006, consists of the following: January 29, 2005 January 28, 2006
Land . . . . . . . . . . . . . . . . . . . . . . . . . . . . . . . . . . . . . . . . . . . . . . . . . . $ 349 $ 349 Buildings and improvements. . . . . . . . . . . . . . . . . . . . . . . . . . . . . . 11,588 12,014 Leasehold improvements. . . . . . . . . . . . . . . . . . . . . . . . . . . . . . . . . 68,480 82,336 Furniture and fixtures . . . . . . . . . . . . . . . . . . . . . . . . . . . . . . . . . . . 36,164 47,927 Equipment and other . . . . . . . . . . . . . . . . . . . . . . . . . . . . . . . . . . . . 26,329 28,683 142,910 171,309 Less: accumulated depreciation and amortization . . . . . . . . . . . (59,289) (70,336) Property, plant and equipment, net . . . . . . . . . . . . . . . . . . . . . . . . $ 83,621 $ 100,973
As of January 29, 2005 and January 28, 2006, payments for capital expenditures included in the Consolidated Statements of Cash Flows excludes $6.7 million and $5.5 million of accrued property, plant and equipment additions that have been incurred but have not been completely invoiced by vendors, and therefore, not paid by the respective year-ends.
5. ACCRUED EXPENSES:
Accrued expenses as of January 29, 2005 and January 28, 2006, consist of the following: January 29, 2005 January 28, 2006
Accrued compensation and benefits . . . . . . . . . . . . . . . . . . . . . . . $ 10,915 $ 13,494 Gift card and certificate payable . . . . . . . . . . . . . . . . . . . . . . . . . . 5,807 6,983 Accrued property, plant and equipment . . . . . . . . . . . . . . . . . . . . 6,714 5,539 Accrued federal income tax . . . . . . . . . . . . . . . . . . . . . . . . . . . . . . 2,275 5,533 Other accrued expenses . . . . . . . . . . . . . . . . . . . . . . . . . . . . . . . . . . 11,794 20,931 Total . . . . . . . . . . . . . . . . . . . . . . . . . . . . . . . . . . . . . . . . . . . . . . . . . . $ 37,505 $ 52,480
Other accrued expenses consist primarily of liabilities related to state income taxes, interest, sales taxes, property taxes, customer deposits, and other store opening costs.
6. LONG-TERM DEBT:
Long-term debt as of January 29, 2005 and January 28, 2006, consists of the following: January 29, 2005 January 28, 2006
Bank Credit Agreement— Borrowings under revolving loan agreement . . . . . . . . . . . . . . . $ — $ —
Mortgage loan secured by corporate office and distribution center, interest at 8.15% payable in monthly installments through April 1, 2013 . . . . . . . . . . . . . . . . . . . . . . . . . . . . . . . . . . . 4,283 3,902
Loan payable secured by certain distribution center equipment, variable interest (7.28% at January 28, 2006) payable in monthly installments through August 1, 2009 . . . . . . . . . . . . . . 2,103 1,676
Other notes payable . . . . . . . . . . . . . . . . . . . . . . . . . . . . . . . . . . . . . . 473 219 Total long-term debt . . . . . . . . . . . . . . . . . . . . . . . . . . . . . . . . . . . . . 6,859 5,797 Less: current portion . . . . . . . . . . . . . . . . . . . . . . . . . . . . . . . . . . . . . 917 971 Long-term debt, net of current portion. . . . . . . . . . . . . . . . . . . . . . $ 5,942 $ 4,826
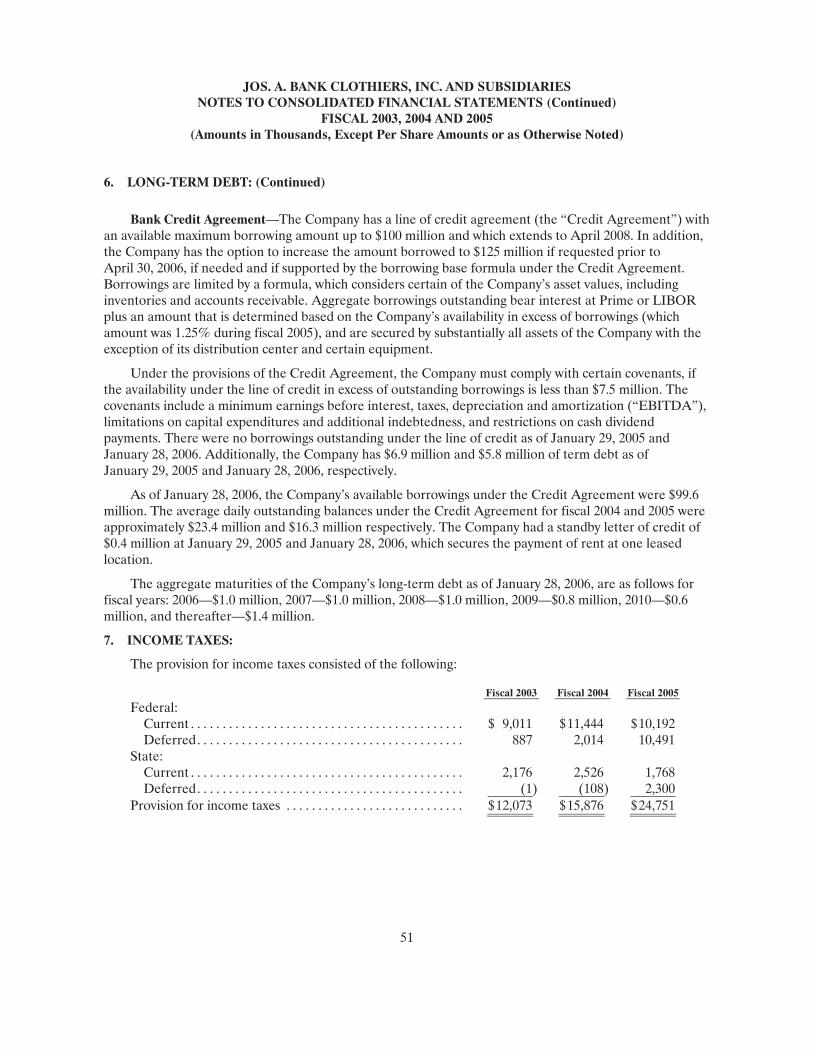
JOS. A. BANK CLOTHIERS, INC. AND SUBSIDIARIES NOTES TO CONSOLIDATED FINANCIAL STATEMENTS (Continued)
FISCAL 2003, 2004 AND 2005 (Amounts in Thousands, Except Per Share Amounts or as Otherwise Noted)
51
6. LONG-TERM DEBT: (Continued)
Bank Credit Agreement—The Company has a line of credit agreement (the “Credit Agreement”) with an available maximum borrowing amount up to $100 million and which extends to April 2008. In addition, the Company has the option to increase the amount borrowed to $125 million if requested prior to April 30, 2006, if needed and if supported by the borrowing base formula under the Credit Agreement. Borrowings are limited by a formula, which considers certain of the Company’s asset values, including inventories and accounts receivable. Aggregate borrowings outstanding bear interest at Prime or LIBOR plus an amount that is determined based on the Company’s availability in excess of borrowings (which amount was 1.25% during fiscal 2005), and are secured by substantially all assets of the Company with the exception of its distribution center and certain equipment.
Under the provisions of the Credit Agreement, the Company must comply with certain covenants, if the availability under the line of credit in excess of outstanding borrowings is less than $7.5 million. The covenants include a minimum earnings before interest, taxes, depreciation and amortization (“EBITDA”), limitations on capital expenditures and additional indebtedness, and restrictions on cash dividend payments. There were no borrowings outstanding under the line of credit as of January 29, 2005 and January 28, 2006. Additionally, the Company has $6.9 million and $5.8 million of term debt as of January 29, 2005 and January 28, 2006, respectively.
As of January 28, 2006, the Company’s available borrowings under the Credit Agreement were $99.6 million. The average daily outstanding balances under the Credit Agreement for fiscal 2004 and 2005 were approximately $23.4 million and $16.3 million respectively. The Company had a standby letter of credit of $0.4 million at January 29, 2005 and January 28, 2006, which secures the payment of rent at one leased location.
The aggregate maturities of the Company’s long-term debt as of January 28, 2006, are as follows for fiscal years: 2006—$1.0 million, 2007—$1.0 million, 2008—$1.0 million, 2009—$0.8 million, 2010—$0.6 million, and thereafter—$1.4 million.
7. INCOME TAXES:
The provision for income taxes consisted of the following:
Fiscal 2003 Fiscal 2004 Fiscal 2005Federal:
Current . . . . . . . . . . . . . . . . . . . . . . . . . . . . . . . . . . . . . . . . . . . $ 9,011 $ 11,444 $ 10,192Deferred. . . . . . . . . . . . . . . . . . . . . . . . . . . . . . . . . . . . . . . . . . 887 2,014 10,491
State: Current . . . . . . . . . . . . . . . . . . . . . . . . . . . . . . . . . . . . . . . . . . . 2,176 2,526 1,768Deferred. . . . . . . . . . . . . . . . . . . . . . . . . . . . . . . . . . . . . . . . . . (1) (108 ) 2,300
Provision for income taxes . . . . . . . . . . . . . . . . . . . . . . . . . . . . $ 12,073 $ 15,876 $ 24,751
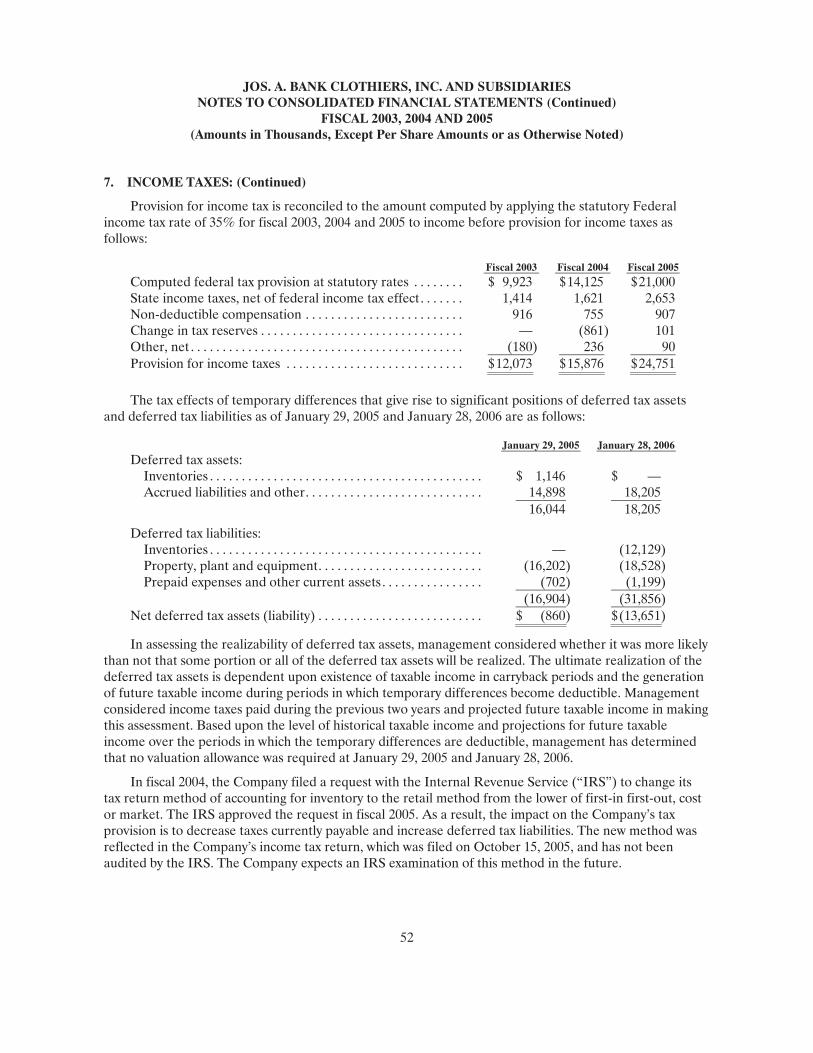
JOS. A. BANK CLOTHIERS, INC. AND SUBSIDIARIES NOTES TO CONSOLIDATED FINANCIAL STATEMENTS (Continued)
FISCAL 2003, 2004 AND 2005 (Amounts in Thousands, Except Per Share Amounts or as Otherwise Noted)
52
7. INCOME TAXES: (Continued)
Provision for income tax is reconciled to the amount computed by applying the statutory Federal income tax rate of 35% for fiscal 2003, 2004 and 2005 to income before provision for income taxes as follows:
Fiscal 2003 Fiscal 2004 Fiscal 2005Computed federal tax provision at statutory rates . . . . . . . . $ 9,923 $ 14,125 $ 21,000State income taxes, net of federal income tax effect. . . . . . . 1,414 1,621 2,653Non-deductible compensation . . . . . . . . . . . . . . . . . . . . . . . . . 916 755 907Change in tax reserves . . . . . . . . . . . . . . . . . . . . . . . . . . . . . . . . — (861 ) 101Other, net . . . . . . . . . . . . . . . . . . . . . . . . . . . . . . . . . . . . . . . . . . . (180) 236 90Provision for income taxes . . . . . . . . . . . . . . . . . . . . . . . . . . . . $ 12,073 $ 15,876 $ 24,751
The tax effects of temporary differences that give rise to significant positions of deferred tax assets and deferred tax liabilities as of January 29, 2005 and January 28, 2006 are as follows:
January 29, 2005 January 28, 2006Deferred tax assets:
Inventories . . . . . . . . . . . . . . . . . . . . . . . . . . . . . . . . . . . . . . . . . . . $ 1,146 $ — Accrued liabilities and other. . . . . . . . . . . . . . . . . . . . . . . . . . . . 14,898 18,205
16,044 18,205
Deferred tax liabilities: Inventories . . . . . . . . . . . . . . . . . . . . . . . . . . . . . . . . . . . . . . . . . . . — (12,129) Property, plant and equipment. . . . . . . . . . . . . . . . . . . . . . . . . . (16,202) (18,528) Prepaid expenses and other current assets . . . . . . . . . . . . . . . . (702) (1,199)
(16,904) (31,856) Net deferred tax assets (liability) . . . . . . . . . . . . . . . . . . . . . . . . . . $ (860) $ (13,651)
In assessing the realizability of deferred tax assets, management considered whether it was more likely than not that some portion or all of the deferred tax assets will be realized. The ultimate realization of the deferred tax assets is dependent upon existence of taxable income in carryback periods and the generation of future taxable income during periods in which temporary differences become deductible. Management considered income taxes paid during the previous two years and projected future taxable income in making this assessment. Based upon the level of historical taxable income and projections for future taxable income over the periods in which the temporary differences are deductible, management has determined that no valuation allowance was required at January 29, 2005 and January 28, 2006.
In fiscal 2004, the Company filed a request with the Internal Revenue Service (“IRS”) to change its tax return method of accounting for inventory to the retail method from the lower of first-in first-out, cost or market. The IRS approved the request in fiscal 2005. As a result, the impact on the Company’s tax provision is to decrease taxes currently payable and increase deferred tax liabilities. The new method was reflected in the Company’s income tax return, which was filed on October 15, 2005, and has not been audited by the IRS. The Company expects an IRS examination of this method in the future.
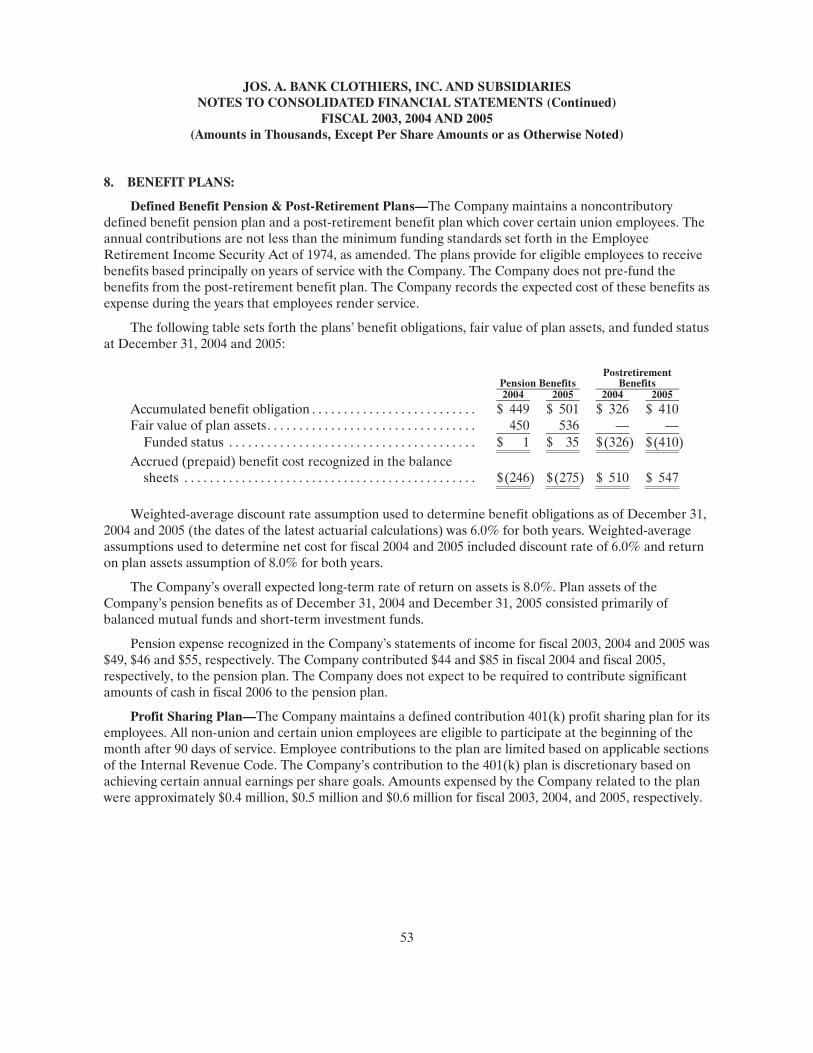
JOS. A. BANK CLOTHIERS, INC. AND SUBSIDIARIES NOTES TO CONSOLIDATED FINANCIAL STATEMENTS (Continued)
FISCAL 2003, 2004 AND 2005 (Amounts in Thousands, Except Per Share Amounts or as Otherwise Noted)
53
8. BENEFIT PLANS:
Defined Benefit Pension & Post-Retirement Plans—The Company maintains a noncontributory defined benefit pension plan and a post-retirement benefit plan which cover certain union employees. The annual contributions are not less than the minimum funding standards set forth in the Employee Retirement Income Security Act of 1974, as amended. The plans provide for eligible employees to receive benefits based principally on years of service with the Company. The Company does not pre-fund the benefits from the post-retirement benefit plan. The Company records the expected cost of these benefits as expense during the years that employees render service.
The following table sets forth the plans’ benefit obligations, fair value of plan assets, and funded status at December 31, 2004 and 2005:
Pension Benefits Postretirement
Benefits 2004 2005 2004 2005
Accumulated benefit obligation . . . . . . . . . . . . . . . . . . . . . . . . . . $ 449 $ 501 $ 326 $ 410Fair value of plan assets. . . . . . . . . . . . . . . . . . . . . . . . . . . . . . . . . 450 536 — —
Funded status . . . . . . . . . . . . . . . . . . . . . . . . . . . . . . . . . . . . . . . $ 1 $ 35 $ (326 ) $ (410)Accrued (prepaid) benefit cost recognized in the balance
sheets . . . . . . . . . . . . . . . . . . . . . . . . . . . . . . . . . . . . . . . . . . . . . . $ (246) $ (275 ) $ 510 $ 547
Weighted-average discount rate assumption used to determine benefit obligations as of December 31, 2004 and 2005 (the dates of the latest actuarial calculations) was 6.0% for both years. Weighted-average assumptions used to determine net cost for fiscal 2004 and 2005 included discount rate of 6.0% and return on plan assets assumption of 8.0% for both years.
The Company’s overall expected long-term rate of return on assets is 8.0%. Plan assets of the Company’s pension benefits as of December 31, 2004 and December 31, 2005 consisted primarily of balanced mutual funds and short-term investment funds.
Pension expense recognized in the Company’s statements of income for fiscal 2003, 2004 and 2005 was $49, $46 and $55, respectively. The Company contributed $44 and $85 in fiscal 2004 and fiscal 2005, respectively, to the pension plan. The Company does not expect to be required to contribute significant amounts of cash in fiscal 2006 to the pension plan.
Profit Sharing Plan—The Company maintains a defined contribution 401(k) profit sharing plan for its employees. All non-union and certain union employees are eligible to participate at the beginning of the month after 90 days of service. Employee contributions to the plan are limited based on applicable sections of the Internal Revenue Code. The Company’s contribution to the 401(k) plan is discretionary based on achieving certain annual earnings per share goals. Amounts expensed by the Company related to the plan were approximately $0.4 million, $0.5 million and $0.6 million for fiscal 2003, 2004, and 2005, respectively.
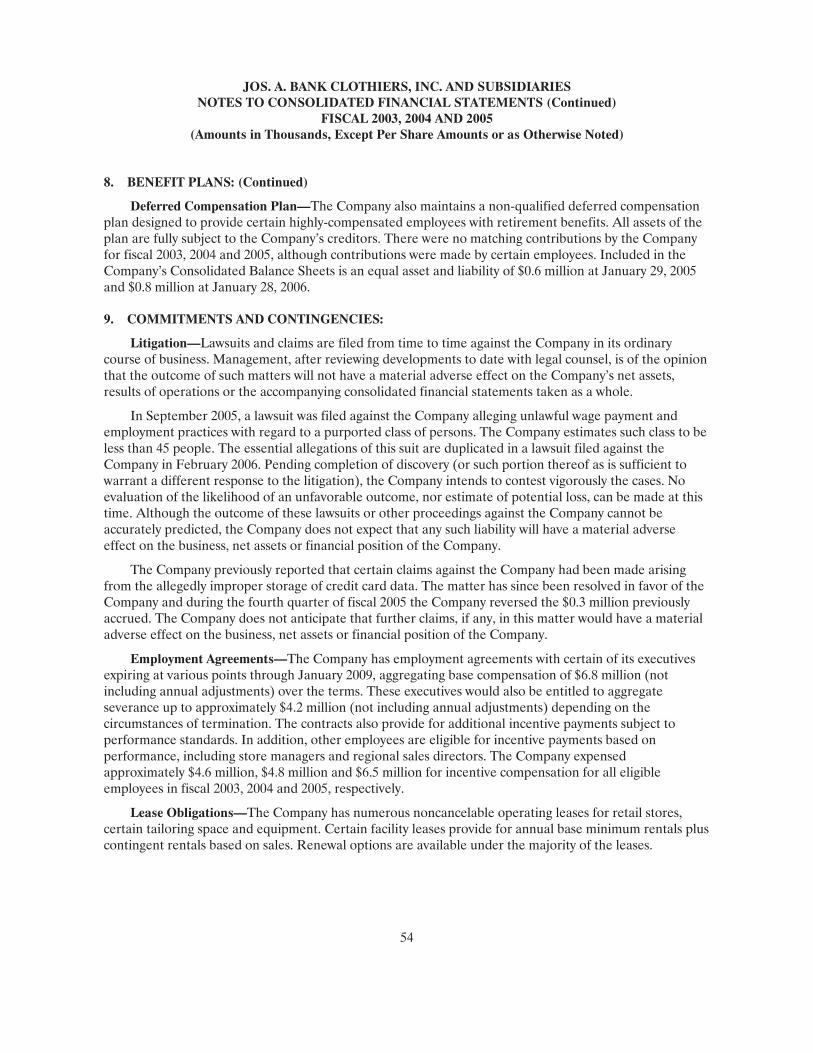
JOS. A. BANK CLOTHIERS, INC. AND SUBSIDIARIES NOTES TO CONSOLIDATED FINANCIAL STATEMENTS (Continued)
FISCAL 2003, 2004 AND 2005 (Amounts in Thousands, Except Per Share Amounts or as Otherwise Noted)
54
8. BENEFIT PLANS: (Continued)
Deferred Compensation Plan—The Company also maintains a non-qualified deferred compensation plan designed to provide certain highly-compensated employees with retirement benefits. All assets of the plan are fully subject to the Company’s creditors. There were no matching contributions by the Company for fiscal 2003, 2004 and 2005, although contributions were made by certain employees. Included in the Company’s Consolidated Balance Sheets is an equal asset and liability of $0.6 million at January 29, 2005 and $0.8 million at January 28, 2006.
9. COMMITMENTS AND CONTINGENCIES:
Litigation—Lawsuits and claims are filed from time to time against the Company in its ordinary course of business. Management, after reviewing developments to date with legal counsel, is of the opinion that the outcome of such matters will not have a material adverse effect on the Company’s net assets, results of operations or the accompanying consolidated financial statements taken as a whole.
In September 2005, a lawsuit was filed against the Company alleging unlawful wage payment and employment practices with regard to a purported class of persons. The Company estimates such class to be less than 45 people. The essential allegations of this suit are duplicated in a lawsuit filed against the Company in February 2006. Pending completion of discovery (or such portion thereof as is sufficient to warrant a different response to the litigation), the Company intends to contest vigorously the cases. No evaluation of the likelihood of an unfavorable outcome, nor estimate of potential loss, can be made at this time. Although the outcome of these lawsuits or other proceedings against the Company cannot be accurately predicted, the Company does not expect that any such liability will have a material adverse effect on the business, net assets or financial position of the Company.
The Company previously reported that certain claims against the Company had been made arising from the allegedly improper storage of credit card data. The matter has since been resolved in favor of the Company and during the fourth quarter of fiscal 2005 the Company reversed the $0.3 million previously accrued. The Company does not anticipate that further claims, if any, in this matter would have a material adverse effect on the business, net assets or financial position of the Company.
Employment Agreements—The Company has employment agreements with certain of its executives expiring at various points through January 2009, aggregating base compensation of $6.8 million (not including annual adjustments) over the terms. These executives would also be entitled to aggregate severance up to approximately $4.2 million (not including annual adjustments) depending on the circumstances of termination. The contracts also provide for additional incentive payments subject to performance standards. In addition, other employees are eligible for incentive payments based on performance, including store managers and regional sales directors. The Company expensed approximately $4.6 million, $4.8 million and $6.5 million for incentive compensation for all eligible employees in fiscal 2003, 2004 and 2005, respectively.
Lease Obligations—The Company has numerous noncancelable operating leases for retail stores, certain tailoring space and equipment. Certain facility leases provide for annual base minimum rentals plus contingent rentals based on sales. Renewal options are available under the majority of the leases.
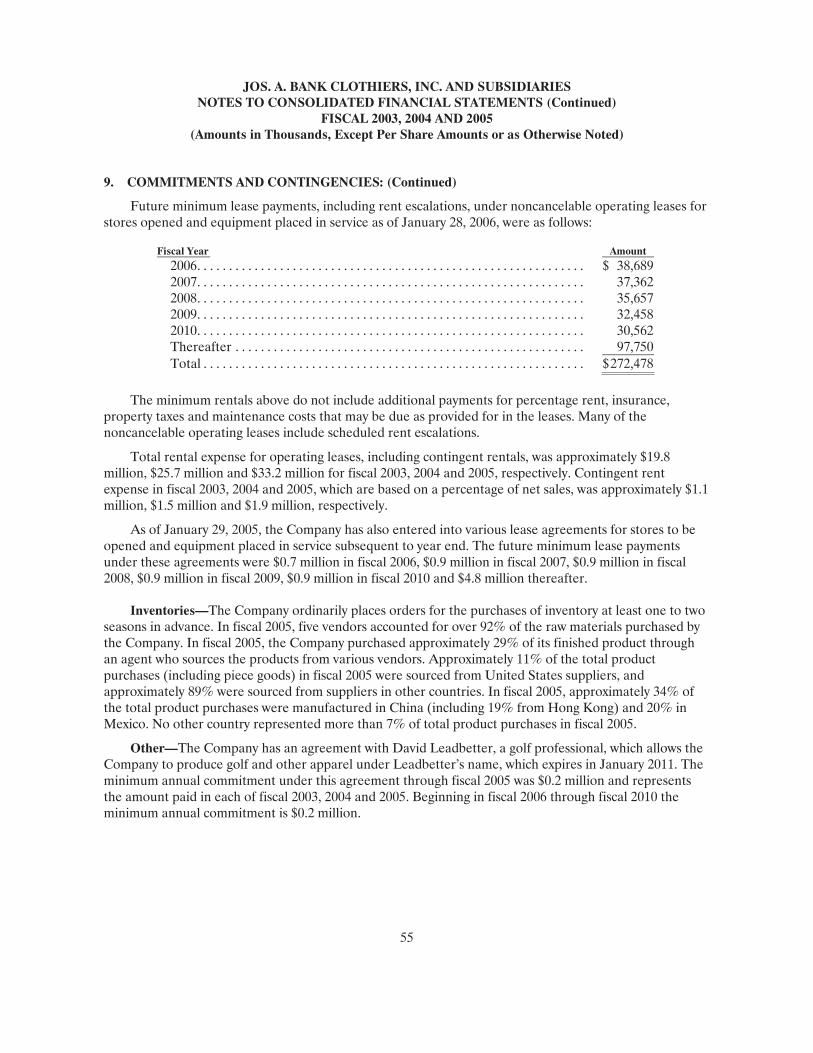
JOS. A. BANK CLOTHIERS, INC. AND SUBSIDIARIES NOTES TO CONSOLIDATED FINANCIAL STATEMENTS (Continued)
FISCAL 2003, 2004 AND 2005 (Amounts in Thousands, Except Per Share Amounts or as Otherwise Noted)
55
9. COMMITMENTS AND CONTINGENCIES: (Continued)
Future minimum lease payments, including rent escalations, under noncancelable operating leases for stores opened and equipment placed in service as of January 28, 2006, were as follows:
Fiscal Year Amount 2006. . . . . . . . . . . . . . . . . . . . . . . . . . . . . . . . . . . . . . . . . . . . . . . . . . . . . . . . . . . . . $ 38,689 2007. . . . . . . . . . . . . . . . . . . . . . . . . . . . . . . . . . . . . . . . . . . . . . . . . . . . . . . . . . . . . 37,362 2008. . . . . . . . . . . . . . . . . . . . . . . . . . . . . . . . . . . . . . . . . . . . . . . . . . . . . . . . . . . . . 35,657 2009. . . . . . . . . . . . . . . . . . . . . . . . . . . . . . . . . . . . . . . . . . . . . . . . . . . . . . . . . . . . . 32,458 2010. . . . . . . . . . . . . . . . . . . . . . . . . . . . . . . . . . . . . . . . . . . . . . . . . . . . . . . . . . . . . 30,562 Thereafter . . . . . . . . . . . . . . . . . . . . . . . . . . . . . . . . . . . . . . . . . . . . . . . . . . . . . . . 97,750 Total . . . . . . . . . . . . . . . . . . . . . . . . . . . . . . . . . . . . . . . . . . . . . . . . . . . . . . . . . . . . $ 272,478
The minimum rentals above do not include additional payments for percentage rent, insurance, property taxes and maintenance costs that may be due as provided for in the leases. Many of the noncancelable operating leases include scheduled rent escalations.
Total rental expense for operating leases, including contingent rentals, was approximately $19.8 million, $25.7 million and $33.2 million for fiscal 2003, 2004 and 2005, respectively. Contingent rent expense in fiscal 2003, 2004 and 2005, which are based on a percentage of net sales, was approximately $1.1 million, $1.5 million and $1.9 million, respectively.
As of January 29, 2005, the Company has also entered into various lease agreements for stores to be opened and equipment placed in service subsequent to year end. The future minimum lease payments under these agreements were $0.7 million in fiscal 2006, $0.9 million in fiscal 2007, $0.9 million in fiscal 2008, $0.9 million in fiscal 2009, $0.9 million in fiscal 2010 and $4.8 million thereafter.
Inventories—The Company ordinarily places orders for the purchases of inventory at least one to two seasons in advance. In fiscal 2005, five vendors accounted for over 92% of the raw materials purchased by the Company. In fiscal 2005, the Company purchased approximately 29% of its finished product through an agent who sources the products from various vendors. Approximately 11% of the total product purchases (including piece goods) in fiscal 2005 were sourced from United States suppliers, and approximately 89% were sourced from suppliers in other countries. In fiscal 2005, approximately 34% of the total product purchases were manufactured in China (including 19% from Hong Kong) and 20% in Mexico. No other country represented more than 7% of total product purchases in fiscal 2005.
Other—The Company has an agreement with David Leadbetter, a golf professional, which allows the Company to produce golf and other apparel under Leadbetter’s name, which expires in January 2011. The minimum annual commitment under this agreement through fiscal 2005 was $0.2 million and represents the amount paid in each of fiscal 2003, 2004 and 2005. Beginning in fiscal 2006 through fiscal 2010 the minimum annual commitment is $0.2 million.
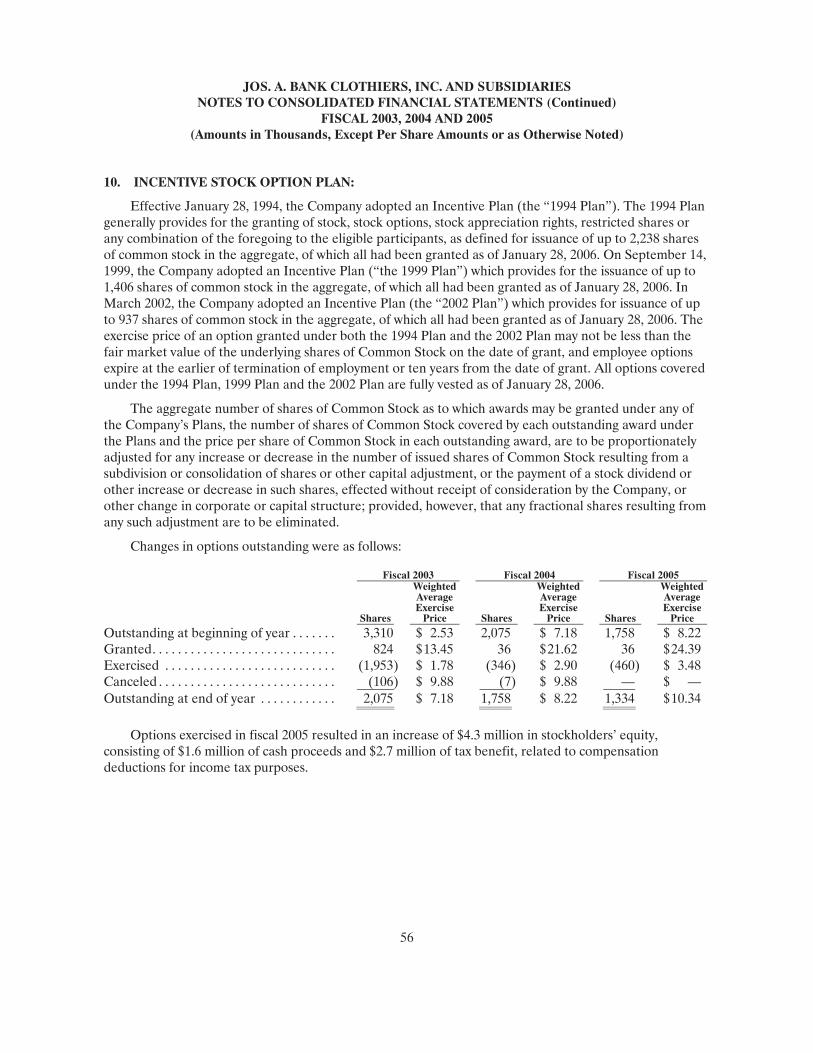
JOS. A. BANK CLOTHIERS, INC. AND SUBSIDIARIES NOTES TO CONSOLIDATED FINANCIAL STATEMENTS (Continued)
FISCAL 2003, 2004 AND 2005 (Amounts in Thousands, Except Per Share Amounts or as Otherwise Noted)
56
10. INCENTIVE STOCK OPTION PLAN:
Effective January 28, 1994, the Company adopted an Incentive Plan (the “1994 Plan”). The 1994 Plan generally provides for the granting of stock, stock options, stock appreciation rights, restricted shares or any combination of the foregoing to the eligible participants, as defined for issuance of up to 2,238 shares of common stock in the aggregate, of which all had been granted as of January 28, 2006. On September 14, 1999, the Company adopted an Incentive Plan (“the 1999 Plan”) which provides for the issuance of up to 1,406 shares of common stock in the aggregate, of which all had been granted as of January 28, 2006. In March 2002, the Company adopted an Incentive Plan (the “2002 Plan”) which provides for issuance of up to 937 shares of common stock in the aggregate, of which all had been granted as of January 28, 2006. The exercise price of an option granted under both the 1994 Plan and the 2002 Plan may not be less than the fair market value of the underlying shares of Common Stock on the date of grant, and employee options expire at the earlier of termination of employment or ten years from the date of grant. All options covered under the 1994 Plan, 1999 Plan and the 2002 Plan are fully vested as of January 28, 2006.
The aggregate number of shares of Common Stock as to which awards may be granted under any of the Company’s Plans, the number of shares of Common Stock covered by each outstanding award under the Plans and the price per share of Common Stock in each outstanding award, are to be proportionately adjusted for any increase or decrease in the number of issued shares of Common Stock resulting from a subdivision or consolidation of shares or other capital adjustment, or the payment of a stock dividend or other increase or decrease in such shares, effected without receipt of consideration by the Company, or other change in corporate or capital structure; provided, however, that any fractional shares resulting from any such adjustment are to be eliminated.
Changes in options outstanding were as follows:
Fiscal 2003 Fiscal 2004 Fiscal 2005
Shares
WeightedAverageExercise
Price Shares
Weighted Average Exercise
Price Shares
WeightedAverageExercise
Price Outstanding at beginning of year . . . . . . . 3,310 $ 2.53 2,075 $ 7.18 1,758 $ 8.22Granted. . . . . . . . . . . . . . . . . . . . . . . . . . . . . 824 $ 13.45 36 $ 21.62 36 $ 24.39Exercised . . . . . . . . . . . . . . . . . . . . . . . . . . . (1,953) $ 1.78 (346) $ 2.90 (460 ) $ 3.48Canceled . . . . . . . . . . . . . . . . . . . . . . . . . . . . (106) $ 9.88 (7) $ 9.88 — $ —Outstanding at end of year . . . . . . . . . . . . 2,075 $ 7.18 1,758 $ 8.22 1,334 $ 10.34
Options exercised in fiscal 2005 resulted in an increase of $4.3 million in stockholders’ equity, consisting of $1.6 million of cash proceeds and $2.7 million of tax benefit, related to compensation deductions for income tax purposes.
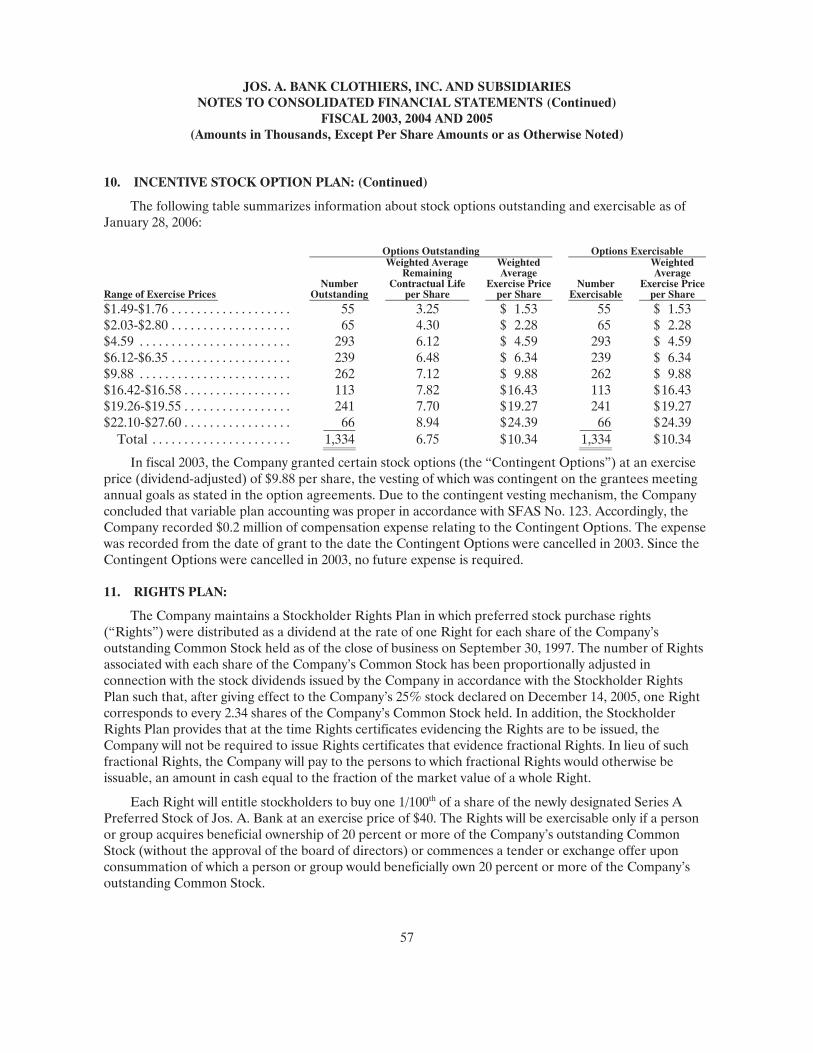
JOS. A. BANK CLOTHIERS, INC. AND SUBSIDIARIES NOTES TO CONSOLIDATED FINANCIAL STATEMENTS (Continued)
FISCAL 2003, 2004 AND 2005 (Amounts in Thousands, Except Per Share Amounts or as Otherwise Noted)
57
10. INCENTIVE STOCK OPTION PLAN: (Continued)
The following table summarizes information about stock options outstanding and exercisable as of January 28, 2006:
Options Outstanding Options Exercisable
Range of Exercise Prices Number
Outstanding
Weighted AverageRemaining
Contractual Lifeper Share
Weighted Average
Exercise Priceper Share
Number Exercisable
Weighted Average
Exercise Priceper Share
$1.49-$1.76 . . . . . . . . . . . . . . . . . . . 55 3.25 $ 1.53 55 $ 1.53 $2.03-$2.80 . . . . . . . . . . . . . . . . . . . 65 4.30 $ 2.28 65 $ 2.28 $4.59 . . . . . . . . . . . . . . . . . . . . . . . . 293 6.12 $ 4.59 293 $ 4.59 $6.12-$6.35 . . . . . . . . . . . . . . . . . . . 239 6.48 $ 6.34 239 $ 6.34 $9.88 . . . . . . . . . . . . . . . . . . . . . . . . 262 7.12 $ 9.88 262 $ 9.88 $16.42-$16.58 . . . . . . . . . . . . . . . . . 113 7.82 $ 16.43 113 $ 16.43 $19.26-$19.55 . . . . . . . . . . . . . . . . . 241 7.70 $ 19.27 241 $ 19.27 $22.10-$27.60 . . . . . . . . . . . . . . . . . 66 8.94 $ 24.39 66 $ 24.39
Total . . . . . . . . . . . . . . . . . . . . . . 1,334 6.75 $ 10.34 1,334 $ 10.34
In fiscal 2003, the Company granted certain stock options (the “Contingent Options”) at an exercise price (dividend-adjusted) of $9.88 per share, the vesting of which was contingent on the grantees meeting annual goals as stated in the option agreements. Due to the contingent vesting mechanism, the Company concluded that variable plan accounting was proper in accordance with SFAS No. 123. Accordingly, the Company recorded $0.2 million of compensation expense relating to the Contingent Options. The expense was recorded from the date of grant to the date the Contingent Options were cancelled in 2003. Since the Contingent Options were cancelled in 2003, no future expense is required.
11. RIGHTS PLAN:
The Company maintains a Stockholder Rights Plan in which preferred stock purchase rights (“Rights”) were distributed as a dividend at the rate of one Right for each share of the Company’s outstanding Common Stock held as of the close of business on September 30, 1997. The number of Rights associated with each share of the Company’s Common Stock has been proportionally adjusted in connection with the stock dividends issued by the Company in accordance with the Stockholder Rights Plan such that, after giving effect to the Company’s 25% stock declared on December 14, 2005, one Right corresponds to every 2.34 shares of the Company’s Common Stock held. In addition, the Stockholder Rights Plan provides that at the time Rights certificates evidencing the Rights are to be issued, the Company will not be required to issue Rights certificates that evidence fractional Rights. In lieu of such fractional Rights, the Company will pay to the persons to which fractional Rights would otherwise be issuable, an amount in cash equal to the fraction of the market value of a whole Right.
Each Right will entitle stockholders to buy one 1/100th of a share of the newly designated Series A Preferred Stock of Jos. A. Bank at an exercise price of $40. The Rights will be exercisable only if a person or group acquires beneficial ownership of 20 percent or more of the Company’s outstanding Common Stock (without the approval of the board of directors) or commences a tender or exchange offer upon consummation of which a person or group would beneficially own 20 percent or more of the Company’s outstanding Common Stock.
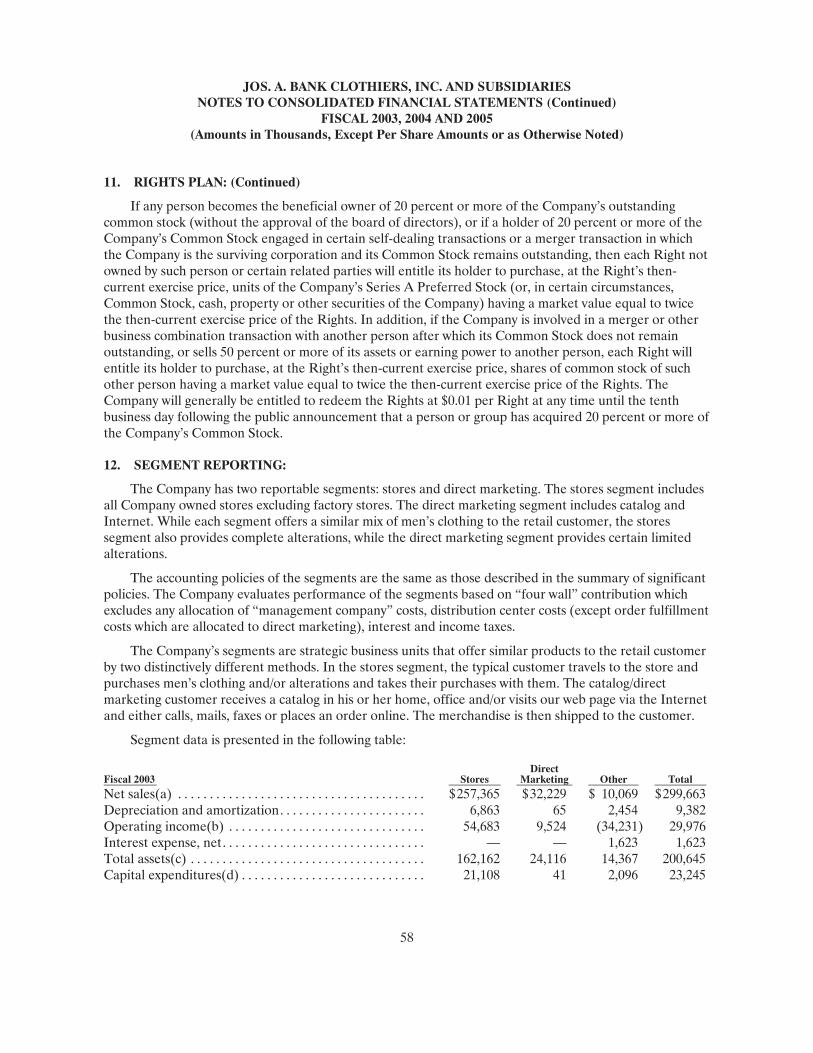
JOS. A. BANK CLOTHIERS, INC. AND SUBSIDIARIES NOTES TO CONSOLIDATED FINANCIAL STATEMENTS (Continued)
FISCAL 2003, 2004 AND 2005 (Amounts in Thousands, Except Per Share Amounts or as Otherwise Noted)
58
11. RIGHTS PLAN: (Continued)
If any person becomes the beneficial owner of 20 percent or more of the Company’s outstanding common stock (without the approval of the board of directors), or if a holder of 20 percent or more of the Company’s Common Stock engaged in certain self-dealing transactions or a merger transaction in which the Company is the surviving corporation and its Common Stock remains outstanding, then each Right not owned by such person or certain related parties will entitle its holder to purchase, at the Right’s then-current exercise price, units of the Company’s Series A Preferred Stock (or, in certain circumstances, Common Stock, cash, property or other securities of the Company) having a market value equal to twice the then-current exercise price of the Rights. In addition, if the Company is involved in a merger or other business combination transaction with another person after which its Common Stock does not remain outstanding, or sells 50 percent or more of its assets or earning power to another person, each Right will entitle its holder to purchase, at the Right’s then-current exercise price, shares of common stock of such other person having a market value equal to twice the then-current exercise price of the Rights. The Company will generally be entitled to redeem the Rights at $0.01 per Right at any time until the tenth business day following the public announcement that a person or group has acquired 20 percent or more of the Company’s Common Stock.
12. SEGMENT REPORTING:
The Company has two reportable segments: stores and direct marketing. The stores segment includes all Company owned stores excluding factory stores. The direct marketing segment includes catalog and Internet. While each segment offers a similar mix of men’s clothing to the retail customer, the stores segment also provides complete alterations, while the direct marketing segment provides certain limited alterations.
The accounting policies of the segments are the same as those described in the summary of significant policies. The Company evaluates performance of the segments based on “four wall” contribution which excludes any allocation of “management company” costs, distribution center costs (except order fulfillment costs which are allocated to direct marketing), interest and income taxes.
The Company’s segments are strategic business units that offer similar products to the retail customer by two distinctively different methods. In the stores segment, the typical customer travels to the store and purchases men’s clothing and/or alterations and takes their purchases with them. The catalog/direct marketing customer receives a catalog in his or her home, office and/or visits our web page via the Internet and either calls, mails, faxes or places an order online. The merchandise is then shipped to the customer.
Segment data is presented in the following table:
Fiscal 2003 Stores Direct
Marketing Other Total Net sales(a) . . . . . . . . . . . . . . . . . . . . . . . . . . . . . . . . . . . . . . . $ 257,365 $ 32,229 $ 10,069 $ 299,663Depreciation and amortization. . . . . . . . . . . . . . . . . . . . . . . 6,863 65 2,454 9,382Operating income(b) . . . . . . . . . . . . . . . . . . . . . . . . . . . . . . . 54,683 9,524 (34,231 ) 29,976Interest expense, net. . . . . . . . . . . . . . . . . . . . . . . . . . . . . . . . — — 1,623 1,623Total assets(c) . . . . . . . . . . . . . . . . . . . . . . . . . . . . . . . . . . . . . 162,162 24,116 14,367 200,645Capital expenditures(d) . . . . . . . . . . . . . . . . . . . . . . . . . . . . . 21,108 41 2,096 23,245

JOS. A. BANK CLOTHIERS, INC. AND SUBSIDIARIES NOTES TO CONSOLIDATED FINANCIAL STATEMENTS (Continued)
FISCAL 2003, 2004 AND 2005 (Amounts in Thousands, Except Per Share Amounts or as Otherwise Noted)
59
12. SEGMENT REPORTING: (Continued)
Fiscal 2004 Stores Direct
Marketing Other Total Net sales(a) . . . . . . . . . . . . . . . . . . . . . . . . . . . . . . . . . . . . . . . $ 325,304 $ 36,513 $ 10,683 $ 372,500Depreciation and amortization. . . . . . . . . . . . . . . . . . . . . . . 8,720 69 1,709 10,498Operating income(b) . . . . . . . . . . . . . . . . . . . . . . . . . . . . . . . 70,299 11,492 (39,738 ) 42,053Interest expense, net. . . . . . . . . . . . . . . . . . . . . . . . . . . . . . . . — — 1,696 1,696Total assets(c) . . . . . . . . . . . . . . . . . . . . . . . . . . . . . . . . . . . . . 198,641 17,147 17,516 233,304Capital expenditures(d) . . . . . . . . . . . . . . . . . . . . . . . . . . . . . 25,056 18 4,865 29,939
Fiscal 2005 Stores Direct
Marketing Other Total Net sales(a) . . . . . . . . . . . . . . . . . . . . . . . . . . . . . . . . . . . . . . . $ 408,452 $ 44,453 $ 11,728 $ 464,633Depreciation and amortization. . . . . . . . . . . . . . . . . . . . . . . 10,777 70 2,173 13,020Operating income(b) . . . . . . . . . . . . . . . . . . . . . . . . . . . . . . . 94,694 15,815 (48,714 ) 61,795Interest expense, net. . . . . . . . . . . . . . . . . . . . . . . . . . . . . . . . — — 1,794 1,794Total assets(c) . . . . . . . . . . . . . . . . . . . . . . . . . . . . . . . . . . . . . 257,499 30,982 16,351 304,832Capital expenditures(d) . . . . . . . . . . . . . . . . . . . . . . . . . . . . . 29,238 44 2,295 31,577
(a) Direct marketing net sales represent catalog and Internet sales. Net sales from other operating
segments below the quantitative thresholds are attributable primarily to three operating segments of the Company. Those segments are factory stores, sales to franchisees’ franchise stores and regional tailor shops. None of these segments have ever met any of the quantitative thresholds for determining reportable segments and are included in “Other.”
(b) Operating income for the stores and direct marketing segments represents profit before allocations of overhead from the corporate office and the distribution center (which are included in the “Other” segment), interest and income taxes. Total operating income represents profit before interest and income taxes.
(c) Identifiable assets include cash and cash equivalents, accounts receivable, inventories, prepaid expenses and other current assets and property, plant and equipment residing in or related to the reportable segment. Assets included in “Other” are primarily cash and cash equivalents, property, plant and equipment associated with the corporate office and distribution center, deferred tax assets, and inventories, which have not been assigned to one of the reportable segments.
(d) Capital expenditures include purchases of property, plant and equipment made for the reportable segment.
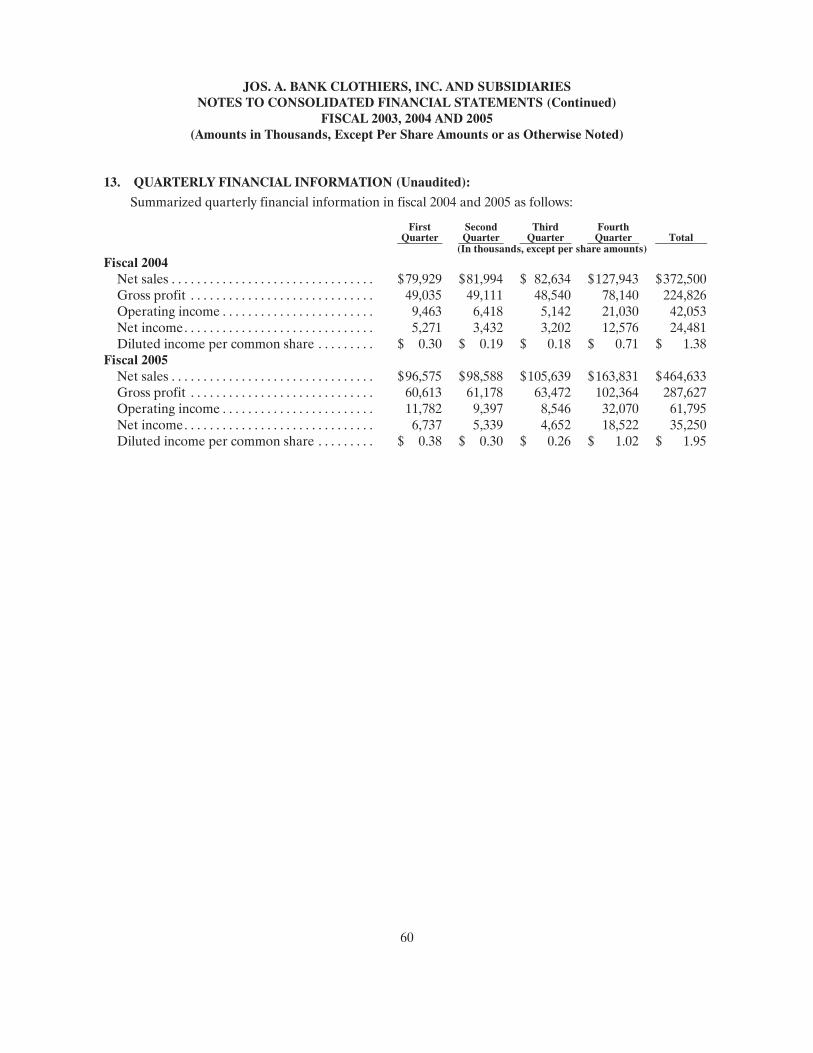
JOS. A. BANK CLOTHIERS, INC. AND SUBSIDIARIES NOTES TO CONSOLIDATED FINANCIAL STATEMENTS (Continued)
FISCAL 2003, 2004 AND 2005 (Amounts in Thousands, Except Per Share Amounts or as Otherwise Noted)
60
13. QUARTERLY FINANCIAL INFORMATION (Unaudited):
Summarized quarterly financial information in fiscal 2004 and 2005 as follows:
First
Quarter SecondQuarter
Third Quarter
Fourth Quarter Total
(In thousands, except per share amounts) Fiscal 2004
Net sales . . . . . . . . . . . . . . . . . . . . . . . . . . . . . . . . $ 79,929 $ 81,994 $ 82,634 $ 127,943 $ 372,500Gross profit . . . . . . . . . . . . . . . . . . . . . . . . . . . . . 49,035 49,111 48,540 78,140 224,826Operating income . . . . . . . . . . . . . . . . . . . . . . . . 9,463 6,418 5,142 21,030 42,053Net income. . . . . . . . . . . . . . . . . . . . . . . . . . . . . . 5,271 3,432 3,202 12,576 24,481Diluted income per common share . . . . . . . . . $ 0.30 $ 0.19 $ 0.18 $ 0.71 $ 1.38
Fiscal 2005 Net sales . . . . . . . . . . . . . . . . . . . . . . . . . . . . . . . . $ 96,575 $ 98,588 $ 105,639 $ 163,831 $ 464,633Gross profit . . . . . . . . . . . . . . . . . . . . . . . . . . . . . 60,613 61,178 63,472 102,364 287,627Operating income . . . . . . . . . . . . . . . . . . . . . . . . 11,782 9,397 8,546 32,070 61,795Net income. . . . . . . . . . . . . . . . . . . . . . . . . . . . . . 6,737 5,339 4,652 18,522 35,250Diluted income per common share . . . . . . . . . $ 0.38 $ 0.30 $ 0.26 $ 1.02 $ 1.95

DE
SIG
N: A
SH
TO
N D
ES
IGN
, BA
LT
IMO
RE
, MD
JOS . A . BANK CLOTHIERS , INC .
5 0 0 H A N OV E R P I K E
H A M P S T E A D, M D 2 1 074
P 4 1 0 2 3 9 2 7 0 0
F 4 1 0 2 3 9 57 0 0
WWW.JOSBANK .COM