Preliminary Results Presentation Year Ended 00 September 2014€¦ · 2015: £14.0m Adjusted...
21
AGM Presentation 14 February 2017 Presented by Alan Wilson, Chairman John Hayward, Chief Executive Officer
Transcript of Preliminary Results Presentation Year Ended 00 September 2014€¦ · 2015: £14.0m Adjusted...

AGM Presentation14 February 2017
Presented by
Alan Wilson, Chairman
John Hayward, Chief Executive Officer
Agenda
2
• Formalities
• Oil and gas market conditions
• Group overview
• Alternative Energy in the news
• Lunch
• Tour of Chesterfield Special Cylinders

Formalities
3

Resolutions
4
Ordinary business
• Resolution 1: To approve the annual report and
accounts
• Resolution 2: To approve the annual report on
Director’s remuneration
• Resolution 3: To re-elect Alan Wilson as a Director
• Resolution 4: To re-elect John Hayward as a
Director
• Resolution 5: To re-elect Neil MacDonald as a
Director
• Resolution 6: To reappoint the auditors and fix
their remuneration
• Resolution 7: To authorise allotment of shares
Special business
• Resolution 8: To authorise Company to purchase
own shares
• Resolution 9: To disapply pre-emption provisions

Oil and gas market
5
Agenda
• A brief re-cap…
• Recent events…a cause for hope?
• Market fundamentals

A brief recap…
6
• Reduced investment - $1 trillion 2015-20
• Job cuts - 500,000 jobs cuts globally, four largest service companies spent $3.12bn in severance costs 2015-2016
• Oil company losses in 2016:
• Shell - $2.7bn in upstream
• Anadarko - net loss of $3bn
• Exxon Mobil - US upstream losses of $2.1bn including impairment charges
• Service company losses 2016 Q4:
• Haliburton – $149m
• Schlumberger - $204m
• "In many ways 2016 was like a barroom brawl, where everyone and I mean everyone took a punch," Schlumberger President Jeff Miller

A brief recap…
7
• Bankruptcies - Around 100 US oilfield service firms 2015-16
• Dividend reductions - many oil companies have cut dividends of more than $7.4 billion
• Less exploration – 2015: lowest discoveries of
oil reserves for more than 60 years
• Rigs being scrapped – 2012 worldwide rig
count averaged 3,518; in 2016 it averaged
1,561. Day rates for rigs have fallen from
$650,000 to $200,000
A brief recap…
8
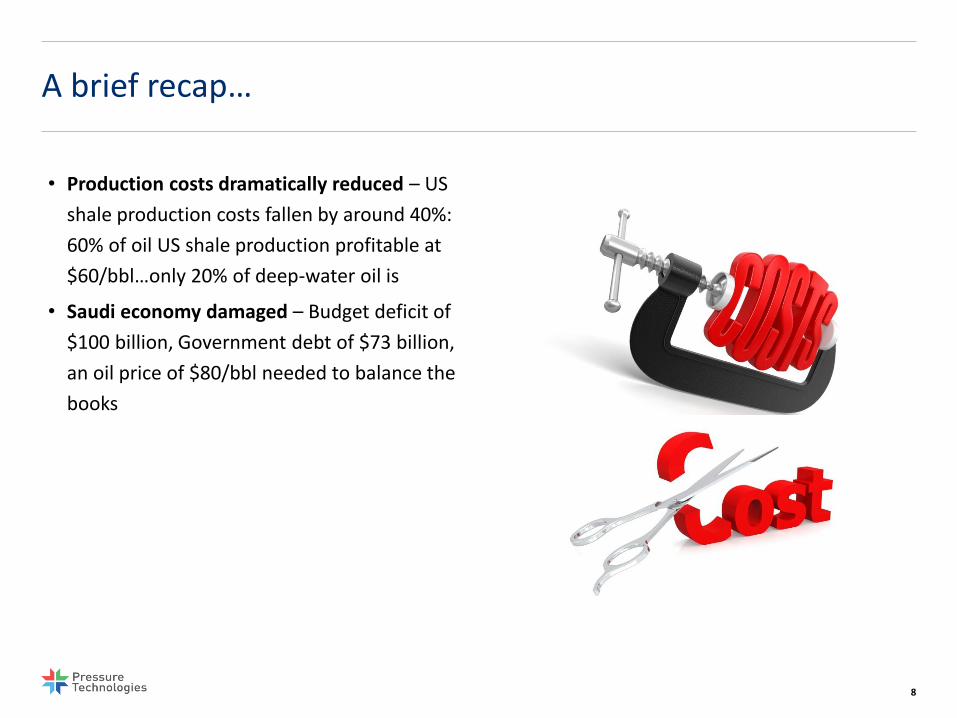
• Production costs dramatically reduced – US
shale production costs fallen by around 40%:
60% of oil US shale production profitable at
$60/bbl…only 20% of deep-water oil is
• Saudi economy damaged – Budget deficit of
$100 billion, Government debt of $73 billion,
an oil price of $80/bbl needed to balance the
books

Recent developments…a cause for hope?
9
• Reputedly 1 Bnbbls of oil in inventories
• Global oil demand set to increase by 1.6% in 2017
• OPEC and 11 others to cut output by 1.8 Mbopd…until June 2017
• North American upstream industry set to stage a comeback - US production increased by about 460,000bbls/day in the past six months
• Inventories in industrialised nations have declined five months in a row and fell in Q4 by the most in three years
• OPEC implemented 90% of promised output cuts in January, Saudi Arabia reduced production by even more than committed
• Resilient oil demand is aiding OPEC’s bid to re-balance world markets, growing more than expected last year and poised to do so again in 2017
-00
200,000,000
400,000,000
600,000,000
800,000,000
1,000,000,000
1,200,000,000
Jan Feb Mar Apr May Jun Jul Aug Sep Oct Nov Dec
Inventory possible depletion scenarios - 2017
Growth Cuts Both Shale Outcome???

Market fundamentals
10
• World economy expected to double in next 20 years
• Mostly driven by productivity - GDP per person
• Population projected to grow by 1.5bn by 2035
• More than 2m people lifted from low incomes
• Half the increase in population is expected in Africa
• Economic growth requires more energy

Market fundamentals
11
• Fast-growing economies drive energy consumption
• Growth decelerates
• Virtually all growth comes from China & India
• Demand from the OECD barely grows
• China initially dominates, but India is excepted to overtake rate of growth

Market fundamentals
12
• Known oil resources dwarf future consumption forecasts
• Global proven reserves have more than doubled over the past 35 years: for every barrel consumed, two new barrels have been discovered
• Around 65% of recoverable reserves are located in the Middle East, CIS and North America
• Looking out to 2050, global demand amounts to less than half today’s recoverable reserves

Market fundamentals
13
• Abundant oil resources and slowing demand have seen low-cost producers using their competitive advantage to protect market share
• Majority of low-cost resources are located onshore Middle East and Russia, with US tight oil plays following up
Key factors in future are:
• Balancing demand versus supply may actually work…
• Ability of low-cost producers to increase and decrease supply
• Implications of low-cost oil for producer’s own economies
• Ability of higher-cost producers to respond to the threat…efficiencies, taxation, royalties etc.
What this means for PT:
• Requirement for high quality and niche consumables delivered on short lead times continues to play to our strengths
• A fundamentally restructured oil and gas market focused on cost and production efficiencies through new technologies, creates opportunities for our niche capabilities which have been further strengthened by the acquisition of Martract.

Group overview
14
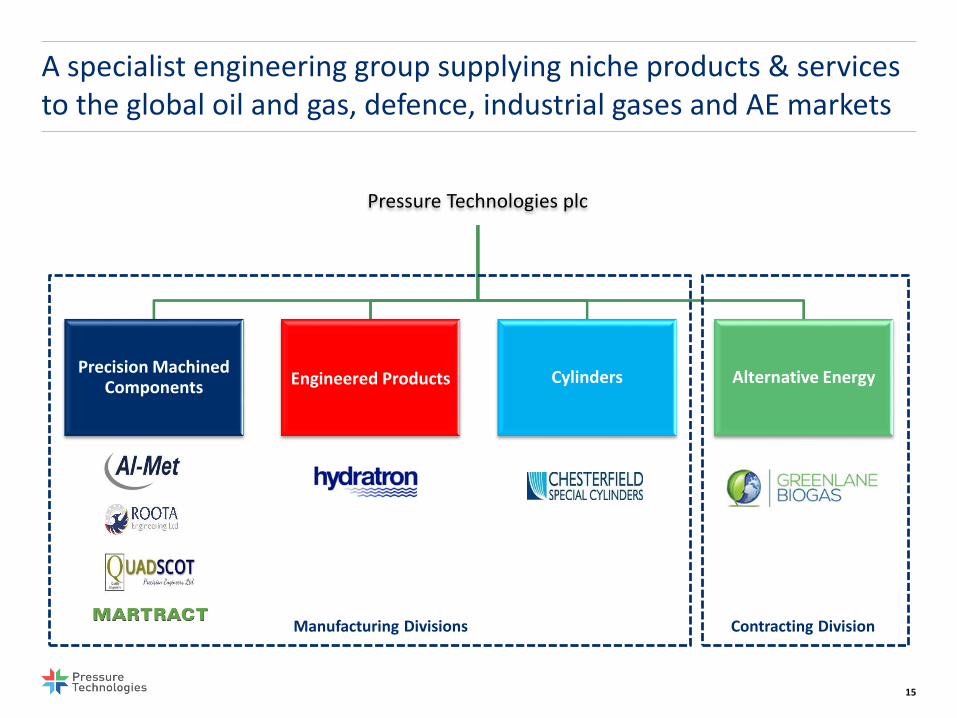
A specialist engineering group supplying niche products & services to the global oil and gas, defence, industrial gases and AE markets
15
Pressure Technologies plc
Precision Machined Components Engineered Products Cylinders Alternative Energy
Manufacturing Divisions Contracting Division

Precision Machined Components Division
16
Revenue
£10.7m2015: £18.8m
Adjusted operating profit
£1.4m2015: £4.5m
Division remains profitable despite its reliance on the oil and gas market
Customer ordering patterns continue to be unpredictable but do not appear to be subject to further deterioration and Al-Met took its single largest ever order of $1.2 million in August
Al-Met and Roota gaining market share and customers but Quadscot remains affected by low-ball pricing in a very competitive sector of the market
Costs aligned with the market to ensure continued profitability with major headcount reduction and short-time working when necessary
Technical capability strengthened through recruitment and Al-Met has gained ‘Fit for Nuclear’ accreditation
Significant latent capacity created through investment in technology and productivity gains
Strategic acquisition of Martract in December 2016 immediately earnings enhancing, reduces lead times through vertical integration and expands market reach

Engineered Products Division
17
Revenue
£4.1m2015: £6.7m
Adjusted operating loss
£(0.3)m2015: £0.1m profit
Business restructured over the last 18 months as cuts in capital expenditure and discretionary service spend in the oil and gas market continue to impact sales revenues and profitability
US manufacturing closed and a distributor appointed covering the Americas
Breakeven sales reduced from £700,000 per month to under £400,000
Delivery lead times for standard pumps and power packs reduced from over two months to under two weeks
Completing the implementation of ‘lean’ operating systems and product rationalisation will yield further cost reductions
Commercial focus on expanding distributor networks with additional distributors appointed in Africa and Italy post year end

Cylinders Division
18
Revenue
£9.5m2015: £14.3m
Adjusted operating profit
£1.1m2015: £2.1m
Division remains profitable despite major reduction in orders from the oil and gas market as the defence market continues to provide a base load of revenue
CSC remains the established naval defence market leader in sales to NATO and NATO-friendly nations outside the USA with potential future large projects in the UK and Australia
USA, making steady progress in the defence market and opportunities opening up in the industrial gases market as our pricing is competitive and we now have all necessary US DoT approvals
Services now account for 25% of revenues and 28% of divisional gross margin (2015: 13% and 17% respectively) due to start of a new cycle of trailer reconditioning and a 14% increase in Integrity Management service

Alternative Energy Division
19
Revenue
£11.3m2015: £14.0m
Adjusted operating loss
£(1.1)m2015: £(1.1)m
Good momentum building with nine upgrader contracts secured in the year totalling £20.8 million
Timing of securing orders results in benefits of the order book delayed to 2017 with £14.2 million of orders at the year end
Kauri upgrader, world’s largest single upgrader plant capable of processing 5000 cubic metres of biogas per hour, launched
Low cost, entry level Kanuka Gen 2.0 launched for volumes up to 300 cubic metres per hour
Sales effort focused on markets where subsidies and incentives are certain
Growth markets USA, Canada, Brazil, UK, Netherlands and France
High quality pipeline with over £15 million potential orders with a medium or high probability of conversion in first-half of 2017
Service & Maintenance contracts covered 30% of UK and Europe fixed costs, North America 7% due to different market dynamics
Summary & Outlook
20
Group reshaped to reduce the reliance on the oil and gas market which now accounts for 43% of revenues (2015: 57%)
Restructuring completed to provide resilience and focus now on expanding into other markets
Alternative Energy Division is showing solid momentum with a good order book and strong pipeline
Manufacturing Divisions aligned to be profitable at second-half sales levels and gross margins preserved as direct costs reduced in response to reductions in revenues
Productivity gains and improved technical capabilities have been achieved across the Group
Acquisition of Martract demonstrates commitment to the Group’s growth strategy
The Board remains confident in the medium to long-term prospects for the Group
Disclaimer
This presentation has been prepared by Pressure Technologies plc (the “Company“ or “Pressure Technologies”) solely in connection with providing information on the Company and to certain institutional and professional investors in the United Kingdom.
This presentation does not constitute or form part of any offer or invitation to purchase, sell or subscribe for, or any solicitation of any such offer to purchase, sell or subscribe for, any securities in the Company nor shall this presentation or any part of it, or the fact of its distribution, form the basis of, or be relied on in connection with, any contract therefore.
No reliance may be placed, for any purposes whatsoever, on the information contained in this presentation or on its completeness and this presentation should not be considered a recommendation by the Company or Cantor Fitzgerald Europe or any of their respective affiliates in relation to any purchase of or subscription for securities of the Company. The content of this Presentation has not been verified and has not been approved by an authorised person. Reliance on this document for the purpose of engaging in any investment activity may expose you to a significant risk of losing all of the property invested or of incurring additional liability. If you are in any doubt about this document, you should consult an appropriate independent advisor.
Neither this presentation nor any copy of it may be (i) taken or transmitted into the United States of America, (ii) distributed, directly or indirectly, in the United States of America or to any US person (within the meaning of regulations made under the Securities Act 1933, as amended), (iii) taken or transmitted into or distributed in Canada, Australia, the Republic of Ireland or the Republic of South Africa or to any resident thereof, or (iv) taken or transmitted into or distributed in Japan or to any resident thereof. Any failure to comply with these restrictions may constitute a violation of the securities laws or the laws of any such jurisdiction. The distribution of this document in other jurisdictions may be restricted by law and the persons into whose possession this document comes should inform themselves about, and observe, any such restrictions or other applicable legal requirements.
This presentation includes statements that are, or may be deemed to be, “forward-looking statements”. Such forward-looking statements are based on assumptions and estimates and involve risks, uncertainties and other factors which may cause the actual results, financial condition, performance or achievements of the Company, or industry results to be materially different from any future results, performance or achievements expressed or implied by such forward-looking statements. Given these uncertainties, prospective investors are cautioned not to place any undue reliance on such forward-looking statements. No representation or warranty express or implied is made as to the fairness, accuracy, completeness or correctness of the presentation or opinions contained therein and each recipient of the presentation must make its own investigation and assessment of the matters contained therein. In particular, but without prejudice to the generally of the foregoing, no representation or warranty is given, and no responsibility of liability is accepted, as to the achievement or reasonableness of any future projections or the assumptions underlying them, forecasts estimates or statements as to loss howsoever arising from any use of, or in connection with the presentation. No responsibility or liability whatsoever is accepted by any person for any loss howsoever arising from any use of, or in connection with the presentation or its contents or otherwise arising in connection therewith. In issuing the presentation, the Company does not undertake any obligation to update or to correct any inaccuracies which may become apparent in the presentation.
21