
PRELIMINARY ?iPORrpdf.usaid.gov/pdf_docs/PNAAY708.pdf · PRELIMINARY ?iPORr. Evaluation of...
13
PRELIMINARY ?iPORr =. Evaluation of nipoyment and Unerploycent Statistics for El Salvador Peter Gregory Estimates of Employment and Unealo,,-ment Currently Available Up until 1980, estimates 'of eiployment and unemplo~ment were based on household surveys carried out throughout the national territory. On the basis of these surveys, unemploymnY t rates of 3.8, 6.7, and 16.1 percent were reported f6r the years 1978, 1979, and 1980 respectively. For the years since 1980, the estimates of unemplo3mm nt have come from the Planning Ministry's ( .fiiT.ZN) Population Division (Direcci6n de Poblaci6n). The unmp].oyment rates for tiie subeequenit years have been estimted as follcw:s: 1981 25 parcent 1983 33.23 percent 1982 31.25 percent 1984 33.34 pe-rcent 1985 32.65 pecenu If these recent .unemployment rates are reliable, they wculd have to be. consider(,d truly alaTaing. Indeed, one ml.g, t wonder howa a society with a th-ird of its labor force in a state of opean unomploynnt could mainta-in any sib].ance of so- cial and political stability. 1V.C . there is no question t:hat the people of -El Salvador have suffered a significant decline i income, there atre groLunds for questioning .Aiether the unamloyment rates cited above are an accurate reflection of those that have actually held. In my opinion, these are more ]iamely to repr.- * sent a sustanital overstatement of the true rates of open un mploy.ent. This con- clusion derives fro.m a consideration of the mannar in which the unc-rm oyrmnnt. figUes were developd. Since 1980, all of the estimates of a-ployment a-lid unemployment represent projections that incorporate a n-nber of assumpticns about the grrco..th of the la- - bor force and the structure of the econcrMy. As a se " hih thes pro- jections are applied is the mplomant and un,-mploymcit: data yie.c0-:(1 by the last household 'survey tunertoken during the ear].y mnonthl/ of 1.980, .4-Cen ac.rici].tural activity and aT1oymn-tf a-c at seasonally l.0w levels. A Subsequent .cb 1f Un fl .. .- n".e-.
Transcript of PRELIMINARY ?iPORrpdf.usaid.gov/pdf_docs/PNAAY708.pdf · PRELIMINARY ?iPORr. Evaluation of...
PRELIMINARY ?iPORr=.
Evaluation of nipoyment and Unerploycent Statistics for El Salvador
Peter Gregory
Estimates of Employment and Unealo,,-ment Currently Available
Up until 1980, estimates 'of eiployment and unemplo~ment were based on
household surveys carried out throughout the national territory. On the
basis of these surveys, unemploymnY t rates of 3.8, 6.7, and 16.1 percent were
reported f6r the years 1978, 1979, and 1980 respectively. For the years since
1980, the estimates of unemplo3mmnt have come from the Planning Ministry's ( .fiiT.ZN)
Population Division (Direcci6n de Poblaci6n). The unmp].oyment rates for tiie
subeequenit years have been estimted as follcw:s:
1981 25 parcent 1983 33.23 percent 1982 31.25 percent 1984 33.34 pe-rcent
1985 32.65 pecenu
If these recent .unemployment rates are reliable, they wculd have to be. consider(,d
truly alaTaing. Indeed, one ml.g, t wonder howa a society with a th-ird of its
labor force in a state of opean unomploynnt could mainta-in any sib].ance of so
cial and political stability. 1V.C . there is no question t:hat the people of -El
Salvador have suffered a significant decline i income, there atre groLunds for
questioning .Aiether the unamloyment rates cited above are an accurate reflection
of those that have actually held. In my opinion, these are more ]iamely to repr.
*sent a sustanital overstatement of the true rates of open un mploy.ent. This con
clusion derives fro.m a consideration of the mannar in which the unc-rm oyrmnnt. figUes
were developd.
Since 1980, all of the estimates of a-ployment a-lid unemployment represent
projections that incorporate a n-nber of assumpticns about the grrco..th of the la
-bor force and the structure of the econcrMy. As a se " hih thes pro
jections are applied is the mplomant and un,-mploymcit: data yie.c0-:(1 by the last
household 'survey tunertoken during the ear].y mnonthl/ of 1.980, .4-Cen ac.rici].tural activity and aT1oymn-tf a-c at seasonally l.0w levels.A Subsequent.cb 1f Unfl.. .-n".e-.
ploymrnt are estimated by reference to changes in sectoral output as these appear
in the national incame measures. The employmeent level so derived is then sub
tracted from the estimated labor force that is derived fra the base population
of the 1971 census and a rate of grcvth in population of batwjeen 2.5 and 3 per-The difference represents unemploy-mnt.
cent per year. /Several objections can be raised regarding this procedure. of
First, consider the estimates iAhanges in output over time. The national
income statistics are based on measures derived from the modern sector alone.
The structure of the econcn.y as between formal and informal sectors is assumed
to lave remained constant since the last econcni- census was taken in 1978. Thus,
informal sector output is ass ned to have increased at the same rate as that of
the formal. tn fact, it seems more likely that the informal sector has weathiered
the economic crisis better than the formal and has gram relative to the formal.
Certainly it is universally acknciledged that employment has expanded in the in
formal sector as the formal sector suffered a decline and nore recently a slc.
recovery. What remains in doubt is wheher the output of the infornal sector
also stagnated or declined while employment increased, thus yieldinig a substan
tial drop in proluctivi-y aid income of participants.
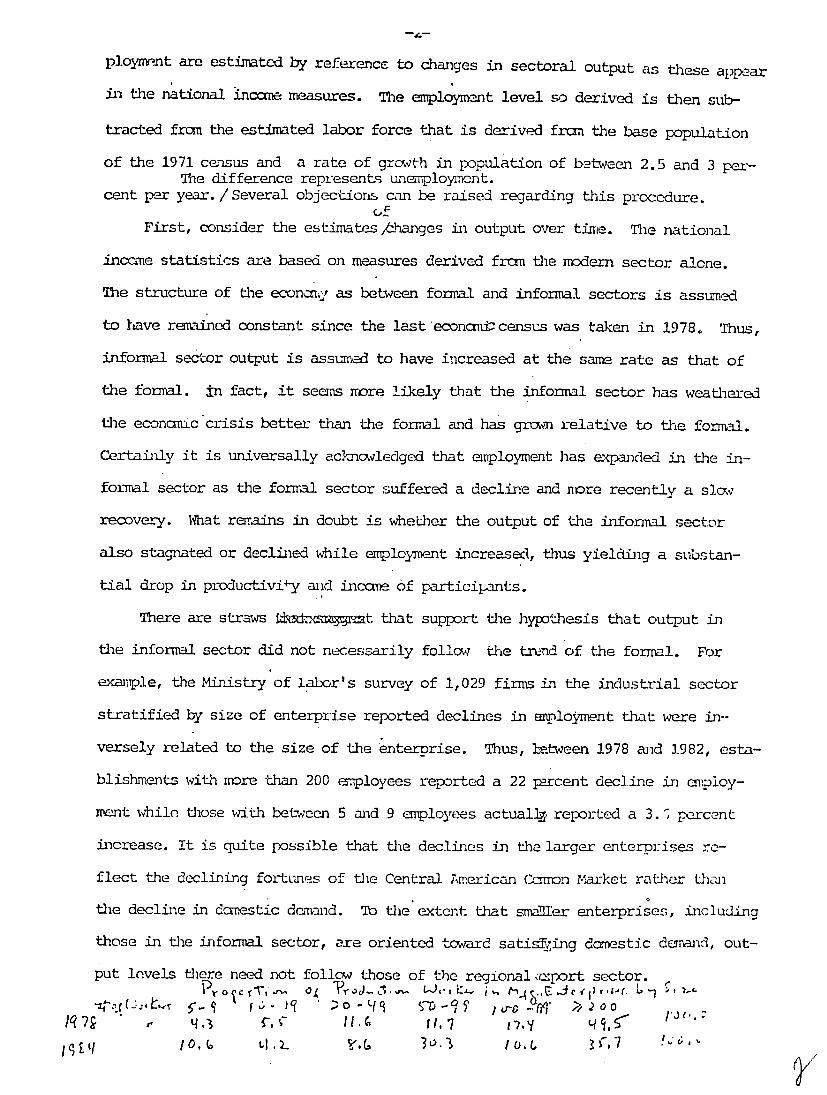
There are straws ibu=mrgmt that support the hypothesis that output in
the informal sector did not necessarily follow the trend of the formal. For
example, the Ministry of labor's survey of 1,029 firms in the industrial sector
stratified by size of enterprise reported declines in anplo j ent that were in-
versely related to the size of the enterprise. Thus, letween 1978 and 1982, esta
blishments with more than 200 employees reported a 22 percent decline in employ
mernt while tiose with between 5 and 9 employees actually reported a 3. , percent
increase. It is quite possible that the declines in the larger enterprises re
flect the declining fortunr- s of the Central 7.merican Ccm=n Market rather thwi
the decline in dcmestic demand. To the extent. that smaller enterprises, includina
those in the informal sector, are oriented toward satisfying dcmestic dEm~nd, out
put levels there need not follow those of the regional r_%port sector.
-q I,6,- jj 0o- '19 S-D - 11 .B 00z
)q7, q,3 r" 11. 11,7 ', Li ,5' it..
0. ,, 3o. I , ,7,
One may also speculate about changes in the pattern of demand for final goods
during a period in which real incomes were falling. It is possible that con
sumers might substitute goods of lower quality and price produced in the informal
sector for those of the formal. Such a shift in demand would imply an increase
in output in the informal relative to the formal sector. Thus, the assimution
of constancy in the structure of the econcry would lead to an underestimate of
the growth (or overestimate of the decline) in GDP and &n underestimate of the
productively engaged labor force. The other side of the coin, of course, is
that for any assumed size of the labor force, the unemployment rate would be
overstated.
Second, it is quite likely that estimates oF the size of the labor force
are exaggexated. As noted earlier, these were derived from the population base
given by the 1971 census and a presumed rate of growth. It is now aclnoledged
by the Population Division of NIPLAN that the earlier forecasts overstated the
growth of population as a result of a failure to take into account the rise in
mortality rates stemming fram the escalation of violence since i979 and of the
sharp increase in emigraticn. It is naq estimated that a ninbar approaching a
half million have emigrated. Migration experience throughout the world gives
rise to the expectation that the migrant stream is heavily weighted by young
people of labor force age. Thus, labor force estimates that fail to tiake into
consideration these two factors will have the effect of overstating its size as
wel as that of the rate of unemployment.
(Me importance of the migration phencmenon be3e apparent during several
of our formal interviews. For example, the presidni of construction contrac
tors association reported that the industry was suffEring a severe shortage of
skiJ led labor in spite of a sharp decline in constr=tion activity. Skilled la
bor has been migrating abroad in large numbers. Thi. was confirmed by the presi
dent of one of the major trade unions of the industry in an interview reported
in the local rress in which he complained that the mxrancies created by the mi
grating tradesmen were being filled by workers from arong the displaced population
//
to the detriment of the established membership of the union. - rntilarly, repre
sentatives of the manufacturers association noted that their manbers were repor
ting the departure of experienced employees for other countries, mainly the U.S.
Infornal conversations with Saivadorans reveals a widespread acquaintance with
numerous cases of knncm departures of friends, relatives, or villagers.)
Third, the appropriateness of the results of the 1980 survey as a baseline
for projections may also be open to question. As I noted above, that survey was
undertaken during months of lad agricultural activity with the result that the
rate of unemployment reported for the agricultural labor force was at. a high
level of 26.3 percent. Since agricultural workers made up about 40 percent of
the labor force, the overall rate of 16.1 percent is heavily w.eighted by that
seasonal phenomenon. Thus, to treat the seasonal unemployment rate as represen
tative of the annual average rate is to depart from a base that overstates the
uneaployment of 1980 (or, conversely, understates the employment level). Thius,
all. su]sequent assigned values will also be distorted.
(I leave aside for the mzment the whole question of how seasonal interruptions
in n2loyment in the rural setting should be treated. Can it be assumled that all in peak seasons
time not occupied in agricultural production/is available for fruitful cplomeant
in other productive pursuits? If not, what proportion would b3 so available? If
the objective is to evalate the economic welfare of the rural population, factors
other than employment may be equally significant, e.g., physical out-ut levels
and the internal terms of trade.)
In short, the estimation procedures emloyed w.ould appear to yield overesti
mations of the supply of labor and an underestimation of the dcmand for labor, tius
lead-ig to an exaggerated notion of the open unemployment rate.
Dipirical Straws in the Wind
In the absence of systematic household surveys, it is to be expected that
estimoes of employment and unemployment will be made on the basis of projections
from some baseline. However, such projections should be evaluated by reference
-5
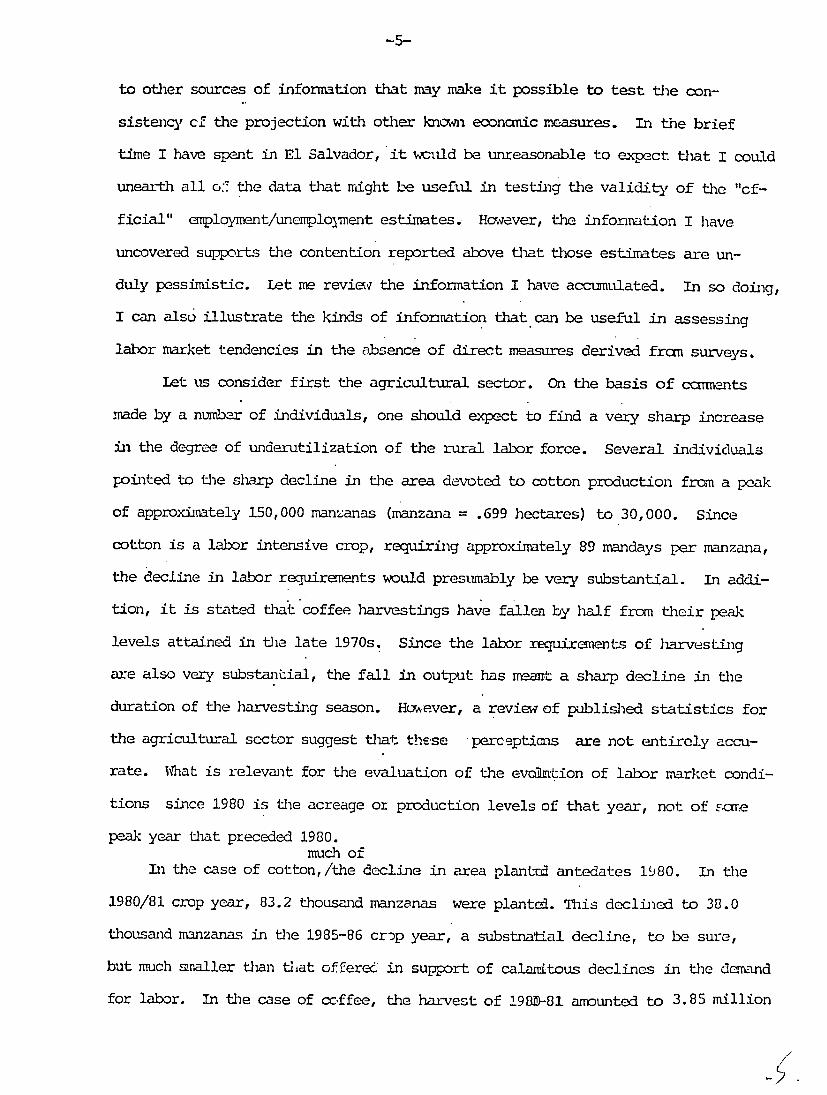
to other sources of information that may make it possible to test the con
sistency cf the projection with othier knomi economic mzasures. In the brief
time I have spent in El Salvador, it woild be unreasonable to expect that I could
unearth all o: the data that might be useful in testing the validity of the "cf
ficial" employment/uneploynent estimates. However, the information I have
uncovered supports the contention reported above that those estimates are un
duly pessimistic. Let me reviw the information I have accummlated. In so doing,
I can also illustrate the kinds of information that can be useful in assessing
labor market tendencies in the absence of direct measures derived frcn surveys.
Let us consider first the agricultural sector. On the basis of ccaments
made by a number of individuals, one should expect to find a very sharp increase
in the degree of underutilization of the rural labor force. Several individuals
pointed to the sharp decline in the area devoted to cotton production from a peak
of approximately 150,000 mananas (manzana = .699 hectares) to 30,000. Since
cotton is a labor intensive crop, requiring approximately 89 mandays per manzana,
the decline in labor requirements would presumably be very substantial. In addi
tion, it is stated that coffee harvestings have fallen by half from their peak
levels attained in Ue late 1970s. Since the labor requirenents of harvesting
are also very substantial, the fall in output has meant a sharp decline in the
duration of the harvesting season. Homever, a review of published statistics for
the agricultural sector suggest that these percepticns are not entirely accu
rate. What is relevant for the evaluation of the evol-Lion of labor market condi
tions since 1980 is the acreage or production levels of that year, not of scme
peak year that preceded 1980. much of
In the case of cotton, /the decline in area plantod antedates 1980. In the
1980/81 crop year, 83.2 thousand manzanas were planted. This declined to 38.0
thousand manzanas in the 1985-86 crop year, a substnatial decline, to be sure,
but much unaller than that offeree. in support of calamitous declines in the darnd
for labor. In the case of coffee, the ha-vest of 198)-81 amounted to 3.85 million
/
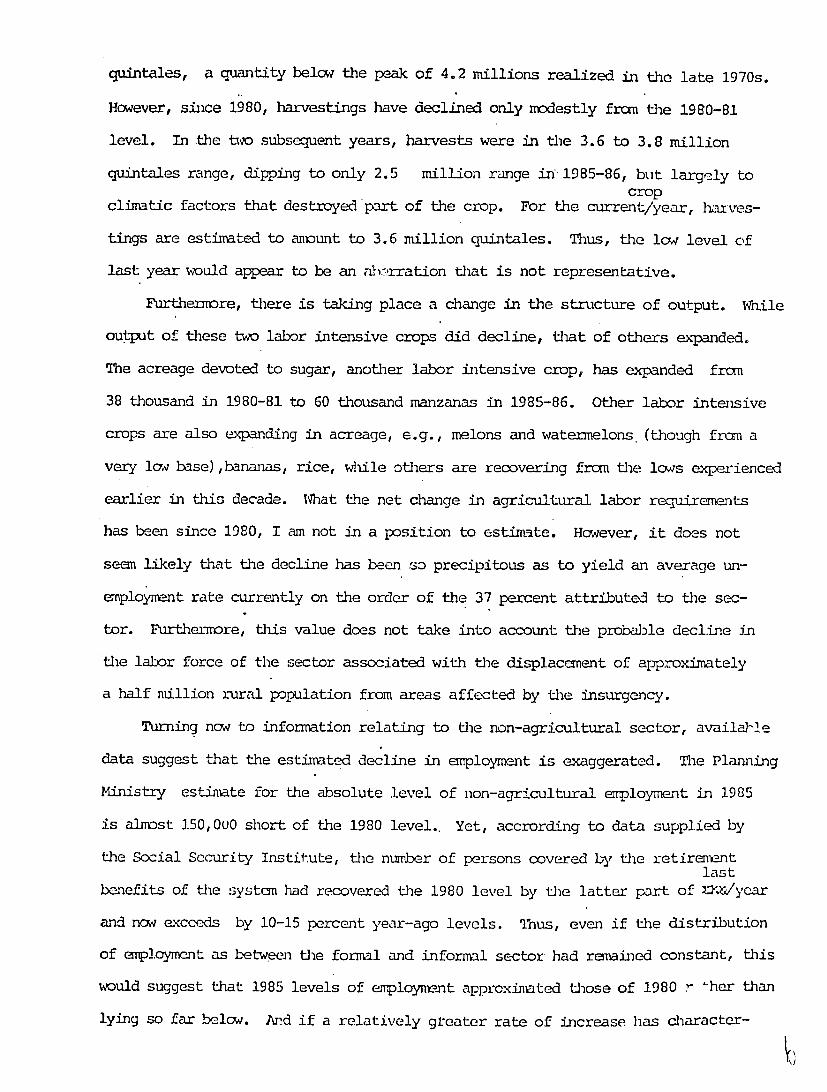
quintales, a quantity below the peak of 4.2 millions realized in the late 1970s.
However, since 1980, harvestings have declined only modestly fron the 1980-81
level. In the two subsequent years, harvests were in the 3.6 to 3.8 million
quintales range, dipping to only 2.5 million range in 1985-86, but largely to crop
climatic factors that destroyed part of the crop. For the current/year, hat ves
tings are estimated to an-unt to 3.6 million quintales. Thus, the low level of
last year would appear to be an nb.)-rration that is not representative.
Furthermore, there is taking place a change in the structure of output. Waile
output of these two labor intensive crops did decline, that of others expanded.
The acreage devoted to sugar, another labor intensive crop, has expanded from
38 thousand in 1980-81 to 60 thousand manzanas in 1985-86. Other labor intensive
crops are also expanding in acreage, e.g., melons and watermelons (though fron a
very law base),bananas, rice, while others are recovering fron the lows experienced
earlier in this decade. What the net change in agricultural labor requirements
has been since 1980, I am not in a position to estimate. However, it does not
seen likely that the decline has been so precipitous as to yield an average un
anploymant rate currently on the order of the 37 percent attributed to the sec
tor. Furthermore, this value does not take into account the probaDle decline in
the labor force of the sector associated with tlhe displacanent of approximately
a half million rural population from areas affected by the insurgency.
Turning now to information relating to the non-agricultural sector, availale
data suggest that the estimated decline in employment is exaggerated. The Planning
Ministry estimate for the absolute level of non-agricultural enployrent in 1985
is almost 150,000 short of the 1980 level.. Yet, accrording to data supplied by
the Social Security Institute, the number of persons covered , the retirement last
benefits of the systcn had recovered the 1980 level by the latter part of =/year
and now exceeds by 10-15 percent year-ago levels. Thus, even if the distribution
of enployment as between the formal and informal sector had remained constant, this
would suggest that 1985 levels of employment approximated those of 1980 r 'her than
lying so far below. And if a relatively greater rate of increase has character
- I
ized informal sector employment, then 1985 arployment levels would be expected
to have been greater than those of 1980.
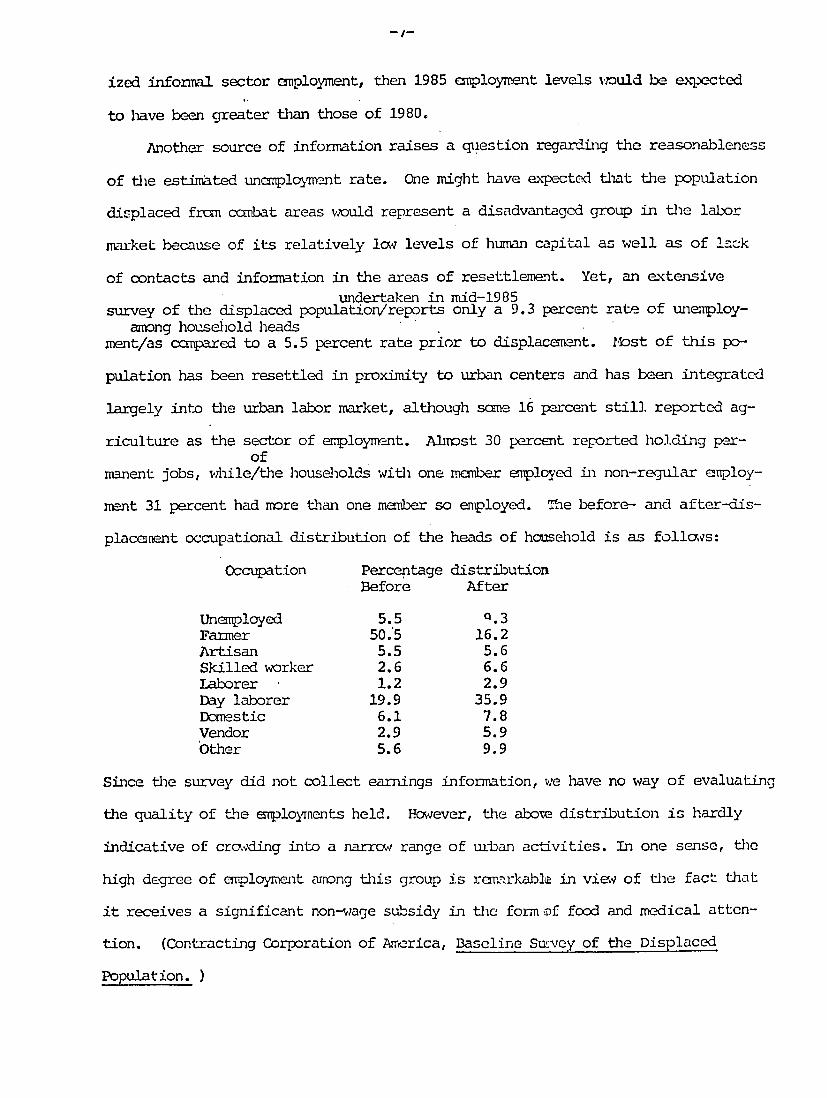
Another source of information raises a question regarding the reasonableness
of the estimated unamplom-nt rate. One might have expected that the population
displaced frcm ccTbat areas would represent a disadvantaged group in the labor
markeL because of its relatively li levels of human capital as well as of lack
of contacts and information in the areas of resettlement. Yet, an extensive undertaken in mid-1985
survey of the displaced population/reports only a 9.3 percent rate of unenployamong household heads
ment/as ccmpared to a 5.5 percent rate prior to displacemant. Most of this po
pulation has been resettled in proximity to urban centers and has been integrated
largely into the urban labor market, although same 16 percent still. reported ag
riculture as the sector of employment. Almost 30 percent reported holding perof
manent jobs, whiile/the households with one member employed in non-regular employ
ment 31 percent had more than one maber so employed. The before- and after-dis
placaeent occupational distribution of the heads of household is as follows:
Occupation Percentage distribution Before After
Unemployed 5.5 0.3 Farmer 50.5 16.2 Artisan 5.5 5.6 Skilled worker 2.6 6.6 Laborer 1.2 2.9 Day laborer 19.9 35.9 Domestic 6.1 7.8 Vendor 2.9 5.9 Other 5.6 9.9
Since the survey did not collect earnings information, we have no way of evaluating
the quality of the employnents held. However, the abow distribution is hardly
indicative of craowding into a narrow range of urban activities. In one sense, the
high degree of employment among this group is remarkab2e in view of the fact iat
it receives a significant non-wiage subsidy in the form of food and medical atten
tion. (Contracting Corporation of America, Baseline Sumey of the Displaced
Population. )
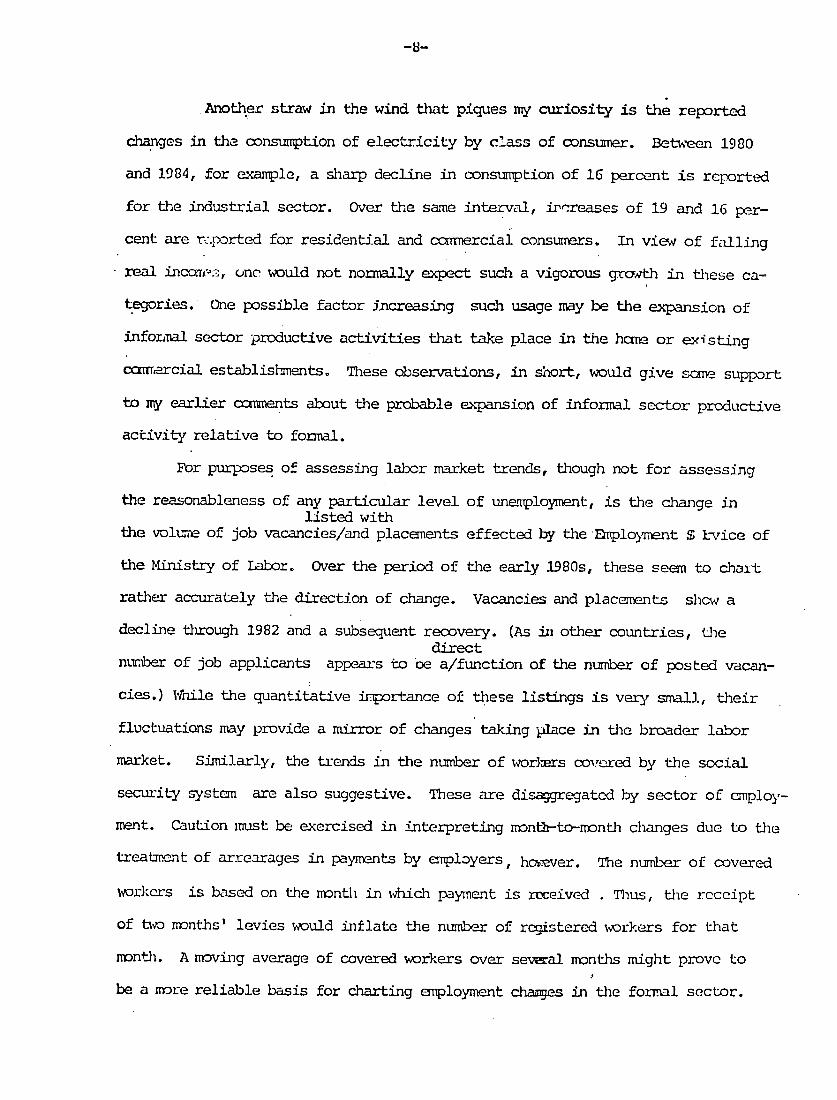
Another straw in the wind that piques my curiosity is the reported
changes in the consumption of electricity by class of consumer. Between 1980
and 1984, for example, a sharp decline in consumption of 16 percent is reported
for the industrial sector. Over the same interval, ir=reases of 19 and 16 per
cent are r:.po.rted for residential and ccrnmercial consumers. In view of falling
real inc.-., one would not normally expect such a vigorous growth in these ca
tegories. One possible factor increasing such usage may be the expansion of
inforial sector productive activities that take place in the hcme or existing
ccT-rcial establishments. These observations, in short, would give sane support
to my earlier ccrinents about the probable expansion of informal sector productive
activity relative to formal.
For purposes of assessing labor market trends, though not for assessing
the reasonableness of any particular level of unemployment, is the change in listed with
the volume of job vacancies/and placements effected by the Emplo)nt S Ivice of
the Ministry of Labor. Over the period of the early 1980s, these seem to chait
rather accurately the direction of change. Vacancies and placements show a
decline through 1982 and a subsequent recovery. (As ii other countries, the direct
n rber of job applicants appears to be a/function of the number of posted vacan
cies.) Wnile the quantitative iportance of these listings is very small, their
fluctuations may provide a mirror of changes taking place in the broader labor
market. Similarly, the trends in the number of workers covered by the social
security system are also suggestive. These are disaggregated by sector of employ
ment. Caution must be exercised in interpreting month-to-month changes due to the
treatment of arrearages in payments by employers, howver. The number of covered
workers is based on the month in w-hich pay7nnt is rcceived . rnius, the receipt
of to months' levies would inflate the number of registered workers for that
month. A moving average of covered workers over seveal months might prove to
be a more reliable basis for charting employment cha.es in the formal sector.
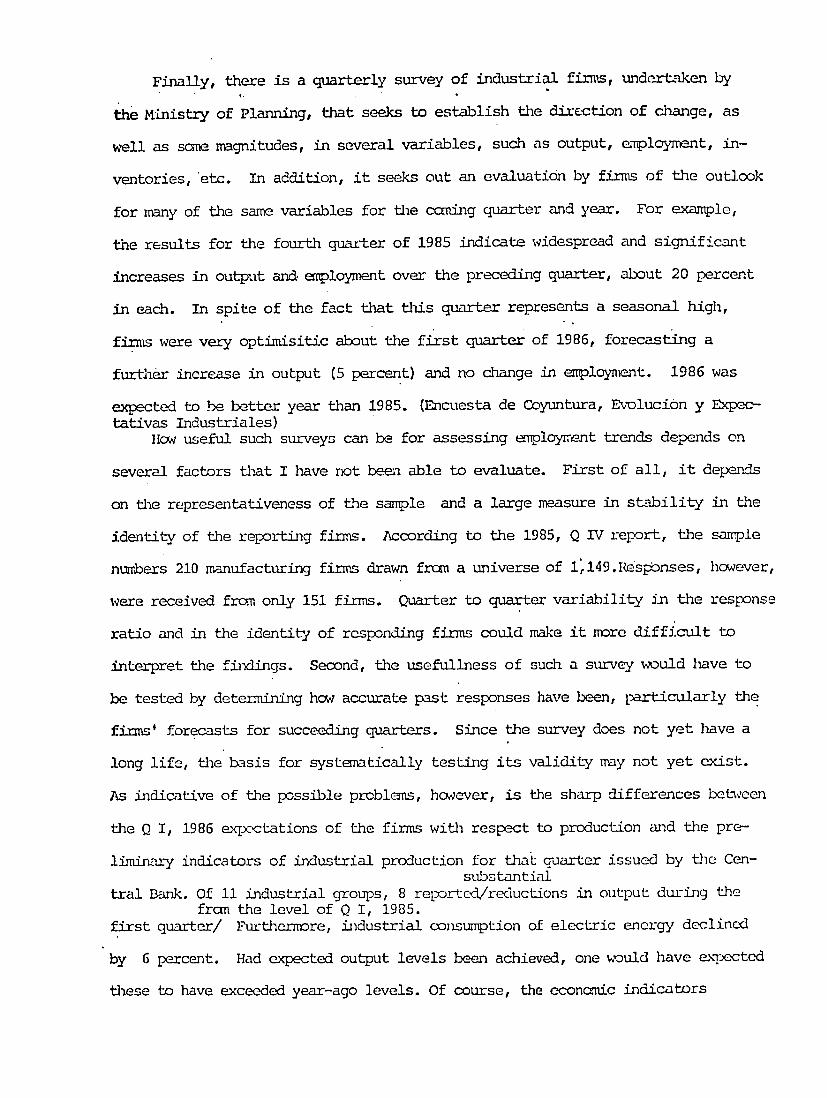
Finally, there is a quarterly survey of industrial firms, undertaken by
the Mnistry of Planning, that seeks to establish the direction of ch-ange, as
well as sane magnitudes, in several variables, such as output, employment, in
ventories, etc. In addition, it seeks out an evaluation by firms of the outlook
for many of the same variables for the caning quarter and year. For example,
the results for the fourth qua-zter of 1985 indicate widespread and significant
increases in output and employment over the preceding quarter, about 20 percent
in each. In spite of the fact that this quarter represents a seasonal high,
firms were very optimisitic about the first quarter of 1986, forecasting a
further increase in output (5 percent) and no change in employnent. 1986 was
expected to -be better year than 1985. (Encuesta de Coyuntura, Evolucion y Expectativas Industriales)
How useful such surveys can be for assessing erploy-ent trends depends on
several factors that I have not been able to evaluate. First of all, it depends
on the representativeness of the sample and a large measure in stability in the
identity of the reporting firms. According to the 1985, Q IV report, the s-Mple
numbers 210 manufacturing firms drawn frcn a universe of 1,149.lesponses, however,
were received from only 151 firms. Quarter to quarter variability in the response
ratio and in the identity of responding firms could make it more diffi.cult to
interpret the finxlings. Second, the usefullness of such a survey would have to
be tested by determining how accurate past responses have been, particularly the
firms' forecasts for succeeding quarters. Since the survey does not yet have a
long life, the basis for systematically testing its validity may not yet exist.
As indicative of the possible problems, however, is the sharp differences between
the Q I, 1986 expctations of the firms with respect to production and the pre
limimary indicators of industrial production for thaL quarter issued by the Censubstantial
tral Bank. Of 11 industrial groups, 8 reported/reductions in output during the fran the level of Q I, 1985.
first quarter/ Furthermore, inidustrial consumption of electric energy declined
by 6 percent. Had expected output levels been achieved, one ,uld have e\Tcted
these to have exceeded year-ago levels. Of course, the econaic indicators

may also prove to be preliminary in nature and subject to considerab le
revision. In short, this survey of manufacturing firms could prove to be a
useful indicator of imnediately past trends if its reliability can be established.
Short-Terni Measures for Supplenenting Existing Information
lne most prcrising development for providing a reading of labor market
conditions is the completion of a household Euployment survey during the final
quarter of 1985. The tabulation of the results by MIPLAN is awaiting the deli
very of a new computer with sufficient capacity to manage the information. It is
expected that preliminary tabulations will be available in August. I have re
viewed the questionnaire that was applied and find that it is quite well con
structed and thorough. Apparently, the Ministry had the assistance of a con
sultant from PREALC (the ILO's Latin American office on employmrent) in preparing
the questionnaire.
The one weakness that I detect is the absence of personnel skilled in labor
market analysis to undertake an analysis of the data. It may be worthw.hile to
consider engaging a person with such skills to review the initial tabulations
and to determine nether a more detailed analysis might be worthwhile. It should
be noted, however, that this survey will be useful only for purposes of indicating
relative distributions of the labor force over various categories. In the ab
sence of a population census or an accurate estimate of the size and distribu
tion of the population, the proper expansion factor for projecting the sample
results to the universe is indeterminable.
However, the sampling division of MIPIAN believes that considerable improve
ment can be wade in the sampling frame on which the si-vey is based. The division
head, Sr. auricio Alens, believes that such a revisn is possible and that it
could contribute a substantial improvement in the relfability of the survey re
sults. I am in no position to evaluate the extent of the improvenent that can
be made in the absence of a carplete population censzi. I would suggest that
an expert in sample design, perhaps from the US Census Bureau, be asked to
reviea the current samplinrg methodology and the possibilities for effectLng
a significant improvement. The cost of developing an improved sampling frame
is estimated at between 1 and 1.5 million colones.
Obviously, the wisdcm of undertaking such an expenditure depends on whe
ther the Ministry will be able to continue to carry out periodic household sur
veys. Apparently, it is hoped that that will be possible on at least an annual
if not a semi-annual basis (thus capturing the principal seasonal variations
in labor market activity). The Sampling Division would like to maintain a per
manent staff for purposes of effecting the survey, utilizing the same persons
for interviewing and coding, thus providing continuous employment and maintaininig
the acquired skill in effecting the survey. This would clearly be optimal, since
there is considerable airount of learning involved in properly applying the in-ter
view schedule and interpreting the responses for coding purposes. Thus, the reand ccmparability
liability/of the results would depend on maintenance of a high degree of sta
bility in a well trained staff.
The regular admnf'istration of such a .survey would clearly 3epresent the op
timal way of maintaining a continuing monitoring of labor market conditions. The
cost of each such strvey appears to me to be quite modest, on the order of one
million colones for data collection and processing. if MIPLAN is reluctant to
comnit the resources to a biennial survey, USAID might consider sharing the
cost. Since many of the houschold surveys in the past have been nmulti-purpose
in character, they could also be used to address other issues as well.
While I have discussed this measure as a short-term response, it should be
obvious that it represents the optimal long-trm approach as well. (I have con
sidered it under "short-term" responses only because such a survey has been al
ready cacpleted and because the Ministry apprently is considering the feasibility
of regularizing them.) While all of the other kinds of information that are
available are useful and indicative of directions of change in employment condi

tions, none are able to provide an accura e quantitative measure of clange.
In particular, they overlook activity in the informal sector. For purposes
of this sector, a household survey is likely to be the only reliable way of
determining enployment conditions in that critical sector.
It should be mentioned that there is a program fr the pranotion of small
enterprises (PROPEM.E, a division of MI3SADES) They undertook a survey of small
and micro-enterprises with a view to determining what needs they had, eg. financing,
technical assistance, skill enhancement, etc., and to undertake to response to
those needs. These are all enterprises that would be considered "infornal" sector
producers and provie mrs of services. Over time, this entity could beccxna a valuable
source of information leading to an improved understanding of the role of the
informal sector in the economy. Alternatively, its Oniverse of firms could
serve as a basis of special surveys designed to illuminate various aspects of
their operation. (The concept of "firm" is used loosely here, since PROPLM.1
considered any small unit, including itinerant vendors, as finr .) However, it
is unlikely thiat such a survey would cast much more light on the employment con
ditions of the informal sector than would a well-executed and designed household
survey.
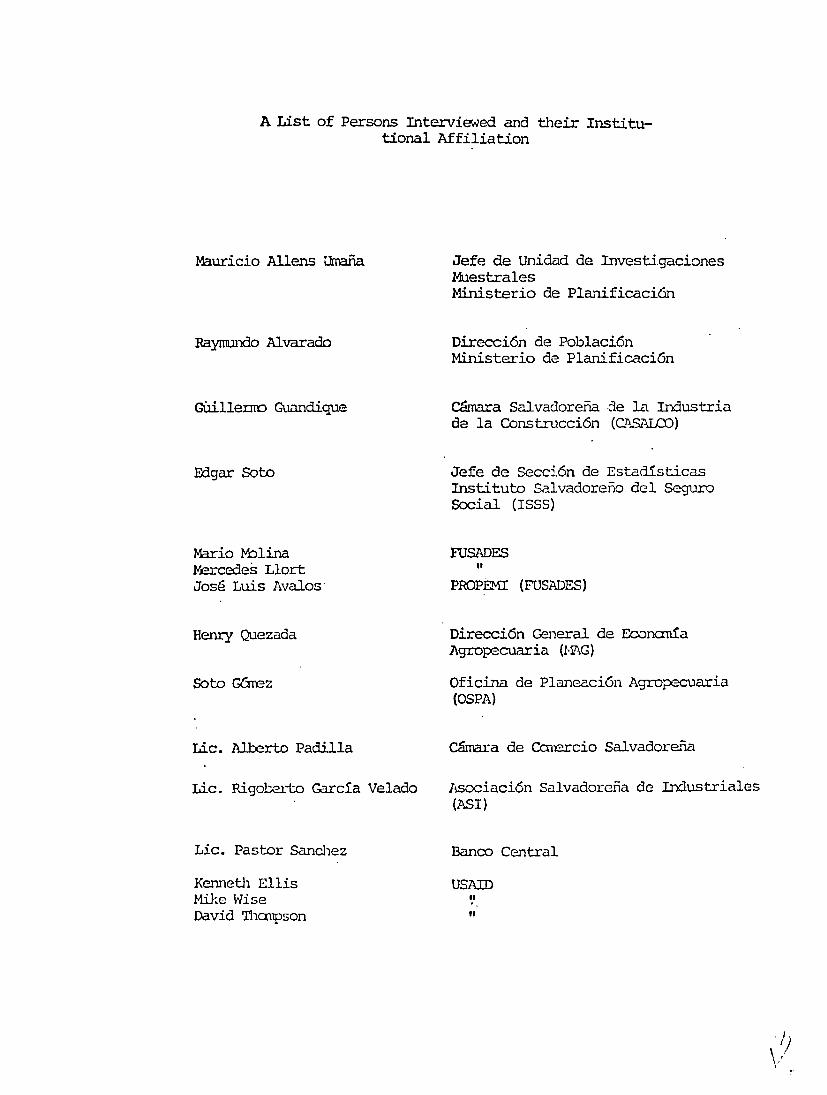
A List of Persons Interviewed and their Institutional Affiliation
Mauricio Allens Unafia
Raymundo Alvarado
Guillermo Guandique
Edgar Soto
Mario Molina Me4rcede s Llort Jose Luis Avalos
Henry Quezada
Soto GCzm z
Lic. Alberto Padilla
Lic. Rigobe to Garcia Velado
Lic. Pastor Sanchez
Kenneth Ellis Mike Wise David Thcrpson
Jefe de Unidad de Investigaciones Muestrales Ministerio de Planificaci6n
Direcci6n de Poblaci6n Ministerio de Planificaci6n
C mara Salvadorefia de la Industria de la Construcci6n (CASALcO)
Jefe de Secci6n de Estad-sticas Instituto Salvadorefio del Seguro Social (ISSS)
FUSADES "
PROPEMI (FUSADES)
Direcci6n General de Econamna Agropecuaria (l flG)
Oficina de Planeaci6n Agropecuaria (OSPA)
CMnara de Ccnxrcio Salvadorf-a
Asociaci6n Salvadoreia de Industriales (ASI)
Banco Central
USAID "
VI.