HEALTH CARE FINANCING A Preliminary Financial Study …pdf.usaid.gov/pdf_docs/PNAAV998.pdf ·...
48
HEALTH CARE FINANCING A Preliminary Financial Study of the Health Care System on St. Vincent and the Grenadines January 1982 Management Sciences for Health 141 Tremont Street Boston, Massachusetts 02111
Transcript of HEALTH CARE FINANCING A Preliminary Financial Study …pdf.usaid.gov/pdf_docs/PNAAV998.pdf ·...

HEALTH CARE FINANCING
A Preliminary Financial Study of the Health Care System on St. Vincent and the Grenadines
January 1982
Management Sciences for Health 141 Tremont Street Boston, Massachusetts 02111

INTRODUCTION
The countries of the Eastern Caribbean are committed to the goal of health for all by the year 2,000, to the resolutions of the World Health Organization on primary health care and to the global targets contained in these resolutions. The individual countries are now in the process of fol
mulating policies and plans with which to meet this commitment.
Implementation of policies and plans require financial and'other resources. Financial resources are limited in all countries and there are always competing claims. Should governments invest more money in agricultural development, education or health? There are many alternative investments which would have a beneficial impact on the well-being of the population. It is, therefore, important that policies and plans be adopted that are: first, financially possible; and second, make maximum possible use of the financial resources availab le.
Among the resolutions tabled at the Health Ministries' conference 1981 is one requesting the Secretary General of CARICOM to seek the cooperation of interested agencies in helping member states meet their commitment to health for all through a primary health care strategy. In this context, USAID/Barbados plans to develop a primary health care project for funding in FY 1983. This one objective of this prelimiriry financial study is to provide those who will eventually be responsible for the design of that project, with a general description of health care financing in several of the member states. This study should also prove useful to policy makers and planners when they consider the financial implications of alternative policies and plans.
USAID/Barbados sought answers to several categories of financial questions. First, what are the current expenditure breakdowns between preventive and curative services, between in-patient and outpatient care, and between the public and private sectors, and among personal emoluments, commodities and capital costs? They also wanted an identification of current primary health care expenditures and an analysis of expenditure trends. Second, what are the sources of the revenues from which the expenditures are financed and what are the current trends in these sources? Sufficient information was found to answer most of these questions with considerable specificity.
Third, USAID posed several questions dealing with the consistency between current and future health policies ani plans and current financial allocations. Answers to these questions tend to be general, not specific in nature, because new health policies and plans are now being formulated. A financial assessment of these policies and plans will require, first, further specification of implementation details and second, a more in-depth analysis of the financial implications implicit in these details.

fourth and final category of questions dealt with the feasibilityUSAID's The mechod by which a country financesof alternative financing mechanisms.
its health care system is a political and historical question more than a willing tofinancial one. One indicator of the degree to which people are
of quality health services is the sizepersonally contribpute towards the cost
of the private sector where they pay directly for goods and services. The
size and corposition of the private sector was investigated in considerable
alternative financing mechanism, a self-financingdetail. In addition, one
revolving fund for drugs, was investigated in considerable detail in a country
where both the financial and political ;,ariables suggested that it might be a
feasible alternative. This investigation could serve as a model for the
analysis of other alternative financing mechanisms in other countries.
Preliminary financial studies of health care systems were carried out in
Vincent and the Grenadines, St. Kitts/Nevis, and Dominica.three countries, St.
In addition, a preliminary investigation wac made into the feasibility of
establishing a self-financing mechanism for drug distribution on Dominica.
It should be stressed again that these studies are preliminary in nature. sytems and deservingThe questions of finance are central to all health care
of much more time. In particular, further financial analysis and planning
should be done as each country develops five-year plans for the health sector.
The recurring costs of the incrzesed and improved services implicit in these
plans needs to be estimated carefully, and where necessary, alternative
financing mechanisms investigated in acccordance with country-specific prior.
ties. Similarly, the recurring cost implications of the new USAID project
should be carefully estimated and compared to resource availability.
In brief, this series of studies goes quite a long way towards defining
current financial resource availability and makes some projections about
future availability and makes some projections about future availability. The
next, and equally important step, is to carefully estimate future financial
resource needs in the light of policies, plans and projects which are now
being formulated. It may turn out that alternative financing mec'anisms will
in those cases where the projected needs exceed projected availability.be needed
ii

Acknowledgments
This preliminary financial study of the health care system on St. Vincent and the Grenadines was made possible by the Perzranent Secretary of Health, Mr. Owen Cuffy. Despite a hectic daily schedule, he managed to find t'ime to discuss financial issues and to arrange apopointments with his staff. Two of his staff also deserve special thanks. Mr. Carl Brown, Health Educator, helped by locating sources of financial information and by spending many hours after work discussing the problems of health care financing. Mrs. Vernie Bowman, Senior Nursing Otficer, took time out from her busy schedule and provided most of the reports from which health statistics were drawn for use in this report. These and other officials demonstrated a level of competence and dedication which, if matched by financial resources, assure thaL the future development of health care on St. Vincent and the Grenadines will be both rapid and cost-effective.
iii

TABLE OF CONTENTS
Introduction i
Acknowledgments iii
Table of Contents iv
List of Tables v
I. Recurrent Government Revenues 1
II. Government Health Sector Allocations 3
III. Service Breakdown of Recurrent Government Health Expenditures 6
IV. Cost of Services Delivered 9
V. Uses of Funds 15
VI. Capital Expenditures 18
VII. Private Sector Expenditures 21
VIII. Sumary and Reconnendations 24
Appendix A: Supporting Tables 26
iv

LIST OF TABLES
Table 1: Recurrent Government Revenues 1 Table 2: Proportion of Governments Recurrent Financial Resources Allocated
to Health 3 Table 3: Government Health Sector Purchasing Power 4 Table 4: Classification -f the 1981/1982 Government Health Budget by Type
of Service 7 Table 5: Health Status Indicators on St. Vincent and the Grenadines 9 Table 6: Estimated Unit Cost of Important Community-Based Services 11 Table 7: Indicators of Service Delivery at Kingstown General Hospital 13 Table 8: Estimated 1981/1982 Unit Operating Costs at Kingston General
Hospital 13 Table 9: 1981/1982 Estimated Cost per admission at three Rural Hospitals 14 Table 10: Comparison of Personal Emoluments to Other Charges 15 Table 11: Amount Budgeted for Other Charges per Employee 16 Table 12: Comparison of Government and Health Sector Capital Budgets 18 Table 13: 1981/1982 Health Sector Capital Budget by Project Category 19 Table 14: Estimate of Financial Size of Private Health Sector in 1981/1982 22
Table Al: Recurrent Revenue of the Government of St. Vincent and the Grenadines 26
Table A2: Allocation of Personal Emoluments in 1981/1982 Estimates by Type of Service 28
Table A3: Allocation of Other Charges in 1981/1982 Estimates by Type of Service 31
Table A4: Estimation of Community Health Nursing Service Cost 34 Table A5: Estimation of Cost of D.M.O. Clinics 35 Table A6: Estimated 1981/1982 Operating Cost of Kingstown General Hospital 36 Table A7: Estimated 1981/1982 Operating Cost of Three Rural Hospitals 37 Table A8: Comparison of Government and Health Sector Capital BudgeLs by Source 38 Table A9: Health Sector Capital Budgets Broken down by Projects 39 Table AlO: Estimated Private Sector Drug Sales 41

I. RECURRENT GOVERNMENT REVENUES
The Government of St. Vincent and the Grenadines provides about half of all health care services free of charge to the population. The other half of health care services are provided on a fee for service basis by the private sector. (See Section VII below.) The Government finances its share from general revenues, the greatest proportion of which is raised from taxes on imports (52"). Income taxes account for an important and stable share (17% in 1981/1982.
The rate of increase in government revenues is one indicator of its capacity to expand health services, since it is much easier to allocate new, previously uncommitted, funds in accordance with new priorities, than it is to re-allocate old funds. Table 1 shows that estimated revenues in current E.C. dollars increased at an annual rate of 21.4% between fiscal years 1976/ 1977 and 1981/1982, while the rate of increase in actual revenues between 1975/1976 and 1980/1981 was 20.4%. The rate of inflation, however, as indicated by the retail price index was 13.3% between January 1976 and January 1981. The annual rate of increase in the Governments' purchasing power was, therefore, much less. The purchasing power of the revenue budget has increased about 6.9% per year while that of actual revenues increased 6.3% per year.
TABLE 1: RECURRENT GOVERNMENT REVENUES(1)
FISCAL CURRENT $ ($000 EC) PRICE(2) PURCHAqING POWER ($000 EC) OVER OR
YEAR ESTIMATE ACTUAL INDEX ESTIMATE ACTUAL UNDER
1981/82 70,881 586.3 62,563
1980/81 48,229 45,767 517.5 48,229 45,767 -5
1979/80 43,166 44,799 432.0 51,709 53,665 +4
1978/79 32,368 39,155 375.4 44,620 53,976 +21
1977/78 28,613 30,881 331.0 44,735 48,281 +8
1976/77 26,835 22,432 309.2 44,913 37,544 -16
1975/76 18,100 277.2 33,791
AVE: %(3) 21.4 20.4 13.3 6.9 6.3 +2

2
(1) Table I is derived from Table Al in Appendix A. Detailed notes on sources are provided with Table Al.
(2) The index of retail prices was obtained from the Department of Statistics, Ministry of Finance, Planning and Development. March 1964 = 100. The January Figure was used, since January comes in the middle of the fiscal year. The figure for 1981/82 is a projection using the rate of increase (13.3%/year) experienced during the previous 5 years. Preliminary information on the first 6 months of 1981 suggest, however, that the rate of retail price increase slowed dramatically.
(3) In the first 5 columns, the figure given is the annual rate of growth (%) required to achieve the top figure in each column using the bottom figure as a base. The figure in the right-hand column is a weighted average also expressed in terms of per cent.
The six to seven per cent per year increase in purchasing power is significant. It represents a real increase in the Government's ability to buy goods and services for its people of approximately $32.00 per year. Should increased outlays be necessary to finance the recurring costs of an improved primary health care system with increased population coverage, the government currently has expanding resources which could be used in this way.
There will, however, be many computing claims on the limited annual increase in purchasing power. Some of these claims may deserve higher priority than expansion of free health services. Possibilities include expanded education services, agricultural research and development, improved roads and port facilities, etc.
It is interesting to note that "medical revenues" have increased more slowly than other revenues, exceeding the rate of inflation by only 1.4% per year. Further investigation might indicate that many people would be willing to contribute more financially for certain health services, if they had confidence in the quality of those services.

3
II. GOVERNMENT HEALTH SECTOR ALLOCATIONS
The Government of St. Vincent and the Grenadines demonstrates the priority it places on health services by allocating 14% of its recurrent budget to those services. This proportion is large compared to many other countries; allocations of seven to eight per cent being much more common.
Analysis of expenditure information indicates that the government's health sector spends apporoximately 98% of its budget. The government as a whole, however, overspends its budget by 12%. The health sector is apparently much less successful than other sectors in obtaining supplemental financial allocations during the year. Thus, expenditure3 in the government's health sector average 13% of total government spending.
TABLE 2: PROPORTION OF GOVERNMENT'S RECURRENT FINANCIAL RESOURCES(l) ALLOCATED TO HEALTH
FISCAL HEALTH ALLOCATION(2) TOTAL GOVERNMENT HEALTH YEAR (S000 E.C.) % ($000 E.C.) % SHARE (%)
OVER/ OVER/ ESTIMATE ACTUAL UNDER ESTIMATE ACTUAL UNDER ESTIMATE ACTUAL
1981/82 9,278 68,394 14
1980/81 6,444 47,894 13
1979/80 5,906 5,566 -6 43,166 47,330 +10 14 12
1978/79 5,253 5,277 0 31,323 41,062 +31 17 13
1977/78 3,949 3,871 -2 28,613 30,303 +6 14 13
1976/77 3,829 3,920 +2 26,835 26,724 0 14 15
1975/76 3,567 24,536 15
AVE. %(3) 19.4 11.8 -2 20.6 17.9 +12 14 13
(1) All figures are taken or derived directly from the "Estimates" for 1976/77 through 1981/82.
(2) The "Health Allocation" figures incl dc. both the administrative costs of the Ministry aad the direct costs of providing medical and health services to the population. The figures for 1979/80 and earlier years were adjusted to reflect the community development function of the Ministry. The community development items were fairly easily identified in the budgets. The proportion expended was assumed to be the same for the health and community development functions.
(3) The annual growth rate (%) required to reach the top figure starting with the *bottom figure is given in all columns denominated in SO00 E.C. A weighted average is given in all columns denominated in per cent.

4
Table 3 presents a little more pessimistic picture. The purchasing power of actual expenditures in the Government's health sector was almost unchanged, comparing 1979/80 with 1975/76. In fact, 1979/80 expenditures represented an 8% decline in purchasing power from 1078/79 expenditures. This problem can also be seen in the right-hand columit of Table 2. The share of government expenditures devoted to health has dropped from a high of 14.7% in 1976/77 to 11.8% in 1979/80.
TABLE 3: GOVERNMENT HEALTH SECTOR PURCHASING POWER(l)
FISCAL CURRENT $ ($000 E.C.) PRICE PURCHJLSING POWER % (JAN.'81 $000 E.C.) OVER/
YEAR ESTIMATE ACTUAL INDEX ESTIMATE ACTUAL UNDER
1981/82 9,278 586.3 8,189
1980/81 6,444 517.5 6,444
1979/80 5,906 5,566 432.0 7,075 6,668 -6
1978/79 5,253 5,277 375.4 7,241 7,274 0
1977/78 3,949 3,871 331.0 6,174 6,052 -2
1976/77 3,829 3,920 309.2 6,408 6,561 +2
1975/76 3,567 277.2 6,659
AVE. %(2) 19.4 11.8 13.3 5.0 0.0 -2
(1) Current $ figures are the same as those used for the "Health Allocation" in Table 2. The Price Index is the same as the one used in Table 1. (See note (2) under that-table.)
(2) In the first 5 columns, the figure given is the annual rate of growth (%)required to achieve the top figure in each column using the bottom figure as a base. The figure in the right-hand column is a weighted average.
Budget data look somewhat better. The 1981/82 estimate represents a 27% increase in purchasing power over 1980/81 and a 27.8% increase over 1976/77. It should be noted, however, that most of the 1981/82 increase is due to a government-wide salary increase, which is unlikely to be repeated on the same scale in the near future. There is likely to be a significant increase in the purchasing power of 1981/82 expenditures. This increase, however, doesn't appear to be the start of a new trend. Barring a change in government policy, future increases in current dollars are likely to offset inflation only.
Tf, as seems li,.ely in the case of St. Vincent and the Grenadines, the objec ve of health for all requires real increases in funding for primary health care, there appear to be only 4 ways to get those funds.

5
1. The decline in government health expenditures relative to total expenditures can be slowed, stopped or reversed. This depends on national policy.
2. Within the government health sector, resources can be reallocated, giving primary health care a greater share. This depends on health policy. Implicit in this alternative is the difficult-to-implement reduction in funding for services not considered to be primary health care, notably hospital services. The current large capital development budget for Kingstown General Hospital makes this alternative still less likely.
3. Within the primary health care subsector improved cost-effectiveness can lead to an expansion of services without increasing financial outlays. Health Policy, however, already seems to be taking advantage of some of the major sources of savings; for example, use of less expensive auxiliary personnel to perform certain specified functions that might othe.rwise require the attention of more highly trained and more expensive personnel.
4. Conmunity participation can be developed. The community can provide services in kind thereby reducing the need for government funding or the community can reimburse the government for some of the services and materials it receives through some form of alternative financing mechanism.
All of the above possibilities should be evaluated in the context of the five-year health plan which is currently being developed.

6
III. SERVICE BREAKDOWN OF RECURRENT GOVERNMENT HEALTH EXPENDITURES
The Government's health expenditures support a broad range of services from sanitation to specialized hospital care. They also support a training program for nurses, nursing assistants and community health aids, as well as a health ministry that oversees the operation of the health system and manages its further development. Table 4 provides a preliminary classification of government health expenditures by the type of service they support.

TABLE 4: CLASSIFICATION OF THE 1982 GOVERNMENT HEALTH BUDGET BY TYPE OF SERVICE
Preventive Services
$000 E.C. %
Curative Services
$000 E.C. %
Sub total IleailtLh Services $000 E.C. %
Training 3uLpport $000 E.C. %
Administrative Support
$000 E.C. %
Sub total Support Services
$000 E.C. %
Total
$000 E.C. %
Community based 1,483 22 880 13 2,363 35 350 25 373 33 723 29 3,086 33
inpatient 4,392 65 4,392 65 1,049 75 749 67 1,798 71 6,190 67
Sub Total Health Services 1,483 22 5,272 78 6,755 73
Training 175 12.5 1,224 87.5 1,399 55
Administration 228 20 894 80 1,122 45
Sub total
Support Services
403 16 2,118 84 2,521 27
Total 1,886 20 7,390 O 9,276
NOTE: This breakdown is approximate. The dividing line between preventive and curative services is not clear.
For example, early case detection and treatment of infant diarrhea is a curative service, in that sick children are identified and treated. It is also, however, a preventive service, since a major purpose is to prevent dehydration which frequently results from diarrhea.
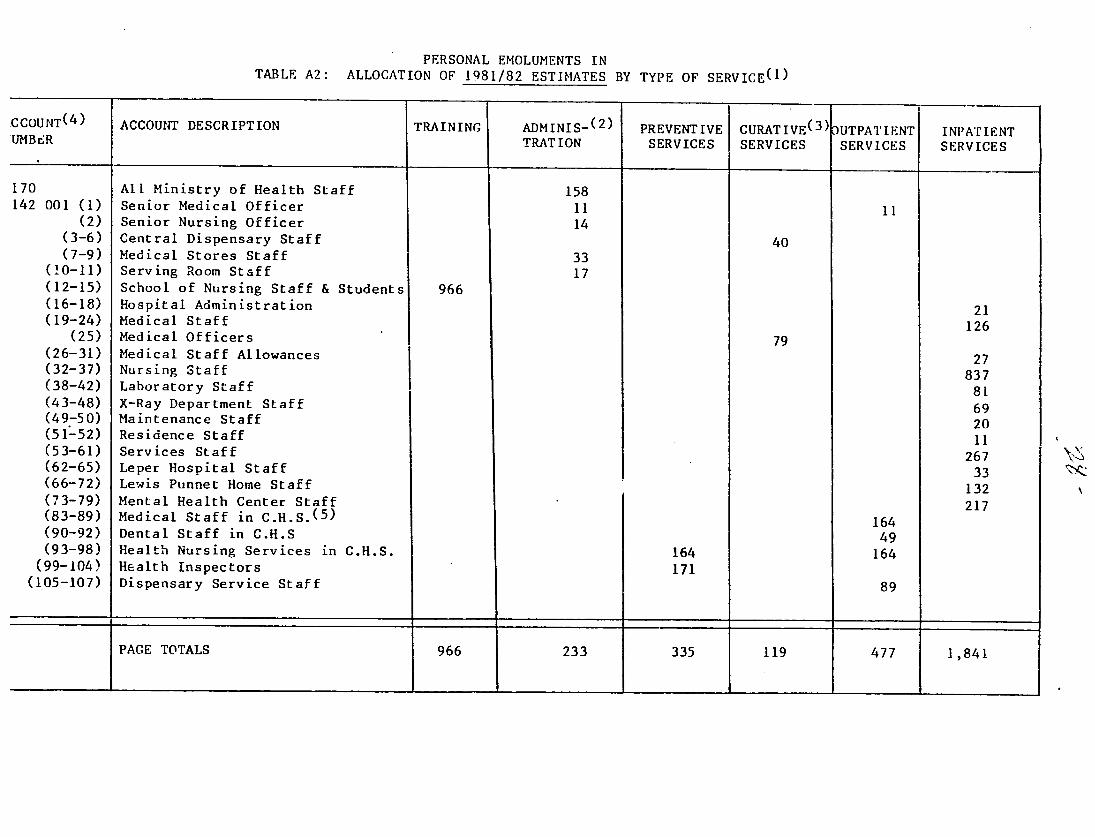
Tables A2 and A3 in Appendix A provide the detailed allocations by budgetary line item. These allocations involved a good bit of judgement. They are not based on standard objective criteria. Someone more familiar with 0ie health system could certainly refine and improve upon these allocations.
\

8
The right-hand column in Table 4 shows that roughly two thirds of the government' health expenditures support the provision of inpatient services. The remaining one third supports "Community-based Services", the combination of all preventive services plus outpatient services. "Community-based Services" are primary health care services. As the government starts to implement policies and plans in support of its commitment to primary health care as a strategy for achieving health for all by 2000, the share of community-based services in government expenditures will probably increase. While the allocation is admittedly subjective, and comparisons with ot!.er countries are of questionable validity due to varying health conditions, Table 4 does suggest that community-based services are underfunded and accorded relatively low priority at the present time.
The bottom row in Table 4 shows that roughly four fifths of the government's health expenditures support provision of curative services. The remaining fifth supports preventive services. Again, the government's primary health care strategy will probably result in a shift of government resources towards cost-effective preventive services. There are no hard and fast guidelines for the allocation of financial resources between preventive and curative services, however, a twenty percent allocation for preventive services seems low.
The $1,122,000 allocation for "Administrative Support" services overstates the allocation for administration, because it includes funds which could not easily be divided among the three types of health services. (See the note at the bottom of Table A3 in Appendix A.) The actual amount being allocated for administration deserves further study. The most cost-effective way to increase the quality and quantity of services being delivered could be to improve the level of administrative support activities; for example in logistics, supervision, information, planning and finance.
It should also be noted at this time that the current format of the "Estimates" is not very useful from a management or planning perspective. Tables A2 and A3 show the current format. It is basically a line item budget. There is almost no differentiation either by institution or by type of activity. (Note that there is some division of personnel by institution.) The lack of budgets for individual institutions makes it difficult to delegate meaningful responsibility to those institutions. Institutional budgets would also aid in calculating the unit costs associated with the services being provided. St. Kitts/Nevis uses a budget broken down by institutions and has delegated considerable budgetary responsibility to institutional managers.
Program budgeting is not very easy to apply in health, because of the tendency for institutions and individuals to provide a wide range of services. Program budgeting is easiest to apply where services are provided through vertical programs. Nevertheless, Dominica uses program budgeting. On St. Vincent and the Grenadines consideration should be given to a combination of institutional and geographical budgeting. Health districts would each have their own budget. In addition, any large institution with anticipated expenditures exceeding $100,000 should have its own budget.

9
IV. COST OF SERVICES DELIVERED
The health status of the population on St. Vincent and the Grenadines is relatively good, particularly considering the level cf economic development and the relative remoteness of certain population groups. Birth and death registration is believed to be virtually complete. There is however, reason to doubt information on the size of the population. Projections had put the 1980 population at about 120,000. The 1980 census counted ju3t under 100,000. Since population is the denominator in the birth and death rates given below, these figures should be used with caution. There is also a relatively small discrepancy in the number of births and infant deaths for 1978 and 1979 between the 1979 Digest of Statistics and the "Fifth (1980) Annual Report of the National Family Planning Programme."
TABLE 5: HEALTH STATUS INDICATORS ON ST. VINCENT AND THF GRENADINES
(1) (2) (3) (A) (5) YEAR POPULATION BIRTH RATE DEATH RATE INFANT MORTALITY MATERNAL
(PER 1,000 (PER 1,000 (PER 1,000 MORTALITY (PER POP.) POP.) BIRTHS) 1,000 BIRTHS)
1980 122,283 25.0 40.9
1979 119,942 28.0 (28.4) 5.8 36.3 (38.1) 0.9
1978 117,646 27.3 (27.8) 6.3 49.9 (49.2) 1.5
1977 113,223 27.8 6.9 52.2 0.0
1976 109,743 34.5 7.2 54.1 1.1
1975 106,275 32.0 7.8 (64.4) 0.3
(1) End of year population figures are from Table 11.2 in Digest of Statistics For the Year 1979. The 1980 figure is a simple projection using the rate of increase experienced between 1978 and 1979.
(2) Calculated using the number of births from "National Family Planning Programme Fifth Annual Report." Figures in parentheses use number of births from Table 11.2 in Digest of Statistics For the Year 1979.
(3) Calculated using number of deaths from Table 11.2 in Digest of Statistics For the Year 1979.
(4) As reported in "National Family Planning Programme Fifth Annual Report," Figures in parentheses calculated using the number of infant deaths and number of births from Table 11.2 in DigesL of Statijtics For the Year 1979.
(5) Calculated using the number of deaths due "complications of pregnancy, childbirth and puerperium" from Table 11.5 and the numbers of births from Table 112 in Digest oF Statistics For the Year 1979.

10
In general the rates all seem to be moving in the desired direction. The reported infant mortality rate has dropped from about 60 to about 40 per thousand births over 5 years. The birth and death rates also appear to have dropped significantly. If the population is around 100,000, instead of 120,000, however, these declines may not be significant. It is comforting to note, though, that the total number of deaths reported decreased each year from 1975 through 1979. The total number of births reported has varied erratically, but 1980 had the lowest figure.
Service statistics reporting is quite good. Annual reports for "Community and Rural Hospitals Services" and for the "St. Vincent National Family Planning Programme" were available for both 1979 and 1980. Both contain information of potential usefulness to managers and planners. Both were produced three to six months after the end of the reporting period. Both are ten to 12 page mimeographed documeuts which deserve praise for their practicality. (Health service statistics reports in many less developed countries contain a great
deal of nearly useless trivia published I to 2 years after the end of the reporting period; so late that the information is of no use to managers and of greatly reduced use to planners.) An information systems consultant is
currently in St. Vincent assisting with revisions which should eventually improve the content of these reports.
Table 6 provides unit cost estimates of some important community-based services. The unit costs are very rough estimates. First, it was not easy to estimate the financial resources expended for community Health Service nursing and for D.M.O. clinics. Tables A4 and A4 in Appendix A provide estimates of the operating costs of these two branches of the Community Health Service. The total operating costs estimated in these tables are probably fairly close to the true costs, although the Medical Staff in Community Health Service may have official responsibilities in addition to D.M.O. clinics, thereby indicating that less than 90% of their salaries should be allocated to those clinics.
Table 6 contains two more major assumptions First, the calendar 1980
service statistics are assumed to be accurate; that is, the reporting rate was assumed to be 100%; and, further, it is assumed that they represent a close
approximation to the quantity of services being delivered in fiscal year 1981/82. Second, the time allocations in Table 6 are rough guesses not based on data or on intimate knowledge of the operation of the community health service.
Keeping in mind that the figures are approximate, it is interesting to note that while ante-natal and child clinics cost much less per session than D.M.O. clinics, the costs per attendance are similar because the average D.M.O. clinic attracts many Tmore (99) patients than the ante-natal (7.5) or child welfare (13) clinic. The government appears to be spending about S22.50 per year for each active family planning acceptor and somewhat less for each home visited by a health worker. Immunizations appear to cost about $5.50 per dose.

TABLE 6: ESTIMATED UNIT COST OF IMPORTANT COMMUNITY-BASED SERVICES
SERVICE UNITS %TIME SERVICE SERVICE # TYPE OF SERVICE DELIVERED ALLOCATED EXPENDITURE UNIT COST
$ E.C. $ E.C.
la Ante-natal clinics 1,273 14% of N.S. 162,956 128
lb New attendances at ante-natal clinics 2,358 14% of N.S 162,956 -69.11
Ic Total attendance at ante-natal clinics 9,507 14% of N.S. !62,956 17.14
2 Total deliveries 365 3% of N.S. 34,919 95.67
3a Child welfare clinics 1,144 13% of N.S. 151,316 132
3b Total attendance at child welfare clinics 15,055 13% of N.S. 151,316 10.05
4 Family planning active users 5,140 10% of N.S 116,397 22.65
5a Homes visited 15,109 25%.of N.S. 290,993 19.26
5b Persons contacted during home visits (all age groups 62,169 25% of N.S. 290,993 4.68
6 Dressings done 75,837 25% of N.S. 290,993 3.84
7a D.M.O. clinics 596 100% of N.S. 535,674 899
7b Total attLendane at D.M.O. clinics 59,039 100% of N.S. 535,674 9.07
Total immunization doses 21,022 10% of N.S. 116,397 5.54

12
.,OTE: Types of services were selected from "Annual Report for 1980 Community
and Rural Hospitals Services" except for the "FamiJy planning active users" which was from."St. Vincent and the Grenadines National Family Planning Programme Fifth Annual Report." The number of "Service Units Delivered" was taken directly, or derived through simple addition, from the same reports. Under "% Time Allocated," N.S. refers to the nursing costs of the community Health Service (See Table A4 in Appendix A), and D.M.O. refers to the costs of D.M.O. clinics. (See Table A5 in Appendix A.) The percentages do not add to 100, because in some cases, different units have be~n used as indicators of the quantity of the same service. Thus the number of child welfare clinics and attendance at those clinics are two measures of the same service. Services that have the same number in the left-hand column use duplicating time allocations. Immunization services are assumed to overlap with all other services. Its 10% time allocation has been included in the allocations to other services. Double counting is not a problem, since immunizatio is understood to be part of these other services; for example, it is part of the standard package of services provided at child welfare clinics.
At this point, the purpose is not to point out the high or low unit cost of a particular service, but to present a practical methodology. Those who are more familiar with the health system can then adjust the assumptions and develop more accurate estimates. Those same people will be also able to make much better use of the information, since they will know something about the quality of the service. On this point, however, even an outsider can tell a lot just from the numbers. For example, he would question the quality of service a patient receives at a D.1.O. clinic when the average attendance is 99. Does a nurse screen the patients, allowing only the very sick to see the doctor? Does the doctor stay at the clinic for 10 hours (6 minutes per patient) or for 3 hours (2 minutes per patient)?
In evaluating the meaning of unit cost information, the question of quality is just as important as the magnitude of the unit cost figure itself.
Kingstown General Hospital produces two pages of annual service statistics. The 1980 "report" was prepared in March 1981, while the 1978 report was prepared in January 1979, both timely indeed. Given that Kingstown General directly or indirectly uses approximately 50% of the Government's health budget, however, a more thorough report appears warranted. Such a report should attempt to regularly relate services provided with the use of financial and human resources.
In general, Kingstown General Hospital appears to be a well-utilized hospital providing a reasonable quality of service. Table 7 presents several indicators of hospital performance during the last four years. The data show a reasonably high level of occupancy and a falling, relatively short, average length of stay.

13
TABLE 7: INDICATORS OF SERVICE DELIVERY AT KINGSTOTN GENERAL HOSPITAL
YEAR PATIENT DAYS AVERAGE LENGTH OF STAY OCCUPANCY RATE $ E.C.
19(0 57,241 7.1 75.6
1979 61,396 7.2 80.1
1978 58,458 7.5 75.9
1977 50,770 7.7 65.9
(1) Taken directly from the numerographed statistics for Kingstown General Hospital for 1978 and 1980.
Table A6 in Appendix A presents an estimated operating cost for Kingstown General Hospital for 198"'82 of $5,299,319 E.C. A key, but seemingly justified, assumption is that 3/4 of the cost of the nurse training program should be considered part of the operating cost of the hospital. (See note (5) to Table A6.) Table 8 presents some unit cost figures using 1980 service data applied to the 1981/82 operating cost estimate.
TABLE 8: ESTIMATED 1981/82 UNIT OPERATING COSTS AT KINGSTOWN GENERAL HOSPITAL
UNIT # UNITS COST PER UNIT S E.C.
Hospital Beds 211 25,115
Patient Days 57,241 93
Patients(l) 8,062 657
(1) Calculated from patient days using an average length of stay of 7.1.
It should be repeated that the unit costs presented in Table 8 are relatively crude estimates. Indirect costs (5.8%) have been included. Non-personnel costs have been allocated to the hospital in proportion to its share of personnel costs. Furthermore, all the estimated costs have been attributed to inpatient services; that is, no costs have been attributed to outpatient services which if any, did not appear in the annual reports of service statistics. Different assumptions could reduce the patient day cost of $93, but this should only be done if it will result in a truer reflection of what the government is doing. While the patient day cost is relatively high, however, the cost per patient is relatively low, a direct result of the relatively short average length of stay, Which is; itself, an indicator of the cuality of case.

14
Unfortunately, the annual reports on "Community and Rural Hospitals Services" don't provide sufficient service information t.o develop similar unit cost information. About the best that can be done is to divide the number of admissions by the estimated hospital budget, thus getting an estimate of the amount spent on each patient. Estimated 1981/82 operating costs for the three rural hospitals are developed in Table A7 in Appendix A. Table 9 shows the corresponding estimated costs per admission.
TABLE 9: 1981/82 ESTIMATED COST PER ADMISSION AT THREE RURAL HOSPITALS ($ E.C.)
HOSPITAL ESTIYATED OPERATING NUMBER OF ADMISSIONS ESTIMATED COST COST IN 1980 PER ADMISSION
Georgetown 133,845 259 517
Chateaubelair 92,476 72 1,284
Bequia 94,909 215 441
The unit costs in Table 9 roughly correspond to what one would expect. Rural hospitals tend to offer a limited range of low-cost services. They have limited budgets. Georgetown, for example, has 20 beds with an estimated budget of $6,692 per bed, about 27% of the budget per bed at Kingstown General. Utilizatin tends to be low at rural hospitals. Where utilization is even moderate; for example, at Georgetown and Bequia, unit costs may be quite low, disregarding for the moment the question of quality of service. Where utilization is low, however, unit costs will be very high as at Chateaubelair, and this, despite the fact that service quality is not likely to be high. It costs about twice as much to treat a patient at Chateaubelair as at Kingstown General!
The above has only scratched the surface of the subject of service unit costs. There may be some information here which will be useful in the current five-year planning exercise. Hopefully, enough questions will have been raised, that some of the information which would have been useful; for example, the number cf patient days at rural hospitals, will be collected in the future. Once better information is available, analyses such as this one could develop information for decision makers interested in applying cost-efectiveness criteria, or in developing a system of service fees for patients in private wards.
15
V. USES OF FUNDS
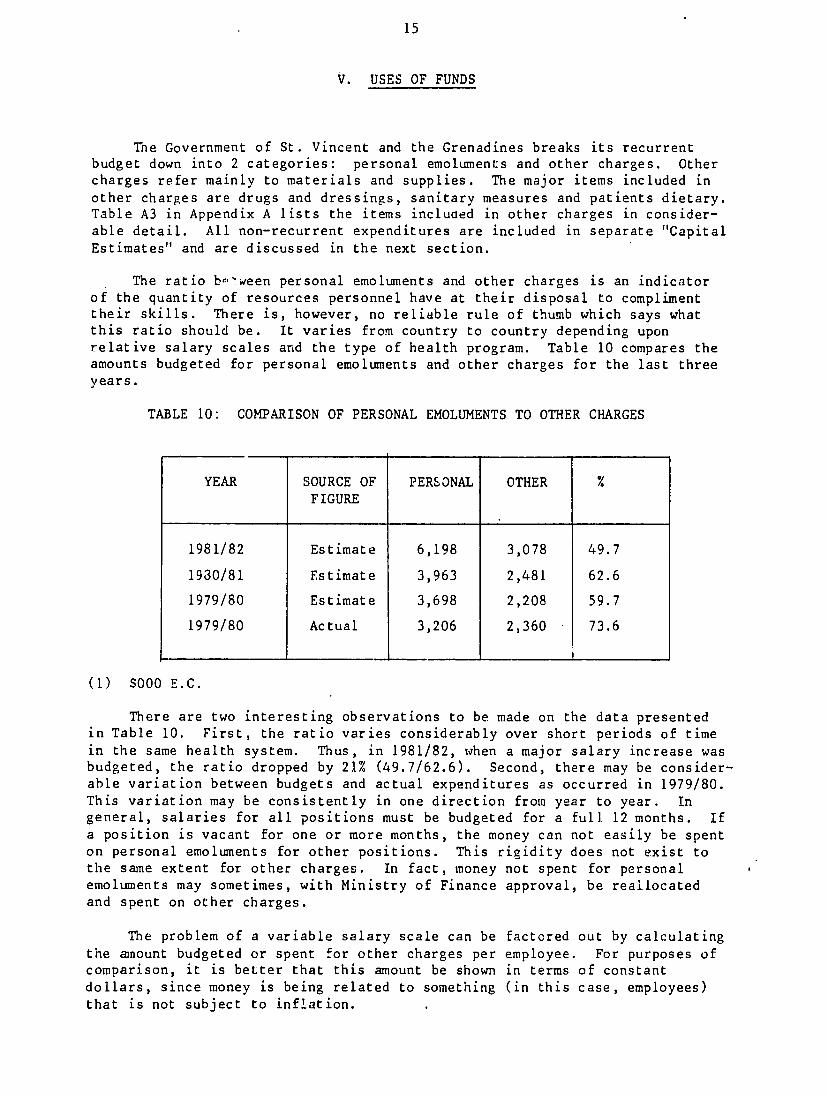
The Government of St. Vincent and the Grenadines breaks its recurrent budget down into 2 categories: personal emoluments and other charges. Other charges refer mainly to materials and supplies. The major items included in other charges are drugs and dressings, sanitary measures and patients dietary. Table A3 in Appendix A lists the items included in other charges in considerable detail. All non-recurrent expenditures are included in separate "Capital Estimates" and are discussed in the next section.
The ratio be-ween personal emoluments and other charges is an indicator of the quantity of resources personnel have at their disposal to compliment their skills. There is, however, no reliable rule of thumb which says what this ratio should be. It varies from country to country depending upon relative salary scales and the type of health program. Table 10 compares the amounts budgeted for personal emoluments and other charges for the last three years.
TABLE 10: COMPARISON OF PERSONAL EMOLUMENTS TO OTHER CHARGES
YEAR SOURCE OF PERSONAL OTHER FIGURE
1981/82 Estimate 6,198 3,078 49.7
1930/81 Estimate 3,963 2,481 62.6
1979/80 Estimate 3,698 2,208 59.7
1979/80 Actual 3,206 2,360 73.6
(1) S000 E.C.
There are two interesting observations to be made on the data presented in Table 10. First, the ratio varies considerably over short periods of time in the same health system. Thus, in 1981/82, when a major salary increase was budgeted, the ratio dropped by 21% (49.7/62.6). Second, there may be considerable variation between budgets and actual expenditures as occurred in 1979/80. This variation may be consistently in one direction from year to year. In general, salaries for all positions must be budgeted for a full 12 months. If a position is vacant for one or more months, the money can not easily be spent on personal emoluments for other positions. This rigidity does not exist to the same extent for other charges. In fact, money not spent for personal emoluments may sometimes, with Ministry of Finance approval, be reallocated and spent on other charges.
The problem of a variable salary scale can be factored out by calculating the amnount budgeted or spent for other charges per employee. For purposes of comparison, it is better that this amount be shown in terms of constant dollars, since money is being related to something (in this case, employees) that is not subject to inflation.

16
TABLE 11: AMOUNT BUDGETED FOR OTHER CHARGES PER EMPLOYEE
YEAR NUMBER OF OTHER OTHER CHARGES PER PRICE(1) OTHER CHARGES EMPLOYEES CHARGES EMPLOYEE CURRENT INDEX PER EMPLOYEE
($ E.C.) ($ E.C.) (Jan/82 $ E.C.)
1981/82 614 3,078,000 5,013 586.3 5,013
1980/81 576 2,481,000 4,307 517.5 4,880
1979/80 590 2,208,000 3,742 432.0 5,079
1979/80(2) 512(3) 2,360,000 4,609 432.0 6,255
(1) As explained under Table 1, the rate of increase of the price index may
have slowed substantially in 1981/82.
(2) Figures in this row are actual rather than budgeted figures.
(3) An estimated number, derived by applying the rate of financial underexpenditure to the budgeted number of personnel.
The right-hand column suggests that there has been little, if any, increase in the purchasing power of the budget for other charges per employee. In fact, if underexpenditure of personal emoluments and overexpenditure for other charges is not typical, the purchasing power available to support the work of health personnc! may be substantially less in 1981/82 than in 1979/80.
Most government-run health systems suffer chronic shortages of materials and supplies. The health workers in the Government's health system on St. Vincent and the Grenadines suggest that their system is no exception. Medicines are reportedly in short supply. Only S38,000 E.C. is budgeted for petrol, diesel and gas for the whole health sytem for a whole year. What happens to workers morale and productivity when they run out of medicines? What happens to supervisory schedules when there is not more money for petrol?
The information available is not sufficient to make a conclusive argument that budgetary allocations for other charges deserve priority over the hiring of new personnei. The question appears, however, to deserve further investigation. This is especially true under circumstances where hiring commitments are frequently made long before the financial consequences become apparent. Thus where a commitment is made to hire nurse trainers who successfully complete training, the full impact of this commitment is not felt on the budget until three years later. At that time, proposals to increase purchases of drugs or petrol or food for patients may take second priority.

17
In conclusion, material and supply shortages appear to be a problem. Allocations in this area do not appear to be keeping up with inflation. Planners need to carefully project the cost of personnel commitments, not only in terms of the financial burden the additional salaries will place on the budget, but also in terms of the additional expenditure for the materials and suppiies these people will need to perform effectively.
Training programs have long-term operating cost implications in much the same way as construction projects which will be discussed in the next section.

18
VI. CAPITAL EXPENDITURES
The Government of St. Vincent and the Grenadines has ambitious plans for the expansion of the physical infrastructure of the health sector. The 1981/82 capital budget exceeds more than one third the budget for recurring costs. The health sector accounts for 22% of the government's 1981/82 capital budget. As indicated in Table 12, the government's capital budget has grown very rapidly, even after taking inflation into account. Growth of the health sector's capital budget has been even more rapid.
TABLE 12: COMPARISON OF GOVERNMENT AND HEALTH SECTOR CAPITAL BUDGETS
YEAR CURRENT $ ($000 E.C.) PRICE PURCHASING POWER HEALTH (JAN. '82 $000 E.C.)
GOVERNMENT HEALTH INDEX GOVERNMENT HEALTH
1981/82 59,496 12,842 586.3 59,496 12,842 21.6
1980/81 55,294 4,785 - 7.5 62,645 5,421 8.7
1979/80 47,344 2,833 432.0 64,254 3,845 6.0
1978/79 29,725 1,428 375.4 46,425 2,230 4.8
1977/78 18,905 1,250 331.0 33,486 2,214 6.6
1976/77 13,297 1,727 309.2 25,214 3,275 13.0
RATE OF GROWTH 34.9% 49.4% 13.3%(l) 18.7% 31.4% 10.7%
(1) The same scale is used as in Table i, although it is one year shorter. Thus, the apparent growth rate of the index as shown here is not 13.3% but rather 13.7%, since the rate of growth registered from January 1976 to January 1977 was only 11.5%.
Most of the growth in the capital budget is due to growth in foreign aid. Although growth of domestic financing for the government's capital budget has been greater than 100% per year, it still constitutes only 11% of the total budget. (See Table A8 in Appendi: A.) The government's strong commitment to the health sector is further demonstrated by the allocation of 38.5% of total domestic capital financing health sector. Twenty per cent of the health sector's capital budget comes from domestic financing, contrasted to 11% for the government as a whole.
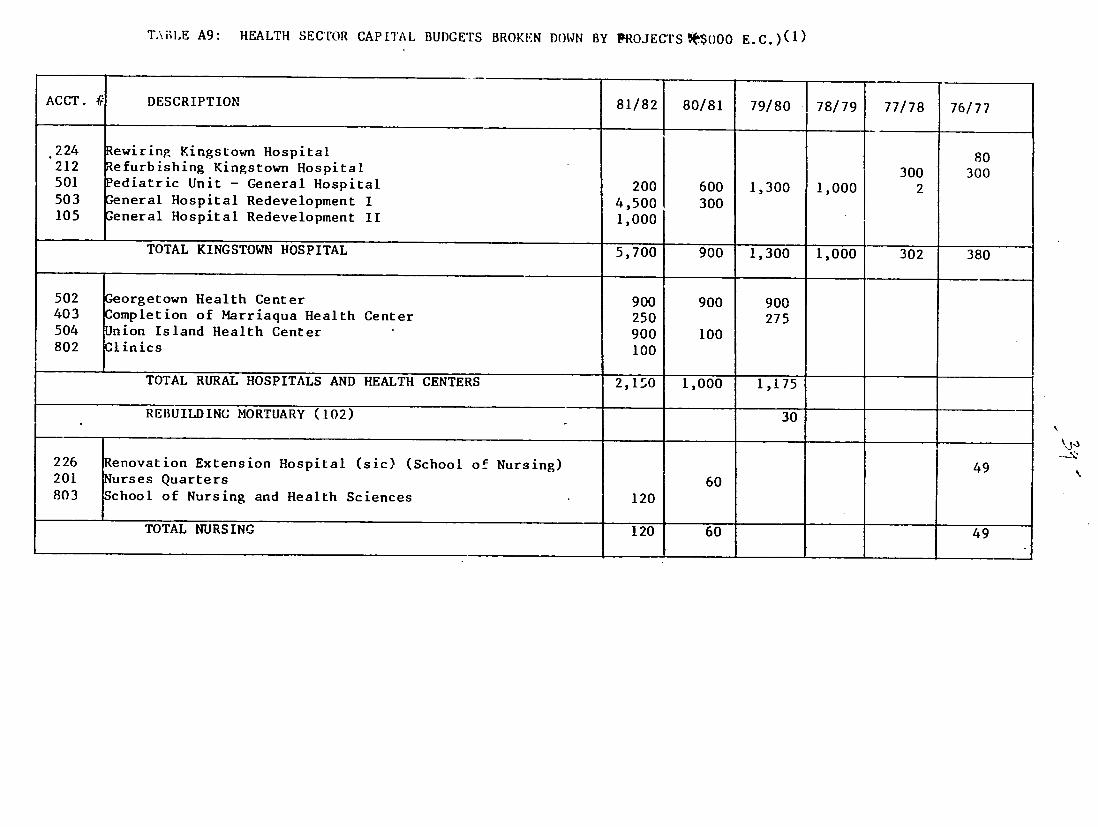
The 1981/82 health sector capital budget is mostly allocated to the further development of Kingstown General Hospital and to water supply projects. Expansion and/or renovation of rural hospitals and health centers are third in priority as is shown in Table 13.

19
TABLE 13: 1981/82 HEALTH SECTOR CAPITAL BUDGET BY PROJECT CATEGORY(1)
PROJECT CATEGORY AMOUNT ($000 E.C.)
Kingstown General Hospital 5,700 44.4
Rural Hospitals and Health Centers 2,150 16.7
School of Nursing and Health Sciences 120 0.9
Water Supply 4,272 33.3
Refuse Vehicles 600 4.7
TOTAL 12,842 100.0
(1) Table A9 in Appendix A provides a complete listing of individual projects, as well as project budgets for each year since 1976/77.
There are two major difficulties in assessing the implications of the capital budget. First, there is no readily available expenditure information. A casual look at Table A9 in appendix A suggests that much of the money in the capital budget isn't spent. For example, $900,000 has been budgeted for the Georgetown Health Center for 3 years in a row. In fact, money appears to be frequently included "in" the capital budget before an agreement is signed with a foreign funder and sometimes before a likely donor is even identified. From the point of view of a financial manager, it would be helpful to classify capital projects into 2 categories, those for which funding is assured and those for which funding is still being sought.
The second major difficulty is perhaps more serious. There appears to have been very little, if any, analysis of the operationg cost implications of many of the projects. This is serious in the case of projects funded by domestic revenues, but at least in the case of these projects, it is possible to agree that future operating costs can be met from the same source as funded the capital investment, the only consequence being less money available for further capital investment.
The capital development phase of most projects is, however, funded by foreign sources. These sources are very unlikely to fund future operating costs. By funding the capital costs these foreign sources are placing an obligation for future operating costs on the government. Foreign donors are, at best, negligent, if they fail to make the government aware of the operating
cost implications of the projects they fund.

20
It appears that donors are frequently not helping the government estimate future operating costs. A recent World Bank review of the health sector listed 10 projects. Eight of these projects, costing $6,540,000, were shown as having no. operating cost implications. The two remaining projects, hospital extension and refurbishing and construction of 5 health centers, costing $3,408,000, were shown as having total operating cost implications of $31,000, less than I per cent of the capital cost. Actual operating costs are likely to be closer to 20 times that amount.
The Ministry of Health is currently going through a five-year planning process. Part of that process should include a fairly detailed review of the operating cost implications of all currrently planned capital development projects. Three major steps would be involved in this review.
1. Estimate total operating cost of the completed project.
2. Estimate current operating cost of any activities that will be displaced by the completed project; for example, the operating cost of a clinic that will be replaced by a health center; and subtract this amount from the estimated operating cost of the completed project.
3. Identify the likely source of funding for all increased operating costs; for example, "general government tax revenues."
Clearly, the same procedure should be followed for the development of all future projects. The current five-year plan might help in this area by providing standard guidelines and forms to be used by project designers for the estimation of expected operating costs.
Until something like this is done, it will be impossible to properly assess the financial feasibility of implementing the government's stated policy of health for all through a strategy of primary health care. Current and future government financial resources are known or can be estimated. At present the magnitude of commitments against those resources is not known.

21
VII. PRIVATE SECTOR EXPENDITURES
It is difficult to make an accurate estimate of the size of the private health sector on St. Vincent and the Grenadines. As the following discussion will make clear, however, it is large, growing rapidly, and clearly demonstrates the willingness of the population to contribute directly towards the financial costs of the health care they need and want.
There are four major elements in the private sector the financial magnitude of which could be estimated: drug sales, the private practices of approximately 14 doctors, the 10-bed private hospital and charges for home deliveries. According to trade statistics the sale of medicines is booming. Estimated private sector retail sales for 1981/82 are $3,905,000 E.C., a little more than 5 times the government's budget for drugs in the public sector. While the government's budget for drugs grew from $3,000,000 in 1976/77 to $700,000 in 1981/82, an annual rate of increase of 18.5%, private sector imports (cost plus duty) grew from $673,000 in 1976/77 to $1,381,000 in 1979/80, an annual rate of increase of 27.1%. Table A10 in Appendix A summarizes the data and assumptions used in estimating private sector drug sales.
Estimating the fees paid to doctors in their private practices is much more speculative. Fourteen doctors are thought to have regular private practices. The size of their practices varies enormously. Some may see as few as 10 patients per day. At least one is thought to see more than 100. An average of 40 has been assumed here. Some doctors see patients every day of the week. Most don't have regular hours on Sundays. An average of 290 days per year, about 5 days per week has been assumed here. Finally some doctors charge $10 to $15 per consultation while others charge $25. An average of $15 has been assumed. The above assumptions suggest that people are paying about $2,436,000 for private consultations per year.
The private 10-bed hospital is reportedly doing well. Its occupancy rate is supposed to be close to 100% (assume 80%) with a daily bed charge of $100 plus medicine and surgery. Private sector drug sales have already been estimated above. Surgery charges have been assumed to be about 20% of the daily bed charge. The hospital operates 365 days a year. These assumptions suggest that the annual gross income of the hospital is about $350,000.
Nurse-midwives charge a standard fee of $20 for home deliveries. About 350 home deliveries are performed each year, producing $7,000 annually in gross income for the nurse-midwives. Table 14 summarizes these estimates of private sector activity.

22
TABLE 14: ESTIMATE OF FINANCIAL SIZE OF PRIVATE HEALTH SECTOR IN 1981/82
SECTOR COMPONENT MAJOR ASSUMPTIONS EXPENDITURES ($000 E.C.)
Retail Drug Sales 75% average private sector mark-up Continuation r f 27.1% annual growth rate
3,905
Doctor Consultations 14 doctors in private practice Average of 40 patients per day per doctor Average of 290 days per year per doctor Average charge of $15 per patient
2,436
Private 10-bed hospital
80% Occupancy Rate 365 days per year S100 per day bed charge Surgery charges equal 20% of bed charges
350
Home Deliveries 350 home deliveries at $20 per delivery 7
TOTAL 6,698
The above is almost certainly an underestimate of private sector health expenditures. It does not include any of the transportation costs incurred in the private sector during the process of procuring health services from either the public or private sectors, nor does it include costs incurred by those who are privately or self-referred to specialist services off the island. It also does not include special charges for medical certificates to justify work absences to employers nor service fees associated with injections which may be received during a consultation with a doctor. Finally, expenditures, probably relatively small, by private voluntary organizations and the International Planned Parenthood Federation have not been included.
If all private health expenditures could be estimated, it seems likely that privte sector expenditures would exceed those of the government.
The existence of a large private sector demonstrates that a large part of the population is willing to pay for some of the health services, particularly curative services, which it feels it needs. Ibis suggests that, if tie government finds it difficult to raise the money needed to implement its health for all policy, it should turn to the people who will willingly help finance the cost of some services.
In considering alternative financing mechanisms, it is important to consider combination of funding sources. Certain services are best paid for by the government from tax revenues; for example, most preventive services.

(1) End of year population figures are from Table 11.2 in Digest of Statistics For the Year 1979. The 1980 figure is a simple projection using the rate of increase experienced between 1978 and 1979.
(2) Calculated using the number of births from "National Family Planning Programme Fifth Annual Report." Figures in parentheses use number of births from Table 11.2 in Digest of Statistics For the Year 1979.
(3) Calculated using number of deaths from Table 11.2 in Digest of Statistics For the Year 1979.
(4) As reported in "National Family Planning Programme Fifth Annual Report," Figures in parentheses calculated using the number of infant deaths and number of births from Table 11.2 in DigesL of Statijtics For the Year 1979.
(5) Calculated using the number of deaths due "complications of pregnancy, childbirth and puerperium" from Table 11.5 and the numbers of births from Table 112 in Digest of Statistics For the Year 1979.
23
Other things patients might willingly pay for directly; for e.ample, drug costs; if they are assured of the quality and competative prizes. Still other services, perhaps surgery and hospitalization, might be covered by a combination of government funds, an insurance scheme and token personal payments. The number of possible alternatives is nearly limitless.
The important principle to keep in mind that it i. the government's responsibility to see that the heaith services needed, are in fact provided, on a reasonably, not necessarily perfectly, equitable basis. The source of funding is an important, but secondary issue. The people pay in any case, because the government's money is, ultimately, their money.

24
VIII. SUMMARY AND RECOMMENDATIONS
revenues and health sector spending have been increasing.Both government After taking into account the effect of inflation, however, there have been
periods when government and health sector purchasing power have decreased.
At the present time, about two thirds of government recurrent health Aboutexpenditures are devoted directly or indirectly to inpatient services.
20% is expended for preventive services, and the remainder for out'patient
services. There is insufficient information currently available to calculate
accurate unit costs, although a methodology was presented, in the form of a
worked example with very broad underlying assumptions. When unit costs are
worked out, some assessment of service quality will also be necessary. For
example, at the cost per patient contact at a D.M.O. clinic seems quite low, this is'because the doctor reportedly sees an average of 99about $9.00, but
patients per session.
Capital expenditure in the health sector appears on the verge of rapid new construction of healthexpansion. About 60% will be on renovation or
Thefacilities. Almost all the remainder will be on water supply systems.
operating cost implications of the capital projects do not appear to have been
adequately assessed. Even at a low rate of expenditure of the capital budget,
major new burdens will be placed on the recurring budget of the health ser
vices. This is likely to have implications for the amount of general tax
revenue funding which will be available for primary health care.
The private sector appears to be prosperous. People are paying a lot of
money for medicines, perhaps as much as $40 per person per year. They are
also oaying a lot for private consultations with physicians. A relatively
wealthy upper and upper-middle class are keeping the small private hospital
very busy. Further demonstration that the people are willing to contribute
directly to meet the costs of health services is not needed.
The following are tentative recommendations, based on an all-to-brief
study, which should help the government's health service reach the announced
goal of health for all by 2000.
1. Undertake a careful, thorough assessment of the projected recurring costs
of all currently planned capital projects. This review should include the
recurring cost implications of current training programs. It should also
include the recurring costs of any new primary health care activities. An
ideal time to perform this review would be upon completion of the first
draft of the country's five-year health plan.
Assiming the review of projected recurring costs indicates a potential2. shortage of funds, investigate alternative financing mechanisms to make
One such measureuse of resources currently used in the private sector.
is currently under consideration; charging for drugs provided at public a result of ainstitutions to patients who received their prescription as
private consultation.

25
3. Alternative financing mechanisms will probably require improved accounting and general information systems. Improvement of the health statistics and management information system should continue to receive high priority. Simplicity should be stressed. The health system on St Vincent and the Grenadines. is small and will continue to be small. Sophisticated, computerized systems ar! not needed and may tend to make the information less accessible to the health workers who need it for their decision making.
4. Neither the annual report of the National Family Planning Programme nor the report of community and Rural Hospital Services nor the two-page annual service statistics summaries of Kingstown General Hospiftal included any financial information. These reports would be improved, if such information were included. The first two reports would also be improved by identification of informacion sources; for example, monthly activity report; and the reporting rate.
5. Permanent Secretary of Health cited planning and management as his priority concern in the Ministry of Health. The possibility of adding senior staff to the Ministry with planning and management skills and/or aptitude should receive priority consideration. Fordign donors should consider long-term technical assistance in this area, particularly if the Ministry can identify suitably placed counterparts.
6. The format of the government's health sector budget should be revised. It is recommended that separate budgets be developed for each geographical district, and for each institution within those districts which has anticipated expenditures in excess of $100,000 per year. This revision of the budget format will be useful for planning purposes, even if management decentralization is not currently being considered. Should managment decentralization be undertaken in the future, the needed budgetary format will already be in place.

APPENDIX A: SUPPORTING TABLES
TABLE Al: RECURRENT REVENUE OF THE GOVERNMENT OF ST. VINCENT AND THE GRENADINES ($000 E.C.)
YEAR IMPORT(9) DUTIES
OTHER( 9 ) TAXES
(mostly on
imports)
INCOME ( 9 ) HEALTH(L0) TAX SECTOR
REVENUES
FOREIGN( 9 ) ALL OTHER (I) TOTAL(9) BUDGETARY REVENUE ESTIMATED
TOTAL() ACHIEVED UNDER/
OVER
81/82(0)
80/81(2)
79/80 ( 3 )
78/79 (4 )
77/78 ( 5 )
76/77(6)
75/76 ( 7 )
74/75(8)
12,500
10,500
10,591
8,031
6,871
5,587
4,194
7,069
,
24,015
12,717
12,213
9,625
8,165
6,389
4,789
4,907
11,980
10,300
10,971
8,790
5.719
4,766
4,039
6,368
216
199
128
143
138
96
94
151
0
500
2,705
4,484
2,154
0
0
1,959
22,170
11,551
8,191
8,082
7.834
5,594
4,984
8,395
70,881
48,229
43,166
32,368
28,613
26,835
45,767
44,799
39,155
30,881
22,432
18,100
26,89)
-5
+4
+21
+8
-16
AVE. GROWTH(12) SINCE 75/76 20.0% 30.8%
I ____________________
19.9%
_________________
14.9%
___________________
- 28.2%
____________________________________________
21.4%
____________________
20.4%
_____________________
+2
_____________

27
(1) Estimate from 1981/1982 Estimates of St. Vincent and the Grenadines
(2) Revised Estimate from 1981/82 Estimates of St. Vincent and the Grenadines
(3) Actual from 1981/1982 Estimates of St. Vincent and the Grenadines
(4) Actual from 1980/1981 Estimates of St. Vincent and the Grenadines
(5) Actual from the 1979/1980 Estimates of St. Vincent
(6) Actual from the 1978/1979 Estimates of St. Vincent
(7) Actual from the 1977/1978 Estimates of St. Vincent
(8) Actual from the 1976/1977 Estimates of St. Vincent
(9) From page 2 of the above mentioned estimates
(10) From page 8 of the above mentioned estimates
(11) Calculated as the remainder using the figure in the "Total Achieved" column, except for 1981/1982.
(12) Calculated as the annual rate of growth required to achieve the 1981/1982 figure using the 1975/1976 figure as a base. For the "Total Estimated" column the 1976/77 figure was used as a base. In the "Total Achieved" column, the rate necessary to achieve the 1980/81 figure was calculated.
(13) No reason was ascertained explaining why the 1974/75 figures should have been so high. Thus, for the purposes of calculating growth rates, the figures for 1975/76 were thought to be more appropriate as a base.
170
PERSONAL EMOLUMENTS IN TABLE A2: ALLOCATION OF 1981/82 ESTIMATES BY TYPE OF SERVICE(l)
CCOUNT(4 )
UMBrR
142 001 (1)
(2)
(3-6)
(7-9)
(!0-11)
(12-15) (16-18)
(19-24)
(25)
(26-31)
(32-37)
(38-42)
(43-48) (49-50)
(51-52)
(53-61)
(62-65) (66-72)
(73-79)
(83-89)
(90-92)
(93-98)
(99-104)
(105-107)
ACCOUNT DESCRIPTION TRAINING ADMINIS - (2) PREVENTIVE CURATIVE(3)DUTPATI-ENT INPATIENT TRATION SERVICES SERVICES SERVICES SERVICES
All Ministry of Health Staff 158 Senior Medical Officer I 11 Senior Nursing Officer 14 Central Dispensary Staff 40 Medical Stores Staff 33 Serving Room Staff 17 School of Nursing Staff & Students 966 Hospital Administration 21 Medical Staff 126 Medical Officers 79 Medical Staff Allowances 27 Nursing Staff 837 Laboratory Staff 81 X-Ray Department Staff 69 Maintenance Staff 20 Residence Staff 11 Services Staff 267 Leper Hospital Staff 33 Lewis Punnet Home Staff 132 Mental Health Center Staff 217 Medical Staff in C.H.S.(5 ) 164 Dental Staff in C.H.S 49 Health Nursing Services in C.H.S. 164 164 Health Inspectors 171 Dispensary Service Staff 89
PACE TOTALS 966 233 335 119 477 1,841

\CCOUNT( 4 )
LrMBER ACC( 1IJNT DESCRIPTION TRAINING ADMINIS (2)
TRATION PREVENTIVE
SERVICES CURAT IVE( 3)OUjTATI ENT SERVICES SERVICES
I NPATIENT SERVICES
TOTALS FROM PREVIOUS PAGE 966 233 335 119 477 1,841
14 2001(108)
(109)
(110)
(111)
(112)
(113)
(114) (115-121)
(122-127)
(12F-133)
(134-139) (140-141)
Physiotherapist
Nutrition Officer
Dietetic Technician
Health Educator
Library Assistant Graphic Artists
Optometrist Allowance Georgetown Rural Hospital Staff Bequia Rural Hospital Staff Chateaubelair Rural Hospital Staff NaL'l Family Planning Programme Staff Hospital Laundry
4
10
13
7
7
88
4
10
55
39
38
43
TOTAL (NOT INCLUDING SALARY INCREASE) PERCENT DISTRIBUTION PROPORTIONAL DISTRIBUTION OF SALARY IN-
CREASES TOTALLING $1,909. TOTAL (INCLUDING SALARY INCREASES) PROPORTIONAL ALLOCATION OF CURATIVE
AMONG OUTPATIENT AND INPATIENT
966 22.5
430
1,396
237 5.5
105
342
460 10.7
205
665
119 2.8
53
172
481 11.2
214
695
33
2,026 47.2
902
2,928
139
TOTAL 1,396 342 665 728 3,067

30
(1) Allocation among the 6 service classifications is a matter of judgement in many cases. Those who know more about the individual accounts and the specific job descriptions of the personnel will be able to improve upon this allocation. Partial allocations may be warranted in many cases. For example x.-ray personnel may perform services for outpatients as well as inpatients.
(2) Administration refers to those activities which support the health service delivery system, but are not necessarily involved directly in the delivery of one or another type of health service,
(3) Curative services is used as a category only when it was thought difficult to specify whether an item supported outpatient or inpatient services. Eventually this category was the relative size of the allocations in these 2 categories.
(4) Account numbers are those provided in the 1981/82 Estimates
(5) C.H.S. Stands for Community Health Service.

290-298
TABLE A3: ALLOCATION OF OTHER CHARGES IN 1981/82 ESTIMATES BY TYPE OF SERVICE ($000 E.C.)(1)
CCOUNT
UBER
1170 002-080
2142 038
080
115
121 131
132
133
135 137
181
182
209
210
211 212
216 217
220 223
231 232
233 236
237 241
242
252
253
ACCOUNT DESCRIPTION TRAINING ADMINIS- PREVENTIVE CURATIVE OUTPATIENT INPATIENT TRATION SERVICES SERVICES SERVICES SERVICES
Other Ministry of Health Charges 160 Medical and Health in the Ministry 207 Medical Library 3 Visiting Specalists 22 General Maintenance 28 Transport of Drugs and Stores 8 Drugs and Dressings 700 Chemicals and Equipment for Drug Mfg. 25 Instruments and Equipment 90 Staff Uniforms 38 Linen and clothing 44 Radiological Sundries 46 Laboratory Chemicals and Equipment 50 Nurses Training 3 Electricity 110 Cleaning Materials 38 Upkeep of Grounds 10 \.3 Petrol, diesel, gas 38 Rentals & casual wages, Dispensaries 15 Maintenance of Vehicles and Plant 40 Conveyance of Patients 3 Druggist's Sundries 7 Patients' Dietary 518 Medical Comforts 1 Mental Health Center Industries 2 Health Education Materials 2 Burials 8 Upkeep of district Cemetaries 2 Allowance to Mental Patients on Parole 1 Overseas Medical Treatment 10
PAGE TOTALS 3 762 2 748 711

TABLE A3: CONTINUED: PAGE 2
CCOUNT NUMBER
ACCOUNT DESCRIPTION TRAINING ADMINIS-TRATION
PREVENTIVE
SERVICES CURATIVE SERVICES
OUTPATIENT
SERVICES INPATIENT
SERVICES
TOTALS FROM PREVIOUS PAGE 3 762 2 748 3 711
2142 280 Histology and Other Investigations 281 Supply of Spectacles
282 Sanitary Measures (St. Vincent) 283 Sanitary Measures (Grenadines) 284 Maintenance of Arnos Vale Plant 285 Nutrition Education
286-289 National Family Planning Programme 980 Renovation of Drug Mfg. Unit (none) 981 Furniture and Equipment 982 Immunization Programme 983 Medical aid Unit at
Amos Vale Airport (none) 486 Aedes Aegypti Programme 987 Purchase of New Equipment 988 Financing of Mental Health Center
15
3
707 6 2 1
20
15
65
6 6
3
TOTAL OTHER CHARGES 3 780 818 748. 9 720
Apportion "Curative Services" between outpatient and inpatient services in same ratio as salary allocation 143 605
TOTAL OTHER CHARGES TOTAL PERSONAL EMOLUMENTS (TABLE 2)
3 1,396
780 342
818 665
152 728
1,325 3,067
GRAND TOTAL 1,399 1,122 1,483 880 4,392

33
TABLE A3: CONTINUED: PAGE 2
() See Notes for Table 2A. Allocation is even more difficult in the case of "other charges." In the case of "other charges," "Administration" was also allocted a number of items which have little or nothing to do with administration, e.g. #981 Furniture and Equipment." Since there was no way to determine whch type of service is supported by these items, they were lumped under administration and will eventually be allocated in proportion to the other financial resources that were directly allocated to particular types of service.

TABLE A4: ESTIMATION OF COMMUNITY HEALTH NURSING SERVICE COST(1)
ITEM AMOUNT $ E.C.
Medical Staff in Community Health Service (10% of time for nursing supervision) 16,400Health Nursing Services in Community Health Service 328,000Dispensary Services Staff (10% only in support of nursing services) 8,900Nutrition Officer 10,000Dietetic Technician
13,000Hlealth Educator
7,000National Family Planning Programme Staff 88,000Graphic Artists
7,000 Salary Increase (44.5% of all items listed above)(2) 212,844Allocation of Administrative Personnel and 25% of Training Costs (12.5% of items listed above)(3) 86,393
TOTAL PERSONAL EMOLUMENTS 777,537
OTHER CHARGES (49.7% of personal emoluments)(4) 386,436
GRAND TOTAL COST OF COMMUNITY HEALTH NURSING SERVICE 1,163,973
(1) Amounts are taken from or derived from Tables A2 and A3.
(2) In Table A2, total salaries without the increase were $4,289,000. The total budgeted for the salaryincrease is $1,909,000. (1,909/4,289 = 44.5%)
(3) In Table A2, total salaries for administration and 25% of training were $691 ( 342,000 + 349,000)while all other salaries totaled $5,507,000 (1,047,000 + 665,000 + 728,000 + 3,067,000). (691/5507 = 12.5%) (See note (3) in Table A7.)
(4) In Table A3, the total of "other charges" was $3,078,000 (3,000 + 780,000 + 818,000 + 152,000 + 1,325,000)while the total of all salaries was $6,198,000 (1,396,000 + 342,000 + 665,000 + 728,000 + 3,067,000).(3,078/6,198 = 49.7%

TABLE A5: ESTIMATION OF COST of D.M.O. CLINICS( 1)
ITEM AMOUNT
$ E.C.
Medical Staff in Community Health Service (90%; 10% included in Table A4) 147,600Dispensary Services Staff (40%; 10% included in Table A4; 50% allocated to rural hospitals) 35,600Salary Increase (44.5% of all items listed above)(2) 81,524Allocation of Administrative Personnel Costs (5.8% of all items listed above)(3) 15,354Nursing Costs (10% of Total Personal Emoluments in Table A4) 77,754Health Educator 7,000
TOTAL PERSONAL EMOLUMENTS 357,832
OTHER CHARGES (49.7% of personal emoluments)(4) 177,842
GRAND TOTAL COST OF D.M.O. CLINICS 535-,674
(1) Amounts are taken from, or derived from, Tables A2 and A3.
(2) See note (2) in Table A4.
(3) Training expenditures not included, although they were included in TablE A4. Some training expenditures are included indirectly in the next line "Nursing Costs." In Table A2, total salaries for administration were $342,000while all other salaries totaled 5,856,000 (1,396,000 + 665,000 + 728,000 + 3,067,000). (342/5,856 = 5.8%)
(4) See note (4) in Table A4.

TABLE A6: ESTIMATED 1981/82 OPERATING COST OF KINGSTOWN GENERAL HOSPITAL(l)
ACCOUNT # ITEM AMOUNT $ E.C.
2142 001(16-18) (19-24)
(25) (26-31) (32-37) (38-42) (43-48) (49-50) (51-52) (53-61) (12-15)
(108) (140-141)
Hospital Administration Medical Staff Medical Officers Medical Staff Allowances Nursing Staff Laboratory Staff X-Ray Department Staff Maintenance Staff Residence Staff Services Staff 75% of School of Nursing Staff and Students(5) Physiotherapist Hospital Laundry Salary Increase (44.5% of all items listed above)(2)
Allocation of Administrative Personnel Costs (5.8% of all items listed above)(3)
21,000 126,000 79,000 27,000 837,000 81,000 69,000 20,000 11,000 267,000 724,500 10,000 43,0001,030,398
194,062
TOTAL PERSONAL EMOLUMENTS
OTHER CHARGES (49.7% of personal emoluments)(4)
3,539,960
1,759,360
GRAND TOTAL 5,299,319
(1) Account numbers and amounts are taken from Tables A2 and A3.
(2) See note (2) in Table A4.
(3) See note (3) in Table A5.
(4) See note (4) in Table A4.
(5) The assumption that student nurses provide an essential service to the hospital appears to be fully justified. If one chose, however, to ignore student nurse training costs, the cost of operating the hospital would be reduced by $1,658,111 to $3.641.208. a 31% redirrinn

TABLE A7: ESTIMATED 1981/82 OPERATING COST OF THREE RURAL HOSPITALS ($ E.C.)
CHATEAU-ITEM GEORGETOWN BELAIR BEQUIA
Hospital Staff Salaries(1) 55,000 38,000 39,000Salary Increase (44.5% of above)(2) 24,475 16,910 17,355Allocation of Administration and 25% of Training Personnel Costs (12.5%)(3) 9,934 6:864 7,044
TOTAL PERSONAL EMOLUMENTS 89,409 61,774 63,399 Other Charges (49.7% of personal emolyments)(4) 44,436 30,702 31,509
GRAND TOTAL 133,845 92,476 94,909
(1) From the 1981/82 Estimates. See Table A2.
(2) See note (2) in Table A4.
(3) Twenty five percent of training added to administration as general overhead. (75% of training costs had been allocated to Kingstown General Hospital.) See note (3) in Table A4.
(4) See note (4) in Table A4.

TABLE A8: COMPARISON OF GOVERNMENT AND HEALTH SECTOR CAPITAL BUDGETS BY SOURCE ($000 E.C.)(1)
YEAR
REVENUE %
TOTAL
LOANS
GOVERNMENT
% GRANTS % TOTAL REVENUE %
HEALTH SECTOR
LOANS % GRANTS TOTAL %
1981/82
1980/81
1979/80
1978/79
1977/78
1976/77
6,646
2,136
373
793
243
176
11
4
1
3
1
1
20,475
28,215
22,955
12,875
8,540
6,375
34
51
48
43
45
48
32,375
24,943
24,016
.16,057
10,122
6,746
54
45
51
54
54
51
59,496
55,294
47,344
29,725
18,905
13,297
2,562
75
30
300
0
0
20
2
1
21
0
0
2,000
2,000
200
0
820
1,170
16
42
7
0
66
68
8,280
2,710
2,603
1,128
430
557
64
57
92
79
34
32
12,842
4,785
2,833
1,428
1,250
1,727
22
9
6
5
7
13
(1) From "Estimates" for the years indicated. "Revenue" indicated domestic financing. "Loans" and "Grants" indicate foreign financing.
ACCT.
224 212 501 503 105
502 403 504 802
226
201 803
T.\BLE A9: HEALTH SECTOR CAPITAL BUDGETS BROKEN DOWN BY PROJECTS*$O00 E.C.)(1)
DESCRIPTION 81/82 80/81 79/80 78/79 77/78 76/77
ewiring Kingstown Hospital Refurbishing Kingstown Hospital Pediatric Unit - General Hospital ;eneral Hospital Redevelopment I ,eneral Hospital Redevelopment II
200 4,500 1,000
600 300
1,300 1,000 300 2
80 300
TOTAL KINGSTOWN HOSPITAL 5,700 900 1,300 1,000 302 380
Georgetown Health Center Completion of Marriaqua Health Center Union Island Health Center Clinics
900 250 900 100
900
100
900 275
TOTAL RURAL HOSPITALS AND HEALTH CENTERS 2,150 1,000 1,175
REBUILDING MORTUARY (102) 30
Renovation Extension Hospital (sic) (School of Nursing) Nurses Quarters School of Nursing and Health Sciences 120
60 49
TOTAL NURSING 120 60 49
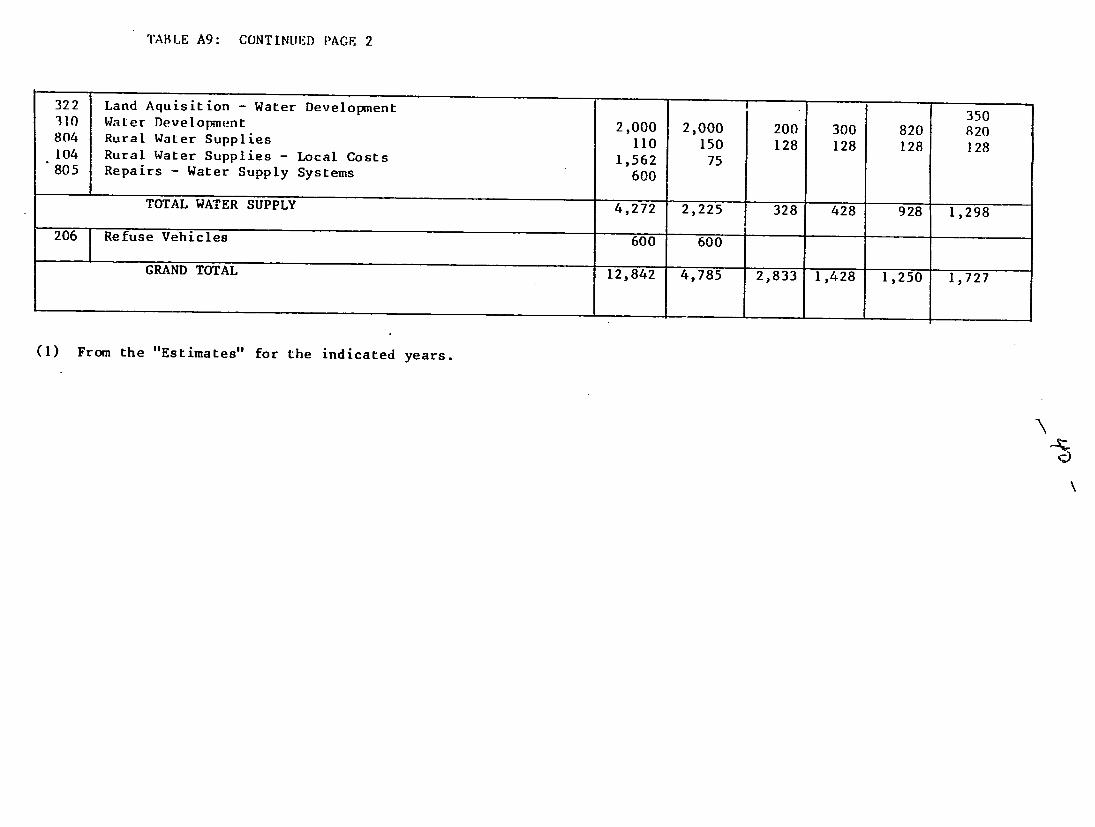
TABLE A9: CONTINUED PAGE 2
322 310 804
104
805
206
Land Aquisition - Water Development Water Development Rural Waler Supplies
Rural Water Supplies - Local Costs Repairs - Water Supply Systems
TOTAL WATER SUPPLY
Refuse Vehicles
2,000 110
1,562
600
4,272
600
2,000 150
75
2,225
600
200 128
328
300 128
428
820 128
928
350 820 128
1,298
GRAND TOTAL 12,842 4,785 2,833 1,428 1,250 1,727
(1) From the "Estimates" for the indicated years.

TABLE A1O: ESTIMATED PRIVATE SECTOR DRUG SALES
1($000 E.C.)( ) % ($000 E.C.)(2) ($000 E.C.)( 4 ) YEAR MINISTRY OF HEALTH OVER/ TOTAL DRUG IMPORTS PRIVATE SECTOR
ESTIMATE ACTUAL UNDER COST DUTY SHARE
81/82 700
80/81 600
79/80 500 611 +22 1,911 81 1,381
78/79 425 409 - 4 1,439 77 1,107
77/78 425 300 -29 1,079 53(3) 832
76/77 300 264 -12 886 51 673
75/76 215
74/75 243
AVE.(%) 18.5(6) 20.3(6) - 7 29.2(6) 16.7(6) 27.1(6)
(1) All figures in these columns taken directly from the "Estimates" for 1981/82, 1980/81, 1979/80, 1978/79, 1977/78 and 1976/77.
(2) Information in these columns obtained from the Department of Statistics. The figures represent the total of all items listed under code #541 in the Departments classification system. The data shown for FY 79/80actually represents information for calendar 1979, and similarly for the other years.
($000 E.C.)(5)
PRIVATE SECTOR
RETAIL SALES
3,905
3,072
2,417
1,937
1,456
1,178
27.1(6)

TABLE A10: CONTINUED PAGE 2
(3) This entry was not obtnined directly from the Department of Statistics, but was estimated by applying the average proportion of duty to cost
calculated from the data for years 79/80, 78/79 and 76/77.
(4) The "Private Sector Share" was calculated as the difference between cost plus duty for "Total Drug Imports" and Ministry of Health Actual Expen
ditures.
(5) The "Private Sector Retail Sales" were estimated as 175% of the "Private
Sector Share." The figures for 80/81 and 81/82 were obtained by projecting the rate of increase, 27.1% per year, experienced during the previous 4 years.
(6) Figures in this row are the annual rate of growth required to achieve the top figure in each column using the bottom figure as a base, except in the
case of the third column, where the figure is a weighted average.