PRELIMINARY FOUNDATION MEMORANDUM - Caltrans · PRELIMINARY FOUNDATION MEMORANDUM ... 2.0 FIELD...
30
PRELIMINARY FOUNDATION MEMORANDUM YERBA BUENA ISLAND RAMPS IMPROVEMENT PROJECT ON EAST SIDE OF ISLAND WESTBOUND ON-RAMP WESTBOUND OFF-RAMP Prepared By: AECOM TRANSPORTATION 2101Webster Street, Suite 1900 Oakland, CA 94612 December 2010
-
Upload
nguyendien -
Category
Documents
-
view
222 -
download
3
Transcript of PRELIMINARY FOUNDATION MEMORANDUM - Caltrans · PRELIMINARY FOUNDATION MEMORANDUM ... 2.0 FIELD...
PRELIMINARY FOUNDATION MEMORANDUM
YERBA BUENA ISLAND RAMPS IMPROVEMENTPROJECT ON EAST SIDE OF ISLAND
WESTBOUND ON-RAMPWESTBOUND OFF-RAMP
Prepared By:
AECOM TRANSPORTATION2101Webster Street, Suite 1900
Oakland, CA 94612
December 2010

TABLE OF CONTENTS
Section ...................................................................................................................................... Page
1.0 INTRODUCTION................................................................................................................... 1
1.1 Purpose and Scope of Study ............................................................................................. 11.2 Project Description ........................................................................................................... 1
2.0 FIELD INVESTIGATION AND LABORATORY TESTING........................................... 3
2.1 Existing Data Review ....................................................................................................... 32.2 Field Investigation ............................................................................................................ 42.3 Laboratory Testing............................................................................................................ 5
3.0 GEOLOGICAL SETTING.................................................................................................... 5
3.1 Regional Geological Structure.......................................................................................... 53.2 Local Geology Overview.................................................................................................. 63.3 Local Stratigraphy............................................................................................................. 63.4 Local Geological Structure ............................................................................................... 93.5 Groundwater ................................................................................................................... 103.6 Regional Seismicity........................................................................................................ 103.7 Geologic hazards ............................................................................................................ 113.8 Seismic Hazards ............................................................................................................. 13
4.0 CONCLUSIONS AND RECOMMENDATIONS.............................................................. 15
4.1 Idealized Soil Profiles And Engineering Properties ....................................................... 154.2 Seismic Design Criteria .................................................................................................. 154.3 Soil Corrosivity............................................................................................................... 184.4 Existing Foundation Data ............................................................................................... 184.5 Pile Foundation Design .................................................................................................. 19
5.0 CONSTRUCTION RECOMMENDATIONS.................................................................... 25
5.1 Earthwork ....................................................................................................................... 255.2 Pile Construction ............................................................................................................ 275.3 Abutment Walls.............................................................................................................. 28

1
1.0 INTRODUCTION
1.1 PURPOSE AND SCOPE OF STUDY
The project is proposed to address present geometric and operational deficiencies of the existing westbound on and off-ramps and the effects on the San Francisco-Oakland Bay Bridge (I-80) mainline.
AECOM Transportation is the prime design consultant and EMI is a subconsultant of AECOM to provide geotechnical engineering for the design and construction of the interchange, which consist of new bridges, earth retaining structures, culverts, permanent cut and fill slopes, and pavement design for the project.
This Preliminary Foundation Memorandum presents draft findings from a geotechnical investigation conducted by Earth Mechanics, Inc. (EMI), preliminary foundation analysis and design, andconstruction recommendations for the proposed ramps improvement project on Yerba Buena Island, California.
1.2 PROJECT DESCRIPTION
1.2.1 Existing Facilities
The existing local Macalla Road is one through lane each way and has a downgrade of about 9% within the project limits. Macalla Road is a major local arterial roadway between Treasure Island andthe westbound on-ramp to the I-80 viaduct.
The existing I-80 bridge structure was constructed in the 1930’s and consists of a reinforced concrete tunnel approach viaduct, a massive concrete abutment structure, and a steel viaduct, all with two decks of five lanes each.
A former timber staircase and associated concrete walkways steps and slabs have now been removed.
1.2.2 Proposed Improvements
The proposed improvements will replace the westbound on-ramp and off-ramps. The new bridgestructures will connect Macalla Road with the new San Francisco-Oakland Bay mainline which is currently under construction as part of the East Span Seismic Safety Project by the California Department of Transportation. The new ramps will consist of two new multi-span precast prestressed concrete girder bridges branching off the new I-80 upper bridge deck and merging into a common bridge abutment at Macalla Road. The bridges will be supported by variable-height bent columns and a high-seat cantilever abutment. At the abutment, the new ramps will terminate with right and left-turn lanes.
The proposed structure (Alternative 2B) is divided in seven segments/design elements and proposed foundation types:

2
� The “Viaduct Structure Widening” supported on large-diameter Cast-In-Drilled Hole (CIDH) foundations,
� The “Transition Structure Widening at On-Ramp” supported on driven pile foundations,
� The “WB On-Ramp Structure” supported by 4 bents and an abutment on driven piles foundations,
� The “WB Off-Ramp Structure” supported by 5 bents and one abutment on driven piles foundations,
� The “Transition Structure Widening at WB Off-Ramp” involving 1 bent on driven pile foundation,
� Two retaining walls adjacent to the ramp abutments on driven piles, and
� A Retaining wall along south side of Macalla Road on spread footing.
Other major foundations are yet to be built in the area for the future I-80 Transition Structure and Final E/B On-Ramp. These foundations consist of large driven pile groups and will require temporary shoring for excavations and access roads. Construction of Transition Bent W7 to Abut W11 foundations are in progress as part of the YBI Transition Structures Advance Construction Package No. 2R0 (2007) and the YBITS#1 contract. Utility conduits and drainage devices are being and will be built in the sloping grounds between I-80 Transition Bents W7 and W9. A Caltrans Retaining Wall No. 6 is proposed in the sloping ground between Transition Structure Bents W7(L) and W8(L).
3
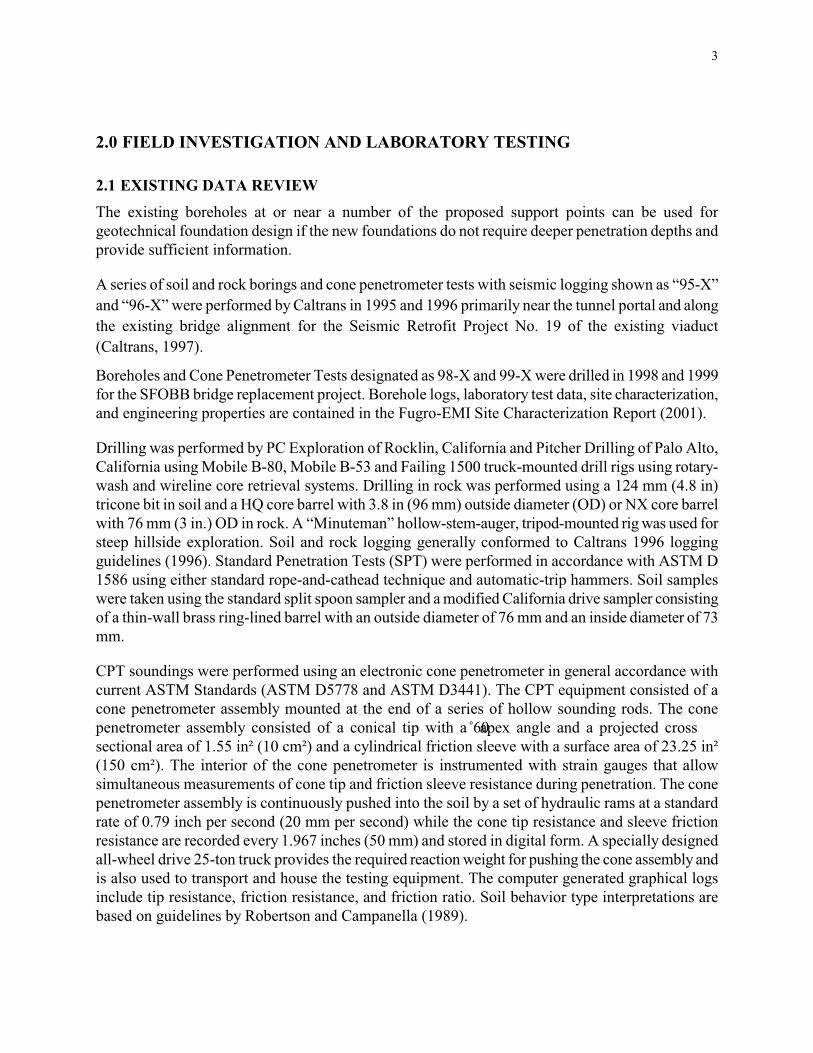
2.0 FIELD INVESTIGATION AND LABORATORY TESTING
2.1 EXISTING DATA REVIEW
The existing boreholes at or near a number of the proposed support points can be used for geotechnical foundation design if the new foundations do not require deeper penetration depths and provide sufficient information.
A series of soil and rock borings and cone penetrometer tests with seismic logging shown as “95-X” and “96-X” were performed by Caltrans in 1995 and 1996 primarily near the tunnel portal and along the existing bridge alignment for the Seismic Retrofit Project No. 19 of the existing viaduct (Caltrans, 1997).
Boreholes and Cone Penetrometer Tests designated as 98-X and 99-X were drilled in 1998 and 1999 for the SFOBB bridge replacement project. Borehole logs, laboratory test data, site characterization, and engineering properties are contained in the Fugro-EMI Site Characterization Report (2001).
Drilling was performed by PC Exploration of Rocklin, California and Pitcher Drilling of Palo Alto, California using Mobile B-80, Mobile B-53 and Failing 1500 truck-mounted drill rigs using rotary-wash and wireline core retrieval systems. Drilling in rock was performed using a 124 mm (4.8 in) tricone bit in soil and a HQ core barrel with 3.8 in (96 mm) outside diameter (OD) or NX core barrel with 76 mm (3 in.) OD in rock. A “Minuteman” hollow-stem-auger, tripod-mounted rig was used for steep hillside exploration. Soil and rock logging generally conformed to Caltrans 1996 logging guidelines (1996). Standard Penetration Tests (SPT) were performed in accordance with ASTM D 1586 using either standard rope-and-cathead technique and automatic-trip hammers. Soil samples were taken using the standard split spoon sampler and a modified California drive sampler consisting of a thin-wall brass ring-lined barrel with an outside diameter of 76 mm and an inside diameter of 73 mm.
CPT soundings were performed using an electronic cone penetrometer in general accordance with current ASTM Standards (ASTM D5778 and ASTM D3441). The CPT equipment consisted of a cone penetrometer assembly mounted at the end of a series of hollow sounding rods. The cone penetrometer assembly consisted of a conical tip with a 60�� ����� ���� ���� �� �� ������� �� ���sectional area of 1.55 in² (10 cm²) and a cylindrical friction sleeve with a surface area of 23.25 in² (150 cm²). The interior of the cone penetrometer is instrumented with strain gauges that allow simultaneous measurements of cone tip and friction sleeve resistance during penetration. The cone penetrometer assembly is continuously pushed into the soil by a set of hydraulic rams at a standard rate of 0.79 inch per second (20 mm per second) while the cone tip resistance and sleeve friction resistance are recorded every 1.967 inches (50 mm) and stored in digital form. A specially designed all-wheel drive 25-ton truck provides the required reaction weight for pushing the cone assembly and is also used to transport and house the testing equipment. The computer generated graphical logs include tip resistance, friction resistance, and friction ratio. Soil behavior type interpretations are based on guidelines by Robertson and Campanella (1989).

4
Additional borings designated as “07-X” and “08-X” were performed in the slope areas for additional foundations and are documented in Addenda to the Site Characterization Report (Fugro-EMI, 2008).
2.2 FIELD INVESTIGATION
2.2.1 Borehole Locations
Site reconnaissance visits were conducted in July and August 2009 to plan the investigation, stake borehole locations, and mark and clear underground utilities. Borehole survey was provided by AECOM/Towill. A geotechnical field investigation was then conducted by EMI in August 2009 that consisted of drilling a total of 13 exploratory borings in the project area. The purpose of theseborings was to determine subsurface conditions and collect samples of subsurface soils for the proposed bridge and wall foundations and for pavement design. Work was performed under a U.S. Navy permit provided by AECOM and a Caltrans encroachment permit rider obtained by EMI under a permit pulled by AECOM. Work was coordinated with AECOM, Caltrans Construction and Environmental Engineering, General Contractor C.C. Meyers, the Public Utilities Commission on Treasure Island, and Towill land surveyors.
Based on the experience during past foundation construction on the SFOBB Bridge Replacement Project, Caltrans direction was to characterize soil and rock conditions at each proposed support by an exploratory borehole to avoid or minimize construction issues and potential significant contractor claims. Caltrans also directed not to encroach into the Historical District area upslope of the NimitzHouse. Based on this direction and geotechnical foundation design considerations, borehole locations were placed at or near proposed bridge foundations based on a number of considerations including need (lack of existing data), site accessibility, presence of existing structures and buried and overhead utilities, personnel safety concerns, fire hazard, and minimal impact on traffic and on-going construction operations. Most of the boreholes were in sloping ground and difficult access. Most (10)of the boreholes were deep and placed in the On-Ramp/Off-Ramp loop area and three shallow borings were placed behind the proposed retaining wall along Macalla Road.
2.2.2 Drilling and Sampling
Drilling in soil was performed using the mud rotary-wash technique with 5-inch diameter auger. Soil sampling was performed to collect relatively undisturbed and disturbed samples for soil laboratory testing. California Drive sampler and a Standard Penetration Test (SPT) sampler were alternated at approximately 5 to 10 ft depth intervals. Soil samples were visually logged in the field following Caltrans Soil and Rock Classification Manual. Relatively undisturbed drive samples were obtained using a Modified California split-spoon sampler (3¼” outside diameter) lined with brass rings 1-inchlong with 2.5-inch outside diameter and 2.4” inside diameter. Disturbed samples were obtained using a SPT sampler (1.4-inch inside diameter) without liners. Standard Penetration Tests (SPT) were performed in the borings generally at 5-foot depth intervals. Both samplers were driven into the ground using a 140-lb automatic-trip hammer free-falling 30 inches.
When rock was encountered, the drill equipment was converted to wireline core drilling using atriple-barrel coring system fitted with carbide bit or HQ-size diamond-impregnated bit tools and a

5
101-mm diameter geobarrel sampling. Rock cores were carefully handled, extruded on PVC shells for visual inspection and logging, then preserved using cellophane/shrink wrap to retain in-situ moisture and stored in sturdy wooden core boxes.
Hazardous materials (free product) or soil contamination was not observed or encountered during drilling. Aerially deposited lead sampling or testing is beyond the scope of this report.
2.3 LABORATORY TESTING
Laboratory tests were performed to determine relevant physical characteristics and engineering properties of soils that exist at the site. Selected representative soil samples were tested to determine soil classification and physical and engineering properties.
The laboratory tests were conducted in general accordance with California Test Methods or American Society for Testing and Materials (ASTM) Standards.
3.0 GEOLOGICAL SETTING
3.1 REGIONAL GEOLOGICAL STRUCTURE
The project is located in the Coast Ranges geologic/geomorphic province of northern California. The Coast Ranges extend from approximately 300 miles from the Transverse Ranges province in the south to the Klamath Mountains about 250 miles to the north of the project site. The Coast Ranges province is bordered on the west by the Pacific Ocean and to the east by the Great Valley province. The Coast Ranges have a general northwest orientation and are characterized by north-northwest trending ranges and valleys.
The San Francisco Bay region comprises a northwesterly-oriented geomorphic depression called the San Francisco Bay-Santa Clara Valley (SFB-SCV) depression (Page, 1992). The SFB-SCV is bounded by the Santa Cruz Mountains to the southwest, and the East Bay Hills and Diablo Range to the northeast. The SFB-SCV depression and its bounding mountains all have relatively recent tectonic origin within about the past 3 or 4 million years (Page, 1992).
Although tectonic deformation continues today, the bulk of large-scale crustal folding and down-warping was near completion about 1 million to 500,000 years ago. At about 100,000 years ago the hills and valleys reached their present configuration and the present form of the bay could have been recognized (Page, 1992; Goldman, 1992).
The project site is between two major fault systems, the San Andreas fault west of the site and the Hayward fault system to the east. The San Andreas Fault is the boundary between the Pacific and the North American tectonic plates and juxtaposes the Jurassic/Cretaceous-age Salinian Block plutonic rocks against the Jurassic/Cretaceous-age Franciscan Complex. The Franciscan rocks are juxtaposed against the Great Valley Sequence which lies east of the Hayward fault.

6
The Franciscan Complex forms the basement rocks under most of the San Francisco Bay area, including the site area, and consists of sedimentary, metamorphic, and igneous rocks. These rocks are believed to have been accreted onto the North American plate during plate subduction that largely ended in the Miocene (Page, 1992). Although parts of the accreted assemblage form coherent, solid rock, most of the complex are intensely sheared and disrupted into a mélange of exotic blocks of basalt, chert, limestone, gabbro, blueschist, eclogite, and amphibolite that are embedded in a tectonic paste of sheared shale, sandstone, and serpentinite (Wahrhaftig, 1989). Deposited onto these basement rocks are Tertiary-age marine and non-marine sedimentary rocks such as the Contra Costa Group and Santa Clara Formations.
3.2 LOCAL GEOLOGY OVERVIEW
Yerba Buena Island is located within the San Francisco Bay, approximately 11 miles east of the San Andreas Fault and 8 miles west of the Hayward fault. Yerba Buena Island can be divided into four distinct topographic zones. These zones are the Main Island, Northeast Point which forms the small knoll at the northeast tip of the island, and the Saddle Area that forms the lowest part of the natural island between the Main Island and Northeast Point, and Treasure Island, the low-elevation man-made island on the north. The project area is on the northeast flank of the Main Island.
The island is underlain by Franciscan Formation basement rock consisting of interbedded graywacke sandstone, siltstone and claystone of varying proportions. The majority of the Franciscan Formation is covered with unlithified sand and localized areas of artificial fill. The unlithified sand is partially eolian (windblown) in origin (Schlocker, 1974) and partially weathered and decomposed Franciscan sandstone. The sand covers most of the bedrock on the island, except along the lower parts of the slopes where waves have cleaned the rocks, and on Northeast Point. Grading in the late 1930’s at the Northeast point removed up to 50-60 feet off the top of the hill exposing slightly weathered bedrock.Areas of artificial fill surrounding the island, such as Treasure Island and the Coast Guard Station, were created by placing cut materials from Yerba Buena Island and dredged bay deposits.
Review of regional seismotectonics of the San Francisco Bay Area indicates that there are no known active faults in proximity of Yerba Buena Island and no historical earthquakes have been associated with fault rupturing on the island. Faulting and seismicity on the island are discussed in more detail in the YBI Site Geotechnical Characterization Report (EMI-Fugro, 2001).
3.3 LOCAL STRATIGRAPHY
The majority of the island is covered with unlithified alluvial deposits, along with localized areas of artificial fill. The unlithified material is primarily wind-blown sand and weathered decomposed Franciscan Formation.
The project site is characterized by the following four basic units:
� Artificial Fill (af),
� Sedimentary Deposits and Alluvium (Qs, Qal, Qb, Qc, Dbr),

7
� Landslide Deposits (Qls and Qols),and
� Bedrock of the Franciscan Formation (JKf).
These units are essentially the same as those found throughout the island as described in the YBI Site Geotechnical Characterization Report (EMI-Fugro, 2001). Table 3-1 provides a summary of site stratigraphy of units which are described in more detail in subsequent sections.
TABLE 3-1. STRATIGRAPHIC INFORMATION
UNIT NAME APPROXIMATE AGE DESCRIPTION
Artificial Fill (af) <100 yrs sand
Alluvium (Qa, Qal): Holocene (< 10,000 yrs) sand, silt and gravel; non indurated to weakly indurated.
Sandy Clay , Silty Clay, Clay (Qs, Qb, Qc, Qc/Dbr)
Late-Middle Pleistocene (10,000-300,000 yrs)
light brown, light gray decomposed mudstone, claystone, shale;
Salinian block granitics, Franciscan and Franciscan metavolcanics
(JKf)
Jurassic/Cretaceous (144-206my)
Salinian block granitics – granodiorite, quartz monzonite, quartz diorite, Franciscan – 25,000 ft thick bedded and massive graywacke, sandstone interbedded with thin-bedded to laminar claystone and siltstone, greenstone, blueschist, greenschist, serpentinized peridotite.
3.3.1 Artificial Fill
Fill occurs locally across the island as road base, foundation support, and landscaping soil. Fill also occurs as uncompacted cast-over or disturbed surficial slough from the various historical development activities. Along the many roads around the island, cast-over grading material from the road building activities overlies, and is gradational with, native slope-wash sedimentary alluvium. Artificial fill occurs along the island shoreline east and south of the Northeast Point at the Torpedo Building and Torpedo Road, and in the Coast Guard base in the southern Saddle Area. Most of the present U.S. Coast Guard Station is entirely on fill first placed around 1934.
The fill material within the Southern Saddle Area is up to about 30 feet thick. Exploratory excavation indicated the upper portion of the fill consists of brown to yellowish brown, moist, loose to medium dense, fine grained sands with some gravel. The lower portion consists of a coarser fraction composed of brown and gray sand and gravel material with large angular cobbles and boulders of the Franciscan Formation sandstone and siltstone.

8
3.3.2 Sedimentary Deposits
Sedimentary deposits are generally slopewash alluvium composed primarily of fine-grained sand and silty sand with a few scattered silt and clay lenses. The colors of the alluvium are shades of brown ranging from yellowish-brown, brown, brownish-yellow, and dark brown. The material is loose to very dense and generally moist except on the upper slopes where it is locally dry to moist. The deposits are thick-bedded to unbedded; where bedding occurs it is generally horizontal to dipping about 20 degrees.
The great thickness and fine-grained nature of the sands along with their poor grading andwidespread distribution in pockets across the island suggests these materials originated as wind-blown sands similar to those occurring on much of the San Francisco Peninsula. Mixed in with the wind-blown deposits may be weathered-in-place siltstone and sandstone of the Franciscan Formation.
The bottom portion of the unlithified deposits generally consists of clay to sandy clay unit about 5 to 15 feet thick (denoted as Qc/Dbr). This clayey deposit is multicolored with shades of yellowish-brown and reddish-brown with gray, black, and white specks, streaks, and spots.
The clayey zone grades imperceptibly downward into sandstone but occasionally contains fragments of decomposed to weathered sandstone. The clays are typically stiff to hard. The gray areas are generally centered around tubular void spaces of l to 2 mm size which appear to be remnant root holes suggesting the material is a relict soil. These characteristics indicate that the unit is completely decomposed and altered Franciscan bedrock. In some cases, the material is intersected by white to black clay seams and planar features that appear to be relict bedding, joints, or veins, typical of those seen within the underlying bedrock. Occasionally, these features could be traced into the underlying rock.
The slope soils predominantly consist of medium dense to dense sedimentary alluvium of poorly-graded, fine-grained sands with varying amounts of silt. The alluvium is generally unbedded and massive. The alluvium is underlain by a layer of very dense clayey sand (at higher elevations) to hard sandy clay (at lower elevations) a few meters thick that represent the transition zone between soil and intensely to highly weathered Graywacke sandstone/siltstone/claystone of the Franciscan Formation. Two design soil profile cross sections are attached as identified in the site plan.
3.3.3 Landslide Deposits
A portion of the project area appears to have experienced shallow landslides. Similar but degraded slide scars can be seen on the slopes around the island indicating that these features have occurred in the past and are a recurring phenomenon. Landslides on YBI consist of two types: thin surficial soil slips and wedge failures involving Franciscan Formation bedrock. These landslides are generally small and occur where slopes have been over-steepened by erosion and excavations. The landslides within the site area appear to thin features similar to those observed throughout the island.
The poorly stratified nature of the unlithified sandy slope-wash and wind-blown deposits indicatethat the predominant landsliding agent is reworking and remobilization by gravitational slope-wash processes. These processes comprise soil creep and landsliding. The landslides can be caused or

9
exacerbated during severe winter rains when the sands become saturated. For example, the intense rainfall during the winter of 1998-1999 resulted in several large shallow soil slips on the steep (about 40º) slopes above the Coast Guard base. Exposures in these slide scars revealed only massive deposits. These slides involved surficial sands of the Sedimentary Deposits. The depth of these slides was on the order of about 2 to 5 feet.
3.3.4 Bedrock
The Jurassic/Cretaceous-age Franciscan Formation (JKf) forms the bedrock of YBI and underlies the surficial unlithified sediments. The Franciscan Formation is about 140 million years old and has a long history beginning with deposition in a deep ocean basin to uplifting to its present surfaceexposure.
The Franciscan formation consists of interbedded sandstone, siltstone and claystone. However, the formation within the YBI ramps area is predominantly thick-bedded to massive sandstone with only a few thin beds of claystone or siltstone. The few beds indicate bedding orientation dipping to the northeast consistent with outcrops and other borings on the island (EMI-Fugro, 2001). The rock is commonly soft in the upper 5 to 15 feet where it has been altered by weathering. These weathered rocks are generally brown. With increasing depth, weathering decreases, and the rocks become gray and much harder.
The rocks have abundant intersecting calcite veins which represent healed fractures. There are a few minor fractured zones. Tiny hairline fractures with tiny offsets are ubiquitous throughout the formation. These small fractures are largely intra-formational and commonly intra-stratal features that formed when the rocks were still soft sediment or only slightly lithified. Displacements on such features are generally on the order of millimeters or centimeters. These features are completely healed and may be tens of millions of year old and of no significance to the modern tectonic regime.
3.4 LOCAL GEOLOGICAL STRUCTURE
The Franciscan Formation on Yerba Buena Island and the immediate surrounding area is unusually coherent compared to the formation in other parts of California which is composed of a highly deformed melange of ancient seafloor/trench deposits. The rocks are about 140 million years old and have undergone a long history of deformation beginning with uplift from the deep ocean basin to its present surface exposure. This history included subduction zone tectonics, perhaps several episodes of uplift, folding, and subsidence, and plate-boundary faulting.
There are abundant shear zones with minor displacements on the order of millimeters and centimeters within the Franciscan Formation bedrock. Several larger fracture zones and minor shearzones were encountered in boreholes and foundation excavations within the rocks of Northeast Point (EMI-Fugro, 2001). However, there are no known active faults in proximity of Yerba Buena Island (EMI-Fugro, 2001) and no historic earthquakes associated with fault rupturing on the island.Geophysical investigations north of the island revealed that offshore discontinuities are a result of dredging and filling activities and not faulting (EMI-Fugro, 2001). An onshore geophysical study suggested another zone of poor continuity within the Saddle Area, but detailed analysis of aerial photographs, geophysics, core samples, and down-hole video logs do not favor a fault origin.
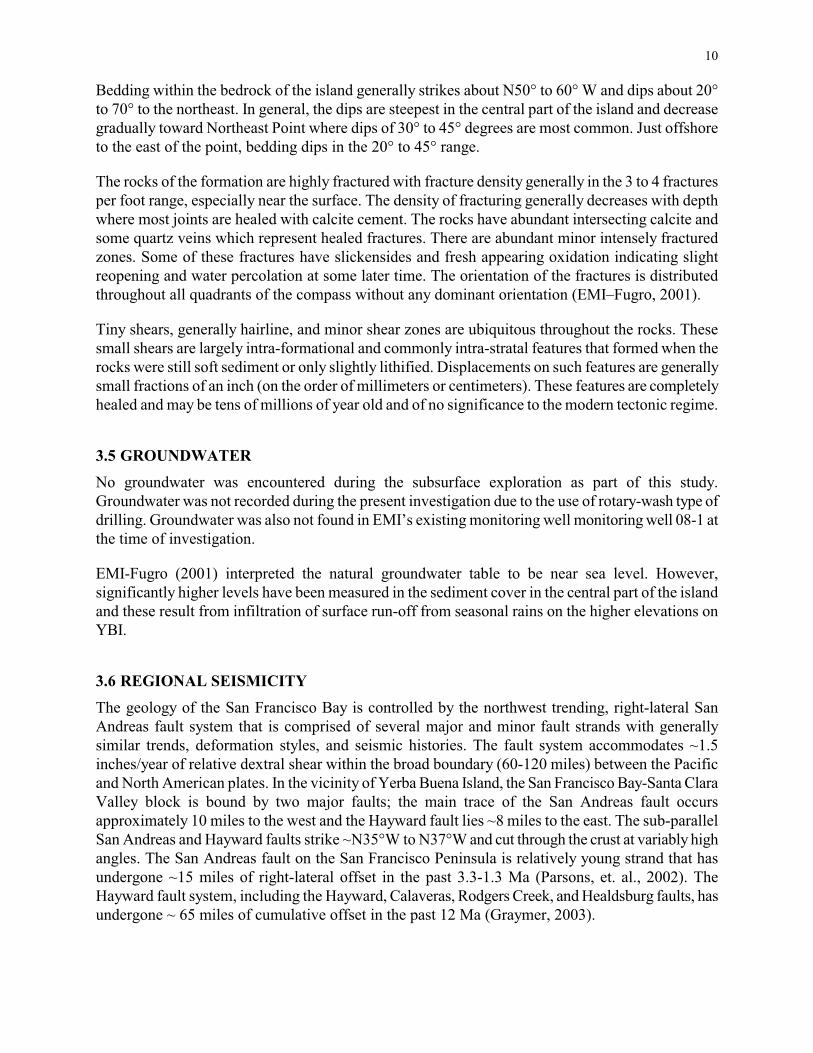
10
Bedding within the bedrock of the island generally strikes about N50° to 60° W and dips about 20° to 70° to the northeast. In general, the dips are steepest in the central part of the island and decrease gradually toward Northeast Point where dips of 30° to 45° degrees are most common. Just offshore to the east of the point, bedding dips in the 20° to 45° range.
The rocks of the formation are highly fractured with fracture density generally in the 3 to 4 fractures per foot range, especially near the surface. The density of fracturing generally decreases with depth where most joints are healed with calcite cement. The rocks have abundant intersecting calcite and some quartz veins which represent healed fractures. There are abundant minor intensely fractured zones. Some of these fractures have slickensides and fresh appearing oxidation indicating slight reopening and water percolation at some later time. The orientation of the fractures is distributed throughout all quadrants of the compass without any dominant orientation (EMI–Fugro, 2001).
Tiny shears, generally hairline, and minor shear zones are ubiquitous throughout the rocks. These small shears are largely intra-formational and commonly intra-stratal features that formed when the rocks were still soft sediment or only slightly lithified. Displacements on such features are generally small fractions of an inch (on the order of millimeters or centimeters). These features are completely healed and may be tens of millions of year old and of no significance to the modern tectonic regime.
3.5 GROUNDWATER
No groundwater was encountered during the subsurface exploration as part of this study.Groundwater was not recorded during the present investigation due to the use of rotary-wash type of drilling. Groundwater was also not found in EMI’s existing monitoring well monitoring well 08-1 at the time of investigation.
EMI-Fugro (2001) interpreted the natural groundwater table to be near sea level. However, significantly higher levels have been measured in the sediment cover in the central part of the island and these result from infiltration of surface run-off from seasonal rains on the higher elevations on YBI.
3.6 REGIONAL SEISMICITY
The geology of the San Francisco Bay is controlled by the northwest trending, right-lateral San Andreas fault system that is comprised of several major and minor fault strands with generally similar trends, deformation styles, and seismic histories. The fault system accommodates ~1.5 inches/year of relative dextral shear within the broad boundary (60-120 miles) between the Pacific and North American plates. In the vicinity of Yerba Buena Island, the San Francisco Bay-Santa Clara Valley block is bound by two major faults; the main trace of the San Andreas fault occurs approximately 10 miles to the west and the Hayward fault lies ~8 miles to the east. The sub-parallel San Andreas and Hayward faults strike ~N35°W to N37°W and cut through the crust at variably high angles. The San Andreas fault on the San Francisco Peninsula is relatively young strand that has undergone ~15 miles of right-lateral offset in the past 3.3-1.3 Ma (Parsons, et. al., 2002). The Hayward fault system, including the Hayward, Calaveras, Rodgers Creek, and Healdsburg faults, has undergone ~ 65 miles of cumulative offset in the past 12 Ma (Graymer, 2003).
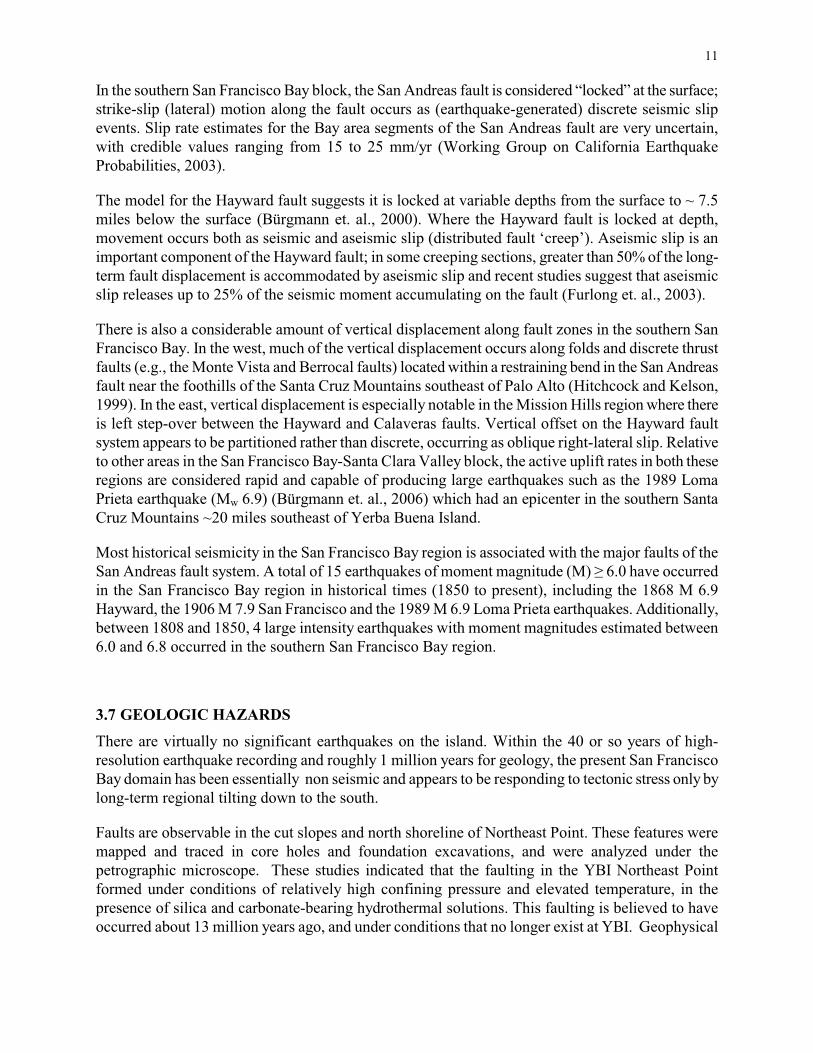
11
In the southern San Francisco Bay block, the San Andreas fault is considered “locked” at the surface; strike-slip (lateral) motion along the fault occurs as (earthquake-generated) discrete seismic slip events. Slip rate estimates for the Bay area segments of the San Andreas fault are very uncertain, with credible values ranging from 15 to 25 mm/yr (Working Group on California Earthquake Probabilities, 2003).
The model for the Hayward fault suggests it is locked at variable depths from the surface to ~ 7.5 miles below the surface (Bürgmann et. al., 2000). Where the Hayward fault is locked at depth, movement occurs both as seismic and aseismic slip (distributed fault ‘creep’). Aseismic slip is an important component of the Hayward fault; in some creeping sections, greater than 50% of the long-term fault displacement is accommodated by aseismic slip and recent studies suggest that aseismic slip releases up to 25% of the seismic moment accumulating on the fault (Furlong et. al., 2003).
There is also a considerable amount of vertical displacement along fault zones in the southern San Francisco Bay. In the west, much of the vertical displacement occurs along folds and discrete thrust faults (e.g., the Monte Vista and Berrocal faults) located within a restraining bend in the San Andreas fault near the foothills of the Santa Cruz Mountains southeast of Palo Alto (Hitchcock and Kelson, 1999). In the east, vertical displacement is especially notable in the Mission Hills region where there is left step-over between the Hayward and Calaveras faults. Vertical offset on the Hayward fault system appears to be partitioned rather than discrete, occurring as oblique right-lateral slip. Relative to other areas in the San Francisco Bay-Santa Clara Valley block, the active uplift rates in both these regions are considered rapid and capable of producing large earthquakes such as the 1989 Loma Prieta earthquake (Mw 6.9) (Bürgmann et. al., 2006) which had an epicenter in the southern Santa Cruz Mountains ~20 miles southeast of Yerba Buena Island.
Most historical seismicity in the San Francisco Bay region is associated with the major faults of the San Andreas fault system. A total of 15 earthquakes of moment magnitude (M) ��6.0 have occurred in the San Francisco Bay region in historical times (1850 to present), including the 1868 M 6.9 Hayward, the 1906 M 7.9 San Francisco and the 1989 M 6.9 Loma Prieta earthquakes. Additionally, between 1808 and 1850, 4 large intensity earthquakes with moment magnitudes estimated between 6.0 and 6.8 occurred in the southern San Francisco Bay region.
3.7 GEOLOGIC HAZARDS
There are virtually no significant earthquakes on the island. Within the 40 or so years of high-resolution earthquake recording and roughly 1 million years for geology, the present San Francisco Bay domain has been essentially non seismic and appears to be responding to tectonic stress only by long-term regional tilting down to the south.
Faults are observable in the cut slopes and north shoreline of Northeast Point. These features were mapped and traced in core holes and foundation excavations, and were analyzed under the petrographic microscope. These studies indicated that the faulting in the YBI Northeast Point formed under conditions of relatively high confining pressure and elevated temperature, in the presence of silica and carbonate-bearing hydrothermal solutions. This faulting is believed to have occurred about 13 million years ago, and under conditions that no longer exist at YBI. Geophysical

12
surveys (EMI-Fugro, 2001) also show that none of the young sediment units in the area have been deformed, eliminating the possibility of Holocene fault activity.
It is therefore concluded that there is little hazard of tectonic faulting or other permanent local deformation to the project area. The long-term regional tilting down to the south of the San Francisco Bay domain is probably continuing, but at a rate that is so slow (approximately 0.1 mm/yr) that it is effectively imperceptible in the YBI area.
3.7.1 Landslides
In general, landslides are the downslope motions of earth materials including rock, soil, or both. Landslides can move by translational movement or rotational settlement or a combination of both. They are the result of the loss of ability of earth materials to maintain their integrity at a specificslope gradient. Subsequently landslides settle into a lesser gradient or state of greater equilibrium. The internal material strength is lost and the material then settles into a form where the mass is centralized on the downhill side of motion. Often landslides are associated with water because water increases the material unit weight and decreases the internal strength of the material. Landslides become increasingly more probable with increasing slope gradient, looseness of material, unfavorable bedding conditions (out of slope), clay content of bedrock, underground springs, unfavorable slope orientation with existing fault boundaries, human/artificial impacts and disturbances, increases in groundwater, earthquake forces, increases in water content and disturbances of the lateral confining forces and/or the portion of the slope.
The steep portions of the existing slopes south of existing I-80 have a history of surficial sloughing after wet periods up to about 3 m deep (detailed information including description, maps, photos, and references is provided in Section 6.3 of 2001 Fugro-EMI Site Characterization Report, and Section 4.3.1.1 and Plates 2 and 40-42 of the 2002 Fugro-EMI Foundation Report). Previous reports for the area discuss and document surficial sloughing and failures dating back to the 1930s, 1974, and during the wet season of 1997-1998. The last sloughing event occurred in the south portion of the slopes after ground saturation due to significant rainfall in early January 2006 and that portion has since been stabilized by extensive reinforced shotcrete facing. In addition, the sloping ground at Transition Bent W7 is being restored using geogrid-stabilized engineered backfill designed by Fugro-EMI.
Previously conducted slope repairs including the shotcrete slope facing seem to have worked well and prevented reoccurrence of failures, so far. The parts of the slope that have recently been involved with landsliding are probably now somewhat stable, but areas between old slides may still be unstable, and the steeper parts of the head scarps of the old slides should be expected to fail during the next period of prolonged heavy rainfall. Future excavations associated with the new SFOBB that create slopes steeper than the angle of repose (i.e. about 35o) may be subject to raveling, surficial sand flowage, and to shallow landsliding.
13
3.8 SEISMIC HAZARDS
3.8.1 Soil Liquefaction
Liquefaction is a phenomenon whereby saturated granular soils lose their inherent shear strength due to increased pore water pressures, which may be induced by cyclic loading such as that caused by an earthquake.
Liquefaction is more likely in clean, low-fines, poorly-graded, saturated, low-density sands. With increasing overburden, density and increasing clay-content, the likelihood of liquefaction decreases. In regards to clay content, recent studies over the past ten years has demonstrated that clays with certain properties can be prone to liquefaction. Other factors affecting the potential of liquefaction include but not limited to the following: magnitude and proximity of the earthquake; duration of shaking; soil types; grain size distribution; clay fraction content; density; angularity; effective overburden; cyclic loading; and soil stress history. Liquefaction is generally considered possible when the depth to groundwater is less than about 50 feet below the ground surface.
The subject site is underlain by competent medium dense to very dense silty sand and deep clay alluvium, particularly at depths where groundwater has been observed in few soil borings during wet seasons. Within the project area, the potential for soil liquefaction under these conditions is low and not considered a design issue.
3.8.2 Lateral Ground Spreading
Lateral spread is the finite, lateral displacement of sloping ground (< 6% percent) as a result of pore pressure buildup or liquefaction in a shallow, underlying soil deposit during an earthquake. Lateral spreading, as a result of liquefaction, occurs when a soil mass slides laterally on a liquefied layer and gravitational and inertial forces cause the layer and the overlying non-liquefied material to move in adownslope direction. The magnitude of lateral spreading movements depends on earthquake magnitude, distance between the site and the seismic event, thickness of the liquefied layer, ground slope or ratio of free-face height to distance between the free face and structure, fines content, average particle size of the materials comprising the liquefied layer, and the standard penetration rates of the materials. Due to a low site soil liquefaction potential, the potential for lateral spreading to impact the project corridor is low.
3.8.3 Fault-Related Ground Rupture
In general terms, an earthquake is caused when strain energy in rocks is suddenly released by movement along a plane of weakness. In some cases, fault movement propagates upward through the subsurface materials and causes displacement at the ground surface. Surface rupture usually occurs along traces of known or potentially active faults, although many historic events have occurred on faults not previously known to be active.
The California Geologic Survey (CGS) establishes criteria for faults as active, potentially active or inactive. Active faults are those that show evidence of surface displacement within the last 11,000 years (Holocene age). Potentially active faults are those that demonstrate displacement within the

14
past 1.6 million years (Quaternary age). Faults showing no evidence of displacement within the last 1.6 million years may be considered inactive for most structures, except for critical or certain life structures. In 1972 the Alquist-Priolo Special Studies Zone Act (now known as the Alquist-Priolo Earthquake Fault Zone Act, 1994, or APEHA) was passed into law which requires studies within 500 feet of active or potentially active faults. The APEHA designs “active” and “potentially active” faults utilizing the same age criteria as that used by the CGS. However, the established policy is to zone active faults and only those potentially active faults that have a relatively high potential for ground rupture.
The project site is not located within any active fault zones as delineated by the APEHA. Localized faults are observable in the cut slopes and north shoreline of Northeast Point. These features were mapped and traced in core holes and foundation excavations, and were analyzed under the petrographic microscope. These studies indicated that the faulting in the YBI Northeast Point formed under conditions of relatively high confining \pressure and elevated temperature, in the presence of silica and carbonate-bearing hydrothermal solutions. This faulting is believed to have occurred about 13 million years ago, and under conditions that no longer exist at YBI. Geophysical surveys (EMI-Fugro, 2001) also show that none of the young sediment units in the area have been deformed, eliminating the possibility of Holocene fault activity. Therefore, it is our professional opinion that the potential for surface ground rupture for the proposed project improvements is negligible.
3.8.4 Potential for Ground Shaking
The energy released during an earthquake propagates from its rupture surface in the form of seismic waves. The resulting strong ground motion from the seismic wave propagation can cause significant damage to structures. At any location, the intensity of the ground motion is a function of the distance to the fault rupture, the local soil/bedrock conditions beneath the structure, and the earthquake magnitude. Intensity is usually greater in areas underlain by unconsolidated material than in areas underlain by more competent rock. Earthquakes are characterized by a moment magnitude, which is quantitative measure of the strength of the earthquake based on strain energy released during the event. The magnitude is independent of the site, but is dependent on several factors including the type of fault, rock-type, and stored energy.
There are virtually no significant earthquakes on the island. Within the 40 or so years of high-resolution earthquake recording and roughly 1 million years for geology, the present San Francisco Bay domain has been essentially non seismic and appears to be responding to tectonic stress only by long-term regional tilting down to the south.
15
4.0 CONCLUSIONS AND RECOMMENDATIONS
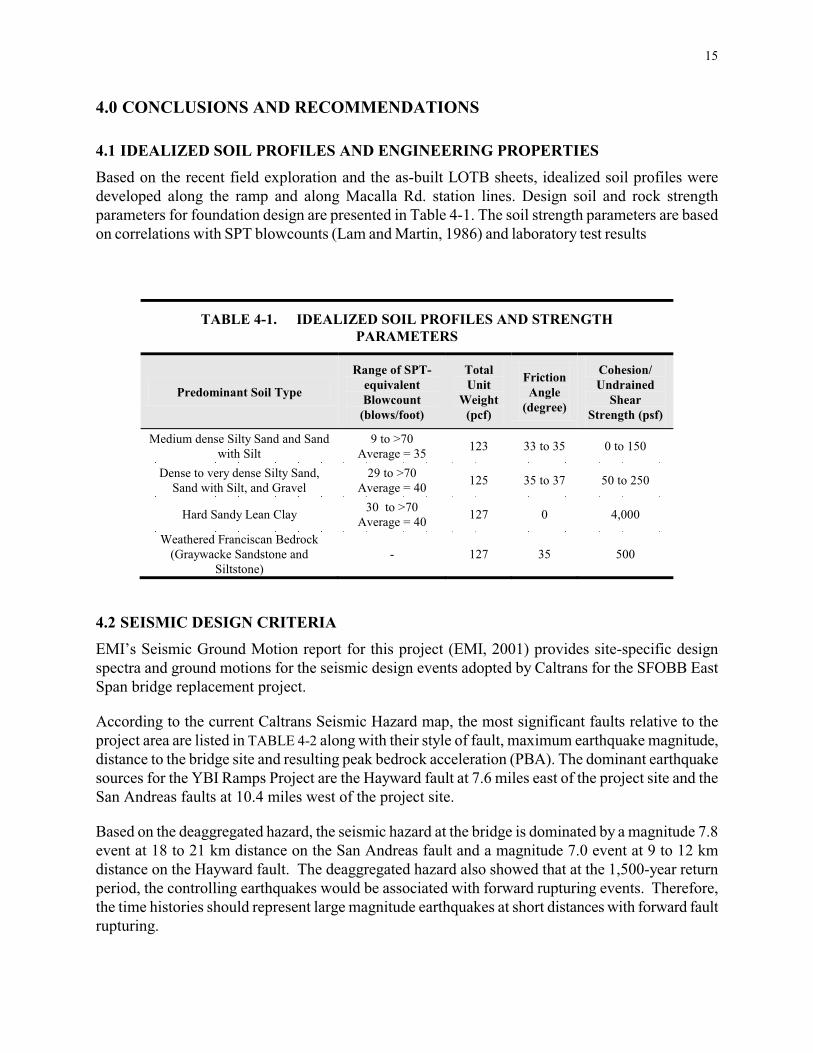
4.1 IDEALIZED SOIL PROFILES AND ENGINEERING PROPERTIES
Based on the recent field exploration and the as-built LOTB sheets, idealized soil profiles were developed along the ramp and along Macalla Rd. station lines. Design soil and rock strength parameters for foundation design are presented in Table 4-1. The soil strength parameters are based on correlations with SPT blowcounts (Lam and Martin, 1986) and laboratory test results included in Appendix C.
TABLE 4-1. IDEALIZED SOIL PROFILES AND STRENGTH PARAMETERS
Predominant Soil Type
Range of SPT-equivalent Blowcount
(blows/foot)
Total Unit
Weight (pcf)
Friction Angle
(degree)
Cohesion/ Undrained
Shear Strength (psf)
Medium dense Silty Sand and Sand with Silt
9 to >70Average = 35 123 33 to 35 0 to 150
Dense to very dense Silty Sand, Sand with Silt, and Gravel
29 to >70Average = 40 125 35 to 37 50 to 250
Hard Sandy Lean Clay 30 to >70Average = 40 127 0 4,000
Weathered Franciscan Bedrock (Graywacke Sandstone and
Siltstone)- 127 35 500
4.2 SEISMIC DESIGN CRITERIA
EMI’s Seismic Ground Motion report for this project (EMI, 2001) provides site-specific design spectra and ground motions for the seismic design events adopted by Caltrans for the SFOBB East Span bridge replacement project.
According to the current Caltrans Seismic Hazard map, the most significant faults relative to the project area are listed in TABLE 4-2 along with their style of fault, maximum earthquake magnitude, distance to the bridge site and resulting peak bedrock acceleration (PBA). The dominant earthquake sources for the YBI Ramps Project are the Hayward fault at 7.6 miles east of the project site and the San Andreas faults at 10.4 miles west of the project site.
Based on the deaggregated hazard, the seismic hazard at the bridge is dominated by a magnitude 7.8 event at 18 to 21 km distance on the San Andreas fault and a magnitude 7.0 event at 9 to 12 km distance on the Hayward fault. The deaggregated hazard also showed that at the 1,500-year return period, the controlling earthquakes would be associated with forward rupturing events. Therefore, the time histories should represent large magnitude earthquakes at short distances with forward fault rupturing.
16
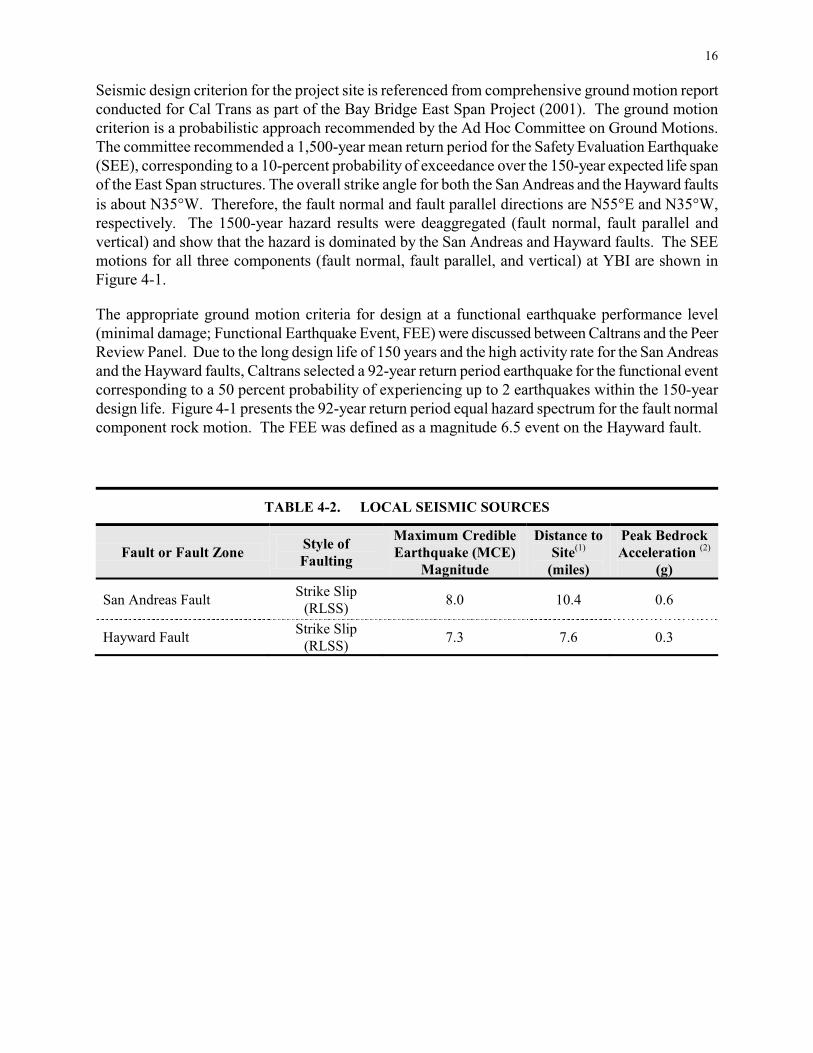
Seismic design criterion for the project site is referenced from comprehensive ground motion report conducted for Cal Trans as part of the Bay Bridge East Span Project (2001). The ground motion criterion is a probabilistic approach recommended by the Ad Hoc Committee on Ground Motions. The committee recommended a 1,500-year mean return period for the Safety Evaluation Earthquake (SEE), corresponding to a 10-percent probability of exceedance over the 150-year expected life span of the East Span structures. The overall strike angle for both the San Andreas and the Hayward faults is about N35�W. Therefore, the fault normal and fault parallel directions are N55�E and N35�W, respectively. The 1500-year hazard results were deaggregated (fault normal, fault parallel and vertical) and show that the hazard is dominated by the San Andreas and Hayward faults. The SEE motions for all three components (fault normal, fault parallel, and vertical) at YBI are shown in Figure 4-1.
The appropriate ground motion criteria for design at a functional earthquake performance level (minimal damage; Functional Earthquake Event, FEE) were discussed between Caltrans and the Peer Review Panel. Due to the long design life of 150 years and the high activity rate for the San Andreas and the Hayward faults, Caltrans selected a 92-year return period earthquake for the functional event corresponding to a 50 percent probability of experiencing up to 2 earthquakes within the 150-year design life. Figure 4-1 presents the 92-year return period equal hazard spectrum for the fault normal component rock motion. The FEE was defined as a magnitude 6.5 event on the Hayward fault.
TABLE 4-2. LOCAL SEISMIC SOURCES
Fault or Fault Zone Style of Faulting
Maximum Credible Earthquake (MCE)
Magnitude
Distance to Site(1)
(miles)
Peak Bedrock Acceleration (2)
(g)
San Andreas Fault Strike Slip(RLSS) 8.0 10.4 0.6
Hayward Fault Strike Slip (RLSS) 7.3 7.6 0.3

17
FIGURE 4-1. 2001 FUGRO-EMI SEE ROCK SPECTRA FOR SFOBB EAST SPAN REPLACEMENT PROJECT AT YBI
Source: EMI, 2001

18
4.3 SOIL CORROSIVITY
A total of seven soil samples were tested for pH, minimum resistivity, soluble chloride content, and soluble sulfate content. The test results are summarized in Table 4-3.
TABLE 4-3. SOIL CORROSION TEST RESULTS
Boring No.
Sample No. Depth (ft) Soil Type
Minimum Resistivity (ohm-cm)
pHSulfate Content (ppm)
Chloride Content (ppm)
09-01 D-7 35.0 SILTY SAND (SM) 18,000 7.66 20 305
09-02 S-9 45.0 SILTY SAND (SM) 7,500 8.39 20 194
09-04 D-14 64.0 SANDY lean CLAY (CL) 2,900 7.57 100 282
09-06 S-13 64.0 Lean CLAY with SAND (CL) 1,000 7.59 400 336
09-07 D-12 59.0 SANDY lean CLAY (CL) 2,500 7.52 200 447
09-10 D-10 50.0 SILTY SAND (SM) 2,300 8.18 20 376
09-10 D-20 100.0 SILTY SAND (SM) 5,900 8.67 20 209
Caltrans Corrosion Guidelines (2003) classify soil as corrosive if the soluble chloride content is less than 500 ppm, the soluble sulfate content is less than 2,000 ppm, and the pH value is 5.5 or higher.Based on the combined test results and these Caltrans criteria, the on-site soils are not considered to be corrosive to bare metals and concrete in contact with the on-site soils at the proposed foundationslocations.
The subject site is located within in a marine environment defined in the Caltrans Corrosion Guidelines as a site located within 1,000 ft of brackish water. For steel piles, sacrificial corrosion allowance is required per Caltrans’ Corrosion Guidelines (2003), Section 10.1. Minimum concrete cover reinforcement should be in accordance with Table 8.22.1 of the Caltrans BDS (2005) for “Corrosive soil above MLLW level with chloride concentration between 500 and 5,000 ppm.” For the above measure pH value and sulfate concentration, cement type should be in accordance with Table 8.22.1 of the Caltrans BDS for “Sulfate concentration from 0 to 1,499 ppm.” Additional corrosion protection requirements for structural members are given in Section 8.22 of the Caltrans BDS.
4.4 EXISTING FOUNDATION DATA
The foundations of the two ramps will be adjacent to or near existing foundations or future foundations which are currently under construction as part of the YBITS#1 contract. The existing I-80 bridge has been demolished and its foundations were cut down to levels that do not interfere with new foundation construction. The new on-ramp will join the I-80 bridge along the north side of the

19
west viaduct. The new off-ramp will divert from the I-80 bridge at Bent W5L. The pile data for these adjacent foundations is summarized below:
TABLE 4-4. CLOSEST AS-BUILT FOUNDATION DATA
Support Location Pilecap Bottom El. (m)
Foundation Type
Service Demand (tons) Spec. Tip El. (m)
Bent W10AL (North Col.) +42.6 HP14x132* 80 +32.0
Bent W10L (North Col.) +43.0 HP14x132 80 +31.5
Bent W9L (North Col.) +41.2 HP14x132 80 +30.0
Bent W8L (North Col.) +34.1 HP14x132 80 +21.0
Bent W7L (North Col.) +21.6 HP14x132 80 +8.0
Bent W6L +6.6 HP14x132 75 -11.5
Bent W5L +6.1 HP14x132 75 -10.5
Note: HP14x132* is HP 360x132 metric; 80 tons is 1,450 kN; 75 tons is 1,350 kN.
4.5 PILE FOUNDATION DESIGN
The proposed structure (Alternative 2B) is divided in six segments/design elements. The following summarizes the segments and proposed foundation types:
� The “Viaduct Structure Widening” supported on large-diameter Cast-In-Drilled Hole(CIDH) foundations,
� The “Transition Structure Widening at On-Ramp” supported on driven pile foundations foundations,
� The “WB On-Ramp Structure” supported by 4 bents and an abutment on driven piles foundations,
� The “WB Off-Ramp Structure” supported by 5 bents and one abutment on driven piles foundations,
� The “Transition Structure Widening at WB Off-Ramp” involving 1 bent on driven pile foundation,
� Two retaining walls adjacent to the ramp abutments on driven piles, and
� A Retaining wall along south side of Macalla Road on spread footing.
This section discusses feasible foundation types, presents pile foundation design, evaluate pile/slope stability, and develop recommendations for ramp abutment design.

20
4.5.1 Foundation Type
To meet structural demands and due to high peak bedrock accelerations at the project site, deep foundations are required. Selection of the foundation type at each location involves consideration of existing structures (buried or above-ground), ground condition, noise, vibration, constructibility(e.g., caving soils, dense soils, rock), site accessibility by and availability of construction equipment, and cost. Driven steel piles and Cast-in-Drilled-Hole (CIDH) piles are feasible foundation types at all support locations. Considerable construction experience exists in the area in regards to both foundation types. The project borders a designated Historical District which includes the General Nimitz building located near ramp Bents 7 and 8. CIDH may be a preferred type if vibration and noise is to be minimized, however, three large pile groups consisting of steel HP14x132 sections were successfully driven to date at the Transition Structure Bent W7 site. In general, there is sufficient fines in the alluvial soils to preclude the potential of caving within the granular soils during construction of the CIDH piles. A single occurrence of soil caving in the first large diameter CIDH pile was dealt with per project specifications. The use of CIDH piles precludes the use of battered piles to resist lateral loads and as a result requires larger diameters to meet lateral demands. Due tolack of soils susceptible to soil liquefaction, pile downdrag under seismic loading condition is not a design issue for either pile type. Pile interaction is a design issue for new piles adjacent to the new I-80 structure foundations.
Unless extraordinary high lateral loads demand the use of large diameter CIDH piles or space limitation precludes the construction of a pile cap, driven piles are recommended for the project.
Based on the above site evaluations, three special issues need to be considered for foundation design:
� Per Caltrans’ Corrosion Guidelines (2003), Section 10.1, the corrosion rate of 0.004 inch per year for a 75-year design life needs to be used for estimating the sacrificial metal loss, or the use of protective coatings and/or cathodic protection. As H-pile can corrode from both sides, no commonly available sections can accommodate the required 0.6 inch of sacrificial thickness. Consequently, protective coating on standard H-piles can be considered.
� To avoid potential damage on the existing 12’x12’ culvert located next to the proposed Bent 3 foundation during pile installation, pre-drilling to 2 feet below the culvert bottom(estimated at about El. + 464.5 feet) is recommended for Bent 3 piles. The skin fiction in the pre-drilling zone is ignored in estimating Bent 3 pile lengths.
4.5.2 Bridge Foundation Design
The viaduct widening will be on 72” CIDH Type-1 cantilever shafts. The ramp abutments will be seat-type supported by a retaining wall on driven HP piles. The bents will be on HP piles and 24” diameter CIDH piles. The selected foundation types are summarized in TABLE 4-6 for the On-Ramp, and TABLE 4-7 for the Off-Ramp.
Per Caltrans policy, the Load and Resistant Factor Design (LRFD) method is used for bent piles and the Working Stress Design (WSD) is used for abutment piles. The foundation design data and foundation loads provided by the structural designers are shown in Table 4-5 to Table 4-7.

21
4.5.3 Axial Capacity
The abutment foundations were designed using working stress design (WSD) per Caltrans policy (2008) using the maximum permanent axial load per pile for the service limit state. The required nominal resistance per pile is twice the maximum compression load. The analysis took into account group effects considering adjacent foundations.
The bent foundations were designed using load factor resistance design (LRFD) per Caltrans policy (2008) using the maximum factored loads per pile for the strength limit state or extreme limit state. The required nominal resistance per pile is the maximum demand divided by a resistance factor (0.7 for strength limit, 1.0 for extreme event limit). The piles were designed for a maximum pile-head settlement of 1/2 inch under service loading. The analysis takes into account group effectsconsidering adjacent foundations.
The HP piles were designed using FHWA methods and American Petroleum Institute criteria (API, 1993) to estimate skin friction and end-bearing resistances. Pile group effects based on the layoutprovided by AECOM and the guidelines published in the AASHTO LRFD Bridge Design Specifications (2007) were included in these results. The ultimate axial capacity of the CIDH piles was determined using the Reese and O’Neill method (1989) addressed in the Caltrans BDS.
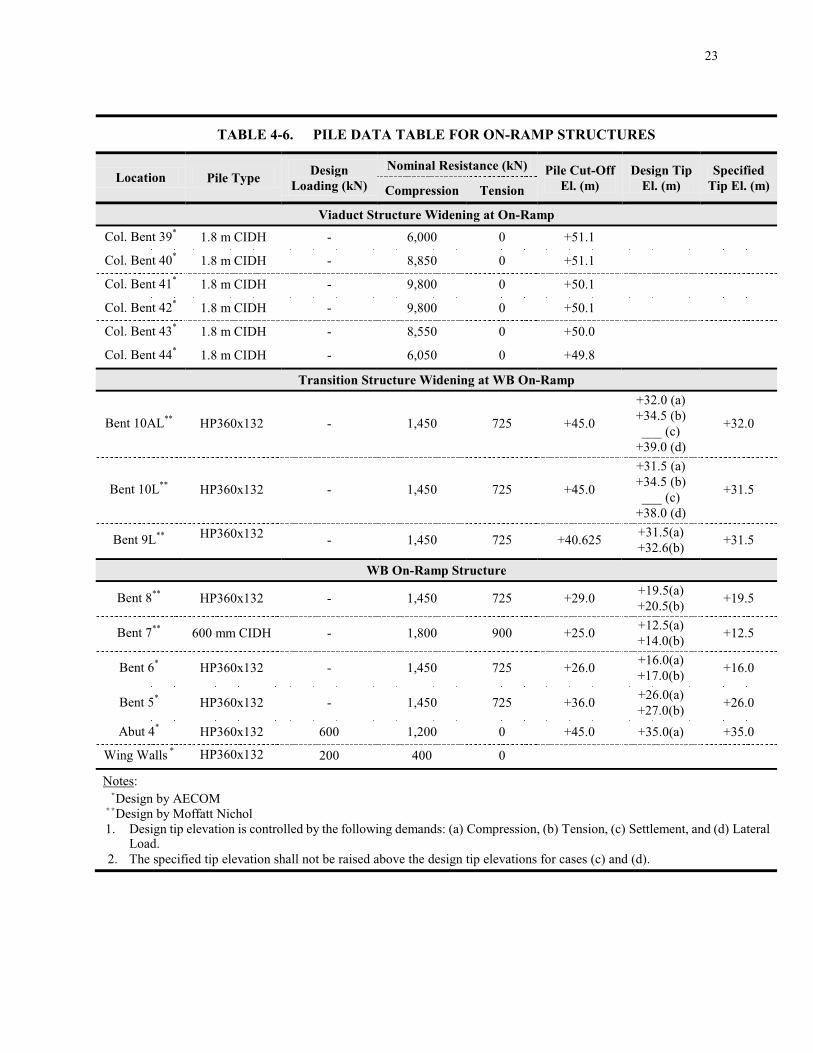
The design nominal resistances (ultimate geotechnical pile capacity), and resulting design and specified pile tip elevations are presented in the Pile Data Tables for the contract plans TABLE 4-6for the On-Ramp and TABLE 4-7 for the Off-Ramp foundations. The capacities are based on soil resistance only and may be limited by the pile-head connection details and the strength of the pile material.

22
TABLE 4-5. FOUNDATION DESIGN DATA
Location Method Pile Type
Design FinishGrade
El.*** (m)
Pile Cut-off El. (m)
Pile Cap Size (m)
Total Permissible Settlement
(inch)
Number of Piles
Viaduct Structure Widening at On-RampCol. Bent 39* LFD 1.8 m CIDH +51.7 +51.1 NA NA 1 1
Col. Bent 40* LFD 1.8 m CIDH +51.7 +51.1 NA NA 1 1
Col. Bent 41* LFD 1.8 m CIDH +51.9 +50.1 NA NA 1 1
Col. Bent 42* LFD 1.8 m CIDH +51.3 +50.1 NA NA 1 1
Col. Bent 43* LFD 1.8 m CIDH +51.2 +50.0 NA NA 1 1
Col. Bent 44* LFD 1.8 m CIDH +49.3 +48.8 NA NA 1 1
Transition Structure Widening at WB On-RampBent 10AL** Conventional HP360x132 +48.1 +45.0 7.42 8.25 1 42
Bent 10L** Conventional HP360x132 +46.5 +45.0 5.85 10.65 1 45
Bent 9L** Conventional HP360x132 +42.2 +40.625 1 54
WB On-Ramp Structure *FROM CALTRANS’ FILEBent 8** Conventional HP360x132 +28.9 +29.0 1
Bent 7** Conventional 600mm CIDH +27.3 +25.0 1
Bent 6* LFD HP360x132 +30.6 +26.0 10.65 9.45 1 68
Bent 5* LFD HP360x132 +38.3 +36.0 8.25 7.05 1 42
Abut 4* WSD HP360x132 +45.0 1
Wing Walls * WSD HP360x132 1
Transition Structure Widening at WB Off-RampBent 5L** Conventional W360x196 +7.325 8.25 8.25 1 49
WB Off-Ramp StructureBent 6** Conventional HP360x132 +11.5 +8.125 11.85 11.85 1 100
Bent 7** Conventional 600mm CIDH +20.6 +17.575 10.65 10.65 1 64
Bent 8** Conventional 600mm CIDH +23.9 +21.975 9.45 9.45 1 49
Bent 9* LFD HP360x132 +29.2 +22.4 10.65 9.45 1 68
Bent 10* LFD HP360x132 +37.8 +34.0 8.25 7.05 1 42
Abut 11* WSD HP360x132 +45.35 15.36 3.9 1
RetainingWalls* WSD HP250x62 1
Notes*Design by AECOM
:
**Design by Moffatt Nichol***Measured at lowest point of CIDH or pilecap
23
TABLE 4-6. PILE DATA TABLE FOR ON-RAMP STRUCTURES
Location Pile Type Design Loading (kN)
Nominal Resistance (kN) Pile Cut-Off El. (m)
Design Tip El. (m)
Specified Tip El. (m)Compression Tension
Viaduct Structure Widening at On-RampCol. Bent 39* 1.8 m CIDH - 6,000 0 +51.1
Col. Bent 40* 1.8 m CIDH - 8,850 0 +51.1
Col. Bent 41* 1.8 m CIDH - 9,800 0 +50.1
Col. Bent 42* 1.8 m CIDH - 9,800 0 +50.1
Col. Bent 43* 1.8 m CIDH - 8,550 0 +50.0
Col. Bent 44* 1.8 m CIDH - 6,050 0 +49.8
Transition Structure Widening at WB On-Ramp
Bent 10AL** HP360x132 - 1,450 725 +45.0
+32.0 (a)+34.5 (b)___ (c)
+39.0 (d)
+32.0
Bent 10L** HP360x132 - 1,450 725 +45.0
+31.5 (a)+34.5 (b)___ (c)
+38.0 (d)
+31.5
Bent 9L** HP360x132 - 1,450 725 +40.625 +31.5(a)+32.6(b) +31.5
WB On-Ramp Structure
Bent 8** HP360x132 - 1,450 725 +29.0 +19.5(a)+20.5(b) +19.5
Bent 7** 600 mm CIDH - 1,800 900 +25.0 +12.5(a)+14.0(b) +12.5
Bent 6* HP360x132 - 1,450 725 +26.0 +16.0(a)+17.0(b) +16.0
Bent 5* HP360x132 - 1,450 725 +36.0 +26.0(a)+27.0(b) +26.0
Abut 4* HP360x132 600 1,200 0 +45.0 +35.0(a) +35.0
Wing Walls * HP360x132 200 400 0
Notes*Design by AECOM
:
**Design by Moffatt Nichol1. Design tip elevation is controlled by the following demands: (a) Compression, (b) Tension, (c) Settlement, and (d) Lateral
Load. 2. The specified tip elevation shall not be raised above the design tip elevations for cases (c) and (d).

24
TABLE 4-7. PILE DATA TABLE FOR OFF-RAMP STRUCTURES
Location Pile Type Design Loading (kN)
Nominal Resistance (kN) Pile Cut-Off El. (fm)
Design Tip El. (m)
Specified Tip El. (m)Compression Tension
Transition Structure Widening at WB Off-Ramp
Bent 5L** W360x196 - 1,450 725 +7.325 -3.6(a)-1.6(b) -3.6
WB Off-Ramp Structure
Bent 6** HP360x132 - 1,450 725 +8.125 -1.9(a)-1.2(b) -1.9
Bent 7** 600 mm CIDH - 1,800 900 +17.575 +6.6(a)+7.8(b) +6.6
Bent 8** 600 mm CIDH - 1,800 900 +21.975 +11.0(a)+13.8(b) +11.0
Bent 9* HP360x132 - 1,450 725 +22.4 +11.4(a)+14.4(b) +11.4
Bent 10* HP360x132 - 1,450 725 +34.0 +23.0(a)+25.0(b) +23.0
Abut 11* HP360x132 600 1,200 - +45.35 +35.9(a) +35.9
Retaining Walls* HP250x62 200 400 -
Notes*Design by AECOM
:
**Design by Moffatt Nichol1. Design tip elevation is controlled by the following demands: (a) Compression, (b) Tension, (c) Settlement, and (d) Lateral
Load. 2. The specified tip elevation shall not be raised above the design tip elevations for cases (c) and (d).
4.5.4 Lateral Pile Resistance
Lateral pile analyses were performed using the computer program BMCOL76 (Matlock, et al., 1981). For the Abutments, analyses were performed for pinned connections at the pilecap and taking into account any group effects. The lateral soil springs (p-y curves) for this analysis were generated using American Petroleum Institute criteria (API, 1993). Results of lateral pile analysis in terms of pile-head shear and lateral deflection for a free-head condition are presented in Table 4-8. The maximum bending moment and the location of maximum moment are also presented. Design criteria for the service condition required a maximum allowable lateral displacement of 1/4” at the pile top and 1” for the seismic load case. The solutions presented in the tables are entirely based on soil resistance and linear pile material properties. Therefore, these values may be limited by the flexural strength (plastic moment) of the piles and other connection details. Linear interpolation can be used for solutions between pile-head deflections shown.

25
5.0 CONSTRUCTION RECOMMENDATIONS
5.1 EARTHWORK
5.1.1 Cuts
Excavations will be required for construction of the bent pilecaps and bridge abutments. On-site soils can be excavated and ripped with conventional earth moving equipment. The volume change of the on-site soils upon excavation and compaction will vary with the soil type and density encountered.
Earthwork should be performed in accordance with Caltrans Standard Specifications, Section 19(Caltrans, 2006c). Appropriate measures should be taken to prevent damage to adjacent structures and utilities. The contractor shall conform to all applicable occupational and health standards, rules, regulations, and orders established by the State of California. In addition, other State, County, or Municipal regulations may supersede the recommendations presented in this section. If a trench shoring design and safety plan is required, the geotechnical consultant should review the plan to confirm that recommendations presented in this report have been applied to the design. If a trench shoring design and safety plan is required, qualified geotechnical personnel should review the plan to confirm that recommendations presented in this report were used in the design or provide additional recommendations.
Any design and construction of temporary sloping, sheeting, or shoring should be made the contractor’s responsibility. Temporary excavations must be sloped or shored in accordance with all applicable codes and regulations including the most recent OSHA standards. Based on the data interpreted from the borings, design of temporary slopes and benches may assume a CAL/OSHASoil Type C. Shoring may be required if space does not allow slope excavations. The design shouldmeet Caltrans Trenching & Shoring Manual (1990) for temporary shoring. Open excavations should be designed such that they do not adversely impact adjacent structures and slopes. No excavations should be performed below an imaginary plane inclined at 45 degrees from the edge of any existing foundation without providing adequate support for the existing foundation.
For initial design and cost estimating purposes only, shoring retaining free-draining soil can be designed assuming a unit weight of 120 pcf, a friction angle of 30 degrees, and zero cohesion. For a cantilevered shoring that retaining level ground, a minimum lateral earth pressure of 36 pcf equivalent fluid pressure can be used. For braced shoring retaining level ground, an appropriate trapezoidal design lateral earth pressures with a 30H psf value (where H is the depth of cut) can be assumed. Lateral pressures due to surcharges and any hydrostatic pressures should be added to the above lateral earth pressures. The earth pressures given above must be confirmed during construction based on actual shoring location, site-specific subsurface conditions, and ground and wall configuration.
Groundwater was not encountered below existing grade at the proposed bridge support locations based on past investigations described in Section 2.0. Groundwater levels could be higher in the rainy season. Therefore, groundwater is not expected to be encountered during pilecap construction. However, groundwater level can fluctuate due to seasonal rainfall, local irrigation and groundwater

26
recharge program and other man-made conditions. If groundwater is encountered, it should be controlled in accordance with Section 19-3.04 of the Caltrans Standard Specifications (2006c).
Soil or other construction materials should not be stockpiled adjacent to excavations. Stockpiles should be set back a distance which is at least equal to the height of the excavation.
During construction, qualified geotechnical personnel should inspect temporary slopes for erosion and sloughing, and should inspect temporary shoring for signs of instability and deformations.
For spread footings (above-ground pump station structure) and slab-on-ground concrete pads (ancillary equipment), existing soil beneath the footings and pads should be overexcavated to a minimum depth of 2 feet (relative to the bottom of footings and pads) and replaced with fill compacted to at least 95 percent relative compaction. The overexcavations should extend laterally at least 2 ft outside the footings and concrete pads.
Vegetation on existing ground should be removed prior to fill placement. Loose, soft, dry, wet, or otherwise unsuitable materials should be removed from areas that will receive compacted fill. All areas to receive fill should be observed to be firm and unyielding prior to fill placement. If pumping or yielding of the subgrade is observed during construction, appropriate measures should be taken by the contractor to stabilize the subgrade prior to placing compacted fill.
5.1.2 Fills
Prior to placing any compacted fill, the exposed ground surface should be scarified to a minimum depth of 8 inches, moisture conditioned as necessary to near optimum moisture content, and compacted to at least 95 percent relative compaction. Fill should be placed in uniform horizontal loose lifts not exceeding 8 inches thick, moisture conditioned to near optimum moisture content, and compacted to at least 95 percent relative compaction. If hand-directed mechanical tampers are used for compaction, the loose lift thickness should not exceed 6 inches.
Areas that are excavated below finish grade or that are disturbed due to construction activities should be overexcavated to undisturbed material. Finish grades should be reestablished using fill properly compacted to a minimum of 95 percent relative compaction.
Compacted fill should be monitored, inspected, and tested by qualified geotechnical personnel during grading to verify degree of compaction. Field and laboratory tests should be conducted in accordancewith ASTM or Caltrans methods, and any other applicable testing requirements.
5.1.3 Finished Slopes
According to design information, the finished slopes will have a steepest gradient of 2H:1V. Slopes constructed with a gradient of 2:1 or flatter should be surficially stable. The following remedial alternatives are presented for slope areas that have not suffered severe erosion to date, but that are susceptible to erosion and surficial instability over time. The following alternatives are intended to improve long-term surficial stability of the slope within the project area.
27
Unpaved slopes with 1.5H:1V gradient are susceptible to erosion and surficial instability over time. The following recommendations are provided to improve long-term surficial stability of the slope within the project area. The upper 3 ft of soils below the finished slope face should have a minimum internal friction angle of 32° and minimum cohesion of 250 psf. If the in-situ soils encountered do not meet these properties, they should be excavated to a minimum depth of 3 ft relative to the finished slope face and replaced with select material having an internal friction angle of at least 32o
and cohesion of at least 250 psf. The select material should be properly keyed and benched into the exposed sloping ground.
Soils should be placed in uniform horizontal loose lifts not exceeding 8 inches in thickness, moisture-conditioned to near-optimum moisture content, and compacted to at least 90 percent relative compaction. Relative compaction should be based on maximum densities determined using Caltrans Test Method 216.
Drainage control and proper maintenance with erosion protection are recommended in accordance with Section 20 of Caltrans Standard Specifications (2006c).
5.2 PILE CONSTRUCTION
5.2.1 Driven Piles
Piles should be driven at least to the specified tip elevation and the bearing value should be checked with the pile-driving formula given in Section 49-1.08 of the Caltrans Standard Specifications (2006c) using the nominal driving resistance or with a pile driving analyzer (PDA). However, if the specified tip elevation is reached without achieving the design load, pile driving should continue until bearing is attained. In this case, it may be prudent to allow the pile to “set up” before continuing the driving.
The selected pile-driving hammer such as diesel-type hammers should be able to deliver sufficient energy to drive the piles at a penetration rate of not less than 1/8 inch per blow at the required bearing value. Vibratory hammers and undersized pre-drilling below the embankment fill are not allowed for pile installation.
Drivability of piles was considered for the bridge site. Based on the available soil boring data, hard driving may be encountered above the specified pile tip. However, driving steel H-Piles is not anticipated to be difficult with a proper choice of equipment.
5.2.2 Drilled Piles
The CIDH piles can be constructed in accordance with Section 49-4 of the Caltrans Standard Specifications (2006c) and using Type V cement. Based on conditions encountered during the geotechnical investigation, groundwater can be expected during drilling of the CIDH piles at all support locations and the Contractor should be prepared to deal with ground water during construction. For this case, “wet” construction using slurry displacement method is likely.

28
Due to the presence of water-bearing granular soils, caving may occur during construction of the CIDH piles. The Contractor may elect to use temporary casing to control any soil caving. The CIDH pile contractor should be experienced in installing closely spaced piles in confined space. Caltrans standard practice for “wet” construction includes PVC tubings installed within the reinforcement cage for gamma-ray (GGL) testing.
Adjacent piles should not be constructed concurrently. Pile boreholes should be inspected and approved by the qualified engineer prior to the installation of reinforcement. Extreme care in drilling, placement of steel, and the pouring of concrete is essential to avoid excessive disturbance of pile boring walls. Concrete placement by pumping or tremie tube to the bottom of the pile borings is recommended. Specifications should require that sufficient space be provided in the pile reinforcing cage during fabrication to allow the insertion of a tremie tube for concrete placement. The pile reinforcing cage should be installed and the concrete pumped immediately after drilling is completed.
5.3 ABUTMENT WALLS
5.3.1 Backfill
Per Caltrans requirements, expansive soils should not be placed as part of the embankment within the limits of a bridge abutment as shown in Figure 5-1. Materials placed behind abutment wall should be low-expansive soil with an Expansion Index (EI) less than 50 and Sand Equivalent (SE) of more than 20. The low-expansive material requirement should be supplemental to the abutment structure and pervious backfill requirement as described in Caltrans Standard Plans (2006d) and Caltrans Standard Specifications (2006c) under Sections 19-3.06 and 19-3.065, respectively.
Backfill should be compacted in accordance with Section 19-5 of the Caltrans Standard Specifications (2006c). Backfill should be placed in loose lifts not exceeding 8 inches in thickness, moisture-conditioned to near optimum moisture content, and compacted to at least 95 percent relative compaction. The relative compaction should be based on the maximum density determined by California Test 216. Jetting or flooding to compact backfill is not recommended. Heavy compaction equipment, such as vibratory rollers, dozers, or loaders, should not be used adjacent to the abutment walls in order to avoid damaging the walls due to large lateral earth pressures.
5.3.2 Backdrains
Backdrains should be installed behind abutment walls to relieve hydrostatic pressure. Backdrains should be constructed in accordance with Bridge Detail 3-1 on Sheet BO-3 per Caltrans Standard Plans (2006d) or the geocomposite drain alternative per Section 6 of the Caltrans Bridge Design Aids (1992b) or perforated plastic pipe surrounded by gravel and wrapped in filter fabric placed near the bottom of the wall with adequate outlets (weepholes).