Preliminary Damage and Needs Assessment - GFDRR · About the Damage and Needs Assessment ... MCRA...
226
2011 PAKISTAN FLOODS Preliminary Damage and Needs Assessment
Transcript of Preliminary Damage and Needs Assessment - GFDRR · About the Damage and Needs Assessment ... MCRA...

2011 PAKISTAN FLOODSPreliminary Damage and Needs Assessment


2011 PAKISTAN FLOODSPreliminary Damage and Needs Assessment

Contents
Executive Summary ....................................................................................................................13Disaster Overview..............................................................................................................................13
About the Damage and Needs Assessment ......................................................................................13
Summary Table of Total Damage and Reconstruction Costs ..........................................................15
Report Outline ...................................................................................................................................17
The 2011 Floods..........................................................................................................................18............................................................................................................................................18
.................................................................................................................................18
...........................................................................................................19
...............................................................................................................20
..............................................................................................................22
.......................................................................................................................24
..................................................................................27.............................................................................................................................................27
................................................................................................................................................28
..........................................................................................................................................28
...................................................................................................29
.......................................................................................................29
.........................................................................................30
................................................................................................30
................................................................................................................................................31
.................................................................................31
.....................................................................................................32
..............................................................................................................................33
......................................................................................................................................33
................................................................................................................34
................................................................................36....................................................................................................................36
..........................................................................................................40
.........................................................................................43
.................................................................................................................45.............................................................................................45
...................................................................................................................................48
.............................49
....................................................................................................51
Overview
The 2010 Floods
Social and Economic Context
Response to the 2011 floods
The DNA Methodology
Economic Impact
Summary of Damage and Needs by Sector
Housing
Health
Education
Irrigation and Flood Management
Transport and Communications
Water Supply and Sanitation (WATSAN)
Agriculture, Livestock, and Fisheries
Energy
Private Sector, Industries and Financial sector
Social Protection and Livelihoods
Social and Gender
Environment
Governance Infrastructure
Governance and Institutional Arrangements
Institutional Framework
Outline Institutional Structure
Monitoring & Evaluation (M&E) System
Social Considerations
Social Impact (Sindh and Balochistan)
Gender Impact
Aid Effectiveness, Governance, Social Accountability and Grievance Redressal
Environmental Considerations

Disaster Risk Management ..................................................................................................... 52
Pakistan Disaster Risk Profile .............. ............ ......................... ............ ............ ............ .................. 52
Lessons Learnt From Flood Response 2011 ................... ............ ............ ............ ........................ ...... 52
Evolution of DRM at the Provincial Level: .................... ............ ............ ............ ........................ ...... 52
DRM Strategy and Recommendations ............. ............. ........................ ............ ............ ............ ...... 53
Guiding Principles ................................................................................................................... 55
LIST OF ANNEXES
Annex 1: Disaster Risk Management ...................................................................................... 58
Annex 2: Economic Assessment ............................................................................................. 66
Annex 3: Environment ............................................................................................................. 87
Annex 4: Social and Gender Impact ........................................................................................ 99
Annex 5: Agriculture, Livestock and Fisheries ......................................................................112
Annex 6: Education ............................................................................................................... 128
Annex 7: Energy .................................................................................................................... 139
Annex 8: Governance Infrastructure ..................................................................................... 146
Annex 9: Health ..................................................................................................................... 154
Annex 10: Housing ................................................................................................................ 166
Annex 11: Private Sector, Industries and Financial Sector .................................................... 180
Annex 12: Social Protection ................................................................................................... 188
Annex 13: Transport and Communications .......................................................................... 197
Annex 14: Water and Sanitation (WATSAN) ......................................................................... 204
Annex 15: Irrigation and Flood Management ....................................................................... 214
LIST OF TABLES
Table 1: Sectors and Themes of the DNA .................................................................................................. 13
Table 2: Estimate of Total Damage Costs by Sector ................................................................................. 15
Table 3: Estimate of Total Reconstruction Costs by Sector ..................................................................... 16
Table 4: Estimated Damage and Reconstruction Costs by Province / Area ......................................... 17
Table 5: Estimate of Total Damages and Reconstruction Costs ............................................................. 24

Acknowledgements
This report has been prepared jointly by the Asian Development Bank and the World Bank, with financial
and technical support from the Global Facility for Disaster Reduction and Recovery and technical
contributions from UN and bilateral partners.
The guidance and inputs of many government agencies and departments have contributed greatly towards the
completion of this report. At the federal level these include the Economic Affairs Division and the National
Disaster Management Authority (NDMA), while at the provincial and district level the report has benefitted
from the Provincial Disaster Management Authorities (PDMA) of Sindh and Balochistan, the Planning and
Development Departments and Provincial Line Departments.
The DNA team gratefully acknowledges the hard work of everyone that contributed to produce this report
which will guide the efforts of all involved in responding to the 2011 Pakistan Floods.
Unless otherwise stated, all photographs used in this publication were taken by the assessment team. The
team would like to express their deepest thanks and appreciation to all the contributors for this report. Any
follow-up questions or requests for additional information should be directed to Haris Khan
([email protected]) or Shaukat Shafi ([email protected]).
Abbreviations and Acronyms
ADB Asian Development Bank
ADR Alternate Dispute Resolution
AG Auditor General
AJK Azad Jammu and Kashmir
ANC Antenatal Care
ARI Acute Respiratory Infections ARL Attock Refinery Limited
ATM Automated Teller Machine
BBB Building Back Better
BBS Building Back Smarter
BHU Basic Health Unit
BID Balochistan Irrigation and Power Department
BISP Benazir Income Support Program
BOD Burden of Disease
BPL BYCO Petroleum Limited
BSF Business Support Fund
CAA Civil Aviation Authority
CBDRM Community Based Disaster Risk Management
CBO Community Based Organization
CCA Climate Change Adaptation
CCI Council of Common Interest
CCT Conditional Cash Transfers
CD Completely Damaged
CDCP Citizens’ Damage Compensation Program
CDD Community Driven Development
CIDA Canadian International Development Agency
CNG Compressed Natural Gas
CNIC Computerized National Identity Card
CPI Consumer Price Index
CSO Civil Society Organization
CSR Composite Schedule of Rates
DDMA District Disaster Management Authority
DCO District Coordination Officer
DEWS Disease Early Warning System
DFID Department for International Development
DHIS District Health Information System
DHQ Distant Headquarter
DISCO Distribution Company

DMAs Disaster Management Authorities
DNA Damage and Needs Assessment
DOH Department of Health
DPOD Duro Puran Outfall Drain
DRM Disaster Risk Management
DRR Disaster Risk Reduction
EAD Economic Affairs Division
EC European Commission
EDO Executive District Officer
EmOC Emergency Obstetric Care
EmONC Emergency Obstetric and Newborn Care
EPI Expanded Program of Immunization
ERC Emergency Response Cell
ERRA Earthquake Reconstruction and Rehabilitation Authority
ESSAF Environmental and Social Screening and Assessment Framework
EU European Union
EWIRS Early Warning and Incident Response System
FAO Food and Agriculture Organization
FATA Federally Administered Tribal Areas
FBS Federal Bureau of Statistics
FFC Federal Flood Commission
FLFC First Level Care Facility
FMIS Financial Management Information System
FP Flood Protection
FSR Financial Stability Review
GIS Geographic Information System
GB Gilgit-Baltistan
GDP Gross Domestic Product
GFDRR Global Facility for Disaster Reduction and Recovery
GIS Geographic Information System
GOB Government of Balochistan
GOP Government of Pakistan
GoPb Government of Punjab
GoS Government of Sindh
GST General Sales Tax
HDI Human Development Index
HEPR Health Emergency Preparedness and Response
HHs Households
HIES Household Integrated Economic Survey
HMIS Health Management Information System
HRM Hazard Risk Management
ILO International Labor Organization
INGO International Non-Government Organization
IPP Independent Power Producer
IsDB Islamic Development Bank

JICA Japan International Cooperation Agency
KESC Karachi Electric Supply Company
KFW Kreditanstalt für Wiederaufbau
KP Khyber Pakhtunkhwa
KPOD Kadhan Patiji Outfall Drain
LBOD Left Bank Outfall Drain
LG Local Government
LGD Local Government Department
LFS Labor Force Surveys
LPG Liquefied Petroleum Gas
LS Larkana Sehwan
M&E Monitoring and Evaluation
MCH Mother and Child Health
MCRA Multi-Cluster Risk Analysis
MDGs Millennium Development Goals
MF Micro Finance
MFI Microfinance Institution
MFPs Micro Finance Providers
MGCL Mari Gas Company Limited
MIS Management Information System
MNCH Maternal Neonate and Child Health
MoE Ministry of Environment
MoF Ministry of Finance
MoIT Ministry of Information and Technology
MOU Memorandum of Understanding
MoWP Ministry of Water and Power
MPNR Ministry of Petroleum and Natural Resources
MSME Micro Small and Medium Enterprises
MSW Municipal Solid Waste
MTDF Medium Term Development Framework
NADRA National Database and Registration Authority
NDMA National Disaster Management Authority
NDMC National Disaster Management Commission
NDMO National Disaster Management Ordinance
NDRMF National Disaster Risk Management Framework
NER Net Enrollment Rate
NFC National Finance Commission
NGO Non-Government Organization
NHA National Highway Authority
NIC National Identity Card
NODMC National Oversight Disaster Management Council
NPLs Non-Performing Loans
NRL National Refinery Limited
NRSP National Rural Support Program
NTDC National Transmission and Dispatch Company

OECD Organization of Economic Cooperation and Development
OGDCL Oil and Gas Development Corporation Ltd
OMC Oil Marketing Company
P&DD Planning and Development Departments
PARCO Pak-Arab Refinery Ltd
PBM Pakistan Bait-ul-Maal
PC Planning Commission
PD Partially Damaged
P&DDs Planning and Development Departments
PDMA Provincial Disaster Management Authority
PDMC Provincial Disaster Management Commission
PDWP Provincial Development Working Party
PEPA Pakistan Environmental Protection Agency
PFM Public Financial Management
PFMA Public Financial Management and Accountability
PHC Primary Health Care
PHED Public Health Engineering Department
PID Provincial Irrigation Department
PIFRA Project to Improve Financial Reporting and Auditing
PMD Pakistan Meteorological Department
PMES Project Monitoring and Evaluation System
PPAF Pakistan Poverty Alleviation Fund
PPPs Public Private Partnerships
PPRA Public Procurement Regulatory Authority
PRL Pakistan Refinery Limited
PRSP Poverty Reduction Strategy Paper
PSDP Public Sector Development program
PSLM Pakistan Social and Living Standards Measurement Survey
PSO Pakistan State Oil
PSP Public Sector Power
PTA Pakistan Telecommunication Association
PTAs Parent Teacher Associations
RHC Rural Health Center
RR Recovery and Reconstruction
SCs School Councils
SBP State Bank of Pakistan
SHYDO Sarhad Hydropower Development Organization
SID Sindh Irrigation and Power Department
SM Sagyun Matiari
SMCs School Management Committees
SMEDA Small and Medium Enterprise Development Authority
SNA Social Network Analysis
SNGPL Sui Northern Gas Pipeline Ltd
SOP Standard Operating Procedure
SPRA Special Purchase and Resale Agreement

SSGCL Sui Southern Gas Company Ltd
SUPARCO Space and Upper Atmosphere Research Commission
T&C Transport and Communication
TCF Trillion Cubic Feet
THQ Tehsil Headquarter
TLC Temporary Learning Center
UN United Nations
UNDP United Nations Development Program
UN-ECLAC United Nations Economic Commission for Latin America and the Caribbean
UNICEF United Nations Children Fund
UNOCHA United Nations Office for the Coordination of Humanitarian Affairs
UNOSAT United Nations Operational Satellite Application Program
USAID United States Agency for International
W&S Works and Services Department
WAPDA Water and Power Development Authority
WATSAN Water Supply and Sanitation
WB World Bank
WFP World Food Programme
WHO World Health Organization
WWF World Wildlife Fund
Weights and Measures
ft3/sec cubic foot per second
ha hectare
km Kilometer
km2 square kilometer
km3 cubic kilometer
kV Kilovolt
m3/sec cubic meter per second
mm Millimeter
MW Megawatt
Currency and Equivalents
Currency Unit = Pakistan Rupee
US$ = PKR 87


Executive Summary
Disaster Overview
Pakistan experienced severe flooding after torrential monsoon rains hit southern Sindh and the adjoining
areas of Punjab and north-eastern Balochistan in August 2011. Flash floods triggered by the monsoon rain
caused severe damage to infrastructure in the affected areas. According to the National Disaster Management
Authority (NDMA) the floods have affected 9.6 million people, killing 520 people and causing injuries to
more than 1180 people. Entire villages and urban centers have been flooded, homes have been destroyed,
and over a million acres of crops and agricultural lands have been damaged. The impact of the flooding in
2011 cannot be seen in isolation. In 2010, 20 million people were affected by the largest floods in living
memory, many of whom were still in the recovery phase. In severely affected areas, food insecurity and
malnutrition were already at critical levels before this year’s new wave of rains and flooding.
About the Damage and Needs Assessment
In the wake of the floods, the Government of Pakistan has requested the Asian Development Bank (ADB)
and the World Bank (WB) to assist in undertaking a Damage and Needs Assessment (DNA). The DNA
assesses the extent of the damage and the needs for rehabilitation and reconstruction of the damaged assets
and infrastructure, and restoration of livelihoods and economic productivity. It provides the strategic
underpinnings for medium- to long-term post-floods reconstruction, recovery planning, prioritization, and
programming. This report quantifies physical damage and presents sector level recovery and reconstruction
strategies. Taking into account the extent of the damage and the proposed strategies, the report then
quantifies corresponding needs.
Scope and sectors
At the request of the Federal and Provincial governments the DNA assesses damages and needs for 17
districts in Sindh and five districts in Balochistan, focusing on seven cross-cutting themes and nine sectors
(Table 1). Damages and needs for the different sectors and themes are summarized in the report and
presented in detail in the annexes.
Page | 13
Cross-cutting themes Sectors
1. Economic assessment
2. Governance Infrastructure
3. Social Protection and Livelihoods
4. Economic assessment
5. Governance Infrastructure
6. Social Protection and Livelihoods
1. Housing
2. Water Supply and Sanitation
3. Transport and Communications
4. Energy
5. Agriculture, Livestock and Fisheries
6. Irrigation, and Flood Management
7. Health
8. Education
9. Private Sector, Industries and Financial Sector
Table 1: Sectors and Themes of the DNA

With respect to financial costs the DNA considers three assessment categories:
• Direct damage refers to the monetary value of the completely or partially destroyed assets - such as social,
physical and economic infrastructure-immediately after a disaster. Wherever possible, the direct damage to
assets is determined in “as was” condition (i.e. at their book values);
• Indirect losses are income losses and comprise of both the change in flow of goods and services and in other
economic flows -such as increased expenses, curtailed production and diminished revenue-which arise
from the direct damage to production capacity and social and economic infrastructure;
• Reconstruction costs measure the costs of rebuilding lost assets and restoring lost services. They are generally
assessed as the replacement costs with a premium added for building back smarter.
Methodology
To conduct the assessment the sector teams relied on secondary data at provincial, district and sub-district
(tehsil)level provided by relevant provincial and district government departments.
All secondary data received was verified and validated by the DNA sector teams using statistical tools,
rationality and plausibility checks and cross-sector damage analysis. Validation techniques included field
inspection visits, interviews with relevant stakeholders, and desk reviews.
Once the validation process was completed the sector teams conducted a comparative pre- and post-disaster
assessment of infrastructure and services affected by the floods.
Coordination
The DNA team, led by the WB and ADB, was supported by the United Nations (UN) and bilateral donors.
The Global Facility for Disaster Reduction and Recovery (GFDRR) provided financial support as well as
technical expertise in disaster risk management and capacity building. Furthermore, the DNA team maintained
close liaison with the NDMA, Provincial Disaster Management Authorities (PDMA), and the Planning and
Development Departments (P&DD) of Sindh and Balochistan, throughout the assessment, including the
provision of regular DNA progress updates.
Consultations
The DNA team actively engaged with the civil society and non-governmental organizations that were operating
in the affected areas throughout the assessment. Their role has been extremely important during the data
validation process given their unique knowledge of the situation on the field.
A consultation session was held on November 2, 2011, with local and international NGOs and civil society
organizations. The session was organized by the DNA team in collaboration with UN. The DNA team
apprised the participants on all aspects of the DNA exercise and received valuable feedback from the
participants on social issues related to 2010 floods and the lessons learnt, as well as the social impact of the
2011 floods. Furthermore, sector teams also held consultations with various sector specific stakeholders dealing
with floods, including a host of government and non-governmental entities.
Page | 14

Page | 15
Table 2: Estimate of Total Damage Costs by Sector
Summary Table of Total Damage and Reconstruction Costs This report presents: (i) estimated direct damage and indirect losses amounting to approximately PKR 324.5 billion (US$ 3.7 billion) and; (ii) estimated cost of recovery and reconstruction needs at PKR 239 billion (US$ 2.7 billion).
The direct damage costs are estimated at PKR 279.5 billion, while indirect losses equal approximately PKR 45 billion. The highest damages occurred in the agriculture, livestock and fisheries sector, calculated at just over PKR 160 billion (US$ 1.84 billion). A detailed breakdown of damage costs is provided in Table 2.
Sector Direct Damages
PKR millions
Indirect Losses PKR
millions
Total Damage
PKR millions USD millions
1. Social Infrastructure
Housing 77,420 8,046 85,465 982
Health 432 826 1,258 14
Education 10,157 1,856 12,014 138
Subtotal 88,009 10,728 98,737 1,135
2. Physical Infrastructure
Irrigation & Flood Management 4,763 4,763 55
Transport & Communications 16,386 10,082 26,468 304
Water Supply & Sanitation 500 704 1,204 14
Energy 457 783 1,240 14
Subtotal 22,106 11,569 33,674 387
3. Economic Sectors
Agriculture, Livestock & Fisheries 142,358 17,749 160,107 1,840
Private Sector, Industries and Financial Sector
22,694 4,560 27,254 313
Social & Gender 39 5 44 1
Subtotal 165,091 22,313 187,405 2,154
4. Cross Cutting Sectors
Governance 1,571 382 1,953 22
Environment 2,763 2,763 32
Subtotal 4,334 382 4,716 54
Total 279,540 44,992 324,533 3,730

Page | 16
The recommended reconstruction needs, are based on the lessons learnt from the Floods 2010 DNA, and are inclusive of Build Back Smarter (BBS) factor. Reconstruction costs are estimated at PKR 239 billion (US$ 2.7 billion). A detailed breakdown of reconstruction costs is provided in Table 3.
Table 3: Estimate of Total Reconstruction Costs by Sector
Sector
Reconstruction Needs
PKR millions USD millions
1. Social Infrastructure
Housing 91,510 1,0512
Health 864 10
Education 22,589 138
Subtotal 114,963 1,321
2. Physical Infrastructure
Irrigation & Flood Management 9,526 110
Transport & Communications 33,902 390
Water Supply & Sanitation 1,900 22
Energy 292 3
Subtotal 45,620 524
3. Economic Sectors
Agriculture, Livestock & Fisheries 26,590.0 306
Private Sector, Industries and Financial Sector 8,178 94
Social & Gender 65 1
Social Protection 34,126 392
3. Cross Cutting Sectors
Governance 4,769 55
Disaster Risk Management 1,827 21
Environment 2,874 33
Subtotal 9,470 109
Total 239,011 2,747

Table 4 presents a breakdown of the total estimated damage and reconstruction costs by province.
Table 4: Estimated Damage and Reconstruction Costs by Province / Area
ProvinceDamage Costs Reconstruction Option 1
PKR millions USD millions PKR millions USD millions
Sindh 310,778 3,572 219,618 2,524
Balochistan 12,356 142 6,035 69
Federal / Cross Cutting Sectors 1,405 16 13,353 153
National Total 324,533 3,730 239,011 2,747
Report OutlineThe introductory sections of the report contextualize the disaster by describing Pakistan's social and economic context and the background to the floods, particularly in light of the record floods that hit the country in 2010 (Chapter 1). The methodology used to conduct the assessment is explained in Chapter 2. An overview of the macro-economic impact of the floods is presented in Chapter 3, followed by a summary of the damages and needs for each sector in Chapter 4 (the detailed sector analyses are presented in the annexes to this report). In Chapter 5 the report suggests governance and institutional arrangements for the implementation of the reconstruction program, followed by an overview of cross-cutting issues that should be taken into consideration, including social considerations (Chapter 6), environmental considerations (Chapter 7), and disaster risk management (Chapter 8). Finally, Chapter 9 presents the guiding principles for reconstruction.
Page | 17

CHAPTER 1
The 2011 Floods
Overview
With the arrival of the annual monsoon in early August, parts of Pakistan including Lower Punjab, Sindh,
Khyber-Pakhtunkhwa (KP) State of Azad Jammu & Kashmir (AJK) and Gilgit-Baltistan (GB) received
varying degrees of heavy rainfall, resulting in the issuance of riverine / flash flood warnings for rivers Kabul,
Swat and Chenab. Between August 10 and September 14, Central and Lower Sindh as well as parts of
Balochistan received additional intense rainfall, heavily concentrated on the eastern side of the Indus River.
The precipitation during this period in parts of Sindh, was estimated to be 270 percent above normal rainfall
patterns. Combined with the diverse topography of the region, including Sindh’s low-lying and flat terrain, the
continued heavy rains overwhelmed the absorption capacity of the soil, as well as flood-mitigation
infrastructure, resulting in the inundation of substantial areas. Despite sustaining several breaches along its
length, the Left Bank Outfall Drain (LBOD) of the Indus River that was not designed to drain rain or flood
run-off, facilitated the drainage of a considerable volume of flood waters from Sindh province out to the
Arabian Sea.
In Balochistan, flash flooding as well as overflowing local rivers and irrigation and drainage channels caused
damages in approximately 14 districts, the worst of which (5 districts) were confined in the south and
northern parts of the province.
As of January 2012, the NDMA estimated that approximately 9.6 million people have been affected in Sindh
and Balochistan as a result of the floods, with 520 reported deaths and 1180 injured1. According to official
sources, approximately 27,370 sq. km area has been affected, for which Sindh alone accounts for an estimated
27,000 sq. km.
The 2010 Floods
Pakistan has also experienced extraordinary rainfall over a year ago, between July and September 2010, in the
north and north-western regions of the country, particularly KP, GB and AJK. The high-intensity rainfall
resulted in the generation of unprecedented flood peaks in Swat, Kabul and Indus Rivers which affected the
entire length of the country. The 2010 floods were assessed to be the worst since 1929. The United Nations
(UN) termed the disaster as greater than the 2004 tsunami, the 2005 Pakistan earthquake and the 2010 Haiti
earthquake, combined. At the time, NDMA had estimated that the floods affected 78 districts and covered
over 100,000 sq. km. The floods affected approximately 20 million people, (more than one-tenth of Pakistan's
population) with over 1,980 reported deaths and nearly 2,946 injured. About 1.6 million homes were
destroyed, and thousands of acres of crops and agricultural lands were damaged with major soil erosion
happening in some areas. The 2010 floods were concentrated along main rivers and caused by overflow of
river banks and breaches of embankments. In comparison, the 2011 floods were driven by high intensity
1 NDMA: Damages Monsoon 2011 (Sindh and Balochistan), January 16, 2012
Page | 18

unprecedented rainfall on the eastern side of the Indus River. Both events demonstrate changing climatic and
weather pattern in the region and their intensity of recurrence. The joint ADB and WB-led Damage and
Needs Assessment estimated total damage costs of the 2010 disaster at approximately PKR 854.8 billion (US$
10.1 billion), while reconstruction costs ranged from PKR 578 billion to PKR 756 billion (US$ 6.8 billion to
US$ 8.9 billion).
Social and Economic Context
For many years, Pakistan has been struggling not only with natural disasters but also issues related to security,
political and economic turmoil. It has low social development indicators, the Legatum Prosperity Index 2011
ranks Pakistan 86th for entrepreneurship and opportunity, 96th for economy and health, 100th for Social
Capital, 104 th for personal freedom, 105thfor education and 109th for safety and security out of 110 countries.
Human Development Index 2011 ranks Pakistan 145 out of 187 countries1.Pakistan has a2 Gender Inequality
Index (GII) value of 0.573, ranking it 115 out of 146 countries in 2011. More than 50 percent of Pakistan’s
people suffer from multiple deprivations3. According to a 2008 UN joint assessment it is estimated that 45
million are severely food-insecure4and almost 40% of children are underweight. The literacy rate for over ten
years is 57%,5 being much higher in urban than rural areas and higher for men than for women.
Pakistan’s economy continued to be affected by a fragile and uncertain political situation, adverse security
conditions, energy shortages, and a weak policy environment. In addition, the economy has been seriously
impacted by floods both in 2010 and 2011. In the wake of these immense challenges, the economy has shown
a fair degree of resilience. For example, despite enduring the worst floods in the country’s history in 2010, the
economy posted a positive growth of 2.4 percent; and even with extensive damage caused by the floods to all
major crops, the agriculture sector showed a growth rate of 1.2 percent. For the first time in many years, the
current account balance showed a surplus, although small.
This less than expected economic impact of the floods was largely due to the concerted efforts and good
management skills displayed by the communities and government to control economic losses caused by the
floods. Government’s support to the flood impacted population, especially in the form of cash grants to
rebuild their livelihoods and homes, and appropriate agricultural packages for the flood hit areas, helped in
limiting the cost of flood damage. However, the fiscal situation has remained weak, adversely impacting
improvement in other macroeconomic indicators. Higher level of fiscal deficits not only implied increased
level of debt liability, but the government’s resort to heavy borrowing from the banking system to meet these
deficits has been crowding out private investment and keeping the inflation rate high. Moreover, natural
disasters have impacted the government efforts and ability to stabilize the economy and accelerate economic
growth.
1 The 2011 Legatum Prosperity Index™ Rankings, Legatum Institute, London UK www.prosperity.com 2 The Gender Inequality Index (GII) reflects gender-based inequalities in three dimensions – reproductive health, empowerment and economic activity. Reproductive health is measured by maternal mortality and adolescent fertility rates; empowerment is measured by the share of parliamentary seats held by each gender and attainment at secondary and higher education by each gender; and economic activity is measured by the labour market participation rate for each gender. The GII replaced the previous Gender related Development Index and Gender Empowerment Index. The GII shows the loss in human development due to inequality between female and male achievements in the three GII dimensions. Source: UNDP HDR 2011. 3 Government of Pakistan, Economic Survey, Ministry of Finance,2010-11 4 World Food Program at http://www.wfp.org/countries/pakistan 5 Pakistan Social and Living Standards measurement survey (PSLM 2008-2009)
Page | 19

Economic framework
Although the macroeconomic framework presented by the government at the time of budget had some
realistic estimates, the fiscal projections appeared to be overly optimistic. The budget aimed at reducing the
fiscal deficit from 6.6 percent of GDP in 2010/11 to 4 percent in 2011/12.1 While the government took
some positive fiscal measures before and with the 2011/12 budget, these were grossly inadequate to support
the kind of fiscal adjustment envisaged by the budget. In any event, government’s macroeconomic framework
became largely irrelevant due to some adverse developments. First, despite some positive measures taken by
the government to expand the base of GST, an integrated VAT (or RGST) remains an unfulfilled wish.
Second, the desired reduction in recurrent expenditure did not materialize, as efforts to lower power sector
subsidies were largely unsuccessful as higher oil prices and change in fuel mix, from domestically produced
natural gas to more expensive imported fuels, raised the cost of power generation. The floods are likely to
add to these fiscal problems of the government.
Response to the 2011 floods
Government of Pakistan response
In the immediate aftermath of the floods, the government responded through the mobilization of national,
provincial and district resources including the deployment of civil and armed forces personnel. Several
infantry platoons of the army as well as medical and engineering teams were deployed in disaster affected
areas to carry out search and rescue operations, which were further supported by helicopters and dozens of
navy and coast guard personnel and boats. To support the national and provincial Disaster Risk Management
(DRM) institutions, the Prime Minister’s Flood Relief Committee was also formed to monitor rescue and
relief activities. In parallel, small-scale engineering works were undertaken to strengthen flood mitigation
infrastructure to avoid further damage and loss of lives. During the peak of the humanitarian crisis, almost
700,000 people were being housed in approximately 3,500 relief camp managed by the government,
international partners, NGOs and civil society. As of January 2012, the NDMA reported the distribution of
over 316,000 tents in the affected areas and 3.7 million ration packs, of which 48,000 ration packs were
distributed in Balochistan. To provide immediate cash assistance to the flood affected population in Sindh,
the provincial government, with support from the federal government, has disbursed approximately PKR
10.3 billion2 through the Pakistan Card-based cash transfer scheme (PKR 10,000 per family).
International response
Initially the federal and provincial governments responded to the disaster through own resources, which
however, were overwhelmed in the wake of the growing humanitarian crisis. Despite providing assistance
during the unprecedented floods of 2010, the international community immediately responded to the appeal
by the Government of Pakistan for international support for rescue and relief activities following 2011 floods.
As of December 2, 2011, forty-six countries have pledged a total commitment of approximately US$ 260
million3 including support in cash and in-kind. Furthermore, an emergency flood relief cell, established at the
1 The 2010/11 fiscal deficit of 6.6 percent of GDP includes a one-time expenditure of 0.7 percent of GDP on payment
of arrears of electricity subsidy. In other words, the 2011/12 budget aimed at reducing the “actual” fiscal deficit from 5.9 percent of GDP in 2010/11 to 4 percent in 2011/12.
2 Figure as of January 18, 2012, obtained from PDMA Sindh website: http://www.pdma.rain.pk/rain2011/ 3 National Disaster Management Authority, Foreign Assistance for Floods 2011, December 2, 2011
Page | 20

Page | 21
Ministry of Foreign Affairs, closely liaised with the members of the diplomatic community and international
organizations to coordinate international assistance.
The UN undertook an Initial Rapid Needs Assessment to focus on the immediate relief phase for the
following clusters: (i) emergency shelter; (ii) food security; (iii) health and; (iv) water sanitation and hygiene.
Based on these cluster assessments, the UN launched a US$ 356 million Rapid Response Plan in September
2011. As of April 2012, approximately, US$ 171 million or 48% were received in response to the UN’s flash
appeal.1 In January 2012, the UN launched the Early Recovery Framework seeking a further US$ 439 million
to continue flood response until September 2012, the funding for which has not yet started.
Civil society and private sector response
The response of civil society organizations and the private sector to the floods in Sindh and Balochistan was
immediate, rapid and extensive. In many cases local NGOs acted as the first responders to the disaster and
worked extensively with the Government to provide emergency relief support in the affected areas. The
emergency relief support provisions included ration packs, water purification kits and tablets, shelter items
(including tents, blankets and mosquito nets), sanitation kits and hygiene supplies, doctors and medical
supplies, mobile and basic health care units especially for women and children. A particular focus has been
placed on health care services to avoid the spread of water-borne infections and other diseases and to provide
basic health care services, an example of which is an extensive program being implemented in the severely
affected district of Tando Allah Yar in Sindh2. Media on their part covered the event extensively and played a
significant role in raising awareness and mobilizing local and international resources for the disaster.
Individuals and organizations from the private sector, both from Pakistan and the global community have
contributed significantly to the flood relief effort alongside the government and donor community.
1 UN, Pakistan Floods 2011 Early Recovery Framework, January 2012 2 A US$165,000 program being implemented by a Pakistani NGO as reported in “USAID, Pakistan Floods, Fact Sheet
# 4, Fiscal Year (FY) 2012, October 28, 2011”

CHAPTER 2
The DNA Methodology
The DNA has remained a Government-led overarching and consultative assessment, with the National
Disaster Management Authority of Pakistan as the main coordination body at the federal level; and the
respective Provincial Disaster Management Authorities (PDMAs) and P&D Departments at the provincial
level.
The assessment flexibly applied the United Nations Economic Commission for Latin America and the
Caribbean (UN ECLAC) methodology to suit the unique country situation.
The impact of the floods on each sector of the economy includes the following three costs: (i) Direct
Damage; (ii) Indirect Losses; and (iii) Reconstruction Cost.
Direct Damage refers to the monetary value of completely or partially destroyed assets, such as social, physical
and economic infrastructure calculated at the book value, or the depreciated value of lost immovable assets.
Movable assets like goods, furniture, machineries and inventories lost during the disaster are valued at the
replacement cost.
Indirect Losses are income losses, and comprise both the change of flow of goods and services and other
economic flows such as increased expenses, curtailed production and diminished revenue, which arise from
the direct damage to production capacity and social and economic infrastructure. Wherever possible damage
and losses have been further split across public and private sectors to assist in macroeconomic analysis and to
guide the development of public sector recovery strategies that optimally also take into account the recovery
of private sector assets and services.
Reconstruction Costs are calculated using the replacement value (and not the book value) of assets and
infrastructure. Coordination was maintained across different sectors to ensure there are no overlapping
reconstruction and recovery costs and different factors used in calculations were consistently applied.
Build Back Smarter (BBS)
While calculating the reconstruction cost the principle of Building-Back-Smarter (BBS) has been applied.
Under the BBS principle Building-Back-Better (BBB) has been selectively applied across sectors and within
sectors to ensure a cost-optimized multi-hazard reconstruction. Under this approach, factors for right siting
and right sizing have been introduced along with larger flood protection infrastructure improvements.
Data Collection
During the DNA of floods in 2010, customized and criteria-based sector templates for collection, collation
and classification of secondary damage data were prepared, allowing simultaneous damage disaggregation at
district and tehsil level and re-aggregation at provincial level, thus allowing room for later data validation at
various levels and using various techniques. Prior to the commencement of DNA 2011, these data templates
were further refined through consultations with government counterparts, as well as through the
Page | 22

incorporation of lessons learnt from the previous year. Extensive data training sessions were held for NDMA,
PDMA and provincial line department officials and 25 DNA data consultants were deployed for data
procurement and for extending support to provincial government departments in template-based consistent
data collection in Sindh and Balochistan. A central DNA Data Team interacted closely with the field data
consultants, sector teams and the provincial governments. Finally, to streamline the flow of information a
web-based team room was created for data management based on specific procedures for data updating,
cleaning, filtering and collation functions.
Damage Quantification
The process of damage and loss quantification broadly entailed the engagement and mobilization of national
and international sector specialists for sector damage assessments and subsequent needs strategization and
quantification. Sector teams mobilized during the DNA 2011 had been capacitated to quantify damages and
recovery needs through the provision of elaborate training in the Damage and Loss Assessment (DaLA)
methodology by the World Bank's Global Facility for Disaster Reduction and Recovery (GFDRR) team,
during DNA 2010.
Validation
Damage validation was based on a multi-pronged approach including: (a) upfront data validation through desk
review and detailed analysis of pre-disaster asset and infrastructure baseline data by the sector teams; (b)
collective determination of percentage-based damage in sectors such as housing and the private sector for
certain regions and provinces; (c) analytical validation of damage data by sector teams, employing techniques
and plausibility checks such as relative-to-baseline analyses, disaggregated analysis at various levels,
comparisons across vertical and horizontal streams of district and provincial data and; (d) limited, sample-
based physical validation by the sector teams in the flood affected areas.
Page | 23

CHAPTER 3
Economic Impact
The Overall damage from 2011 floods is estimated at Rs 324.5 billion (1.6 percent of GDP), with direct
damages amounting to 1.3 percent of GDP and indirect losses of 0.2 percent of GDP (Table 5). Unlike last
year, when the floods affected each province and inundated one-fifth of the agricultural area, the 2011 floods
remained confined to Sindh and Balochistan, with almost all (96 percent) of the damage occurring in Sindh.
Although the 2011 floods were significantly less in intensity and duration than the 2010 floods, yet in terms of
their economic impact, especially in Sindh, these were as devastating. In 2010, the total flood damage in
Sindh was estimated at Rs 370 billion (8.4 percent of estimated provincial GDP), whereas the 2011 floods
have caused an estimated damage of Rs 311 billion (or 6.1 percent of provincial GDP) in the province. This
is mainly because 2010 floods devastated the areas on right bank of river Indus, which contains relatively
poorer districts of Sindh with low economic activity. In 2011, the floods impacted the richer districts on the
left bank of Indus. These districts constitute the agricultural heartland of the province. The damage just in
agriculture is estimated to be Rs 151 billion as compared to Rs 194 billion in 2010. On the other hand, in
Balochistan, damages in 2011, at Rs 12 billion, (or 1.4 percent of provincial GDP) were only about a quarter
of Rs 53 billion (6.7 percent of provincial GDP) of damages suffered in 2010.
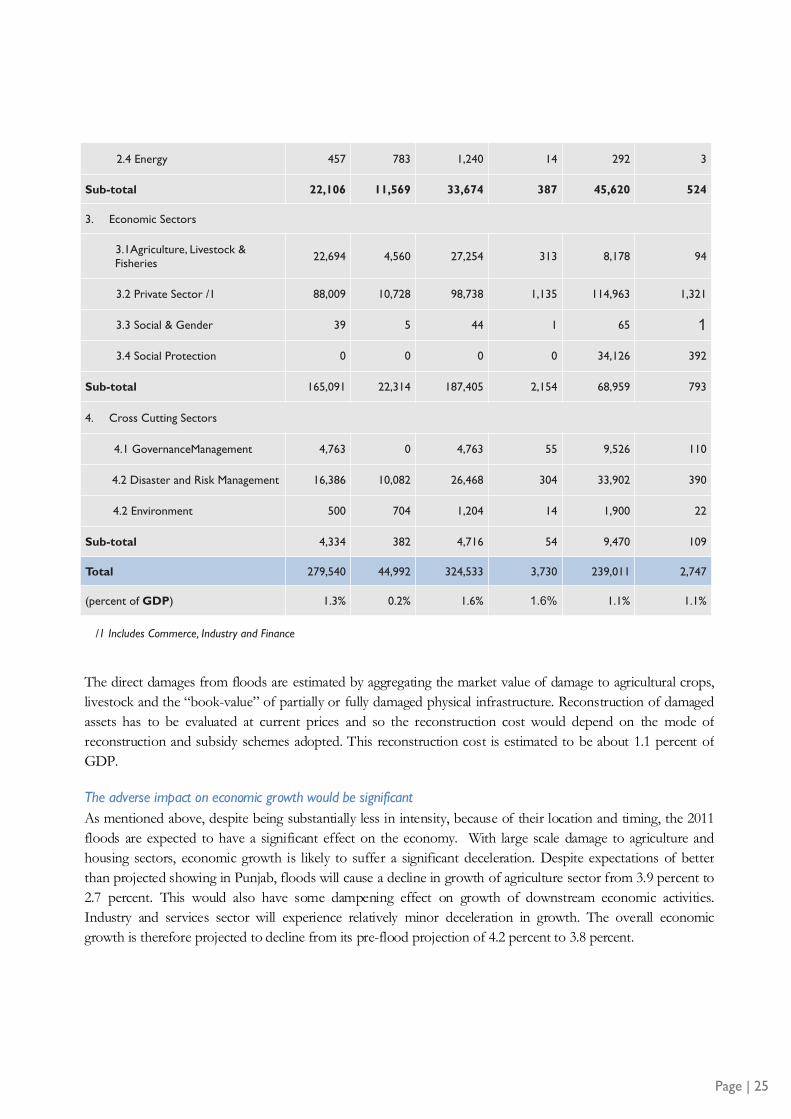
Table 5:Estimate of Total Damages and Reconstruction Costs
Sector
Indirect Losses
Indirect Losses
Total Damage Reconstruction Cost
(Rs million) (Rs (Rs million) (US$ (Rs Million) (US$ million)
1. Social Infrastructure
1.1 Housing 77,420 8,046 85,466 982 91,510 1,052
1.2 Health 432 826 1,258 14 864 10
1.3 Education 10,157 1,856 12,014 138 22,589 260
Sub-total 88,009 10,728 98,738 1,135 114,963 1,321
2. Physical Infrastructure
2.1 Irrigation & Flood Management
4,763 0 4,763 55 9,526 110
2.2 Transport & Communications 16,386 10,082 26,468 304 33,902 390
2.3 Water Supply & Sanitation 500 704 1,204 14 1,900 22
Page | 24
2.4 Energy 457 783 1,240 14 292 3
Sub-total 22,106 11,569 33,674 387 45,620 524
3. Economic Sectors
3.1Agriculture, Livestock & Fisheries
22,694 4,560 27,254 313 8,178 94
3.2 Private Sector /1 88,009 10,728 98,738 1,135 114,963 1,321
3.3 Social & Gender 39 5 44 1 65 1
3.4 Social Protection 0 0 0 0 34,126 392
Sub-total 165,091 22,314 187,405 2,154 68,959 793
4. Cross Cutting Sectors
4.1 GovernanceManagement 4,763 0 4,763 55 9,526 110
4.2 Disaster and Risk Management 16,386 10,082 26,468 304 33,902 390
4.2 Environment 500 704 1,204 14 1,900 22
Sub-total 4,334 382 4,716 54 9,470 109
Total 279,540 44,992 324,533 3,730 239,011 2,747
(percent of GDP) 1.3% 0.2% 1.6% 1.6% 1.1% 1.1%
/1 Includes Commerce, Industry and Finance
The direct damages from floods are estimated by aggregating the market value of damage to agricultural crops,
livestock and the “book-value” of partially or fully damaged physical infrastructure. Reconstruction of damaged
assets has to be evaluated at current prices and so the reconstruction cost would depend on the mode of
reconstruction and subsidy schemes adopted. This reconstruction cost is estimated to be about 1.1 percent of
GDP.
The adverse impact on economic growth would be significant
As mentioned above, despite being substantially less in intensity, because of their location and timing, the 2011
floods are expected to have a significant effect on the economy. With large scale damage to agriculture and
housing sectors, economic growth is likely to suffer a significant deceleration. Despite expectations of better
than projected showing in Punjab, floods will cause a decline in growth of agriculture sector from 3.9 percent to
2.7 percent. This would also have some dampening effect on growth of downstream economic activities.
Industry and services sector will experience relatively minor deceleration in growth. The overall economic
growth is therefore projected to decline from its pre-flood projection of 4.2 percent to 3.8 percent.
Page | 25
Inflation is likely to remain high.
Since experiencing the commodity price shocks in 2007/08, inflation has remained high, mostly in double digits.
This is mainly because of the weak fiscal policy stance has effectively eroded any impact on prices of a tight
monetary policy pursued by the State Bank of Pakistan. Moreover, the pass-through effect of frequent
adjustments of power tariffs and oil and gas prices have also kept the inflation level high. In 2010/11, inflation
averaged a relatively high level of 13.7 percent. For 2011/12, original projections put inflation at 11.3 percent.
However, during the first half of the fiscal year, the deceleration in inflation has been faster than expected, and
year-on-year inflation dropped to single digit level (9.8 percent) in December 2011, despite a sharp depreciation
of rupee. It is therefore projected that floods will cause the average inflation to increase to 11.6 percent.
Cost of relief, rehabilitation activities and repair and reconstruction of public infrastructure is likely to add to fiscal fragility
As mentioned above, a bulk of Pakistan’s macroeconomic vulnerability stems from its fragile fiscal situation.
Compared to the original fiscal deficit target of 4 percent of GDP, due to substantial overrun in power sector
subsidy and revenue shortfall, the end-year fiscal deficit in 2010/11 was 6.6 percent of GDP. For 2011/12, the
government again set a fiscal deficit target at 4 percent of GDP. However, given the lack of budgetary measures
to achieve this target, a fiscal deficit of 6 percent of GDP was considered more realistic. After the floods, this
estimate is likely to increase 6.4 percent of GDP as revenue are expected to fall by 0.1 percent of GDP and
additional expenditure on relief, rehabilitation and reconstruction will cause an overrun of 0.3 percent of GDP in
expenditure.
Balance of payments may also come under pressure
The current account deficit will also widen from 0.8 percent of GDP to 1.4 percent of GDP as damages,
especially to the cotton crop, will adversely impact exports, whereas additional imports would be required to
cover the supply losses caused by floods, agricultural inputs (fertilizers, pesticides, etc.) and construction material.
Page | 26
CHAPTER 4
Summary of Damage and Needs by Sector
Housing
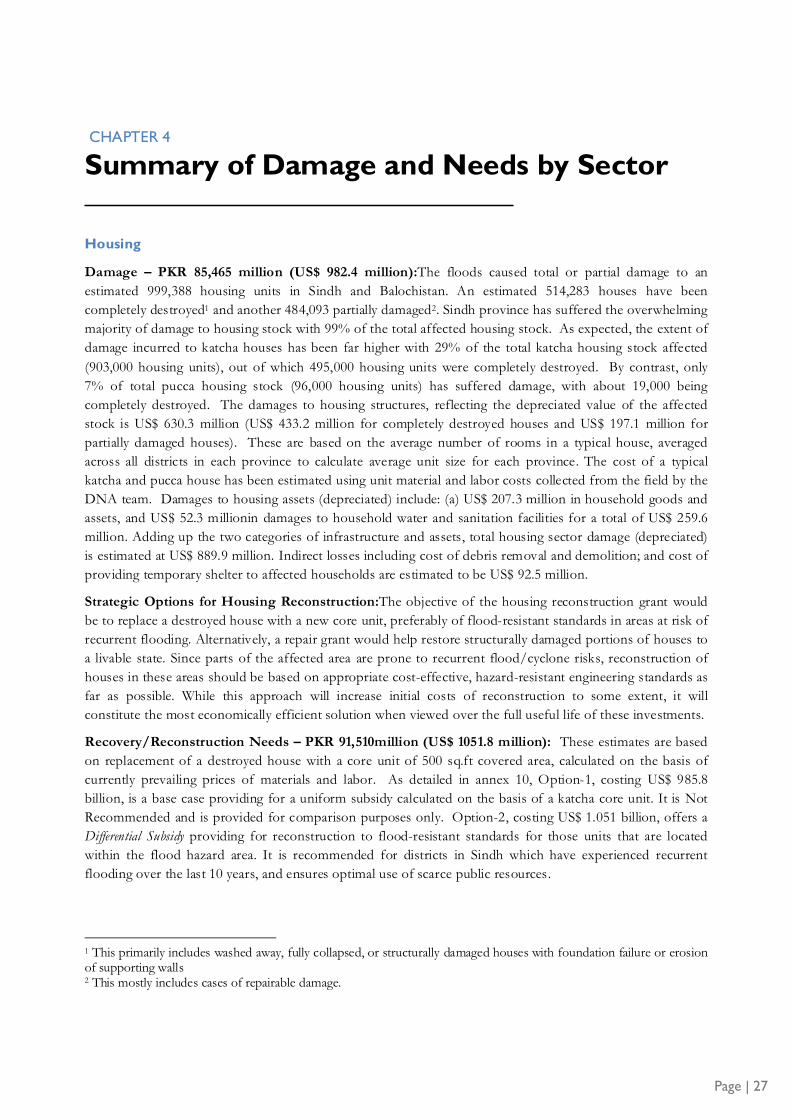
Damage – PKR 85,465 million (US$ 982.4 million):The floods caused total or partial damage to an
estimated 999,388 housing units in Sindh and Balochistan. An estimated 514,283 houses have been
completely destroyed1 and another 484,093 partially damaged2. Sindh province has suffered the overwhelming
majority of damage to housing stock with 99% of the total affected housing stock. As expected, the extent of
damage incurred to katcha houses has been far higher with 29% of the total katcha housing stock affected
(903,000 housing units), out of which 495,000 housing units were completely destroyed. By contrast, only
7% of total pucca housing stock (96,000 housing units) has suffered damage, with about 19,000 being
completely destroyed. The damages to housing structures, reflecting the depreciated value of the affected
stock is US$ 630.3 million (US$ 433.2 million for completely destroyed houses and US$ 197.1 million for
partially damaged houses). These are based on the average number of rooms in a typical house, averaged
across all districts in each province to calculate average unit size for each province. The cost of a typical
katcha and pucca house has been estimated using unit material and labor costs collected from the field by the
DNA team. Damages to housing assets (depreciated) include: (a) US$ 207.3 million in household goods and
assets, and US$ 52.3 millionin damages to household water and sanitation facilities for a total of US$ 259.6
million. Adding up the two categories of infrastructure and assets, total housing sector damage (depreciated)
is estimated at US$ 889.9 million. Indirect losses including cost of debris removal and demolition; and cost of
providing temporary shelter to affected households are estimated to be US$ 92.5 million.
Strategic Options for Housing Reconstruction:The objective of the housing reconstruction grant would
be to replace a destroyed house with a new core unit, preferably of flood-resistant standards in areas at risk of
recurrent flooding. Alternatively, a repair grant would help restore structurally damaged portions of houses to
a livable state. Since parts of the affected area are prone to recurrent flood/cyclone risks, reconstruction of
houses in these areas should be based on appropriate cost-effective, hazard-resistant engineering standards as
far as possible. While this approach will increase initial costs of reconstruction to some extent, it will
constitute the most economically efficient solution when viewed over the full useful life of these investments.
Recovery/Reconstruction Needs – PKR 91,510million (US$ 1051.8 million): These estimates are based
on replacement of a destroyed house with a core unit of 500 sq.ft covered area, calculated on the basis of
currently prevailing prices of materials and labor. As detailed in annex 10, Option-1, costing US$ 985.8
billion, is a base case providing for a uniform subsidy calculated on the basis of a katcha core unit. It is Not
Recommended and is provided for comparison purposes only. Option-2, costing US$ 1.051 billion, offers a
Differential Subsidy providing for reconstruction to flood-resistant standards for those units that are located
within the flood hazard area. It is recommended for districts in Sindh which have experienced recurrent
flooding over the last 10 years, and ensures optimal use of scarce public resources.
1 This primarily includes washed away, fully collapsed, or structurally damaged houses with foundation failure or erosion of supporting walls 2 This mostly includes cases of repairable damage.
Page | 27

Health
Damage – PKR 1,257.85 million (US$ 14.3 million): The floods caused by heavy rains in 2011 resulted in
mild damage to the public health infrastructure in Sindh and Balochistan provinces. Basic health units and
rural health centers suffered the most damage; accounting for 74 (52%) of the total 141 damaged facilities.
Most of the secondary health care facilities largely remained un-affected and – except for short interruption,
these facilities have continued service provision. No health staff is reported to have died or injured. In Sindh,
of the total of 708 health facilities of various categories in the 11 districts where health sector was affected,
113 (16%) were damaged out of which 28 (4%) were fully damaged, and 85 (12%) were partially damaged. In
Balochistan, of the total of 193 health facilities in the 3 affected districts, 28 (15%) were damaged out of
which 13 (7%) were fully damaged and 15 (8%) were partially damaged. The damage caused to the health
sector in the Sind province constitutes 7% of its total health facilities (1486); and 1% of the total health
facilities (2075) in Balochistan.
Recovery/Reconstruction Needs – PKR 863.7 million (US$ 9.8 million):Total reconstruction cost
estimates for the fully and partially damaged health facilities have been worked out as PKR 863.7 million
(US$ 9.8 m)based on the government’s local schedule of rates with a 15% addition for price escalation and
build back smarter factor, and 10% addition for external development. In the medium- and long-term, a
comprehensive health sector revitalization/restructuring strategy should aim at the provision of minimum
standards of service delivery based on the key principles of equitable access to essential health care,
timeliness, results, and accountability.
Education
Damage – PKR 12,013.78 million (US$ 138.1 million): Total number of educational institutions affected
by the floods is 4,096 (Sindh: 3,892; Balochistan: 204). The damaged institutions are 9.8% of the total (Sindh:
9.9%, Balochistan: 7.20%) institutions in the affected districts and only 6.7% of the overall total educational
institutions in the two provinces (Sindh: 8.0%, Balochistan: 1.7%). In Sindh, damaged schools for females are
1,032 (385 are fully damaged and 647 are partially damaged) or 26.5% of the total of 3,892 damaged schools,
while damaged schools for males are 2,860 (1,022 are fully damaged and 1,838 are partially damaged) are
73.5% of the total of 3,892 damaged schools. In Balochistan, damaged schools for females are 51 (3 are fully
damaged and 48 are partially damaged) or 25% of the total of 204 damaged schools, while damaged schools
for males are 153 (17 are fully damaged and 136 are partially damaged) or 75% of the total of 204 damaged
schools). The total damage and loss in both the provinces is PKR 12,013.8 million including indirect loss of
PKR 1,856.4 million. In Sindh, total damage and loss is estimated at PKR 11,751.5 million including indirect
loss of PKR 1,771.1 million and direct loss of PKR 9,980.3 million. In Balochistan, indirect and direct losses
are PKR 85.11 million and PKR 177.1 million respectively.
Recovery/Reconstruction Needs – PKR 22,589.43 million (US$259.7 million): The total cost of
reconstruction for all the damaged institutions of both the provinces is estimated to be PKR 20,733.1 million
(US$ 238.3 million) of which requirement for Balochistan is estimated at PKR 544.5 million (US$ 6.3
million). Overall recovery and reconstruction needs are estimated to be PKR 22,589.4 million (US$ 259.7
million). Reconstruction needs for Sindh would be PKR 21,959.9 million (US$ 252.4 million) and those for
Balochistan would be PKR 629.6 million (US$ 7.2 million). In addition to reconstruction cost of damaged
institutions, other reconstruction needs include teacher orientation, facility-by-facility survey of damaged
Page | 28

institutions to work out actual needs of each institution, and provision of textbooks and other learning
materials. Provision of free textbooks is the responsibility of each province as per the current policy.
Irrigation and Flood Management
Damage – PKR 4,763 million (US$ 54.75 million): The damage reported are in 38 irrigation divisions of
Sindh province (PKR 3,936 million or US$ 45.2 million), and 14 irrigation divisions of Balochistan province
(PKR 827 million or US$ 9.5 million). In Sind, fifteen divisions suffered damages exceeding US$ 2.5 million
each. In Balochistan, three divisions have reported damages exceeding US$ 1.0 million. The damage estimates
reflect the reconstruction requirement at depreciated value as most of the infrastructure is more than 15 years
old. Indirect losses such as damage to crops due to flooding and disruption of irrigation supplies, siltation and
water-logging of agricultural land are not covered in irrigation and flood sector.
Recovery/Reconstruction Needs – PKR 9,526 million (US$ 109.49 million): The reconstruction cost
estimated for Sindh province is PKR 7,872 million (US$ 90.5 million) and for Balochistan is PKR 1,654
million (US$ 19 million). The proposed irrigation, drainage and flood protection sector reconstruction
strategy is to restore all damaged infrastructures, and strengthen vulnerable and damaged sections before 2012
monsoon. Main drains in Sindh, particularly left bank outfall drain (LBOD) drained huge volume of water,
which otherwise would have kept the farmlands inundated for a very long time also affecting the cropping in
winter season. These drains have been designed to discharge sub-surface water for checking water logging of
agricultural land. Their capacity should be enhanced for also draining storm water, after carrying out in-depth
analysis and forecasting probable maximum rainfalls in next 20 to 50 years. Proper inlets need to be designed
for collecting rain water. Strict monitoring is essential to avoid damages to drainage structures by the farmers.
If annual maintenance is not carried out, before and after monsoon season, it would waste all investments
made to improve these drains. Preparation of a maintenance manual is strongly recommended. For small
dams, design parameters for estimating reservoir capacity, spillway capacity and crest levels, highest flood
levels as well as dam configuration need to be revisited keeping in view the changing climate patterns, and
rainfall intensities and durations. The present hydrological approaches of using historic data to estimate future
trends need to be more carefully applied for designing dams and flood irrigation projects considering
changing climatic patterns.
Transport and Communications
Damage – PKR 26,468 million (US$ 304 million): The damages in transport and communications sector
involve various categories of roads, railways, bridges, and telecommunications infrastructure. Preliminary
estimates indicate that 10% of the road network (approximately 8,385 km) and 190 km railway lines were
damaged by the flood including bridges and allied structures. Most of the damages are on provincial highways
and district roads of Sindh. Damage to the telecommunication infrastructure includes damages to cellular
sites, exchange centers, equipment, power system and supporting civil works (US$1.9 million). Out of the
estimated total damage and losses, the road subsector sustained the highest damage and losses (US$299
million) followed by the railway subsector (US$3 million). The affected mobility during the floods has mostly
been restored through emergency measures. The floods have impaired the road asset condition which will
continue to deteriorate faster if repairs, rehabilitation and restoration works remain deferred for a longer
period. The indirect losses due to damages in road sector were also calculated based on an increase in the
road user cost and using a phased recovery period.
Page | 29

Recovery/Reconstruction Needs – PKR 33,719 million (US $ 388 million): The reconstruction needs of
the sector have been estimated at US $ 388 million, including US $ 5 million for railways and excluding US $
2 million required in the telecommunication subsector as these were private assets with insurance coverage.
Most of the reconstruction needs are in the road subsector (US $ 383 million). The recovery strategy varies
across each subsector based on the nature of the responsible agency and the importance of the infrastructure.
For telecommunications, the private sector operators have mobilized and carried out repairs, and restored
telecom services. For roads, diversion routes were created and services restored. Emergency repairs on
railway lines have been undertaken. As a short term measure, the National Highways Authority (NHA) has
tasked the regional maintenance units to undertake the emergent works through pre-qualified contractors and
using proceeds of the annual road maintenance funds. All reconstruction costs for railways and 10 percent of
the road reconstruction costs are included in the short-term recovery phase for works to be completed within
12 months. The remaining road reconstruction will require careful prioritization to ensure efficient utilization
of available resources. As most of the restoration works are not complex and thinly spread across wider
geographic area, it is recommended that recovery and reconstruction works are packaged through small
contracts engaging local construction firms and labor.
Water Supply and Sanitation (WATSAN)
Damage – PKR 1,203.6 million (US $ 14 million): Total damages for water supply and sanitation for both
direct and indirect damages are PKR 1,160million and PKR 43.6 million in Sindh and Balochistan,
respectively. Direct damages in Sindh are PKR 456.6 million in 378 reported schemes in the flood affected
districts. These damages include PKR 147.6 million for public water supply and PKR 253million for public
sanitation. An amount of Rs 56 million for community infrastructure damage is also included. In Balochistan,
WATSAN damages have been assessed at PKR 46.6 million, in a total of 80 schemes. Indirect losses for
Sindh have been calculated to at Rs 703.6 million. No such loss is calculated for Balochistan due to lack of
data. Indirect losses which derives from higher expenditures related to (i) supplying potable water (tankers,
cost of hand pumps, water tanks, purification and disinfection processes), and (ii) cleaning, wells, sewers and
pipes; and for the loss of revenue from interrupted water supply services.
Recovery/Reconstruction Needs – PKR 1,900.2 million (US$ 22 million): The reconstruction needs
inclusive of Build Back Smarter (BBS) Factor in Sindh and Balochistan are PKR 1,900.2 million which
includes PKR 1,831.7 and PKR 68.5 million for each, respectively. In Sindh, it has been calculated to be PKR
833.24 million and PKR 998.5 million for water supply and sanitation, respectively. The reconstruction needs
inclusive of BBS for Balochistan are only for water supply amounting to PKR 68.5 million. BBS has been
evaluated for two parameters i.e. (i) technical upgrade factor and (ii) disaster mitigation factor. A 15%
increment has been assumed for each of the proposed factors in all districts of Sindh and Balochistan. In
addition, several other awareness, hygiene and disaster related factors have also been costed.
Agriculture, Livestock, and Fisheries
Damage – PKR 160,106 million (US$ 1,840 million): The floods have heavily impacted the agriculture
sector, with damages to crops, livestock, fisheries, poultry and on-farm water distribution infrastructure. The
total loss estimated isUS$ 1840.3 million, of which 89% is in the form of direct damage and 11% is in the
form of indirect losses. Sindh suffered most with 94% of total damage and Balochistan with 6%. The losses
were largest in the crops subsector, which accounted for 91.5%, including estimates of damages to Kharif
crops; food and seed stocks; on-farm irrigation water facilities; and support services for crops, as well as
indirect damages to the forthcoming Rabi 2011-12 and Kharif 2012 crops. Livestock subsector damages,
Page | 30
which include loss of animals and poultry, distress sales, and destruction of animal health support services, as
well as indirect damages due to reduced milk production, accounts for 8.3% of total damages. Fisheries losses
are estimated at around $3.4 million (0.2%) that accounts for private fish farms/ponds and hatcheries. A total
of about 881 thousand ha or 53% of the planted areas was affected. The most affected crops are cotton with
74%damages to the overall planted area in the affected districts. The damages to rice were 33%, sugarcane
34%, vegetables 79% and fruits 32%. The livestock subsector losses were mainly in productivity of the large
ruminants and deaths in small ruminants and poultry.
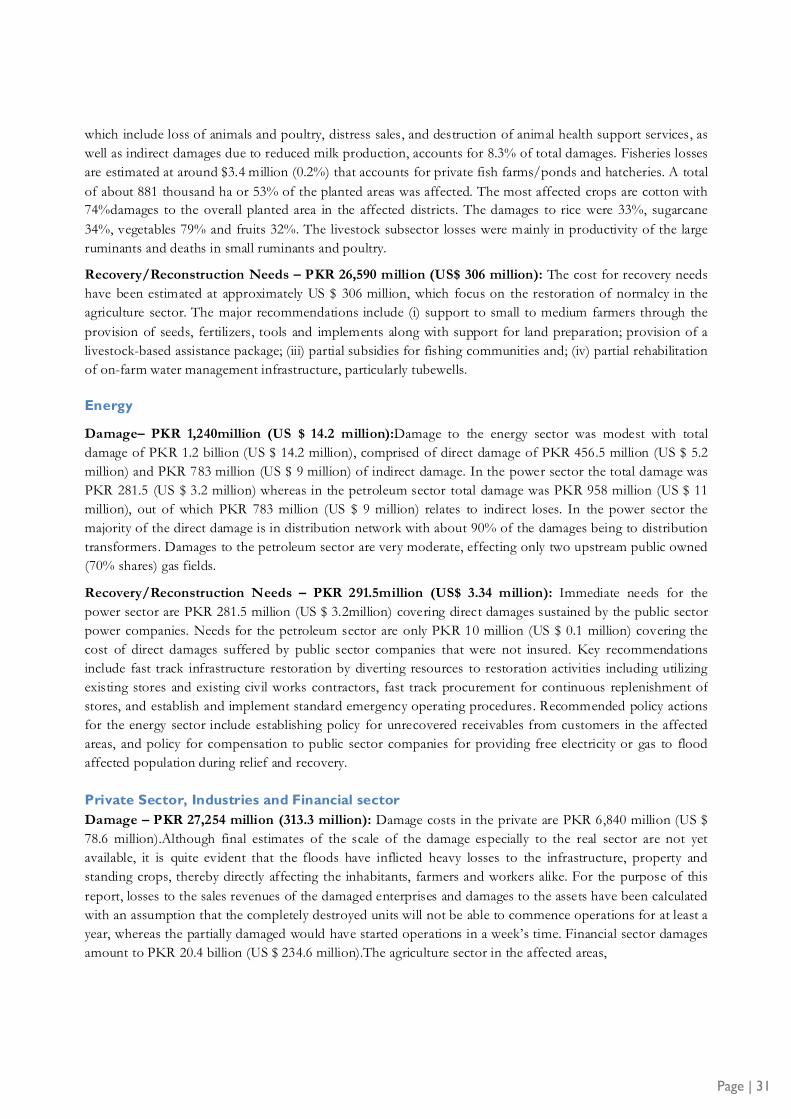
Recovery/Reconstruction Needs – PKR 26,590 million (US$ 306 million): The cost for recovery needs
have been estimated at approximately US $ 306 million, which focus on the restoration of normalcy in the
agriculture sector. The major recommendations include (i) support to small to medium farmers through the
provision of seeds, fertilizers, tools and implements along with support for land preparation; provision of a
livestock-based assistance package; (iii) partial subsidies for fishing communities and; (iv) partial rehabilitation
of on-farm water management infrastructure, particularly tubewells.
Energy
Damage– PKR 1,240million (US $ 14.2 million):Damage to the energy sector was modest with total
damage of PKR 1.2 billion (US $ 14.2 million), comprised of direct damage of PKR 456.5 million (US $ 5.2
million) and PKR 783 million (US $ 9 million) of indirect damage. In the power sector the total damage was
PKR 281.5 (US $ 3.2 million) whereas in the petroleum sector total damage was PKR 958 million (US $ 11
million), out of which PKR 783 million (US $ 9 million) relates to indirect loses. In the power sector the
majority of the direct damage is in distribution network with about 90% of the damages being to distribution
transformers. Damages to the petroleum sector are very moderate, effecting only two upstream public owned
(70% shares) gas fields.
Recovery/Reconstruction Needs – PKR 291.5million (US$ 3.34 million): Immediate needs for the
power sector are PKR 281.5 million (US $ 3.2million) covering direct damages sustained by the public sector
power companies. Needs for the petroleum sector are only PKR 10 million (US $ 0.1 million) covering the
cost of direct damages suffered by public sector companies that were not insured. Key recommendations
include fast track infrastructure restoration by diverting resources to restoration activities including utilizing
existing stores and existing civil works contractors, fast track procurement for continuous replenishment of
stores, and establish and implement standard emergency operating procedures. Recommended policy actions
for the energy sector include establishing policy for unrecovered receivables from customers in the affected
areas, and policy for compensation to public sector companies for providing free electricity or gas to flood
affected population during relief and recovery.
Private Sector, Industries and Financial sector
Damage – PKR 27,254 million (313.3 million): Damage costs in the private are PKR 6,840 million (US $
78.6 million).Although final estimates of the scale of the damage especially to the real sector are not yet
available, it is quite evident that the floods have inflicted heavy losses to the infrastructure, property and
standing crops, thereby directly affecting the inhabitants, farmers and workers alike. For the purpose of this
report, losses to the sales revenues of the damaged enterprises and damages to the assets have been calculated
with an assumption that the completely destroyed units will not be able to commence operations for at least a
year, whereas the partially damaged would have started operations in a week’s time. Financial sector damages
amount to PKR 20.4 billion (US $ 234.6 million).The agriculture sector in the affected areas,
Page | 31

constitutes about 71 percent of loans by volume and 26 percent by amount. The agriculture credit was
extended to almost all the affected districts in Sindh, and significant non-performing loans (NPLs) have been
reported by one specialized bank for the zones of Mirpur Khas (US$ 56 million), Sukkur (US$ 44.5 million),
Nawabshah (US$ 34 million) and Hyderabad (US$ 28 million). The State Bank of Pakistan (SBP) suspects
that since the floods have rendered heavy losses to crops, property and businesses in Sindh, hence a number
of additional borrowers are likely to default on their commitments. It is likely, that the NPLs for the province
will exceed PKR 17 billion (US$ 195.4 million) which is more than double the amount of pre-flood NPLs. In
short, an increase of about PKR 12.9 billion (US$ 148.3 million) in new NPLs is likely1. There have been no
reports of damages to the Balochistan lending portfolios of the financial sectors. The penetration of the
financial sector in the area is the lowest of all provinces, and there are very few micro-finance providers
(MFPs) operating in Balochistan, who may report NPLs later in the year.
Recovery/Reconstruction Needs – PKR8,178 million (US$ 94 million): Analysis shows there is a need
for recapitalization in the case of the micro-finance institutions (MFIs) and the specialized agriculture banks.
Given that MFIs have limited ability to replenish capital when there are losses as in this case, they need to be
rescued, and in the case of the specialized banks, their reserves are thin and their relatively undiversified
portfolio limits their ability to make up the losses. The replenishment requirements of the micro-finance (MF)
sub- sector in Sindh and Balochistan are around PKR 3,304 million (US$ 38 million).Meanwhile, the strong
capital base of the commercial banking sector appears to help it withstand the losses inflicted by their
additional NPLs. It is also worth noting that the final shape of the banking sector losses will become clearer
when SBP publishes its next Financial Stability Review (FSR) in May 2012 for the second half of year 2011.
The specialized banks with exposure to districts in Sindh and Balochistan may need immediate help as a big
percentage of their portfolio comprised agricultural loans, and their refinancing need could go as high as PKR
4 billion (US$ 46 million). Regardless, no blanket write offs are recommended in the commercial banking and
MF sectors. Such decisions should be made at the institutional level on case to case basis. Some of the MF
borrowers will make genuine cases for loan write offs as many poor and transient poor households have lost
their livelihoods and assets. It is recommended that women borrowers of the MF products should be given
special consideration as they were already marginalized and hence more vulnerable to such shocks. No
specific assistance is recommended for the insurance sector.To ensure that the viable enterprises are restored,
it is estimated that a matching grant scheme of approximately PKR 870 million (US$ 10 million) would
suffice. Of this amount, it is recommended that approximately 20% is routed through an agency like Small
and Medium Enterprise Development Authority (SMEDA), which would target the small number of larger
enterprises affected, and the remainder (80%) through the Pakistan Poverty Alleviation Fund (PPAF) which
would target micro and very small enterprises where the bulk of the damage lies.
Social Protection and Livelihoods
Damage - Estimates for the total affected population in flood hit districts of Sindh and Balochistan are based
on the total affected area. PSLM data is used to calculate post-flood poverty levels; this is combined with
damage to housing and agriculture to estimate the number of severely affected poor and vulnerable
households who require assistance to cope with the negative impact of the floods. The total is in the range of
801,897 to 851,439, representing 52-54 percent of the total affected population. The majority of these are in
Sindh (786,917 to 836,311) and the rest in Balochistan. Districts with over 50 percent or more severely
1 SBP (2011). Impact of Recent Floods on NPLs. Financial Stability Review – First Half 2011. Box 2.1 Page 33-34. Downloaded from www.sbp.gov.pk on Dec 20, 2011.
Page | 32

affected households are Badin, Dadu, Khairpur, Matiari, Mirpurkhas, Sanghar, Tando Allah Yar, Tando
Muhammad Khan, and Thatta in Sindh, and Kalat, Jaffarabad, and Lasbela in Balochistan.
Recovery/ReconstructionNeeds – PKR 34,126 million (US$ 392 million): The poverty profile of flood
affected districts in Sindh and Balochistan already shows a heavy concentration around the poverty line –
meaning that an external shock such as the floods would have pushed many households into/deeper into
poverty. To meet the immediate basic needs of poor and vulnerable affected families it is recommended that
they be given cash or in kind transfers for a period of six months. For a food basket of PKR 6,680 the
estimated cost is PKR 34,126 million1 (US$ 392 million). At the same time a medium- and long-term
perspective is required with measures that can mitigate the effects of future shocks, and that can help lift
families out of poverty. These include large scale public works programs and other temporary employment
schemes, vocational training to rebuild livelihoods and potentially the use of conditional cash transfers (CCT)
linked to education building on already existing systems. The recent availability of nationwide BISP poverty
database would allow better targeting and cross-sectoral collaboration opportunities to respond to future
crises.
Social and Gender
Damage – PKR 43.6 million (US$ 0.5 million): The impact on people and livelihoods is more severe than
the infrastructure damages. According to the National Disaster Management Authority (NDMA)2, 9.6
million people are affected including 744,000 dislocated.Total deaths are reported as 520. In Sindh, 179 social
welfare infrastructure units3 serving a population of 41,140 people are partially or fully damaged. The direct
damage estimated costs are PKR 39 million. Indirect costs are assessed as PKR 4.6 million. According to UN
OCHA, the situation remains alarming with poor coverage of all essential sectors. Failure to meet Rabi
cultivation will have severe consequences on farm dependent households. The report further documents
increasing insecurity and violence against women, boys and girls. 70% of households are reported not have
received any shelter, only 48% of funding has been received from the Rapid Response Plan and funding for
the revised falsh appeal launched in February 2012 has yet to start.
Recovery/Recovery Needs – PKR 64.7 million (US$ 0.7 million) - More than 50 percent of Pakistan’s
population suffers from multiple deprivations4. Vulnerable groups, socially marginalized populations, women
and children will suffer disproportionately from a failed response risking any opportunity for moving out of
impoverishment. Reconstruction efforts should focus on providing secure shelter, food security; sustainable
livelihood opportunities ensuring basic human needs are met. Critical is the need for effective national and
provincial institutional arrangements. Sound gender disaggregated data collection for base line, and during
and post-flood is essential for adequately addressing needs and priorities of flood-affected households.
Environment
Damage – PKR 2,762.7 million (US$ 31.8 million):In addition to causing loss of life, dislocation of
millions, and huge losses to the economy, the floods in 2011 have also resulted in environmental damages,
heightened environmental health risks and affected forests, wetlands and other natural systems. The floods
have caused damages to trees and forest land, avenue and block plantation, forest nurseries, mangroves,
1 Estimated cash grant support is based on a total of 851,439 severely affected households 2 NDMA, Damages Monsoon 2011 (Sindh and Balochistan(January 16 2012) 3 Social Welfare Department, Sindh Province. Social infrastructure is defined as centers such as orphanages, Dar-ul-uman women shelters child care and rehabilitation centers 4 Government of Pakistan, Ministry of Finance, Economic Survey, 2010-11
Page | 33

wetlands, and Forest Department infrastructure. The floods have also caused contamination of drinking
water, proliferation of disease vectors caused by stagnant water ponds, and accumulation of solid wastes –
factors that would further exacerbate health risks for the affected population, particularly women and children.
Environmental degradation and its effects on human health were already a significant development challenge
in Pakistan, which has some of the highest prevalence rates in all of South Asia for child mortality, diarrhea
and acute respiratory illnesses associated with environmental factors. The conditions created by the floods
could result in a significant increase of these and other illnesses. No estimates are available for damages to
other environmental resources such as wetlands and mangroves at this stage. To fill such damage data gaps,
follow-up environmental studies have been proposed to address safe disposal of debris, leakage/spillage of
hazardous and/or toxic substances, and damage to cultural heritage sites.
Recovery/Reconstruction Needs – PKR2,873.6 million (US$ 33.02 million): The floods were initiated by
a natural phenomenon; however, anthropogenic interventions exacerbated them, particularly as destruction
and degradation of natural ecosystems reduced their capacity to provide flood-protection services. Also,
development of settlements and croplands in floodplains as well as blocking of natural drainage routes created
the conditions for the current human tragedy. To avoid such disasters in the future, strengthening the
resilience of the Indus Watershed is urgently needed, involving an approach that combines structural and non-
structural measures that are strategic, feasible, and affordable to minimize vulnerability to extreme weather
events. Such an approach also calls for an improved management of the Indus Basin’s major natural resources
through strengthened coordination of flood-related actions within and among the provinces. Towards this
end, the following priority actions are proposed to be undertaken on immediate basis: 1) addressing
environmental health priorities, including drinking water, sanitation, hygiene and indoor air quality; 2)
reviewing/updating the flood protection strategy and master plan, and preparing a storm water drainage
master plan; and 3) preparing land use plans and building regulation, and strengthening legal and institutional
frameworks.
Governance Infrastructure
Damage – PKR 1,953 million (US$ 22.5 million):The rain floods caused severe disruption to functions and
services of the public institutions because of damage to buildings, record and equipment and also by limiting
access of the people to these institutions and temporary or permanent loss to institutional capacities. Impact of
lower level of governance functions performed and services delivered as a consequence of impairment of
institutional capacities and capabilities may include lower coverage and quality leading to higher risks of
insecurity and vulnerability to the citizens, slower recovery and rehabilitation. Governance related institutions
in the affected districts suffered direct damage to their buildings, record, furniture and equipment. Aggregate
damage has been assessed and quantified to be PKR 1,953million. Total number of buildings reported to have
been damaged is 648 in Sindh and 18 in Balochistan. Worst hit district in Sindh is Mirpurkhas where estimate
of aggregate affected covered area is 845,000 sq feet, followed by Sanghar (299,000), Tharparkar (246,000),
Shaheed Benazirabad (201,000). Civil Administration in Sindh suffered heaviest damage to its facilities, where
257 buildings were reported to have been partially damaged and 86 as completely destroyed. Damage to 137
police facilities and 24 and 14 facilities respectively for courts and prisons has been reported. Accounts
Offices, Auqaf buildings, NADRA, Post Offices and other governance institutions shared the remaining
damage. Recovery/Reconstruction Needs – PKR4,768 million (US$ 54.816 million): Bulk of the
Page | 34

reconstruction costs are the costs of repair and reconstructions of buildings. Cost of restoration of records and
targeted capacity building have been estimated and included. Sector recovery strategies recommend short term
actions for restoration of services through temporary arrangements and adjustments for space, human
resources, records, equipment. For medium and long term, the recommendations include strategic actions for
reconstruction/repair of hard physical assets, development of human and technology resources, standardized
process for expenditure planning and execution, development of focused M&E and participatory planning and
monitoring, considering the overall governance challenges.
Page | 35

CHAPTER 5
Governance and Institutional Arrangements
Implementation Arrangements
The overall scope of this flood disaster is relatively small compared to previous disaster events. However,
considering the frequency of disasters and their varying extent in Pakistan the institutional arrangements have
to be robust enough to cater for implementation requirements for this and all recent and future disasters. The
arrangement should be able respond to reconstruction requirements in which efficiency, speed, disaster
mitigation, transparency and accountability are fully embedded, as the focus is on immediate restoration or
reconstruction of what existed and was in use against new works which are part of regular development cycle.
The institutional arrangements also need to recognize the existing challenges in the routine public service
delivery, including, increased role of provinces in implementation resulting from the 18th Constitutional
Amendment, inadequate public financial management capabilities, human resources constraints, and complex
intergovernmental coordination mechanisms. Special attention will also need to be paid to accountability and
transparency concerns of the public and the development partners.
Institutional Framework
Having a clear institutional framework is essential for efficient and transparent reconstruction of damaged or
destroyed facilities. This is to establish Government commitment to the early commencement of the
reconstruction process and credibility for mobilizing resources. One of the main reason for inadequate
resource mobilization after 2010 flood was the absence of such an institutional framework which although
was recommended in the flood 2010 DNA report, but was not established. The following key guiding
principles draw on lessons learned from the 2010 floods as well as from international post-disaster
reconstruction experience.
Clarity of the overall mandates
Any large-scale reconstruction operation requires clear delineation of the mandates of the various levels of
government as this provides the structure and clarity required for all stakeholders to work with maximum
efficiency. In the case of this reconstruction program, this will mean a delineation of mandates in line with
the 18th Constitutional Amendment. Any possible overlaps in the reconstruction function between
institutions need to be eliminated in order that government institutions are placed firmly in the driving seat
and reconstruction partners are well managed. In accordance with this, international experience has shown
that, in the case of a national disaster, a single institution or body at the federal level needs to take the lead in
overall coordination, monitoring and formulation of reconstruction policies and strategies, necessary for
equity considerations. Since disaster impacts/mitigations do not necessarily recognize administrative
boundaries, and with capacity gaps and the stress created by the floods and related reconstruction in the
institutions handling public sector programs, the existence of a central level dedicated institution becomes
even more critical. Based on the current mandates this role can be performed by the National Disaster
Page | 36

Management Authority (NDMA). The provincial and regional governments and federal agencies in case that
some sectors are mandated to the federation, are to take the lead in implementation of the reconstruction of
sector program including sector coordination, planning and monitoring at the provincial or agency level.
Early articulation of policies, strategy and standards
The provincial and regional governments have already started articulating their responses depending upon
their capacity, especially after the 18th Amendment and given the urgency of reconstruction. The federal
government needs to ensure that the overall reconstruction policies and strategies are articulated as soon as
possible to avoid inconsistencies and major divergence in reconstruction approach and strategy among the
provinces and regions.
Equitable allocation of resources
Floods have impacted the two provinces and the 22 districts located within them differentially depending
upon location, topography and socioeconomic situation. This has given rise to diversity in the response and
needs. The allocation of resources among provinces/districts has to be based on the needs and the
associated disaster risks for reconstruction.
Setting a definite time frame for reconstruction implementation
Planning for reconstruction, a difficult task for any government, has been beset with challenges in the case of
previous disasters in Pakistan.The efficiency of the reconstruction program would be greatly enhanced if the
federal government, in consultation with the provinces, set a definite time frame for reconstruction
implementation to instill an emergency mindset within government institutions and reconstruction partners
(multilateral and bilateral institutions, and non-government organizations). The reconstruction
implementation plan should take into account private and public sector capacities and systems and, in case of
gaps, should include measures to fill these to complete the reconstruction program within the set time frame.
Special policies, laws or special dispensations for reconstruction can then also be bound to this definite time
frame to shorten reconstruction time lines.
Effective coordination
Effective coordination among all levels of government and reconstruction partners (government and donor
agencies1) is essential and can best be achieved through government-led national, provincial and district level
coordination forums and sectoral coordination where required. These forums will facilitate information
sharing, better planning and collaboration among the multiple partners as well as more targeted management
of reconstruction resources at all levels.The current clusters developed for relief and early recovery are
inadequate for reconstruction purposes.
Enhanced transparency
Independent oversight and monitoring involving representatives of civil society is essential to achieve
transparency. The Government had put in place the National Oversight Disaster Management Council
(NODMC) comprising independent and reputable individuals from civil society after the 2010 floods.
1 Including NGOs
Page | 37

However the council remained inactive during implementation. The Government should consider
establishing a more robust independent oversight body with representation from partners organization,
donors, civil society and academia, that accompanies the reconstruction process and reviews and reports
regularly on the its progress, outcomes, and impacts to the general public. All key reports from the M&E
system and internal/external audits should also be reviewed by this body.
Enhanced disclosure on reconstruction policies, strategies, criteria, procurements and plans to the Pakistani
and international community could then be done through a pro-active and strategic communications program
on reconstruction implementation, both at the federal and provincial levels. The expectations and
information needs of the public, particularly the affected communities, should also be taken into account and
any strategy to enhance transparency should be supported by a strong public awareness campaign, conducted
at community level.
Implementation through existing government institutions as “first-choice” option
International practice has shown that implementation arrangements need to respect the mandate of existing
institutions. Setting up parallel structures should be avoided to the extent possible. Existing institutions
should be supported with additional capacity in short to medium term if required, in order to efficiently
deliver against the additional requirements and expectations associated with large-scale reconstruction
programs. Implementation responsibility should be delegated to the lowest level of government, to increase
accountability and reconstruction outreach and in order to allow the fastest response possible to the dynamic
situation on the ground.
Enhanced Accountability
Enhanced fiduciary safeguards and risk mitigation measures, including internal controls and external audits,
should be adopted for the specific purposes of the reconstruction program. This will increase the credibility
of the government’s response in the eyes of the national and international public and will facilitate the
mobilization of reconstruction funds and support. The existing public sector financial management systems
(PIFRA) should be used where possible, augmented by robust integrated FMIS to track
reconstruction/donor funding. Additional internal control/audit staff may be required at the district or
regional (division) levels to strengthen internal controls in the affected areas. All reconstruction programs and
projects channeled through the government’s budget systems may be audited by the Auditor General (AG) of
Pakistan as the external auditor in conformity with the International Standards of Auditing. Given the
urgency of the reconstruction programs a dedicated Audit Unit may be established within the AG office to
carry out special performance audits and provide annual audit reports efficiently. Some of these activities
could be outsourced by the audit department if required. All accountability efforts should be made known to
the public through a highly visible public awareness campaign so that all stakeholders are aware of the anti-
corruption and transparency efforts of the government at all levels.
Institutionalizing fast-tracking
The speed at which the reconstruction program is delivered will be greatly enhanced if expedited approval
procedures are put into place to govern both on-budget and off-budget projects. Procedures and systems to
fast-track the reconstruction program especially for disbursements, procurement, and approvals should be
Page | 38

of capacity and reluctance on the part of implementing agencies unfamiliar with these procedures. The federal
body coordinating reconstruction, in this case NDMA, could assist and technically back-stop mandated
institutions to further elaborate and streamline the procedures for simplified projects and umbrella approval,
public sector procurement, fund flow, and financial management. The fast-track procedures should be
accompanied by clear systems, controls and instructions to minimize corruption and ensure accountability.
Incentivizing the human resource base
International experience has shown that to break the “business as usual” culture of the institutions handling
reconstruction, special incentives for staff working on reconstruction are needed. Depending upon the role of
the institution in the reconstruction, the incentives could be target-oriented and based on outputs. Return of
government staff to the flood affected areas may be facilitated and incentive systems designed to attract and
retain quality staff working under difficult conditions.
Full use of private sector capabilities
Private sector services and capacities play a important role in delivering effective reconstruction programs
andshould be tapped where possible and appropriate. The additional capacities required in the short- to
medium-term for reconstruction could also be outsourced so that government institutions can continue to
perform their normal operations. The outsourcing could benefit from innovative options like turn-key
(design-build) and public-private partnership models. Strict compliancewith, and efficient and transparent use
of, fast-track procurement and implementation procedures could incentivize the participation of capable and
reputable consulting firms, contractors and suppliers in reconstruction implementation.
Enhancing community participation
Community participation in reconstruction implementation should be promoted and facilitated. Options
include partnerships with individual households through community-driven development (CDD) type
mechanisms in the case of housing programs, and CBOs and NGOs to support reconstruction of
community-infrastructure. Whichever mechanism is used, the affected communities need to be put at the
center of the reconstruction process and be kept informed and up to date on progress and challenges. The
communities themselves represent a key stakeholder group with considerable potential contribution. Past
reconstruction programs around the world have repeatedly shown that if given the resources and the
guidance, affected communities can play a substantial role in implementing reconstruction at local level.
Socially responsive implementation
The existing legal system is already stressed and cannot efficiently handle the additional burden posed by
reconstruction activities. A timely and effective response to grievances and complaints, both individual and
institutional (in relation to delays, procurement etc.), needs to be ensured through the establishment of
effective grievance redress systems and complaints handling procedures. Ensuring timely redress will avoid
delays in reconstruction implementation, as well as effectively protecting individual rights and entitlements.
The system has to be supported by a monitoring mechanism to ensure its effectiveness. In addition, the
existing systems have to be capacitated for a short term to provide dedicated, timely and efficient justice to
the affected population where required. A public awareness campaign should support these efforts in order
that stakeholders, in particular affected communities, are aware of their rights and entitlements and of
Page | 39

measures of redress. This will promote peaceful dispute resolution and promote the fact that the government
is implementing an equitable reconstruction program.
Maintain social and environmental safeguards.
While the reconstruction program calls for accelerated implementation, social and environmental safeguards
need to be maintained. This will require social and environmental review and approval procedures to be
adjusted in view of the nature and urgency of the reconstruction program and at the same time
development/acquisition of additional capacities to undertake these reviews and implement and monitor
safeguard plans and their implementation.
Focusing on results
Monitoring and Evaluation (M&E) systems already exist at the provincial and federal level for public sector
programs. However reconstruction programs, due to their urgency and multiplicity of donors, require real
time segregated information. Internal and external M&E of reconstruction implementation will have to be
integrated with existing systems to address the information and monitoring needs resulting from the flood
response. The focus of monitoring should be on the process and results, in addition to the regular inputs and
outputs monitoring and has to be implemented both at federal (NDMA) and provincial levels.
Flexible implementation modalities for external reconstruction partners
To maximize mobilization of external resources, external partners should be given the opportunity to support
the reconstruction program based on their strengths and capacities but in conformity with the overall
reconstruction needs, policies and strategies. While required to follow government policy and encouraged to
adopt government delivery and on-budget systems, external partners should be offered the possibility to
provide reconstruction support through in-kind or direct implementation. A dedicated unit with NDMA
should be the first point of contact for external off-budget donorssupported by the respective federal or
provincial agency responsible for implementation, and to keep track of all external resources to ensure their
efficient use within the overall reconstruction context.
Outline Institutional Structure
Based on the guiding principles and taking into account the federal level institutional set-up and the mandates
of the various institutions to be involved, the following outline institutional structure may be considered for
flood reconstruction.
The Council of Common Interest (CCI) may provide the highest level of policy guidance to the federal and
provincial/regional governments. The CCI could ensure the equitable allocation of reconstruction resources
among the provinces and the regions, and resolve interprovincial issues related to reconstruction policy and
implementation.
The independent oversight body should be established for the reconstruction program with representation
from partners organization, donors, civil society and academia, that accompanies the reconstruction process
and reviews and reports regularly on the it progress, outcomes, and impacts to the general public, donors,
parliament and CCI. A donor coordination group led by the government may also be established to review
Page | 40

reconstruction implementation, discuss overall reconstruction policy and strategy aspects, resolve common
issues faced by off-budget partners and assist in mobilizing additional external resources, if needed.
At federal level
Existing or devolved approval forums can be responsible for review of all on-budget reconstruction
programs. As a large number of such programs are expected to be submitted during the initial phase,
additional dedicated capacity may need to be established within these institutions to fast-track the review
process during this phase, as was done after the 2005 earthquake. The approval forums if it is not devolved
to NDMA, would need to co-opt a member from the NDMA to ensure that disaster risk reduction (DRR)
considerations are incorporated in the design of reconstruction programs, where appropriate. The
Government may consider establishing a subcommittee exclusively for the reconstruction program which
could have the delegated authority to approve reconstruction programs during the initial phase. The
Government may also consider raising the approval authority of provincial/regional governments for
reconstruction programs to fast-track the approval process, including simplification of the PC-I format for
reconstruction and using umbrella PC-I’s. The relevant ministries of the government will have to ensure that
reconstruction is accorded high priority during the annual budget preparation process and the timely release
of adequate counterpart funds during the course of the financial year in line with annual reconstruction work
programs. Similarly additional resources may have to be provided in existing miniseries responsible for
negotiating and concluding grant and loan agreements for reconstruction programs with external on-budget
partners, to ensure timely availability of donor funding.
The overall coordination of reconstruction programs and projects should ideally be done through the NDMA
at the federal level, based on current mandates. The NDMA should coordinate all off-budget and on-budget
reconstruction programs and would be the first point of contact for all the external on- and off-budget
partners. It would also act as the Secretariat for the CCI, the oversight body and the Donor Coordination
Group. The NDMA would need to establish a database of all on- and off-budget programs. This will ensure
synergy and complementarily between the two types of programs and the equitable allocation of overall
reconstruction resources among provinces/ regions and among sectors. The NDMA would monitor overall
reconstruction implementation (on- and off-budget) and provide regular progress overview reports to
oversight agencies like the CCI, the oversight body, the Government’s reconstruction partners and the public
at large. For this purpose, the NDMA may need to establish a comprehensive M&E system in partnership
with the respective counterpart agencies at provincial/regional level (provincial and regional disaster
management authorities), complementing the existing M&E systems at federal/provincial/regional level.
The NDMA at the federal level could also assist in: (i) the formulation of reconstruction policies, strategies
and standards, and (ii) the development/simplification of fast-track procedures for project approval, public
sector financial management and procurement, in collaboration with the respective agencies mandated for
approval of these activities by the Government (iii) supporting government and reconstruction partners in
addressing challenges and bottlenecks. The NDMA may have to be strengthened for duration of the
reconstruction program to undertake its reconstruction coordination, reporting, policy and M&E functions.
The Auditor General can be responsible for the audit of all on-budget programs as the external auditor in
conformity with the International Standards of Auditing. Given the size of the reconstruction program and
the number of agencies that are likely to be involved, the AG may need to engage reputable private auditors
to carry out the external audits on its behalf and also establish a dedicated unit for this within.
Page | 41

A number of federal authorities may be responsible for the implementation of reconstruction programs that
fall under their respective mandates. These authorities include, among others, the National Highway
Authority (NHA) and the Water and Power Development Authority (WAPDA).
At provincial/ regional level
The institutional structure proposed here recognizes the lead role of the provincial and regional governments
in reconstruction implementation based on the umbrella reconstruction policies and strategies issued by the
federal government.
Each of the provincial/regional governments may establish a Reconstruction Committee to provide overall
guidance and oversight at the provincial/regional level for the implementation of on-budget reconstruction
programs. The Committee may include: (i) the Chief Minister (Chair), (ii) an opposition Member of the
Provincial Assembly, and (iii) the Secretaries of the departments involved in reconstruction implementation.
A Provincial/Regional Government-Donor Coordination Group may also be established to serve as a forum
to coordinate the implementation of on- and off-budget reconstruction programs. The group can include
representatives of the Planning and Development Departments (P&DDs), Provincial/Regional Disaster
Management Authorities and other relevant departments, NDMA and reconstruction partners with major
programs in the province/region.
Considering their mandates, the respective P&DDs or provincial disaster management authorities (PDMA)
can be, responsible for coordination of reconstruction implementation. It will ensure compliance with
reconstruction policies and strategies across the various sectors. The P&DD or PDMA, as the case may be in
a respective province, can also ensure that fast-track procedures will be operationalized for reconstruction
implementation, synergies with ongoing development programs and policies and provide support in
addressing challenges and bottlenecks.
As most provinces may not afforat to keep permanent staff on lon tern basis, this can be achieved by
establishing a dedicated purpose built Reconstruction Unit within the coordinating agency at the provincial
level that will be the focal point for reconstruction planning and coordination, and M&E, with co-opted
representatives from NDMAs. The unit can act as the clearing house for reconstruction programs to be
approved at Federal or the Provincial level. The Unit can also facilitate the participation of off-budget
partners in reconstruction implementation provincially/regionally.
The existing provincial forums may also be used to approve the reconstruction projects submitted by the
provincial departments or some function may be delegated to the coordination body to fast track approval.. A
representative of the NDMA can be co-opted in the approval forum at the provincial level to increase
coordination and improve synergies. With regard to federally transferred funds, the provinces may be
delegated the authority to approve projects up to a threshold to be determined by the Government1,
including the possibility of unlimited delegated authority to approve sub-projects under umbrella PC-Is
approved at the federal level.
Line Departments can then be responsible for the preparation of reconstruction projects in their respective
sectors and implementation of these following their approval. Line Departments with a large reconstruction
program may need to establish a dedicated reconstruction unit. Reconstruction implementation may need to
be outsourced where departments lack the required resources.
1 The PDWP has the authority to approve projects of unlimited amounts from the provincial funds.
Page | 42

The District Offices may also be involved in small-scale local level reconstruction programs. They could also
facilitate the implementation of off-budget reconstruction programs through a district-level coordination forum
if required.
Monitoring & Evaluation (M&E) System
The demand for urgency, transparency and the need to be able to respond to the dynamic situation on the
ground, as the flood response develops, requires an effective M&E system in place at the outset. Monitoring is
challenged by dispersed implementation across a range of sectors and the diverse information needs of multiple
partner, donors, decision makers, general public, affected population and implementation agencies.
The Project Monitoring & Evaluation System (PMES) currently used at the federal Planning Commission
captures the Public Sector Development Program (PSDP) funded projects by the federation only – its basic
point of reference is the PC-I and the annual plans. It is mainly used to monitor physical progress and fund
allocation and use. It does not currently offer adequate connectivity to the provincial PSDP or donor funding.
It is a web based program for which access is being slowly extended to all federal line ministries. The
provincial M&E systems independent of the PMES also use PC-I as a point of reference in their design.
However the quality, extent and operation of these systems vary substantially between the two provinces.
Almost all these systems are outside the public domain, and are not designed to capture any activity outside the
PC-I. No qualitative data is being captured by these systems although some pilot work is ongoing under PMES.
The only M&E system that has extended its boundaries to include multiple sources of funding, diverse
information needs of multiple stakeholders and provides information to the general public has been designed
by the Government of Punjab (GoPb).
M&E system for the flood reconstruction
Reconstruction activities have special M&E needs that are not necessarily aligned with PMES. The
reconstruction programs are expected to be financed both on- and off-budget, by multiple sources of funds
provided by multiple donors. There are reconstruction programs that are not PC-I based such as in housing
and cash grants, and many others where in-kind support is being extended such as in agriculture and livestock.
In addition an M&E system supported by a Management Information System (MIS) in reconstruction
programs also needs to provide information to coordinate the reconstruction activities between multiple
agencies and for efficient decision making. Similarly reconstruction information and reporting has to be
efficient to facilitate delivery in short timeframes; this requires multiple access and control of the systems.
It is important that reconstruction requirements do not undermine but supplement and strengthen existing
M&E systems, without overloading them with activities that may not go beyond the reconstruction phase.
Based on these consideration the Government may consider a two-pronged strategy for M&E: a) strengthening
PMES, by consolidating existing requirement and adding modules that are common to reconstruction and the
future needs of the system; and b) develop an M&E/MIS capturing the reconstruction requirements not served
by existing and future needs of the PMES, with a well developed interface in case of future disasters. has to
take account of these limitations. The recommended approach is to start with a basic system, and build this up
incrementally once it starts operating.
Page | 43

The M&E system for reconstruction may be developed at the NDMA in close coordination with the planning
commission. Implementation would take place at different levels, for which additional capacities and training
would have to be provided at the relevant levels of the provinces, districts and off-budget donors to operate
such a system.
Page | 44

CHAPTER 6
Social Considerations
Social Impact (Sindh and Balochistan)
The UN1 reported that 2.5 million children and 1.2 million women were affected by the floods in 2011, while
744,000 people were dislocated. With 46% of health facilities damaged, the vulnerabilities of women and
children have increased in the affected areas. The children who are pushed out of schools are over 733,000
where 60% schools are damaged in Sindh alone. Acute Respiratory Infections (ARI) and skin infections
represent major health risks in flood affected areas2. Women are at high risk due to disruption in the
provision of pre and post natal care.
Migration has taken place largely due to unavailability of fodder in flood affected areas. Approximately, 10-
15% of the affected population is engaged in non-farm livelihoods, including fisheries which are severely
affected by the rains.
Loss of Assets and Livelihoods
Large-scale destruction of schools is affecting the education of more than 733,000 children with 60% children
out of school due to damaged facilities and absence of teachers.
In Shaheed Benazirabad district 75% population depends on agriculture. Cotton is the major crop and
cultivated in 60% land followed by sugar cane and banana. The first cotton crop, which was ready for picking,
was not picked due to the month of fasting. The rain fall intensified on 26 August and the first harvest was
lost. More than 70% of the cotton crop was damaged, 40 – 45% of the sugarcane crop was damaged, banana
orchards were totally or partially damaged in 40% of the affected area and mango and lemon orchards were
completely damaged (CD)3. Land degradation has intensified and production decreased. Crime is increasing in
the affected area exacerbating the vulnerability of the women and children4.
The social impact can be gauged by the decrease in income due to land degradation and temporary
interruption in use of land, agricultural unemployment, and lack of alternatives outside agriculture. Field visits
to Benazirabad indicated the crime rate increased. Some internal migration has been noticed e.g. most of the
Sanghar populations were migrants from Tharparkar. Now due to heavy rains and less availability of dry land,
many families have migrated back to Tharparkar. There are no implementing partners for nutritional
intervention in Tharparkar5. Generally, the relief goods influx has created a dependency mindset and people
have no guidance for the future.
1 UN, Pakistan Floods 2011 Early Recovery Framework,January 2012
2 OCHA Situation Report No.7, October 2011 3 DCO, Shahid Benazirabad, Verbal communication 4 DNA team field visit, verbal communication local government and CSOs, November 2011 5 UNOCHA Pakistan Monsoon 2011:Situation Report No. 8 14October 2011
Page | 45

Page | 46
Catastrophic events that impact on basic human needs disproportionately affect the most vulnerable groups;
children, minority groups, the elderly, the landless tenants, people with special needs and women’s
vulnerability also increases. Existing vulnerabilities are exacerbated, and new vulnerabilities emerge as some
who were previously economic secure are now unable to meet their daily needs. Flooding in summer means
people face additional hardship as winter approaches. In Pakistan, 8 percent of households with children that
were hit by income shocks took their children out of school and 10 percent of households had to put their
child to work.1 Sindh and Balochistan have low social development indicators, landlessness in Sindh is high,
and people have few assets and limited ability to deal with shock. Research is essential to understand how
households cope, track their progress and provide relevant support where needed.
The 2011 floods added to vulnerabilities of marginalized communities; Balochistan stands out as the province
with the weakest social development2. The latest PSLM (2010) social indicators show that both Sindh and
Balochistan are below national averages on Primary Net Enrollment Rate (NER) and Middle NER3. Sindh is
somehow better than the national average for literacy whereas Balochistan stands below the national average.
Health practices in Sindh and Balochistan in terms of full immunization and Tetanus Toxoid are below the
national average. Both Sindh and Balochistan have low access to safe drinking water whereas less than 45%
population is provided with piped drinking water.4 Sanitation practices in terms of HHs using flush type toilet
are somewhat more encouraging in the case of Sindh as compared to Balochistan. The 2011 floods are
expected to add high pressure on almost 50.07%5affected HHs of Balochistan and on some 39.44% of Sindh,
based on indicative figures in 2011 PSLM.
There is likely to be an acute shortage of onion, chilies, tomato and other vegetables during winter6. Rice, a
key staple has also been badly damaged. It would seriously affect food security and availability of seeds in the
next season. Small farmers will lose contracts to cultivate in the coming season due to loss of bulls. Many on-
farm and off-farm jobs will be lost in cotton farms due to loss of cotton related subsidy. Loss of the cotton
cropwould also lead to loss of jobs for women cotton pickers7. In Sindh, specifically in Benazirabad, land
ownership pattern is self cultivation by small land holders, daily wagers, part and quarter time tenants. It is
most likely that low crop productivity will severely affect both tenant groups. Moreover, the recent floods has
increased land salinity and added to land degradation. This not only turns out to be long term assets loss but
also affects crop productivity. The small farmers are already under heavy debt and are unable to get new loans
due to the absence of collateral.
Guidelines for public private partnership under new institutional, legal and regulatory framework require that
all public project proposals should assess impact on women and explore employment opportunities for them
and deliver benefits to both men and women8. However, the UN flood response report mentioned increased
1 ibid 2 Balochistan Economic Report; From Periphery to Core (Volume II): Full Report, May 2008, (World Bank Report No. 40345-PK) 3 Pakistan Social and Living Standards Measurement Survey (PSLM), 2010-11 Statistics Division, Government of Pakistan, Islamabad, September, 2011 4 ibid 5 ibid 6 FAO, SUPARCO PAKISTAN RAIN/FLOOD 2011 September 24) 7 FAO Preliminary Flood Damage: An Inside View September 2011 8 ADB Fact sheet 31 December 2010
Impact on Vulnerable Groups

risk of possible sexual and physical abuse, child abuse, child labor, bonded labor, trafficking, honor killing and
forced marriages among the affected population1.
Impact on Food Security
FAO2 damage assessment highlights possible acute shortage of onion, chilies, tomato and other vegetables
during winter. The long term storable food including rice has been badly damaged and will lead to seeds and
grains shortage adding concerns for food security. In Balochistan the populations living in hilly areas of
affected districts had been able to secure some stocks for a few months but as soon as the stocks deplete,
these HHs will be badly affected. Farming households are directly affected by floods whereas non-agriculture
based households will be badly affected by price increase and low supplies from local producers. The long
lasting drought in Balochistan (1998-2005) had already stressed food security, the 2011 flood is expected to
create short-term insecurities but over the long term, land fertility is expected to increase as the water recedes.
However, even with this opportunistic note the livestock (major source of meat and milk) is at risk due to the
acute shortage of fodder. Food insecurity is emerging as a critical issue, caused by many aligned social and
economic damages.
Impact on Assets Ownership
In many cases whole livestock assets have been lost. The productivity of remaining livestock has been
reduced to 50%3. Discussions with local relief organizations confirmed that generally savings are kept in the
form of cash and livestock. The affected population has lost savings, including both livestock and cash which
could provide a cushion against inflation. Now people are very uncertain and tend to grab as many relief
goods as they can. They tend to accumulate enough resources for next six months and are showing low
interest in work.
Impact on Access to Services
The UN Report on flood response 2011, noted lack of access and discrimination in distribution of relief and
early recovery assistance to minorities, women, children, landless, non ID-card holders, Afghan refugees,
older persons and persons with disabilities. The report also pointed out inter-communal tension and violence,
land and property disputes, lack of access to legal redress mechanisms and cases of family separation and
unaccompanied children4. In some areas of lower Sindh where people did not move out of houses after the
floods, delivery of assistance was hampered due to the large amount of stagnant water surrounding the
villages. Lack of pipeline information from other humanitarian organizations engaged in flood response limits
the ability to accurately forecast assistance needs5.
Sanitation and water supply are among the most critical problems requiring the attention of aid providers to
alleviate poverty and reduce the suffering of flood affected families6.The main source of water in many
affected districts is open rain water ponds and biologically and chemically contaminated canal water7. Out of
1 United Nations Pakistan Floods: One year On Islamabad, 2011 2 FAO Preliminary Flood Damage: An Inside View September 2011 3 FAO Preliminary Flood Damage: An Inside View September 2011 4 United Nations Pakistan Floods: One year On, Islamabad, 2011 5 UNOCHA Pakistan Monsoon 2011: Situation Report No. 8 14October 2011 6 Oxfam 2011 7 UNOCHA, Pakistan Humanitarian Bulletin 29 September 2011
Page | 47

326 water sources tested by WHO in Sindh, 86% were found contaminated and 80% of all the diseases were
found to be water borne diseases1.
Loss of livestock, crop lands, and extensive damage to the country’s infrastructure, are projected to have
long-term negative effects on Pakistan’s food security and economic performance. It is estimated that the cost
of rehabilitation of the flood-affected population (relief and recovery) and reconstruction of damaged
infrastructure in different parts of the country could be in the range of $4billion. According to a former
Finance Minister and Ex-Senior Vice President of the World Bank, “The government’s prediction that GDP
in 2011-12 would increase by 4.1 percent now seems extremely optimistic. Given some of the shocks the
economy has received in the last few days, it appears that the national product will not increase by more than
2.5 to 2.8 percent this year”2.
It is essential that Government adopts a rights-based development approach to reconstruction. Sind has been
hit twice, although not all districts were affected twice, the overall impact on the people should not be
addressed through limited relief and recovery support.
The challenge lies in looking beyond relief, beyond restoration to improving lives and providing opportunities
for safe and secure lives. Failure to redress existing structural inequalities means many affected people risk
falling into chronic poverty and will not have an opportunity to lead a dignified life.
Gender Impact
Disasters are not gender neutral. However, gender-differentiated outcomes of a disaster seldom occupy
critical and central spaces in public policy. Men and women have different priorities and should be
differentially engaged in the reconstruction process. However, recognition of the effects and outcomes of
flood 2011 on the lives of female-headed households, ethnic minorities and women and girls in general would
remain a challenge, as gender is not a priority in actual practice. Additionally, lack of data precludes a
comparative analysis of borrowing and debt amongst women and men separately, and it is impossible to
discern in a sectoral approach how the destruction of irrigation canals, environment, or railway links, causes
losses to men and women separately. There was no gender and income based disaggregated data available to
target the most vulnerable groups for assistance. Data provided by the Multi Cluster Risk Analysis (MCRA) is
based on sample survey and cannot be used in identifying and reaching out to most vulnerable groups3.
Lack of availability of female hygiene kits, undergarments, emergency lights and separate toilet and bathing
facilities for women and girls exacerbate their vulnerability.4Women are more vulnerable to food insecurity
especially in terms of nutritional needs. While standing water and flooding posed health risks for all but
specifically for pregnant and lactating women. The field visit reports of various NGOs reveal that women’s
workload and responsibilities have increased many folds, women and the elderly face difficulties in acquisition
of relief goods.
While looking at the institutional arrangements within public and donor sectors, NDMA has established a
“Gender and Child Cell” which has begun a consultative process at the federal and provincial levels to
1 World Health Organization Environmental Health Response to Sindh Floods 16 October, 2011 2 Shakil Ahmad, The Nation, September 20, 2011 3 UN Women , ADB, World Bank, CSO , Workshop, November 1, 2011 4 UNOCHA Pakistan Monsoon 2011:Situation Report No. 8 14October 2011
Page | 48

policy making, public spending and project implementation. Gender is officially included in the vision and
mandated objectives of all UN agencies, INGOs and key NGOs that are participating in disaster risk
reduction and reconstruction for flood 2011. However, it has been observed that gender analysis is not
prioritized or a sustained practice. Each sector has its own dynamics and integration of gender in an
individual sector demands a deeper understanding of the issues through a gender lens.
The aftermath of the floods 2011, similar to the 2010 floods, provides an opportunity to transform the basic
inequalities, poor governance and social injustices, which laid the groundwork for such destruction. The scale
of the disaster creates an opportunity to revisit the policy tools and institutional arrangements. The disaster
highlighted the profile of specific vulnerabilities, such as gender and social exclusion, which provide
government and civil society with a unique opportunity to address the root causes of gender inequity and
social exclusion.
Aid Effectiveness, Governance, Social Accountability and Grievance Redressal
While immediate support and humanitarian relief is essential, equally important is the GoP’s stated
commitment to development. Pakistan’s continuing exposure to disaster with poor development indicators
demands a longer term commitment by the state: to deliver basic human needs and development and not a
return to pre-flood or pre-recovery standards.
The effective delivery of support and services requires sound baseline information. Disaggregated
information on households and at the individual level should be available from the tehsil to the province.
Information crucial to provide targeted support and to enable speedy identification of people requiring
special attention should be known before the disaster hits.
The destruction caused by the recent floods created and exacerbated serious governance issues both within
the public sector and for the affected population at large. It is evident that direct damages while substantial
are not a major impediment for sector recovery and reconstruction. The indirect losses and strains on systems
are more important and need to be addressed. Broadly speaking: (a) capacity to govern reconstruction has
diminished and been exacerbated by the floods; (b) flood affected population's entitlements are at risk and (c)
the provinces are also strained due to worsening law and order1. Social unrest is already on the increase and
will complicate the reconstruction efforts. Support for law enforcement will be vital.
Aid must be better coordinated, focused and systematic. Information shared with the DNA team indicates
overlapping tasks by different agencies working in isolation and gaps in adequately address needs. A supply
driven approach fails to respond to local needs and coverage.
Humanitarian relief, recovery and reconstruction are a continuum toward development. While agency funding
requirements are separated and bound by policy and financing decisions, suffering and deprivation resulting
from disasters and exacerbated by pre-existing inequalities, do not fit neatly into compartmentalized boxes.
Post-flood reconstruction will require assessment of households requiring longer term support to return to
improved, secure lives. Vulnerable groups require special attention. Shelter linked to property rights,
nutrition, food security and livelihoods require urgent, long term support. The provision of basic human
needs with opportunities for improved and secure lives must be ensured. It is essential that reconstruction
1 DNA , Governance Report, 2010
Page | 49

efforts are designed with sensitivity to household needs. Government must lead efforts to immediately
establish dedicated, trained personnel at village level and DDMAs to identify and support households,
manage grievance, monitor and report on reconstruction efforts. NDMA and PDMAs play a critical role in
establishing standards, oversight, transparency and securing support for focused, longer-term development
efforts.
Page | 50

CHAPTER 7
Environmental Considerations
The floods have caused wide-ranging damage to different sectors of the national economy. The
reconstruction and recovery needs are diverse and multi-faceted as elaborated in this DNA, and work has to
be undertaken on an urgent basis. However, these reconstruction and recovery interventions, particularly
those related to irrigation, agriculture, transport, health, education, housing, and WATSAN are likely to cause
negative environmental and social impacts. In order to ensure the sustainability of the reconstruction and
recovery process, redressal of these negative environmental and social impacts has to be made an integral part
of all sectoral plans.
The national environmental legislation (PEPA 1997), as well as the International Financial Institutions' (IFIs)
safeguards require that environmental and social assessments are carried out and management
plans/frameworks are prepared prior to undertaking the interventions such as those recommended in the
floods DNA. However, details of the specific activities associated with the individual reconstruction and
recovery plans in the majority of sectors are not currently known, hence the potentially adverse
environmental and social impacts of these activities cannot be identified. Instead, it is proposed that a broad
Environmental and Social Screening and Assessment Framework (ESSAF) be prepared for the overall
reconstruction and recovery needs.
The ESSAF will define the environmental and social screening and assessment requirements of individual
projects or interventions, and will guide the implementing agencies in identifying the appropriate type and
level of environmental and social assessment to be carried out prior to undertaking each project or
intervention - in compliance with national as well as IFIs' safeguard requirements. The ESSAF will also define
the requirements for preparing appropriate environmental and social documents, and obtaining
approvals/clearances of these documents from the relevant agencies.
To ensure implementation of ESSAF, it is further proposed that each line agency appoints an environmental
and social focal person within the department.
Page | 51

CHAPTER 8
Disaster Risk Management
Pakistan Disaster Risk Profile
Pakistan is increasingly facing hydro-meteorological and seismic disasters. After the massive earthquake that
hit the northern parts of the country resulting in the death of more than 73,000 people, it has been affected
by cyclones, floods and earthquakes of varying intensities. The flood of 2010 affected more than 20 million
people across the country. Heavy monsoon rains from August 10 to September 14, 2011 triggered heavy
flooding in Sindh and Balochistan resulting in inundation of vast areas, causing widespread damages to the
lives and livelihoods of the affected as well as infrastructure. Sindh and Balochistan, due to their geographic
location and diverse topography continue to be at risk from various disasters such as earthquakes and floods,
which may occur with greater frequency due to shifting climatic patterns.
Lessons Learnt From Flood Response 2011
Lessons learnt include: (a) Contingency planning exercises at the provincial level need to be multi-hazard and
multiple-scenario based to allow flexibility in preparing for a wide range of disaster situations; (b) There is a
need for an integrated early warning communication and response system to enable the PDMAs to receive
information and take timely actions; (c) There is a need to study the role of infrastructure such as reservoirs
and water channels in mitigating the impacts of future disasters and assimilate the findings and related
mitigation actions in existing response plans.
Shift in Climatic Patterns
Pakistan is experiencing a shift in the climatic weather patterns that caused monsoon rains to shift more
towards the western parts of the country in 2010 and to the southern half of the country in 2011. This year,
southern parts of the country including some desert areas received heavy rains over a prolonged period of
time resulting in inundation and floods. There is a need to study the longer term implications and assess the
trends in these shifts for predicting future events allowing for better planning in such eventualities.
Evolution of DRM at the Provincial Level:
System evolution and description
Before the establishment of the NDMA in 2006, DRM in the country mainly revolved around disaster
response. The Emergency Relief Cell used to function under the Cabinet Division at the Federal Level while
at the Provincial Level, the Senior Member of the Board of Revenue used to act as the Relief Commissioner
for the province. The application of the NDM Act 2010 envisages the replication of the DRM institutional
structure from the federal to the provincial level. The Provincial Disaster Management Commission (PDMC)
is chaired by the Chief Minister while the Provincial Disaster Management Authority (PDMA) is the main
executive arm of the PDMC. PDMAs have been established in all provinces of the country.
Page | 52

Forecasting and climate change research
PDMA Balochistan was initially an attached department to the Board of Revenue, Government of
Balochistan. However at a later stage PDMA Balochistan was notified as an independent organization with
administrative and financial autonomy. PDMA Sindh was established, and continues to function, as an
authority under the Rehabilitation Department, Government of Sindh. Furthermore, the Secretary
Rehabilitation is the ex-officio Director General of PDMA Sindh. In addition to the PDMAs, there are a
number of entities responsible for disaster management including the Revenue Department, Civil Defence,
Provincial Irrigation Departments, etc. The entrustment of DRM responsibility to the provinces has
exacerbated the challenges faced by the PDMA’s in terms of capacity, preparedness and effective response.
District level DRM mechanisms existing and their capacities
District level DRM responsibilities rest with the District Disaster Management Authority (DDMA) which is
headed by the District Coordination Officer (DCO) as per the NDM Act 2010. Although DDMAs have been
notified in almost all of the districts in Sindh and Balochistan, they lack the capacity in terms of trained
manpower and equipment to assist the DCO in fulfilling his responsibilities as the head of the DDMA.
DRM Strategy and Recommendations
Policy and institutional
There is a need to update the existing DRM Strategy / Policy in order to reflect the inter-departmental and
Federal-Provincial relationship especially in the context of the 18th Amendment. PDMAs require support in
establishing their structures in line the global best practices, to strengthen the provincial emergency
operations centers and to prepare SOPs for dealing with various situations. PDMAs also need to be provided
with an integrated GIS based MIS and Early Warning and Incident Response System (EWIRS) with linkages
to all the concerned departments to enable better preparedness and coordinating response to disasters and
emergency situations. The capacity to undertake Needs Assessments for future disasters also needs to be
strengthened.
Risk identification and mitigation measures
It is important to identify the overall risk environment for Sindh and Balochistan through collation of existing
information, identification of gaps and additional mapping exercises. While conducting multi-hazard mapping
activities, the Government should ensure that a common platform is utilizedso that all information can easily
be integrated possibly using GIS enabled MIS. Mitigation measures including assessment, improvement in
existing multi-hazard early warning systems, contingency planning and the role of major infrastructure in
mitigating the impacts of disasters, need to be studied and put into place.
Risk transfer and sharing
There is a need for developing a country catastrophe risk financing strategy that could allow for risk sharing
with the private sector to avoid heavy reliance on donor funding as well as reallocation of public development
funds towards response. The government should initiate a dialogue, especially with the Ministry of Finance
and the Securities and Exchange Commission of Pakistan, on the development of a catastrophe insurance
market through catastrophe insurance pools.
Page | 53

Forecasting and climate change research
The capacity of the PMD to predict extreme weather events which result in disasters should be enhanced.
There is a need to study the impacts of climate change on the weather patterns in Pakistan in order to be
included in long term DRM planning and be better prepared for future anomalies. The Government
commissioned National Task Force Report on Climate Change and its recommendations need to be translated
into action with the Provinces taking the lead in implementation and follow up actions / feasibility studies.
Page | 54

CHAPTER 9
Guiding Principles
The experience of implementing the reconstruction program following the devastating 2005 earthquake in
Pakistan holds important lessons on how to implement a large-scale reconstruction program. Experiences of
recent large-scale post-disaster reconstruction programs in other countries also offer several relevant lessons.
Though the institutional arrangements for implementation of reconstruction programs inevitably vary across
countries, a core set of guiding principles has emerged from these experiences which should be considered
for the post-2011 flood reconstruction program. The following principles are the most relevant:
Coordinate centrally, implement locally
Central coordination with local implementation should be one of the key features of the institutional
framework to implement the reconstruction program. The majority of successful large-scale reconstruction
programs have carried out central coordination through a dedicated agency, like NDMA in the case of
Paksitan. In past reconstruction programs this has been considered critical for setting overall policies,
strategies and standards, especially in areas such as cash transfers, asset compensation, and housing
entitlements. In addition, a centrally coordinated mechanism is essential for effective coordination between
government agencies as well as engagement with international donors. In cases where many international
NGOs are implementing programs a central agency can ensure their efforts are consistent, coordinated and
targeted to meet needs and gaps in the program. It will allow the Government to set common standards for
all involved including the donor agencies. A central agency can also play a key role in helping to troubleshoot
and overcome obstacles in the reconstruction program and maintain a sense of urgency.
Within the broader context of central coordination, reconstruction should preferably be implemented at the
lowest competent tier of government to ensure that it is tailored to the local conditions. This also encourages
more rapid feedback loops from local communities to implementing agencies. Through this "subsidiarity"
principle, local ownership is strengthened and sustainability of reconstructed assets is better ensured.
Focus on poverty reduction and sustainable livelihoods
Ensure that the rehabilitation and reconstruction efforts are socially equitable with support targeted mainly to
those in greatest need. Special measures should be put in place to ensure that vulnerable groups living in the
flood affected areas, such as landless farmers, tenants, and those in riverine areas where property rights are
poorly defined, fully benefit from the support measures to be provided, through targeted outreach and
monitoring.
Support Government Institutions
Prior to the 2011 flood event, most government institutions were already struggling to fulfill their mandated
responsibilities. Many government institutions will therefore need support, in the form of additional capacity
or specific expertise, to implement their part of the reconstruction program. Support is also needed to deal
Page | 55

with the increased demand for interaction with local communities and for public information. This support
can be provided by mobilizing and redistributing expertise with the government or it can be provided in the
form of technical assistance from international and private sector partners.
Match greater flexibility and speed in Public Financial Management and Accountability (PFMA)
processes
The urgency of the reconstruction program calls for fast-track operations with streamlined, flexible
procedures and systems while increasing controls to address equally important concerns on anticorruption,
transparency and accountability. Although core fiduciary principles need to be applied, management,
planning, budgeting and project implementation need to follow a different sequence and modalities to be
effective, especially in the early phase of reconstruction implementation.
The influx of additional resources from multiple donors will require additional controls, not only to meet
enhanced stakeholder expectations but also to compensate for the additional strain on the PFMA systems.
This can best be achieved through independent oversight bodies, comprehensive M&E systems, enhanced
audit procedures, specialized complaints and grievance redressal mechanisms, and effective anti-corruption
penalties. To balance speed and accountability, some services such as procurement, accounting and auditing
could be outsourced. This would also address capacity constraints of the government institutions.
Many large-scale reconstruction programs have expedited ex-ante audit processes in favor of emphasis on ex-
post audit. This approach has been shown to increase the speed at which reconstruction can be delivered.
Channel funds into the hands of those with the strongest incentives to use them for the intended
purposes
In post-disaster contexts, this has generally translated into a strong preference, where appropriate, for
Community-Driven Development (CDD) implementation arrangements and transfer programs directly to
beneficiaries. Such arrangements not only help to disburse benefits to communities and individuals quickly,
but also make best use of individual incentives to ensure that funds are used for their intended purpose.
However, support mechanisms, preferably in collaboration with civil society organizations, may be required
to make this approach fully effective. Such support could focus on ensuring equitable distribution of
assistance at community level, integration of gender considerations in community decision-making, and
adherence to proper standards and processes.
Communicate, consult and manage expectations
Continuous communication and consultation with all stakeholders is essential for identifying needs and
managing expectations. Dedicated mechanisms need to be put in place for beneficiary feedback and grievance
redress. Regular consultations with the donor community will assist in addressing donor concerns, channeling
resources to address gaps, highlighting common issues and lessons, and seeking solutions to problems.
Regular communication with beneficiaries and donors is essential to manage expectations and to maintain
popular support.
Page | 56

Maximize credibility through an independent oversight board, third party monitoring and a
grievance redressal mechanism
An independent oversight board representing the interests of stakeholders is one of the most effective ways to
ensure accountability and transparency over reconstruction implementation. Independent systems for third
party monitoring, where possible in collaboration with civil society, will further enhance credibility.
Considering the scale of its program, a dedicated grievance redressal system is needed that complements the
existing mechanisms. Such a system would need to be operationalized at local (union, tehsil or at least district)
level. Cases that cannot be resolved through this mechanism can then be referred to the existing systems such
as the Ombudsman or to the courts. To overcome the difficulties in accessing and resolving issues through
these systems, in particular for vulnerable people, legal aid centers may need to be established.
Institutionalize urgency in Government and donor institutions
A constant theme spanning across the principles laid out above is the need for speed, flexibility, pro-activism,
responsiveness and openness. Maintaining the sense of urgency during the entire frame of reconstruction
implementation will be a challenge. Over time, the sense of urgency will tend to wane with the risk that a
business-as -usual attitude will take over. Hence the challenge of the recovery is to institutionalize urgency, i.e.
to embed the drive for extraordinary results into government and donor systems and practices. Setting a clear
time frame during which the institutional framework for reconstruction and its associated implementation
arrangements and fast-track procedures will be applied is important in this context, not only for the
Government but also the donors.
Page | 57
Annex 1: Disaster Risk Management

Introduction
Pakistan Disaster Risk Profile
Pakistan is increasingly facing hydro-meteorological and seismic disasters in the past few years. After the
massive earthquake that hit the northern parts of the country resulting in the death of more than 73,000
people, it has been affected by cyclones, floods and earthquakes of varying intensities. The flood of 2010
affected roughly one fifth of the country and more than 20 million people, and was termed as a disaster
greater than the 2004 tsunami, the 2005 Pakistan earthquake and the Haiti earthquake combined, by the
United Nations. As the provinces of Sindh and Balochistan were recovering from the impacts of the 2010
floods, heavy monsoon rains from August 10 to September 14, 2011 triggered heavy flooding resulting in
inundation of vast areas, causing widespread damages to the lives and livelihoods of the affectees as well as
the infrastructure. Sindh and Balochistan provinces, due to their geographic location and diverse topography
continue to be at risk from various disasters such as earthquakes, floods, cyclones and tsunamis some of
which may occur with greater frequency due to the shifting climatic patterns.
Event Description
While the floods of 2010 were due to excessive flows in the rivers due to more than normal monsoon rains in
the catchment areas, the occurrence this year is attributed to extraordinary monsoon rains in the Southern
parts of the country especially Sindh and Balochistan provinces which overwhelmed the absorption capacity
of the soil resulting in inundation of substantial areas in the affected districts.
Before the start of the monsoon season, the meteorological department had forecast 10% below normal
monsoon rains for Sindh and southern parts of the country. Even during the month of July, the monsoon
rains in Sindh and Balochistan were 72% and 36% less than normal respectively. However, Sindh received
heavy rains during the month of August which were 270% above normal and affected the entire Sindh
province. While the authorities had prepared flood contingency plans based on past experiences, particularly
based on floods in 2010, the sheer volume of the precipitation overwhelmed the provincial capacity. The
excessive amount of rains even exceeded the drainage capacity of the infrastructure such as the Left Bank
Outfall Drain (LBOD) which facilitated the drainage of the water to some extent but is not designed to
channel flood water.
Lessons Learnt From Flood Response 2011
· Contingency planning exercises at the provincial level need to be multi-hazard and multiple-scenario
based to allow the authorities flexibility to prepare for a wide range of disaster situations.
· There is a need for an integrated early warning communication and response system to enable the
PDMAs to receive information as well as to take timely implementable actions all along the early warning
chain down to the vulnerable communities.
· There is a need to study the role of infrastructure such as reservoirs and water channels in mitigating the
impacts of future disasters and assimilate the findings and related mitigation actions in existing response
plans.
Page | 59
Shift in climatic patterns
Pakistan is experiencing a shift in the climatic weather patterns that caused monsoon rains to shift more
towards the western parts of the country in 2010 and to the southern half of the country in 2011. As
mentioned by Pakistan Meteorological Department (PMD), the 2010 floods were caused by a phenomenon
termed as cloudburst in the northern parts of the country in which very heavy rainfalls are experienced in a
short time. However, this year, southern parts of the country including some desert areas received heavy rains
over a prolonged period of time resulting in inundation and floods. Thar Desert on an average receives hardly
70 mm rains in the period July-September, however, during this year’s monsoon, more than 500 mm rains
were recorded in the area during the same months. Similarly, Mithi an area on the outskirts of Thar Desert
received 1100 mm of rains during August-September which is almost ten times its average yearly rainfall.
This anomaly is attributed to a shift in the weather patterns mainly due to climate change. There is a need to
study the longer term implications and assess the trends in these shifts for predicting future events allowing
for better planning in such eventualities.
Existing Capacities
Brief overview of the institutions, legislation and policies relating to DRM at the national level
To provide the necessary policy, legal and institutional guidelines on Disaster Risk Management in Pakistan,
the National Disaster Management Ordinance (NDMO) was promulgated on December 21, 2006 which
required creation of the National Disaster Management Commission (NDMC) and establishment of the
National Disaster Management Authority (NDMA) as the lead agency at the federal level to coordinate
disaster response. The National Disaster Management (NDM) Act, 2010 succeeded the NDMO and provided
the necessary legislative cover to the DRM institutions as envisaged under the NDMO.
The National Disaster Risk Management Framework (NDRMF) was launched in March 2007 to provide
strategic guidance for DRR activities in the country. It also highlights priorities for a five-year period. It also
identifies roles and responsibilities of various stakeholders including Ministries, Departments, Technical
Agencies, Donors, NGOs and the UN Agencies. At the time of preparation of this report, formation of the
Ministry of Disaster Management has been announced which covers National Disaster Management
Authority, Pakistan Environmental Protection Council, Pakistan Environmental Protection Agency, Pakistan
Environmental Planning and Architectural Consultants Limited, Global Environmental Impact Study Centre
etc. However, the working arrangement at both the national and provincial levels is still not clear. This has
the potential to cause friction in inter-department functions if clear guidelines and policies on mandates and
roles of various stakeholders are not soon issued.
In spite of the NDM Act 2010 and NDRMF which serve as legal and strategic guidance documents as well as
provincial DRR plans in some provinces, the country lacks Disaster Risk Management policy that provides a
way forward for the government to bring together all the stakeholders involved in DRM.
Evolution of DRM at the provincial level in Sindh and Balochistan and current status, legal standing
and capacities
Before the establishment of the NDMA in 2006, DRM in the country mainly revolved around disaster
response. For this purpose, an Emergency Relief Cell used to function under the Cabinet Division at the
Federal Level while at the Provincial Level, the Senior Member of the Board of Revenue used to act as the
Page | 60

Relief Commissioner of the provincial government who would coordinate and direct relief activities in
response to disaster and emergency situations.
The NDM Act 2010 envisages the replication of the DRM institutional structure from the federal to the
provincial level. The Provincial Disaster Management Commission (PDMC) is chaired by the Chief Minister
while the Provincial Disaster Management Authority (PDMA) is the main executive arm of the PDMC.
PDMAs have been established in Punjab, Sindh, Khyber Pakhtunkhwa (KP), Balochistan, Federally
Administered Tribal Areas (FATA), the State of Azad Jammu and Kashmir (AJK) and Gilgit-Baltistan.
PDMA Balochistan was initially an attached department to the Board of Revenue, Government of
Balochistan. However at a later stage PDMA Balochistan was notified as an independent organization with
administrative and financial autonomy. PDMA Sindh was established, and continues to function, as an
authority under the Rehabilitation Department, Government of Sindh. Furthermore, the Secretary
Rehabilitation is the ex-officio Director General of PDMA Sindh.
In addition to the PDMAs, there are a number of entities responsible for disaster management which include
the Revenue Department, Civil Defence, Provincial Irrigation Departments, etc.
As a result of the enactment of the 18th constitutional amendment by Pakistan’s Parliament, the provinces
have been entrusted with DRM responsibility. The increased responsibility has exacerbated the existing
challenges faced by both PDMA Balochistan and Sindh in terms of capacity, preparedness and availability of
resources for effective response.
District level DRM mechanisms existing in the affected districts and their capacities
District level DRM responsibilities rest with the District Disaster Management Authority (DDMA) which is
headed by the District Coordination Officer (DCO) as per the NDM Act 2010. Although DDMAs have been
notified in almost all of the districts in Sindh and Balochistan, they lack the capacity in terms of trained
manpower and equipment to assist the DCO in fulfilling his responsibilities as the head of the DDMA.
Gaps and Challenges
Need for preparedness focus
In a country having suffered losses of more than US$ 14 billion over the last few years from natural and
manmade calamities, disaster risk management remains among the low priority issues both for the
government as well as the donors. Disaster situations in many countries have shown that low cost
investments in preparedness and mitigation yield significant dividends by reducing loss of lives and
livelihoods in time of disasters. Since 2005, Pakistan has been facing disasters at an increasing frequency
because of which the recovery phase of one disaster overlaps with the relief phase of the proceeding disaster.
This has contributed to the adoption of a “firefighting” approach by the authorities resulting in lack of focus
on the longer term aspects of DRM.
This is also true for PDMAs in Sindh and Balochistan that are relatively recently established and do not have
the capacity or the resources for undertaking preparedness and mitigation interventions in the provinces.
Similarly, district authorities are under an obligation to dedicate 1% of the total district budget towards DRM;
however there is little action in this regard.
Page | 61

Institutional/Legal
The existence of multiple legal frameworks including the National Calamities Act 1958 and Civil Defence Act
1952, NDM Act 2010 and Earthquake Reconstruction and Rehabilitation Authority Act 2011, Punjab
Emergency Services Act 2010, create ambiguity regarding DRM roles and responsibilities. There are a
number of entities dealing with DRM at the federal and provincial levels. At the federal level, NDMA has
been mandated to manage DRM under the NDM Act 2010. However, the Earthquake Reconstruction and
Rehabilitation Authority (ERRA) is also entrusted with some aspects of DRM having overlaps with the
mandate of NDMA. Similarly, other actors such as Pakistan Meteorological Department, Federal Flood
Commission, National Crisis Management Cell, Civil Defence Department to name a few are all working in
DRM. Similarly, there are a number of departments at the provincial level involved in different aspects of
DRM including the Revenue Department, Irrigation, Civil Defence etc. There is a level of coordination
between these entities but it usually is on “as required” basis. There is a need to institutionalize the
coordination mechanism with a single entity mandated and capacitated for overall coordination on DRM
interventions to avoid duplication and/or gaps.
Similarly, at the provincial level, PDMAs have been formed and their responsibilities highlighted in the NDM
Act. However, their relationship with NDMA as well as with other departments at the provincial levels needs
to be clearly defined to enable them to effectively perform their responsibilities both in preparedness as well
as response to disaster and emergency situations. Furthermore, in the aftermath of the passage of the 18th
amendment, the PDMAs would need to play a much more active role in DRM which requires elaboration of
their responsibilities as well as authorities in the rules of business to empower them to perform these
functions.
Capacity of PDMAs
Under the NDM Act, the PDMA have been given the mandate of DRM in the province. However, there are
some overlaps as well as gaps due to a number of entities working on different aspects of DRM. Additionally,
the relationship between the PDMAs and NDMA is also not clear resulting in coordination and
implementation shortfalls. There needs to be an overarching policy to outline all these issues and to
streamline the Federal-Provincial relationship especially in the context of the 18th Amendment.
The PDMAs lack an integrated GIS based MIS and incidence response system with linkages to all the
concerned departments to enable better preparedness as well as support in coordinating response to disasters
and emergency situations. The Emergency Operations Centers also are in need of strengthening to support
PDMAs in better coordination and information sharing in times of disasters.
Risk assessment
Although it has been more than five years since the establishment of NDMA, a comprehensive Hazard and
Vulnerability Risk Assessment is yet to be undertaken for the country. This means that there is an absence of
any baseline or risk profile for different areas of the country which is a major impediment to DRM planning
and identifying interventions. NDMA lacks the capacity to prepare multi hazard guidelines for various areas
and locations in line with the prevailing risks and does not have the authority to enforce these guidelines.
Page | 62

Similarly, for Sindh and Balochistan provinces, the respective PDMAs have yet to lead the process of
identification of the vulnerable areas through hazard and risk mapping, inundation profiles and digital
elevation models to inform future planning for similar disasters.
MER and R&D Capacity
The PDMAs lack the capacity to monitor DRM related activities being implemented in the provinces and do
not have the means of evaluating the impact of various interventions. They also lack dedicated Research and
Development capacity to learn from the experiences of other countries and to pilot innovative approaches
tailored to the disaster context of the province.
Catastrophe risk financing
Despite the frequency of natural disasters and manmade catastrophes affecting the country, little or no work
has been done in creating a catastrophe risk financing strategy or developing a catastrophe insurance market
in the private sector. The PDMAs need to lead identification of opportunities for investment in this
important area.
DRM Strategy and Recommendations
During the course of the assessment the DRM Sector team held consultations with a number of stakeholders
at the Federal and Provincial levels, which helped in informing policy recommendations by the team, as well
as with the identification of issues in the sector which need attention and intervention. The recommendations
on DRM policy and institutional development are based on an assessment of the state of current DRM
structures especially at the provincial and district levels in Sindh and Balochistan. Secondly, the lessons learnt
on disaster response and preparedness from the current flood event form the basis of improvements
suggested in respect of the existing disaster response and preparedness apparatus and dispensation.
Policy and institutional
· There is a need to update the existing DRM Strategy / Policy in order to reflect the inter-
departmental and Federal-Provincial relationship especially in the context of the 18 th Amendment.
· There is a need to support the PDMAs in establishing their structures in line with the global best
practices, to strengthen the provincial emergency operations centers and to prepare SOPs for dealing
with various situations.
· PDMAs need to be provided with an integrated GIS based MIS and Early Warning and Incident
Response System (EWIRS) with linkages to all the concerned departments to enable better
preparedness as well as support in coordinating response to disasters and emergency situations.
· Capacity of the PDMAs to undertake Needs Assessment exercise in the aftermath of future disasters
needs to be strengthened.
Page | 63
Risk identification and mitigation measures
· There is a need to undertake a risk assessment exercise in the vulnerable districts of Sindh and
Balochistan to identify the areas under risk of flash floods, inundation etc. For this purpose,
inundation profiles need to be prepared for the high risk areas along with digital elevation models to
enable the authorities to highlight the areas at risk and to prepare for future disasters of this kind.
The mapping obtained from this exercise needs to feed into the integrated MIS.
· Existing early warning systems at the provincial level need to be strengthened and improved to
enable timely warning and response. The system needs to be integrated with effective
communications and response capabilities in order to ensure completion of the early warning chain
down to the last mile i.e. communities at risk.
· Contingency plans at the provincial level needs to be strengthened and tested through drills and
simulations considering a wide range of disasters prevalent in the province.
· There is a need to study the role that major infrastructure can play in mitigating the impacts of
disasters in vulnerable areas of Sindh and Balochistan including reservoir management techniques
and water overflow drains / channels, particularly where risk of recurring floods are high and
communities are situated in such hazard prone locations.
Risk transfer and sharing
· There is a need for developing a country catastrophe risk financing strategy that could allow for risk
sharing with the private sector to avoid heavy reliance on donor funding as well as reallocation of
public development funds towards response.
· The government should initiate a dialogue on the development of a catastrophe insurance market
through catastrophe insurance pools. The Ministry of Finance and the Security Exchange
Commission of Pakistan would be key stakeholders in this dialogue with the Insurance Industry.
Forecasting and climate change research
· There is a need to enhance the capacity of the PMD to predict extreme weather events which result
in disasters such as floods. This is important as the contingency planning is primarily based on the
forecasts received from the PMD.
· There is a need to study the impacts of climate change on the weather patterns in Pakistan in order
to be better prepared for future anomalies. The findings and recommendations of these studies need
to be included in long term DRM planning to enable the country to be better prepared for future
disaster events.
· The Government commissioned National Task Force Report on Climate Change and its
recommendations need to be translated into action with the Provinces taking the lead in
implementation and follow up actions / feasibility studies
Page | 64
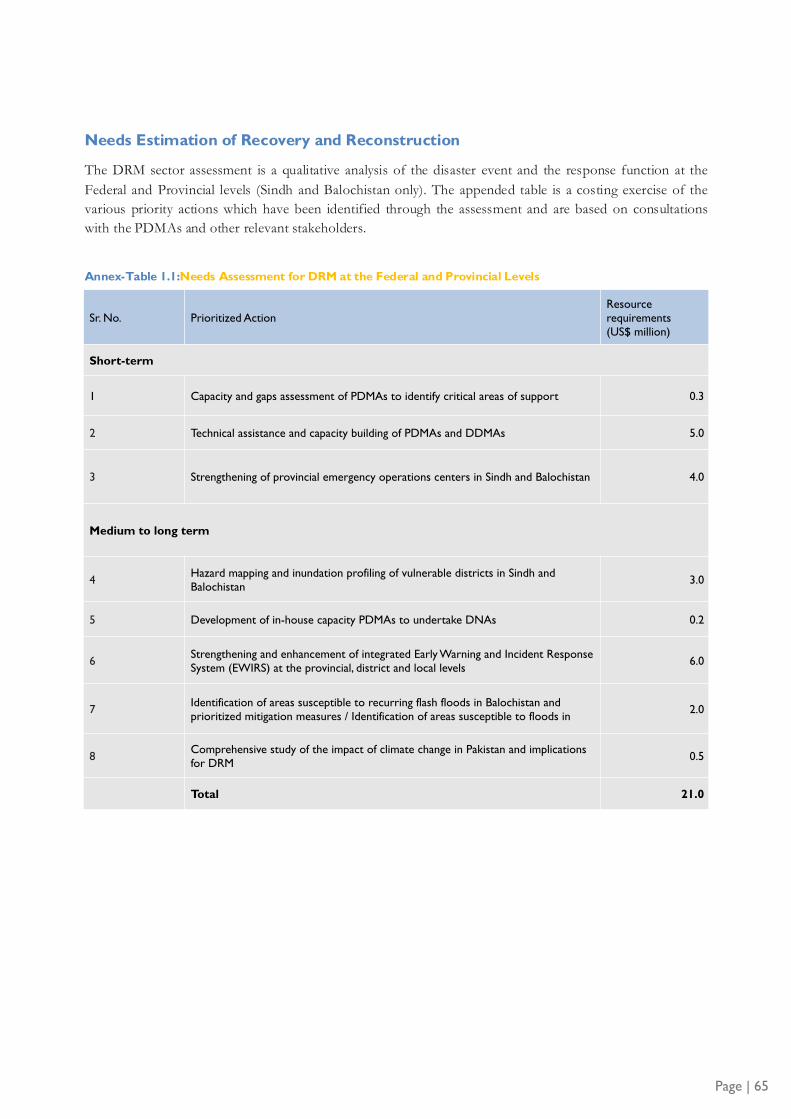
Needs Estimation of Recovery and Reconstruction
The DRM sector assessment is a qualitative analysis of the disaster event and the response function at the
Federal and Provincial levels (Sindh and Balochistan only). The appended table is a costing exercise of the
various priority actions which have been identified through the assessment and are based on consultations
with the PDMAs and other relevant stakeholders.
Annex-Table 1.1:Needs Assessment for DRM at the Federal and Provincial Levels
Sr. No. Prioritized ActionResource requirements (US$ million)
Short-term
1 Capacity and gaps assessment of PDMAs to identify critical areas of support 0.3
2 Technical assistance and capacity building of PDMAs and DDMAs 5.0
3 Strengthening of provincial emergency operations centers in Sindh and Balochistan 4.0
Medium to long term
4Hazard mapping and inundation profiling of vulnerable districts in Sindh and Balochistan
3.0
5 Development of in-house capacity PDMAs to undertake DNAs 0.2
6Strengthening and enhancement of integrated Early Warning and Incident Response System (EWIRS) at the provincial, district and local levels
6.0
7Identification of areas susceptible to recurring flash floods in Balochistan and prioritized mitigation measures / Identification of areas susceptible to floods in
2.0
8Comprehensive study of the impact of climate change in Pakistan and implications for DRM
0.5
Total 21.0
Page | 65

Annex 2: Economic Assessment

Introduction
Over the last six years, Pakistan endured a series of natural disasters. In October 2005, the northern part of
the country was devastated by a huge earthquake which took hundreds of thousands of lives and destroyed
the local economy. In September 2007, the southern two provinces of Sindh and Balochistan had to bear the
brunt of unseasonal cyclones. The damage was rather limited, however. In July-August 2010, the country
experienced the worst flooding of its sixty-three year old history with direct and indirect damages estimated at
US$ 10 billion (4.7 percent of GDP). Sindh was the worst affected province.1 While the international
community mobilized itself to assist the government in its reconstruction endeavors, the actual flow of donor
assistance was reduced as the government opted to seek mainly budgetary support to compensate the affected
households by providing grant financing.2 On the other hand, efforts by the federal, provincial and local
governments were largely successful in reducing the adverse impact of floods on the economy.
In August 2011, Sindh and Balochistan were severely affected by unseasonably heavy rains and flooding
again. While only five districts of Balochistan were affected, almost the entire rural economy of Sindh was
once again hit by floods. In economic terms, damages in Sindh from the 2011 floods are expected to be only
marginally lower than the 2010 disaster. The is attributed to the fact that the 2011 floods affected the
agricultural heartland of Sindh situated on the left bank of river Indus, causing extensive damage to cotton,
rice, sugarcane and chilies crops. Nationwide, however, the overall impact of the floods appear lower (1.6
percent of GDP) than in 2010.
Pre-Floods Economic Profile of Affected Districts
Balochistan
As mentioned above, in Balochistan, five districts were affected.3 These comprise only 9 percent of the
geographical area of the province. However, as three of the five districts affected by floods have the highest
population density after Quetta, total population of the flood affected districtsis home to almost one quarter
of the population of the province. Moreover, the affected districts contain Jaffarabad and Nasirabad, the two
biggest agricultural districts of the province. As such, the flood affected districts have 46 percent of the total
cropped area of the province and economic activity in the flood impacted districts is dominated by
agriculture. These districts provide a very large percentage of the province’s total production of some of the
major crops (Figure 2.1). In addition, these districts also produce about 20 percent of livestock products of
the province. It is therefore no surprise that bulk of the income produced in the flood-affected districts is
generated from agriculture, which contributes 40 percent to the total income of these districts. Social and
community services (26 percent) and commerce (18 percent) are other major contributors to income.
Whereas, industry contributes only 6 percent to the income of these districts (Figure 2.2).
1 By some estimates (State Bank of Pakistan, Annual Report 2011), these floods caused about 6.6 million of Pakistan’s
labor force to be out of work for 2 to 3 months, and capital stock worth US$ 2.6 billion (1.2 percent of GDP) was lost.
2 Nonetheless, IMF provided budgetary support of US$ 453 million under its Emergency National Disaster Assistance. 3 These include:Jaffarabad, Kalat, Killa Abdullah, Lasbela, and Nasirabad
Page | 67

Figure-Annex 2.1: Balochistan: Share of Affected Districts in Provincial Outputs of Various Crops
8%
23%
29%32% 34%
50%
85%90%
96% 98%100%
90%
80%
70%
60%
50%
40%
30%
20%
10%
0%
Fruits Vegetables OtherCrops
Spices Fodder Wheat Cotton Pulses Sugarcane Rice
Agriculture,40%
Manufacturing,1%Other
industries, 5%
Commerce,18%
Transport, 8%
Housing, 2%
Other Services,26%
Figure-Annex 2.2: Sources of Income Generation in Flood Affected Districts of Balochistan
Source: Development Statistics of Balochistan 2007.
Source: World Bank estimates of Gross Domestic Product (GDP) of the province and affected districts, 2011.
The affected districts of Balochistan generate a little less than one quarter (23 percent) of the total income
produced in the province. These districts contribute 38 percent of the total agricultural income of the
province; 31 percent on income generated in social and community services; 28 percent of income in
commerce and almost one quarter of Balochistan’s housing income. However, as Balochistan’s own
contribution towards national GDP is only about 5 percent, the income generated in affected districts
Page | 68

constitutes only about 1 percent of national income (Figure 2.3). The methodology to estimate these shares is
summarized in Box 1.
Box 1: Assumptions Underlying the Output Estimates of Affected Districts
The estimation of output at the district level is not a simple exercise since National Income Accounts are not prepared at
provincial and district levels in Pakistan. However, the World Bank in consultation with the provincial Governments has
estimated GDP for all four provinces. It may however be noted that estimation of GDP at the sub-national is even more
complicated than the National Income Accounts. This is because some income identities close only at the national level
and not at the sub-national level. This is specifically true of income derived from mobile factors, which can freely move
across the provincial boundaries, providing services (and generating income) in more than one province.
Hence, to the extent possible, the United Nation’s System of National Accounts (SNA methodology (which is also
adopted by the Federal Bureau of Statistics (FBS) in estimating nation accounts) was adopted to calculate sectoral value
addition. However, in a number of sectors this was not possible due to the lack of data. For these sectors, informed
“allocators”, based on past data, were used to derive sub-national value-added from the national data.
The same methodology, albeit with stronger assumptions and greater approximations was used to estimate district-wise
GDP. For each sub-sector, multiple indicators are used to estimate the share of individual districts in the province and a
geometric mean of various shares of these indicators is used to compute an informed composite “allocator” for each
district and for each sector. The district GDP (DGDP) for a sub-sector is then derived by assuming that the share of the
district in national/provincial GDP would be equal to the value of this composite “allocator”.
34%
6% 10%
28%
9%
24%
31%
23%
2% 0% 1% 1% 1% 1% 1% 1%
0%
5%
10%
15%
20%
25%
30%
35%
40%
45%
Agricultue Manufacturing Otherindustries
Commerce Transport Housing Otherservices
GDP
Balochistan Pakistan
Figure-Annex 2.3: Balochistan: Contribution of Affected Districts to the Provincial and National Economies
Source: World Bank estimates 2011.
Page | 69

Sindh
Unlike Balochistan, the floods had a much greater impact on Sindh, where almost all districts were affected.
However, the Sindh government has listed seventeen districts which by its estimation were severely affected.1
These affected districts constitute 86 percent of geographical area of the province. However, as Karachi, the
most populated district of the province was not one of the districts affected by floods; the actual affected
districts comprise only 54% of the total population of the province. Moreover, like Balochistan, agriculture is
the main economic activity in the affected districts of Sindh. These districts provide over 70 percent of
province’s fishery and livestock products and an even larger proportion for wheat, cotton and sugarcane
outputs (Figure 2.4). Overall, 45 percent of the total income of these districts is generated in the agriculture
sector (Figure 2.5).
Figure-Annex 2.4:Sindh: Share of Affected Districts in Provincial Output
Source: Development Statistics of Sindh, 2009
1 These districts include: Badin, Dadu, Ghotki, Hyderabad, Jamshoro, Khairpur, Matiari, Larkana, Mirpur Khas, Naushero Feroze, Sanghar, Shaheed Benazirabad, Tando AllahYar, Tando Mohammad Khan, Tharparkar, Thatta, Umerkot
24%
50%
69% 71% 72%
88%
99% 100%
0%
10%
20%
30%
40%
50%
60%
70%
80%
90%
100%
Industry Rice Other Crops
Fish Livestock Wheat Cotton Sugarcane
Page | 70
Figure-Annex 2.5: Sources of Income Generation in Rural Sindh
Agriculture,45%
Manufacturing,8%
Otherindustries,
8%
Commerce,11%
Transport, 10%
Housing, 3%
Other Services,17%
Source: World Bank estimates of Gross Domestic Product of Sindh and affected districts 2011.

In 2010, the flooding occurred mostly on the right bank of river Indus. The districts in Sindh situated on the
right bank of river Indus are generally poor with relatively less agricultural and economic activity than the
districts on the left bank. However, in 2011, the rains and flooding affected the districts on the left bank of
Indus. As such, while the 2010 floods are considered to be the worst that hit the province in many decades, the
economic impact of the 2011 floods on the province may only be marginally less than 2010. As illustrated in
Figure 2.4, the affected districts have a sizable share in agricultural produce of the province, including all the
major crops, inland fishing and livestock. It is therefore natural to expect that the floods must have caused a
considerable damage to the agriculture sector of the province. In the affected districts, Social and Community
Services contribute 17 percent of income; while commerce (11 percent) and transport (10 percent) are other
major sources of income in these districts. Manufacturing and other industries provide 8 percent each to
income.
From the provincial and national perspective, the economies of all affected districts comprise about 34% of all
income produced in Sindh but only 8 percent of income generated in the country (Figure 2.6). This may imply
that while the flood damage to the local and to the provincial economy of Balochistan was substantial, the
impact to the national economy wasrelatively small.
Page | 71

Figure-Annex 2.6: Sindh: Contribution of Affected Districts to Provincial and National Economies
Source: World Bank estimates, 2011.
Damage Assessment - Preliminary Estimates
Concepts and Methodology
Damage due to floods depends on a number of factors. These include:
· the magnitude of flooding;
· depth and velocity of flowing water;
· rate of floodwater rise;
· duration of flooding;
· evacuation problems;
· effective flood access;
· size of population at risk;
· land use;
· flood awareness/readiness;
· effectiveness of flood warning system; etc.
Flood damages can be classified as tangible or intangible, reflecting the ability to assign monetary values.
Intangible damages arise from adverse social and environmental effects caused by flooding, including factors
such as loss of life and limb, stress and anxiety.
93%
12%
38%
20% 28%
34% 26%
34%
17%
3% 10%
5% 7% 9% 7% 8%
0%
20%
40%
60%
80%
100%
Agricultue Manufacturing Otherindustries
Commerce Transport Housing Otherservices
GDP
Sindh Pakistan
Page | 72

While it is important to be cognizant of the intangible losses, and is important to cater for them when
designing and implementing recovery and rehabilitation efforts, tangible damages, which form the bulk of
flood losses, remain the focus of attention for any damage assessment exercise. In order to assess the tangible
damages of the recent floods in Balochistan and Sindh, both direct and indirect losses were estimated.This is
done by using the UN ECLAC Macro-Economic Assessment Methodology.
Tangible damages are monetary losses directly attributable to flooding. They may occur as a result of direct or
indirect flood damages. Direct damages result from the actions of floodwaters, inundation and flow, on
property and structures. These refer to the monetary value of the completely or partially destroyed assets,
such as social, physical and economic infrastructure (including final goods, goods in transit or process, raw
materials, materials and spare parts), immediately following the floods. Wherever possible, the direct damage
of assets is assessed in “as was” condition, i.e. at their book values.
As is often the case, the bulk of direct damage occurred to the housing and agriculture sectors.Loss of, and
damage to, housing units presents losses of physical assets and can lead to considerable human suffering due
to dislocation and shelter related issues. Losses in the agricultural sector are equally extensive, as these imply
loss to standing or harvested crops; losses of farm livestock, agricultural structure and implements, seeds,
fertilizers and other inputs; etc. However, these damages are not limited to the agricultural and housing
sector, as significant damages also occur to businesses and public infrastructure, particularly in the case of
larger floods.
Indirect damages arise from the disruptions to physical and economic activities caused by flooding. These
comprise both the change of flow of goods and services and other economic flows such as increased
expenses, curtailed production and diminished revenue, which arise from the direct damage to production
capacity and social and economic infrastructure. Examples are the loss of sales, reduced productivity and the
cost of alternative travel if road and rail links are broken.
Finally, Reconstruction Costs need to be measured as these constitute the cost of rebuilding the lost assets and
restoring the lost services. It is generally assessed at the replacement cost, and in the case of this report, it is
defined to include the additional costs incurred to ensure flood-resistance construction.
The economic losses are calculated according to the methodology summarized in Box 2. For many sectors,
the methodology was applied assuming constant return to scale production function with capital and labor as
two factors of production. The loss in capital (and labor, if any) for each sector was obtained from the
sectoral annexes. Assuming some values for factor elasticities (α and β),1 the economic loss, i.e. change in
production (or values added), was estimated.
Additional information was sought, and, wherever available, this information was used to enhance the
robustness of these estimates. For example, for sectors dominated by public sector utilities, e.g. power, gas,
water supply and sanitation, the annualized revenue loss of these utilities attributable to the floods was used
to estimate indirect losses. Table 2.1 summarizes the direct damage, indirect losses and reconstruction costs
for each sector.
1 Generally the capital elasticity (α) is assumed to be 0.35 and of labor (β) is taken to be 0.65.
Page | 73

Overall Damage
From the perspective of Sindh – the most affected province in 2010 and 2011 - the damage in 2011 was as
severe and economically devastating as in 2010. For example, in 2010, the total damage in Sindh was
estimated at Rs 370 billion, whereas the 2011 floods have caused an estimated damage of Rs 311 billion in the
province. This is mainly for the reason that last year, floods devastated the areas on right bank of river Indus,
which contains relatively poorer districts of Sindh with low economic activity. In 2011, the floods impacted
the richer left bank districts. These districts constitute the agricultural heartland of the province. As such, the
damage to agriculture is estimated to be Rs 151 billion as compared to Rs 194 billion last year. The overall
damage in Sindh is estimated to be about 6 percent of provincial GDP. On the other hand, in Balochistan,
damages in 2011, at Rs 12 billion, (or 1.4 percent of provincial GDP) were only about one-quarter of
damages occurred in 2010.
This methodology, however, required some alterations in terms of direct damage to the output. In cropped
agriculture, for example, the biggest loss emanates from damage to the standing kharif crop. It is estimated
that a large proportion of the crop in the affected districts had been destroyed. However, a disproportionately
large amount of inputs (seeds, fertilizers, pesticides, water, etc.) have already been utilized in the production
process, thus the loss to the value-added is even larger than the loss in output, which is derived from the
above described methodology.
The overall, direct and indirect, damage caused by the floods is estimated at Rs 324.5 billion (US$ 3.7 billion
or 1.5 percent of estimated GDP), with exactly half of these losses occurring in the agriculture sector.
Damage in the housing sectors is responsible for another 27 percent of these losses, with a significant
Box 2: Methodology for Estimating the Economic Losses
In order to estimate the indirect losses due to flood, a simple production function approach was adopted. To illustrate the
process, assume a Cobb-Douglas type of production function which relates the pre-floods sectoral capital stock and labor
to sectoral output (value-added in our case).
Yi = Ai KiαLiβ
Where: Yi = Output (i.e. value added) in the ith sector of a given district
Ki is stock of capital in sector i.
Li is labor employed in sector i.
αand β are the output elasticities of capital and labor, respectively.
A similar relationship exists after the floods, i.e.
Yi *= Ai Ki*αLi*β
Hence, Yi*/Yi = (Ki*/Ki)α(Li*/Li)β
Under the assumption of constant returns to scale, i.e. α + β =1, the last relationship states that the ratio of post- to pre-
floods output is simply the geometric mean of the ratios or post- to pre-floods capital and labor. Given some estimate (or
assumed value) of elasticity (i.e. coefficients α or β), the impact of losses in output could be determined from damages to
sectoral capital and/or labor.
Page | 74

proportion of the damage caused by standing waters. Given the nature of floods, damages in 2011 were
somewhat different; damage to physical infrastructure comprises only about 10 percent of total damage,
which is considerably less than 2010, when this ration was about 23 percent.
Regionally, the losses are estimated at Rs 12.3 billion (US$ 141 million) in Balochistan and Rs 311billion in
Sindh (US$ 3.6 billion). The reason why damages in Balochistan are assed to be only 4 percent of the
estimated total losses is that compared to Sindh, damage to the housing sector in Balochistan was only
nominal (Table 2.2). As a proportion of GDP of all the affected districts the damage measures at 19 percent,
i.e. 21 percent for the affected districts of Sindh and 7 percent for affected districts of Balochistan. As part of
the provincial GDP, however, the damage is significantly less (6.1 percent for Sindh and 1.4 percent for
Balochistan). As a percentage of GDP, the damage is only 1.6 percent, almost entirely in Sindh (Figure 2.7).
Table-Annex 2.1: Estimate of Total Damages and Reconstruction Costs
Sector
DirectDamages
Indirect Losses
Total Damage Reconstruction Cost
(Rs million) (Rs million) (Rs million) (US$ million) (Rs Million) (US$ million)
1. Social Infrastructure
1.1 Housing 77,420 8,046 85,466 982 91,510 1,052
1.2 Health 432 826 1,258 14 864 10
1.3 Education 10,157 1,856 12,014 138 22,589 260
Sub-total 88,009 10,728 98,738 1,135 114,963 1,321
2. Physical Infrastructure
2.1 Irrigation & Flood Management
4,763 0 4,763 55 9,526 110
2.2 Transport & Communications 16,386 10,082 26,468 304 33,902 390
2.3 Water Supply & Sanitation 500 704 1,204 14 1,900 22
2.4 Energy 457 783 1,240 14 292 3
Sub-total 22,106 11,569 33,674 387 45,620 524
3. Economic Sectors
3.1Agriculture, Livestock & Fisheries
22,694 4,560 27,254 313 8,178 94
3.2 Private Sector /1 88,009 10,728 98,738 1,135 114,963 1,321
Page | 75
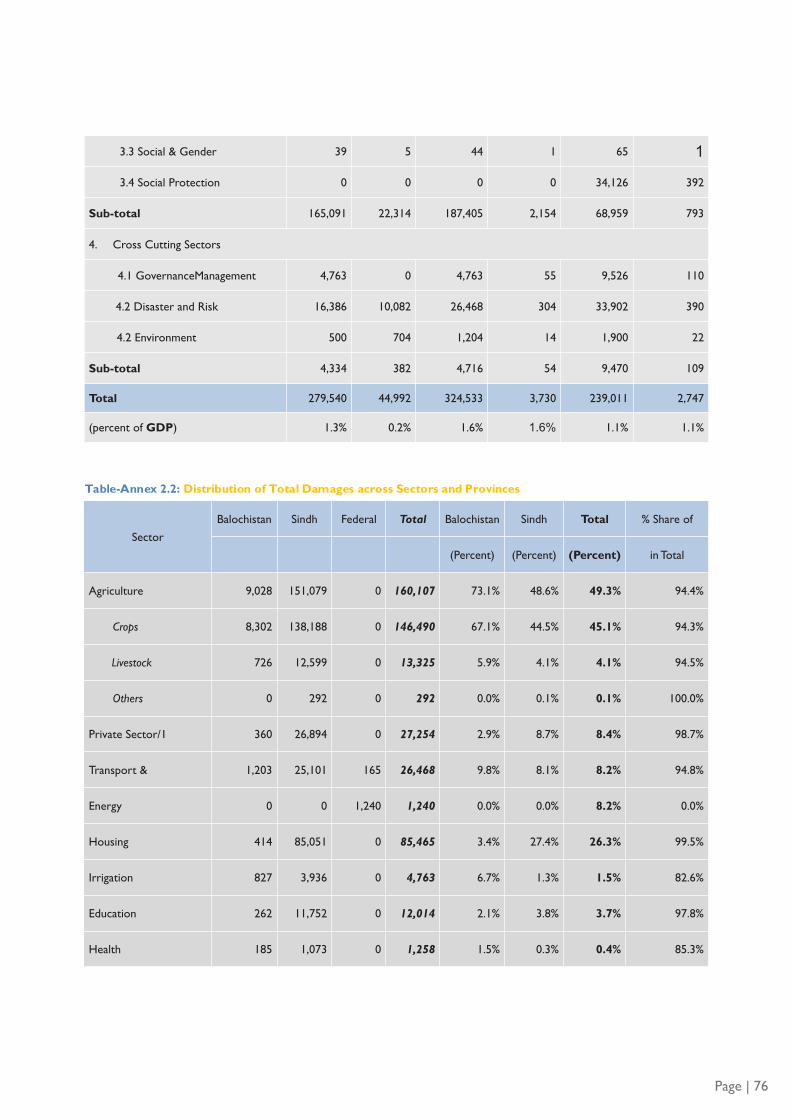
3.3 Social & Gender 39 5 44 1 65 1
3.4 Social Protection 0 0 0 0 34,126 392
Sub-total 165,091 22,314 187,405 2,154 68,959 793
4. Cross Cutting Sectors
4.1 GovernanceManagement 4,763 0 4,763 55 9,526 110
4.2 Disaster and Risk 16,386 10,082 26,468 304 33,902 390
4.2 Environment 500 704 1,204 14 1,900 22
Sub-total 4,334 382 4,716 54 9,470 109
Total 279,540 44,992 324,533 3,730 239,011 2,747
(percent of GDP) 1.3% 0.2% 1.6% 1.6% 1.1% 1.1%
Table-Annex 2.2: Distribution of Total Damages across Sectors and Provinces
Sector
Balochistan Sindh Federal Total Balochistan Sindh Total % Share of
(Percent) (Percent) (Percent) in Total
Agriculture 9,028 151,079 0 160,107 73.1% 48.6% 49.3% 94.4%
Crops 8,302 138,188 0 146,490 67.1% 44.5% 45.1% 94.3%
Livestock 726 12,599 0 13,325 5.9% 4.1% 4.1% 94.5%
Others 0 292 0 292 0.0% 0.1% 0.1% 100.0%
Private Sector/1 360 26,894 0 27,254 2.9% 8.7% 8.4% 98.7%
Transport & 1,203 25,101 165 26,468 9.8% 8.1% 8.2% 94.8%
Energy 0 0 1,240 1,240 0.0% 0.0% 8.2% 0.0%
Housing 414 85,051 0 85,465 3.4% 27.4% 26.3% 99.5%
Irrigation 827 3,936 0 4,763 6.7% 1.3% 1.5% 82.6%
Education 262 11,752 0 12,014 2.1% 3.8% 3.7% 97.8%
Health 185 1,073 0 1,258 1.5% 0.3% 0.4% 85.3%
Page | 76

Governance 28 1,925 0 1,953 0.2% 0.6% 0.6% 98.6%
Environment/2 1 2,762 0 2,763 0.0% 0.9% 0.9% 100.0%
Social & Gender 5 39 0 44 0.0% 0.0% 0.0% 89.4%
Total 12,356 310,778 1,405 324,533 100.0% 100.0% 100.0% 95.8%
(percent of PGDP)/3 1.4% 6.1% 0.01% 1.6%
/1 The damages were calculated as aggregate for both provinces. The provincial disaggregation is made by assuming that 5 percent of total damages occurred in Balochistan and the rest in Sindh.
/2 The damage is distributed between two provinces on the assumption of 10 percent and 90 percent for Balochistan and
/3 While losses of each province are expressed as a percentage of their own respective GDPs, the federal and overall damages are shown as percent of national GDP.
Figure-Annex 2.7: Estimated Total Losses
Direct Damages
The direct damage is calculated as Rs 280 billion (or US$ 3.2 billion), with more than half (51 percent) of the
damage occurring assessed in the agricultural sector. Damage to private housing, furniture and household
effects (28 percent); irrigation (1.7 percent) and transport (5.9 percent) infrastructure also shows significant
direct losses.1 A very large proportion (about 96 percent) of direct damage was in Sindh, with almost 80
percent of it occurring in agriculture and housing sectors. A large majority of direct damage in Balochistan is
1 These damages relate to the “book value” or “selling price” of the assets and goods on “as is” basis.
20.6%
6.1%
1.5%
6.8%
1.4%0.1%
0.0%
5.0%
10.0%
15.0%
20.0%
25.0%
Proportion of GDP of the Affected Areas
Proportion of Provincial GDP Proportion of National GDP
Sindh Balochistan
Page | 77

Social Sectors,48%
Cross Cutting4%
Infrastructure19%
Economic Sector29%
Ttal Cost Rs 239 billion(or 1.1% of GDP)
attributed to losses in agriculture, irrigation and transport sectors, with agriculture alone accounting for
almost two-thirds of the direct damages in the province.
Indirect Losses
Like the direct damages, almost 40 percent of indirect losses of floods are in agricultural sector, as flooding
has impacted productive capacity of land for the next cropping season. As agriculture is the main sector
affected by floods in Balochistan, the losses in the agriculture sector are as high as 73 percent of overall
damage in the province. This is almost twice the proportion of losses in agriculture sector of Sindh. Damage
to housing units caused losses in (actual and imputed value) rental income of the house owners. These losses
comprise 27 percent of all indirect losses. Similarly, disruption of economic activities caused significant
income losses to transport and communication sector (23 percent). The other noteworthy indirect loss of
about 4 percent of indirect losses is because of suspension of education services, both due damage to school
infrastructure and the use of schools as shelters for flood-affected communities.
Reconstruction Costs
The cost of reconstruction of public and private assets and the restoration of public services is estimated to
be Rs 239 billion (or 1.1 percent of GDP). As of a bulk of reconstruction efforts are likely to involve
repairing and rebuilding of damaged houses, the estimated reconstruction cost for social infrastructure (at 0.6
percent of GDP) is almost half of the total cost (Figure 2.8). On the other hand, physical infrastructure,
economic sectors and cross-cutting sectors would entail 19 percent, 29 percent and 4 percent of the
reconstruction cost, respectively. Although, from the perspective of the local, and the provincial economies
of Sindh and Balochistan, the reconstruction cost is high, yet viewed from the national perspective, the
reconstruction cost is only about 1.1 percent of GDP (Figure 2.9).
Figure-Annex 2.8: Sectoral Distribution of Reconstruction Costs
Source: World Bank estimates of Gross Domestic Product (GDP) of the province and affected districts, 2011.
The affected districts of Balochistan generate a little less than one quarter (23 percent) of the total income
produced in the province. These districts contribute 38 percent of the total agricultural income of the
province; 31 percent on income generated in social and community services; 28 percent of income in
commerce and almost one quarter of Balochistan’s housing income. However, as Balochistan’s own
contribution towards national GDP is only about 5 percent, the income generated in affected districts
Page | 78

Macroeconomic Effects
Overall Effects
During the past four years, Pakistan’s economy has slowed down considerably. Besides structural and policy-related
problems, adverse security conditions, energy shortages and political uncertainty played and significant role in this sharp
deceleration of the economy, with all key economic indicators showing marked deterioration. Economic growth dropped
from 3.8 percent in 2009/10 to 2.4 percent in 2010/11. Inflation during these two years increased from 10.1 percent to
13.7 percent; fiscal deficit increased from an average of 6.3 percent of GDP to 6.6 percent. Although current account
balance improved from a deficit of 2.2 percent of GDP in 2009/10 to a surplus of 0.2 percent of GDP in 2010/11,
confidence declined, and investment fell from 15.4 percent of GDP to 13.4 percent during these two periods.
Unemployment rate increased and all indicators point to a sharp increase in poverty. The devastating floods contributed
towards this economic decline.
Looking forward, the Pakistani economy faces some daunting challenges. High inflation continues to have a devastating
impact on the standard of living of the population, especially of fixed income groups and the poor. The floods in 2010
and 2011 have caused extensive physical damage to personal property and public infrastructure. Millions of people have
been affected. Although relatively few lives were lost, a large number of people have lost their livelihoods due to
temporary disruption in economic activity. In addition to relief costs, this preliminary assessment places the cost of
reconstruction of the damagescaused by the 2011 floods to be US$ 2.7 billion (or nearly 1.1 percent of Pakistan’s
estimated 2011/12 GDP). While a bulk of these costs will fall on the private sector and households, there would be a
sizeable fiscal impact, as not only has there been significant damage to public, social and economic infrastructure which
would require repairs and restoration, but also because households, especially the poorer ones, in the affected areas will
require government assistance to rebuild their houses and livelihoods. Although, in comparison to the number of houses
1.05%
5.0%
14.5%
0.03%0.01
3.3%
0.06%
0%
2%
4%
6%
8%
10%
12%
14%
16%
% of GDP % of PGDP % of GDP of Affected AreasSindh Balochistan Federal
Page | 79
Figure-Annex 2.9: Area-Wise Distribution of Reconstuction Costs

damaged or destroyed, the estimated book value of these assets is small, yet the replacement cost of these
assets would be much higher, not only because of cost escalation overtime, but also because of a need to
reconstruct these assets with improved standards in order to minimize the impact of similar disasters in the
future. As such, the government has to assess the level of assistance for less affluent households against fiscal
affordability and consistency with overall macroeconomic stability. Moreover, with the increased frequency of
natural disasters faced by the country, the government has to devise sound policies, establish and strengthen
institutions and invest in disaster control and damage mitigation measures at local, provincial and national
levels.
Effects on Economic Growth
In order to estimate the impact of floods on the macro-economy, two set of projections are made for selected
macroeconomic indicators in light of all the latest information available both prior to the floods and what is
compiled as part of DNA to estimate direct and indirect losses. The first set of projections attempts to
determine the level of macroeconomic indicators if there had been no floods this year, while the second set
estimates the value of the same indicators after the floods.
The impact of the floods on Pakistan’s economic growth is expected to be quite significant - in the order of
0.4 percent (i.e. 40 bps). In June 2011, the government of Pakistan projected the 2011/12 GDP growth at
4.1%, with value added in major crop sector expected to rebound from its flood-stricken negative growth (of
- 4 percent) in 2010/11 to post a positive growth of 3 percent in 2011/12. However, it was clear that these
estimates were based on partial information and could therefore be incorrect. Most importantly, with the 18th
amendment leading to devolution of some key federal ministries to the provinces, the federal government lost
its handle on some key information required to make robust projections. This includes, area sown under
various crops and the expected output from these crops, livestock, fishery and forestry information. On the
basis of partial information, the federal government set some arbitrary targets for agricultural crops, and
correspondingly for growth in the agriculture sector. Some of these targets appeared quite strange. For
example, in 2010/11 the government set a target of 14 million bales of cotton. However, due to large scale
damage in southern Punjab and Sindh, the realized output of cotton that year was only 11.8 million bales. For
2011/12, the target that was set was of 12.8 million bales – one million bales higher than the output in
2010/11, but 1.2 million bales lower than the 2010/11 target. However, the provincial authorities consider
the target to be on the low side. Factoring in all the relevant information, and including a minor adjustment
related to agriculture productions, it is projected that the Pakistani economy would have grown at 4.2 percent
in 2011/12 if there had been no floods.
As mentioned earlier, a bulk of the growth impact of floods would be through the agriculture sector and
through its forward linkages with other sectors (e.g. large and small scale manufacturing, transport, whole and
retail trade, etc.). However, Pakistan’s agriculture has two cropping seasons, summer or rabi and winter or
kharif. The overall impact on the sector, and correspondingly on macro-economy, would depend on the
actions taken by the government, communities, farmers,entrepreneurs and households to mitigate the impact
on these floods. While it is clear that the floods have caused extensive damage to standing kharif crops in all
the affected districts of Sindh and Balochistan, further damages could be minimized by ensuring that rabi
crops are sown on time by ensuring timely supply of seeds and fertilizers, and in cases where that is made
impossible by standing flood waters, to convince famers to sow crops that could be sown late (e.g. sunflower
instead of wheat). Similarly, early repair of houses can ensure that actual and imputed income from these
housing units is not unduly affected by floods. Table 2.3 shows the impact of floods on some key
Page | 80

macroeconomic indicators under the behavioral assumptions that all players will behave to minimize the
impact of floods on the macro-economy.
On the assumption that the projections only account for the flood shock, it is projected that the 2011/12
GDP growth will decline from 4.2 percent to 3.8 percent due to floods (Table 2.3)1, with post-floods growth
in agriculture sector falling from an estimated 3.8 percent prior to 2.7 percent. Whereas, the impact on
industry and services sector, both on account of direct damage to sectoral infrastructure and their backward
linkages to agriculture is expected to be marginal. It is projected that the growth in the industrial sector will
drop from its pre-flood projection of 3.2 percent to 3.0 percent; whereas that of services sector will fall from
5 percent to 4.7 percent.
Table-Annex2.3: Pre- and Post Flood Projections of Selected Economic Indicators
2009/10 2010/11 2011/12
Actual Actual Pre-Flood Post-Flood
Economic growth and inflation Annual Percentage Change
Real GDP growth (at factor cost) 3.8 2.4 4.2 3.8
Nominal GDP growth (at market prices) 16.6 21.7 15.5 15.4
Consumer prices (period average) 10.1 13.7 11.3 11.6
Investment and savings Percent of GDP
Gross domestic investment 15.4 13.4 14.2 14.6
Private sector 1/ 11.8 10.1 10.6 10.8
Public sector plus government 3.6 3.3 3.6 3.8
Gross national savings 13.1 13.6 14.0 13.8
Consolidated fiscal accounts
Revenue 14.0 12.5 13.2 13.1
Tax revenue 10.1 9.4 10.0 9.9
Non-tax revenue 3.9 3.1 3.2 3.2
1 While the growth impact on the national economy is projected to be rather small, the impact on the provincial and
some local economies has been sizeable. This would also have severe implications for income distribution and poverty in the flood-affected areas.
2009/10 2010/11 2011/12
Actual Actual Pre-Flood Post-Flood
Economic growth and inflation Annual Percentage Change
Real GDP growth (at factor cost) 3.8 2.4 4.2 3.8
Nominal GDP growth (at market prices) 16.6 21.7 15.5 15.4
Consumer prices (period average) 10.1 13.7 11.3 11.6
Investment and savings Percent of GDP
Percent of GDP 15.4 13.4 14.2 14.6
Private sector 1/ 11.8 10.1 10.6 10.8
Public sector plus government 3.6 3.3 3.6 3.8
Gross national savings 13.1 13.6 14.0 13.8
Consolidated fiscal accounts
Revenue 14.0 12.5 13.2 13.1
Tax revenue 10.1 9.4 10.0 9.9
Non-tax revenue 3.9 3.1 3.2 3.2
Total expenditures (incl. net lending) 20.3 19.1 19.2 19.5
Page | 81

Current expenditure (incl. interest payments) 15.9 16.1 16.1 16.3
Interest payments 4.3 3.9 3.7 3.7
Development expenditure and net lending 4.4 2.8 3.1 3.2
Overall balance (excl. grants) -6.3 -6.6 -6.0 -6.4
Total public debt 60.8 59.7 56.5 56.9
Foreign currency public debt 2/ 29.5 26.4 23.0 23.1
Domestic currency public debt 31.4 33.3 33.5 33.8
Balance of payments
Balance on Goods & Services -7.5 -5.9 -6.6 -6.7
Exports of goods & services 14.1 14.6 14.0 13.8
Imports of goods & services 21.6 20.5 20.6 20.8
Transfers 7.1 7.5 6.8 6.9
Private 6.8 7.4 6.7 6.8
Current account balance (incl. transfers) -2.2 0.2 -0.8 -1.3
Gross official reserves (in months of imports of G&S) 3.6 3.9 3.9 3.5
Memorandum items:
Nominal GDP at market prices (in Rs Billion) 14,836 18,063 20,862 20,844
Rupees per U.S. dollar (period average) 83.9 85.5 89.1 89.6
1/ Includes changes in inventories.
2/ This includes medium and long term PPG debt, IMF debt as well as short-term external debt.
Source: World Bank Staff estimates
Page | 82

Over the medium-term, growth patterns are unlikely to be significantly influenced by these floods, not only
because the affected areas account for a relatively small portion of the country’s GDP,1 but also as per its
performance during the 2010 floods, the government is expected to take all necessary measures to restrict the
impact of floods on the economy beyond 2011/12. Moreover, a positive second-round effect can be
expected as soon as reconstruction activities start, which will translate into a stimulus to economic growth.
Fiscal impact
The floods have had a sizeable adverse impact on the fiscal situation of the local, provincial and federal
governments. Firstly, there could be decline in government revenue both as a result of curtailment of
economic activity and because a number of districts have been declared “calamity hit” areas implying that no
tax could be collected from these districts. As such, it is projected that there will be a revenue loss of Rs 20
billion (or 0.1 percent of GDP). On the other hand, government expenditures, especially those of provincial
governments of Sindh and Balochistan, will increase as a result of relief and rehabilitation services. Unlike
last year when the provincial and federal government jointly provided grant compensation of about of Rs
60,000 to each of the select number of families,2 to-date the federal and Balochistan governments have not
announced any support for the flood affected families. However, the Sindh government is likely to announce
a compensation grant of Rs 10,000 for each of the 1.35 million affected families. Similarly, provision of
agricultural inputs for rabi crops may lead to an additional recurrent expenditure of about Rs 15 billion. Thus
overall the recurrent expenditure of the two provincial governments will increase by Rs 35 billion (or 0.2
percent of GDP). Repairs and reconstruction of damaged public infrastructure is projected to add about Rs
25 billion to the provincial government development expenditure. Overall, the consolidated fiscal deficit of
the federal and provincial governments will increase by 0.4 percent of GDP, from 6.0 percent prior to the
floods to 6.4 percent after the floods; with bulk of the increase coming through higher fiscal deficits (lower
surpluses) of Sindh and Balochistan governments. As for financing the additional deficit is concerned, due to
the favorable changes in revenue transfers brought about by the Seventh NFC Award, the provincial
governments of Sindh and Balochistan are quite capable of meeting these additional expenditures, provided
of course that the revenue transfers are made as per the projections of the federal budget. Overall, the higher
consolidated fiscal deficit has to be financed through additional borrowing. Hence, there is a need to
mobilize additional donor financing, which requires preparation and efficient implantation of bankable
projects both at federal and provincial levels.
Effects on the External Sector
After a lag of many years, 2010/11 was the first year when Pakistan external trade sector showed a small
surplus in its current account. This was mainly an outcome of favorable terms of trade that Pakistan faced
during the year, mainly as a result of exceptionally high cotton and textile prices. However, right from the
start of 2011/12 it was clear that Pakistan cannot rely on favorable international prices of its exports nor can
1 As mentioned earlier, the affected districts of Sindh and Balochistan account for 8 and 1 percent of nations output,
respectively. 2 The first tranche of Rs 20,000 was provided to each of the affected family through geographical targeting. The cost of
this grant (estimated to be Rs 12 billion in Sindh and Rs 1.7 billion in Balochistan) was equally shared between the federal and provincial governments. The remaining amount of Rs 40,000 per family (to be provided in 2011/12 in two equal tranches) is to be distributed to affected families on the basis of estimated housing damage. The number of families qualifying for this grant is estimated to be 249,000 in Sindh and 47,000 in Balochistan. As such, the overall compensation to families affected by the 2010 floods is estimated to be Rs 22 billion in Sindh and Rs 3.6 billion in Balochistan.
Page | 83

it bank on falling petroleum prices. During the first five months of 2011/12, the exports continued to grow at
a healthy rate of 11.5 percent. However, higher petroleum prices led to a surge in imports of 21 percent. The
current account deficit for 2011/12 was therefore projected at -0.8 percent of GDP. The recent damage
caused by floods, especially to the cotton crop, and with greater use of cement in the domestic construction
sector, the exports are expected todecrease by US$ 750 million, whereas imports are likely to be higher (by
US$ 420 million) as Pakistan would have to import some additional agricultural inputs and outputs (e.g. chili
powder, molasses, seeds, pesticides, fertilizers, construction material, etc.). As a result, trade deficit is likely to
worsen by US$ 1.2 billion. On the other hand, private transfers (remittances) are expected to be somewhat
higher than their pre-flood level as workers abroad send additional funds back home to help families cope
with flood damages. The post-flood current account deficit is likely to increase by 0.8 percent of GDP to 1.3
percent.
Effect on Inflation
Pakistan has been witnessing high inflation rates, with increases in food prices outpacing the non-food prices.
The monetary authorities have pursued a tight monetary policy for the last four years, with intent to lower the
inflation rate to single digits. However, with significant damages to both food and non-food crops, the
impact on CPI-based inflation would be the magnitude of 0.3 percent, i.e. inflation will increase from 11.3
percent in the pre-flood to 11.6 percent in the post-flood scenario. At the local level there were some short-
term spikes in prices – not solely because of the loss in output and disruption in production but also because
it would havebeen difficult to transport commodities to the affected areas due to standing water and damage
infrastructure. Furthermore, reconstruction of houses and other infrastructure may lead to temporary
shortages of construction material and certain other commodities, which can lead to another small round of
price increases.
Summary and Conclusion
Overall, given the magnitude of natural disasters that Pakistan, and especially the provinces of Sindh and
Balochistan faced over the last two years, the broad macroeconomic impact of 2010/11 floods is estimated to
be significant but compared to the devastation of floods is relatively small. This is also partly because the
macroeconomic impact of the 2011 floods is based on the prudence and exemplary managerial ability shown
by the government and communities. Nonetheless, the government has been struggling to reestablish the
macroeconomic stability and the natural disasters have not helped the government’s cause. While the short-
run costs of these disasters would have to be borne to the extent that they are fiscally affordable, for the
medium-run, the government has to devise sound policies, establish and strengthen institutions and invest in
systems to minimize the cost of future natural disasters, including those at the provincial level.
Page | 84
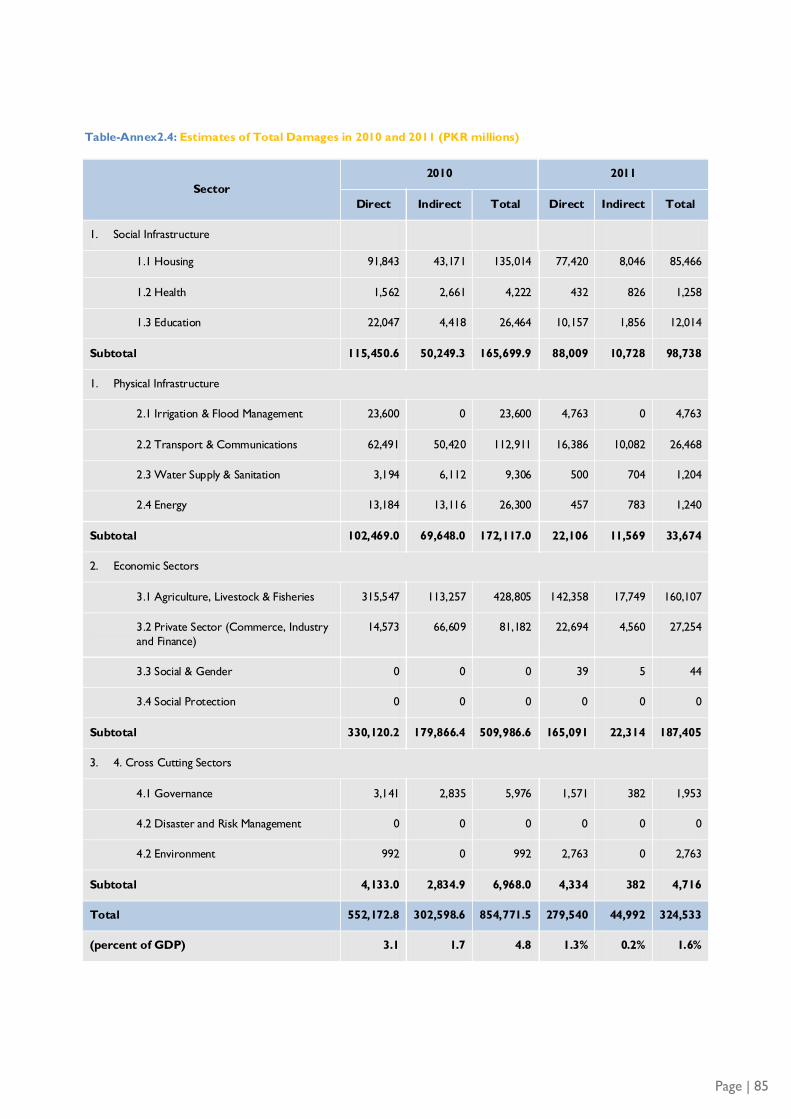
Page | 85
1.1 Housing 91,843 43,171 135,014 77,420 8,046 85,466
1.2 Health 1,562 2,661 4,222 432 826 1,258
1.3 Education 22,047 4,418 26,464 10,157 1,856 12,014
Subtotal 115,450.6 50,249.3 165,699.9 88,009 10,728 98,738
1. Physical Infrastructure
2.1 Irrigation & Flood Management 23,600 0 23,600 4,763 0 4,763
2.2 Transport & Communications 62,491 50,420 112,911 16,386 10,082 26,468
2.3 Water Supply & Sanitation 3,194 6,112 9,306 500 704 1,204
2.4 Energy 13,184 13,116 26,300 457 783 1,240
Subtotal 102,469.0 69,648.0 172,117.0 22,106 11,569 33,674
2. Economic Sectors
3.1 Agriculture, Livestock & Fisheries 315,547 113,257 428,805 142,358 17,749 160,107
3.2 Private Sector (Commerce, Industry and Finance)
14,573 66,609 81,182 22,694 4,560 27,254
3.3 Social & Gender 0 0 0 39 5 44
3.4 Social Protection 0 0 0 0 0 0
Subtotal 330,120.2 179,866.4 509,986.6 165,091 22,314 187,405
3. 4. Cross Cutting Sectors
4.1 Governance 3,141 2,835 5,976 1,571 382 1,953
4.2 Disaster and Risk Management 0 0 0 0 0 0
4.2 Environment 992 0 992 2,763 0 2,763
Subtotal 4,133.0 2,834.9 6,968.0 4,334 382 4,716
Total 552,172.8 302,598.6 854,771.5 279,540 44,992 324,533
(percent of GDP) 3.1 1.7 4.8 1.3% 0.2% 1.6%
Sector
2010 2011
Direct Indirect Total Direct Indirect Total
1. Social Infrastructure
Table-Annex2.4: Estimates of Total Damages in 2010 and 2011 (PKR millions)

Table-Annex 2.5: Province Wise Comparison of Total Damage in 2010 and 2011 (PKR millions)
Sector
2010 2011
Balochistan Sindh Balochistan Sindh
Agriculture 35,148 193,912 9,028 151,079
Crops 21,021 177,848 8,302 138,188
Livestock 14,127 16,016 726 12,599
Others 0 48 0 292
Private Sector 943 11,747 360 26,894
Transport & Communication 4,246 53,164 1,203 25,101
Energy 0 0 0 0
Housing 8,228 78,667 414 85,051
Irrigation 2,516 9,168 827 3,936
Education 776 13,355 262 11,752
Health 185 1,921 185 1,073
Water supply & Sanitation 497 4,890 44 1,160
Governance 112 3,046 28 1,925
Environment & Others 25 1 6 2,801
Total 52,676 369,870 12,356 310,772
Page | 86

Annex 3: Environment

Introduction
This section estimates the environmental damages and needs associated with the flooding during 2011 in the
provinces of Sindh and Balochistan. The flood caused environmental damages and losses to the population,
affected badly the environmental services rendered by natural resources like wetlands, mangroves, and
protected areas, and heightened environmental health risks. Environmental degradation and its effects on
human health were already a significant development in Pakistan, which has some of the highest prevalence
rates in all of South Asia for child mortality, diarrhea and acute respiratory illnesses associated with
environmental factors. Pakistan suffers a loss of 8.84% of its GDP each year from environmentally-related
disease. Almost half of this cost is caused by mortality (4.13% of GDP) while the rest stems from the
malnutrition caused by environmentally-related disease (4.71% of GDP). The conditions created by the
floods could result in a significant increase of these and other illnesses.
The environmental damages caused by the 2011 floods included: i) contamination of resources for drinking
water; ii) contamination of water resources that are used for other domestic usage; iii) stagnant water ponds
resulting in proliferation of disease vectors such as mosquitoes; iv) solid waste and debris accumulation; v)
agricultural lands affected by pollution and salt; vi) damage to soil through erosion; vii) damages to wetlands
and mangroves; and viii) damages to protected areas and cultural assets.
Other cross cutting environmental aspects such as damages and needs connected to water supply facilities,
sewerage networks and latrines have been covered under the WATSAN sector, loss of agricultural land and
crops covered under the Agriculture, Livestock and Fisheries sector, damages to the irrigation network
covered under the Irrigation and Flood Management sector, while damages to dwellings have been covered
under the Housing sector.
The quality, inconsistencies and gaps of data that was collected for the purpose of this assessment, highlights
the need for environmental monitoring system in the regions, as well as the need to strengthen the
institutional framework in the government agencies in charge of environmental protection.
Environment Baseline of the Affected Areas
This section provides the environmental baseline for the area affected by the 2011 floods. The section
contains three parts: the first part describes the environmental health problems in Pakistan; the second part
describes the waste management practices in the affected area; while the third part describes the general
conditions of the natural systems including wetlands and mangroves.
Status of environmental health
Pakistan suffers a loss of 8.84% of its GDP each year from environmentally-related disease. Almost half of
this cost is caused by mortality (4.13% of GDP) while the rest stems from the malnutrition caused by
environmentally-related disease (4.71% of GDP). 1, 2
1 Malnutrition and child mortality are strongly interlinked. Malnourished children are particularly vulnerable to environmentally-related diseases and therefore at higher risk of death. Conversely, children that contract environmentally-caused infections have a high likelihood of becoming malnourished, regardless of their socio-economic level, although lower income children with limited access to treatment are at higher risk. 2 The World Bank (2008). Environmental Health and Child Survival, Epidemiology, Economics, Experiences
Page | 88

Approximately 90 percent of typhoid and diarrheal illness in Pakistan is attributable to inadequate drinking
water, sanitation and hygiene. Up to 83,500 deaths a year are linked to these causes. Morbidity linked with
waterborne diseases amounts to 74.5 million cases per year.
Children under five constitute the population group most vulnerable to these diseases. In fact, infant child
mortality rates in Pakistan are the highest in South Asia and the prevalence of childhood diarrhea and acute
respiratory infections are the second highest. By 2008, roughly one third of all child mortality in Pakistan (or
approximately 132,000 children per year) was caused by environmentally related factors (35% of which
originate from acute lower respiratory illnesses and 64% due to diarrhea). When malnutrition is taken into
account in the calculations, mortality from environmental factors increased to 187,000 children per year (47%
of all child mortality).
Stagnant water pools breed vectors such as mosquitoes, which can cause malaria, dengue fever, and other
similar diseases in the nearby communities. Malaria is the second most prevalent and devastating disease in
the country1. A total of 4.3 million were treated as malaria cases in 2004. The Health Management
Information System (HMIS) reported 4.5 million clinical cases of malaria for 2004 and 3.5 million for 20062.
Waste management issues
In the flood-affected areas the generation of municipal solid waste can be estimated to 1.5 kg per capita per
day, regardless of people staying in their houses or having moved to relief shelters or other temporary camps.
Most of this waste is biodegradable and in the long run not harmful at all. In the short perspective, however,
it poses a certain risk for the environmental health, as it may attract rodents and other animals. On the other
hand this waste may be a resource for the future when it can be used for biogas production and as such can
contribute to the energy supply for domestic use.
In the affected areas, most of the domestic solid waste used to be disposed off at local dumpsites or, too
often, just thrown out and/or burned in the streets or along the roads. During floods many small dumpsites
tend to wash away and spread over a large area carrying plastics, non-degraded organics, small metal objects
and, frequently, different kind of hazardous substances like hospital/medical waste, pesticides, heavy metals
from batteries, oil and other chemicals.
The open burning of solid waste in the streets or at dumpsites under poor conditions creates air pollutants,
many of them quite toxic such as chlorinated hydrocarbons and dioxins. In addition to the solid wastes, large
quantities of waste effluents are also generated in the affected areas, most of which is released to environment
without adequate treatment, thus polluting soil and water.
The quantity and composition of industrial wastes in the flood-affected areas is still unknown but the
presence of warehouses for fertilizers and pesticides poses a potential risk of soil/water contamination by
these substances. Several sugar mills are located in the affected areas, but these mills are not operational
during the monsoon season, hence release of any significant quantities of pollutants from these mills is quite
unlikely.
1 National Health Management Information System (HMIS) 2006. Islamabad, Pakistan. 2 Ibid.
Page | 89
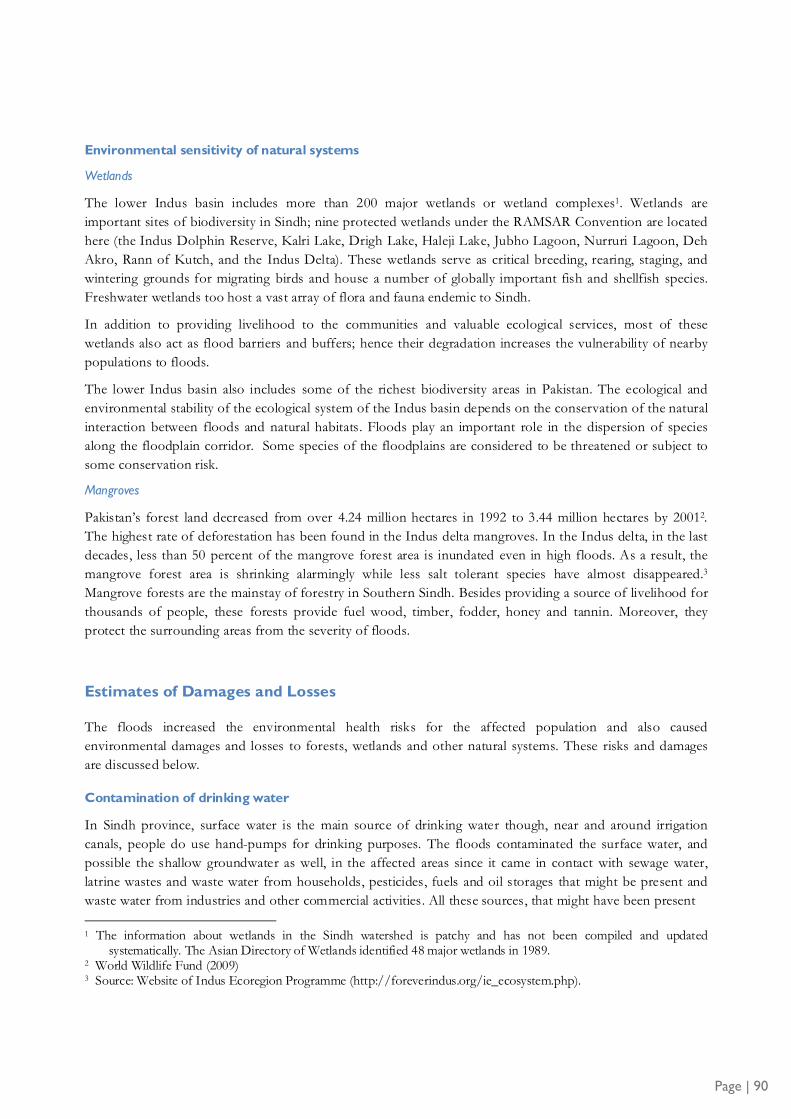
Environmental sensitivity of natural systems
Wetlands
The lower Indus basin includes more than 200 major wetlands or wetland complexes1. Wetlands are
important sites of biodiversity in Sindh; nine protected wetlands under the RAMSAR Convention are located
here (the Indus Dolphin Reserve, Kalri Lake, Drigh Lake, Haleji Lake, Jubho Lagoon, Nurruri Lagoon, Deh
Akro, Rann of Kutch, and the Indus Delta). These wetlands serve as critical breeding, rearing, staging, and
wintering grounds for migrating birds and house a number of globally important fish and shellfish species.
Freshwater wetlands too host a vast array of flora and fauna endemic to Sindh.
In addition to providing livelihood to the communities and valuable ecological services, most of these
wetlands also act as flood barriers and buffers; hence their degradation increases the vulnerability of nearby
populations to floods.
The lower Indus basin also includes some of the richest biodiversity areas in Pakistan. The ecological and
environmental stability of the ecological system of the Indus basin depends on the conservation of the natural
interaction between floods and natural habitats. Floods play an important role in the dispersion of species
along the floodplain corridor. Some species of the floodplains are considered to be threatened or subject to
some conservation risk.
Mangroves
Pakistan’s forest land decreased from over 4.24 million hectares in 1992 to 3.44 million hectares by 20012.
The highest rate of deforestation has been found in the Indus delta mangroves. In the Indus delta, in the last
decades, less than 50 percent of the mangrove forest area is inundated even in high floods. As a result, the
mangrove forest area is shrinking alarmingly while less salt tolerant species have almost disappeared.3
Mangrove forests are the mainstay of forestry in Southern Sindh. Besides providing a source of livelihood for
thousands of people, these forests provide fuel wood, timber, fodder, honey and tannin. Moreover, they
protect the surrounding areas from the severity of floods.
Estimates of Damages and Losses
The floods increased the environmental health risks for the affected population and also caused
environmental damages and losses to forests, wetlands and other natural systems. These risks and damages
are discussed below.
Contamination of drinking water
In Sindh province, surface water is the main source of drinking water though, near and around irrigation
canals, people do use hand-pumps for drinking purposes. The floods contaminated the surface water, and
possible the shallow groundwater as well, in the affected areas since it came in contact with sewage water,
latrine wastes and waste water from households, pesticides, fuels and oil storages that might be present and
waste water from industries and other commercial activities. All these sources, that might have been present
1 The information about wetlands in the Sindh watershed is patchy and has not been compiled and updated
systematically. The Asian Directory of Wetlands identified 48 major wetlands in 1989. 2 World Wildlife Fund (2009) 3 Source: Website of Indus Ecoregion Programme (http://foreverindus.org/ie_ecosystem.php).
Page | 90

when the flooding occurred, contributed to the contamination of the water. It is not clear to what extent the
water has been polluted and therefore there is a need to identify the sources and extent of water
contamination in the affected areas. However, it is impossible to estimate the amount and the associated cost
of drinking water that was polluted during the floods.
Affects of contaminated water and soil on human health
The floods also posed health risk for the people when they came in contact with contaminated water and soil
in the daily life, for example washing, bathing and children playing in water ponds and with soil.
As understood from the situation in the relief camps and unofficial temporary camps, open defecation has
been a common behavior. This directly exposes people, especially children, to health risks especially diarrhea
infections among others. Furthermore the open defecation pollutes water, which transfers and spreads
infection agents to wider areas and also to freshwater sources. Where latrines are constructed this risk is
reduced. No cost has however been estimated for the contaminated water and the associated health hazards,
because of the subjectivity of such estimation.
Agricultural land affected by pollution and salt
The contaminated water also pollutes and degrades the soils particularly in the cultivated areas. In the
inundated areas, when the water recedes after flooding some of the pollutants in the water are left in the soil.
Another impact on the soils is that the high water level brings the saline groundwater up to the surface and
leaves salt on the surface level once the water recedes or evaporates. This could have a significant impact
upon agriculture. No cost has however been estimated for the contaminated land because of the subjectivity
of such estimation.
On the other hand the floodwater also nourishes the soil, due to the sediment load if it is coming from river
and or canals. Rainwater may also help in reducing the soil salinity.
Disease vectors from stagnant water
The receding flood water has left behind a large number of stagnant water ponds. These ponds are the main
source of disease vectors such as mosquitoes. If such ponds are located near communities, they will
contribute towards further increase of diseases such as malaria and dengue fever. The estimated number of
ponds in the affected areas is around 15,356 (Table 3.1). Detailed studies are however needed to determine
the exact number and location of such ponds. No cost has however been estimated for the health hazards
associated with this water stagnation because of the subjectivity of such estimation.
Table-Annex 3.1:Stagnant Water Ponds
Province Affected Households Number of Ponds a
Balochistan 5,832 58
Sindh 1,529,799 15,298
Total 1,535,631 15,356
a Basis. Average size of village: 100 households; one pond per village. The number of affected households has been estimated based upon the number of affected people reported by NDMA/PDMA and average household size of six persons.
Page | 91

Page | 92
Solid waste accumulation
Lack of appropriate disposal of solid waste increases the risks of water pollution, which in turn contributes to
the increased health risks to the affected population. Affected households are estimated to generate about
2,300 tons of municipal solid waste (MSW) per day spread over a huge area (Table 3.2). Most of this waste
has never been a subject to proper collection or treatment in the affected areas. No cost has however been
estimated for this waste accumulation because of the subjectivity of such estimation.
Table-Annex 3.2: Municipal Solid Waste
Province Affected Households Tons of Solid Waste per Day
Balochistan 5,832 9
Sindh 1,529,799 2,295
Total 1,535,631 2,304
a Basis. MSW quantity per household: 1.5 kg per day. See footnote of Table 3.1 for the criteria used to determine the number of affected households.
Debris accumulation
Inappropriate disposal of debris from damaged/demolished buildings and structures can potentially cause
environmental problems such as water contamination, siltation resulting into shortening of water reservoir
lives, affects on aquatic flora and fauna, loss of biodiversity, decrease in the services provided and functions
performed by wetlands, and decreased aesthetic value of the area. No firm estimates are available for the
amount of debris associated with the damaged buildings and infrastructure, therefore a follow-up study is
proposed to assess these damages. The UNDP has estimated the quantity of the debris to be 550,000 m3. 1
Damage to forests and plantation
The provincial governments of Sindh and Balochistan have provided the estimates of the damages to the
forests, plantation, and the Department infrastructure as given in the Table below. Cost of these damages has
been estimated to be PKR 2,762.66 m (US$ 31.75 m).2
1 Early Environmental Recovery-Sindh Floods. Early Environmental Needs and Proposed Response. First Draft.
NDMA/UNDP 2 The loss of ecological and environmental services provided by the trees has not been included in the damage estimates.

Page | 93
aSalvage value of 20% of trees lost; PKR 20,000 per tree. b PKR 20 per sapling. c PKR 100,000 per nursery. d PKR 200,000 per office destroyed. e PKR 50,000 per office damaged.
Damage to wetlands and mangroves In many cases, the wetlands are already more contaminated than the receiving runoff, therefore net effect of
floods and heavy rains at times, is the improvement in the quality of water in the wetlands thereby improving
the service of this natural resource. However, wetlands near the settlements and/or industries can potentially
be damaged during the floods by the ingress of contaminated runoff in them. However, no estimates of such
damages are available through the government sources. Detailed studies are needed to determine the exact
nature and extent of these damages in the flood-affected areas.
Estimates of damages to the mangroves in Indus delta are also yet to be determined. The water salinity in
mangrove areas would be significantly altered due to the influx of large quantities of fresh water. However, to
determine its consequences on the mangroves, separate in-depth studies would be needed.1
Damage to cultural heritage
There are some reports of damages to the Sama Dynasty site situated west of Nindo town in Badin.2 Field
investigations are needed to assess the extent and nature of the damages as well as the restoration costs.
Estimates of Needs Disinfection of water
The cost of meeting basic needs of water with in-situ disinfection for the flood-affected population over a
period of six month has been estimated to be PKR 5,549 m (US$ 63.78 m), as shown in the Table 3.4 below.
However, this estimate has not been included in the final cost table in view of the overlap with the WATSAN
Sector.
Table-Annex3.4: Drinking Water Damages and Needs
1 A study has been conducted to assess the effects of the 2010 floods on these mangroves however its report is not available yet. 2 NDMA/UNDP, Early Environmental Recovery-Sindh Floods, Early Environmental Needs and Proposed Response,
First Draft.
Loss of Trees
Cost a (m PKR)
Damaged Saplings
Cost b (m PKR)
Damaged Nurseries
Cost c (m PKR)
Destroyed Offices
Cost d (m PKR)
Damaged Offices
Cost e (m PKR)
Sindh 689,478 2,757.9 35,000 0.7 6 0.6 8 1.6 22 1.1
Balochistan - - 1 0.1 1 0.2 9 0.5
Total Cost
2,757.9
0.7
0.7
1.8
1.6
Loss of Trees
Cost a (m PKR)
Damaged Saplings
Cost b (m PKR)
Damaged Nurseries
Cost c (m PKR)
Destroyed Offices
Cost d (m PKR)
Damaged Offices
Cost e (m PKR)
Sindh 689,478 2,757.9 35,000 0.7 6 0.6 8 1.6 22 1.1
Balochistan - - 1 0.1 1 0.2 9 0.5
Total Cost
2,757.9
0.7
0.7
1.8
1.6
Loss of Trees
Cost a (m PKR)
Damaged Saplings
Cost b (m PKR)
Damaged Nurseries
Cost c (m PKR)
Destroyed Offices
Cost d (m PKR)
Damaged Offices
Cost e (m PKR)
Sindh 689,478 2,757.9 35,000 0.7 6 0.6 8 1.6 22 1.1
Balochistan - - 1 0.1 1 0.2 9 0.5
Total Cost
2,757.9
0.7
0.7
1.8
1.6
Loss of Trees
Cost a (m PKR)
Damaged Saplings
Cost b (m PKR)
Damaged Nurseries
Cost c (m PKR)
Destroyed Offices
Cost d (m PKR)
Damaged Offices
Cost e (m PKR)
Sindh 689,478 2,757.9 35,000 0.7 6 0.6 8 1.6 22 1.1
Balochistan - - 1 0.1 1 0.2 9 0.5
Total Cost
2,757.9
0.7
0.7
1.8
1.6
Loss of Trees
Cost a (m PKR)
Damaged Saplings
Cost b (m PKR)
Damaged Nurseries
Cost c (m PKR)
Destroyed Offices
Cost d (m PKR)
Damaged Offices
Cost e (m PKR)
Sindh 689,478 2,757.9 35,000 0.7 6 0.6 8 1.6 22 1.1
Balochistan - - 1 0.1 1 0.2 9 0.5
Total Cost
2,757.9
0.7
0.7
1.8
1.6
Province Quantity of water to be dis infected per
day a (m3) Cost of in-situ disinfection b
(m PKR)
Balochistan 350 21.07
Sindh 91,788 5,527.93
Total 594,946 5,549.00
Province Quantity of water to be dis infected per
day a (m3) Cost of in-situ disinfection b
(m PKR)
Balochistan 350 21.07
Sindh 91,788 5,527.93
Total 594,946 5,549.00
Province Quantity of water to be dis infected per
day a (m3) Cost of in-situ disinfection b
(m PKR)
Balochistan 350 21.07
Sindh 91,788 5,527.93
Total 594,946 5,549.00
Province Quantity of water to be dis infected per
day a (m3) Cost of in-situ disinfection b
(m PKR)
Balochistan 350 21.07
Sindh 91,788 5,527.93
Total 594,946 5,549.00
Province Quantity of water to be dis infected per
day a (m3) Cost of in-situ disinfection b
(m PKR)
Balochistan 350 21.07
Sindh 91,788 5,527.93
Total 594,946 5,549.00
Province Quantity of water to be dis infected per
day a (m3) Cost of in-situ disinfection b
(m PKR)
Balochistan 350 21.07
Sindh 91,788 5,527.93
Total 594,946 5,549.00
a Drinking water needs: 10 liters per person per day. b Basis. Cost of in-situ disinfection of water: PKR 0.33 per
liter; water to be provided for six month.
Table-Annex 3.3: Damages to Forests and Plantation
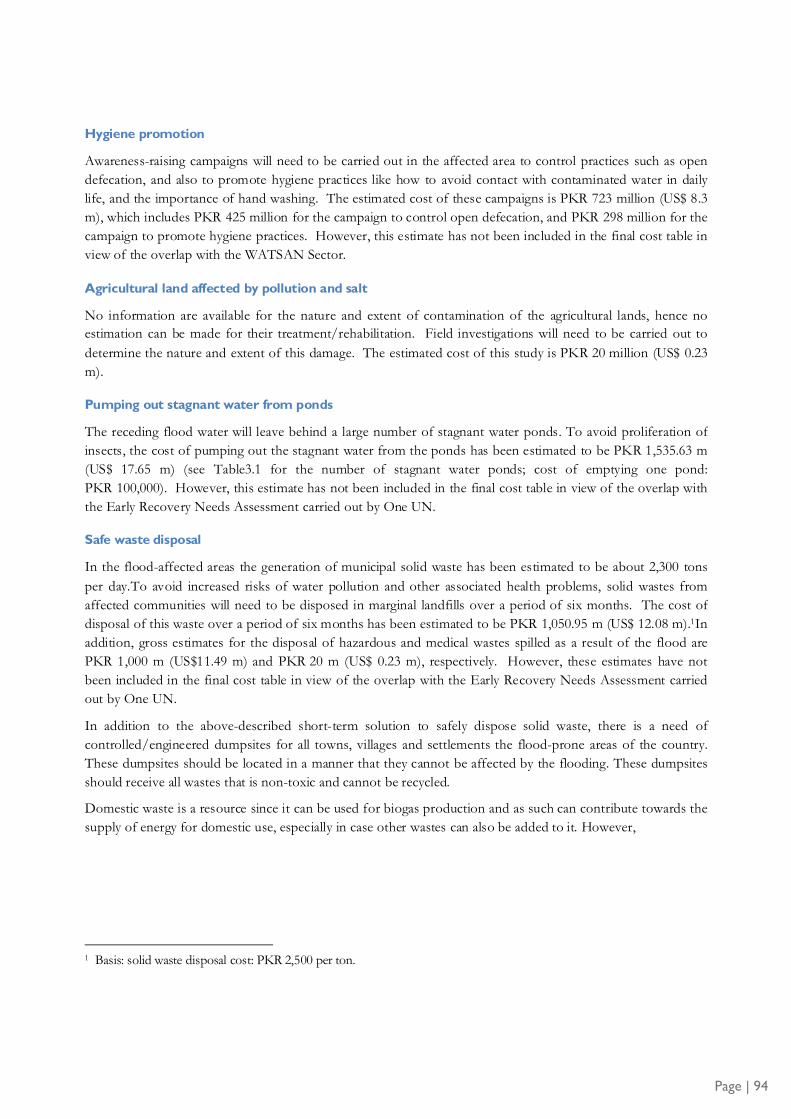
Hygiene promotion
Awareness-raising campaigns will need to be carried out in the affected area to control practices such as open
defecation, and also to promote hygiene practices like how to avoid contact with contaminated water in daily
life, and the importance of hand washing. The estimated cost of these campaigns is PKR 723 million (US$ 8.3
m), which includes PKR 425 million for the campaign to control open defecation, and PKR 298 million for the
campaign to promote hygiene practices. However, this estimate has not been included in the final cost table in
view of the overlap with the WATSAN Sector.
Agricultural land affected by pollution and salt
No information are available for the nature and extent of contamination of the agricultural lands, hence no
estimation can be made for their treatment/rehabilitation. Field investigations will need to be carried out to
determine the nature and extent of this damage. The estimated cost of this study is PKR 20 million (US$ 0.23
m).
Pumping out stagnant water from ponds
The receding flood water will leave behind a large number of stagnant water ponds. To avoid proliferation of
insects, the cost of pumping out the stagnant water from the ponds has been estimated to be PKR 1,535.63 m
(US$ 17.65 m) (see Table3.1 for the number of stagnant water ponds; cost of emptying one pond:
PKR 100,000). However, this estimate has not been included in the final cost table in view of the overlap with
the Early Recovery Needs Assessment carried out by One UN.
Safe waste disposal
In the flood-affected areas the generation of municipal solid waste has been estimated to be about 2,300 tons
per day.To avoid increased risks of water pollution and other associated health problems, solid wastes from
affected communities will need to be disposed in marginal landfills over a period of six months. The cost of
disposal of this waste over a period of six months has been estimated to be PKR 1,050.95 m (US$ 12.08 m).1In
addition, gross estimates for the disposal of hazardous and medical wastes spilled as a result of the flood are
PKR 1,000 m (US$11.49 m) and PKR 20 m (US$ 0.23 m), respectively. However, these estimates have not
been included in the final cost table in view of the overlap with the Early Recovery Needs Assessment carried
out by One UN.
In addition to the above-described short-term solution to safely dispose solid waste, there is a need of
controlled/engineered dumpsites for all towns, villages and settlements the flood-prone areas of the country.
These dumpsites should be located in a manner that they cannot be affected by the flooding. These dumpsites
should receive all wastes that is non-toxic and cannot be recycled.
Domestic waste is a resource since it can be used for biogas production and as such can contribute towards the
supply of energy for domestic use, especially in case other wastes can also be added to it. However,
1 Basis: solid waste disposal cost: PKR 2,500 per ton.
Page | 94

widespread adaptation of this technique requires extensive planning, community mobilization and awareness
raising, capacity building, and technical support.
Debris disposal
A follow-up study is recommended to carefully assess the quantity of debris to be disposed and to identify
feasible and cost-effective the disposal arrangements. The estimated cost of this study is PKR 5 m (US$ 0.06
m). The UNDP has estimated the cost of the debris disposal to be US$ 1.5 m.1
Rehabilitation of forests, plantation, and department infrastructure
The uprooted trees will need to be replanted, the damaged nurseries will need to be reestablished, and the
destroyed/damaged buildings will need to be reconstructed/repaired. The rehabilitation and reconstruction
needs of the forest resources have been estimated to be about PKR 2,676.84 m (US$ 30.77 m) as shown
below.
Table-Annex 3.5: Rehabilitation and Reconstruction of Forests and Plantation
Re-plantation of trees a
(m PKR)
Re-plantation of saplings b (m PKR)
Re-establishment of nurseries c
(m PKR)
Reconstruction of offices d (m PKR)
Repair of officese (m PKR)
Total (m PKR)
Sindh 551.58 7.00 3.00 21.00 2.20 584.78
Balochistan - - 0.50 3.00 0.90 4.40
Total 551.58 7.00 3.50 24.00 3.10 589.18
a PKR 800 per tree with two years’ maintenance:. b PKR 200 per sapling. c PKR 0.5 m per nursery. d PKR 3 m per office reconstruction. e PKR 0.1 m per office repair.
Rehabilitation of wetlands and mangroves
There is a need for an in-depth study to determine the nature and extent of damages to the wetlands and
mangroves caused by the floods. World Wildlife Fund (WWF) is conducting a similar study to assess the
damages to the mangroves caused by the 2010 floods, and its results are likely to be useful for the proposed
study. The estimated cost of this study is PKR 5 m (US$ 0.06 m).
Rehabilitation of cultural heritage sites
The Government of Sindh has estimated the damage to the cultural sites to be about PKR 16.41 m
(US$ 0.19 m). Further field investigations would be needed to determine the exact nature and extent of the
damages to the cultural heritage sites and also to identify the restoration needs. The estimated cost of this
study is PKR 2.0 m (US$ 0.02 m).
1 NDMA/UNDP, Early Environmental Recovery-Sindh Floods, Early Environmental Needs and Proposed Response,
First Draft
Page | 95

Adapting to Climate Change and Reducing the Vulnerability to Extreme Weather
Events
As evidenced by the recent floods in 2010 and 2011, Pakistan is highly vulnerable to extreme weather events.
Climate change, which is likely to result in increased intensity and frequency of these events, threatens to
revert Pakistan’s achievements in reducing poverty and stimulating economic growth. Developing the
institutional capacity to facilitate climate change adaptation is a key development challenge. Building capacity
for climate change adaptation in Pakistan involves: (i) improving the knowledge base for decision-making, (ii)
emphasizing the needs of poor and vulnerable groups, (iii) maintaining the integrity of environmental
services, and (iv) adopting a “no-regrets” approach that yields immediate development benefits while
simultaneously enhancing climate change resilience.
Strengthening the resilience of the Indus watershed involves an approach that combines non-structural and
structural measures that are strategic, feasible, and affordable to minimize vulnerability to extreme weather
events. Such an approach calls for an improved management of the Indus Basin’s major natural resources
through strengthened coordination of flood-related actions within and among the provinces, as well as “non
structural measures” consisting of a combination of actions for “living-with-floods,” including flood warning
and civil defense measures in lesser priority areas. The sustainability of outcomes depends mainly on
designing and implementing non-structural interventions. Systems that integrate naturally with existing
cultural or social institutions are likely to be relatively low cost (in terms of capital outlay and maintenance)
while providing improved security.1
Adopting a river basin management approach for this process will provide for coordinated policies and
actions by provinces most affected by floods. Furthermore, a basin-wide approach is needed to overcome
the dispersion of local institutions and inconsistent policy frameworks. There is also a need to strengthen
local rules and their administration in such a way as to overcome current deficiencies in flood protection of
the Basin and related environmental concerns. The provincial governments have the authority for flood
protection. However, current provincial legislation does not adequately provide clear regulations on land and
water resources use, which has led to development of areas highly vulnerable to flood damage.
The “living-with-floods” approach stems from the growing recognition in Pakistan that vulnerability to flood
damage is largely the consequence of human actions and choices instead of acts of nature. Attention under
this approach focuses on decisions such as where people live, where industry and commerce settles, acts of
cutting forests, and development of marginal lands. On this basis, the non-structural approach is a strategy
that encourages residents of rural areas and small communities to adapt to floods, and even to capture their
benefits when possible. It seeks to offset the negative effects of floods, and also to mitigate any negative
effects that flood control measures may cause, while at the same time complementing lands use restrictions.
The interventions described below were proposed in the 2010 floods DNA however none of them were
implemented. Therefore these interventions have been included in the present DNA as well.
1 Examples of this include: (i) design of multi-purpose schools or clinics that can also serve as emergency shelters or supply storage for storms or floods; or, (ii) use of public address systems in village mosques as part of early warning systems.
Page | 96

Flood protection master plan
A review and updation of the flood protection master plan, based on the outcomes of detailed hydrological,
hydraulic, geological, and environmental studies, is critically needed for the Indus watershed. The updated
master plan would: recommend key flood protection infrastructure for vulnerable areas in the Indus
(wetlands restoration, afforestation, riparian re-vegetation, land use plans, and others); identify areas that are
flood-prone or vulnerable to other risks and which should be protected and where development should not
be permitted; and identify areas that are safe from hazard risks and which could serve for (re)settlement
purposes. The estimated cost for such a study is PKR 595 m (US$ 6.84 m).1
Storm water drainage master plan
A storm water drainage master plan is critically needed in the Indus watershed, particularly the southern parts
of Sindh (a rapid assessment would determine priority areas). The master plan would mainly: (i) recommend
key storm water drainage and flood protection structural and non-structural interventions to minimize
vulnerability to floods and channel flood and storm water away from the heavily populated areas; and (ii)
identify, at the city level, areas that are vulnerable to flood where development should not be permitted. The
cost for studies in 14 priority urban areas would be an estimated PKR 714 m (US$ 8.2 m).
Land use plans and building regulations in urban areas
Detailed land use plans and building regulations should be prepared or, where they exist, updated in
accordance with the findings of the storm water drainage plans. These detailed land use plans and building
regulations would demarcate areas where development is permissible and regulate the characteristics of such
development. The preparation of detailed land use plans is the timely step that follows the master plan,
whereas the building regulations would need to be updated. The estimated cost for the preparation of these
detailed plans and regulations for the priority urban areas is estimated at PKR 366 m (US$ 4.2 m). Support
for the enforcement entities in the form of human resources, equipment and training would require an
additional PKR 238 m (US$ 2.73 m).
Monitoring and evaluation and information databases
The estimated needs to establish these databases are PKR 442 m (US$ 5.08 m) and would require at least
three phases (short, medium and long term) to help improving the effectiveness of interventions.
Strengthening the legal and institutional framework
The floods highlighted the lack of institutional and legal frameworks for natural resources management and
environmental control for reducing the vulnerability to manager extreme weather events or flood
emergencies. In general, the institutions in charge of implementing environmental regulations are
understaffed and have no enforcement capacity. There are no systematic environmental procedures for flood
protection. In addition, there is no coordination between the institutions in charge of promoting flood
protection infrastructure and natural resources and environmental agencies.The programs include detailed
activities for: (i) strengthening the environmental regulatory framework; (ii) strengthening environmental
management capacity of the implementing agencies of structural interventions (such as WAPDA and the
Irrigation Departments), as well as environmental protection agencies; (iii) improving local urban
environmental management and monitoring, especially regarding the sound disposal of wastes; (iv) improving
baseline knowledge of the ecology and dynamics of the riparian and floodplain ecosystem and improving
protection and management of wetlands within the project region, especially near
1 This estimate has not been included in the final cost table in view of the overlap with the Irrigation Sector.
Page | 97
Technical assistance in environmental non-structural interventions for flood protection
Given below are some of the recommended technical assistance interventions on non-structural
environmental measures.
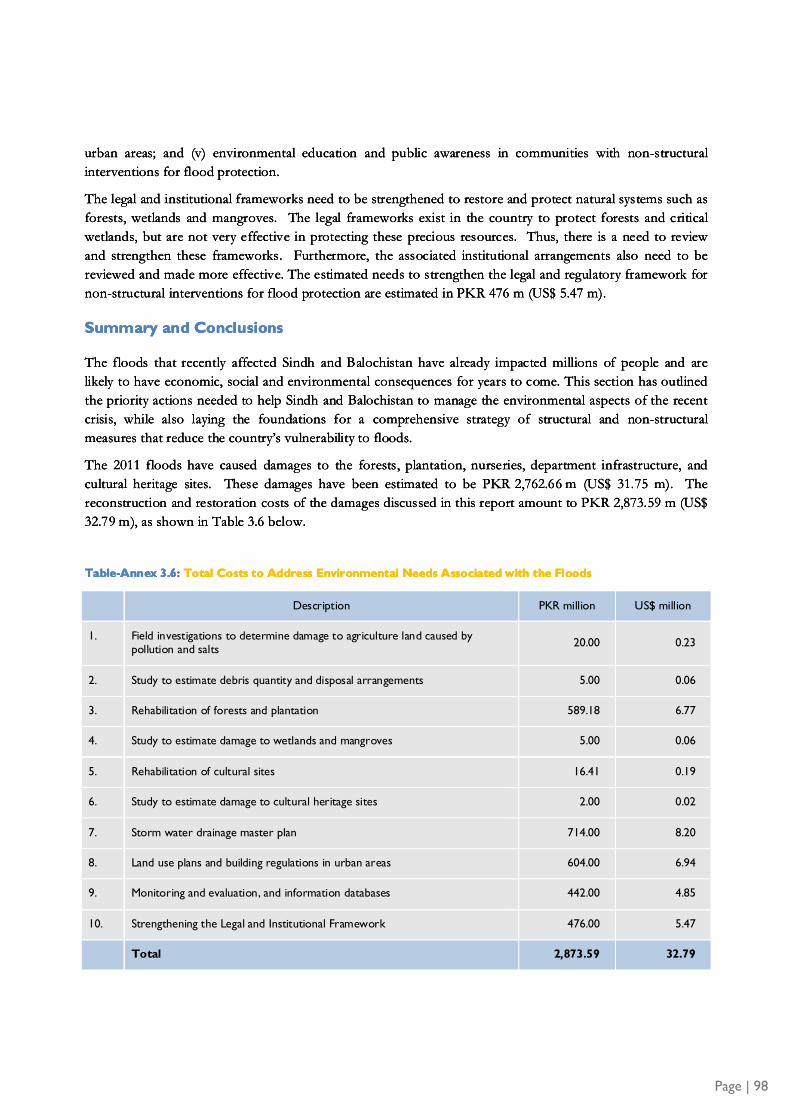
urban areas; and (v) environmental education and public awareness in communities with non-structural
interventions for flood protection.
The legal and institutional frameworks need to be strengthened to restore and protect natural systems such as
forests, wetlands and mangroves. The legal frameworks exist in the country to protect forests and critical
wetlands, but are not very effective in protecting these precious resources. Thus, there is a need to review
and strengthen these frameworks. Furthermore, the associated institutional arrangements also need to be
reviewed and made more effective. The estimated needs to strengthen the legal and regulatory framework for
non-structural interventions for flood protection are estimated in PKR 476 m (US$ 5.47 m).
Summary and Conclusions
The floods that recently affected Sindh and Balochistan have already impacted millions of people and are
likely to have economic, social and environmental consequences for years to come. This section has outlined
the priority actions needed to help Sindh and Balochistan to manage the environmental aspects of the recent
crisis, while also laying the foundations for a comprehensive strategy of structural and non-structural
measures that reduce the country’s vulnerability to floods.
The 2011 floods have caused damages to the forests, plantation, nurseries, department infrastructure, and
cultural heritage sites. These damages have been estimated to be PKR 2,762.66 m (US$ 31.75 m). The
reconstruction and restoration costs of the damages discussed in this report amount to PKR 2,873.59 m (US$
32.79 m), as shown in Table 3.6 below.
Table-Annex 3.6: Total Costs to Address Environmental Needs Associated with the Floods
Description PKR million US$ million
1. Field investigations to determine damage to agriculture land caused by pollution and salts
20.00 0.23
2. Study to estimate debris quantity and disposal arrangements 5.00 0.06
3. Rehabilitation of forests and plantation 589.18 6.77
4. Study to estimate damage to wetlands and mangroves 5.00 0.06
5. Rehabilitation of cultural sites 16.41 0.19
6. Study to estimate damage to cultural heritage sites 2.00 0.02
7. Storm water drainage master plan 714.00 8.20
8. Land use plans and building regulations in urban areas 604.00 6.94
9. Monitoring and evaluation, and information databases 442.00 4.85
10. Strengthening the Legal and Institutional Framework 476.00 5.47
Total 2,873.59 32.79
Page | 98

Annex 4: Social and Gender Impact

Page | 100
Introduction
This section highlights the social impact of the flood, particularly focusing on the socio-economic effect on
groups disproportionately affected by loss due to pre-existing poverty levels and social inequalities.
One of the major causes for flooding as reported by PDMA Sindh was the loss of natural drainage as these
lands had been taken over for cultivation or otherwise encroached upon or ‘legitimately’ given over through
local bodies. According to the PDMA, current proposals are to pass a ‘Pre-emption law’ to enable the
provincial government to repossess the lands. While the rains cannot be stopped, considerable human
suffering and loss of life could have been avoided if Government ensured maintenance and operation of the
drainage system.
Barely one year has passed since the floods of 2010 devastated the lives of an estimated 20 million people
nationwide. The flooding in 2011 is relatively localized, the impact on people and livelihoods is severe,
infrastructure damages less so. In Sindh, 19 social welfare infrastructure units1 serving a population of 37006
people are partially or fully damaged. In Balochistan2, 18,403 people were reported affected with no damage
to social welfare infrastructure.
Table-Annex 4.1:Sindh: Damage to Social Welfare Institutions
Orphanages Women Shelters Community Centres Multiple Purpose
Child Care Centre
Dar-ul-Iman Other Item
*CD **PD CD PD CD PD CD PD CD PD CD PD
2 1 5 1 2 5 1 0 0 1 1 0
Source: Social Welfare Department, Sindh
*CP =Complete Damage, **PD= Partially Damage
Social Welfare Infrastructure
Table-Annex 4.2: Social Welfare Infrastructure: Damage and Loss Figures
Provinces
Direct Damage3
(PKR millions)
Indirect Losses4
(PKR millions) Total
(PKR millions)
Public Sector *Private Sector Public Sector Private Sector
Sindh 39 NA 4.6 NA 43.6
1 Social Welfare Department, Sindh Province. Social infrastructure is defined as centers such as orphanages, Dar-ul-uman women shelters child care and rehabilitation centers 2 NDMA, September 2011 3 Including structural damage and loss of assets/equipment, etc. 4 Indirect losses cost include three women and child shelters which have been completely damaged in flood 2011

**Balochistan NA NA NA NA NA
Total (PKR millions) 39 NA 4.6 NA 43.6
*NA= Not Applicable as this includes damages to only Public sector damages, **NA=Not Applicable as no damage in Balochistan
has been reported
According to UNOCHA1, the situation remains alarming with poor coverage of all essential sectors. Failure
to meet Rabi cultivation will have severe consequences on farm dependent households. The report further
documents increasing insecurity and violence against women, boys and girls. 70% of households are reported
to not having received any shelter. As of January 2012, only 48% of funding has been received from the
Rapid Response Plan.2 The lack of data disaggregated by gender and social groups both pre and flood
affected is stark.
Vulnerable communities, most with no assets or safety nets to fall back on bear the brunt of disaster. It is the
landless rural poor, and vulnerable social groups such as ethnic minorities, elderly, children and female
headed households, the disabled that are hardest hit. The impact on households and the speed of recovery
varies, influenced by a number of factors, such as: asset ownership and resources; community and
households’ ability to cope; institutional capacity and resources available at the local level; and, crucially, the
extent of civil society and peoples’ involvement and support for proposed rehabilitation and reconstruction
measures. There is no ‘one size fits all’ solution – each intervention has to be tailored.
Flash Back 2010
According to the 2010 DNA, almost 90-100% livelihoods were affected in Sindh. Approximately 77 billion
rupees of the annual development plan was reallocated due 2010 floods; the education and health sectors
were affected by the cuts. Government of Sindh (GoS) plans to increase the current budget to adjust
forreallocation in 20103. Recovery efforts from the 2010 floods are ongoing.
Sindh was the worst hit, with 7.2 million of its people affected (40% of all those affected in Pakistan) in 17 of
its 23 districts. Damages in Sindh amounted to around US$ 4.4 billion (44% ofthe total for the country),
more than half of this was in the agriculture sector. Medium-term recovery and reconstruction is estimated to
cost US$ 2.7 billion4.
Given the restricted mobility and less exposure, women had a difficulty in obtaining funds through WATAN
cards Disasters and crisis situation adds to the vulnerabilities of poor communities who may face difficulties
in accessing transportation and other relief facilities. Government and NGOs therefore should take extra care
and prepare inclusive relief and rehabilitation programs to avoid discrimination and social and gender
exclusion
1 OCHA, Situation Report No.11, 4 November 2011 2 UN, Pakistan Floods 2011 Early Recovery Framework,January 2012
3 Verbal Communication, Planning and Development Department, GoS 4 Rebuilding Towards progress in the province of Sindh, May 2011, UNDP (draft)
Page | 101

All the while, incomes continue falling and vulnerability increasing. According to the GoS1, the province was
hit by the 2011 floods before an assessment of the impact of support on 2010 floods could be undertaken.
This resulted in gender considerations becoming an even less of an issue.
Patchy information exists in reports prepared by individual agencies, both national and international. The
absence of information on the impact of assistance on rehabilitation of peoples’ lives by NDMA, PDMAs
and GoS, leaves a major gap in understanding. According to the UN,2 following the government’s decision to
end the relief phase, the government with UN and other partners developed a strategy plan. However, the
report notes that as of July 2011, the gaps for early recovery are still very significant.
Socio-economic Baseline
For many years, Pakistan has been struggling not only with natural disasters but also issues related to security,
conflict, political and economic turmoil. It has low social development indicators, the Legatum Prosperity
Index 2011 ranks Pakistan 86th for entrepreneurship and opportunity, 96th for economy and health, 100th for
Social Capital, 104th for personal freedom, 105th for education and 109th for safety and security out of 110
countries. Human Development Index 2011 ranks Pakistan 145 out of 187 countries3. Pakistan has a4 Gender
Inequality Index (GII) value of 0.573, ranking it 115 out of 146 countries in 2011. More than 50 percent of
Pakistan’s people suffer from multiple deprivations5. According to a 2008 UN joint assessment it is estimated
that 45 million are severely food-insecure6 and almost 40% of children are underweight. The literacy rate for
over ten years is 57%,7 being much higher in urban than rural areas and higher for men than for women.
Unlike the 2010 floods, it is mostly the poor and vulnerable who are hit this time including the poor coastal
communities in Thatta (second least developed district in Sindh) and Badin. Sindh has the largest number of
rural poor in the country, the highest absolute number of landlessness (62%) and the lowest (26%) share of
land ownership in Pakistan.8 Sindh and Balochistan face child malnutrition, posing a major challenge to
achieving both the millennium development goals and economic growth.9
1 Verbal Communication, Planning and Development Department, GoS 2 One Year On 2011, Pakistan Floods , United Nations Flood Response 3 The 2011 Legatum Prosperity Index™ Rankings, Legatum Institute, London UK www.prosperity.com 4 The Gender Inequality Index (GII) reflects gender-based inequalities in three dimensions – reproductive health, empowerment and economic activity. Reproductive health is measured by maternal mortality and adolescent fertility rates; empowerment is measured by the share of parliamentary seats held by each gender and attainment at secondary and higher education by each gender; and economic activity is measured by the labour market participation rate for each gender. The GII replaced the previous Gender related Development Index and Gender Empowerment Index. The GII shows the loss in human development due to inequality between female and male achievements in the three GII dimensions. Source: UNDP HDR 2011. 5 Government of Pakistan, Economic Survey, Ministry of Finance, 2010-11 6 World Food Program at http://www.wfp.org/countries/pakistan 7 Pakistan Social and Living Standards measurement survey (PSLM 2008-2009) 8 Government of Pakistan, 2003. Pakistan Agricultural Census 2000. Islamabad: Agricultural Census organization 9 Nutritional Survey 2011 Ministry of Health (MOH) and Agha Khan University (AKU)
Page | 102

Table-Annex 4.3: Selected Social Indicators
Social Indicators Sindh Balochistan Pakistan
Primary NER 53 47 56
Middle NER 19 13 20
Literacy 10 years or older 59 41 58
Full immunization (12-23 months) 75 53 81
Tetanus Toxoid (% of Married Women aged 15 49years)
60 31 69
Piped Water as Main Source of Drinking Water 43 35
Flush type Toilet Used by HHs 62 31
Perceptions
Economic Situation of HHs
(Worse & Much Worse) 39.44 50.07 42.79
Economic Situation of Community
(Worse & Much Worse) 33.25 44.97 28.73
Satisfaction with Public Services
Basic Health Units 30.21 42.48 30.70
Family Planning Services 9.98 7.81 11.52
Schools 55.90 52.99 60.92
Veterinary Hospitals 10.93 11.69 14.83
Agriculture Extension Services 20.06 10.57 14.78
Data Source Note1
Institutional Linkages
The 2007 National Disaster Risk Management Framework sets out a comprehensive structure for response,
and several detailed contingency plans for flood disasters were in place prior to 2010. Pakistan has not,
however, agreed upon a national framework, which covers population displacement brought about by natural
disasters, conflict and other causes.
1 Pakistan Social and Living Standards Measurement Survey (PSLM), 2010-11 Statistics Division, Government of Pakistan, Islamabad, September, 2011
Page | 103

Policy development in this area remains ad hoc, and the above-mentioned framework does not address the
phenomenon as defined by the Guiding Principles on Internal Displacement. The principles provide a useful
framework for efforts to recognize and fulfill the rights of people displaced by disasters.1Provincial Disaster
Management Authorities (PDMAs) and District Disaster Management Authorities (DDMAs) have also been
set up, as is the case for Sindh province. Frequent transfer of staff, lack of technical capacity, coordination
and clearly defined roles and responsibilities hamper effective response. The operations focal was of the view
that costing for damages is the responsibility of the planning and development department.2
The gaps and loopholes in the availability of the data within the public departments, the process of collection
of data and capacity of NDMA, PDMAs and DDMAs were found to be the hardest areas of queries3.At the
district and provincial levels, particularly the line agencies, the capacity to collect relevant baseline data
including the absence of reliable pre-flood data is telling.
In Sindh, the Women Development Department has no presence in the districts and limited technical
capacity and resources to respond to disaster. The Social Welfare Department notified a Rain Relief Cell in
September, which is similarly hampered by lack of resources for rapid response. The provincial social welfare
departments hampered by lack of resources and technical capacity are ill equipped to respond to the welfare
needs in non-emergency situations let alone in emergencies. The Balochistan social welfare department
confirmed that they had no transport at the provincial level, and at the district level, the officers did not even
have a bicycle. Information flow critically important from the village, district to provincial level is limited or
non-existent. Relief committees formed by the Sindh government, has politicized the distribution of relief
goods. Such actions negatively impact the role of local administration
In most cases, providing safety was not a priority of line departments. They were in need of learning new
skills, training in the use of new technology e.g. mapping through GIS, and guidance in motivating the
people. Uncoordinated work resulted in too much attention to easily accessible areas and complete neglect of
difficult areas4
Social Impact (Sindh and Balochistan)
The UN5 reported that 2.5 million children and 1.2 million women were affected by the floods in 2011, while
744,000 people were dislocated. With 46% of health facilities damaged, the vulnerabilities of women and
children have increased in the affected areas. The children who are pushed out of schools are over 733,000
where 60% schools are damaged in Sindh alone. Acute Respiratory Infections (ARI) and skin infections
1 Source: Briefing paper on flood-displaced women in Sindh Province, Pakistan. Flood-displaced families in Shahdadkot district, Sindh. (IDMC, April 2011).June 2011,Presented at the Nansen Conference on Climate Change 2 Source DNA Mission Report: The household level related data is kept and maintained by the census department and DC office has no information. The DC office keeps and maintains the land record. The land record is collected by the patwari and sent to mukhtiarkar who shares this with the DDO and he shares it with the DC office. All land records are computerized now in compliance with the court order and no record was damaged during the floods. No information was available about any possible tampering of records at the patwari level. The land ownership of women if any was very little and no substantial information could be gathered. 3 DNA, field team visits and discussions 4 UN habitat, partners meeting, 3 November, 2011 Islamabad 5 UN, Pakistan Floods 2011 Early Recovery Framework,January 2012
Page | 104

represent major health risks in flood affected areas1. Women are at high risk due to disruption in the
provision of pre and post natal care.
Migration has taken place largely due to unavailability of fodder in flood affected areas. Approximately, 10-
15% of the affected population is engaged in non-farm livelihoods, including fisheries which are severely
affected by the rains.
Loss of Assets and Livelihoods
Large-scale destruction of schools is affecting the education of more than 733,000 children with 60% children
out of school due to damaged facilities and absence of teachers.
In Shaheed Benazirabad district 75% population depends on agriculture. Cotton is the major crop and
cultivated in 60% land followed by sugar cane and banana. The first cotton crop, which was ready for picking,
was not picked due to the month of fasting. The rain fall intensified on 26 August and the first harvest was
lost. More than 70% of the cotton crop was damaged, 40 – 45% of the sugarcane crop was damaged, banana
orchards were totally or partially damaged in 40% of the affected area and mango and lemon orchards were
completely damaged (CD)2. Land degradation has intensified and production decreased. Crime is increasingin
the affected areasexacerbating the vulnerability of the women and children3.
The social impact can be gauged by the decrease in income due to land degradation and temporary
interruption in use of land, agricultural unemployment, and lack of alternatives outside agriculture. Field visits
to Benazirabad indicated the crime rate increased. Some internal migration has been noticed e.g. most of the
Sanghar populations were migrants from Tharparkar. Now due to heavy rains and less availability of dry land,
many families have migrated back to Tharparkar.
As per NDMA’s daily emergency and response situational information report (as of 5 Nov 2011), total
346,709 tents and 3,368,144 ration packs were distributed to the affected families of Sindh.4
Impact on Vulnerable Groups
Catastrophic events that impact on basic human needs disproportionately affect the most vulnerable groups;
children, minority groups, the elderly, the landless tenants, people with special needs and women’s
vulnerability also increases. Existing vulnerabilities are exacerbated, and new vulnerabilities emerge as some
who were previously economic secure are now unable to meet their daily needs. Flooding in summer means
people face additional hardship as winter approaches. In Pakistan, 8 percent of households with children that
were hit by income shocks took their children out of school and 10 percent of households had to put their
child to work.5 Sindh and Balochistan have low social development indicators, landlessness in Sindh is high,
and people have few assets and limited ability to deal with shock. Research is essential to understand how
households cope, track their progress and provide relevant support where needed.
1 OCHA Situation Report No.7, October 2011 2 DCO, Shahid Benazirabad, Verbal communication 3 DNA team field visit, verbal communication local government and CSOs, November 2011 4 NDMA – Information Management Unit Daily Emergency & Response Situational Information
Report 5th November 2011 5 ibid
Page | 105

The 2011 floods added to vulnerabilities of marginalized communities; Balochistan stands out as the province
with the weakest social development1. The latest PSLM (2010) social indicators show that both Sindh and
Balochistan are below national averages on Primary Net Enrollment Rate (NER) and Middle NER2. Sindh is
somehow better than the national average for literacy whereas Balochistan stands below the national average.
Health practices in Sindh and Balochistan in terms of full immunization and Tetanus Toxoid are below the
national average. Both Sindh and Balochistan have low access to safe drinking water whereas less than 45%
population is provided with piped drinking water.3 Sanitation practices in terms of HHs using flush type toilet
are somewhat more encouraging in the case of Sindh as compared to Balochistan. The 2011 floods are
expected to add high pressure on almost 50.07%4affected HHs of Balochistan and on some 39.44% of Sindh,
based on indicative figures in 2011 PSLM.
There is likely to be an acute shortage of onion, chilies, tomato and other vegetables during winter5. Rice, a
key staple has also been badly damaged. It would seriously affect food security and availability of seeds in the
next season. Small farmers will lose contracts to cultivate in the coming season due to loss of bulls. Many on-
farm and off-farm jobs will be lost in cotton farms due to loss of cotton related subsidy. Loss of the cotton
cropwould also lead to loss of jobs for women cotton pickers6. In Sindh, specifically in Benazirabad, land
ownership pattern is self cultivation by small land holders, daily wagers, part and quarter time tenants. It is
most likely that low crop productivity will severely affect both tenant groups. Moreover, the recent floods has
increased land salinity and added to land degradation. This not only turns out to be long term assets loss but
also affects crop productivity. The small farmers are already under heavy debt and are unable to get new loans
due to the absence of collateral.
Guidelines for public private partnership under new institutional, legal and regulatory framework require that
all public project proposals should assess impact on women and explore employment opportunities for them
and deliver benefits to both men and women7. However, the UN flood response report mentioned increased
risk of possible sexual and physical abuse, child abuse, child labor, bonded labor, trafficking, honor killing and
forced marriages among the affected population8.
Impact on Food Security
FAO9 damage assessment highlights possible acute shortage of onion, chilies, tomato and other vegetables
during winter. The long term storable food including rice has been badly damaged and will lead to seeds and
grains shortage adding concerns for food security. In Balochistan the populations living in hilly areas of
affected districts had been able to secure some stocks for a few months but as soon as the stocks deplete,
these HHs will be badly affected. Farming households are directly affected by floods whereas non-agriculture
1 Balochistan Economic Report; From Periphery to Core (Volume II): Full Report, May 2008, (World Bank Report No. 40345-PK) 2 Pakistan Social and Living Standards Measurement Survey (PSLM), 2010-11 Statistics Division, Government of Pakistan, Islamabad, September, 2011 3 ibid 4 ibid 5 FAO, SUPARCO PAKISTAN RAIN/FLOOD 2011 September 24) 6 FAO Preliminary Flood Damage: An Inside View September 2011 7 ADB Fact sheet 31 December 2010 8 United Nations Pakistan Floods: One year On Islamabad, 2011 9 FAO Preliminary Flood Damage: An Inside View September 2011
Page | 106
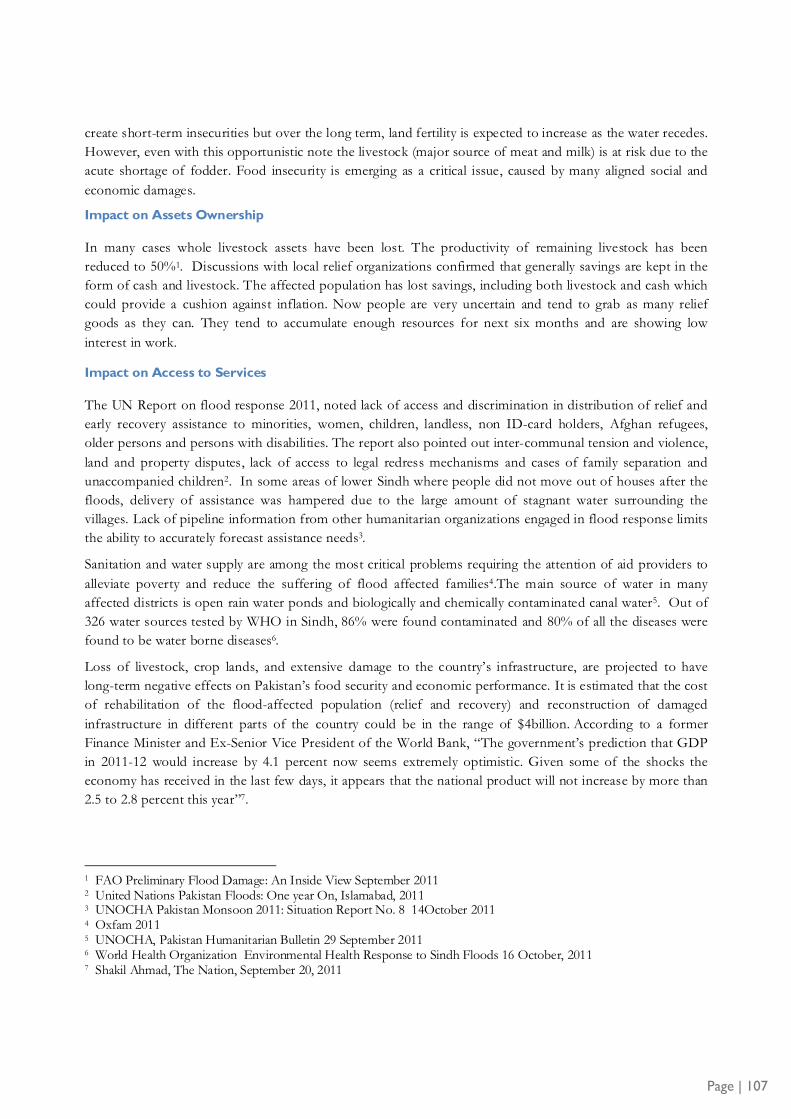
create short-term insecurities but over the long term, land fertility is expected to increase as the water recedes.
However, even with this opportunistic note the livestock (major source of meat and milk) is at risk due to the
acute shortage of fodder. Food insecurity is emerging as a critical issue, caused by many aligned social and
economic damages.
Impact on Assets Ownership
In many cases whole livestock assets have been lost. The productivity of remaining livestock has been
reduced to 50%1. Discussions with local relief organizations confirmed that generally savings are kept in the
form of cash and livestock. The affected population has lost savings, including both livestock and cash which
could provide a cushion against inflation. Now people are very uncertain and tend to grab as many relief
goods as they can. They tend to accumulate enough resources for next six months and are showing low
interest in work.
Impact on Access to Services
The UN Report on flood response 2011, noted lack of access and discrimination in distribution of relief and
early recovery assistance to minorities, women, children, landless, non ID-card holders, Afghan refugees,
older persons and persons with disabilities. The report also pointed out inter-communal tension and violence,
land and property disputes, lack of access to legal redress mechanisms and cases of family separation and
unaccompanied children2. In some areas of lower Sindh where people did not move out of houses after the
floods, delivery of assistance was hampered due to the large amount of stagnant water surrounding the
villages. Lack of pipeline information from other humanitarian organizations engaged in flood response limits
the ability to accurately forecast assistance needs3.
Sanitation and water supply are among the most critical problems requiring the attention of aid providers to
alleviate poverty and reduce the suffering of flood affected families4.The main source of water in many
affected districts is open rain water ponds and biologically and chemically contaminated canal water5. Out of
326 water sources tested by WHO in Sindh, 86% were found contaminated and 80% of all the diseases were
found to be water borne diseases6.
Loss of livestock, crop lands, and extensive damage to the country’s infrastructure, are projected to have
long-term negative effects on Pakistan’s food security and economic performance. It is estimated that the cost
of rehabilitation of the flood-affected population (relief and recovery) and reconstruction of damaged
infrastructure in different parts of the country could be in the range of $4billion. According to a former
Finance Minister and Ex-Senior Vice President of the World Bank, “The government’s prediction that GDP
in 2011-12 would increase by 4.1 percent now seems extremely optimistic. Given some of the shocks the
economy has received in the last few days, it appears that the national product will not increase by more than
2.5 to 2.8 percent this year”7.
1 FAO Preliminary Flood Damage: An Inside View September 2011 2 United Nations Pakistan Floods: One year On, Islamabad, 2011 3 UNOCHA Pakistan Monsoon 2011: Situation Report No. 8 14October 2011 4 Oxfam 2011 5 UNOCHA, Pakistan Humanitarian Bulletin 29 September 2011 6 World Health Organization Environmental Health Response to Sindh Floods 16 October, 2011 7 Shakil Ahmad, The Nation, September 20, 2011
Page | 107

It is essential that Government adopts a rights-based development approach to reconstruction. Sind has been
hit twice, although not all districts were affected twice, the overall impact on the people should not be
addressed through limited relief and recovery support.
The challenge lies in looking beyond relief, beyond restoration to improving lives and providing opportunities
for safe and secure lives. Failure to redress existing structural inequalities means many affected people risk
falling into chronic poverty and will not have an opportunity to lead a dignified life.
Gender Impact
Disasters are not gender neutral. However, gender-differentiated outcomes of a disaster seldom occupy
critical and central spaces in public policy. Men and women have different priorities and should be
differentially engaged in the reconstruction process. However, recognition of the effects and outcomes of
flood 2011 on the lives of female-headed households, ethnic minorities and women and girls in general would
remain a challenge, as gender is not a priority in actual practice. Additionally, lack of data precludes a
comparative analysis of borrowing and debt amongst women and men separately, and it is impossible to
discern in a sectoral approach how the destruction of irrigation canals, environment, or railway links, causes
losses to men and women separately. There was no gender and income based disaggregated data available to
target the most vulnerable groups for assistance. Data provided by the Multi Cluster Risk Analysis (MCRA) is
based on sample survey and cannot be used in identifying and reaching out to most vulnerable groups1.
Lack of availability of female hygiene kits, undergarments, emergency lights and separate toilet and bathing
facilities for women and girls exacerbate their vulnerability.2Women are more vulnerable to food insecurity
especially in terms of nutritional needs. While standing water and flooding posed health risks for all but
specifically for pregnant and lactating women. The field visit reports of various NGOs reveal that women’s
workload and responsibilities have increased many folds, women and the elderly face difficulties in acquisition
of relief goods.
While looking at the institutional arrangements within public and donor sectors, NDMA has established a
“Gender and Child Cell” which has begun a consultative process at the federal and provincial levels to
develop a draft policy on Gender Priority in Disaster Management3. GoS has deputed a Women
Development Secretary for Provincial Development Working Party (PDWP) to ensure gender inputs into
policy making, public spending and project implementation. Gender is officially included in the vision and
mandated objectives of all UN agencies, INGOs and key NGOs that are participating in disaster risk
reduction and reconstruction for flood 2011. However, it has been observed that gender analysis is not
prioritized or a sustained practice. Each sector has its own dynamics and integration of gender in an
individual sector demands a deeper understanding of the issues through a gender lens.
The aftermath of the floods 2011, similar to the 2010 floods, provides an opportunity to transform the basic
inequalities, poor governance and social injustices, which laid the groundwork for such destruction. The scale
of the disaster creates an opportunity to revisit the policy tools and institutional arrangements. The disaster
highlighted the profile of specific vulnerabilities, such as gender and social exclusion, which provide
1 UN Women , ADB, World Bank, CSO , Workshop, November 1, 2011 2 UNOCHA Pakistan Monsoon 2011:Situation Report No. 8 14October 2011 3 Source: http;//www.pakistantoday.com.pk/2011/10/ndma-starts-series-of-workshops-on-gender-issues/
Page | 108

government and civil society with a unique opportunity to address the root causes of gender inequity and
social exclusion.
Aid Effectiveness, Governance, Social Accountability and Grievance Redress
While the Government has yet to release a report that documents the impact of assistance for the 2010 flood;
discussions with several agencies indicated an absence of a coordination and coherent approach for disaster
management. While immediate support and humanitarian relief is essential, equally important is the GoP’s
stated commitment to development. Pakistan’s continuing exposure to disaster with poor development
indicators demands a longer term commitment by the state: to deliver basic human needs and development
and not a return to pre-flood or pre-recovery standards.
The effective delivery of support and services requires sound baseline information. Disaggregated
information on households and at the individual level should be available from the tehsil to the province.
Information crucial to provide targeted support and to enable speedy identification of people requiring
special attention should be known before the disaster hits.
The destruction caused by the recent floods created and exacerbated serious governance issues both within
the public sector and for the affected population at large. It is evident that direct damages while substantial
are not a major impediment for sector recovery and reconstruction. The indirect losses and strains on systems
are more important and need to be addressed. Broadly speaking: (a) capacity to govern reconstruction has
diminished and been exacerbated by the floods; (b) flood affected population's entitlements are at risk and (c)
the provinces are also strained due to worsening law and order1. Social unrest is already on the increase and
will complicate the reconstruction efforts. Support for law enforcement will be vital.
Aid must be better coordinated, focused and systematic. Information shared with the DNA team indicates
overlapping tasks by different agencies working in isolation and failing to adequately address needs. A supply
driven approach fails to respond to local needs and coverage.
Humanitarian relief, recovery and reconstruction are a continuum toward development. While agency funding
requirements are separated and bound by policy and financing decisions, suffering and deprivation resulting
from disasters and exacerbated by pre-existing inequalities, do not fit neatly into compartmentalized boxes.
Post-flood reconstruction will require assessment of households requiring longer term support to return to
improved, secure lives. Vulnerable groups require special attention. Shelter linked to property rights,
nutrition, food security and livelihoods require urgent, long term support. The provision of basic human
needs with opportunities for improved and secure lives must be ensured. It is essential that reconstruction
efforts are designed with sensitivity to household needs. Government must lead efforts to immediately
establish dedicated, trained personnel at village level and DDMAs to identify and support households,
manage grievance, monitor and report on reconstruction efforts. NDMA and PDMAs play a critical role in
establishing standards, oversight, transparency and securing support for focused, longer-term development
efforts.
1 DNA , Governance Report, 2010
Page | 109
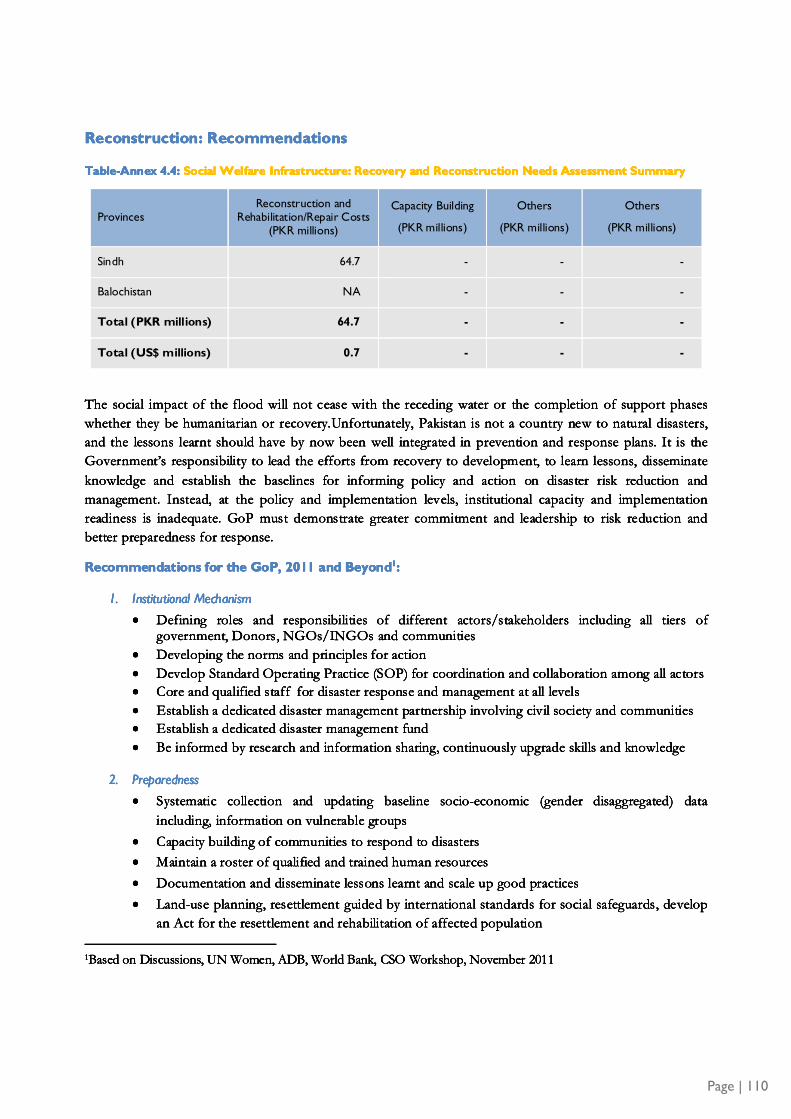
Page | 110
Reconstruction: Recommendations
Table-Annex 4.4: Social Welfare Infrastructure: Recovery and Reconstruction Needs Assessment Summary
Provinces Reconstruction and
Rehabilitation/Repair Costs (PKR millions)
Capacity Building
(PKR millions)
Others
(PKR millions)
Others
(PKR millions)
Sindh 64.7 - - -
Balochistan NA - - -
Total (PKR millions) 64.7 - - -
Total (US$ millions) 0.7 - - -
The social impact of the flood will not cease with the receding water or the completion of support phases
whether they be humanitarian or recovery.Unfortunately, Pakistan is not a country new to natural disasters,
and the lessons learnt should have by now been well integrated in prevention and response plans. It is the
Government’s responsibility to lead the efforts from recovery to development, to learn lessons, disseminate
knowledge and establish the baselines for informing policy and action on disaster risk reduction and
management. Instead, at the policy and implementation levels, institutional capacity and implementation
readiness is inadequate. GoP must demonstrate greater commitment and leadership to risk reduction and
better preparedness for response.
Recommendations for the GoP, 2011 and Beyond1:
1. Institutional Mechanism
· Defining roles and responsibilities of different actors/stakeholders including all tiers of government, Donors, NGOs/INGOs and communities
· Developing the norms and principles for action
· Develop Standard Operating Practice (SOP) for coordination and collaboration among all actors
· Core and qualified staff for disaster response and management at all levels
· Establish a dedicated disaster management partnership involving civil society and communities
· Establish a dedicated disaster management fund
· Be informed by research and information sharing, continuously upgrade skills and knowledge
2. Preparedness
· Systematic collection and updating baseline socio-economic (gender disaggregated) data
including, information on vulnerable groups
· Capacity building of communities to respond to disasters
· Maintain a roster of qualified and trained human resources
· Documentation and disseminate lessons learnt and scale up good practices
· Land-use planning, resettlement guided by international standards for social safeguards, develop
an Act for the resettlement and rehabilitation of affected population
1Based on Discussions, UN Women, ADB, World Bank, CSO Workshop, November 2011

3. Transparency and Accountability
· Transparency and equity in recovery assistance
· Establishment of localized Gender responsive grievance redress mechanisms
· Expand and strengthen ombudspersons functions at all levels
· Access to information
· Independent impact evaluation by third party and public disclosure by all stakeholders
· Establish mechanisms for governance effectiveness
Page | 111

Annex 5: Agriculture, Livestock and Fisheries

Sector background
Agriculture is a key sector of the Pakistan’s economy and accounts for 21% of GDP, 45% of employment
and 60% of exports. Sindh has 30% and Baluchistan 8% share in the national Agricultural GDP. The
livelihood of more than 60% of the total population is directly or indirectly dependent on agriculture sector.
Furthermore, agriculture sector has strong backward and forward linkages and as a result has a large impact
on overall economic performance. The sector’s performance has been weak over the last few years recording
a growth of around 2% per year, mainly due to the crop subsector. The performance of the livestock
subsector has remained healthy and its share in Agriculture GDP has surpassed the crop sector standing at
around 55%. Due to limited rainfall, less than 240 mm in an average year, crop production is dependent on
irrigation and more than 80% of land is irrigated. There are two main cropping seasons, namely, Kharif
(summer) and Rabi (winter). The Kharif season starts in April and ends in October, and the main crops
during this season are cotton, rice, sugarcane, maize, pulses, fruits and vegetables. The Rabi season, which
starts in October and ends in April, is dominated by wheat production which is the main staple food in
Pakistan. Other Rabi crops include fodder, vegetable, fruits. Commercial production of fruit and vegetable,
particularly for the main urban markets has increased rapidly in recent years, particularly close to major cities
or where agro-climatic conditions are favorable. Important fruits include mangoes, citrus, dates and banana in
the tropical and subtropical areas like Sindh, as well as a range of semi-temperate fruits like grapes, peaches,
apples in Baluchistan. Important vegetables include potato, tomato, chilies and onions.
Small farmers dominate the agriculture production system but have limited access to assets. Small farms with
an average 1.4 ha land are 87% of total 6.6 million farms and their share in the total cultivated land is 38%.
The majority of small farmers cultivate their own lands but a substantial proportion are share croppers, many
of them “tenants at will” having no acquired rights and providing one third or half into the total cost of the
inputs as well as all labor. In many areas, particularly in Sindh, a number of land holders are operating large
commercial farms, particularly fruit orchards.
Livestock is an integral part of the farming system and is the main asset for many farmers. Buffalo and cattle
are mainly kept for milk, with draft power, meat and hides being other important products. Most households
also have sheep, goat and poultry for domestic consumption as well as for sale. Fodder, wheat straw, maize
thinnings and stover are used for livestock. Animals are also grazed on rangelands (particularly in
Balochistan), pastures and crop stubble. Concentrate feed is widely used in commercial poultry farms and for
lactating cattle. In addition to the settled agricultural population, there are also a significant number of
transhumants (Gujars) who move within the country as well as in the region and specialize in the rearing of
sheep and goat. Their animals are mostly for sale to the large urban centers particularly during Eid times
when it is traditional to sacrifice sheep or goats.
As in the case of crops, small farmers dominate the sector. More than 50% of the cattle and buffalo are
maintained in a herd size of less than 6 animals and over 60% of the goat population is kept in flocks of less
than 30 animals. However, in Balochistan there are often large flocks of animals that are grazed in the arid
and semi-arid areas. Sixty percent of the sheep population however is kept in units of 50 to 350 animals,
particularly in Baluchistan. In recent years, there has been a rapid growth of medium to large-scale
commercial enterprises in dairy and poultry, mainly to supply the needs of urban areas.
Page | 113

On-farm irrigation system1, which conveys water from the distributary canals to the crops, is an integral part
of the overall irrigation network of the country. This system comprises a dense network of watercourses that
are partially lined in most cases. To enhance the of water use efficiency, low pressure drip irrigation and laser
land leveling technologies are being introduced in the country. There arearound 140,000 thousands of
watercourses in the country with 50,000 in Sindh. In addition to the surface irrigation system there are some
0.9 million tubewells in the country. These tubewells provide irrigation in almost 4 million ha and
supplementary water in another 8 million ha of canal irrigated areas especially during the Rabi season.
Pakistan has a significant fisheries sector producing about 1 million tons of fish products annually. About two
thirds of this is from marine sources (70% from Sindh) and mostly comprise prawn and demersal species.
The rest is from inland sources. Inland fisheries, was largely restricted to the main rivers and canals.
However, in recent years there has been a rapid increase in aquaculture with many farmers using small ponds
and other water bodies. Supplies of fingerlings come from a few large Government hatcheries but there has
been a rapid increase in private sector activity in the areas particularly in Sindh.
Lessons from 2010 Flood Recovery Response
The Detailed Livelihood Assessment2 carried out in June – July 2011 confirmed that livelihood recovery is
happening in those areas affected by the 2010 floods, however, it is slower in Sindh than in other provinces
and is certainly not complete. Amongst other things, there are some clear differences in recovery and needs
between male and female headed households. Pertinent findings from the DLA include the following:
Agriculture
60% of households reported that their Rabi harvest for 2010-11 was significantly reduced from a normal year,
and area planted for Kharif 2011 was between 10% and 20% lower than normal. On average households
expected a Kharif harvest of about 25% below the usual level.
Livestock
For all types of livestock (large ruminants, small ruminants and poultry) the DLA data indicates that there has
been no recovery in household ownership in the districts most affected by the 2010 floods. Only in Thatta
there were some signs of recovery in large livestock numbers (and this will have been negatively affected by
the 2011 flood), and in Qambar Shahdadkot for poultry.
Debt
The proportion of heavily indebted households appears to have risen since the immediate post-flooding
period, as families still struggle to recover and meet their daily consumption needs. Indeed, meeting food
consumption needs (as opposed to investment in productive assets) was by far the most common reason for
increased household debt.
Outreach of external assistance
During the six months up until July 2011, a large majority of interviewed households did not receive any
agricultural assistance (70% of households) or livestock assistance (90% of households). In contrast, about
50% of interviewed households received cash assistance through the government watan card system. Most of
1 The DNA analysis of the irrigation system (which includes, barrages, main and branch canals, distributaries, and
minors) has been done by another group. This report covers only the tertiary (i.e. on-farm) irrigation system. 2 The DLA was conducted in the 28 severely affected districts of 2010 floods in Pakistan.
Page | 114

those households who did receive assistance felt that it was of some help, although sizeable minorities felt
that it was no or little help. A key reason for this was quantity: households complained that there was not
enough assistance.
Implications for response
Subsequent to the DLA, provincial consultations were undertaken to draw out some of the implications for
response. The provincial deliberations tended to reinforce the conclusions from the DLA itself in terms of
priorities for continued support to rural livelihood recovery in 2010 flood affected districts. In particular the
need for:
· Continued support for agricultural inputs for the Rabi season
· Restocking of poultry and small ruminants
· Intensified veterinary assistance for large ruminants to improve animal health
· Continued rehabilitation of irrigation infrastructure – linked to cash for work schemes
· Continuation and expansion of Watan scheme and encouragement of other cash grant schemes for poor
and vulnerable households.
Floods Damage - Overview of Agriculture Sector
Heavy monsoon rains caused renewed and devastating flooding in southern Sindh and northern parts of
Balochistan provinces. The subsequent breaches in the drainage canal (LBOD) at several locations resulted in
submerging of vast areas. While it was mostly the right side of the river Indus hit by floods last year, this time
it was mostly the left side. In Sindh, the central and southern districts of Badin, Dadu, Hyderabad, Kamber
Shahdadkot, Khaipur, Larkana, Matiari, Mirpurkas, Neushero Feroze, Sangar, Shahid Benazirabad, T.
Allahyar, T.M. Khan, Thatta, Tharparker, Umerkot have been the worst affected1. The Provincial Disaster
Management Authority (PDMA) and the Sindh Department of Agriculture Extension estimate that standing
crops of cotton, rice, sugar cane, sorghum, vegetables and pulses have been destroyed on about 0.84 million
hectares of land. Similarly the livestock sub sector also suffered heavy losses. The Directorate of Animal
Husbandry, Sindh has reported that approximately 115,500 livestock have perished and about 5 million
surviving livestock have been directly affected.
Direct Damages
Crops
Substantial damages were reported for crops due to the flood. The flowing water uprooted, or caused
lodging, in standing crops. Short crops like cotton, tomato, chillies and rice mostly died because of drenching
in water for several days. As shown in the Table below, a total of about 881thousand ha. (53%) of the planted
areas was affected. The most affected crops are cotton with 74% damage, rice 33%, sugarcane 34%,
vegetables 79% and fruits 32%.
1Pakistan Food Security Cluster, Guidance on Emergency and Recovery Interventions in Sindh: 2011 - 2012
Page | 115
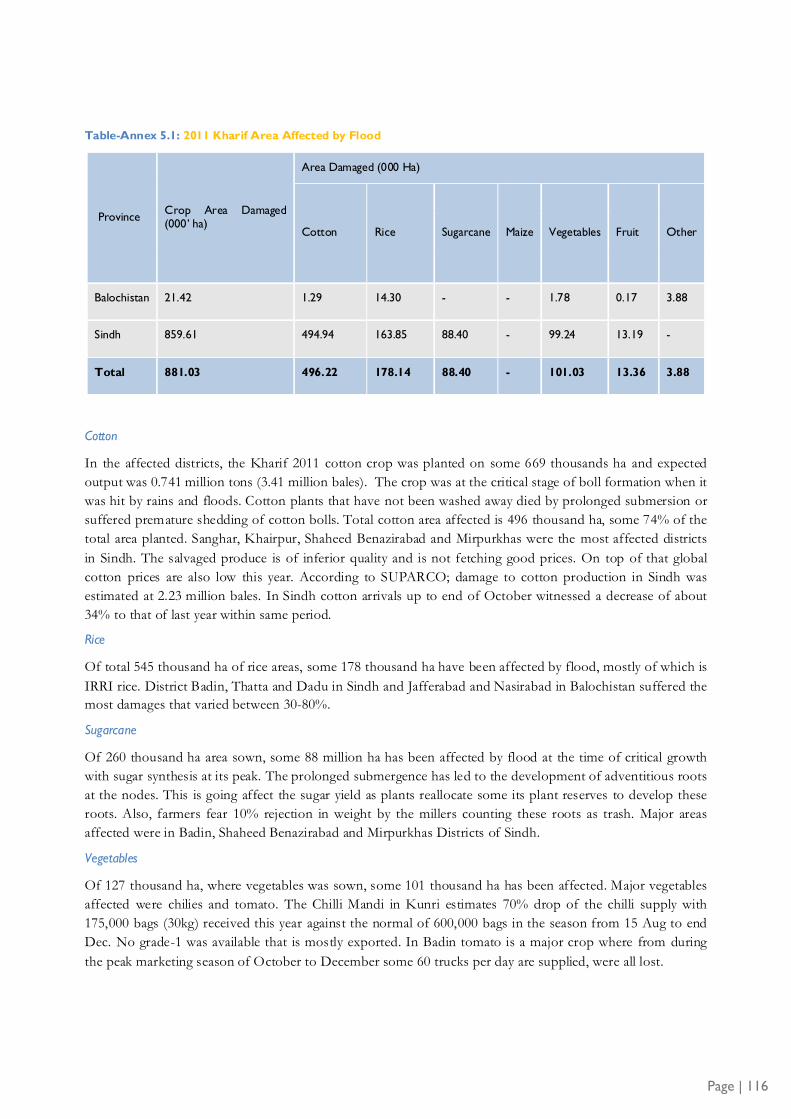
Table-Annex 5.1: 2011 Kharif Area Affected by Flood
Province
Crop Area Damaged (000’ ha)
Area Damaged (000 Ha)
Cotton Rice Sugarcane Maize Vegetables Fruit Other
Balochistan 21.42 1.29 14.30 - - 1.78 0.17 3.88
Sindh 859.61 494.94 163.85 88.40 - 99.24 13.19 -
Total 881.03 496.22 178.14 88.40 - 101.03 13.36 3.88
Cotton
In the affected districts, the Kharif 2011 cotton crop was planted on some 669 thousands ha and expected
output was 0.741 million tons (3.41 million bales). The crop was at the critical stage of boll formation when it
was hit by rains and floods. Cotton plants that have not been washed away died by prolonged submersion or
suffered premature shedding of cotton bolls. Total cotton area affected is 496 thousand ha, some 74% of the
total area planted. Sanghar, Khairpur, Shaheed Benazirabad and Mirpurkhas were the most affected districts
in Sindh. The salvaged produce is of inferior quality and is not fetching good prices. On top of that global
cotton prices are also low this year. According to SUPARCO; damage to cotton production in Sindh was
estimated at 2.23 million bales. In Sindh cotton arrivals up to end of October witnessed a decrease of about
34% to that of last year within same period.
Rice
Of total 545 thousand ha of rice areas, some 178 thousand ha have been affected by flood, mostly of which is
IRRI rice. District Badin, Thatta and Dadu in Sindh and Jafferabad and Nasirabad in Balochistan suffered the
most damages that varied between 30-80%.
Sugarcane
Of 260 thousand ha area sown, some 88 million ha has been affected by flood at the time of critical growth
with sugar synthesis at its peak. The prolonged submergence has led to the development of adventitious roots
at the nodes. This is going affect the sugar yield as plants reallocate some its plant reserves to develop these
roots. Also, farmers fear 10% rejection in weight by the millers counting these roots as trash. Major areas
affected were in Badin, Shaheed Benazirabad and Mirpurkhas Districts of Sindh.
Vegetables
Of 127 thousand ha, where vegetables was sown, some 101 thousand ha has been affected. Major vegetables
affected were chilies and tomato. The Chilli Mandi in Kunri estimates 70% drop of the chilli supply with
175,000 bags (30kg) received this year against the normal of 600,000 bags in the season from 15 Aug to end
Dec. No grade-1 was available that is mostly exported. In Badin tomato is a major crop where from during
the peak marketing season of October to December some 60 trucks per day are supplied, were all lost.
Page | 116

Similarly, during the same period 10-15 trucks of onion used to come to the market but were all lost to the
floods.
Fruits
Fruit orchards that sustained heavy economic losses due to the floods are mangoes, guava and banana in
Sindh province. Relatively minor losses were reported in Balochistan. The damage to fruit subsector accounts
for 20% loss in the total value.
Other Crops
Total Sorghum (irrigated) area planted in Balochistan was 17 thousand ha with an estimated output of 0.061
million tons. Out of which 3.88 thousand ha (23%) was affected. Significant losses have taken place also in
Sindh. District Badin and surrounding area used to supply 25-50 trucks per day of melons to the country
markets. This year, the flood wiped out the whole crop.
Livestock
The flood substantially affected the livestock population causing death and loss in productivity mainly in
Sindh. The deaths were mainly in small ruminants and productivity losses were mainly in large ruminants.
Animals standing in mud and stagnant water for extended periods contrived various diseases. The losses in
productivity occurred due to acute fodder shortage, debilitation and emaciation. Sources of livestock feed
were fully inundated and the availability of fodder in local markets was very low. Facing an acute shortage of
feed, these livestock were left stranded. The productivity of milking animals dropped from 7 or above litres to
2-3 litres (50-70%), and many young calves died due to the reduction of the milk in their mothers. The loss in
productivity accounts for more than 50% of the total loss. Luckily some 3.5 million animals from the
neighboring districts could be moved to the higher grounds of District Tharparkar. The EDO Livestock
Tharparkar found these to be testing times, where the district had to host such large number of animals
besides his district’s own population of 4.5 million. Only 30,000 animals died in his care. A number of
farmers moving away from flooded areas found themselves without money to buy food and other essential,
and with limited access to feed and fodder for their animals. These farmers sold their animals, often at very
low prices. In addition, they missed the premium price time of Eidul Azha. This accounts for 10% of the
total monitory loss to the subsector. The cumulative impact on the food security and asset base of
households is likely to be severe.
Table-Annex 5.2: Livestock, Poultry and Fisheries Damages in Flooded Areas
Province Large Animals
(000 head) Small Animals
(incl. sheep, goat) 000 Poultry Perished
(million Nos.) Fishery/ ponds
Damaged
Balochistan 0.1 0.2 0.0 n/a
Sindh 33.8 81.2 1.1 393
Total 33.87 81.46 1.14 393
Page | 117

Large animals (cattle, buffalo, horse, camel, and donkey)
Around 34,000 large animals may have either perished or had been subjected to distress sale. Jaffarabad and
Nasirabad districts in Balochistan, and Badin, Mirpur Khas Shaheed Benazirabad, Sanghar, Tharparker and
Umarkot, districts in Sindh had suffered most livestock losses, where it appears that sufficient advance
warning was not possible.
Small animals (sheep, goat)
A total of 81.40 thousand sheep and goat have been perished or subjected to distress sales. The largest
number was in Tharparkar (Sindh) (34 %) where floods carried away some of the large flocks that are grazed
in the arid and semi arid areas. A total of 250 sheep and goat have been perished in Balochistan.
Poultry
Some 1.14 million heads of poultry have been lost during the flood, primarily in Sindh. Besides the household
poultry, quite a few commercial poultry farms were also damaged.
Fisheries
Damages to fish farm have been reported only from Sindh where 393 ponds/farms have been damaged by
the recent monsoon floods.
Other Damages
The table below presents other physical damages in the flooded area.
Table-Annex 5.3: Other Physical Damages
Province Household Food, Seed, and Feed (PKR Million)
Agriculture Machinery, tools (PKR million)
Govt. buildings, Infrastructure facilities
(PKR million)
No. of Watercourses
Damaged
Balochistan 63.21 6.00 15.00 32
Sindh 15,081.55 - 4,228.45 819
Total 15,144.76 6.00 4,243.45 851
Food, Seed & Feed Stocks
The wheat crop was already harvested by the time the floods hit. However, stocks of wheat held by farmers
for their own consumption, as well as stocks held by traders, millers and the Government have been affected
by the flood as well as high rainfall and humidity. An estimated 0.150 million tons of household level stocks
of food grains (mainly wheat stocks for food and seed) have been destroyed. In addition, a proportion of the
public stocks, particularly stocks that are not properly protected, may have been damaged1.
1 The financial losses of wheat stock losses held in the government godowns have not been included in the calculation of direct damages.
Page | 118

On-farm water management infrastructure & tubewells
The floods have caused significant damages to the on-farm water management system many of which have
been partially lined with concrete and brickwork with support from Government. Some 851 watercourses
have been fully or partially damaged in Sindh, and Balochistan. The flood has damaged the concrete and
brickwork structures associated with tubewells, as well as the machinery and boreholes. Some 376 tubewells,
almost all in Sindh, have been damaged partially or fully.
Support Services
A total of 31 government veterinary hospitals / veterinary services centers, and 432 agriculture extension field
offices have been completely damaged whereas 568 offices have been partially damaged by the floods in
Sindh. The detailed estimation of damages to Govt. agriculture infrastructure needs detailed assessment.
Indirect Damages
Impact on 2011/12 Rabi and 2012 Kharif Crop
It is difficult to accurately predict the impact of the floods on the forthcoming two cropping seasons. Much
depends on the early recovery effort and the ability of farmers and domestic supply chains to revive.
However, based on consultations with provincial line departments, and crop experts, tentative estimates
indicate that about 10% (142,434 ha) of the affected Kharif crop area will not be available for cultivation in
Rabi and 5% in the next Kharif 2012. The main Rabi crop in Pakistan is wheat which is grown on some 8.5
million ha. In Sindh 95% of the land was allocated to wheat in Rabi 2010. Planting of the wheat crop starts in
mid-September in the southern parts of the country and is completed by mid November in the northern parts
of Pakistan. There is a high possibility that wheat planting in Sindh may face substantial constraints, mainly
due to the fact that the flood waters have not fully receded. In contrast in Balochistan, waters have receded
except for some low lying areas and, provided the necessary support system for land clearing and input
supplies are put in place for the planting season, wheat planting may not be substantially affected. However,
damage to watercourses and tubewells, which are a critical source of supplementary water, may affect yields.
Irrigation department is allowing water into channels in a controlled manner so that flood water is cleared
from the remaining fields. This water is not needed only for irrigation but also for draining salt deposits
before crop can be sown e.g. in Badin. In some parts where lands cannot be vacated or water cannot be
arranged before the end of December - the last month for sowing wheat, it will be mainly sunflower and
other short duration vegetables before next year’s Kharif season starts in April. Another factor that may
contribute to decrease in the area under wheat will be the delayed start of sugarcane crushing but a recovery
in the gap may be filled by the early clearing of the damaged cotton areas. SUPARCO estimates 0.5 million
tons loss of wheat production in Sindh due to non availability of land.
Livestock
The loss of livestock, poultry and fisheries will result in temporary shortages in supplies of milk, meat, and
eggs from local sources until the time the population has not been fully replenished. Since the production in
the rest of the country will remain stable particularly in the neighboring Punjab, the shortages are likely to be
covered from the country’s own sources but with some increase in prices.
Page | 119

Estimation of Losses
Methodology, Data Sources, Validation
Based on the physical losses reported in the preceding section, direct damages, indirect losses, and
reconstruction costs (in value terms) of agriculture sector have been calculated. The methodology for
quantifying the damages in value terms is based on the standard approach of calculating direct damage,
indirect losses and reconstruction costs. Most estimated damages and losses have been expressed in current
market prices. However, in the case of livestock the damage estimates are based on prices prior to the flood.
The direct damage, defined as the value of completely and partially destroyed assets include: (i) physical
infrastructure, assets, and machinery and equipment losses (on-farm irrigation infrastructure, fish ponds,
storage facilities, office buildings, tractors and other agricultural machinery); (ii) output losses of 2011 Kharif
crops that were ready for harvesting; and (iii) losses of stock (livestock, inputs, and, harvested products
including fodder stored in warehouses).
Indirect Losses defined as reduced production throughout the recovery period resulting from direct
damages caused by flood include the annualized losses of future production. The indirect losses of crop
production include the partial production losses of the 2010/11 Rabi and 2012 Kharif seasons. The indirect
losses in livestock included the loss of milk production of survived animals, which suffered due to stress and
lack of fodder. The linked crop-livestock production and loss model was developed for the whole country
sub-aggregated into individual provinces. The model also calculates the district level crop-livestock losses.
Reconstruction Costs refer to the amount of resources required for priority programs to rehabilitate
partially and fully destroyed assets, agricultural livelihoods of vulnerable groups and to bring normalcy to the
farming community, and is derived by estimating the required amount of rehabilitation works costed either at
recent Government schedule rates or at current market prices. The assessment is based on the primary
damage data compiled by provincial governments, agricultural and livestock census data, and the information
collected by the Assessment Team itself. The primary data on livestock and crop losses provided by the
provincial governments were validated through several methods including process checking of government
data collection system, SUPARCO crop report of October 2011, and making visits to farmers’ fields,
ginneries, rice mills, fruit and vegetable wholesale markets and input dealers’ shops.
Quantification of Direct and Indirect Losses
The summaries of preliminary loss estimates are provided below. As shown in the Table below, total losses in
crop and livestock subsectors expressed in dollars are estimated at $ 1840.3 million, of which 89 % is in the
form of direct and 11 % is in the form of indirect losses. Sindh suffered most with 94 % of total losses and
Balochistan with 6%. The losses were largest in the crops sector with 91.5%, which includes estimates of
damages to Kharif crops; food and seed stocks; on-farm irrigation facilities; and support services for crops, as
well as indirect damages to the forthcoming Rabi 2011/12 and Kharif 2012 crops. Livestock damages, which
include loss of animals, distress sales, and destruction of animal health support services, as well as indirect
damages due to reduced milk production, accounts for 8.3 % of total losses. Fisheries losses are estimated at
around $ 3.36 million (0.2%).
Table-Annex 5.4: Estimated Direct and Indirect Losses (US$ million)
Province
Livestock Crops
Fisheries/ Pond
Total
Direct Indirect Sub-Total
Direct Indirect Sub
Total
Page | 120

Page | 121
Balochistan 0.41 7.94 8.35 87.84 7.58 95.42 n/a 103.77
Sindh 45.51 99.28 144.79 1,499.19 89.20 1,588.39 3.36 1,736.54
Total 45.92 107.22 153.14 1,587.03 96.79 1,683.81 3.36 1,840.32
Losses by Provinces
In order to have an idea of the major contributors to overall provincial losses, the figures for each province are
compiled and shown in the Table 5.5 below. The damage figures are grouped together keeping in view the
importance and to have minimal categories for quick comparison.
Table-Annex5.5: Losses by Provinces (US$ Million)
Description
Balochistan Sindh
Total
Livestock Crops Sub Total Livestock Crops Sub Total
Direct Losses 0.4 87.8 88.2 45.5 1,499.2 1,544.7 1,632.9
Indirect losses 7.9 7.6 15.5 99.3 89.2 188.5 204.0
Fisheries/Pond Loss n/a - - 3.4 - 3.4 3.4
Total 8.3 95.4 103.8 148.2 1,588.4 1,736.5 1,840.3
Sindh
The total damages in this province are valued at $1,737 million out of which 89% ($1,545 million) are direct
damages. Crop damages make 91% and livestock 9%. The damages are highest for cotton ($455 million). The
other crops including rice, sugarcane and vegetables are the dominant contributors to damages. The damages
are highest for small ruminants and the productivity loss of large animals.
Balochistan
Out of a total loss of $ 103.8 million, 85% ($88 million) are direct damages. The damages for crops are 92%
and livestock 8%. The damages are highest for rice ($72.6 million). The other crops including cotton,
vegetables and fruits are the dominant contributors to damages. The damages are highest for small ruminants
and the productivity loss of large animals.
Impacts on Agricultural Supplies and Markets
The floods have had a large and direct impact on the Kharif cropping season. As this is the season when
crops of higher value are grown and more cropped area matures for harvesting than Rabi season, this is likely

Page | 122
going to have effects on exports and domestic markets, food security, indebtedness and labour market.
Expected reductions in national output of these crops are given below (Table 5.6).
Table-Annex5.6: Areas Affected by Flood as Proportion of National Aggregates
Crops Cotton Rice Fruits Sugarcane Vegetables
Impacted Area ‘000 ha 496 178 13.36 88.40 3.88
Total Area Planted ‘000 ha 3,199 2,642 950 1047 478
Likely reduction in aggregate supplies (%) 15.5% 6.7% 1.4% 8.4% 0.8%
Impact on Exports
The impact of the reduced cotton crop will be largely on exports. Ginning, spinning and weaving mills may
also be impacted due to short supply of domestic cotton. In the case of paddy, the major impact will be on
IRRI rice production that mainly feeds the domestic, rather than the export, market. In case of chilies, this
year no grade-1 quality was produced that is mainly exported. Mango, specially the Chonsa variety that has
recently started gaining share in the international market also suffered losses.
Impact on Domestic Markets
Domestic supplies of rice, cotton, fruits, sugarcane and vegetables specially tomato and chilies have been
reduced substantially and are being reflected in prices of commodities that have increased in many key
markets. Recent reports talk of increases ranging from 10 to 60 % for key staples to over 60 % for fruit,
vegetable and poultry in specific areas. It is likely that prices will continue to remain high for products such as
vegetables which are not imported. However, in the case of rice, sugarcane and maize (particularly for use by
the domestic feed and oil industries) impacts of national markets could be reduced in the medium term if the
Government liberalizes imports of these crops. International markets for these crops have generally ample
supplies and low prices. The impact on milk prices has also been significant. However, if feed and fodder
production problems are solved and no disease outbreaks occur, milk production may recover in coming
months.
Impact on Local Labour Market
During this time of the year, when a lot of harvesting, processing and trading takes place locally, large number
of skilled and unskilled laborers get the opportunity to remain gainfully engaged for a while. This includes daily
wage work in harvesting and threshing of rice, picking of cotton, chilies, and tomato, ginning of cotton,
dehusking and polishing of rice, loading, unloading, re-grading and packing at the wholesale markets. Dalip
Kumar, Abadgar Rice Mills, Badin tells that his mill used to operate for 8 months during the season with day
and night shifts, this year it will operate hardly for 3 months and with only day time shifts.
Impact on Domestic Food Security
Two crops are important from the food security point of view i.e. wheat and rice as they provide some 40%
and 15% calories respectively of the average Pakistani diet. The floods have direct substantial damage to the
rice crop of Kharif 2011 and will have indirect damage to the wheat crop of Rabi 2011/12 as some lands will

not be free from the standing water, irrigation water may not become available or farmers will have problems
to arrange inputs. Since there was a bumper crop of about 26 million tons of wheat in 2010, sufficient stocks
should be available with the government and there will be a need for enhanced allocation of funds to the
Food Department to make additional procurements for wheat from Punjab and for rice from the
international markets.
Impact on Indebtedness
The high crop losses have left large number of small farmers and tenants unable to retire loans from the local
input suppliers. New loans are difficult or more expensive to get. The market needs to be replenished with
finances from outside sources. Last year, after the 2010 floods, the State Bank provided some 10 billion PKR
soft loans to the commercial banks for onwards lending to farmers at10% interest rate. But large portion of it
could not be disbursed due to the fear of the Banks that farmers will not return it within a year and thus will
become liable to the penalty of the State bank. State Bank is thinking of relaxing the conditionalities this year
that may help the situation ease out somewhat. Also last year the State Bank allocated PKR. 37 billion credit
for Sindh, but the banks could not disburse PKR 7 billion. This year this allocation/target has been increased
to PKR 40 billion, which is a good decision but needs to be matched with efforts from the partner banks.
Under the crop maximization program, government provided revolving funds to groups of small farmers at
10% interest rate. Fifty percent of the principal had to be repaid in 10 installments after a grace period of 5
years. This scheme had a very good track record of recovery. Due to the devolution the scheme has come to
a halt. A revival of the scheme, especially in the flood affected schemes will greatly help in ameliorating the
indebtedness burden of the small farmers.
Proposed Sectoral Reconstruction Strategies
Existing Sectoral Policies and Priorities
The Medium Term Development Framework (MTDF) 2005-10 sets the main objectives of the agricultural
development as the achievement of self-reliance in agricultural commodities, ensuring food security and
productivity improvement of crops. During the period for the MTDF, an annual growth rate of 5.2% was
projected. To achieve the objectives, the MTDF proposes several key strategies including: (i) strengthening of
agricultural research and extension institutions; (ii) enhancement of crop productivity through introduction of
new high yielding varieties and better on-farm practices; (iii) increased production and export promotion of
high value crops, fruits and vegetables; (iv) enhanced production of oilseeds, horticulture and tea; and (v)
development of additional water storage capacity and increased water use efficiency (through laser land
leveling, water courses lining, and promotion of drip sprinkler and trickle irrigation systems).
In addition, a promotion of the use of improved seed, balanced fertilizers and herbicides/pesticides, ensuring
the availability of institutional agricultural credit, specially for small and medium farmers, improvement of
farm to market roads, and continuation of support price program for wheat with indication of prices for
cotton, rice and sugarcane to protect farmers against market volatility have been proposed.
For livestock, the MTDF’s strategy is to increase the productivity by giving emphasis on quality rather than
number of animals to produce more healthy and well-nourished livestock. Availability of adequate feed will
be given highest priority. The major thrust will be on breed improvement through crossbreeding, artificial
insemination and embryo transfer technology. Emphasis will be given to fodder research particularly
combinations of fodder that fit into existing farming systems and provide year-round supplies of green
Page | 123

matter. Research will be intensified on the utilization of agricultural wastes, industrial by-products, crop
residues and molasses as animal feed. Specific strategies include: promotion of the private sector participation
with the public sector roles focusing on creating enabling environments and capacity building; better
extension system to upgrade farmers’ knowledge on animal husbandry to raise productivity; and better animal
health coverage.
Agriculture in Pakistan has not played its due role in the overall development of the economy. Actual growth
of the agricultural sector has been lower than projected. After a jump of a 4.7% growth in 2008-2009/ 2009-
2010, mostly due to strong wheat pricing policy of the Government after food crisis in the previous year,
growth rate of the sector decreased to around 2% in 2010/2011. In order to improve the performance and to
sustain its potential contribution to the economy, there is a need for strategic interventions with strong focus
on increasing productivity (per unit of land and water), improving marketing policies, infrastructure
development and improved sector governance through policy and institutional reforms. Also with much of
the poor and vulnerable living in rural areas, agriculture development will be key in meeting the Millennium
Development Goals (MDGs).
Raising growth and reducing poverty in rural areas would require a higher level of public investment in the
sector. The current agricultural portfolio of major donors would also need to be strengthened to assist the
government with pursing key policy changes and leveraging the public spending on the sector.
Guiding Principles for Recovery and Reconstruction
The guiding principles for restoration set out below reflect the experience in Pakistan and other countries in
the region regarding agricultural reconstruction and rehabilitation after a natural disaster.
Focus on Poverty Reduction and Sustainable Livelihoods
The rehabilitation and reconstruction efforts must be and be perceived to be socially equitable with support
being targeted mainly to those in greatest needs. Special measures will have to be put in place to ensure that
vulnerable groups living in the flood affected areas, such as the landless farmers, tenants, and those in the
riverine area where property rights are poorly defined, benefit fully in the support measures being provided
Create a Leading Role for Local People and Their Organizations
Rural communities should play a central role in the rehabilitation and reconstruction process. Their
involvement will range from helping address land tenure and ownership issues expected to arise, to planning,
monitoring and guiding the support effort. While the immediate recovery phase may require extensive
involvement of the central and provincial government, responsibility for planning and implementing the
rehabilitation and longer term reconstruction efforts should be handed over as soon as possible to
communities and district governments. Cash-for-work and food-for-work programs should not only apply to
rehabilitation of public infrastructure, but also target those who prefer to restart their own economic activities
immediately.
Allow Markets to Lead Recovery
Markets must be left to play a key role in guiding existing and renewed productive patterns. This will be
essential to ensure that the reconstruction activities of the agriculture sector are: (i) built on the natural and
entrepreneurial assets of the affected areas; and (ii) that they are sustainable beyond the period that special
assistance is being provided.
Page | 124

Page | 125
Build on Past and On-Going Projects and Programs
Agriculture, forestry and the water sector have benefited from a long series of project and program
interventions stretching over 20 years and supported by donors such as the ADB, IFAD and the World Bank.
The projects have resulted in a strong project management experience in all provinces and many districts.
This strong implementation capacity needs to be quickly mobilized – possibly through reallocating funds and
staff from ongoing projects and programs.
Issues of Immediate Urgency
In preparing a set of interventions, a number of key concerns and issues faced by agriculture sector need to
be kept in view. The 2011/12 Rabi season is fast approaching, in Sindh. Although some areas may still be
inundated and not suitable for planting, other areas urgently need support for land preparation and inputs,
particularly for the wheat crop. Moreover, some of the affected areas rely on tubewells to fulfill their needs.
Support is needed on an urgent basis to repair tubewell pumps, boreholes etc, to ensure that water is not a
constraint. The rehabilitation work to the damaged lined and unlined watercourses need to be started soon to
irrigation the lands. A number of farm machinery including tractors is damaged which may cause problems in
timely seed bed preparation and increase the cost due to limited availability of tractors. Large numbers of
livestock as main source of livelihood of poor people has been affected mainly with productivity loss, putting
the food security at risk. Immediate measure for restocking for targeted groups in most affected areas may be
needed. To restore animal productivity subsidized ‘animal feed’ supply and timely vaccination may be started.
Key Interventions Needed Restoring Normalcy
Tens of thousands of rural families have seen their farms submerged by the floods. A primary goal for
interventions is to allow people to return to their homes and restart economic activity. This will require, for
example, help with provision of seeds, fertilizer and implements to start cropping, restoration of on-farm
facilities such as watercourses and tubewells, as well as a restocking program complemented by provision of
feed, fodder and medicine for their animals.
The recovery / reconstruction needs have been estimated at approximately US$ 306 million, as detailed in the
Table below.
Table-Annex 5.7: Estimated Costs for Restoring Normalcy in Agriculture
Description PKR million US$ million
1. Crops
Seed/fertilizer/land preparation/ tolls and implementation of Rabi 2011/12 and for Kharif 2012
25,120 289
2.Livestock
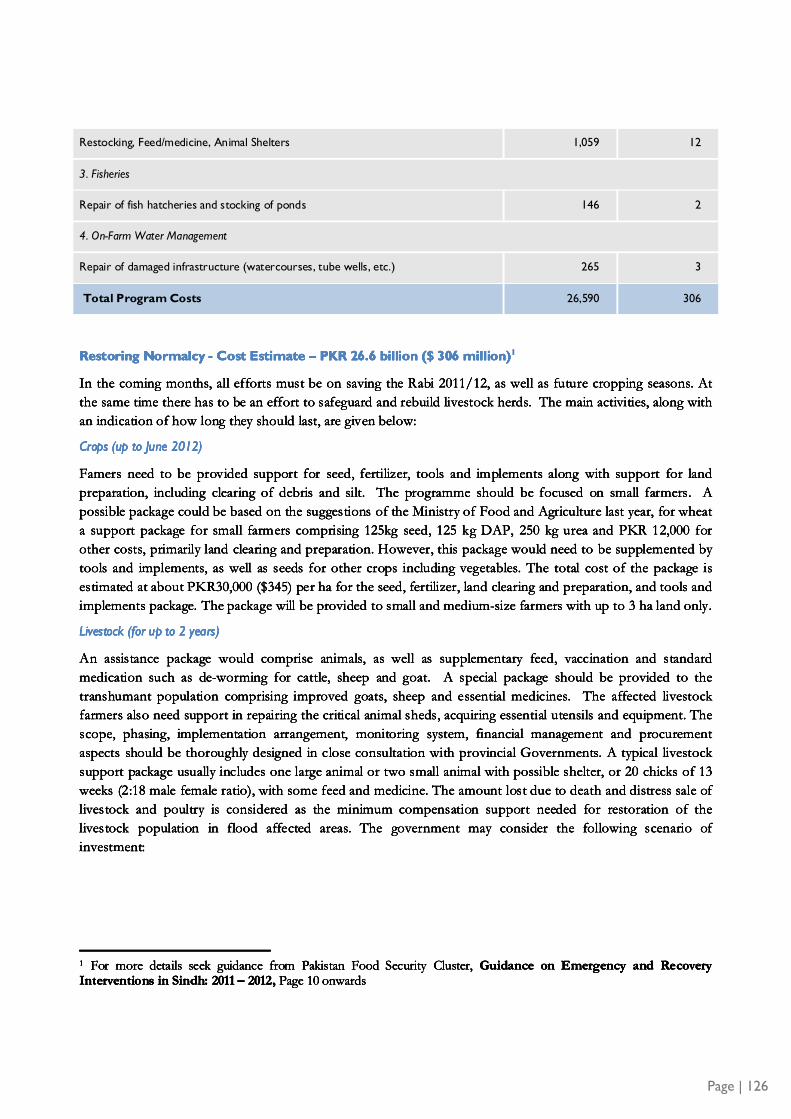
Page | 126
Restocking, Feed/medicine, Animal Shelters 1,059 12
3. Fisheries
Repair of fish hatcheries and stocking of ponds 146 2
4. On-Farm Water Management
Repair of damaged infrastructure (watercourses, tube wells, etc.) 265 3
Total Program Costs 26,590 306
Restoring Normalcy - Cost Estimate – PKR 26.6 billion ($ 306 million)1
In the coming months, all efforts must be on saving the Rabi 2011/12, as well as future cropping seasons. At
the same time there has to be an effort to safeguard and rebuild livestock herds. The main activities, along with
an indication of how long they should last, are given below:
Crops (up to June 2012)
Famers need to be provided support for seed, fertilizer, tools and implements along with support for land
preparation, including clearing of debris and silt. The programme should be focused on small farmers. A
possible package could be based on the suggestions of the Ministry of Food and Agriculture last year, for wheat
a support package for small farmers comprising 125kg seed, 125 kg DAP, 250 kg urea and PKR 12,000 for
other costs, primarily land clearing and preparation. However, this package would need to be supplemented by
tools and implements, as well as seeds for other crops including vegetables. The total cost of the package is
estimated at about PKR30,000 ($345) per ha for the seed, fertilizer, land clearing and preparation, and tools and
implements package. The package will be provided to small and medium-size farmers with up to 3 ha land only.
Livestock (for up to 2 years)
An assistance package would comprise animals, as well as supplementary feed, vaccination and standard
medication such as de-worming for cattle, sheep and goat. A special package should be provided to the
transhumant population comprising improved goats, sheep and essential medicines. The affected livestock
farmers also need support in repairing the critical animal sheds, acquiring essential utensils and equipment. The
scope, phasing, implementation arrangement, monitoring system, financial management and procurement
aspects should be thoroughly designed in close consultation with provincial Governments. A typical livestock
support package usually includes one large animal or two small animal with possible shelter, or 20 chicks of 13
weeks (2:18 male female ratio), with some feed and medicine. The amount lost due to death and distress sale of
livestock and poultry is considered as the minimum compensation support needed for restoration of the
livestock population in flood affected areas. The government may consider the following scenario of
investment:
1 For more details seek guidance from Pakistan Food Security Cluster, Guidance on Emergency and Recovery Interventions in Sindh: 2011 – 2012, Page 10 onwards

· Those living below the poverty line affected will be compensated equivalent to about 50 percent of
animal losses they had endured during the flood.
· Thos living above the poverty line affected will also be compensated for about 30 percent of their total
lost animals.
Fisheries (up to 2 years)
An equivalent of 50 percent of the total loss will be provided as subsidy for recovery needs of the fishing
communities.
On-Farm Water Management (up to 2-3 years)
Of the total watercourses and tubewells damaged, 60% will be rehabilitated.
Possible Implementation Arrangements
The focus of assistance should be to rebuild the livelihoods of poor families who are likely to have severe
problems to obtain machinery, equipment and inputs needed to clear their fields and cultivate them. In
providing targeted supplies to poor farmers, local NGOs and others could play a key role. It is also essential
that local suppliers and traders be drawn into the distribution system by the use of vouchers wherever
practical and possible. The Sindh Government has already started a scheme for distribution of wheat seeds to
farmers for maximum of up to 25 acres to flood affectees.
Food/Cash for Work
Such schemes would be particularly suitable for work associated with clearing of debris, cleaning of water
courses and removal/spreading of silt. Where possible such activities should be organized on a community
basis with local village organization being the main implementing agency.
The provincial breakdown of costs is provided in the Table below, and further details on provincial
breakdowns are in Annexes.
Table-Annex5.8: Provincial Breakdown of Costs for Restoring Normalcy
Description PKR million Million US$
Balochistan 348 4
Sindh 26,243 302
Total 26,590 306
Page | 127

Annex 6: Education

Sector background
Pre-floods status of educational institutions and baselines
There were 49,152 educational institutions in Sindh, including: (i) 44,518 or 90.6% primary schools (out of
which 8,458 schools were for females and 27,629 schools were mixed) and; (ii) 238 inter and degree colleges
(out of which 91 colleges were for females and 40 colleges were mixed). A total of 144,610 teachers were
associated with the educational institutions in Sindh, out of which 45,499 or 31.5% were female teachers. The
number of educational institutions in the17 flood affected districts of Sindh was 39,348 including:(i) 39,132
schools (6,503 for females, 9,881 for males& 22,748 mixed); (ii) and 216 colleges (82 for females& 44 mixed).
There were 101,081 teachers in the 17 flood affected districts of Sindh, of which female teachers constituted
23,746 or 23.5%.
Overall number of institutions in the province of Balochistan was 12,349 including: (i) 10,668 or 86.4%
primary schools (3,394 were for females) with 48,348 teachers (15,551 or 32.2% were females) and (ii) 56
inter and degree colleges (19 colleges were forfemales and 19were mixed colleges). The number of institutions
in five flood affected districts of Balochistan province was 2,849 including: (i) 2,834 schools (27.6% schools
were for females) with 9,233 teachers (2,514 or 27.2% were females) and; (ii) 15 colleges (4 of which were for
females).
Total enrollment in the schools of Sindh province was 4.4 million, of which females constituted 1.81 million
or 41.2%. In schools of Balochistan province, enrollment was 1.04 million (females equaled 38.5%).
Enrollment in the schools of 17 affected districts of Sindh was 3.17 million (38.4% females), while it was 0.24
million (33.3% females) in the 5 affected district of Balochistan.
Lessons learnt from 2010 floods and DNA
Educational Institutions in the provinces of Sindh and Balochistan have been badly hit by floods for three
times during the last five years in 2007, 2010 and now in 2011. 13 out of the 17 affected districts in Sindh and
all 5 of the affected districts in Balochistan were also affected by floods in 2010. Two affected districts in
Sindh (Dadu and Qambar-Shahdad Kot) and three of the affected districts in Balochistan (Kalat, Jaffarabad
and Nasirabad) were also hit by torrential rains during 2007. Schools that had been previously affected by
floods were hit once again by heavy flashes of floods before they had the opportunity to rebuild. One
important factor that came out clearly is the poor quality of architecture design and construction materials
used for reconstructing school buildings, which cannot withstand the heavy flooding.
The recent floods, along with other natural calamities and continuously worsening security situation in the
provinces, have adversely affected the already inadequate access, low enrollment ratios - more particularly for
females, poor quality of education, weak management, and fragile supervision. This has become a vicious
circle but no appropriate efforts are being made to break this circle. After the 2010 floods, educational
activities in most cases have been taking place in the open (without adequate shelter) because of a lack of
rehabilitation of few schools and occupation of educational institutions by groups of people affected by the
floods.
Page | 129

Page | 130
Floods Damage Overview
Damage Criteria Verification and Means of Verification
For the purpose of this report, educational institutions are categorized partially or fully damaged; the state of
damage equaling 40% or below constitutes partially damaged and 40% and above constitutes fully damaged
infrastructure.
Nature and extent of damage: Damage to facilities (direct and indirect loss)
Total number of institutions including colleges1, in the total affected districts, are 42,171, of which 4,096 (204
schools in Balochistan) institutions have been affected by floods. The damaged institutions are 9.8% of the
total (Sindh: 9.9%, Balochistan: 7.20%) institutions in the affected districts and only 6.7% of the total
institutions in the two provinces (Sindh: 8.0%, Balochistan: 1.7%).
Primary schools were the most badly hit constituting 3,597 or 87.8% of total damaged institutions, whereas
middle, secondary, higher secondary and colleges combined constituted 12.18% of total damaged institutions
(Table 6.1 below). 2,536 or 61.92% of damaged institutions were partially damaged and 1,560 or 38.08% were
fully damaged (Table 6.2)
In Sindh, 1,032 schools for females have been damaged (385 of which are fully damaged and 647 of which
are partially damaged), which consists of 26.5% of the total of 3,892 damaged schools. 2,860 schools for
males were damaged (1,022 are fully damaged and 1838 are partially damaged) which constitute 73.5% of
damaged schools in the province. In Balochistan, 51 schools for females have been damaged (3 are fully
damaged and 48 are partially damaged) constituting 25% of the total of 204 damaged schools, while 153
schools for males were damaged (17 are fully damaged and 136 are partially damaged) constituting 75% of
total damaged schools.
Table-Annex 6.1 Province and Level-wise Numbers of Damaged Institutions
Provinces
Type 1 Colleges
Type 2 Higher Secondary
Schools
Type 3 Secondary / High
Schools
Type 4 Middle Schools
Type 5 Primary Schools
Total
C D PD C D PD C D PD C D PD C D PD
Sindh 0 37 15 29 50 81 81 188 1261 2150 3892
Balochistan 0 0 0 0 0 9 1 8 19 167 204
Total 0 37 15 29 50 90 82 196 1280 2317 4096
Level Total 37 44 140 278 3597 4096
% of Total 0.90 1.07 3.42 6.79 87.82 100
1 AEPAM Data 2008-09

Table-Annex 6.2: Province and Level-wise, Males and Females Damaged Institutions
Province Primary schools Middle schools Secondary
schools Higher secondary
schools Colleges Total
Sindh FD PD Total FD PD Total FD PD Total FD PD Total FD PD Total FD PD Total
Males 927 1609 2536 46 129 175 40 57 97 9 21 21 0 22 22 1022 1838 2860
Females 334 541 875 35 59 94 10 24 34 6 8 8 0 15 15 385 647 1032
Subtotal 1261 2150 3411 81 188 269 50 81 131 15 29 29 0 37 37 1407 2485 3892
Balochistan FD PD Total FD PD Total FD PD Total FD PD Total FD PD Total FD PD Total
Males 17 122 139 0 5 5 0 9 9 0 0 0 0 0 0 17 136 153
Females 2 45 47 1 3 4 0 0 0 0 0 0 0 0 0 3 48 51
Subtotal 19 167 186 1 8 9 0 9 9 0 0 0 0 0 0 20 184 204
Total 1280 2317 3597 82 196 278 50 90 140 15 29 29 0 37 37 1427 2669 4096
Page | 131

Service and productivity losses – in qualitative/descriptive terms
In Sindh, 1,151 persons died or were injured (426 dead and 725 injured) out of which 228 were children (111
died, 117 injured)1, however the number of students amongst the dead and injured is not known. No staff
casualty has been reported either in Sindh or Balochistan. However, the indirect losses are in several shapes.
A large number of institutions were used, and are still being used, to provide shelter to the flood affected
population. In Sindh there were 803 reliefs camps mostly set-up in schools. Seven districts in Sindh contained
764 relief camps; each district containing over 20 camps. 620 of these camps were in the three districts of
Sanghar (560), Matiari (34) and Mirpur Khas (26). As of November 1st, 2011 the number of relief camps in
these three districts has decreased to 280, 26 and 5 respectively, however they are all set-up in school
buildings. This has resulted in a loss of innumerable educational contact hours after the opening of schools
from August 14th, 2011.
Students in schools are supplied free textbooks in all provinces, which would have been taken away by flood
water or damaged and thus they are not available to students for studies. These books will need to be
supplied again to the students.
The number of students and teachers in the affected districts of Sindh is 3.17 million and 101,081,
respectively. In addition to students, millions of parents and their relatives have also been affected. These
numbers are highly significant. As of the 1st week of November, 2011, only district Thatta, originally having 3
camps, presently has no relief camps and all schools are functional. The most affected district is Sanghar
where 570 schools were still under water as of the first week of November, 2011. However, there are some
improvements being made as 200 schools have been made functional in Temporary Learning Centers (LTCs)
by UNICEF, while another 240 schools have been made functional in tents by the district administration and
7 high schools have been shifted in other schools as evening shifts. In district Mirpur Khas, 600 schools are
still non-functional however UNICEF is likely to start LTCs in Taluka Jhudo. In district Matiari, two Union
Councils of Taluka Saeedabad are still under water and schools are non-functional, however schools are
operational in the remainder of the district; barring 5, which are being used as relief camps.
In Balochistan, no reports were made available regarding any damage to the students and children, neither is
any institution reported as being used by the flood-affected communities.
It is highly likely that a large number of students and teaching and non-teaching staff will suffer from
emotional trauma, especially because they had hardly recovered from the suffering of 2010 floods. This will
necessitate counseling services. This in turn would require teachers to be trained for school-based
psychosocial support. But practically no such arrangements are made after these calamities, and children,
teachers and parents are left to manage at their own.
Furthermore, in the absence of proper facilities and equipment, it is not difficult to imagine that the existing
poor quality of education may be impaired further. Alternate means shall be required to run the partially and
fully damaged schools while waiting for their full rehabilitation or reconstruction and thus operational costs
are likely to increase. These temporary solutions will also cost money and most of the arrangements made
thus far would be wasted resulting in further losses to people and government, including loss to the economy.
Without proper schooling arrangements, the teachers and other staff will be getting salaries without giving
any output or with a very little output. Teachers themselves are among the flood-affected persons and several
1 PDMA Sindh Data, Dated 4th November, 2011
Page | 132
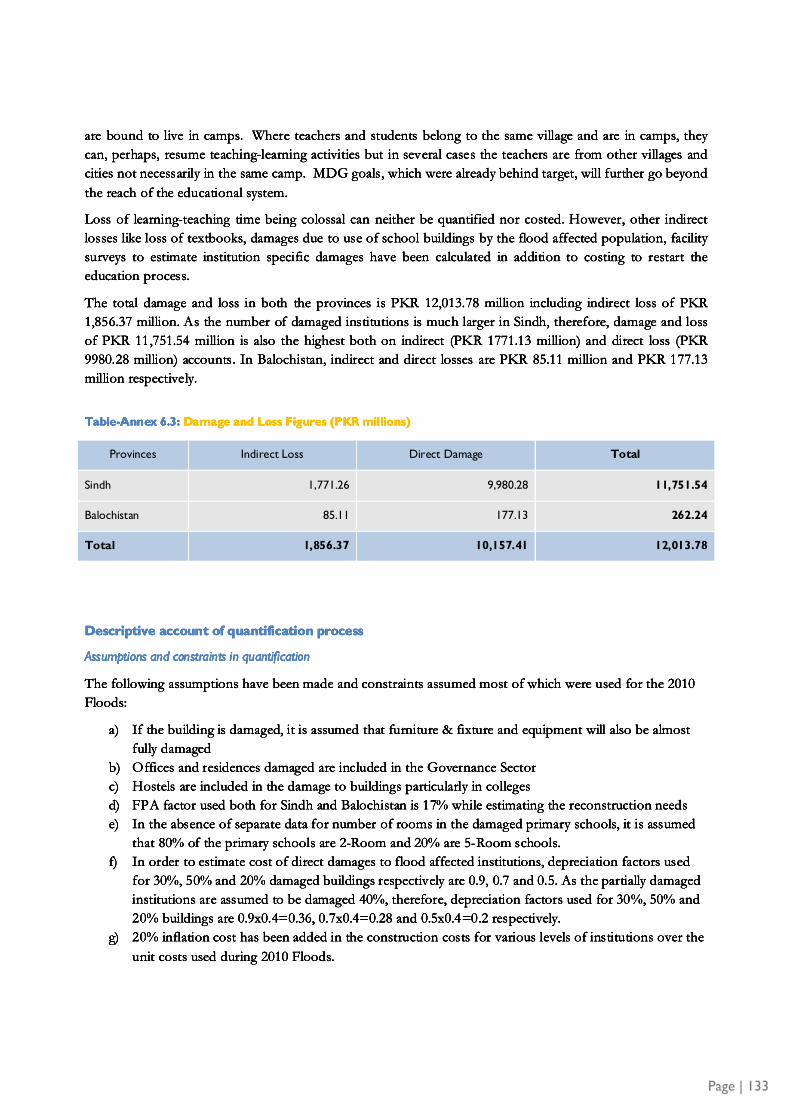
Page | 133
are bound to live in camps. Where teachers and students belong to the same village and are in camps, they
can, perhaps, resume teaching-learning activities but in several cases the teachers are from other villages and
cities not necessarily in the same camp. MDG goals, which were already behind target, will further go beyond
the reach of the educational system.
Loss of learning-teaching time being colossal can neither be quantified nor costed. However, other indirect
losses like loss of textbooks, damages due to use of school buildings by the flood affected population, facility
surveys to estimate institution specific damages have been calculated in addition to costing to restart the
education process.
The total damage and loss in both the provinces is PKR 12,013.78 million including indirect loss of PKR
1,856.37 million. As the number of damaged institutions is much larger in Sindh, therefore, damage and loss
of PKR 11,751.54 million is also the highest both on indirect (PKR 1771.13 million) and direct loss (PKR
9980.28 million) accounts. In Balochistan, indirect and direct losses are PKR 85.11 million and PKR 177.13
million respectively.
Table-Annex 6.3: Damage and Loss Figures (PKR millions)
Provinces Indirect Loss Direct Damage Total
Sindh 1,771.26 9,980.28 11,751.54
Balochistan 85.11 177.13 262.24
Total 1,856.37 10,157.41 12,013.78
Descriptive account of quantification process
Assumptions and constraints in quantification
The following assumptions have been made and constraints assumed most of which were used for the 2010
Floods:
a) If the building is damaged, it is assumed that furniture & fixture and equipment will also be almost
fully damaged
b) Offices and residences damaged are included in the Governance Sector
c) Hostels are included in the damage to buildings particularly in colleges
d) FPA factor used both for Sindh and Balochistan is 17% while estimating the reconstruction needs
e) In the absence of separate data for number of rooms in the damaged primary schools, it is assumed
that 80% of the primary schools are 2-Room and 20% are 5-Room schools.
f) In order to estimate cost of direct damages to flood affected institutions, depreciation factors used
for 30%, 50% and 20% damaged buildings respectively are 0.9, 0.7 and 0.5. As the partially damaged
institutions are assumed to be damaged 40%, therefore, depreciation factors used for 30%, 50% and
20% buildings are 0.9x0.4=0.36, 0.7x0.4=0.28 and 0.5x0.4=0.2 respectively.
g) 20% inflation cost has been added in the construction costs for various levels of institutions over the
unit costs used during 2010 Floods.

h) None of the institutions affected by floods has been included in the current account of damaged
institutions.
Proposed Sectoral Recovery and Reconstruction Strategies
Reconstruction Strategies
The reconstruction strategies being recommended here are similar to those proposed during DNA of 2010
floods because most of them are still appropriately relevant. These strategies will be helpful to federal and
provincial governments while formulating their own detailed reconstruction strategies specific to their
provincial and area needs. The strategy for the education sector should form part of the overall country and
province-specific strategy to address multi-hazard risks and other common factors and requirements for the
reconstruction.
The reconstruction strategy should be used as an opportunity for improved access to higher quality education
through improved design of physical learning spaces, social and physical access, teacher development, and
capacity development of the district education offices for improved service delivery. It also provides an
opportunity to ensure that building codes are enforced. Monitoring of compliance with these codes is
essential and here the national, provincial and district disaster management authorities have a critical role to
play. The education departments at provincial and district levels will need to play a leading role in the
planning and implementation of recovery and reconstruction of the education system. The capacities of
district governments and other stakeholders such as NGOs and the private sector need to be pooled and
efforts made to increase them for expediting implementation of the reconstruction exercise because
government’s own capacity may not suffice to meet these huge reconstruction needs together with most of
the remaining work from 2010 floods.
The five major recommendations on policy guiding principles are as follows:
Start learning-teaching process immediately
The first and the foremost guiding principle is to ensure that all children of school-going age have access to
education activities in a protective environment as soon as possible. The government has started providing
temporary shelter and the provision of “school-in-a-box” kits, temporary learning centers with the support of
donor agencies like UNICEF, and international and local nongovernmental organizations. In addition,
arrangements will need to be put in place for textbooks lost during the floods and learning materials in view
of the provincial governments’ policies for provision of free textbooks up-to secondary level. Similarly,
arrangement should be made for vaccination of children in their temporary residences and in schools, and
providing suitable hygiene conditions in temporary or semi-permanent schools. Educational institutions shall
need shelter, students would need books and other learning materials, and teachers wouldrequire orientation
to meet the psycho-socio needs of the students, who suffered during the disaster.
Consolidate educational facilities
The provincial education departments have been making continuous and concerted efforts to consolidate
educational facilities in order to minimize wastage and under/over-utilization of them. Consolidation will
Page | 134

female primary schools in the same village with low enrollments, if parents are willing; (e) providing
classrooms in the damaged buildings according to number of students enrolled and not only on the extent of
damaged facilities etc. To achieve this goal, education departments will assess enrolling capacity, before
floods, of each damaged institution, actual enrollment, and making decisions about viability of further
enrollment, closure or merger and provision of additional classrooms keeping out-of-school children in count
for classroom spaces.
Conduct facility-by-facility survey
In order to make a more accurate assessment of the actual number of institutions affected and of the extent
of damage to each institution, facility-by-facility survey will need to be conducted simultaneous to formulating
the reconstruction and rehabilitation strategies and starting educational processes. This will help in assessing
actual reconstruction needs of each facility and help making consolidation decisions including provision for
future enrolment as per school going population of the area. Experienced teams of surveyors and data
analysts will be required, who have the capability to map facilities and assess future needs.
Prioritization of reconstruction needs
Rural girls’ institutions should be rehabilitated first followed by rural male boys, followed by semi-urban and
urban institutions. This is necessary because in most cases urban-based and schools for males are preferred
over schools for girls and rural-based schools, where educational levels are already low. Similarly, partially
damaged institutions should be repaired first because they can be made functional with lesser cost and time
and then fully damaged institutions should be reconstructed. For this purpose, female and rural educational
facilities should be surveyed first and decisions about consolidation and reconstruction needs should be made
and implemented.
Engage Parents-Teachers Associations (PTAs) / School Management Committees (SMCs) / School Councils (SCs) in
reconstruction work
Government construction agencies and private contractors hired by them cannot alone carry out
reconstruction work spread mostly over rural areas. Existing PTAs/SMCs/PTSMCs have to have enhanced
role in rehabilitation and maintenance of schools. Actions required in this regard would be to engage with
communities to enter into partnerships for school rehabilitation and arrange their orientation training.
Prioritized Sector Recovery Framework/Timeframe
In the short term phase the first priority will be given to, (i) starting educational activities immediately by
cleaning the schools being used by the flood affected population, (ii) fumigation and dis-infectioning of
educational campuses and, (iii) provision of textbooks and learning materials to the students. Simultaneously,
teams would be constituted to carry out facility-by-facility survey of the institutions as discussed above under
recovery and reconstruction strategies. Orientation for teachers, administrative and management staff would
be held in suitable batches so that educational activity does not stop in any of the institutions. Various
donors are already supporting education sector in one form or the other and their on-going programs can
accommodate the immediate requirements. Planning for rehabilitation and reconstruction will be initiated
with detailed surveys of damaged institutions, approval of PC-Is and architectural designs followed by
budgetary provision and construction work.
Page | 135

Short term (6-12 months) recovery needs are costed at PKR 1,856.38 (US$ 21.34 million) for both the
provinces. Short term needs for Sindh are PKR 1,771.26 million (US$ 20.36 million), and for Balochistan
PKR 85.12 million (US$ 0.98 million) are required. Medium to long term cost of reconstruction is estimated
to be PKR 20,733.1 million,out of which PKR 20,188.6 million is needed for Sindh and PKR 544.45 million
is required for Balochistan.
Table-Annex 6.4: Prioritized Recovery Framework
Activity
Short-term
(6-12 months) Medium- and Long-term
(12-36 months)
Sindh Balochistan Sindh Balochistan
Resume teaching work and provision of books to students 1,679.7 79.85 0 0
Damage assessment, facility-by-facility survey 43.69 2.04 0 0
Teacher Orientation 47.92 3.23 0 0
Reconstruction work 0 0 20,188.6 544.45
Total (PKR million) 1771.3 85.12 20,188.6 544.5
Total (US$ million) 20.4 0.98 232 6.3
Grand Total (US$ million) 21.34 238.3
Estimation of Recovery and Reconstruction Needs
The total cost of reconstruction for all the damaged institutions of both the provinces is estimated to be PKR
20,733.1 million (US$ 238.31 million) of which requirement for Balochistan is estimated at PKR 544.45
million (US$ 6.26 million). Fully damaged institutions are although lesser in number (1,437 as compared with
2,659 partially damaged) but due to higher cost of reconstruction of fully damaged institutions out of the
overall reconstruction cost, 53.2% (PKR 11,030.91 million out of 20,733.03 million) is estimated for fully
damaged institutions.
Overall recovery and reconstruction needs are estimated to be PKR 22,589.43 million (US$ 259.65 million).
Reconstruction needs for Sindh would be PKR 21,959.86 million (US$ 252.41 million) and those for
Balochistan would be PKR 629.57 million (US$ 7.24 million). In addition to reconstruction cost of damaged
institutions, other reconstruction needs include teacher orientation, facility-by-facility survey of damaged
institutions to work out actual needs of each institution, and provision of textbooks and other learning
materials. Provision of free textbooks is the responsibility of each province as per current policy of the two
provincial governments.
Page | 136

Page | 137
Table-Annex 6.5: Summary of Reconstructions Cost for Damaged Institutions (PKR million)
Province
FD PD Total
Sindh Male 7,878.29 6,623.23 14,501.52
Female 3,069.31 2,617.75 5,687.06
Subtotal
10,947.6 9240.98 20,188.58
Balochistan Male 67.19 365.06 432.25
Female 16.12 96.08 112.2
Subtotal
83.31 461.14 544.45
Total (both provinces) 11,030.9 9,702.12 20,733.03
Table-Annex 6.6: Summary of Recovery and Reconstruction Needs
Province
Short - term (6-12 months)
Total
Short term
Long Term
(12-
36months) Grand
Total
Start Education Books Teacher
Orientation Survey
Reconstructi
on
Needs
Sindh 1,529.15 150.50 47.92 43.69 1,771.26 20,188.6 21,959.8
Balochistan 71.4 8.45 3.23 2.04 85.11 544.45 629.56
Total 1,600.55 158.95 51.14 45.73 1,856.37 20733 22,589.4
Table-Annex6.6.1: Starting Educational Activities
Province Destroyed/damaged
(number)
Unit
Cost Total Cost
Used as
relief camps
(number)
Unit Cost Total Cost Grand
Total
Sindh 3,892 0.35 1,362.2 477 0.35 166.95 1,529.15
Balochistan 204 0.35 71.4 0.35 0 71.4
Total 4,096 1,433.6 477 166.95 1,600.55

Page | 138
Province Students
Affected
Per st.
T.Books
Total
Cost Teachers
Orientation
Cost
Total
Orientatio
n
Total
Sindh 301,008 0.0005 150.50 9583 0.005 47.915 198.42
Balochistan 16,897 0.0005 8.45 645 0.005 3.225 11.67
Total 317,905 158.95 10228 51.14 210.09
Province
Affected
Schools
Used as
relief camps
Total
Schools
Survey Per
School
Total
Survey
Sindh 3892 477 4369 0.01 43.69
Balochistan 204 204 0.01 2.04
Total 4096 477 4573 0.01 45.73
Table-Annex6.7: Recovery and Reconstruction Needs AssessmentSummary
Provinces Reconstruction and
Rehabilitation/Repair Costs (PKR millions)
Teacher Orientation
(PKR millions)
Start Education and Books Provision (PKR millions)
Facility-by-facility Survey (PKR millions)
Total
Sindh 20188.60 47.92 1679.65 43.69 21959.86
Balochistan 544.45 3.23 79.85 2.04 629.57
Total (PKR millions) 20733.05 51.15 1759.50 45.73 22589.43
Total (US$ millions) 238.31 0.59 20.22 0.53 259.65

Annex 7: Energy

Background
The damage and needs assessment for the energy sector focuses on three main subsectors: (i) power, (ii) oil,
and (iii) gas. Subsistence fuels (wood and dung) are not included in the scope.
Power sector
In the four provinces and Federally Administered Tribal Areas (FATA), power distribution is carried out by
nine PSPs (distribution companies or DISCOs) and one private sector power company Karachi Electric
Supply Company Ltd. (KESC). In Azad Jammu and Kashmir (AJK) and Gilgit Baltistan (GB), local electricity
departments are responsible for distribution and hydro generation. Transmission is the responsibility of
National Transmission and Dispatch Company (NTDC) which also dispatches the power and acts as the
Central Power Purchasing Agent.
Power generation is provided by thermal plants, hydroelectric facilities and a small nuclear facility (300 MW).
The 13 hydroelectric facilities (installed capacity 6,481 MW) are owned and operated by the Water and Power
Development Authority (WAPDA), a public sector entity. Thermal power plants are owned by public and
private companies. The public sector operates 13 thermal power plants (installed capacity 4,900 MW). About
a third of Pakistan generation (5,987 MW) is provided by private sector companies (independent power
producers or IPPs). Also, KESC operates plants with total capacity of 1,955 MW. Out of the total 19,252
MW of the national installed generation capacity, dependable generation is about 17,523 MW in the summer
and about 14,640 MW in the winter, depending on the annual hydrology.
Petroleum sector
Ministry of Petroleum and Natural Resources (MPNR) coordinates oil and gas activities.
Oil sector
Oil refining capacity is 270,000 barrels per day (bbl/day) from five main refineries, Pakistan Refinery Ltd.
(PRL), Par-Arab Refinery (PARCO), National Refinery Ltd. (NRL), BYCO Petroleum Ltd. (BPL), and
Attock Refinery Ltd. (ARL). Refineries are primarily owned by the private sector. There are also a dozen oil
marketing companies (OMCs). Product distribution is by road tankers (13.5 million tons/year), rail (1.5
million tons/year) and pipeline (6.8 million tons/year). The crude oil and product pipeline network covers
over 2,000 km. Total product storage of OMCs can meet 22 days of oil demand while total product storage
of OMCs, refineries and terminals can meet 38 days of oil demand.There are nearly 6,400 petrol stations
nationwide.
Gas sector
Two state-owned companies, Sui Northern Gas Pipeline Ltd. (SNGPL) and Sui Southern Gas Company Ltd.
(SSGCL) distribute about 78% of the total natural gas production to consumers. The state-owned Mari Gas
Company Ltd. (MGCL) feeds 12% while independent systems supply 10%. Gas transmission lines span over
10,000 kms, and distribution lines another 101,000 kms supplying over 5.6 million consumers and power
plants. SNGPL owns around 60% of the country’s gas network with 3.2 million consumers. There are around
84 LPG marketing companies and 3,170 compressed natural gas (CNG) stations across the country.
Page | 140

Page | 141
Grid station (units)
Transmission lines (km)
Distribution lines (km)
Distribution transformer (units)
Customer conn. (units)
Equipment (PKR million)
Hydro plants (units)
Thermal plants (units)
Completely destroyed
60 650 4,772 261.8
Partially damaged
16 48 10.23
Grid station (units)
Transmission lines (km)
Distribution lines (km)
Distribution transformer (units)
Customer conn. (units)
Equipment (PKR million)
Hydro plants (units)
Thermal plants (units)
Completely destroyed
60 650 4,772 261.8
Partially damaged
16 48 10.23
Grid station (units)
Transmission lines (km)
Distribution lines (km)
Distribution transformer (units)
Customer conn. (units)
Equipment (PKR million)
Hydro plants (units)
Thermal plants (units)
Completely destroyed
60 650 4,772 261.8
Partially damaged
16 48 10.23
Grid station (units)
Transmission lines (km)
Distribution lines (km)
Distribution transformer (units)
Customer conn. (units)
Equipment (PKR million)
Hydro plants (units)
Thermal plants (units)
Completely destroyed
60 650 4,772 261.8
Partially damaged
16 48 10.23
Grid station (units)
Transmission lines (km)
Distribution lines (km)
Distribution transformer (units)
Customer conn. (units)
Equipment (PKR million)
Hydro plants (units)
Thermal plants (units)
Completely destroyed
60 650 4,772 261.8
Partially damaged
16 48 10.23
Upstream Oil and Gas
The two main national oil and gas companies, Oil and Gas Development Corporation Ltd. (OGDCL) and
Pakistan Petroleum Ltd. (PPL) and various international oil companies and domestic firms operate in the upstream
sector.Current oil production is around 66,000 bbl/day. Recoverable gas reserves are 30 trillion cubic feet (TCF).
Potential tight gas reserves are about 35 TCF.
Floods Damage Overview
Assessment is based on the information provided by the focal points of the different energy sector agencies under
the Ministry of Water and Power (MOWP) and MPNR. Threshold of 40% was used to account for assets as
completely damaged.
Power sector
Table-Annex 7.1: Physical Damage Details: Power Sector
Only two power distribution companies are operating in the flood affected areas, HESCO in Sind and QESCO in
Balochistan. In the power sector, damages have only been reported by HESCO. Whereas, QESCO confirmed that
no damages were caused due to floods. Majority of the damages identified by HESCO relate to distribution
transformers. These include damages due to floods as well as heavy rains. It was difficult to bifurcate the two. No
other power sector entity provided any details on damages.
Petroleum sector
Table-Annex 7.2: Physical Damage Details: Petroleum Sector
Access road(km)
Gas field equipment damages (PKR)
Oil pipeline (km)
Oil depots (units)
Gas fields (sites)
LPG facilities (locations)
Completely destroyed
17 40
Partially damaged 50 2

In the petroleum sector, PSO and SSGCL confirmed that no damages were caused by the floods. PPL has
reported some minor infrastructure damages as well as lost of revenue due to decrease in sales. The losses
due to floods are covered under the insurance policy subject to a certain percent of deductibles.
Damage Quantification
Direct and indirect damage estimates were gathered from the relevant companies. Values were assessed for
reasonableness and compared against available pricing data. Direct damage estimates are based on
replacement cost. Indirect losses reflect a reduction in earnings due to loss of production or reduced business
activity.
Table-Annex 7.3: Damage and Losses
Entity Direct damage (PKR million)
Indirect damage (PKR million)
Total damage (PKR million)
Total damage (US$ million)
Generation
Transmission 19.7 19.7 0.226
Distribution 261.8 261.8 3.0
Total Power 281.5 281.5 3.226
Oil downstream
Gas downstream
Upstream oil and gas 175 783 958 11.0
Total Oil and Gas 175 783 958 11.0
National total 456.5 783 1,239.5 14.2
Power sector
Estimated direct and indirect damage to the power sector from the flood is moderate at PKR 281.5 million
(US$ 3.226 million), all of which is direct damage. No indirect losses have been reported.
Petroleum sector
Total reported damages are PKR 958 million (US$ 11.0 million). Damages are concentrated in the public
sector (about 98%), with direct damage of PKR 175 million (US$2.01 million) and indirect damage of PKR
783 million (US$ 9 million) since the bulk of oil and gas infrastructure is publicly owned.
Page | 142

Proposed Sectoral Recovery and Reconstruction Strategies
The basic recovery strategy for the energy sector is:
· First priority is to restore basic services.
· Second priority is to rehabilitate supporting infrastructure.
· Third priority is restore projects that were completely damaged or under construction.
There is no formal institutional arrangement for risk management and mitigation strategies for the energy
sector. Also there is no existing disaster risk reduction or climate proofing program for the energy sector.
Pakistan’s development priorities are given in Vision 20301 and the medium-term development framework
for 2005–2010 provides for priority investment in key sectors. There are annual development programs i.e.,
Public Sector Development Program (PSDP) for all the PSPs. Special development funds are also available
for new village electrification and improvement of oil logistics.
In the power sector, Asian Development Bank (ADB), Islamic Development Bank (IsDB), Japan
International Cooperation Agency (JICA), and the World Bank, has traditionally been major donors providing
sizeable funding to assist energy infrastructure development. The United States Agency for International
Development (USAID) has increased its assistance in recent years. For the petroleum sector, there is no
major donor-assisted program. ADB assists with renewable energy development, power distribution and transmission networks, and energy efficiency improvement. World Bank and JICA focus on power
transmission and distribution networks, and USAID on infrastructure development. IsDB’s focus has been
hydro generation, and increasingly on thermal generation. Other donors including France, Germany, Republic
of Korea, and the Netherlands; and the United Nations Development Program support energy efficiency and
renewable energy projects.
The energy sector is federally-based and policies, rules, pricing, projects and implementation issues are
coordinated by the respective federal department, except in AJK, GB, and Sarhad Hydropower Development
Organization (SHYDO) in KP. HESCO has redirected their internal resources to begin restoration work.
PPL is replacing and restoring affected facilities in coordination with MPNR. Challenges to power sector
development includes: (i) inadequate financial resources, (ii) insufficient quantities of equipment and stores,
(iii) domestic manufacturing capacity to supply required equipment, (iv) reconstruction prioritization, and (v)
financial strain from damages.
Needs Estimation of Recovery and Reconstruction Needs
Table-Annex 7.4: Recovery and Reconstruction Needs Assessment Summary
Reconstruction and rehabilitation/repair costs
(PKR millions) Total
(PKR millions) Total
(US$ millions)
Power 281.5 281.5 3.226
Petroleum 10.0 10.0 0.115
National total 291.5 291.5 3.341
1 Government of Pakistan, Planning Commission. 2007. Vision 2030. Islamabad
Page | 143

Immediate needs for the power sector is PKR 281.5 million (US$ 3.226 million) covering direct damages by
the PSPs. Needs for the petroleum sector is only PKR 10 million (US$ 0.115 million) covering the losses not
covered by insurance. Insurance cover for public sector companies has not been factored into needs.
Opportunities to Build Back Better are few as most programs involve rehabilitation of existing infrastructure
rather than building new facilities.
Prioritized Sector Recovery Framework / Timeframe
Power sector
Policy actions
· Policy for unrecovered receivables from customers in the affected areas.
Early recovery, short (<= 12 months)
· Fast track infrastructure restoration by diverting resources to restoration activities in the flood-affected areas, utilizing existing stores and existing civil works contractors.
· Reconstruct, repair and rehabilitate damaged facilities. Where appropriate Build Back Better.
· Fast track procurement for continuous replenishment of equipment to stores.
· Provide renewable energy systems to provide power to communities that are cut off.
· Establish emergency SOP including disaster management, stores back-up, prioritization, costing, providing renewable power equipment as emergency supply to cut off areas.
Medium term (0 – 24 months)
· Implement SOP for emergencies.
Long term (> 24 months)
· Long-term development planning for power generation, transmission and distribution improvement program, increase power supply coverage, explore alternate sources of energy.
· Long-term sustainable development.
· Develop improved and implement safety standards and building codes.
Petroleum sector
Policy actions
· Policy for unrecovered losses to public sector companies.
Early recovery, short (<= 12 months)
· Reconstruct, repair and rehabilitate damaged facilities.
Medium term (0 – 24 months)
· Establish emergency SOP and outline mitigating strategies.
Page | 144

Long term (> 24 months)
· Develop strategy for more robust refining and marketing, and gas distribution infrastructure.
· Develop a plan to reduce oil imports. Accelerate implementation of LNG import facilities.
· Develop a strategic stock policy to maintain adequate oil stocks for emergency situations.
Page | 145

Annex 8: Governance Infrastructure

Background
Governance related institutions in the flood-hit districts of Sindh have suffered damage to their assets, which
in turn eroded their already limited capacities. In Balochistan, reported damage for governance sector was
limited. Flooding caused by rains led to disruption of social and economic life and created a crisis. Demand of
governance and related services in a crisis is much higher and ever more challenging to respond to effectively
and promptly. Governance sector institutions in Pakistan, even before the disaster, faced many challenges.
Governance Structures and Institutions
Constitutional, federal, provincial and local agencies with governance related roles, are present across the
districts. These include: formal justice and law enforcement - district and lower courts, police and prisons; service
delivery agencies - Pakistan Post, the National Database and Registration Authority (NADRA) and Election
Commission offices; provincial and district Accounts Offices; and the district and sub-district civil
administration. Civil administration is responsible for land revenue and land titles, maintenance of public
order and general coordination of government activities at the district level. Lower tier administration (talukas
and union councils) are responsible for municipal services and maintenance of vital records such as births,
deaths and marriage.
Governance structures in Sindh and Balochistan, as well as other provinces, have shifted back and forth
between devolution and re-centralization in the last decade. Three-tier elected local governments were
installed after the enactment of Local Government Ordinance of 2001. However, after two four-year tenures
of elected local governments, the provincial governments are managing the local government agencies directly
through civil servants. Balochistan Local Government Act of 2010 has effectively rolled back the local
governments to the pre-devolution local bodies system, concentrating powers at the provincial level. While
the local government system in Sindh remains in limbo, district authorities find themselves responsible for
critical social services, land administration and revenue as well as frontline public agencies in crises and
disasters. Maintenance of law and order has been a direct responsibility of the provincial government.
Provinces are also responsible for providing financial resources to the judiciary.
Capacities to Deliver
Coverage and quality of services of two national institutions viz. Pakistan Post and NADRA have been largely
adequate. Pakistan Post also performs 40 agency functions for the federal and provincial governments, and
utility companies, including payment of pensions, money transfers, and saving bank services. NADRA
provides the vital citizen registry services across the country. However, the lower judiciary, police, prisons,
and civil administration have had entrenched problems of limited human, technical and physical resources.
Both coverage and quality of the corresponding services and functions have been low. Structural issues, poor
resource allocation, weak human resource, corruption, influences by vested interests and nepotism are
reported as important factors constraining the performance and results of public service delivery.
While there have been considerable investments in the physical infrastructure for governance institutions over
the last decade, given the resource constraint, these investments for the police, judiciary, prisons and other
governance institutions remain inadequate. No less importantly a near-lack of public participation in planning,
implementation and monitoring of public service delivery and governance combined with weak internal and
Page | 147

administrative accountability of public servants and agencies is both a cause and effect of weak governance
systems.
Technical capacities and availability of human resources at district as well as provincial level have been
inadequate even under normal circumstances. Relief and reconstruction are intimidating challenges, given the
scale of the damage and recovery and reconstruction needs. Engineering, Finance, Planning and Project
Management capacities are constrained even at the provincial level and are effectively non-existent with the
districts.
Law and Order
Security situation in Balochistan and crime in Sindh- including those of gender and oppressive nature- are
major law and justice related challenges facing state and society in both provinces. Limited capacities further
eroded by chaos ensuing repeated floods in two consecutive years have adversely affected state capabilities to
protect rights and shield vulnerabilities. Relief operations; transport and distribution of relief supplies and
implementation of early recovery activities require security for orderly arrangements. This remains a challenge
in relief and early recovery phases, as disaster related crime has been reported after the 2011 floods. 58% of
the communities have reported theft and robbery following the rains.
Financial Management
Public expenditure effectively lacks linkage with performance, results and intermediate (administrative) and
ultimate (parliamentary) accountability. Fiduciary risk management in public spending and value for money
aspects are chronically weak. The poor, women, minorities and other vulnerable groups receive less than
adequate focus in budget allocation and execution. Public Financial Management (PFM) reforms, and
demand and evidence based prioritization of expenditure are overdue to improve delivery and results of
services and performance of governance functions.
Governance Dynamics
Recent political progress of the country toward more provincial autonomy through the 18th Constitutional
Amendment and upward revision of provincial share in federal revenues under the revised National Finance
Commission (NFC) Award formula have empowered provincial legislatures and executives. Implementation
of the 18th Amendment, involving transfer of functions, assets, staff and records, has been slow. Capacity of
the provincial governments needs to be developed with a sense of urgency to fulfill their expanded mandate
due both to the 18th Amendment and the discontinuation of devolved local government system.
Lessons Learnt from 2010 Floods and DNA
Disaster Management
Disaster management expertise with the provincial governments is limited, with a few personnel with relevant
experience. National, provincial and district disaster management authorities - NDMA, PDMAs, and
DDMAs found themselves inadequately resourced to launch a disaster response matching the scale of the
catastrophe. Contingency planning existed in at least some cases. Role of DMAs can become more effective
through developing better institutional partnerships. DMAs can be usefully geared to provide a platform for
coordination of all government and non-government organizations involved in relief and recovery activities.
Page | 148

National Disaster Management Commission (NDMC) is the apex decision-making and oversight body under
the National Disaster Management Act of 2010, which should be activated to institutionalize strategic
coordination.
Public Sector Capacity
Weak PFM and technical capacities slowed down implementation and led to public resentment. Standardized
fast track and yet transparent and accountable financial and managerial processes would need to be
institutionalized to avoid similar problems. Much larger volumes of work in comparison to normal workload
and output of the government agencies becomes an implementation bottleneck. Significant support would be
necessary to bring in additional resources for technical and managerial capacities.
Difficulties were experienced by disaster victims in receiving cash compensation and other relief because they
either did not have or had lost the computerized national identity cards (CNIC). NADRA’s mobile service
capabilities had to be stretched to visit/locate near relief camps and other convenient locations to issue new
and duplicate CNICs in the flood-hit areas. It is estimated that more than 50% of the affected population lost
their CNICs in the flooding this year.
Floods Damage Overview
Table 8.1 details damage to governance related infrastructure. Governance institutions in the 17 affected
districts of Sindh have reported damage to 648 facilities including offices, residences. Aggregate covered area
damaged or destroyed has been estimated to be slightly below three million square feet. In Balochistan, the 5
affected districts have reported damage to 18 buildings. Worst hit district in Sindh is Mirpurkhas where
estimate of aggregate affected covered area is 845,000 sq feet, followed by Sanghar (299,000), Tharparkar
(246,000), Shaheed Benazirabad (201,000), Dadu (186,000), Umerkot (171, 000), Khairpur (161,000), and
Hyderabad (140,000).
Civil Administration in Sindh suffered heaviest damage to its facilities, where 257 buildings were reported to
have been partially damaged and 86 as completely destroyed. Partial damage to 11 Prison and 71 Police
facilities and complete damage to 3 Prison and 66 Police buildings has been reported. 14 court buildings have
been partially damaged and 10 have been reported as completely destroyed. 21 Auqaf buildings are reported
as completely damaged and 10 as partially damaged. NADRA, Post Offices and other governance institutions
shared the remaining disaster damage.
Table-Annex 8.1: Physical Damage Details
Provinces Unit
(Square Feet)
District Sub Division/Taluka Union Council/Village Completely Destroyed
Partially Damaged
Completely Destroyed
Partially Damaged
Completely Destroyed
Partially Damaged
Sindh 2,943,517 109 213 59 114 64 89
Balochistan 17,455 6 6 - 6 - -
Total 2,960,972 115 219 59 120 64 89
Page | 149

Damage Quantification
Templates for data collection were developed by simplifying the ones used for the 2010 DNA. Government
agencies were requested to nominate focal persons. The sector team gave orientation to the focal persons and
liaised with field officers of various agencies in the affected districts to collect data. Efforts were made to
ensure data quality while it was being collected and by follow up action to remove apparent flaws.
Damage assessment is based on reports from district officers and provincial and federal agencies. The damage
data was reported in different formats, making standardization and quantification difficult. Covered area
measured in scale or in number of rooms was used as the basis of damage quantification for buildings. Not all
data templates provided by the districts and departments contained information on covered area. Similarly,
information on damage to moveable assets was also not provided by most districts and departments.
Validation of reported damage was carried out through field visits, meetings with frontline officials, cross
verification and review of other publicly available data. Field visits were carried out in Badin, Tando
Muhammad Khan, Mirpurkhas, Sanghar and Hyderabad districts of Sindh. Data coordination and validation
in Balochistan was carried out by a team of consultants hired by WB/ADB who visited the districts.
Validation did not reveal significant differences between reported and actual damage. However, compilation
and consolidation of data consistency across districts and departments was aimed and appropriate
adjustments have been made on the basis of explicit realistic assumptions, where necessary.
Table-Annex 8.2: Damage and Loss Figures
Provinces Direct Damage (PKR millions)
Indirect Losses (PKR millions)
Total
Sindh 1,555.83 369.23 1,925.06
Balochistan 15.61 12.65 28.27
Total (PKR millions) 1,571.44 381.89 1,953.33
Total (US$ millions) 18.06 4.39 22.54
In case of governance institutions service and productivity losses create complex issues. Disruption of
services or functions and inability to respond to much bigger demand can and do impede relief and
reconstruction. States of rule of law, justice, security, property and citizenship records and management
capacities of public accounting and local level public management become exposed to risk of deterioration
because of damage and serious inadequacy in the face of much higher volume of output demanded by
recovery and reconstruction needs. Disruption of governance services and functions affect the condition of
population already suffering from the direct effects of the disaster. While the economic loss to population is
complex to estimate as it would involve estimating economic value of security, justice and protection.
Moreover, indirect losses primarily relate to the economic and productive sectors and are catered for in
damage estimates of the relevant sectors. Indirect loss to governance institutions is estimated on notional
costs of continued services and functions despite loss to their facilities, records and reduced staff
productivity/availability in the damage quantification.
Page | 150

Proposed Sector Recovery and Reconstruction Strategies
Key aspects of proposed governance sector strategy include mobilization of technical expertise; preparation,
processing, approval of expenditure proposals; mobilizing and raising funds to finance the reconstruction
expenditure; constructing a quality conduit for flow of funds by organizing capacity support to relevant
agencies; and inclusive approaches to planning, implementation and monitoring of reconstruction activities.
While rule of law, access to justice, good governance and public service delivery are stated priorities of the
government inadequate resources- institutional apparatus, financial and technical resources- impede progress
and improvement.
Proposed sector strategy and costed strategic options for the government
Restoration of services and functions
In the short term, it is recommended that resources be mobilized and focused on full restoration of affected
services and functions. In order to achieve this in short time temporary arrangements should be put in place.
Planning for medium to long term activities must also be carried out simultaneously.
Expenditure planning capacity
Preparation of PC-1 is the first step on the part of government agencies to seek approval of capital
expenditure. Compliance to technical standards of expenditure proposals proves to be a bottleneck in
reconstruction. Capacities of the agencies need to be strengthened by providing trainings and outreach by the
Planning and Development Departments (P&DD). The P&DD in Sindh has recently enhanced its capacity
by recruitment of qualified Planning Officers, which can be utilized for outreach to departments and districts.
Entire process of expenditure approval needs to be strengthened to ensure quality and yet match the needs of
fast paced reconstruction.
Budget execution
After expenditure approval, budget execution comes as the next bottleneck to implementation of
reconstruction plans. In addition to fast tracking ongoing PFM improvements, it is important that the entire
process of disbursements be streamlined with appropriate risk management and transparency as well as
expansion of capacity to handle larger volumes of work.
Monitoring and Evaluation
Sindh has made initial developments in a project monitoring and evaluation system (PMES). This function in
both the provincial P&D departments is a priority reform. Capacity building of the M&E function, use of
MIS, data bases, GIS technology and access to PIFRA system need to be done in order to monitor and report
progress of implementation. There is a critical corresponding need to expand the capacities of line
departments in fully implementing such systems.
Community oriented approaches
With help of NGOs and CBOs active in the flood-hit areas community centered approaches can be
implemented to improve governance results by alternative approaches such as ADR to relieve pressure on
formal justice institutions, community involvement in planning and implementation of relief as well as
restoration of services.
Page | 151
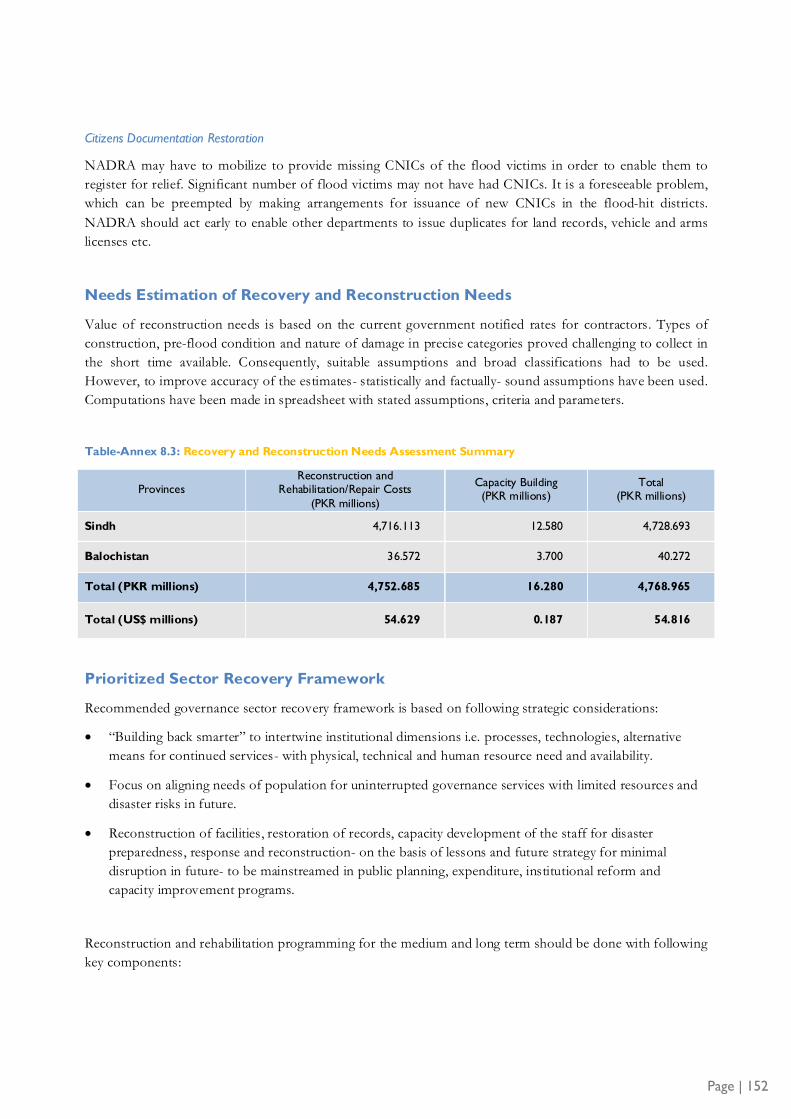
Citizens Documentation Restoration
NADRA may have to mobilize to provide missing CNICs of the flood victims in order to enable them to
register for relief. Significant number of flood victims may not have had CNICs. It is a foreseeable problem,
which can be preempted by making arrangements for issuance of new CNICs in the flood-hit districts.
NADRA should act early to enable other departments to issue duplicates for land records, vehicle and arms
licenses etc.
Needs Estimation of Recovery and Reconstruction Needs
Value of reconstruction needs is based on the current government notified rates for contractors. Types of
construction, pre-flood condition and nature of damage in precise categories proved challenging to collect in
the short time available. Consequently, suitable assumptions and broad classifications had to be used.
However, to improve accuracy of the estimates- statistically and factually- sound assumptions have been used.
Computations have been made in spreadsheet with stated assumptions, criteria and parameters.
Table-Annex 8.3: Recovery and Reconstruction Needs Assessment Summary
Provinces Reconstruction and
Rehabilitation/Repair Costs (PKR millions)
Capacity Building (PKR millions)
Total (PKR millions)
Sindh 4,716.113 12.580 4,728.693
Balochistan 36.572 3.700 40.272
Total (PKR millions) 4,752.685 16.280 4,768.965
Total (US$ millions) 54.629 0.187 54.816
Prioritized Sector Recovery Framework
Recommended governance sector recovery framework is based on following strategic considerations:
· “Building back smarter” to intertwine institutional dimensions i.e. processes, technologies, alternative
means for continued services- with physical, technical and human resource need and availability.
· Focus on aligning needs of population for uninterrupted governance services with limited resources and
disaster risks in future.
· Reconstruction of facilities, restoration of records, capacity development of the staff for disaster
preparedness, response and reconstruction- on the basis of lessons and future strategy for minimal
disruption in future- to be mainstreamed in public planning, expenditure, institutional reform and
capacity improvement programs.
Reconstruction and rehabilitation programming for the medium and long term should be done with following
key components:
Page | 152

· Temporary arrangements for premises
- Temporary readjustments of available space
- Arrangements for additional space for short term needs
· Fast track rehabilitation of equipment and record
- Procurement of goods and services for equipment rehabilitation
- Staff availability and short intensive trainings for record restoration
· Preparation of expenditure proposals for premises reconstruction
- Development of standardized disaster reconstruction planning process to allow fast track
processing
- P&DD to design and deliver trainings for preparation of expenditure proposals
- Lay out schedule for approval and process/decision steps in time for next year’s annual finance
bill i.e. by March 2012
- Develop custom M&E plan and capacity to monitor implementation
· Programming for future institutional and capacity improvements
- Develop and implement a diagnostic and prescriptive program of action to improve capacities
and management/coordination processes with contingent-service continuity planning as key
objective
- Develop and implement record digitization, remote back-up & access, and process automation
plans
- Develop human resource capacities for improved processes
· Inclusive Governance
- Involve local communities and stakeholders in planning and monitoring for uninterrupted
delivery of governance services and functions
- Improve transparency and citizens’ access to planning, expenditure and M&E information
- Link real-time planning, expenditure and M&E information with websites of public agencies
- Hold public discussions on planning and implementation of governance services.
Page | 153

Annex 9: Health

Sector Background
A large number of people, women and children being particularly vulnerable, are still living in scattered
roadside camps without potable water, as fears of water-borne diseases loom large and many of humanitarian
aid agencies with their limited resources find it hard to meet basic needs of the affected people. Women and
children are particularly vulnerable as their precarious circumstances have left them without access to food,
safe water, medicine and shelter. The situation in certain areas within affected districts is reported to be
critical as affected communities are at risk of facing various communicable diseases. Also the situation with
regard to childhood nutrition (38% of under 5 children in Pakistan are reported as being underweight) will
certainly deteriorate as a consequence of the flood emergency. In particular, micronutrient deficiencies are
widespread with high rates of iron-deficiency anemia, zinc, iodine folic acid and vitamin A deficiencies,
having a particularly damaging impact on the survival, growth, development and productivity of pre-school
children and pregnant women.
Infectious and communicable diseases are a major cause of concern and remain the prime cause of morbidity
and mortality in the affected districts. Almost all the affected areas at high risk for epidemics for a large
number of reasons such as overcrowding, poor housing, unsafe drinking water, insufficient sanitation, poor
socio-economic conditions, poor health awareness, low vaccination coverage, and poor health services. The
risk of disease outbreaks further increases during the humanitarian crisis. Communicable diseases account for
a significant percent of the total burden of diseases (BOD). During the week of 28 October to 3 November
2011, a total of 379,536 patient consultations were reported to the disease early warning system (DEWS) by
the mobile health centers established in the affected areas. The major causes for seeking health care were
upper respiratory tract infections (19%), skin diseases (13%), suspected malaria (13%), acute diarrhea (8%),
and lower respiratory tract infections (6%); representing 59% of the BOD1. Twenty percent of the total BOD
account for reproductive health problems (maternal and peri-natal mortality and disability), and about 6% for
nutritional deficiencies, particularly micronutrient related. Some of the key indicators of a few jurisdictions are
given in the following table:
Table-Annex 9.1: Key Health Indicators
District Maternal Mortality
Ratio Infant Mortality Rate
Immunization Rate (%)*
Contraceptive Prevalence Rate (%)
Punjab 238 81 53 33
Sindh 333 81 37 27
Khyber Pakhtunkhwa 323 63 47 25
Balochistan 856 49 35 14
Pakistan 297 78 46 29.6
Source: PDHS, 2007
* BCG, measles, and three doses each of DPT and polio vaccine (excluding polio given at birth)
1 Weekly Epidemiological Bulletin, Volume 2, Issue 44, Epi week 44, 28 Oct to 3 Nov 2011, World Health Organizaiton
-Sindh
Page | 155

Health services are provided by both public as well as private sectors. However, given the dearth of
information on the private sector and its limited relevance in the affected districts, this report therefore
focuses on public sector only. There are also practitioners of alternative and traditional medicine, and not-
fully qualified providers (including rural medical practitioners and drug sellers, and traditional birth
attendants). The public sector delivers both inpatient and outpatient services for curative and preventive care,
but the utilization and quality of services is very low because of a number of factors including limited
availability of basic amenities in these facilities – national average of first level care facilities with electricity is
60%, water supply 42%, public toilets 26%, and accessibility through roads 44%. (HMIS, 2007, Ministry of
Health)
Like rest of the country, the public health care system in the flood-affected districts has multilayer structure.
The provincial and district governments are responsible for the establishment, maintenance and staffing of
the network. The overall quality of governance in the health sector has deteriorated gradually during the last
two decades, with political polarization and increased political interventions. This has led to a significant
negative impact on service delivery, as reflected by low utilization of health facilities and decreasing public
confidence. Poor governance is reflected in: (i) site selection for health facilities, (ii) lack of merit-based
recruitment and promotion, (iii) weaknesses in procurement system, (iv) rapid and frequent transfers of staff
at senior management level both at provincial and district level, and (v) staff absenteeism. Most of
government facilities, particularly in rural areas, lack quality basic inputs; they are often in an abysmal status
with empty and dilapidated buildings, lacking or poorly maintained equipment, and a limited supply of
medicines. A study conducted recently found that 28% health facilities had no laboratory equipment, 21%
were without emergency equipment, 23% had no delivery equipment, and 22% were without ambulance, as
per standard. Despite having a very high population per doctor ratio, staff expansion and distribution has not
kept pace with the physical expansion of medical facilities. Available data indicates that a large number of the
posts of doctors, particularly of women medical officers, are vacant in the affected districts.
Flood Damage Overview
The DNA was carried out in two phases: (i) data was collected from districts during the first phase and the
second phase constituted consultation and verification of data with provincial health departments and field
validation visits to some of the affected districts. During field visits, the team interacted with the people
dislocated by floods, and also with government officials, local and international NGOs and UN staff and
development partners. The data was provided for public sector health facilities only, as there was very little
data available with the provincial governments on private sector facilities. Moreover, damages caused to the
family planning outlets run by the provincial Population Welfare Departments were negligible, and since most
of these outlets operate in rented houses, these damages have not been reported in this report; the housing
sector has covered these damages in their report.
The reported damage to public health infrastructure has not been to the extent of paralyzing the health
system; it sustained only mild damages. Most of the secondary health care facilities remained un-affected and
– except for short interruption – continued service provision. No health staff is reported to have died or
injured. Of the total 882 health facilities of various categories in 13 districts where health sector was affected
in Sindh, 278 (32%) were damaged; this total includes 12 (1%) fully damaged, and 266 (30%) partly damaged.
In Balochistan, of the total of 193 health facilities in the 3 affected districts, 28 (15%) were damaged, and the
Page | 156

damaged facilities include 13 (7%) fully damaged, and 15 (8%) partly damaged. The largest number among
damaged facilities taken together of both the provinces is that of basic health units (BHUs) and government
dispensaries (GDs), accounting for 236 (77%) of the total 306 damaged facilities. Table 9.2 shows the district
wise data of damaged health facilities by type, and Table 9.3 presents the percent of damaged health facilities
in each affected district and also as percent of total health facilities in the province:
Table-Annex 9.2: District Wise Damage Caused to Health Facilities by Type of Facility
District
Damaged
DHQ Hospital
THQ Hospital
Rural Health Centre
Basic Health Unit
Dispensary/ MCH
Centre Office/Institute
Fully Partly Fully Partly Fully Partly Fully Partly Fully Partly Fully Partly
Sindh 0 6 1 15 3 34 1 127 7 79 0 5
Badin 0 1 0 1 1 3 0 21 4 14 0 2
Jamshoro 0 0 0 1 0 0 0 5 0 5 0 0
Khairpur 0 0 0 0 0 0 0 13 0 4 0 0
Matiari 0 0 0 0 0 1 0 2 0 0 0 1
Mirpurkhas 0 1 0 2 0 5 0 7 0 14 0 1
Naushero Feroze 0 0 0 2 0 7 0 0 0 0 0 0
Shaheed Benazirabad*
0 0 0 1 1 7 0 25 0 21 0 1
Sanghar 0 1 1 1 0 2 0 21 0 8 0 0
Tharparkar 0 1 0 3 0 2 0 23 0 11 0 0
Thatta 0 0 0 1 0 0 0 0 0 0 0 0
Tando Allahyar 0 1 0 0 0 2 0 3 0 0 0 0
Tando M. Khan 0 0 0 0 0 1 0 2 1 1 0 0
Umerkot 0 1 0 3 1 4 1 5 2 1 0 0
Balochistan 0 1 0 0 1 0 6 2 6 8 0 4
Jaffarabad 0 1 0 0 1 0 4 0 3 4 0 2
Nasirabad 0 0 0 0 0 0 0 2 0 4 0 2
Lasbella 0 0 0 0 0 0 2 0 3 0 0 0
Total 0 7 1 15 4 34 7 129 13 87 0 9
* The facilities visited by ADB’s data validation Mission on 18 November 2011 were found partly damaged, which were
otherwise reported as completely damaged by the district health authorities. A revalidation mission was fielded on 25
Page | 157

January 2012, which reclassified, in consultation with EDO Health and DG Health, 20 out of 21 facilities from completely damaged to partly damaged.
Table-Annex 9.3: Damaged Health Facilities as percent of Health Facilities in District and in Province
Province/District Total health facilities of all
categories
Number of damaged health facilities Affected facilities as % of district
total
Affected facilities as % of province total Completely
damaged Partly
damaged Total
Sindh 1,486 12 266 278 - 18.7
Badin 61 5 42 47 77 3.0
Jamshoro 40 0 11 11 28 0.7
Khairpur 153 0 17 17 11 1.1
Matiari 28 0 4 4 14 0.2
Mirpurkhas 71 0 30 30 42 2.0
Naushero Feroze 95 0 9 9 9 0.6
Shaheed Benazirabad
75 1 55 56 75 3.7
Sanghar 97 1 33 34 35 2.3
Tharparkar 80 0 40 40 50 2.7
Thatta 84 0 1 1 1 0.06
Tando Allahyar 20 0 6 6 30 0.4
Tando M. Khan 21 1 4 5 24 0.3
Umerkot 57 4 14 18 32 1.2
Balochistan 2,075 13 15 28 - 1
Jaffarabad 83 8 7 15 18 0.7
Nasirabad 34 0 8 8 24 0.3
Lasbella 76 5 0 5 7 0.2
Pakistan 9,721 25 281 306 - 3.1
Damage Quantification
The damage estimate (direct losses) for all health facilities was calculated as PRs 431.85 million (US$4.9 m) –
Sindh: PRs 404.85 m (US$4.6 m) and Balochistan: PRs 27 m (US$0.3 m) – on the book value taking into
Page | 158

account the generic depreciation factor which was assumed as 50% of the replacement cost based on the
assumption that all health facilities were older than 15 years. There is no data available for calculating the
indirect losses. However, the estimated amount required to meet short-term needs has been taken as proxy of
indirect losses i.e., PRs 826 million (US$9.4 million).
Proposed Health Sector Recovery and Reconstruction Strategies
Overview of Existing Sector Development Programs
National Programs recently devolved to the provinces under 18 Amendment in the Constitution include
Family Planning, MNCH, PHC, EPI, HIV/AIDS-, Malaria- and Tuberculosis control, nutrition, mental
health, complemented by various programs in partnership with NGOs (e.g. National Action Plan for the
Prevention and Control of Non-Communicable Disease, Health Promotion and the Leprosy Control
Program). Donor/IFI financed direct assistance amounts to 3% of the total health sector expenditure.
Among others, ADB, WB, JICA, USAID, CIDA, DFID, KfW, WHO and UNICEF have financed health
programs either through budget support or as direct technical assistance support to country sector programs.
(e.g., health system reform, MNCH, etc.).
Sectoral Strategy and Costed Strategic Options for the GoSindh and GoBalochistan
Like the previous year’s floods, the 2011 floods provide the government with a strong opportunity to revamp
and reform its existing health sector and build a better performing sector. To increase sector performance,
the provincial governments may continue introducing innovative measures such as public-private
partnerships, out-contracting of services and others. An imperative prerogative for the provincial DOH is to
lead an efficient disaster preparedness and response which will require a detailed district master plan (for each
district) with the participation and commitment of federal, provincial and district health authorities with the
NDMA, PDMA and humanitarian cluster lead agencies.
The recovery strategy will have a short term, which is in addition to the plan developed by humanitarian
agencies for early recovery, and a long term component. Based on service availability mapping, priority should
be given to minimal coverage of essential health services (PHC, EmOC, and response to disease outbreak) to
flood-affected communities, while taking into account recovery of other sectors complementing to care
provision and accessibility (water, electricity, roads, etc). The estimated cost for activities to be undertaken
under the short-term plan has been worked out as US$ 10.2 million. In the medium term a comprehensive
health sector revitalization strategy should encompass a strategy aiming at the provision of minimum
standards for health care, based on the key principles of equitable access to essential health care, timeliness, results, and
accountability.
Short Term Measures (up to 12 months)
These measures will address the urgent needs for flood-affected communities, by sustaining and improving
the functionality of an essential health care provision with alternative interventions (mobile team, mass
vaccination, minimal rehabilitation). Due to budgetary constraints during the emergency situation budgetary
support is needed for the continuation of services to the flood-affected population. Measures need to be
taken to prepare for the smooth transition from short term to medium and long term strategies, which should
include:
Continuation of quality PHC service delivery to affected populations, including those with special needs. The DoH, assisted
by adequate support from UN agencies and NGOs should ensure service delivery in the areas of
Page | 159
Page | 160
· PHC services, including ANC, MCH, EPI and basic curative and preventive care services to the affected
population. This includes also supplementation with micro-nutrients such as Vitamin A, oral re-hydration
salts and zinc supplements. Other services to be established and/or strengthened include alternative PHC
provision system (mobile and temporarily health structure) with a functional referral system for
emergency services (EmONC), surgical services for critical health condition, DEWS, DHIS data collation
and analysis.
· Post-crisis epidemiological situation: During the week of 28 October to 3 November 2011, a total of 379,536
patient consultations were reported to the disease early warning system (DEWS) by the mobile health
centers established in the affected areas. The major causes for seeking health care were upper respiratory
tract infections (19%), skin diseases (13%), suspected malaria (13%), acute diarrhea (8%), and lower
respiratory tract infections (6%); representing 59% of the BOD. Twenty percent of the total BOD
account for reproductive health problems (maternal and peri-natal mortality and disability), and about 6%
for nutritional deficiencies, particularly micronutrient related. Since the beginning of the flood, all
epidemic prone diseases are being closely monitored. Besides curative services, preventive and health
promotional services are being provided to affected communities to mitigate risks. However, the disease
surveillance system would require further strengthening.
· District health planning based on service availability mapping and vulnerability Assessment of health facilities. DoHs
need to perform detailed needs assessments and mapping by district to assess health facility
vulnerability/feasibility in terms of population movement, and functional status/utilization pattern of the
existing facilities and the emerging health situation. In this context also the disease surveillance system
should be improved or where necessary it should be introduced. To enable the DoHs to effectively
accomplish this task, physical resources and equipment provided by relief organizations need to be
coordinated with and later handed over and integrated into the existing PHC system.
· Establishment of Emergency Response Cells (ERC). DoHs need to establish/strengthen the ERCs to timely
plan, coordinate and manage health service delivery for the post disaster period and be prepared for the
recovery and rehabilitation phase for the current and future disasters.
· Human Resources planning and management. Dislocated staff and service providers need to be encouraged
with appropriate incentives to relocate or to return to their original place of services. At the same time
healthcare workers need to be assisted in coping with the extremely stressful working environment,
which they are subjected to during the relief and recovery period.
Medium to Long Term Measures (12 – 36 months)
In the medium to long term, affected health facilities at all levels will need to be reconstructed/rehabilitated
and re-equipped.
· Reconstruction and reequipping of health facilities. Keeping in view the pre-flood utilization rates and
vulnerability to natural hazards of the damaged facilities, a detailed damage assessment with financial
analysis needs to be undertaken to facilitate decision for repairing, reconstructing, or relocating the
facilities. The DoHs need to restructure provision and delivery of PHC services through BHUs and
RHCs, introducing agreed package of basic health services, including minimum quality care standards and
addressing key principles of equity, accessibility to care, timeliness and accountability.
· Strengthening of health system management: At district level, the build up of the low health management
system is essential, through technical assistance, in-service training, and introducing performance based
incentives to staff for effective implementation.
· Assessing alternative models of health care financing and service delivery: DoH also need to look into other
possibilities of support for field operations in the health facilities as due to budgetary limitations there is a
severe strain on the system which hinders its capacity to absorb even minor emergencies let alone a major
one like the current floods.
· Application of DNA Cross Cutting Principles in Development of Sectoral Strategies: Maternal and child health care
constitutes almost 70% (ante, peri and post natal care, safe motherhood, reproductive health, vaccination,
nutrition, etc.) of the primary health care package designed for all first level care facilities (FLCF). Still
80% of deliveries are home-based and are performed by traditional birth attendants. The already high
maternal mortality ratio (ranging from 238 in Punjab to 856 women in Balochistan dying per 100,000 live
births) may increase due to lack of access to obstetric care following the damages to health facilities.
While Pakistani government and NGOs have sent female health workers in the camps, their numbers are
not sufficient to meet the enormous demand. Due to the cut off from supply of contraceptives, a wave of
unwanted pregnancies with all the ensuing complications is certain. Destruction of district and rural roads
limits access for women already suffering from mobility constraints to health care. With limited road
access, transportation costs increase, reducing the probability of families sending their female family
members to health facilities. Thus pre-natal, post-natal check up and deliveries in health facilities will
most likely decrease from an already low baseline. Women doctors might return later in the recovery
period than male doctors to rural health facilities, which will render it impossible for women to consult a
physician (due to the prevailing culture for women only to consult women doctors). This void in
women’s health service coverage jeopardizes achievements made so far, i.e. to promote health-facility-
based or home based deliveries attended by a medical professional. With increasing financial constraints
due to the loss of assets during the flood, less household expenses will be spent on health care, meaning
that women, children and the elderly as the most vulnerable population groups will suffer most. In this
context it is also essential to combat the already precarious nutrition situation in children by supplying in
particular micro-nutrients. Also the establishment of a nutrition surveillance system to strengthen the
existing nutrition information system needs to be addressed. Cooperation with the private sector as an
important provider of nutrients and micro-nutrients should be intensified.
· Common Elements of Recovery Strategies Across Provinces: Emergency preparedness and response capacity of
the health sector at all levels has been very low and require urgent and sustained strengthening at all
levels. ERC need to coordinate the relief and recovery strategies across provinces. Hazard resistant health
care facilities should be built on priority in all affected areas based on mapping and vulnerability
assessments.
· Existing Risks and Challenges to Health Sector Development: Poor overall governance of the health sector, a
weak and inefficient physical and functional structure of public health facilities aggravate severely the
consequences of disaster related damages. The lack of quality services provision, insufficient funding and
the absence of a functional emergency response system contribute significantly to the aggravation of the
incurred damages. To ensure acceptable health service delivery during and after the emergency, an
improved human resources management and distribution, an efficient and transparent financial
management and a well coordinated and functional disaster response mechanism are mandatory.
Page | 161

Needs Estimation of Recovery and Reconstruction
Short-Term: From humanitarian response toward an integrated recovery and rehabilitation (PKR
826 million [US$ 9.4 million])
In the aftermath of the flood, interventions were aiming at saving life through a range of activities. The
WHO has prepared a plan for the early recovery phase (12 months) which is being implemented in
collaboration with the provincial and the district health authorities in the affected districts. In order to
integrate WHO’s early recovery activities with the health sector’s overall rehabilitation, a short-term recovery
framework at a cost of US$9.4 million (see below under section ‘F’ of this report) needs to be implemented.
This integration effort will take into account the unequal and inequitable pre-crisis health facility coverage, the
post-crisis deterioration of the health system, the flood related public health threats, and the return modality
and pattern.
Medium/Long-Term: From integrated recovery/Rehabilitation to Reconstruction (PKR 863.7 million
[$9.8 million])
Total reconstruction cost estimates for the fully and partially damaged health facilities have been worked out
as PRs 863.7 million (US$ 9.8 m) based on the scheduled rate per square foot of covered area plus 15% as
price escalation factor and 10% for external development. The total base cost so computed was then applied
to the size of different types of damaged health facilities, which were provided to the Health Sector Team by
the respective governments. Additional 10% cost for seismic/flood proofing and 15% for equipment and
furniture were also added to the total cost of a damaged facility to come up with the replacement cost of each
damaged facility. The partial damage to health facilities was not uniform as the damage ranged from 1% to
40%, which was therefore averaged out to 25%. The cost for repair/renovation of partly damaged facilities
was thus calculated as 25% of the total replacement cost. The damage quantification does not include: (i)
private health facilities because of unavailability of data, (ii) population welfare facilities as majority of them
were in rented houses (1-2 rooms) without expensive equipment/furniture, and (iii) again because of
unavailability of data, the indirect losses due to expenditure on treatment of survivors and additional costs on
public health interventions; and inability to provide services, etc. The detailed working of the costs of direct
damages by province is given in the table below.
Table-Annex 9.4: Estimates of Book Value of Damaged Health Facilities and their Replacement Costs
Facility
Type
Average
covered area
(Sft)
Number of facilities
damaged
Cost per Facility1
(Million PRs)
Total Cost Estimates of damaged
facilities (M/PRs)
Fully
damaged
Partially
damaged
Fully
damaged
Partially
damaged2 Fully damaged
Partially
damaged
Sindh (Base rate PRs1200/sft (inclusive of 15% price escalation and 10% external dev) + 25% of base rate = PRs 1500/sft)
DHQ
Hospital 50,000 0 6 00 18.750 00 112.5
THQ
Hospital 31,000 1 15 46.5 11.6 46.5 174.0
RHC 15,000 3 34 22.5 5.6 67.5 191.2
Page | 162

Dispensary/MCH 1350 7 79 2.0 0.5 14.1 40.0
Office/Institute 3,000 0 5 00 1.1 00 5.6
Total 132.9 676.8
Total Replacement Cost for Sindh PRs 809.7 m
@ PRs 88 = US $1 $ 9.2 m
Total Book Value of Damaged Facilities in Sindh PRs 404.85 m = US$4.6 m
Balochistan (Base rate PRs1200/sft (inclusive of 15% premium and 10% external dev) + 25% of base rate = PRs 1500/sft)
DHQ Hospital 31,000 0 1 00 11.6 00 11.6
THQ Hospital 20,000 0 0 00 00 00 00
RHC 7,909 1 0 11.9 00 11.9 00
BHU 1,533 6 2 2.3 0.5 13.8 1.0
Dispensary/MCH 925 6 8 1.4 0.3 8.4 2.8
Office/Residence 3,000 0 4 00 1.1 00 4.5
Total 34.1 19.9
Total Replacement Cost for Balochistan PRs54.0 m
@ PRs88 = US $1 $0.6 m
Total Book Value of Damaged Facilities in Balochistan PRs 27 m = US$0.3 m
Sindh and Balochistan
Grand Total of Replacement Cost PRs 863.7 m
Grand Total US $ 9.8 m
Grand Total of Book Value of Damaged Facilities for Pakistan PRs 431.85 m = US$4.9 m
1/ The base cost is inclusive of 15% price escalation factor and 10% for external development. On the top of base cost
10% has been added as earthquake/flood proofing factor and 15% for equipment and furniture.
2/ The cost of partially damaged has been calculated as 25% of the cost of fully damaged facility since the damage
caused by rains/flood was marginal. The dalipidated condition of health facilities was mainly because of neglect/deferred maintenance, and very little blame could be put on rains and flood.
3/ The book value has been calculated as 50% of the replacement cost assuming average life of all health facilities as
older than 15 years.
Page | 163

Prioritized Health Sector Recovery Framework / Timeframe
Activity Short-term / 12 months Medium- and Long-term
DoH resumes PHC services as early as possible primarily through Emergency Relief Health Services to :
address immediate health care needs of the affected population; and
§ response to disease outbreaks
§ prepare for early recovery
MCH services – currently delivered by Relief Organizations be extended to assist DoH to ensure continuity of: pre-natal, delivery and post-natal care, and EPI coverage expanded to prevent CD outbreaks
PHC services with MCH as its intergral part, to be delivered by BHUs and RHCs and (ii) secondary care services to be provided by THQ/DHQ hospitals.
DoH takes over PHC services to deliver routine MCH and basic curative and preventive care services including psychosocial care of affected people; and DEWS, and DHIS data collation and analysis.
Diarrhea/cholera treatment centers
Budgetary support needed
[Est. PRs 800 m (US$ 9 m) over 1 year (PRs 50 million for each affected district)]
DoH to restructure provision & delivery of PHC services to ensure (i) minimum standards for quality care and (ii) respond to key principles of equity, accessibility to essential care, timeliness, results and accountability (focusing on MCH services). Also strengthen response to any disease outbreak.
DoH works on affected health infrastructure
§ damage assessment and utilization profile
§ Service availability mapping to fill accessibility gap
§ district health planning for facility (re)location
§ rehabilitation and reconstruction of facility type
§ hazard-resistant building code
Provide and deliver health care services [< 6mths] through currently in place emergency set up e.g. medical camps, mobile teams and static clinics in safe and accessible locations near to either existing facilities or where affected population is concentrated.
Assess facility damages and utilization before allocating facilities to either: repair/ renovation/ rehabilitation or full reconstruction in accordance with requirements for hazard-resistant building code.
TA needed
[Est. included in TA estimate below]
District and provincial plan based on service availability mapping and return pattern.
For affected facilities provide and deliver health care services in the (i) medium-term (< 3 years) through semi-permanent structures e.g. pre-fabricated BHUs and RHCs; and (ii) longer term (> 3 years) through reconstruction of nominated facilities to required service standards.
Standard floor plans and facility designs ensuring facility and equipment meet prescribed quality service standards.
DoH acquires physical resources and equipment for continuing services and operating facilities
Relief Organizations will leave behind physical resources and equipment upon their departure.
EDOs/DHOs to ensure that handover of physical resources and equipment from partner organizations be kept functional through adequate maintenance and provision of operational costs; and registered on official assets list for functional maintenance and end-of-life replacement (as for routine government assets)
Reconstructed (including refurbished) facilities will be re-equipped as per the service package to be delivered from the targeted facility.
Standard equipment packages are available for equipping various types of facilities to ensure equipment meets the prescribed standards for quality services delivery.
Funds needed for (re)construction/ refurbishment of facilities/eequipment
[Est. PRs 863.7 m (US $9.8 m]
DoH improves health services management functions and supply systems and set up a financing system based to avoid financial barrier to
DoH must take on coordination of relief organizations health programs and must allocate services to priority health need areas.
An emergency response cell (ERC) needs to
In the medium-term , the ERC/HEPR should develop a framework outlining appropriate strategies and timeframe for relief agencies to phase out by ensuring services are smoothly handed over to, sustained and operated by government service providers; and build-up
Page | 164
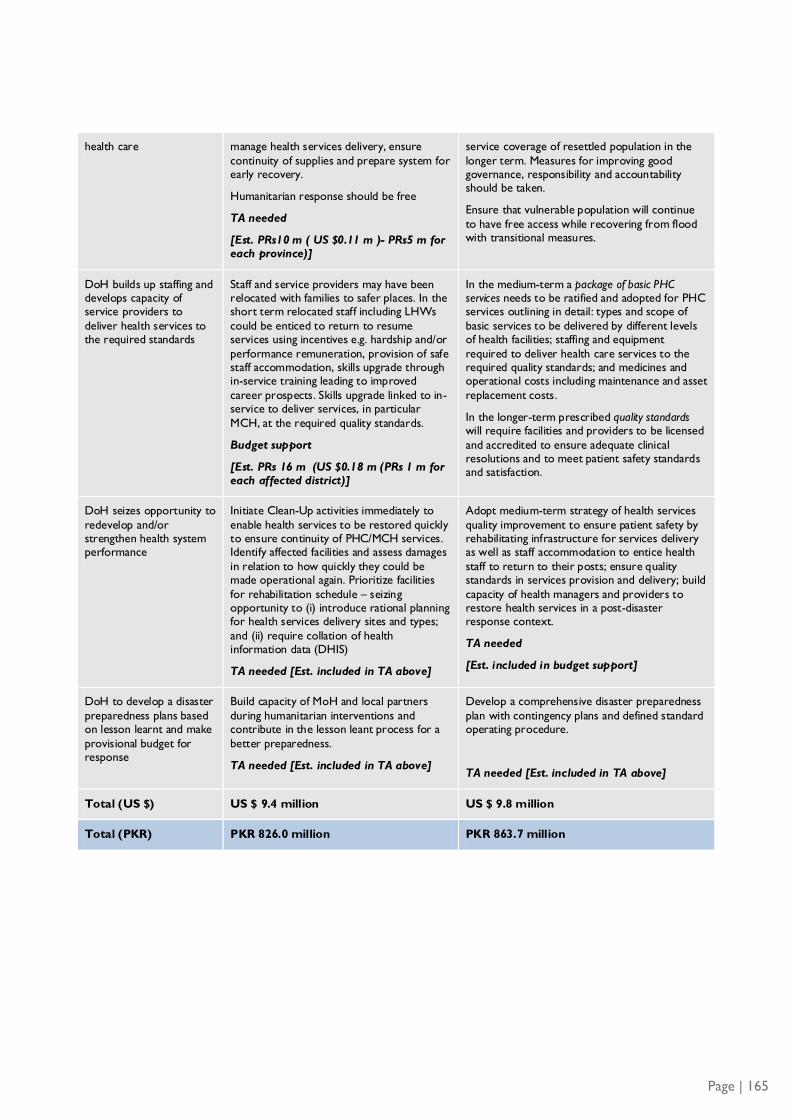
health care manage health services delivery, ensure continuity of supplies and prepare system for early recovery.
Humanitarian response should be free
TA needed
[Est. PRs10 m ( US $0.11 m )- PRs5 m for each province)]
service coverage of resettled population in the longer term. Measures for improving good governance, responsibility and accountability should be taken.
Ensure that vulnerable population will continue to have free access while recovering from flood with transitional measures.
DoH builds up staffing and develops capacity of service providers to deliver health services to the required standards
Staff and service providers may have been relocated with families to safer places. In the short term relocated staff including LHWs could be enticed to return to resume services using incentives e.g. hardship and/or performance remuneration, provision of safe staff accommodation, skills upgrade through in-service training leading to improved career prospects. Skills upgrade linked to in-service to deliver services, in particular MCH, at the required quality standards.
Budget support
[Est. PRs 16 m (US $0.18 m (PRs 1 m for each affected district)]
In the medium-term a package of basic PHC services needs to be ratified and adopted for PHC services outlining in detail: types and scope of basic services to be delivered by different levels of health facilities; staffing and equipment required to deliver health care services to the required quality standards; and medicines and operational costs including maintenance and asset replacement costs.
In the longer-term prescribed quality standards will require facilities and providers to be licensed and accredited to ensure adequate clinical resolutions and to meet patient safety standards and satisfaction.
DoH seizes opportunity to redevelop and/or strengthen health system performance
Initiate Clean-Up activities immediately to enable health services to be restored quickly to ensure continuity of PHC/MCH services. Identify affected facilities and assess damages in relation to how quickly they could be made operational again. Prioritize facilities for rehabilitation schedule – seizing opportunity to (i) introduce rational planning for health services delivery sites and types; and (ii) require collation of health information data (DHIS)
TA needed [Est. included in TA above]
Adopt medium-term strategy of health services quality improvement to ensure patient safety by rehabilitating infrastructure for services delivery as well as staff accommodation to entice health staff to return to their posts; ensure quality standards in services provision and delivery; build capacity of health managers and providers to restore health services in a post-disaster response context.
TA needed
[Est. included in budget support]
DoH to develop a disaster preparedness plans based on lesson learnt and make provisional budget for response
Build capacity of MoH and local partners during humanitarian interventions and contribute in the lesson leant process for a better preparedness.
TA needed [Est. included in TA above]
Develop a comprehensive disaster preparedness plan with contingency plans and defined standard operating procedure.
TA needed [Est. included in TA above]
Total (US $) US $ 9.4 million US $ 9.8 million
Total (PKR) PKR 826.0 million PKR 863.7 million
Page | 165

Annex 10: Housing

Page | 167
Sector Background
State of Sector Prior to Disaster
The 2011 floods impacted private housing more than most sectors due to it predominantly being of katcha
construction type. A typical affected house in the disaster-affected area in rural Sindh and Balochistan
consists of one or two rooms, an animal shed, storage silos for grain, space for open cooking, and a latrine
and washing area which are generally without roof, with 4-5 feet high walls. The average size of a housing
unit varies, between an average of 1.76 rooms (381 sq. ft.) in Sindh (including urban areas) and 2.24 rooms
(485 sq. ft.) in Balochistan, and an average household comprising 6.0 persons in Sindh and 6.7 in Balochistan.
Most of the affected houses are of Katcha (non/semi-permanent)1 type construction, which is the
predominant type in rural areas2. Pucca (permanent) type construction is found in some rural and most urban
affected areas. Virtually none of the houses in the affected areas had been designed for flood-resistance.
Baseline Housing Stock
The pre-flood baseline housing stock for the affected districts has been estimated by applying district-wise
inter-censal (1981-1998) housing growth rates to the housing stock as reported in the 1998 Census Reports.
In the case of Sindh however, application of the district/tehsil-wise population growth rate was deemed more
appropriate. The baselines so developed were disaggregated into katcha and pucca categories using the
district-level katcha/pucca housing proportion also inferred from the 1998 Census.
According to the estimated baselines, there were 4.128 million housing units in the 22 flood-affected districts
in Sindh and Balochistan. Of these, 1.08 million units were pucca (26%) while 3.05 million units (74%) were
katcha. This proportion varies greatly across and within the two provinces, with 90% katcha prevalence in
affected districts of Balochistan and 74% in affected districts of Sindh. Moreover, a part of this housing stock
is exposed to risks of recurrent natural disasters making one-solution-fits-all reconstruction inappropriate, or
unnecessarily costly if risk resistant standards are to be adopted across the board. This alludes to the need for
differential and localized (district-level) housing reconstruction solutions.
Table-Annex 10.1: Baseline Housing Stock in Flood-Affected Districts
District
Type of Construction
Total % Katcha % Pucca
Katcha Pucca
Sindh (Affected Districts)
Badin 229,201 44,249 273,450 84% 16%
1 This predominantly includes Jhumpari (grass cottage, built with twigs woven around vertical posts with mud %30plaster), mud houses adobe block or brick construction, and fired brick with mud mortar construction types for Sindh. In Balochistan, Katcha houses generally consist of mud houses. 2 Mud house is generally of uncompacted earth lumps stacked to make walls. These may be augmented by:
· Brick masonry up to two to three feet and mud walls above;
· Stone masonry up to two to three feet and mud walls above;
· Brick masonry up to two to three feet with the addition of plastic sheeting at the plinth level;
· Use of fired bricks on the inner and outer face and core of mud in it.
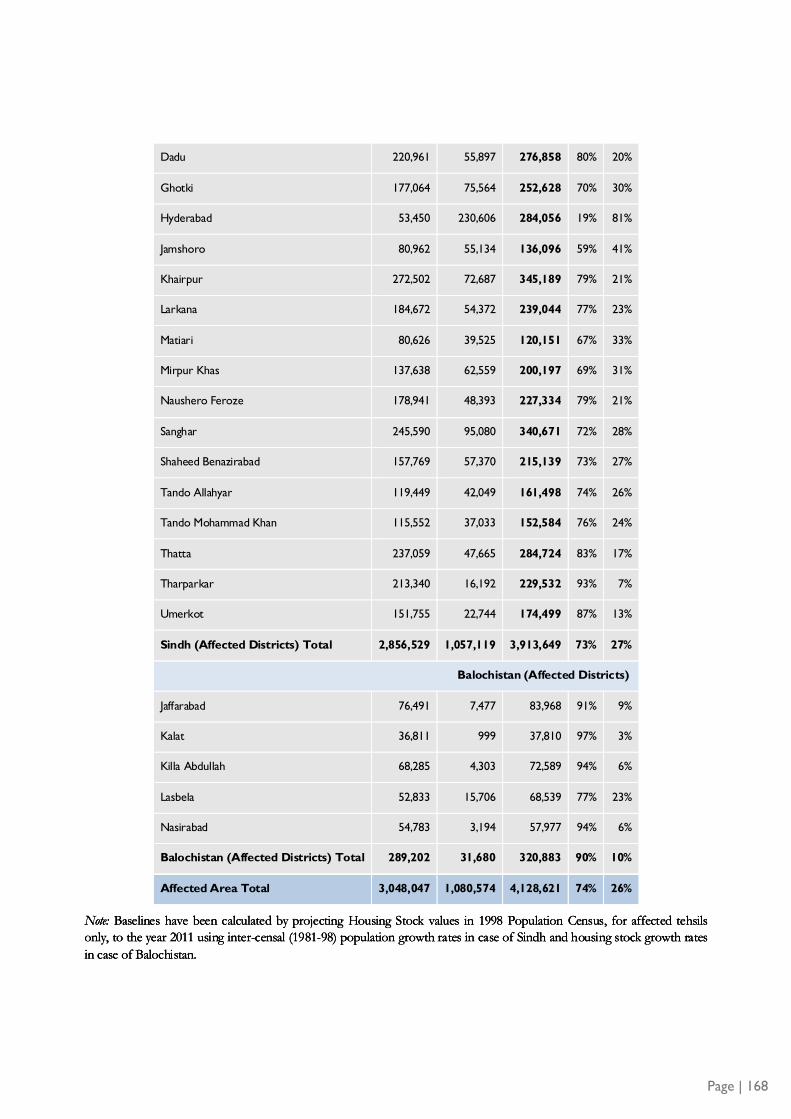
Page | 168
Dadu 220,961 55,897 276,858 80% 20%
Ghotki 177,064 75,564 252,628 70% 30%
Hyderabad 53,450 230,606 284,056 19% 81%
Jamshoro 80,962 55,134 136,096 59% 41%
Khairpur 272,502 72,687 345,189 79% 21%
Larkana 184,672 54,372 239,044 77% 23%
Matiari 80,626 39,525 120,151 67% 33%
Mirpur Khas 137,638 62,559 200,197 69% 31%
Naushero Feroze 178,941 48,393 227,334 79% 21%
Sanghar 245,590 95,080 340,671 72% 28%
Shaheed Benazirabad 157,769 57,370 215,139 73% 27%
Tando Allahyar 119,449 42,049 161,498 74% 26%
Tando Mohammad Khan 115,552 37,033 152,584 76% 24%
Thatta 237,059 47,665 284,724 83% 17%
Tharparkar 213,340 16,192 229,532 93% 7%
Umerkot 151,755 22,744 174,499 87% 13%
Sindh (Affected Districts) Total 2,856,529 1,057,119 3,913,649 73% 27%
Balochistan (Affected Districts)
Jaffarabad 76,491 7,477 83,968 91% 9%
Kalat 36,811 999 37,810 97% 3%
Killa Abdullah 68,285 4,303 72,589 94% 6%
Lasbela 52,833 15,706 68,539 77% 23%
Nasirabad 54,783 3,194 57,977 94% 6%
Balochistan (Affected Districts) Total 289,202 31,680 320,883 90% 10%
Affected Area Total 3,048,047 1,080,574 4,128,621 74% 26%
Note: Baselines have been calculated by projecting Housing Stock values in 1998 Population Census, for affected tehsils only, to the year 2011 using inter-censal (1981-98) population growth rates in case of Sindh and housing stock growth rates
in case of Balochistan.

Page | 169
Damage Overview
The floods caused total or partial damage to an estimated 999,388 housing units in Sindh and Balochistan. An estimated 514,283 houses
have been completely destroyed1 and another 484,093 have suffered partial damage2. This translates into 99% of the total affected
housing stock being in Sindh.
Characteristics of Damage to Katcha and Pucca Houses As expected, the extent of damage incurred to katcha houses is far higher with 29% of the katcha pre-flood housing stock affected
(903,000 housing units), with 495,000 housing units completely destroyed. By contrast, only 7% of pucca pre-flood housing stock
(96,000 housing units) has suffered damage, with about 19,000 being completely destroyed. In general, pucca houses have performed
better but have still been vulnerable to collapsing of roofs, undermining of foundations, and scouring/erosion at the base of walls and
corners. Furthermore, standing water has subjected submerged portions of walls to hydraulic pressure, often causing walls to overturn
or tilt laterally . At places subsidence of the ground under water-logged foundations has resulted in cracking and collapse of walls. For
katcha buildings, the impact has often been extreme and irreversible.
Table-Annex 10.2: Consolidated Damage Details (number of houses)
1 This primarily includes completely washed away, fully collapsed, or structurally damaged houses with foundation failure or erosion of supporting walls 2 This mostly includes cases of roof damage and repairable damage to walls, etc.
District
Katcha Pucca Total
CD
Total
PD
District
Total
% of
Pre-flood
stock CD PD Total CD PD Total
Sindh
Badin* 55,195 57,725 112,920 1,914 12,747 14,660 57,108 70,471 127,580 47%
Dadu* 4,782 7,960 12,742 706 2,278 3,929 5,488 10,238 16,671 6%
Ghotki* 4,577 0 4,577 0 680 680 4,577 680 5,257 2%
Hyderabad* 6,951 8,869 15,820 0 5,352 5,352 6,951 14,220 21,171 7%
Jamshoro* 12,457 20,828 33,285 765 5,265 6,030 13,222 26,093 39,315 29%
Khairpur* 11,553 17,470 29,023 26 837 863 11,579 18,307 29,886 9%
Larkana* 56 3,072 3,128 0 0 0 56 3,072 3,128 1%
Matiari* 4,857 14,555 19,412 0 0 0 4,857 14,555 19,412 16%
Mirpur
Khas 69,881 22,424 92,305 624 3,262 3,886 70,505 25,686 96,191 48%
Naushero Feroze* 5,773 26,025 31,798 395 1,255 1,650 6,168 27,280 33,448 15%
District
Katcha Pucca Total
CD
Total
PD
District
Total
% of
Pre-flood
stock CD PD Total CD PD Total
Sindh
Badin* 55,195 57,725 112,920 1,914 12,747 14,660 57,108 70,471 127,580 47%
Dadu* 4,782 7,960 12,742 706 2,278 3,929 5,488 10,238 16,671 6%
Ghotki* 4,577 0 4,577 0 680 680 4,577 680 5,257 2%
Hyderabad* 6,951 8,869 15,820 0 5,352 5,352 6,951 14,220 21,171 7%
Jamshoro* 12,457 20,828 33,285 765 5,265 6,030 13,222 26,093 39,315 29%
Khairpur* 11,553 17,470 29,023 26 837 863 11,579 18,307 29,886 9%
Larkana* 56 3,072 3,128 0 0 0 56 3,072 3,128 1%
Matiari* 4,857 14,555 19,412 0 0 0 4,857 14,555 19,412 16%
Mirpur
Khas 69,881 22,424 92,305 624 3,262 3,886 70,505 25,686 96,191 48%
Naushero Feroze* 5,773 26,025 31,798 395 1,255 1,650 6,168 27,280 33,448 15%
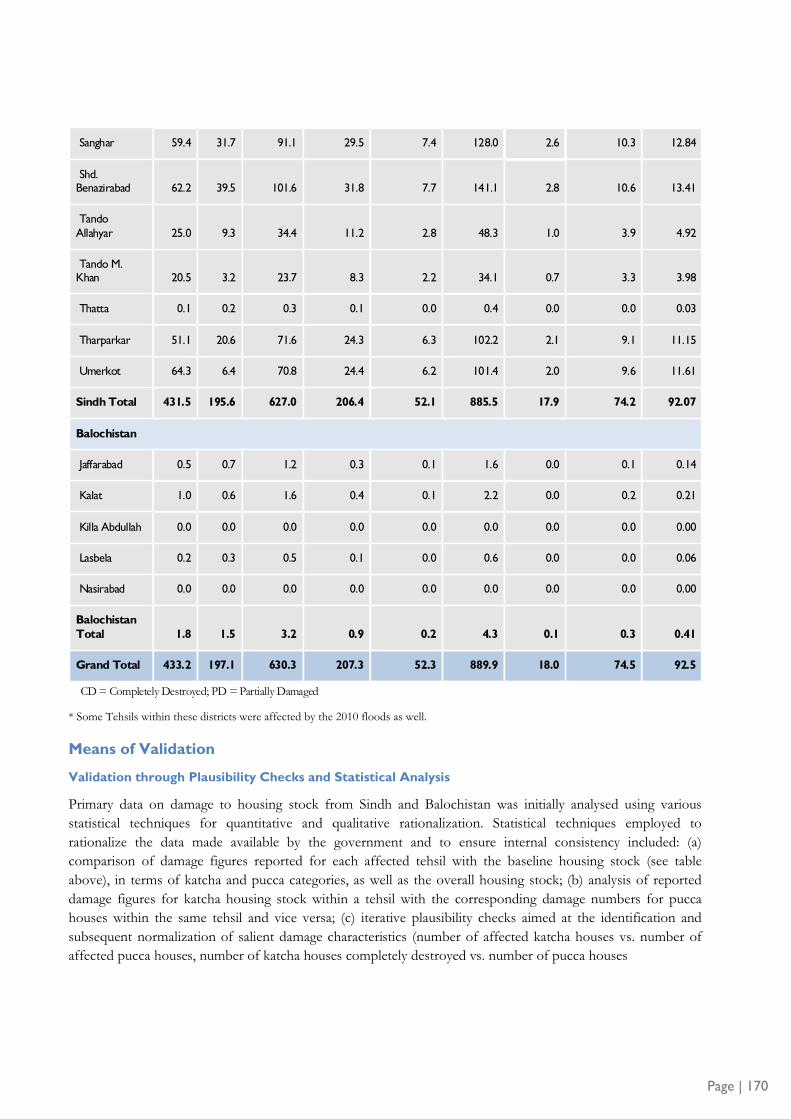
Page | 170
CD = Completely Destroyed; PD = Partially Damaged
Sanghar 59.4 31.7 91.1 29.5 7.4 128.0 2.6 10.3 12.84
Shd. Benazirabad 62.2 39.5 101.6 31.8 7.7 141.1 2.8 10.6 13.41
Tando Allahyar 25.0 9.3 34.4 11.2 2.8 48.3 1.0 3.9 4.92
Tando M. Khan 20.5 3.2 23.7 8.3 2.2 34.1 0.7 3.3 3.98
Thatta 0.1 0.2 0.3 0.1 0.0 0.4 0.0 0.0 0.03
Tharparkar 51.1 20.6 71.6 24.3 6.3 102.2 2.1 9.1 11.15
Umerkot 64.3 6.4 70.8 24.4 6.2 101.4 2.0 9.6 11.61
Sindh Total 431.5 195.6 627.0 206.4 52.1 885.5 17.9 74.2 92.07
Balochistan
Jaffarabad 0.5 0.7 1.2 0.3 0.1 1.6 0.0 0.1 0.14
Kalat 1.0 0.6 1.6 0.4 0.1 2.2 0.0 0.2 0.21
Killa Abdullah 0.0 0.0 0.0 0.0 0.0 0.0 0.0 0.0 0.00
Lasbela 0.2 0.3 0.5 0.1 0.0 0.6 0.0 0.0 0.06
Nasirabad 0.0 0.0 0.0 0.0 0.0 0.0 0.0 0.0 0.00
Balochistan Total 1.8 1.5 3.2 0.9 0.2 4.3 0.1 0.3 0.41
Grand Total 433.2 197.1 630.3 207.3 52.3 889.9 18.0 74.5 92.5
* Some Tehsils within these districts were affected by the 2010 floods as well.
Means of Validation
Validation through Plausibility Checks and Statistical Analysis
Primary data on damage to housing stock from Sindh and Balochistan was initially analysed using various
statistical techniques for quantitative and qualitative rationalization. Statistical techniques employed to
rationalize the data made available by the government and to ensure internal consistency included: (a)
comparison of damage figures reported for each affected tehsil with the baseline housing stock (see table
above), in terms of katcha and pucca categories, as well as the overall housing stock; (b) analysis of reported
damage figures for katcha housing stock within a tehsil with the corresponding damage numbers for pucca
houses within the same tehsil and vice versa; (c) iterative plausibility checks aimed at the identification and
subsequent normalization of salient damage characteristics (number of affected katcha houses vs. number of
affected pucca houses, number of katcha houses completely destroyed vs. number of pucca houses
completely destroyed, number of pucca houses completely destroyed vs. number of pucca houses partially
damaged, et al.) reported for katcha and pucca houses that had been reported as partially damaged or
completely destroyed within a tehsil; and (d) cross comparisons amongst the scale and profile of damages
reported for a tehsil vis-à-vis other similarly affected tehsils from the same as well as other districts to identify
damage normalization coefficients, wherever needed.
Validation through comparison with other sources of data
While data provided by government agencies represented the primary source of data utilized for the current
exercise, other sources of primary data available were utilized for counter-analytic and cross-comparison
purposes such as the damage estimates for United Nations Inter-Agency Shelter Cluster report, based on
primary data collected during field assessments by agencies such as the World Food Program, the Temporary
Settlement Support Unit, National Rural Support Program, and other NGOs. These sources were particularly
useful for identification of the scale and characteristics of damage within each district in Sindh. In addition,
damage figures for the health sector were also consulted, particularly as a basis for comparison with the tehsil-
wise damages reported to pucca housing stock.
Validation through Remote-Sensing Data
Satellite imagery-based information developed by SUPARCO for the FAO was used to analyse area
inundated within each district. Moreover, data from such sources as UNOSAT, German Remote Sensing
Data Center, and iMMAP was used to identify the duration and characteristics of inundation for affected
areas. These data sets have been used to validate and rationalize damage estimates on a district, and in some
cases tehsil/taluka, level - particularly in the case of Sindh.
Risks in Quantification due to housing damages from 2010 Floods
As shown in Table 10.2 above, part of the housing stock in 12 of the 17 districts affected by the 2011 floods
was also affected during the floods of 2010. The scale of flooding and therefore damages has varied within
the districts and sub-district administrative units between the two flood events. However, there is a high risk
that some housing stock damaged in the 2010 floods but not reconstructed or repaired to date, may have
been double counted during the current assessment of housing damages due to the 2011 floods. This risk is
further compounded by the fact that no detailed housing damage assessment survey was undertaken in the
intervening period, or any comprehensive housing reconstruction programs initiated after the 2010 floods.
In order to quantify this risk, a detailed analysis has been undertaken by the DNA Housing team to
determine: (a) the districts and tehsils affected by 2010 as well as 2011 floods; and (b) the total housing stock
within the districts and tehsils affected in both years. A comparison of the corresponding numbers of
affected housing stock at the district and tehsil level has been used to compute the total number of houses
which are at risk of being double-counted in the current assessment. The results from these analyses show
that a total of approximately 118,700 housing units situated within the tehsils1 affected in both 2010 and 2011
are at the risk of being double counted. This represents about 11.95% of the total housing stock affected by
the 2011 floods.
1 Tehsils affected in both 2010 and 2011 floods: Badin, Dadu, Mehar, Khairpur Nathan Shah, Johi, Ubauro, Daharki, Hyderabad City, Latifabad, Hyderabad Rural, Qasimabad, Kotri, Sehwan Sharif, Khairpur, Gambat, Kotdiji, Kingri, Larkano, Ratodero, Dokri, Matiari, Hala, Naushero.Feroze, Moro, Kandiaro, Sanghar, Nawabshah, Sakrand, and Thatta.
Page | 171

Damage and Loss Quantification
Direct Damage Estimate
The term ‘Damage’ refers to the loss in depreciated monetary value due to structural damage to the housing
stock caused by the disaster. The damage costs for a typical house vary depending upon the severity of
damage, size of house, type of construction, and the age of the housing unit. A detailed model was developed
for the assessment - using differential rates for pucca and katcha housing types. This model helped estimate
the average unit reconstruction cost for each area. Based on the 1998 Census data, the average number of
rooms in a typical house, averaged across all districts in each province, has been used to calculate average unit
size for each province. The cost of a typical katcha and pucca house has been estimated using construction
costs collected from field visits by the DNA team, as well as desk estimates. Reconstruction of a katcha house
to pre-flood standards is estimated to cost PKR 230 per sq. ft and a pucca one at PKR 650 per sq. ft.
Damages to partially damaged houses, considered repairable, are assumed to be 40 percent of damages to an
equivalent completely destroyed house. Furthermore, depreciation factors have been determined for each
province/region using Census 1998 data on average age of housing units. Two additional categories have
been added to calculate total damage to housing infrastructure and assets. These are specific for housing
assets and include: (a) damage to household goods and assets estimated as a proportion (15%) of the value of
housing unit as well as the estimated value of lost appliances based on the available statistics1; and (b)
estimated damage to household water and sanitation facilities based on representative data2.
Using the above model, the direct damages (depreciated) costs for partially damaged houses is estimated at
US$ 197.1 million, and for completely destroyed houses at US$ 433.2 million, giving a total direct damage
cost of US$ 630.3 million. Damages to housing assets (depreciated) include: (a) US$ 207.3 million in
household goods and assets, US$ 52.3 million in water and sanitation facilities, with a total of US$ 259.6
million. Adding up the two categories of infrastructure and assets, the total housing sector damage
(depreciated) is estimated at US$ 889.9 million.
Loss Estimate
The value of losses including costs of debris removal and provision of temporary shelter, as prescribed by the
UN-ECLAC methodology have also been calculated. The cumulative value of indirect housing sector losses is
estimated at US$ 92.5 million, including US$ 18.0 million for demolition and debris removal; and US$ 74.5
million for provision of temporary shelter.
Table-Annex 10.3: Depreciated Value of Housing Sector Damage and Losses (US$ million)
District
Value of Housing Stock (Direct Damages) Indirect Losses
CD PD Total
Damage
HH Goods
and Assets
WATSAN infrastruct
ure
Total Housing Damage
Debris Removal
Costs
Temporary Shelter Costs
Total Damage & Loss
1 Census of Electricity 2005-06 2 Pakistan Social and Living-Standard Measurement (PSLM) Survey 2006-7
Page | 172

Sindh
Badin 47.8 29.6 77.4 25.1 6.3 108.9 2.2 8.8 11.01
Dadu 5.3 4.5 9.9 3.0 0.7 13.6 0.3 1.0 1.23
Ghotki 3.6 0.6 4.2 1.4 0.4 6.0 0.1 0.5 0.67
Hyderabad 5.5 7.6 13.1 4.0 1.0 18.0 0.4 1.3 1.61
Jamshoro 11.5 11.3 22.8 7.2 1.8 31.7 0.6 2.3 2.99
Khairpur 9.2 6.3 15.4 5.2 1.4 22.0 0.4 1.9 2.36
Larkana 0.0 1.0 1.0 0.3 0.1 1.4 0.0 0.1 0.13
Matiari 3.8 4.6 8.4 2.9 0.8 12.1 0.2 1.0 1.27
Mirpur Khas 56.5 10.0 66.5 22.9 5.9 95.3 1.9 8.9 10.85
Naushero Feroze 5.4 9.3 14.8 4.8 1.3 20.8 0.4 1.6 2.00
Sanghar 59.4 31.7 91.1 29.5 7.4 128.0 2.6 10.3 12.84
Shd. Benazirabad 62.2 39.5 101.6 31.8 7.7 141.1 2.8 10.6 13.41
Tando Allahyar 25.0 9.3 34.4 11.2 2.8 48.3 1.0 3.9 4.92
Tando M. Khan 20.5 3.2 23.7 8.3 2.2 34.1 0.7 3.3 3.98
Thatta 0.1 0.2 0.3 0.1 0.0 0.4 0.0 0.0 0.03
Tharparkar 51.1 20.6 71.6 24.3 6.3 102.2 2.1 9.1 11.15
Umerkot 64.3 6.4 70.8 24.4 6.2 101.4 2.0 9.6 11.61
Sindh Total 431.5 195.6 627.0 206.4 52.1 885.5 17.9 74.2 92.07
Balochistan
Jaffarabad 0.5 0.7 1.2 0.3 0.1 1.6 0.0 0.1 0.14
Kalat 1.0 0.6 1.6 0.4 0.1 2.2 0.0 0.2 0.21
Killa Abdullah 0.0 0.0 0.0 0.0 0.0 0.0 0.0 0.0 0.00
Lasbela 0.2 0.3 0.5 0.1 0.0 0.6 0.0 0.0 0.06
Nasirabad 0.0 0.0 0.0 0.0 0.0 0.0 0.0 0.0 0.00
Page | 173

Balochistan Total 1.8 1.5 3.2 0.9 0.2 4.3 0.1 0.3 0.41
Grand Total 433.2 197.1 630.3 207.3 52.3 889.9 18.0 74.5 92.5
CD = Completely Destroyed; PD = Partially Damaged
Proposed Housing Recovery and Reconstruction Strategy
The suggested recovery and reconstruction strategy comprises a variety of activities to assist households to be
re-housed in permanent housing. The predominant form of suggested assistance is cash grants for owner-
driven rebuilding – a mode well suited to the predominantly rural affectees, and already being used by the
government for immediate assistance. This would be responsive to individual preferences and maximize
household ownership thereby keeping expectations of, and demands on, government realistic. It would
mobilize self-standing reconstruction and rehabilitation efforts primarily at the level of the affected
households, thereby not burdening government administrative capacity with a large volume of contract
management. The objective of the reconstruction grant would be to replace a destroyed house with a new core
unit, preferably of flood-resistant standards. A repair grant would help restore structurally damaged portions
of houses to a livable state.
Urgent attention to beneficiary identification and eligibility verification is required, to ensure transparency.
The strategy also recognizes the need for extended-term intermediate sheltering options for households that
will need to be relocated from areas that are severely hazard-prone, or at a risk of recurrent flooding.
Although permanent relocation will require time, replacement site identification and re-planning are short-
term priorities. Priority also needs to be given to zoning of the affected area for recurrent hazard risks, to
enable application of appropriate engineering design solutions. The post-earthquake housing reconstruction
program, substantially implemented over 2006-09, achieved impressive results and provides valuable lessons
and the strategic underpinnings for developing a post-floods housing reconstruction program, with
appropriate adjustments.
Proposed policy principles
1. Ensure rebuilding is owner-driven.
2. Rebuild in-situ as far as possible, but relocate settlements away from recurrent risk areas.
3. Offer equitable assistance package for a core unit that is not compensation-based, but is differential
based on applicable natural hazard risks.
4. Adopt and promote use of cost-effective, hazard-resistant engineering designs and reconstruction
standards.
5. Rebuild with easily accessible materials reflecting cultural preferences.
6. Ensure consistency of policy principles & strategies across provinces, and centrally coordinated policy
framework, monitoring, and standards for equity.
7. Route housing grant disbursements through the provinces.
Page | 174

Page | 175
1. Undertake detailed Damage Assessment and Eligibility Verification survey based on uniform technical
criteria to ensure consistency across affected areas.
2. Require uniformity of implementation approach across funding sources/partner organizations.
3. Sign MOUs with beneficiaries to ensure judicious use of grants (for the purposes intended) &
adherence to applicable hazard resistant standards.
4. Require assisted, inspected, and certified tranche-based disbursement of reconstruction assistance
linked to stages of construction, and adoption of applicable hazard-resistant standards.
5. Ensure consistency & complementarity between early recovery & permanent housing solutions.
6. Establish participatory and inclusive information management and grievance redressal systems.
Costed Strategic Options
Since parts of the affected area are prone to recurrent flood risks, reconstruction of houses should be based
on appropriate cost-effective, flood-resistant engineering standards as far as possible. While this approach will
increase initial costs of reconstruction to some extent, it will constitute the most economically efficient
solution when viewed over the full useful life of these investments.
Locations vulnerable to recurrent flooding have been identified using historical evidence and recorded
damage figures. A number of districts including Badin, Hyderabad, and Thatta have been affected during
flood emergencies in 2003, 2010, and 2011. In particular, the floods in 2003 closely resembled the current
situation since they were also caused by unusually heavy rainfall over the lower Sindh region, and witnessed
breaches along the Left Bank Outfall Drain (LBOD). Badin and Thatta being located along the coastal belt
are also susceptible to cyclones and typhoon hazards. Thus adoption of hazard-resistant construction
standards is strongly recommended for restoration of the damaged housing stock in these districts.
Estimated Needs for Permanent Housing Reconstruction
The reconstruction and repair needs for Housing have been calculated for the two options explained below.
They range between US$ 986 million and US$ 1.04 billion. These estimates are based on replacement of a
destroyed house with a core unit of 500 sq.ft covered area, calculated on the basis of currently prevailing
prices of materials and labor.
Table-Annex 10.4: Housing: Summary of Reconstruction Cost Options
Reconstruction Options Pros and Cons Reconstruction /
Repair Costs (US$ mill)
Option-1 (Base Case Scenario): Uniform Subsidy calculated on the
basis of a katcha core unit. Subsidy of PKR 115,000 for
reconstruction; PKR 55,000 for repairs.
Not Recommended: Least
cost but sub-optimal option
from engineering/ disaster risk
reduction perspective
985.8
Option-2: Differential Subsidy - providing for reconstruction to
flood-resistant standard for units located in recurrent flood
hazard areas only. Subsidy of PKR 205,000 for reconstruction of
flood-resistant hybrid house; PKR 115,000 for reconstruction in the
rest of the affected areas; PKR 55,000 for repairs.
Recommended: Caters to
flood risk, providing optimal
balance between affordability
and BBB
1,051.8

Option-1 (Base Case): Uniform subsidy
The base case assumes provision of a uniform subsidy equivalent to the amount required to construct a core
katcha unit. It implies a standardized cash grant of PKR 115,000 (approximately US$ 1322) to each
household whose dwelling was completely destroyed, and PKR 55,000 (approximately US$ 632) to each
household for repairs of dwellings damaged partially. It does not cater for the prevalent risks of recurrent
flooding or other disasters in parts of the affected area, and is costedonly for comparison purposes. Since it
putsfuture investment that will go into housing reconstruction at risk,itis a sub-optimal use of scarce public
resources, andis not recommended.
Option-2: Partially Differential Subsidy (Flood Premium)
This option provides for restoration to flood-resistant standard for units located within the flood hazard
areas. It offers a subsidy of PKR 205,000 (US$ 2356) including a flood premium of PKR 90,000, for
reconstruction of a flood-resistant hybrid house in flood hazard areas only. Completely destroyed housing
units in districts Badin, Hyderabad, and Thatta have been included for the purposes of this calculation. The
total number of completely destroyed houses in these districts on which flood premium is recommended is
71,392 (57,108 in Badin, 14,220 in Hyderabad, and 64 in Thatta). The additional outlay required for the
payment of flood premium is estimated to be USD 66 million which amounts to 7% of the total cost for the
Uniform Subsidy Option. However, a detailed Damage Assessment and Beneficiary Eligibility Survey will be
required to identify the exact number of houses eligible for a reconstruction grant that includes a flood
premium. It requires of pucca construction of foundations and plinth (burnt brick, concrete block or stone
masonry, set in cement-sand mortar), raised to an average height of six feet, with a katcha (adobe or mud
wall) super structure. The subsidy for units outside these areas remains PKR 115,000.
The Reconstruction Grant will be released in two tranches: (i) an advance payment; and (ii) as second
payment after completion and certification of construction up to plinth level. All partially damaged units will
continue to be eligible for PKR 55,000 for repairs, since existing structures cannot be repaired to flood-
resistant standards. This is the recommended option and is generally recommended for the flood-affected
areas that are vulnerable to recurrent flooding.
Since the amounts of the proposed reconstruction subsidies have been calibrated on the basis of a katcha
core unit, owners of pucca houses that have been completely destroyed will find the proposed subsidy for the
base case inadequate. While it cannot be varied for reasons of equity, it is recommended that the government
try to facilitate access to housing loans through existing financial institutions for creditworthy house owners
within this category.
Table-Annex 10.5: Costed Reconstruction Options (Million PKR)
District
Option 1 - Base Case Option 2 – Differential Subsidy
Reconstruction Repair Total USD
million Reconstruction Repair Total
USD
million
Page | 176

Page | 177
Badin 6,567 3,876 10,443.4 120.0 11,679 3,876
15,554 178.8
Dadu 631 563 1,194.3 13.7 631 563 1,194 13.7
Ghotki 526 37 563.8 6.5 526 37
564 6.5
Hyderabad 799 782 1,581.5 18.2 1,425 782 2,207 25.4
Jamshoro 1,521 1,435 2,955.6 34.0 1,521 1,435 2,956 34.0
Khairpur 1,332 1,007 2,338.5 26.9 1,332 1,007 2,338 26.9
Larkana 6 169 175.4 2.0 6 169 175 2.0
Matiari 559 800 1,359.1 15.6 559 800 1,359 15.6
Mirpur Khas 8,108 1,413 9,520.8 109.4 8,108 1,413 9,521 109.4
Naushero
Feroze 709 1,500 2,209.7 25.4 709 1,500 2,210 25.4
Sanghar 7,554 4,676 12,229.6 140.6 7,554 4,676
12,230 140.6
Shd. Benazirabad 8,090 4,280 12,370.4 142.2 8,090 4,280 12,370 142.2
Tando Allahyar 3,157 1,368 4,525.8 52.0 3,157 1,368 4,526 52.0
Tando M. Khan 2,990 529 3,518.7 40.4 2,990 529 3,519 40.4
Thatta 7 32 39.3 0.5 13 32 45 0.5
Tharparkar 7,279 3,129 10,408.3 119.6 7,279 3,129
10,408 119.6
Umerkot 9,097 814 9,911.0 113.9 9,097 814 9,911 113.9
Sindh Total
58,933 26,412 85,345
981.0
64,675
26,412
91,087
1,047.0
Balochistan
Jaffarabad 59 96 154.9 1.8 59 96 155 1.8
Kalat 124 80 204.5 2.4 124 80 205 2.4
Killa Abdullah 0 0 0.0 0.0 0 0 - 0.0
Lasbela 26 37 63.2 0.7 26 37 63 0.7
Badin 6,567 3,876 10,443.4 120.0 11,679 3,876 15,554 178.8
Dadu 631 563 1,194.3 13.7 631 563 1,194 13.7
Ghotki 526 37 563.8 6.5 526 37 564 6.5
Hyderabad 799 782 1,581.5 18.2 1,425 782 2,207 25.4
Jamshoro 1,521 1,435 2,955.6 34.0 1,521 1,435 2,956 34.0
Khairpur 1,332 1,007 2,338.5 26.9 1,332 1,007 2,338 26.9
Larkana 6 169 175.4 2.0 6 169 175 2.0
Matiari 559 800 1,359.1 15.6 559 800 1,359 15.6
Mirpur Khas 8,108 1,413 9,520.8 109.4 8,108 1,413 9,521 109.4
Naushero
Feroze 709 1,500 2,209.7 25.4 709 1,500 2,210 25.4
Sanghar 7,554 4,676 12,229.6 140.6 7,554 4,676 12,230 140.6
Shd. Benazirabad 8,090 4,280 12,370.4 142.2 8,090 4,280 12,370 142.2
Tando Allahyar 3,157 1,368 4,525.8 52.0 3,157 1,368 4,526 52.0
Tando M. Khan 2,990 529 3,518.7 40.4 2,990 529 3,519 40.4
Thatta 7 32 39.3 0.5 13 32 45 0.5
Tharparkar 7,279 3,129 10,408.3 119.6 7,279 3,129 10,408 119.6
Umerkot 9,097 814 9,911.0 113.9 9,097 814 9,911 113.9
Sindh Total
58,933 26,412 85,345
981.0
64,675
26,412 91,087
1,047.0
Balochistan
Jaffarabad 59 96 154.9 1.8 59 96 155 1.8
Kalat 124 80 204.5 2.4 124 80 205 2.4
Killa Abdullah 0 0 0.0 0.0 0 0 - 0.0
Lasbela 26 37 63.2 0.7 26 37 63 0.7
Nasirabad 0 0 0.0 0.0 0 0 - 0.0
Balochistan 209
Badin 6,567 3,876 10,443.4 120.0 11,679 3,876
15,554 178.8
Dadu 631 563 1,194.3 13.7 631 563 1,194 13.7
Ghotki 526 37 563.8 6.5 526 37
564 6.5
Hyderabad 799 782 1,581.5 18.2 1,425 782 2,207 25.4
Jamshoro 1,521 1,435 2,955.6 34.0 1,521 1,435 2,956 34.0
Khairpur 1,332 1,007 2,338.5 26.9 1,332 1,007 2,338 26.9
Larkana 6 169 175.4 2.0 6 169 175 2.0
Matiari 559 800 1,359.1 15.6 559 800 1,359 15.6
Mirpur Khas 8,108 1,413 9,520.8 109.4 8,108 1,413 9,521 109.4
Naushero
Feroze 709 1,500 2,209.7 25.4 709 1,500 2,210 25.4
Sanghar 7,554 4,676 12,229.6 140.6 7,554 4,676
12,230 140.6
Shd. Benazirabad 8,090 4,280 12,370.4 142.2 8,090 4,280 12,370 142.2
Tando Allahyar 3,157 1,368 4,525.8 52.0 3,157 1,368 4,526 52.0
Tando M. Khan 2,990 529 3,518.7 40.4 2,990 529 3,519 40.4
Thatta 7 32 39.3 0.5 13 32 45 0.5
Tharparkar 7,279 3,129 10,408.3 119.6 7,279 3,129
10,408 119.6
Umerkot 9,097 814 9,911.0 113.9 9,097 814 9,911 113.9
Sindh Total
58,933 26,412 85,345
981.0
64,675
26,412
91,087
1,047.0
Balochistan
Jaffarabad 59 96 154.9 1.8 59 96 155 1.8
Kalat 124 80 204.5 2.4 124 80 205 2.4
Killa Abdullah 0 0 0.0 0.0 0 0 - 0.0
Lasbela 26 37 63.2 0.7 26 37 63 0.7
Nasirabad 0 0 0.0 0.0 0 0 - 0.0
Balochistan
Total
209
213
423
4.9 209
213
423
4.9
Grand Total 59,143 26,625 85,768 985.8 64,885 26,625 91,510 1,051.8
Premium over Base Case Option 107%
Nasirabad 0 0 0.0 0.0 0 0 - 0.0
Balochistan
Total
209
213
423
4.9 209
213
423
4.9
Grand Total 59,143 26,625 85,768 985.8 64,885 26,625 91,510 1,051.8
Premium over Base Case Option 107%
Nasirabad 0 0 0.0 0.0 0 0 - 0.0
Balochistan
Total
209
213
423
4.9 209
213
423
4.9
Grand Total 59,143 26,625 85,768 985.8 64,885 26,625 91,510 1,051.8
Premium over Base Case Option 107%
Nasirabad 0 0 0.0 0.0 0 0 - 0.0
Balochistan
Total
209
213
423
4.9 209
213
423
4.9
Grand Total 59,143 26,625 85,768 985.8 64,885 26,625 91,510 1,051.8
Premium over Base Case Option 107%
Nasirabad 0 0 0.0 0.0 0 0 - 0.0
Balochistan
Total
209
213
423
4.9 209
213
423
4.9
Grand Total 59,143 26,625 85,768 985.8 64,885 26,625 91,510 1,051.8
Premium over Base Case Option 107%
CD = Completely Destroyed; PD = Partially Damaged

Development of Unit Rates for Reconstruction
Since the damaged housing stock is spread across most of Sindh and parts of Balochistan, geographical
variations are expected for types as well as prices of preferred construction materials. The estimation of unit
reconstruction rates for the housing options considered for estimating ‘needs’ has involved the use of a unit cost
housing model, designed and tailored by the DNA Housing team for owner-driven, rather than contractor-driven,
reconstruction. The reported prices of basic construction inputs obtained from various credible sources have
been fed into this model for developing the damage and needs scenarios presented.
Priorities for Recovery and Reconstruction
· Information Dissemination should be a crucial part of the government’s strategy. This should include information
on the full range of assistance options, their eligibility criteria and the means of accessing them, as well as
improved construction methods for hazard-resistant houses.
· Detailed Damage Assessment and Eligibility Verification Survey is an urgent task, and needs to be undertaken using
uniform technical standards, to ensure transparent eligibility verification.
· Flood Risk investigation studies need to be undertaken to identify land susceptible to future natural disasters like
recurrent flooding as well as other disasters.
· Developing Appropriate Hazard-resistant Engineering Design Options: Since different parts of the affected area may
be prone to flood/cyclone/typhoon risks, developing cost-effective engineering design solutions should be a
priority.
· Training for Safe Construction for artisans, contractors, home-owners, and construction supervisors should be an
integral part of government’s reconstruction strategy. This should be initiated as soon as possible, and housing
assistance needs be tied to the adoption of the improved construction practices.
· Recycling Materials from Debris will reduce reconstruction costs and have a positive environmental impact.
Communities need to be educated on optimal reuse of materials from the housing debris.
· Community Mobilization will be needed to ensure information dissemination, better construction methods/skills
training, mutual support and oversight. Moreover, vulnerable-headed eligible households will need special
attention and assistance via such mechanisms.
Page | 178

Page | 179
· Availability of Construction Materials during the reconstruction phase will be critical, particularly with the
compounded needs of multiple sectors. Special efforts will be needed such as setting up of construction
material hubs throughout the affected areas.
· Settlement Planning and Development should be reviewed in light of the possibility of introducing flood
protective measures for entire communities in areas prone to risks of recurrent flooding. Protective
measures for entire communities, like construction of levees (earthen embankments) offer optimal use of
resources, enabling engineering standards for individual buildings to be lowered.
· Appropriate Implementation Arrangements for Housing Reconstruction, particularly one that is: (a) owner-driven; and
(b) predominantly rural, are needed. The successful post-2005 earthquake rural housing reconstruction
program offers a most useful precedent.
Follow-up Actions Required for Housing Sector
i. Focus on federal-provincial dialogue to harmonize provincial strategies and plans for housing
reconstruction along proposed policy parameters.
ii. Develop consensus on roles: (a) for central (federal) coordination, monitoring, and standard setting for equity,
and (b) provincial level implementation.
iii. Explore the potential of introducing urban housing loans and rural microfinance through existing
mechanisms, for providing supplementary support to creditworthy house owners.
iv. Develop incentivized community protection approaches and programs to ensure greater disaster (flood) risk
reduction for communities at high risk of recurrent flooding. This could include introduction of
community level protective infrastructure such as bunds, spurs, and dykes. In case of some
communities prone to significant flood risks, it may be more cost-effective to reconstruct individual
houses to the base standard, and collectively use the proceeds of the eligible flood risk premium to
finance community level protective infrastructure.

Annex 11: Private Sector, Industries and Financial Sector

Page | 181
1I. Private Sector and Industries
Background
A significant number of micro and small enterprises in Sindh and Balochistan were affected by the 2011
floods, but there was little direct affect on formal private sector enterprises. We estimate that approximately
half of Sindh’s enterprises in the affected areas were impacted directly (damaged) or indirectly (loss of
economic activity) by the floods. The impact in Balochistan was very small. As noted above these were
primarily informal micro and small enterprises. These enterprises are engaged in services and small-scale
manufacturing.
For many enterprises this was a double-hit as these were also impacted by the 2010 Floods: The 2010 floods
affected economic centers across the country, including the province of Sindh, where damages of PKR 24.0
billion (US$ 275.86 million) to the private sector were reported1 with an estimated reconstruction cost of
around PKR 4.0 billion (US$ 46.0 million). The floods resulted in heavy losses to micro and small enterprises
in the manufacturing and services sectors. The sectors of cotton ginning, sugar and rice processing took the
worst hit in Sindh, and as a result, the livelihoods and household incomes of the affected communities
received a serious blow. The consequences were even graver for women and ethnic minorities in the province
of Sindh, as the contribution of women towards agricultural labor (for example cotton picking and spraying
pesticides) was never properly documented and monetized. Similarly, due to their relatively small population,
the participation of the ethnic minorities in the workforce has not been visible.
Lessons can be learnt from 2010 Rehabilitation efforts for the Private Sector: In addition to the cash transfers
program and other relief packages offered by the GoP, organizations like the Pakistan Poverty Alleviation
Fund (PPAF)2 came forward to launch immediate relief activities. The PPAF generated PKR 965 million
(US$ 11.09 million) through its own resources and through partnerships with KfW, USAID, WB and
corporate sector. It managed to reach out to 22 districts providing direct support to 519,155 affected
individuals and few micro and small enterprises.
Establishing baseline data has been difficult due to the high levels of informality in the Pakistani economy: In
Pakistan approximately 1% of enterprises are formally registered. The remaining 99% are not captured in
Government’s data. There are many estimates of the number of these informal non-farm enterprises in
Pakistan. SMEDA suggests there are 3.2 million of these enterprises and the World Bank’s 2007 report on
rural growth and poverty reduction, suggests there are 3.8 million non-farm rural enterprises3. Extrapolations
from these overall estimates have been used to establish the baselines. With a few exceptions noted in this
report, the formal and registered enterprises of the two provinces were not affected by the floods.
1 MoF (2011). ‘Pakistan Flood Impact Assessment’ – Section 2, Special Section. Economic Survey of Pakistan 2010-2011. Ministry of Finance. Government of Pakistan. 2 PPAF is the apex microfinance institution that provides credit to its partner institutions for on-lending as microcredit and for supporting other activities such as community infrastructure, service delivery etc. 3 These are classified as firms engaged in any activity excluding primary agricultural production (crops, livestock and fisheries) – Pakistan Rural Investment Climate Assessment 2005

Page | 182
Estimated Damages – PKR 6,840 million (US$ 78.62 million)
Although final estimates of the scale of the damage especially to the real sector are not yet available, it is quite
evident that the floods have inflicted heavy losses to the infrastructure, property and standing crops, thereby
directly affecting the inhabitants, farmers and workers alike. For the purpose of this report, losses to the sales
revenues of the damaged enterprises and damages to the assets have been calculated with an assumption that
the completely destroyed units will not be able to commence operations for at least a year, whereas the
partially damaged would have started operations in a week’s time. The detailed calculations follow in the table
below.
The estimated number of non-farm rural enterprises that were directly affected in Sindh and Balochistan by
the 2011 floods is around 200,000 and 1,100 respectively. We estimate 10% of these enterprises were
destroyed, further we estimate 80% were in the services sector and 20% in manufacturing. For calculating the
impact on the sales revenues, we used the figure of PKR 180,000 for annual sales, as quoted in the 2007
Agricultural Growth and Poverty Reduction Report of the World Bank. The involvement of these
enterprises, especially in the affected districts of Sindh was in agro-based industry including backward and
forward linkages with manufacturing plants of fertilizer, apparel, cotton ginning, rice and sugar mills, and also
through, localized food processing e.g. bakeries, small-scale fabrication e.g. furniture and a wide variety of
small-scale, often curb-side services e.g. trading, transportation, and construction.
Table-Annex 11.1: Damage and Loss Figures (PKR millions)
Provinces Assets Destroyed Assets Partially Destroyed Sales Loss for Destroyed Sales Loss for Others Total
Sindh 1,440 720 3,600 720 6,480
Balochistan 80 40 200 40 360
Total 6,840
The floods will directly impact the income generating potential of the local communities, as the operations of
the affected enterprises came to a halt for few days, and there will be a general reduction in demand from the
losses of on-farm income. Whilst this impact has not been directly calculated, it is important to note that this
severely impacts the households of the daily wage earners. The earlier mentioned 2007 World Bank report on
rural growth showed that the non-farm income accounts for 32 percent of household income in rural Sindh,
and the poorest households are relatively more dependent on non-farm self-employment and wage incomes
than richer households. Hence, there will be a reduction in consumer demand due to loss of farmer and
workers’ income, thereby affecting the revenues of the trading and service sectors in particular. These follow-
on effects could easily surpass the specific losses calculated in the above table.
The Balochistan province has reported the only significant formal sector damages. These damages are in the
brick industry of Jaffarabad district. The 30 brick kilns located in the district have been affected however the
details and numbers are unavailable. It is assumed that the rain water and floods have damaged the inventory
(baked and raw bricks) of these kilns and have rendered the daily wage earners jobless for at least 2-3 days.
Each kiln has the potential to employ 100-150 workers, so the overall impact on the income of the local

communities would be significant. The district of Kalat has reported partial damages to three units of
handicrafts, carpet and apparel with a direct but temporary impact on 79 workers. The remaining three
districts affected by rains have reported no losses to the private sector. It is believed that the damages and
losses have been accounted for in the calculations enumerated above in the preceding table.
Proposed Sectoral Recovery and Reconstruction Strategies
Immediate Restoration of Economic Activities
Since the flood has hit the relatively less developed towns and districts in Sindh and Balochistan, it will be
important to provide financial assistance and handholding support to the enterprises that were completely
destroyed by the floods. This will help in the restoration of jobs in the affected areas. The provincial
governments should consult with the rural support programs and development partners including the
International Labour Organization (ILO) to initiate these schemes. An immediate step would be to introduce
a matching grants program for the affected enterprises which would support enterprises that wish to re-
establish themselves. Within such matching grants scheme, priority should be given to women-owned
enterprises, and to enterprises that only employ women workers (such as bangle manufacturing cottage
industry, selective handicrafts) and ethnic minorities. Any standard financial sector support would not be
effective as these enterprises are have limited or no access to the formal financial sector. Moreover, after two
successive floods, entrepreneurs may be very risk averse. In fact, in order to avoid the hassles, such as
cumbersome documentation and collateral involved in the formal financial sector lending procedures, the
troubled entrepreneurs and small farmers will probably resort to seeking financial assistance from the
informal money lenders. Hence grants programs should be introduced without further delays.
It is very important for the government to ensure restoration of key infrastructure including electricity, water
and gas supply and roads to these areas so that the private sector can resume its operations.
For the medium-long term support to the sector, the officials in the public sector should be provided with
adequate capacity to collect the data and maintain an up to date database on the private sector and especially,
the non-farm rural enterprises of the respective provinces. This can help the government and development
partners better assess the needs of the sector and extent of damages in case of a natural calamity.
Similarly, the presence of institutions such as the Small and Medium Enterprise Development Authority
(SMEDA) and SME Business Support Fund (BSF) in the two provinces should also be strengthened so that
the desired handholding support to the private sector can be extended in normal times as well.
Recovery and Reconstruction Needs
To ensure that viable enterprises are restored, it is estimated that a matching grant scheme of approximately
PKR 870 million (US$ 10 million) would suffice. Of this amount, it is recommended that approximately 20%
is routed through an agency like SMEDA, which would target the small number of larger enterprises affected,
and the remainder (80%) through the PPAF which would target micro and very small enterprises where the
bulk of the damage occurred.
Page | 183

Page | 184
11I. Financial Sector
Background
The impact of the floods on the financial sector was greater compared to the private sector. The financial
sector was affected by the 2011 floods in three main ways: (i) direct losses (damaged crops and enterprises)
from the floods in the agriculture and private sector, (ii) general reduction in demand which affects business
viability and ability to make interest and principal repayments, and (iii) impact on the insurance sector. The
figure below shows how the floods affect the credit risk of the banking system due to loss of life and
property, slowdown in economic activity, and also by damaging the collateral received by the banks against
the credit. The financial sector, in turn, consists of a mix of large commercial banks, some specialized banks
which tend to be public sector owned, microfinance institutions and insurance companies.
The 2010 Floods had a major impact on the financial sector. As a result of 2010 floods, areas across the
country with higher indices of poverty were inundated, thereby crippling life and reducing economic activities
of the already marginalized population to a minimum. The 2010 Floods DNA anticipated that in addition to
the physical damages to 86 bank branches in the affected areas, the banking sector NPLs were expected to
increase from PKR 24.6 billion (US$ 282.75 million) to PKR 52 billion (US$ 597.7 million). The estimated
NPLs in the microfinance sector were PKR 1.85 billion (US$ 21.26 million) as agriculture, housing,
infrastructure and MSMEs took the worst hit.
Figure-Annex 11.1: Floods and NPLs
2010 Rehabilitation Efforts for the Financial Sector
There have been some efforts to rescue the financial sector from the situation created due to floods of year
2010. In anticipation of the NPLs rising around PKR 52 billion (US$ 597.7 million), the SBP, launched a
PKR 10 billion (US$ 114.94 million) concessional financing scheme in Nov 2010, for flood affected SMEs
and agricultural sector, and allowed banks/DFIs rescheduling of loans in the flood affected areas. The
Floods Loss of Property
Economic Downturn in Affected
Declined BusinessPerformance and
Household Income
Damage to Collateral
Increase in LossGiven Default
Higher DefaultRates
Floods
Source: Adapted from The Shirouka Bank, LtdRisk Management Deptt.
Source: SBP’s FSR (December 2011). Page 33
Floods and NPLs

affected areas, identified by the NDMA and, under the relief package, banks could only defer loan payment
for a maximum of one and a half year1. There was very little uptake of the package and the banking sector
could not really benefit from the scheme due to the associated mark up and other terms and conditions.
Baseline Data
For the purpose of 2011 DNA, the data for the expected increases in NPLs was gathered from the central
bank (SBP) and is representative of the commercial, specialized and Islamic banks. The estimates for the
NPLs in the MF sector, and losses to the insurance sector are also included in the overall assessment of the
financial industry.
Floods Damage Overview
Estimated Damages – PKR 20.414 billion (US$ 234.64 million)
The agriculture sector in the affected areas, constitutes about 71 percent of loans by volume and 26 percent
by amount. A detailed breakup of the affected loans by type is given in the figure below. The agriculture
credit was extended to almost all the affected districts in Sindh, and significant NPLs have been reported by
one specialized bank for the zones of Mirpur Khas (US$ 56 million), Sukkur (US$ 44.5 million), Nawabshah
(US$ 34 million) and Hyderabad (US$ 28 million). The SBP suspects that since the floods have rendered
heavy losses to crops, property and businesses in Sindh, hence a number of additional borrowers are likely to
default on their commitments. It is likely, that the NPLs for the province will exceed PKR 17 billion (US$
195.40 million) which is more than twice the pre-flood NPLs. In short, an increase of about PKR 12.9 billion
(US$ 148.27 million) in new NPLs is likely2. There have been no reports of damages to the Balochistan
lending portfolios of the financial sectors. The penetration of the financial sector in the area is the lowest of
all provinces, and there are very few Microfinance Providers (MFPs) operating in Balochistan, who may
report NPLs later in the year.
Figure-Annex 11.2: Loans by Type in Affected Districts
Source: SBP’s FSR (December 2011). Page 33
1 2010. ‘Flood-hit areas: SBP launches Rs 10 billion plan’. Nov 3, 2010. Website of Pakistan Microfinance Network visited on Dec 27, 2011 at www.microfinanceconnect.info 2 SBP (2011). Impact of Recent Floods on NPLs. Financial Stability Review – First Half 2011. Box 2.1 Page 33-34. Downloaded from www.sbp.gov.pk on Dec 20, 2011.
Page | 185
Loans by Type of in Affected Areas-Sep 2011 (percent)
Agriculture SME Housing Corporate Consumer Other
Volume
Amount1.4
(Housing)
0.2 (Corporate)

The 2011 Financial Stability Review (FSR) of the SBP mentions that the banks will be able to recover around
PKR 4.7 billion (US$ 54 million) from insurance companies against damage to collateral, however, the new
NPLs will still infect the balance sheets of the banks. For the agricultural credit, banks will recover around
PKR 4.1 billion (US $ 46.5 million), which is almost half of the additional NPLs through the insurance
proceeds.
The projected amount of flood related incremental NPLs is substantial. For the province of Sindh, the
estimate is one-third of the net profit generated by the entire banking sector during the first half of FY11 or
about 9 percent of existing net NPLs.
Of the US$ 234.5 million, the share of the Microfinance Providers (MFPs) through NPLs in Sindh is
estimated at PKR 3,011 million (US$ 34.6 million)1. Around 159 branches of the MFPs in the affected areas
have also reported physical damages to their premises.
Although, the penetration of insurance products and density in the affected areas is quite low, eleven
insurance companies have reported losses to the tune of PKR 403 million (US$ 4.63 million), including 367
claims against fire breakouts, and those filed by sectors, such as marine, crop and motor vehicles2. In addition
to that, a secondary impact will kick in since banks will recover PKR 8.8 billion (US$ 100 million) through the
sector against their NPLs. This is likely to mount if the textile sector, which has a higher insurance density, is
affected by the damages to the cotton crop.
Eleven bank branches and a national savings centre in districts of Badin and Mirpurkhas were physically
damaged by the rains.
Table-Annex 11.2: Damage and Loss Figures (PKR millions)
Provinces
Direct Damage3 (PKR millions)
Total (PKR millions) Public Sector Specialized Banks
and Private Commercial Banks Microfinance
Providers Insurance Sector
Sindh 17,000 3,011 403 20,414
Balochistan N/A N/A N/A N/A
Total (PKR millions) 20,414
Proposed Sectoral Recovery and Reconstruction Strategies
Although the extent of losses to the micro-finance sub-sector will not be clear until every micro-finance
institution (MFI) has assessed its clients, yet several proposals could be considered for the sector’s rescue—
for instance, interest rate subsidies, a risk-mitigation fund, an emergency liquidity facility, and access to
liquidity from the SBP. Also, demand for credit does not always rise as strongly as the MFIs expect. For
example, with the Benazir Income Support Programme (BISP) and the Watan Card acting as entry points for
1 Preliminary information reported to PMN by its members. 2 Provisional estimates submitted by the Securities and Exchange Commission of Pakistan (SECP) 3 Includes NPLs …
Page | 186

cash transfers and food, it is unlikely that clients would choose to borrow to repay later. The next two years
years are therefore crucial to test the demand for credit. MFIs may want to explore an expansion of the
services that are often most in demand immediately after a disaster, ranging from conventional savings and
and remittances to micro-insurance1.
At the community and microenterprise levels, an important area for intervention is financing of the public
private partnership (PPPs) ventures to support small projects. These could include construction of small
dams, setting up of risk mitigation funds for the cottage industries and farmers, and training of district
government officials in the areas of disaster preparedness. The model could be replicated in areas vulnerable
to natural disasters especially heavy monsoon rains and floods.
Another area for post-crisis development is housing. It should be the strategy of the provinces to build back
better. The provincial governments should also try to address the long pending issues around management of
land records and title deeds. This will then trigger a response from the financial institutions who can then
utilize their excess liquidity by extending housing finance products and services and home improvement
loans. As recommended in the 2010 Floods DNA, compiling comprehensive electronic land records and
clean titles should be a priority in the reconstruction phase.
Recovery and Reconstruction Needs
Estimated Recovery Needs (PKR 7,308 million - US$ 84 million)
The analysis shows there is a need for recapitalization in the case of the MFIs and the Specialized Agriculture
Banks. Given that MFIs have limited ability to replenish capital when there are losses such as in this case,
they need to be rescued. Similarly, in the case of specialized banks, their reserves are thin and their relatively
undiversified portfolio limits their ability to make up the losses. The replenishment requirements of the MF
sector in Sindh and Balochistan are around PKR 3,304 million (US$ 38 million). Meanwhile, the strong capital
base of the commercial banking sector apparently enables it to withstand the losses inflicted by their
additional NPLs. It is also worth noting that the final shape of the banking sector losses will become clearer
when SBP publishes its next FSR in May 2012 for the second half of year 2011. The specialized banks with
exposure to districts in Sindh and Balochistan may need immediate help as a big percentage of their portfolio
comprised agricultural loans, and their refinancing need could be as high as PKR 4 billion (US$ 46 million).
Regardless, no blanket write offs are recommended in the commercial banking and MF sectors. Such
decisions should be made at the institutional level on case to case basis. Some of the MF borrowers will make
genuine cases for loan write offs as many poor and transient poor households have lost their livelihoods and
assets. It is recommended that women borrowers of the MF products should be given special consideration
as they were already marginalized and hence more vulnerable to such shocks. No specific assistance is
recommended for the insurance sector.
1 Khan, Z (2010). ‘Consequences of the floods’. A Silent Revolution Not to Be Silenced: An Overview of the Microfinance Sector and Its Impact in Pakistan. QFinance website visited on Dec 27, 2011 at http://www.qfinance.com/financing-best-practice/a-silent-revolution-not-to-be-silenced-an-overview-of-the-microfinance-sector-and-its-impact-in-pakistan?page=5#s7
Page | 187

Annex 12: Social Protection

Page | 189
Sector Background
Pre-Flood Poverty Profile
Pre-flood poverty data based on the BISP poverty scorecard shows an average poverty score of 33.1 in Sindh
and 26.2 in Balochistan, compared to the national average of 31.7. Variations between districts within the
same province are significant: average poverty scores in Sindh range from 23.1 in Ghotki to 38.1 in
Hyderabad, and in Balochistan from 19.2 in Kalat to 27.6 in Lasbela. Comparison of flood and non-flood
districts reveals that in both Sindh and Balochistan, the flood affected districts are amongst the poorest in the
province, in particularly those that were also hit by the 2010 floods.
Figure-Annex 12.1: Distribution of Per-Adult Equivalent Expenditures, PSLM 2007-8
Detailed analysis of poverty data reveals that a significant proportion of the population in Sindh and
Balochistan (flood and non-flood districts) is concentrated around the poverty line. This implies that an
external shock such as the 2011 floods would push the vulnerable below the poverty line and the poor deeper
into poverty – the total number of people in need of social safety nets support would increase (albeit perhaps
only temporarily).
The pre-flood population profile of affected districts also reveals the following: a) average household size is
6.3 in Sindh and 7.0 in Balochistan; b) the proportion of female-headed households in Sindh is 1.9 percent
and in Balochistan 0.6 percent; c) the elderly dependent population is minimal (1.7 and 1.1 percent
respectively in Sindh and Balochistan) but the dependent population under ten years is substantial – 29.3
percent in Sindh and 32.7 percent in Balochistan; d) house ownership (a liability in disaster situations since
damage to housing entails significant reconstruction expense) is high at 85.6 percent owner occupancy in
Sindh and 86.8 percent in Balochistan; e) agriculture is the main source of employment in both provinces,
accounting for 38.5 percent of the workforce in Sindh and 45.3 percent in Balochistan; this means that flood
PovLin
e=
11
41
.48
0.0
002
.00
04
.00
06
.00
08
.00
1de
nsity
500 1000 1500 2000 2500 3000Per-adult equivalent expenditures
Pakistan Punjab Sindh KPK Balochistan
Source: 2007-2008 PSLM
All provinces

impact on employment will depend largely on damage to the agriculture sector; and f) human development
indicators are generally low, for example school attendance among 5-17 year olds is 60.2 percent in Sindh and
just 50.2 percent in Balochistan.
2010 Floods
During the 2010 floods, 20 million people across the entire length of the country were affected. There was
widespread damage to homes, infrastructure, agriculture, and so on. The 2010 Floods Damage and Needs
Assessment reported that over 2 million poor households were in immediate need of livelihood support. It
recommended provision of cash support to vulnerable populations for a period of six months to address their
short-term needs; additional measures were suggested in the medium- to longer-term.
In response to the 2010 floods, Zakat, Pakistan Bait-ul-Mal and other safety net providers distributed relief
goods to affected population, but did not expand their regular programs. Instead, the government launched
the Citizens’ Damage Compensation Programme (CDCP), more commonly known as the Watan Card
scheme. Flood affectees had to register for this card, which entitled them to a one-off cash grant of PKR
20,000 to help their rehabilitation. Targeting was based on affected communities in Punjab, Sindh and
Balochistan (at least 40 or 50 percent of a community had to be calamity-affected for the community to be
eligible), but on affected households in KP (based on the findings of a Rapid Household Survey). Registration
was carried out with support from NADRA, and was dependent on possession of Computerized National
Identity Cards (CNIC). Payment was through bank ATM machines. A total of around 1.4 million families
were helped under Phase 1 of the Watan card scheme. An evaluation of the scheme reported that people had
found the Watan card easy to use and generally had not had problems accessing payment.1 However,
effectiveness of targeting was more problematic, with exclusion rather than inclusion errors.
The PSLM 2010/11 has been completed and preliminary data is available. An indication of the impact of the
2010 floods on poverty levels can be gauged from household perceptions of change in economic situation
compared to the previous year. Aggregate data for Sindh reveals that the perceived economic situation of 47
percent of households remained the same, for 12.72 percent it improved, and for 39.44 percent it worsened;
similarly in Balochistan for 37.53 percent of households it remained the same, for 12.19 percent it improved
and for 50.52 percent it worsened. These figures indicate an increase in poverty since the 2010 floods (though
the fact that districts not affected by the 2010 floods also reported a worse economic situation suggests other
factors are at play).
The 2010 Floods DNA made a number of recommendations for short-, medium- and long-term measures to
meet the needs of the poor and vulnerable and help lift them out of poverty. While cash grants were provided
to needy families under the Watan card scheme, there has been little action on the other recommendations.
An important element of mitigating future shocks is pre-crisis planning and, specifically, having mechanisms
in place to collect updated information on the poor and vulnerable. The BISP poverty database (see below) is
a useful tool in this regard, but is not yet being utilized to its full potential. Overall, the need to institutionalize
disaster preparedness and social protection mechanisms called for in the 2010 Floods DNA, has not been
adequately addressed. Implementation of DNA recommendations needs to be improved.
1 Evaluating Implementation of Pakistan’s Citizens’ Damage Compensation Programme (Phase I) Final Report. Oxford Policy
Management, April 2011.
Page | 190

Pre-Flood Social Protection Measures
In recent years there has been growing recognition (at both federal and provincial level) of the need for
effective social protection measures, and a growing commitment to social protection. This is reflected in
policies: the National Social Protection Strategy was adopted in 2007; PRSP-II has a pillar dedicated to social
protection (‘Protecting the Poor and Vulnerable’). It is also reflected in resource allocations: the launch of BISP
(see below) led to a substantial increase in social protection spending, taking this to almost 1 percent of GDP.
The two main social safety net programs in Pakistan used to be Zakat and Pakistan Bait-ul-Maal (PBM). The
former provides support to needy Sunni Muslims, the latter to all groups. Almost two-thirds of Zakat funds go
on the Guzara allowance for poor families, the rest on education stipends, health care and marriage grants.
Individual financial assistance (for higher education, healthcare) and the Child Support Programme (education
related CCTs) account for the largest share of PBM funds. Both Zakat and PBM suffer from weaknesses in
terms of targeting, as well as level and scope of benefits.
To address these issues the government launched the Benazir Income Support Programme (BISP) in 2008.
This is a nationwide program in which beneficiaries are decided on the basis of a poverty scorecard. PKR
2,000 is provided to poor households every two months. As of June 2010 some 2.28 million beneficiaries had
been provided cash transfers under BISP. The BISP poverty scorecard has potential applications far beyond
selecting BISP beneficiaries: it can be used to identify recipients for other programs (e.g. CCTs), support
planning of development initiatives (schools, clinics, livelihood schemes, etc), and promote better targeting in
post-crisis situations. While protocols are being developed for sharing of the BISP poverty database, this has
not yet been made available for wider use. BISP itself is developing/piloting a number of poverty exit
strategies: these are linked to vocational training, micro-credit (Waseela-e-Haq) and health insurance.
Floods Damage Overview
Figures for affected populations in Sindh are based on the provincial government’s latest estimates at district
level of the percentage area affected. Given that data on specific areas damaged within districts was not
available, the populations in flood affected districts are assumed to be uniformly affected in a proportion equal
to the share of area affected in their districts. However, the same estimation process for ‘total affected
population’ cannot be utilized in the case of Balochistan due to paucity of data. Instead, the figures used for
‘total affected population’ are as reported by PDMA Balochistan.1 The number of affected households is
calculated by dividing the total affected population of the respective province by its average household size
(Balochistan = 6.8, Sindh = 6). While these figures are relevant, analysis from the social protection lens requires
disaggregation of these into the target group ‘poor and vulnerable population affected by the floods’,
hereinafter called the ‘severely affected population’.
Estimation of ‘Severely Affected Population’
The ‘severely affected population’ is calculated as follows:
1 Pg3. http://www.fao.org.pk/news/11/Floods/Statistical_Data/Flood_Situation_Update_v10_20111114.pdf
Page | 191

(i) Every household in a district with a damaged or destroyed ‘kacha ghar’ (mud house) is identified as a
severely affected household.1
(ii) In addition, district post-flood poverty rates have been projected and applied to the remaining
affected households (total affected households – no. of affected households by destroyed/damaged
kacha ghar) in a district to obtain the final range of severely affected population.2
Estimation of ‘Post-Flood Poverty Rates’
PSLM data is used to estimate the provincial post-flood poverty rates. PSLM 2010-11 is the latest in the
series, but as its micro-data has yet not been released, the analysis was based on PSLM 2007-08 and 2008-09
data (the former to impute the household consumption data, as the latter does not contain consumption
aggregates). Furthermore, given the largely agrarian employment patterns in the flood affected region,
agricultural damage data has been used to look at the impact on household consumption. Using this data, the
provincial post-flood poverty rates have been projected by assuming several damage scenarios, elaborated
below, and applying these to the households’ predicted expenditure as provided in PSLM 2008-09.
Damage Scenarios for estimating ‘Post-Flood Poverty Rates’
The consumption of all households in the flood affected districts is assumed to be affected in a proportion
equal to the share of damaged agricultural land in their respective districts. However, the impact of the
damaged agricultural land on household consumption can differ according to the income group the
household belongs to. Households have been categorized into three, not necessarily mutually exclusive,
income groups:
(i) Households owning agricultural land;
(ii) Households not owning any agricultural land; and
(iii) Households comprising of agricultural wage workers.
Each of these three categories is further classified in two specifications (Specification 1 and Specification 2),
which highlight a) who will be affected by the floods, and b) what will be subject to flood damage. The
following two specifications against each category have been considered in order to project the provincial
post-flood poverty rates (see figure below):
(i) Households owning Agricultural Land:
Specification 1: All such households will experience a reduction in consumption owing to own production.
Specification 2: All such households will experience a reduction in entire household’s consumption.
(ii) Households with no Agricultural Land:
1 The figures for damage to mud houses (katcha ghar) both in Sindh and Balochistan have been taken as reported by PDMA Sindh and Balochistan respectively. In case of district Larkana of Sindh, disaggregation in terms of ‘pakka’ and ‘katcha’ housing was unavailable, therefore, the GoSindh’s assumption has been used, i.e. 90 percent of the fully damaged or destroyed houses are ‘kacha ghar’ belonging to poor and vulnerable households. 2 With the exception of districts Jamshoro, Larkana, Mirpurkhas, Shaheed Benazirabad, and Tharparkar, where the
reported kacha ghar damage was more than the total affected households. In these cases, the district post-flood poverty rate has been applied directly to the total affected households to obtain the range of severely affected households.
Page | 192

a) All householdsb) only consumptionfrom own production
a) All householdsb) only consumptionfrom own production
Households OwningAgricultural Land
a) All householdsb) only consumptionfrom own production
a) Randomly selectedlandless householdsb) only consumptionfrom own production
Housholds with NoAgicultural Land
a) All householdb) 80% of Agriculturalwage income
a) All householdb) 80% of Agriculturalwage income
Households with agicultural wage workers
Specification 1: Randomly selected landless households will experience a reduction in consumption owing to own
production. This shall cater to the fact that not all landless households consume from own production.
Specification 2: All such households will experience a reduction in consumption owing to own production.
(i) Households with agricultural wage workers:
Specification 1 and Specification 2: All such households will experience a reduction in their consumption by 80 percent
of the agricultural wage earned, assuming that is the percentage of wage-income from agriculture used for household
consumption.
Figure-Annex 12.2: Summary of Specifications for Projections: Who will lose and what will be subject to flood damage
After simulating the above-stated specifications, the severely affected poor households who require assistance to cope
with the negative impact of the floods fall in the range of 801,897 to 851,439, representing 52-54 percent of the total
affected population. The severely affected population ranges from 786,917 to 836,311 in Sindh, which represents 50-54
percent of the total affected population. In Balochistan, the range of severely affected households stands at 14,981 to
15,127, which pertains to 53-54 percent of the total affected population. The districts having the larger share of severely
affected households, i.e. 50 percent or more, are Badin, Dadu, Khairpur, Matiari, Mirpurkhas, Sanghar, Tando Allah Yar,
Tando Muhammad Khan, and Thatta in Sindh province, and the districts Kalat, Jaffarabad, and Lasbela in Balochistan.
Specification 1
Specification 2
Table-Annex 12.1: Summary Estimates of Severely Affected Poor Households- Floods 2011
Total Affected Population
Total HH Affected
Severely Affected Households
% of Severely Affected Households
Specif. 1 Specif. 2 Specif. 1 Specif. 2
Sindh 8,216,788 1,369,465 786,917 836,311 50% 54%
Balochistan 188,736 27,755 14,981 15,127 53% 54%
Total 8,405,524 1,397,220 801,897 851,439 52% 54%
Total Affected Population
Total HH Affected
Severely Affected Households
% of Severely Affected Households
Specif. 1 Specif. 2 Specif. 1 Specif. 2
Sindh 8,216,788 1,369,465 786,917 836,311 50% 54%
Balochistan 188,736 27,755 14,981 15,127 53% 54%
Total 8,405,524 1,397,220 801,897 851,439 52% 54%
Total Affected Population
Total HH Affected
Severely Affected Households
% of Severely Affected Households
Specif. 1 Specif. 2 Specif. 1 Specif. 2
Sindh 8,216,788 1,369,465 786,917 836,311 50% 54%
Balochistan 188,736 27,755 14,981 15,127 53% 54%
Total 8,405,524 1,397,220 801,897 851,439 52% 54%
Total Affected Population
Total HH Affected
Severely Affected Households
% of Severely Affected Households
Specif. 1 Specif. 2 Specif. 1 Specif. 2
Sindh 8,216,788 1,369,465 786,917 836,311 50% 54%
Balochistan 188,736 27,755 14,981 15,127 53% 54%
Total 8,405,524 1,397,220 801,897 851,439 52% 54%
Total Affected Population
Total HH Affected
Severely Affected Households
% of Severely Affected Households
Specif. 1 Specif. 2 Specif. 1 Specif. 2
Sindh 8,216,788 1,369,465 786,917 836,311 50% 54%
Balochistan 188,736 27,755 14,981 15,127 53% 54%
Total 8,405,524 1,397,220 801,897 851,439 52% 54%
Page | 193

Page | 194

Targeting Safety Nets
In post-disaster situations it is important to, one, institutionalize mechanisms to address large-scale needs, e.g.
for food, water, shelter, and, two, be able to quickly and accurately identify those in need. Targeting requires a
dynamic approach, because while the pre-disaster poor are likely to be in even greater need following a
disaster, many of those who would previously not be considered poor or needy could be rendered so by a
disaster. Any cash transfer scheme will also be dependent on availability of data about potential beneficiaries,
i.e. on effective targeting. The BISP poverty scorecard database has potential applications both in the
immediate aftermath of a disaster to identify the poor and vulnerable, and in the longer-term for targeting of
CCT support. There is a strong commitment to share BISP data, but as yet little progress has been made on
this. It is also important to develop effective monitoring mechanisms, to provide data on support provided
and to enable evaluation of the impact of different social protection initiatives.
Estimation of Recovery and Reconstruction Needs
Given the macro-economic situation of Pakistan, where inflationary pressures have been in constant play, the
poor are being further driven down into the poverty trap. Here, the changes in prices that have led to an
increase in the food basket cost are captured through the consideration of equivalence scales.
Equivalence Scale
Due to economies of scale in consumption, the needs of a household grow but not proportionately. This can
be reflected using equivalence scales, by which each household type in the population is assigned a value in
proportion to its needs. Factors such as household size and the age of its members are commonly taken into
account to assign these values. Using a commonly used OECD1 equivalence scale, we assign 1 to the first
household member, 0.7 to each additional adult and 0.5 to each child. With an average HH size of 6.4 (for
Balochistan and Sindh), the scale comes out to be roughly 4. Taking this figure and multiplying it with the
food basket cost of PKR 1,670 per month per head [as reflected in the article 'Change in the cost of food basket
2010-11' from the annual report of Planning & Development Division Nutrition Section], the household
monthly food basket cost amounts to PKR 6,680.
Based on this, the temporary cash grant program will cost approximately PKR 34,126 million, corresponding
to US$ 392 million, as estimated in the table below.
1 OECD- Organization of Economic Cooperation and Development
Page | 195

Table-Annex 12.2: Summary Estimates of Cash Grants to Severely Affected Poor Households using
Equivalence Scales
No. of Severely Affected HHs1
Cash Grant of PKR 6,680
per month for 6 months
Cash Grants
(US$ millions)
Sindh 836,311 33,519.35 385
Balochistan 15,127 606.31 7
Total 851,439 34,126 392
Prioritized Sector Recovery Timeframe
Table-Annex 12.3: Recovery Timeframe
Activity Description Short-term 12 months
Medium- and Long-term2
Provision of Cash/In Kind (Food) Transfers for Six Months
6 months
Creation of Temporary Employment Opportunities
6 - continuous Continuous
Rebuilding Livelihoods 6 - continuous Continuous
Safety Net Coordination Continuous
1 Specification 2 figures are used to estimate the cash grant support representing the higher end of the range of severely
affected households 2 This should include activities related to medium to long term recovery, and should not overlap or duplicate activities
under the UN early recovery program. Close coordination with the respective UN agencies shall have to be maintained by the DNA sector teams in this respect.
Page | 196

Annex 13: Transport and Communications

Sector background
The 796,095-square kilometer area of Pakistan and its 190 million inhabitants1 are connected through a
transport and communications (T&C) network of 259,618 km of roads; 2 7,791 km of railways; 42 airports;
and 34,950 km of telecommunication lines and other infrastructure. The 11,800 km long national highways
and motorways network is the spine of the primary transport corridor. This is supported by the provincial
highways network of 37,400 km that fans out to the districts through 161,000 km of district roads (including
farm-to-market and access roads) in rural areas and 54,000 km of municipal roads in urban areas.
In the two flood-affected provinces, the national highway system traverses 1,975 km in Sindh and 4,630 km
in Balochistan. About 13,700 km of provincial highways and 31,900 km of district roads are in Sindh and
11,800 km of provincial highways and 20,200 km of district roads are in Balochistan.3 The railway network of
7,791 km railway lines4 and 1,100 stations serve the long-distance main NS corridor and connections to other
regions including Balochistan. Approximately 1,899 km of railway lines are in Sindh while 1,202 km in
Balochistan. Six international airports in major cities serve as hubs connecting to 19 regular and 17 feeder and
other airports. The telecommunication infrastructure consists of 3,155 exchanges; 34,950 km of optical fiber
transmission lines for the landline networks; and 25,554 transmission towers for the cellular telephone
networks.5
Floods Damage Overview
Damages and Losses
The rains and floods during August and September 2011 damaged the transport and communications (T&C)
infrastructure in the province of Sindh and Balochistan. Based on the data received on the damages in T&C
Sector, a total of 5 districts in Balochistan and 18 in Sindh have been affected by the floods, longer spell and
high intensity of rains. It affected the network of national and provincial highways, district and municipal
roads. Damages to the road infrastructure were caused by submergence, high surface runoffs and ingress of
water in roadway formation. The incremental deterioration in road asset condition as a result of floods varied
- depending on the intensity of floods/rains, topography, design standard especially of drainage, quality of
construction, remaining service life and pre-flood maintenance level of affected roads. The damage consisted
mostly of washed away or eroded shoulders, surface impairment, localized failures like rain cuts in
embankments, widening of potholes and edge breaks, and structural damages to cross drainage structures,
bridges, retaining and protection works. Like roads, floods have caused damages to railway tracks, bridges,
stations and residential buildings under the administrative control of Pakistan Railways. There were no
reports of damages by Civil Aviation Authority in the aviation sub-sector. In the communication sector,
damages were reported to the buildings, equipments and transmission network of cellular and landline
operators.
The reported damage is classified into two broad categories: completely destroyed (CD) and partially
damaged (PD). For roads and railways, the data is segregated into lengths of roads, railway lines and number
1 Projection of population by DNA Core Team based on 1981 and 1998 Census Federal Bureau of Statistics Pakistan 2 Economic Survey of Pakistan 2009-10 3 It is based on the Pakistan Transport Policy Study (JICA, 2006) and information provided by the Government agencies. 4 Year Book 2008-09 Ministry of Railways 5 As reported by the Ministry of Information Technology (MoIT) and Pakistan Telecommunication Authority (PTA).
Page | 198

Page | 199
of affected structures.1 For telecommunication infrastructure, the reported damage is more specific. Four
national highways were affected at various places2; three in Sindh and one in Balochistan. On these highways,
seven bridges were also reported to be partially damaged; all located in Sindh. About 1,955 km of provincial
highways in Sindh, representing 15% of the provincial highway assets and 5,773 km of district roads were
affected (including municipal and urban roads). On the contrary, damages in Balochistan are lesser and
comprising about 426 km affected sections of provincial highways and district roads (about 1% of this road
stock). A summary of direct damage to road infrastructure is given in Table 13.1.
Table-Annex 13.1: Physical Damage Details in Road Subsector
Provinces
Motorways / National
Highways (km) Provincial Highways (km) District Roads (km)
Total (km)
Completely
Destroyed
Partially
Damaged
Completely
Destroyed
Partially
Damaged
Completely
Destroyed
Partially
Damaged
Sindh 1 50 274 1,681 808 4,965 7,779
Balochistan 1 1 5 92 16 312 427
Total 2 51 279 1,773 824 5,277 8,206
Similar to the roads, the damages to railway lines involved inundation and erosion of railway track formation
including embankment and track structure. A length of 190 km railway line was damaged located in Sindh and
under the railway administrative divisions of Sukkur and Karachi. Bridges and other supporting structures
were also damaged along the railway lines involving 2 stations, 395 residential buildings and 14 bridges. In
telecommunication, major damages to the telecommunication infrastructure involved damages to 233 cellular
sites3 and 12 exchange centers of a landline operator. It includes damages to the equipment and cables due to
floodwater ponding in buildings, settlement and collapse of boundary walls, short circuits, power system
damages, outages and disruption in services and, damages to the allied residential buildings due to
accumulation of water.
The indirect losses due to damages in road sector were also calculated. It was based on an increase in the road
user cost due to incremental deterioration in the roadway roughness. Since these losses are time related, they
have been capped to three years. The indirect losses have been estimated using a phased recovery period –
10% of the facilities recovered within 12 months, 50% within 24 months, and only 30% of damages
reconstruction will continue in the third year.
1 Bridges and other small structures, such as culverts and retaining walls, are included in the damage estimates. 2 In Sindh, national highways are N-5 (Karachi-Kot Sabzal), N-55 (Kashmore-Kotri) and N-120 (Hyderabad-Mirpurkhas-Umarkot- Khokhrapar). In Balochistan, only two kilometers were affected on N-50 (Kuchlak - Qila Saifullah – Zhob). 3 Four mobile and one landline operators have reported damages to the infrastructure to the Pakistan Telecommunication Authority.
Data Verification and Validation
During the DNA 2010 Floods in Pakistan, one of the biggest constraints in data collection and physical
verification in the province of Sindh was submergence of the infrastructure, especially the road network. In
the current DNA, field surveys were possible as water has receded from the road surface. The data for
national and provincial highways in Sindh was received much earlier and therefore field coordinators were
mobilized to verify and validate the reported damages on this network1. Prior to the field visit, a consultative
session was held in Hyderabad with the officials of the Works and Services Department (W&S) Sindh to
discuss data gaps and seek clarification. The field coordinator’s verification work was supplemented by sector
specialist’s visit. A random sample of affected roads was visited in seven districts of Sindh along with the
reporting officer of the W&S responsible for filling in the DNA template. The field visit revealed that in
some cases poor condition due to deferred maintenance was also attributed to recent floods. Based on the
result of random sampling the extent, type and cost of damages were reconciled with the template data. The
difference in the results of verification and validation exceeded 15% and the corrections were applied on the
damage estimates and overall figures.
Damage Quantification
Government agencies were given templates prepared by the ADB and WB team to report damage. W&S
Department Sindh and Pakistan Railways started collecting data before the DNA’s templates were finalized
by ADB and the World Bank. This preliminary damage information was analyzed. The bulk of the data was
received during the last week of November and early December. The data is reported in two broad categories:
completely destroyed and partially damaged. Most of the damages fall in the latter category. There was
inconsistency within and across the organizations in quantifying the costs of damages which led to variation
in estimates of road damages. It was harmonized based on the physical damage, class of road, type of surface
and carriageway width. The revised costing was used in the analysis and the damage cost was depreciated to
arrive at final damage figures.2
The total damage including direct damage and indirect losses is summarized in Table 13.2.
1 The rest of the data on roads continued to receive in the last week of November till first week of December. Field visit was not possible where data was received with delays or in inappropriate form. 2 Value of damages was calculated based on the depreciated price of replacement of damaged asset. Depreciation approach to valuation was used which is based on the assumption that depreciation of the network equals the sum of the depreciation of all of the asset components comprising the road network. Depreciated cost is calculated linearly after deducting to represent the remaining life of the asset (service level). The design life of road component was grouped by i) pavement, and ii) structures and bridges.
Page | 200

Page | 201
Table-Annex 13.2: Damage and Loss Figures (PKR millions)
Provinces Direct Damages Indirect Losses Total
Roads
Sindh 14,850 9,974 24,824
Balochistan 1,095 108 1,203
Subtotal 15,945 10,082 26,027
Railways
Sindh 277 277
Balochistan - -
Subtotal 277 - 277
Telecommunications 165 - 165
Total 16,386 10,082 26,468
$188 $116 $304
Proposed Sectoral Recovery and Reconstruction Strategy
The recovery strategy varies across each transport and communications sector based on the nature of the
responsible agency and the importance of the infrastructure. For telecommunications, the private sector
operators have mobilized and carried out repairs, and restored telecom services. For roads, diversion routes
were created and services restored. Emergency repairs on railway lines have been taken. As a short term
measure, the National Highways Authority has tasked the regional maintenance units to undertake the
emergent works through pre-qualified contractors and using proceeds of the annual road maintenance funds.
It is proposed that NHA undertakes detail assessment of the damages, as it carried out after the floods of
2010, followed by field surveys, engineering design, and bid documents for packaging, procuring and
awarding the reconstruction contracts well within the first year after disaster.
The provincial and district road agencies in Sindh and Balochistan should a) complete the condition surveys
for detailed assessment of the damage, b) identify and prioritize minor damages that requires repairs to
restore the infrastructure and facilitate vehicular flow, c) prepare project processing documents (PC-1) and
start packaging works in small contracts. For larger and complex works, the preliminary surveys, engineering
designs and estimation of major damages should be undertaken as a preparatory work till the reconstruction
project and financing is committed. Where required, engage consulting firms to augment the departmental
design and implementation capacity. The district and road agencies’ respective regional offices are encouraged
to undertake both the recovery and reconstruction works, through small contracts engaging local

construction firms and labor. Local inter- and intra-village roads and unpaved tracks could be reconstructed
through a participatory mechanism using community-based organizations under the supervision and technical
guidance of local NGOs. Workfare schemes could also be used to generate employment in the recovery phase.
The reconstruction activity offers opportunities to revive the economy and provide livelihood opportunities
for the people that are affected by the floods.
Needs Estimation of Recovery and Reconstruction Needs
The estimates for rehabilitation and reconstruction are based on the current costs for each element of
transport infrastructure. For roads, unit rates were harmonized to remove inconsistencies.1 The other costs
that have been reflected in Table 13.3 below include cost for complying with i) social safeguards during
implementation, ii) engineering design, construction supervision, project management and capacity
development of the government agencies, and iii) escalation in prices2 during the reconstruction period (taken
as three years).
Table-Annex 13.3: Recovery and Reconstruction Needs Assessment Summary (PKR million)
Provinces Reconstruction and Rehabilitation
/ Repair Costs Social
Safeguards Design, Supervision, Project
Management Escalation in
Prices
Total (PKR
millions)
Roads
Sindh 25,641 256 2,051 3,077 31,025
Balochistan 1,873 19 150 225 2,267
Subtotal 27,514 275 2,201 3,302 33,292
Railways
Sindh 395 32 427
Balochistan
Subtotal 395 32 427
Total 27,909* 275 2,233 3,302 33,719
$321 $3 $26 $38 $388
* It does not include PKR 183 million (US$ 2 million) required in the telecommunication sector.
1 The rates were taken from the National Highway Authority’s Composite Schedule of Rates 2009 with a premium of 30 percent. The premium was calculated using the engineers estimate/tender cost of various projects and updating it to the current value using the CPI/WPI/SPI index published by Government of Pakistan. 2 Average of Planning Commission’s suggested escalation for three years.
Page | 202

reconstruction may be based on the criteria to i) reconstruct the four national highways, provincial highways
connecting major provincial cities to the national highway network, ii) followed by district roads connecting
district capitals or major population centers to the provincial highways, and iii) district roads providing access
to areas of agricultural production or key industries and municipal roads connecting to major provincial and
district roads. The Table 13.4 provides sector recovery framework and time frame.
Table Annex 13.4: Prioritized Sector Recovery Framework/Timeframe (PKR million)
Activity Short-term (12 months) Medium- and long-term
Emergency Works (for restoration of services and
infrastructure)
Railways: 395
Roads: 2,752
Total: 3,147
Rehabilitation and Reconstruction
Roads: 24,762
Studies, Surveys, Design, Supervision 401 1,541
Social Safeguard Measures 110 165
Administration Cost 85 206
Escalation during Implementation
3,302
TOTAL 3,743* 29,976
$43 $345 m
* It does not include PKR 183 million (US$ 2 million) required in the telecommunication sector.
Page | 203
Annex 14: Water and Sanitation (WATSAN)

Sector Background
A signatory to the MDGs declaration, Pakistan is committed to extending improved sanitation to 67% of its
population by 2015. The PSLM Survey 2010 shows that 78% households had access to flush or non-flush
latrines in Pakistan in 2008-9 compared to 57% households in 2001- Further, the number of households
without any toilet facility decreased from 43% to 22% during this period. This is significant progress in
quantitative terms. However, the qualitative aspects have been quite weak. The fact that 75% households use
latrines without drainage facility or with open drains point toward the fact that many latrines are acting as
transfer stations to shift waste from within the household to outside the households. This raises an urgency to
focus on the quality of services.
Access to drinking water which - an essential for life – is quite impressive being 92% overall in Pakistan. This
is 95% in urban areas and 91% in rural areas. However, a number of gastro-related episodes are killing
thousands of children and elderly each year. The main source of drinking water in Pakistan is tap water. Hand
pumps and motor pumps together provide 54 percent of households with drinking water in 2008-09, as
compared to 51 percent in 2006-07.
While increasing access to an improved sanitation facility is paramount, there are other dimensions to
sanitation which impact on health outcomes. Domestic waste containing both household effluent and human
waste may be discharged to a sewer system, a natural drain, a water body, a nearby field or an internal septic
tank. There is little separation of industrial waste from municipal waste in Pakistan, with both flowing
directly to open drains and then open water bodies. Floods provide us an opportunity to plan in a manner
that infrastructure is not only sustainable but also a complete solution. The Floods in Sindh and Balochistan
reminds us of the absolute vacuum in solid waste management. Only Sukkur and Tando Mohammad Khan
reported on losses to solid waste.
The table below presents the water and sanitation situation in Sindh and Balochistan:
Table-Annex 14.1: Key Indicators for Water Supply and Sanitation
Province
Main Source of Drinking Water Type of Toilets in Households
Tap Water Hand Pump Motor Pump Dug Well Flush Non-Flush No Toilet
Urban Rural Urban Rural Urban Rural Urban Rural Urban Rural Urban Rural Urban Rural
Sindh 74 11 9 65 12 6 0 9 95 25 4 55 1 20
Balochistan 85 25 3 4 3 1 2 21 75 10 21 66 5 24
Reference: Pakistan Social and Living Standards Measurement Survey (PSLM), 2008-2009
Service delivery institutions face a shortage of skilled personnel, and even where skilled staff is available, the
overall institutional space for a number of reasons inhibits their capacities. At decentralized levels,
Page | 205
Sector Background
A signatory to the MDGs declaration, Pakistan is committed to extending improved sanitation to 67% of its
population by 2015. The PSLM Survey 2010 shows that 78% households had access to flush or non-flush
latrines in Pakistan in 2008-9 compared to 57% households in 2001- Further, the number of households
without any toilet facility decreased from 43% to 22% during this period. This is significant progress in
quantitative terms. However, the qualitative aspects have been quite weak. The fact that 75% households use
latrines without drainage facility or with open drains point toward the fact that many latrines are acting as
transfer stations to shift waste from within the household to outside the households. This raises an urgency to
focus on the quality of services.
Access to drinking water which - an essential for life – is quite impressive being 92% overall in Pakistan. This
is 95% in urban areas and 91% in rural areas. However, a number of gastro-related episodes are killing
thousands of children and elderly each year. The main source of drinking water in Pakistan is tap water. Hand
pumps and motor pumps together provide 54 percent of households with drinking water in 2008-09, as
compared to 51 percent in 2006-07.
While increasing access to an improved sanitation facility is paramount, there are other dimensions to
sanitation which impact on health outcomes. Domestic waste containing both household effluent and human
waste may be discharged to a sewer system, a natural drain, a water body, a nearby field or an internal septic
tank. There is little separation of industrial waste from municipal waste in Pakistan, with both flowing
directly to open drains and then open water bodies. Floods provide us an opportunity to plan in a manner
that infrastructure is not only sustainable but also a complete solution. The Floods in Sindh and Balochistan
reminds us of the absolute vacuum in solid waste management. Only Sukkur and Tando Mohammad Khan
reported on losses to solid waste.
The table below presents the water and sanitation situation in Sindh and Balochistan:
Table-Annex 14.1: Key Indicators for Water Supply and Sanitation
Province
Main Source of Drinking Water Type of Toilets in Households
Tap Water Hand Pump Motor Pump Dug Well Flush Non-Flush No Toilet
Urban Rural Urban Rural Urban Rural Urban Rural Urban Rural Urban Rural Urban Rural
Sindh 74 11 9 65 12 6 0 9 95 25 4 55 1 20
Balochistan 85 25 3 4 3 1 2 21 75 10 21 66 5 24
Reference: Pakistan Social and Living Standards Measurement Survey (PSLM), 2008-2009
Service delivery institutions face a shortage of skilled personnel, and even where skilled staff is available, the
overall institutional space for a number of reasons inhibits their capacities. At decentralized levels,
Province
Main Source of Drinking Water Type of Toilets in Households
Tap Water Hand Pump Motor Pump Dug Well Flush Non-Flush No Toilet
Urban Rural Urban Rural Urban Rural Urban Rural Urban Rural Urban Rural Urban Rural
Sindh 74 11 9 65 12 6 0 9 95 25 4 55 1 20
Balochistan 85 25 3 4 3 1 2 21 75 10 21 66 5 24

capacity-constraint in the public sector. In addition, the institutions face lack of efficient administrative
systems which enable delivery of services and integration of other vital forces such as private sector and
NGOs.
Floods Damage Overview
The government of Sindh had indicated seventeen (17) districts as flood affected where damages needed to
be assessed. However, flood damage data was forthcoming only from thirteen (13) districts. From the
Balochistan province flood damages were reported from Kalat, Lasbela, Nasirabad and Jaffarabad districts,
and that too for the water supply sector only. The most obvious result from the data compilation is the
finding regarding the relative damage distribution amongst the districts and talukas. In the Sindh province
that has been mainly affected in the 2011 floods the Shaheed Benazirabad (Nawabshah) district by far shows
the most extensive damages both in the public water supply and sanitation sectors. Badin, Sanghar and
Mirpurkhas districts also show significant damages to the water supply related infrastructure and facilities
(Table 14.2). More damages are reported in the sanitation sector as compared to the water supply sector.
Shaheed Benazirabad (Nawabshah) district is the worst hit accounting for 42% of the overall damage cost in
the public sanitation sector.
Nature and extent of damage
Total damages for water supply and sanitation for both direct and indirect damages are PKR 1,160 million
and PKR 43.6 million in Sindh and Balochistan, respectively. Direct damages in Sindh are PKR 456.6 million
in 378 reported schemes in the flood affected districts. These damages include PKR 147.6 million for public
water supply and PKR 253 million for public sanitation. An amount of Rs 56 million for community
infrastructure damage is also included. In Balochistan, WATSAN damages have been assessed at PKR 46.6
million, in a total of 80 schemes.
The data indicates that the most expensive damages in terms of needs are accounted by fresh water
sedimentation and collection tanks on the water supply side and paved streets and street drains on the
sanitation side. Only Tando Mohammad Khan has reported about losses regarding solid waste management.
No data on damages to privately created and owned assets (community infrastructure) was forthcoming from
the government. As such reliance had to be made on data provided by locally mobilized NGO’s (Table 14.2).
There may be some issues and concerns regarding the reliability and authenticity of the data and field
validation of these reported damages which was not possible.
Page | 206
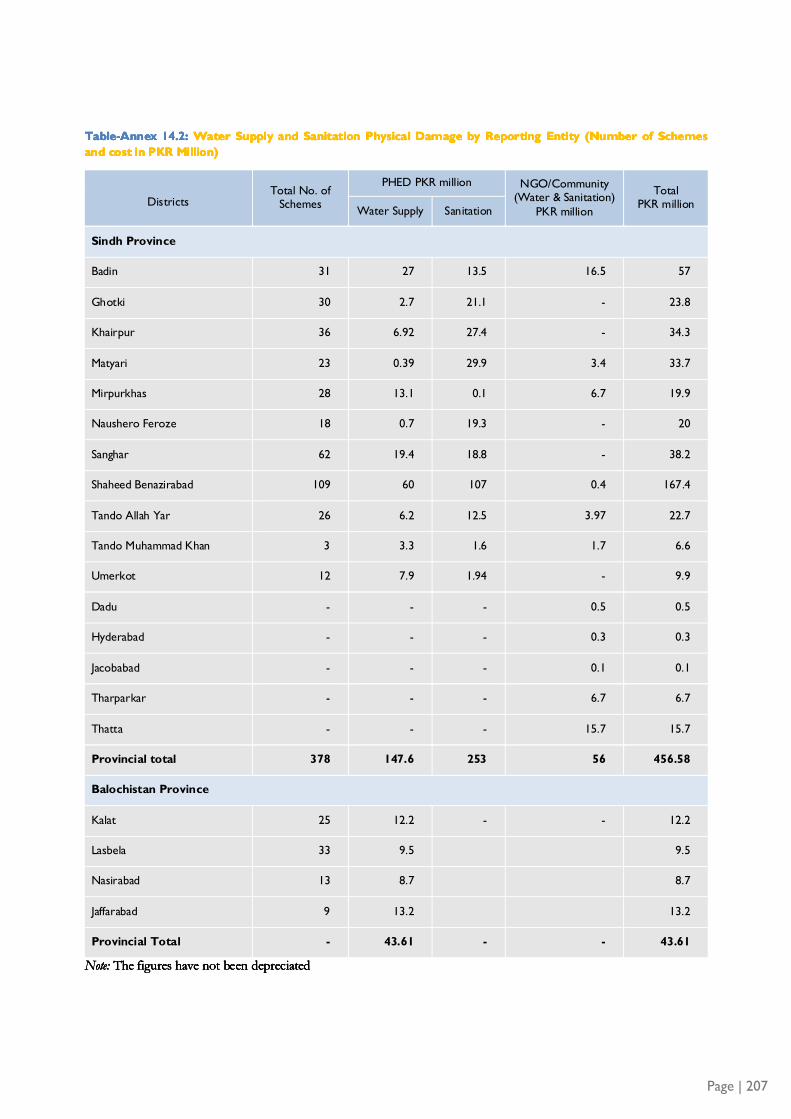
Table-Annex 14.2: Water Supply and Sanitation Physical Damage by Reporting Entity (Number of Schemes
and cost in PKR Million)
Districts Total No. of
Schemes
PHED PKR million NGO/Community (Water & Sanitation)
PKR million
Total PKR million
Water Supply Sanitation
Sindh Province
Badin 31 27 13.5 16.5 57
Ghotki 30 2.7 21.1 - 23.8
Khairpur 36 6.92 27.4 - 34.3
Matyari 23 0.39 29.9 3.4 33.7
Mirpurkhas 28 13.1 0.1 6.7 19.9
Naushero Feroze 18 0.7 19.3 - 20
Sanghar 62 19.4 18.8 - 38.2
Shaheed Benazirabad 109 60 107 0.4 167.4
Tando Allah Yar 26 6.2 12.5 3.97 22.7
Tando Muhammad Khan 3 3.3 1.6 1.7 6.6
Umerkot 12 7.9 1.94 - 9.9
Dadu - - - 0.5 0.5
Hyderabad - - - 0.3 0.3
Jacobabad - - - 0.1 0.1
Tharparkar - - - 6.7 6.7
Thatta - - - 15.7 15.7
Provincial total 378 147.6 253 56 456.58
Balochistan Province
Kalat 25 12.2 - - 12.2
Lasbela 33 9.5 9.5
Nasirabad 13 8.7 8.7
Jaffarabad 9 13.2 13.2
Provincial Total - 43.61 - - 43.61
Note: The figures have not been depreciated
Page | 207
Page | 208
Indirect Losses
Indirect losses for Sindh have been calculated to at Rs 703.6 million. No such loss is calculated for
Balochistan due to lack of data. Indirect losses which derives from higher expenditures related to (i) supplying
potable water (tankers, cost of hand-pumps, water tanks, purification and disinfection processes), and (ii)
cleaning, wells, sewers and pipes; and for the loss of revenue from interrupted water supply services.
Damage Quantification Process
The assessment relied on government reports of damage for public sector infrastructure, provided by the
Public Health Engineering Department (PHED), and to a lesser extent from local NGOs (community
infrastructure data). The data quality and authenticity varied, depending on access to damage sites and on the
organizational capacity of the provincial government. The collected data in cases was probably more of an
estimate where apparently no physical inspection was possible or time available to do so was insufficient.
Where validation has been possible in Sindh, validators found damages overstated.
Damage has been quantified on the basis of an assessment by the Government of Sindh, where they
identified the schemes in each district/tehsil and the extent of damage to each scheme. The actual cost was
calculated based on the actual cost of construction. Most of the schemes are between 10-20 years of age;
however a depreciation factor has not been applied because inflationary appreciation of cost in relation to
current market value is much higher.
As soon as detail damage data at scheme level was obtained, the Team began a validation process that
consisted of site visits by team members to review the estimates, document damage and make some
assessment on building back better requirements. The validators were accompanied by PHED and/or TMA
staff familiar with the schemes. Based on this information, the validators engaged with the Government
representative on areas of concern. The data initially provided by PHED was completely revised on the basis
of the findings of the validation visits.
Box 1: Challenges to Data Collection and Validation
· Data collection templates not strictly followed by all government agencies, nor well understood; data
quality varies
· New schemes added by government agencies; some overestimation indicated
· Lack of asset inventories; no baseline for infrastructure or service levels
· Under-reporting of damage to non-functional schemes possibly understates damage to public assets
· No centralized source for information on community infrastructure

Page | 209
A total need of PKR 1,378.6 million has been assessed for the losses in Sindh. A need could not be assessed
for Balochistan because of lack of data from the government, however, it is estimated that it would be much
more than the damage i.e. PKR 43.61 million. The need is based on construction of similar facilities that have
been damaged. PKR 610.53 million have been assessed for water supply and PKR 768.08 million for
sanitation. Completely destroyed public infrastructure requirements for WATSAN stand at PKR 514.14
million and partially destroyed public infrastructure is at PKR 864.47 million.
No need has been assessed for the community infrastructure damage. It is also worth noting that sanitation
needs are more than that of water supply possibly due to costly drainage schemes. There must also be
household needs to construct toilets which are not part of this calculation. Table 14.3 depicts the district-wise
needs for both, completely destroyed and partially destroyed schemes for both water supply and sanitation.
This calculation is based on government’s estimates conducted through district offices of PHED. Districts
which show a need of ‘zero’ rupees are where either there is no need for infrastructure due to damages of the
rains or insufficient data existed.
Table-Annex 14.3: District-wise Needs Assessment for Public Water Supply and Sanitation
District Public Water Supply
Facilities Public Sanitation Total
Damage
Destroyed - PKR Million Destroyed - PKR Million PKR million
Completely Partially Completely Partially
Badin 24.04 32.26 8.00 12.88 77.18
Dadu 0.00 0.00 0.00 0.00 0.00
Ghotki 0.00 0.00 4.07 10.78 14.85
Hyderabad 0.00 0.00 0.00 0.00 0.00
Jamshoro 0.00 0.00 0.00 0.00 0.00
Khairpur 15.27 10.43 2.84 99.60 128.13
Larkana 0.00 0.00 0.00 0.00 0.00
Matiari 1.05 2.11 1.13 75.35 79.64
Mirpurkhas 157.26 27.74 6.50 86.10 277.60
Naushahro Feroze 2.40 3.60 0.00 46.16 52.16
Nawabshah (Shaheed Benazirabad) 4.30 15.36 15.50 100.86 136.02
Sanghar 77.49 25.03 19.70 32.63 154.84
Tando Allahyar 14.50 0.72 88.64 1.00 104.86
Recovery and Reconstruction Need Assessment & Build Back Smarter Factor:
Need Assessment

Tharparkar (tehsils) 12.92 17.00 15.54 11.96 57.42
Thatta 0.00 0.00 0.00 0.00 0.00
Umerkot 0.00 157.30 0.00 95.63 252.93
Total All Districts 319.01 291.52 195.13 572.95
Total (WS and Sanitation): 610.53 768.08 1,378.61
Build Back Smarter
Considering the nature of damage due to excessive rainfall, the Build Back Smarter Factor (BBS) has been
evaluated for two parameters i.e. (i) technical upgrade factor and (ii) disaster mitigation factor. A 15%
increment has been assumed for each of the proposed factors in all districts of Sindh and Balochistan. In
addition, several other awareness, hygiene and disaster related factors have been costed given in the table
below:
Table-Annex 14.4: Incremental Factor for BBS
Factors Sindh Balochistan
WATSAN infrastructure/system specific review PKR 3.6 million PKR 300,000
Tariff awareness + willingness to pay PKR 42.5 million PKR 2.5 million
Establish information and policy framework PKR 16 million PKR 4 million
Emergency response plan preparation and training PKR 17 million PKR 5 million
Total PKR 79.1 million PKR 11.8 million
Disaster-Mitigation Factor 15% 15%
Technical Upgrade Factor 15% 15%
The Reconstruction Needs inclusive of BBS in Sindh and Balochistan are PKR 1,900.2 million, which
includes PKR 1,831.7 and PKR 68.5 million for each, respectively. In Sindh, it has been calculated to be PKR
833.24 million and PKR 998.5 million for water supply and sanitation, respectively. The Reconstruction
Needs inclusive of BBS for Balochistan are only for water supply amounting to PKR 68.5 million.
Existing sectoral policies/strategies and priorities
Amongst the key areas that the national and provincial governments have focused on are the development
and roll out of a clearly articulated policy framework, sector financing and understanding institutional
Page | 210
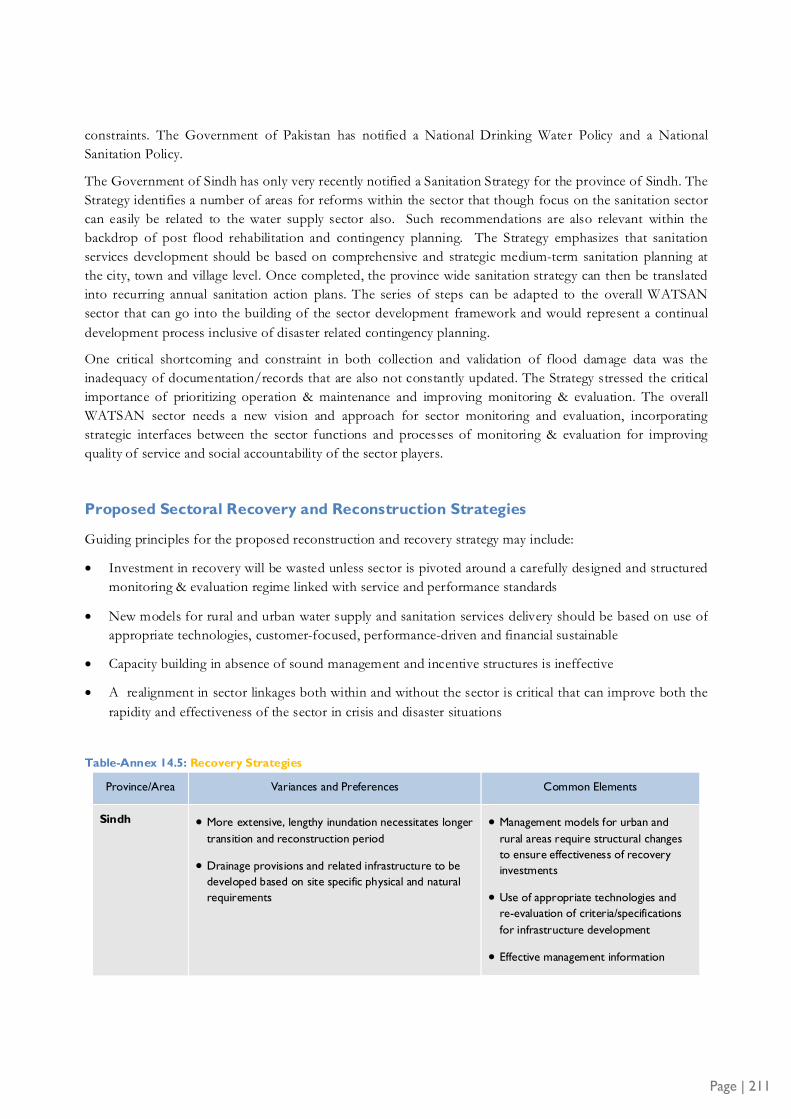
constraints. The Government of Pakistan has notified a National Drinking Water Policy and a National
Sanitation Policy.
The Government of Sindh has only very recently notified a Sanitation Strategy for the province of Sindh. The
Strategy identifies a number of areas for reforms within the sector that though focus on the sanitation sector
can easily be related to the water supply sector also. Such recommendations are also relevant within the
backdrop of post flood rehabilitation and contingency planning. The Strategy emphasizes that sanitation
services development should be based on comprehensive and strategic medium-term sanitation planning at
the city, town and village level. Once completed, the province wide sanitation strategy can then be translated
into recurring annual sanitation action plans. The series of steps can be adapted to the overall WATSAN
sector that can go into the building of the sector development framework and would represent a continual
development process inclusive of disaster related contingency planning.
One critical shortcoming and constraint in both collection and validation of flood damage data was the
inadequacy of documentation/records that are also not constantly updated. The Strategy stressed the critical
importance of prioritizing operation & maintenance and improving monitoring & evaluation. The overall
WATSAN sector needs a new vision and approach for sector monitoring and evaluation, incorporating
strategic interfaces between the sector functions and processes of monitoring & evaluation for improving
quality of service and social accountability of the sector players.
Proposed Sectoral Recovery and Reconstruction Strategies
Guiding principles for the proposed reconstruction and recovery strategy may include:
· Investment in recovery will be wasted unless sector is pivoted around a carefully designed and structured
monitoring & evaluation regime linked with service and performance standards
· New models for rural and urban water supply and sanitation services delivery should be based on use of
appropriate technologies, customer-focused, performance-driven and financial sustainable
· Capacity building in absence of sound management and incentive structures is ineffective
· A realignment in sector linkages both within and without the sector is critical that can improve both the
rapidity and effectiveness of the sector in crisis and disaster situations
Table-Annex 14.5: Recovery Strategies
Province/Area Variances and Preferences Common Elements
Sindh · More extensive, lengthy inundation necessitates longer
transition and reconstruction period
· Drainage provisions and related infrastructure to be
developed based on site specific physical and natural
requirements
· Management models for urban and
rural areas require structural changes
to ensure effectiveness of recovery
investments
· Use of appropriate technologies and
re-evaluation of criteria/specifications
for infrastructure development
· Effective management information
Page | 211

Balochistan · Modular designs if possible to simplify process,
accelerate implementation, reduce costs
· Rural water supply storage tanks at ground level for
earthquake resilience
· Earthquake resilience a priority
· systems, including accounting,
inventory and customer complaints
systems needed linked with a
comprehensive monitoring &
evaluation regime
· Incentivize service providers to
monitor water quality, inventory and
maintain assets, record and respond to
customer needs
· Incorporate disaster planning within
the planning processes
· Harness economies of scale; tap private
sector expertise and resources
The recovery process should begin with clear understanding of the baseline for pre-flood services and
WATSAN assets, followed by scheme-specific and community system-specific analysis of damages, with
consideration for building back better and smarter –with view to ensuring that reconstruction enhances
overall system performance. This would require a thorough process of inventory development that should
then become part and parcel of the sector responsibilities and functions – data updating and record keeping.
Options for reconstruction should only be enforced where the damaged facility may be redundant. Immediate
actions that may also assist in identifying area/scheme related repair/reconstruction needs may include
system de-clogging/cleaning, priority repairs and review of the models for managing capital investments and
service delivery in rural and in urban areas. The program for repair and reconstruction should be coupled
with a rethink on selection of building materials/technologies, models for system management (community
ownership, government-community partnership etc.). Specific drainage provisions and flood management
plans would have to be considered to avoid extended inundation in the future. However, for such a process
to find sustainability and effectiveness it has to be linked with much enhanced investment in research and
development and staff training and capacity building.
As mentioned earlier also, in the post flood scenario, scheme selection criteria, including design standards and
specifications, flexibility of expansion, and quality and level of service, location of schemes in flood-prone
areas and their respective protection are critical areas requiring improvement. Standard operating procedures
(SOPs) in such emergencies should be put in place for WATSAN service providers, LGD, and PHED. In
addition, relevant line departments and other agencies/communities should be made a part of the emergency
preparedness programs.
Page | 212

Page | 213
Table-Annex 14.6: Prioritized Sector Recovery Framework/Timeframe
but the entire province
Medium & Long Term
(12 to 24 months)
Emergency response plan/ risk reduction plans preparation and training and capacity building of relevant sector personal
Study to evaluate and asses the building/procurement specifications, selection criteria for technology options that focus on use of appropriate technologies/site selection of key infrastructure and facilities and materials with relevance to sustainability of use in disaster situations such as floods
Study on WATSAN services management and alternative models for organizing service delivery, particularly in rural areas that pivots the sector around carefully designed and structured monitoring & evaluation regime linked with service and performance standards
Timeframe Activity
Short Term (12 months)
System cleaning, de-clogging, disinfection
Priority water supply and sanitation repair and reconstruction
Study to develop ‘Sector Baseline’ that does not only provides coverage to the flood affected areas

Annex 15: Irrigation and Flood Management
Page | 215
Sector Background
Sindh’s agriculture accounts for 17.4 percent of the provincial GDP and 50 percent of the employment. The
Sindh irrigation system consists of Guddu, Sukkur and Kotri Barrages on the Indus River. These barrages
divert water into fifteen canals— four at Guddu, seven at Sukkur and four at Kotri Barrage commanding 2.5
million ha. A total of 2,240 km of drains and 5,835 tube wells complement the irrigation system. In Balochistan
only about 767,120 ha land in 3 out of the 26 districts is irrigated by Indus Basin Irrigation System. The main
canals are the Pat Feeder, Kirther and Uch canals. In remaining parts of the province there are many small
basins where spate irrigation, karezes, small irrigation schemes, small dams and tube wells are the main sources
of irrigation.
Floods Damage Overview
Unprecedented rainfall in two major spells during August and September 2011, caused wide spread damages in
most parts of Sindh province and some of Balochistan. Twenty one of 30 districts in Sindh, and 14 of 24
districts in Balochistan were affected due to extremely high intensity and long duration rains. Vast portion of
agricultural land remained inundated for more than two months thus causing huge agriculture and crop losses
alongside damages to irrigation, drainage and flood protection infrastructure. Mostly banks canals and drains
got eroded. Initially drains overflowed due to excessive water and subsequently ran in fully submerged
conditions. Residential and office buildings, already prone to collapse due to long deferred maintenance
worsened, actually collapsed. The damages reported are actually reconstruction cost worked out by using
prevailing composite schedule of rates (CSR) in each province. The cost of damage is worked out by applying
depreciation factor of 0.5 because most of the infrastructure is more than 15 years old. The cost of damage is
provided in the summary para of main report, whereas this annex shows all figures for reconstruction.
Sindh provincial Irrigation and Power Department (SID) reported damages amounting PKR 15,774 million
(US$ 181.3 million) in all its six administrative regions covering 38 operational divisions. However, after field
verification and data validation these damages reduced to PKR 7,872 million (US$ 90.5 million). Similarly,
Balochistan Irrigation and Power Department (BID) reported damages worth PKR 1,720 million (US$20
million) in 14 irrigation divisions, which reduced to PKR 1,654 million (US$ 19 million) after field validation.
Table 15.1 shows the damages reported by each Region and Figure 15.1 shows distribution of same damages by
regions. In Sindh most of the damages were to canals, drains and appurtenant structures. Offices and
residential buildings of the Irrigation department also suffered damages. Flood embankments and other minor
infrastructure also suffered few losses. In Balochistan most of the damages were to small dams, diversion
channels, flood embankments, canals and drains. Table 15.2 reflects the damages by type of structure and
Figure 15.2 shows distribution of damages by type of structure.

Page | 216
S.No. Regions/Zones Total
Sindh
1 SIDA 3,369
2 Sukkur Barrage Left Bank 2,175
3 Kotri Barrage 887
4 Development 746
5 Sukkur Barrage Right Bank 638
6 Small Dams 58
Sindh Total 7,872
Balochistan
1 North Zone 779
2 South Zone 783
3 Canal Zone 92
Balochistan Total 1,654
S.No. Regions/Zones Total
Sindh
1 SIDA 3,369
2 Sukkur Barrage Left Bank 2,175
3 Kotri Barrage 887
4 Development 746
5 Sukkur Barrage Right Bank 638
6 Small Dams 58
Sindh Total 7,872
Balochistan
1 North Zone 779
2 South Zone 783
3 Canal Zone 92
Balochistan Total 1,654
S.No. Regions/Zones Total
Sindh
1 SIDA 3,369
2 Sukkur Barrage Left Bank 2,175
3 Kotri Barrage 887
4 Development 746
5 Sukkur Barrage Right Bank 638
6 Small Dams 58
Sindh Total 7,872
Balochistan
1 North Zone 779
2 South Zone 783
3 Canal Zone 92
Balochistan Total 1,654
S.No. Regions/Zones Total
Sindh
1 SIDA 3,369
2 Sukkur Barrage Left Bank 2,175
3 Kotri Barrage 887
4 Development 746
5 Sukkur Barrage Right Bank 638
6 Small Dams 58
Sindh Total 7,872
Balochistan
1 North Zone 779
2 South Zone 783
3 Canal Zone 92
Balochistan Total 1,654
S.No. Regions/Zones Total
Sindh
1 SIDA 3,369
2 Sukkur Barrage Left Bank 2,175
3 Kotri Barrage 887
4 Development 746
5 Sukkur Barrage Right Bank 638
6 Small Dams 58
Sindh Total 7,872
Balochistan
1 North Zone 779
2 South Zone 783
3 Canal Zone 92
Balochistan Total 1,654
SIDA43%
Manufacturing,1%
Small Dams 1%
Sukkur BarrageRight Bank
8%
Sukkur BarrageLeft Bank 33%
Development 9%
Sindh
Kotri Barrage11%
Table-Annex 15.1: Damages by Region/Zone (PKR million)
Figure-Annex 15.1: Distribution of Damages by Region (%)
Canal / WaterChannels
34%
North Zone40%
Canal Zone 6%
Flood Protection Embankments
6%
South Zone 47%
Balochistan

Table-Annex: 15.2: Damages by Type of Structure (PKR million)
S.No. Structure description Total
Sindh
1 Canal 3,724
2 Drains and Appurtenant Structures 2,563
3 Building etc 1,009
4 Flood Protection Embankments 512
5 Small Dams 63
Sindh Total 7,872
Balochistan
1 Dams and Related Structures 557
2 Flood Protection Embankments 561
3 Canals 435
4 Drains and Appurtenant Structures 87
5 Building etc 14
Balochistan Total 1,654
Page | 217

Damages to Canals
Damages incurred to main canals, branch canals, distributaries, minors and head/cross regulators, which were
47% of the total cost of damages in Sindh and 26% in Balochistan. The field validation/ verification exercise
revealed that major damages occurred on embankments of main/branch canals as a result of slippages, and to
the berms due to inundation. The inspection path along canals, however, sustained minor losses in terms of
settlement or small pitting. Akram Wah main canal in Sindh is an exception where large breeches resulted due
to both relief cuts made by the farmers and heavy rains. Following first spell of rain in August 2011, the
farmers in Sindh made relief cuts at various reaches to drain their inundated farmlands. These relief cuts
which were not largely plugged before second spell of rain in September further widened and/or breeched. In
Sindh, more than 50% of damages have been reported in only nine divisions operating main canals like Fullili,
Akram Wah and Ghotki Feeder. In Balochistan, damages to aqueducts, head regulators and feeder channels
have been reported. Table 15.3 gives the damages by canal types.
Canal / WaterChannels
34%
Dams andRelated dikes
26%
Small Dams 1%
Flood Protection Embankments
6%
Drains andAppurtenant
Structures 33%
Balochistan
Canal / WaterChannels
40%
Manufacturing,1%
Small Dams 1%
Flood Protection Embankments
6%
Drains andAppurtenant
Structures 33%
Building etc 26%
Sindh
Page | 218
Figure-Annex 15.2: Distribution of Damages by Type of Structure (%)

Page | 219
Table-Annex 15.3: Canal Damages by Type (PKR million
S.No. Sub types Total
Sindh
1 Main Canals 1,180
2 Branches 986
3 Canal Minors 581
4 Distributaries 527
5 Head / Cross Regulators 450
Overall 3,724
Balochistan
1 Canals/Channels 232
2 Aqueducts 80
3 Feeding Channels 32
4 Head / Cross Regulators 29
5 Others (Culverts etc) 62
Overall 435
Damages to Drains and Appurtenant Structures
Damages to main/outfall drains, secondary and tertiary drains, regulators and embankments are 33% of the
total in Sindh and 5% in Balochistan. Left Bank Outfall Drains (LBOD) and in particular spinal drain
eventually took entire drainage load of left bank of Indus river in Sindh. SID estimated that flow in spinal
drain reached four to five times of its designed capacity, but it is not verified. A number of breaches and
overtopping was reported between RD 204 to RD 297 and at some reaches (RD 6 & RD 7 and in between
RD 0 to RD 6). The drain banks completely washed away where farmers have made relief cuts1. The spinal
drain along with its tributary drains remained inundated for several weeks causing erosion of embankments
and inspection paths. Other major drains like Mirpur Khas main drain, Fullili-Gunni, Karo Naro drain, Duro
Puran outfall drain (DPOD) and Kadhan Patiji outfall drain (KPOD) sustained similar losses all along their
lengths. Relatively lesser damages have been reported for allied regulators, and no regulator was reported as
completely damaged or washed away. Table 15.4 shows damages by type of drain.
1 LBOD Daily status report by Director Left Bank Canals Area Water Board
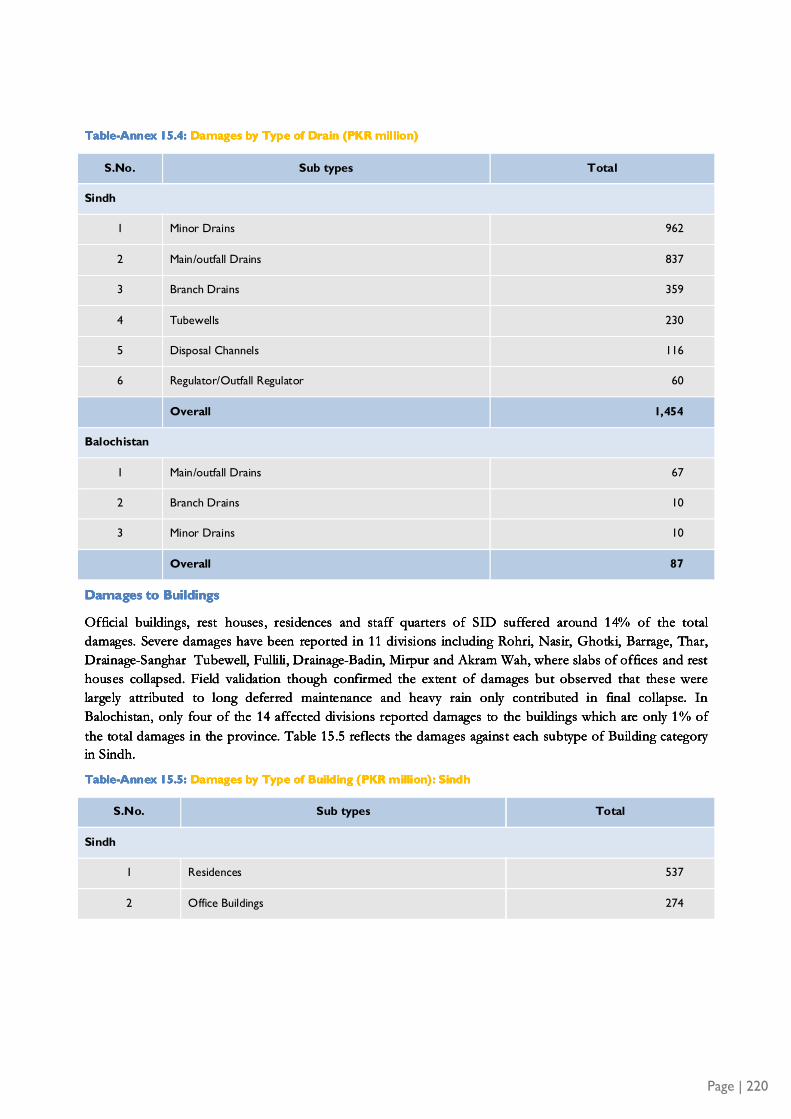
Page | 220
Table-Annex 15.4: Damages by Type of Drain (PKR million)
S.No. Sub types Total
Sindh
1 Minor Drains 962
2 Main/outfall Drains 837
3 Branch Drains 359
4 Tubewells 230
5 Disposal Channels 116
6 Regulator/Outfall Regulator 60
Overall 1,454
Balochistan
1 Main/outfall Drains 67
2 Branch Drains 10
3 Minor Drains 10
Overall 87
Damages to Buildings
Official buildings, rest houses, residences and staff quarters of SID suffered around 14% of the total
damages. Severe damages have been reported in 11 divisions including Rohri, Nasir, Ghotki, Barrage, Thar,
Drainage-Sanghar Tubewell, Fullili, Drainage-Badin, Mirpur and Akram Wah, where slabs of offices and rest
houses collapsed. Field validation though confirmed the extent of damages but observed that these were
largely attributed to long deferred maintenance and heavy rain only contributed in final collapse. In
Balochistan, only four of the 14 affected divisions reported damages to the buildings which are only 1% of
the total damages in the province. Table 15.5 reflects the damages against each subtype of Building category
in Sindh.
Table-Annex 15.5: Damages by Type of Building (PKR million): Sindh
S.No. Sub types Total
Sindh
1 Residences 537
2 Office Buildings 274

Page | 221
Damages to Flood Protection Embankments
Relatively lesser (7% of total) damages were reported to flood protection works in Sindh as most of these
embankments lie outside the heavy rainfall areas. Only 15 out of 38 divisions reported damages to flood
embankments in their jurisdiction. The major embankments reported damaged include Gaj Diversion Bund
(RD 0-32), Larkana Sehwan (LS) bund, Flood Protection (FP) bund and Sagyun Matiari (SM) Bund. The
damages to these bunds occurred mostly on outer side and largely because of water pooled on farms having
no drainage. As a result frequent slippages occurred at bottom of bund sections all along their lengths. No
breach was reported in any of major embankments. In Balochistan, damage to flood embankments is 34% of
the total damages. Table 15.6 gives flood protection damages in Sindh by divisions and damages in
Balochistan by type of flood protection structure.
Table-Annex 15.6: Damages to Flood Protection Embankments by Division (PKR million)
S.No. Division Total
Sindh
1 Southern Dadu Division 132
2 Hala 110
3 Rohri 83
4 Kohistan I 42
5 Northern Dadu Division 32
6 Lower Pinyari 20
7 Thar 18
8 Warah Division 16
9 Dad 13
10 Rice Canal Division 13
11 Saifullah Magsi Division 11
12 Drainage Thatta 10
13 Upper Pinyari 6
14 Kalri Beghar 5
S.No. Division Total
Sindh
1 Southern Dadu Division 132
2 Hala 110
3 Rohri 83
4 Kohistan I 42
5 Northern Dadu Division 32
6 Lower Pinyari 20
7 Thar 18
8 Warah Division 16
9 Dad 13
10 Rice Canal Division 13
11 Saifullah Magsi Division 11
12 Drainage Thatta 10
13 Upper Pinyari 6
14 Kalri Beghar 5
15 Shahbaz Irr Division 4
Overall 512
Balochistan
1 Flood Protection Bunds 470
2 Flood Spurs 60
3 Bund Sluices/Escapes 31
Overall 561

Page | 222
Damages to Dams and related Structures
Minor damages of about 1% of total damages costing PKR 63 million have been reported in Sindh and only
in one of six regions. Whereas in Balochistan damages occurred to dam embankments, spillways/weirs and
guide Bunds are 34% of the total cost of damages. The field validation/verification exercise revealed that
major damages occurred on embankments of dams and spillways due to flood exceeding the design value.
Table 15.7 gives the damages by type of structure for both provinces.
Table-Annex 15.7: Damages to Dams and Appurtenant Structure (PKR million)
S.No. Sub types Total
Sindh
1 Stone Pitching 23
2 Weir 40
Overall 63
Balochistan
1 Dam Embankments 195
2 Spillways/Weirs 233
3 Guide Bunds 116
4 Others 13
Overall 557
Data Collection and Validation Process
As the process of DNA commenced in early October 2011, a standard format was developed for Irrigation
and Flood sector seeking consistency in data capturing and recording. The structured format was flexible
enough to capture damages and diversity in subtypes of irrigation infrastructures under six broad categories.
The format along with necessary guidelines for filling the same were accordingly sent to provincial Irrigation
Department (PIDs) in mid October. 38 operational divisions of SID and 14 of BID sent damage data to
Focal Person, which was forwarded to ADB. Earlier a team of consultants was recruited and stationed at
Hyderabad to help facilitate data collection from field and data entering into DNA format. As a parallel
exercise a comprehensive database was developed for generating customized reports based on deeper
analysis. Field data entry in the database continued till revision and finalization of all data i.e. second week of
December. This exercise had two distinct functions; first one comprised simply transfer of data from DNA
format to database, data cleaning, necessary corrections (categories, subtypes, units etc wrongly placed or
reported in DNA format) and filling of blanks (particularly unit cost and measuring units). The second one -
being instrumental in field validation process- comprised (i) segregating and arranging data by key parameters
(categories /subtypes, administrative regions/divisions); (ii) analyzing data further for indentifying possible
anomalies (comparing unit costs across subtypes of infrastructures and regions/divisions, and comparison
of total size of infrastructure with size and extent of damages reported); (iii) identifying relatively high damage
areas (both by divisions and by infrastructure types); and (iv) spotting evident areas of diversions from mean
values.
Page | 223
Physical verification at site was next critical step in validation process. For the purpose ADB further
strengthened its already deployed DNA team by increasing number of consultants from 2 to 5 for
accomplishing required task at the earliest possible. Thirty eight divisions in Sindh were divided into Priority-I
divisions, 20 in total (based on the value of reported damages); and remaining 18 divisions under Priority-II.
All of Priority-I divisions were visited by DNA validation team and previously spotted points, through data
analysis, were verified/or observed otherwise on sample basis. Damages for another 6 divisions were
validated through discussions with concerned field staff. In this way validation exercise covered the divisions
that correspond to more than 90% of total reported damages. In Balochistan three divisions reporting
maximum damages were visited for field validation, whereas detailed discussion were done with chief
engineers, superintending engineers, executive engineers and assistant executive engineers of all divisions. The
data inconsistencies were shared with them and subsequently they were advised to submit revised data.
Apart from other observations, DNA validation team made two key observations almost across the board;
firstly: extent and magnitude of damages reported was not merely because of intense rains rather appeared a
result of long deferred maintenance and rains, particularly in Sindh; secondly: cost basis for reporting
damages varied considerably for similar structures across various operational divisions.
Final step of validation process was to get the reported damages rationalized/revised from PIDs on the basis
of field observations particularly the ones mentioned above. The cumulative effect of rationalization after
field verifications was significant in Sindh, with a net reduction PKR 7,901 million (US$90.8 million) in
previously reported damage figures. However, in Balochistan the validation exercise has caused a difference
of only PKR 66 million (US$0.8 million), which is nominal. Therefore present figure of PKR 1,654 million
(US$ 19 million) may be considered final for Balochistan.
Proposed Sector Recovery and Reconstruction Strategies
The proposed irrigation, drainage and flood protection sector reconstruction strategy is to restore all damaged
structures, and strengthen vulnerable and damaged sections before 2012 monsoon. Keeping in view the
changing climate patterns affecting intensity and duration of rainfalls, particularly in Sindh province, it is
recommended that the Government reviews its (i) current flood management strategy, (ii) disaster
management strategy, (iii) disaster preparedness capacity, and (iv) evacuation and flood relief capacities. Main
drains in Sindh, particularly Left Bank Outfall Drain (LBOD) drained huge volume of water, which otherwise
would have kept inundated the farmlands for a very long period also affecting the cropping in winter season.
These drains have been designed to discharge sub-surface water for checking water logging of agricultural
land. Their capacity should be enhanced for also draining storm water, after carrying out in-depth analysis and
forecasting probable maximum rainfalls in next 20 to 50 years. Proper inlets need to be designed for
collecting rain water. Strict monitoring is essential to avoid cutting by the farmers. Annual maintenance,
before and after monsoon season, if not carried out would waste whatever investments are made to improve
these drains. Preparation of a maintenance manual is strongly recommended.
For small dams, design parameters for estimating reservoir size, dam configuration, spillway capacity, and
highest flood levels need to be revisited keeping in view the changing climate patterns, and rainfall intensities
and durations. The present hydrological approaches of using historic data to estimate future trends need to be
more carefully applied for future dams and flood irrigation projects.