Preinforme goverment at glance 2013
198
PRELIMINARY VERSION Government at a Glance 2013
-
Upload
observatoriodigital -
Category
Technology
-
view
2.993 -
download
0
Transcript of Preinforme goverment at glance 2013
Preliminary version
Government at a Glance 2013
Govern
ment at a G
lance 2013
Government at a Glance 2013

Government at a Glance2013
This work is published on the responsibility of the Secretary-General of the OECD. The
opinions expressed and arguments employed herein do not necessarily reflect the official
views of the Organisation or of the governments of its member countries.
This document and any map included herein are without prejudice to the status of or
sovereignty over any territory, to the delimitation of international frontiers and boundaries
and to the name of any territory, city or area.
ISBN 978-92-64-20132-3 (print)ISBN 978-92-64-20133-0 (HTML)
Government at a Glance:ISSN 2221-4380 (print)ISSN 2221-4399 (online)
The statistical data for Israel are supplied by and under the responsibility of the relevant Israeli authorities. The useof such data by the OECD is without prejudice to the status of the Golan Heights, East Jerusalem and Israelisettlements in the West Bank under the terms of international law.
Photo credits: Cover © Robert Adrian Hillman/Shutterstock.com, © tovovan/Shutterstock.com.Chapters 2 to 9 © Shutterstock/kentoh.
Corrigenda to OECD publications may be found on line at: www.oecd.org/publishing/corrigenda.
© OECD 2013
You can copy, download or print OECD content for your own use, and you can include excerpts from OECD publications, databases and
multimedia products in your own documents, presentations, blogs, websites and teaching materials, provided that suitable
acknowledgment of the source and copyright owner is given. All requests for public or commercial use and translation rights should be
submitted to [email protected]. Requests for permission to photocopy portions of this material for public or commercial use shall be
addressed directly to the Copyright Clearance Center (CCC) at [email protected] or the Centre français d'exploitation du droit de copie
(CFC) at [email protected].
Please cite this publication as:OECD (2013), Government at a Glance 2013, OECD Publishing.http://dx.doi.org/10.1787/gov_glance-2013-en
FOREWORD
Foreword
The financial and economic crisis that started in 2008 and affected most OECD member countries
has reopened the debate on the role of the state on how and where it should intervene to achieve
which objectives. Government at a Glance 2013 provides key quantitative and qualitative data
that can enable evidence-based decision making as well as help governments plan for the future. It
allows for the comparison of government activities, practices and performance across a number of
critical dimensions, and helps pinpoint areas that warrant further examination. In its policy chapter,
the publication explores the links between trust in government and the policies and institutions of
public governance.
This work was led by Zsuzsanna Lonti under the direction of Rolf Alter and Edwin Lau and
drafted by Natalia Nolan-Flecha, Santiago González, Jean-François Leruste and Alessandro Lupi.
Major drafted contributions were received from Mario Marcel and Stéphane Jacobzone (Chapter 1
on “Trust in government, policy effectiveness and the governance agenda”); Catherine Gamper
and Alice Lazzati (Chapter 2 on “Strategic governance”); Monica Brezzi, Arthur Mickoleit and
Camila Vammalle (Chapter 3 on “Public finance and economics”); Ronnie Downes, Ian Hawkesworth,
Joung Jin Jang, Knut Klepvisk and Lisa Von Trapp (Chapter 4 on “Budgeting practices and procedures”);
Robert Ball and Maya Beauvallet (Chapter 5 on “Public sector employment and pay”); Robert Ball,
Michelle Marshalian and Tatyana Teplova (Chapter 6 on “Women in government”); Elodie Beth,
María-Emma Cantera, Ulrika Kilnes (Chapter 7 on “Public procurement”); Julio Bacio Terracino,
Janos Bertok, Maria-Emma Cantera, Ronnie Downes, Ulrika Kilnes, Knut Klepvisk, Arthur Mickoleit,
Adam Mollerup and Barbara Ubaldi (Chapter 8 on “Open and inclusive government”);
Filippo Cavassini, Alice Lazzati and Adam Mollerup (Chapter 9 on “Special feature – Serving citizens:
Accessibility and quality of public services”). We thank Lia Beyeler, Laura Boutin, Kate Lancaster,
Natasha Lawrance, Sophie Limoges, Jennifer Stein and Deirdre Wolfender for their help in preparing
the document for publication.
This publication is the result of contributions from a wide range of sources and expertise. It
benefited from inputs provided by the OECD Public Governance Committee and the Government at a
Glance Steering Group (details in Annex F); the OECD Committee on Statistics; the Public
Employment and Management Working Party; the Working Party of Senior Budget Officials; the
OECD Expert Group of Conflict of Interest; the Network of Senior E-government Officials; the leading
Practitioners on Public Procurement and the Expert Group on Innovative and Open Government.
Valuable comments have also been received from Peter Van de Ven and Catherine La Rosa-Elkaim
(OECD Statistics Directorate); Richard Highfield, Mehmet Ceylan and Devi Thani (Centre for Tax
Policy), Gaetan Lafortune, Nicolaas Sieds Klazinga, Valerie Paris (OECD Directorate for Employment,
Labour and Social Affairs), Corine Heckmann, Joris Ranchin (OECD Directorate for Education),
Peter Hoeller, Giussepe Nicoletti (OECD Economics Directorate) Messaoud Hammouya (International
Labour Organization, Geneva, Switzerland) and Zoltan Mikolas (Consultant).
GOVERNMENT AT A GLANCE 2013 © OECD 2013 3

TABLE OF CONTENTS
Table of contents
Preface – Governance matters!. . . . . . . . . . . . . . . . . . . . . . . . . . . . . . . . . . . . . . . . . . . . . . . . 8
Executive summary . . . . . . . . . . . . . . . . . . . . . . . . . . . . . . . . . . . . . . . . . . . . . . . . . . . . . . . . . 9
Reader’s guide . . . . . . . . . . . . . . . . . . . . . . . . . . . . . . . . . . . . . . . . . . . . . . . . . . . . . . . . . . . . . 11
Introduction . . . . . . . . . . . . . . . . . . . . . . . . . . . . . . . . . . . . . . . . . . . . . . . . . . . . . . . . . . . . . . . 15
Chapter 1. Trust in government, policy effectiveness and the governance agenda . . . 19
Introduction. . . . . . . . . . . . . . . . . . . . . . . . . . . . . . . . . . . . . . . . . . . . . . . . . . . . . . . . . . . . 20
What do we mean by trust in government? . . . . . . . . . . . . . . . . . . . . . . . . . . . . . . . . . 21
Why does trust in government matter? . . . . . . . . . . . . . . . . . . . . . . . . . . . . . . . . . . . . 21
Measuring trust in government . . . . . . . . . . . . . . . . . . . . . . . . . . . . . . . . . . . . . . . . . . . 23
Patterns and trends of trust in government in OECD countries . . . . . . . . . . . . . . . . 25
Drivers of trust in government . . . . . . . . . . . . . . . . . . . . . . . . . . . . . . . . . . . . . . . . . . . . 28
Conclusion . . . . . . . . . . . . . . . . . . . . . . . . . . . . . . . . . . . . . . . . . . . . . . . . . . . . . . . . . . . . . 35
Notes. . . . . . . . . . . . . . . . . . . . . . . . . . . . . . . . . . . . . . . . . . . . . . . . . . . . . . . . . . . . . . . . . . 36
Bibliography. . . . . . . . . . . . . . . . . . . . . . . . . . . . . . . . . . . . . . . . . . . . . . . . . . . . . . . . . . . . 36
Chapter 2. Strategic governance . . . . . . . . . . . . . . . . . . . . . . . . . . . . . . . . . . . . . . . . . . . . . . . 39
Trust in government. . . . . . . . . . . . . . . . . . . . . . . . . . . . . . . . . . . . . . . . . . . . . . . . . . . . . 40
Improving fairness through selected government policies . . . . . . . . . . . . . . . . . . . . 42
Rule of law . . . . . . . . . . . . . . . . . . . . . . . . . . . . . . . . . . . . . . . . . . . . . . . . . . . . . . . . . . . . . 44
Risk management . . . . . . . . . . . . . . . . . . . . . . . . . . . . . . . . . . . . . . . . . . . . . . . . . . . . . . . 48
Fiscal sustainability . . . . . . . . . . . . . . . . . . . . . . . . . . . . . . . . . . . . . . . . . . . . . . . . . . . . . 50
Public sector efficiency. . . . . . . . . . . . . . . . . . . . . . . . . . . . . . . . . . . . . . . . . . . . . . . . . . . 52
Public sector cost-effectiveness . . . . . . . . . . . . . . . . . . . . . . . . . . . . . . . . . . . . . . . . . . . 56
Chapter 3. Public finance and economics . . . . . . . . . . . . . . . . . . . . . . . . . . . . . . . . . . . . . . . 61
General government fiscal balance . . . . . . . . . . . . . . . . . . . . . . . . . . . . . . . . . . . . . . . . 62
General government debt . . . . . . . . . . . . . . . . . . . . . . . . . . . . . . . . . . . . . . . . . . . . . . . . 64
Fiscal balance and debt by level of government. . . . . . . . . . . . . . . . . . . . . . . . . . . . . . 66
General government revenues . . . . . . . . . . . . . . . . . . . . . . . . . . . . . . . . . . . . . . . . . . . . 68
Structure of general government revenues. . . . . . . . . . . . . . . . . . . . . . . . . . . . . . . . . . 70
Revenue structure by level of government . . . . . . . . . . . . . . . . . . . . . . . . . . . . . . . . . . 72
General government expenditures. . . . . . . . . . . . . . . . . . . . . . . . . . . . . . . . . . . . . . . . . 74
Structure of general government expenditures (by COFOG function) . . . . . . . . . . . 76
Expenditures structure by level of government . . . . . . . . . . . . . . . . . . . . . . . . . . . . . . 78
Government investment spending. . . . . . . . . . . . . . . . . . . . . . . . . . . . . . . . . . . . . . . . . 80
Production costs and outsourcing of general government . . . . . . . . . . . . . . . . . . . . . 82
Special feature: Central government ICT spending . . . . . . . . . . . . . . . . . . . . . . . . . . . 84
GOVERNMENT AT A GLANCE 2013 © OECD 2013 5
TABLE OF CONTENTS
Chapter 4. Budgeting practices and procedures . . . . . . . . . . . . . . . . . . . . . . . . . . . . . . . . . 87
Fiscal rules . . . . . . . . . . . . . . . . . . . . . . . . . . . . . . . . . . . . . . . . . . . . . . . . . . . . . . . . . . . . . 88
Medium-term expenditure frameworks . . . . . . . . . . . . . . . . . . . . . . . . . . . . . . . . . . . . 90
Executive budget flexibility . . . . . . . . . . . . . . . . . . . . . . . . . . . . . . . . . . . . . . . . . . . . . . . 92
Performance budgeting . . . . . . . . . . . . . . . . . . . . . . . . . . . . . . . . . . . . . . . . . . . . . . . . . . 94
Public-private partnerships. . . . . . . . . . . . . . . . . . . . . . . . . . . . . . . . . . . . . . . . . . . . . . . 96
Independent fiscal institutions. . . . . . . . . . . . . . . . . . . . . . . . . . . . . . . . . . . . . . . . . . . . 98
Chapter 5. Public sector employment and pay. . . . . . . . . . . . . . . . . . . . . . . . . . . . . . . . . . . 101
Employment in general government and public corporations . . . . . . . . . . . . . . . . . 102
General government employment across levels of government . . . . . . . . . . . . . . . . 104
Compensation of senior managers . . . . . . . . . . . . . . . . . . . . . . . . . . . . . . . . . . . . . . . . 106
Compensation of middle managers. . . . . . . . . . . . . . . . . . . . . . . . . . . . . . . . . . . . . . . . 108
Compensation of professionals in central government . . . . . . . . . . . . . . . . . . . . . . . 110
Compensation of secretarial staff . . . . . . . . . . . . . . . . . . . . . . . . . . . . . . . . . . . . . . . . . 112
Compensation in selected service occupations . . . . . . . . . . . . . . . . . . . . . . . . . . . . . . 114
Teachers’ salaries . . . . . . . . . . . . . . . . . . . . . . . . . . . . . . . . . . . . . . . . . . . . . . . . . . . . . . . 116
Chapter 6. Women in government . . . . . . . . . . . . . . . . . . . . . . . . . . . . . . . . . . . . . . . . . . . . . 119
Women in general government employment. . . . . . . . . . . . . . . . . . . . . . . . . . . . . . . . 120
Women in central government employment . . . . . . . . . . . . . . . . . . . . . . . . . . . . . . . . 122
Women in senior administrative positions in central government . . . . . . . . . . . . . 124
Women in politics. . . . . . . . . . . . . . . . . . . . . . . . . . . . . . . . . . . . . . . . . . . . . . . . . . . . . . . 126
Chapter 7. Public procurement . . . . . . . . . . . . . . . . . . . . . . . . . . . . . . . . . . . . . . . . . . . . . . . . 129
Public procurement spending . . . . . . . . . . . . . . . . . . . . . . . . . . . . . . . . . . . . . . . . . . . . . 130
Innovative tools in public procurement . . . . . . . . . . . . . . . . . . . . . . . . . . . . . . . . . . . . 132
Strategic public procurement . . . . . . . . . . . . . . . . . . . . . . . . . . . . . . . . . . . . . . . . . . . . . 134
Fair competition in public procurement and SMEs . . . . . . . . . . . . . . . . . . . . . . . . . . . 136
Chapter 8. Open and inclusive government . . . . . . . . . . . . . . . . . . . . . . . . . . . . . . . . . . . . . 139
Open government data . . . . . . . . . . . . . . . . . . . . . . . . . . . . . . . . . . . . . . . . . . . . . . . . . . 140
Conflict of interest and asset disclosure . . . . . . . . . . . . . . . . . . . . . . . . . . . . . . . . . . . . 142
Budget transparency . . . . . . . . . . . . . . . . . . . . . . . . . . . . . . . . . . . . . . . . . . . . . . . . . . . . 144
Inclusive policy making . . . . . . . . . . . . . . . . . . . . . . . . . . . . . . . . . . . . . . . . . . . . . . . . . . 146
Chapter 9. Special feature – Serving citizens: Accessibility and qualityof public services . . . . . . . . . . . . . . . . . . . . . . . . . . . . . . . . . . . . . . . . . . . . . . . . . . . . . . . 149
Access to public services: Affordability . . . . . . . . . . . . . . . . . . . . . . . . . . . . . . . . . . . . . 150
Uptake of online public services. . . . . . . . . . . . . . . . . . . . . . . . . . . . . . . . . . . . . . . . . . . 154
Responsiveness of public services: Timeliness. . . . . . . . . . . . . . . . . . . . . . . . . . . . . . . 158
Reliability of public services: Ensuring citizens’ rights . . . . . . . . . . . . . . . . . . . . . . . . 162
Citizen satisfaction with public services. . . . . . . . . . . . . . . . . . . . . . . . . . . . . . . . . . . . 166
Annex A. Methodology for revenue aggregates . . . . . . . . . . . . . . . . . . . . . . . . . . . . . . . . . 169
Annex B. Classification of the Functions of Government (COFOG) . . . . . . . . . . . . . . . . . 170
Annex C. Composite indexes budget practices. . . . . . . . . . . . . . . . . . . . . . . . . . . . . . . . . . 172
Annex D. Methodology and additional notes on compensation of governmentemployees . . . . . . . . . . . . . . . . . . . . . . . . . . . . . . . . . . . . . . . . . . . . . . . . . . . . . . . . 176
Annex E. Detailed data on conflict-of-interest disclosure . . . . . . . . . . . . . . . . . . . . . . . . 185
Annex F. Members of the Steering Group . . . . . . . . . . . . . . . . . . . . . . . . . . . . . . . . . . . . . . 189
Glossary . . . . . . . . . . . . . . . . . . . . . . . . . . . . . . . . . . . . . . . . . . . . . . . . . . . . . . . . . . . . . . . . . . . 190
GOVERNMENT AT A GLANCE 2013 © OECD 20136
Look for the StatLinks2at the bottom of the tables or graphs in this book.
To download the matching Excel® spreadsheet, just type the link into your
Internet browser, starting with the http://dx.doi.org prefix, or click on the link from
the e-book edition.
Follow OECD Publications on:
This book has... StatLinks2A service that delivers Excel® files from the printed page!
http://twitter.com/OECD_Pubs
http://www.facebook.com/OECDPublications
http://www.linkedin.com/groups/OECD-Publications-4645871
http://www.youtube.com/oecdilibrary
http://www.oecd.org/oecddirect/ OECD
Alerts
GOVERNMENT AT A GLANCE 2013 © OECD 2013 7

PREFACE – GOVERNANCE MATTERS!
Preface – Governance matters!
The outlook for the global economy is improving gradually, but the world continues to
grapple with the consequences of the global financial, economic and social crisis. Low
growth, high government indebtedness, persistent unemployment and widening
inequalities require strong corrective action. Governments are expected to put our
economies back on a track of stronger, greener and more inclusive growth.
Citizens look to governments to lead the way. Without strong leadership, supported by
effective policies, trust is easily eroded. Indeed, the crisis has taken its toll on trust in
government. Citizens across the OECD have lost their confidence in the ability of policy
makers to solve economic problems and respond to their needs and demands. It is essential
that governments regain the confidence of their citizens to carry out necessary reforms.
A key lever governments can use to build back trust is strong performance. The
2013 edition of Government at a Glance puts forth a dashboard to help decision makers and
citizens analyse and benchmark government performance and to identify fields where the
effectiveness and efficiency of the public sector can be improved. The 50 indicators cover
the whole production chain of public goods and services (inputs, processes, outputs and
outcomes) and key areas of public management and governance, such as budgeting
practices, integrity and open government, e-government and ICT strategies.
Government at a Glance 2013 demonstrates that, while governments have taken steps to
strengthen institutions and improve value for money, much remains to be done. For example,
despite considerable efforts in many countries, the health of their public finances needs to be
further improved and substantial gender disparities still exist. For example, women occupy
only 40% of middle management and 29% of top management positions. Also, Open
Government Data (OGD) is gaining importance as a governance tool – 56% of OECD countries
have a national OGD strategy – but more effort is required to ensure that citizens can
effectively use the available information. Across these and many other areas, public sector
reform needs to remain a high priority in support of our economic and social goals.
By continually extending the scope and timeliness of our governance indicators and
analysis, and providing them in a variety of electronic formats for ease of access, we trust
that Government at a Glance 2013 will be a critical resource for policy makers, citizens, and
researchers in their pursuit of better policies for better lives.
Angel Gurría
OECD Secretary-General
GOVERNMENT AT A GLANCE 2013 © OECD 20138
Government at a Glance 2013
© OECD 2013
Executive summary
The financial and economic crisis and its aftermath have led many OECD governments to
implement structural adjustment plans to restore the health of their public finances.
However, trust in governments has declined considerably, as citizens’ growing
expectations have been hard to address with limited government resources. Between 2007
and 2012, confidence in national governments declined from 45% to 40% on average,
making it difficult for national authorities to mobilise support for necessary reforms.
A new approach to public governance is needed if governments are to meet citizens’
expectations with the limited means at hand. This approach should be built around
creating strategic capacity, strong institutions, effective instruments and processes and
clear measurable outcomes. The indicators presented in Government at a Glance 2013 show
how far OECD countries have progressed towards developing that strategic state.
Key findings
● Public finance challenges remain, despite the significant efforts made by countries torestore financial health. The OECD has produced estimates of improvements in the
underlying primary balances that would be required to reduce gross public debt to 60% of
GDP by 2030. On average, in OECD member countries, an increase of around 3% of
potential GDP is needed from the fiscal position in 2012. However, several OECD countries
continue to face rising public debt-to-GDP ratios, with government spending on average
in 2011 outstripping revenues. This was partly due to the cost of stimulus packages and
stagnant revenues because of the crisis, as well as increases in ageing-related spending.
● Countries have adopted new budgetary practices and developed new governanceinstitutions. Changes in the global economic governance framework, which were
necessary as existing mechanisms proved ineffective to maintain fiscal discipline, are
driving countries to refine the current tools and implement new strategies. For instance,
97% of OECD countries currently have fiscal rules in place and the average number of
rules per country has increased. Between 2009 and 2013, eight countries established
Independent Fiscal Institutions to promote fiscal discipline, generate economic
information and ensure that resources are allocated where they will be the most useful.
● Public employment levels tend to remain stable over the longer term. General government
employment remained relatively unchanged between 2001 and 2011, at just under 16% of
the total labour force. This figure is relatively small when compared to average government
expenditures, which represented 45.4 % of GDP in 2011, showing the important role of
outsourcing. Despite the fact that several OECD countries announced recruitment freezes
and employment reductions as part of their fiscal consolidation plans, significant
reductions in public employment are hard to sustain in the long run, as citizens demands
keep growing.
9
EXECUTIVE SUMMARY
● Further mechanisms are needed to close the public sector gender gap. Governments
have taken a variety of steps to guarantee equal opportunities for their female and male
employees, such as implementing recruitment and promotion targets as well as measures
to facilitate greater work-life balance. However, data show that women occupy more
than 50% (in certain cases, nearly 90%) of secretarial positions, but they are far less
represented in more senior posts. Measures to correct such disparities include, for
example, gender responsive budgeting (GRB), which inserts a gender perspective into all
stages of the budgetary cycle. It aims to avoid “gender-blind spending” and to make
government programmes more effective by identifying gender-disproportionate
consequences of spending appropriations. However, less than half of OECD countries have
instituted GRB.
● Countries are using public procurement more strategically. Many OECD countries are using
innovative procurement tools to achieve economies of scale (94% use framework
agreements, for example), restructuring their purchasing functions, consolidating
their purchases and adopting ICTs in the procurement process (97% use a national
e-procurement system for calls for tender). Moreover, many OECD members use public
procurement policies not only to foster value for money but also to pursue other policy
objectives such as innovation, sustainable growth (73% promote green procurement), SMEs
(70% promote the use of SMEs) and a level playing field to access economic opportunities.
● Asset and private interest disclosure by decision makers continues to be an essential toolfor managing conflict of interest. Nearly all countries require decision makers to make
public their assets and income sources. However, few countries require the disclosure of
previous employment and liabilities.
● Open Government Data (OGD) is gaining importance as a governance tool. Just over half
of OECD countries have a national strategy for providing OGD to citizens; 12% indicate the
existence of separate strategies in this field for individual line ministries, and 28% have
both national and lower level strategies. Key OGD priorities include transparency and
openness, volume increase for private sector business and creation of new businesses. In
addition, the potential of OGD to improve service delivery is well understood by countries;
however its potential impact on citizen engagement in public debates and in the
decision-making process does not appear among the top priorities.
● Citizens have more confidence in the public services they use than in the abstractnotion of national government. Despite diminishing trust in “government”, citizens
report being pleased with the services provided by governments. For instance, on
average 72% reported having confidence in their local police force. Almost the same
percentage considered themselves satisfied with the availability of quality health care,
and 66% were satisfied with the education system and schools in their city or area.
Levels of satisfaction remained fairly consistent, on average, during and immediately
following the global financial and economic crisis.
● Governments in OECD countries are increasingly concerned with delivering qualitypublic goods and services to a wide range of citizens. Many countries are introducing
service delivery performance standards and implementing mechanisms to measure and
integrate citizen feedback into the process. For the first time, Government at a Glance
compares four dimensions of service quality – affordability, responsiveness, reliability
and citizens’ satisfaction – not only among countries, but also across the key public
services of education, health care, justice and tax administration.
GOVERNMENT AT A GLANCE 2013 © OECD 201310

READER’S GUIDE
Reader’s guide
In order to accurately interpret the data included in Government at a Glance, readers need
to be familiar with the following methodological considerations that cut across a number
of indicators. As in previous editions, the standard format for the presentation of
indicators is on two pages, except for a few indicators – such as indicators on the rule of
law and on the quality of public services – that are presented on four pages. For the
two-page format, the first page contains text that explains the relevance of the topic and
highlights some of the major differences observed across OECD countries. It is followed by
a “Methodology and definitions” section, which describes the data sources and provides
important information necessary to interpret the data. Closing the first page is the “Further
reading” section, which lists useful background literature providing context to the data
displayed. The second page showcases the data. These figures show current levels and,
where possible, trends over time. A “Glossary” of the main definitions of the publication
can be found in the final chapter of the book.
Calendar year/fiscal year in National Accounts dataUnless specified, data from the OECD National Accounts are based on calendar years.
Data for Australia and New Zealand refer to fiscal years: 1 July of the year indicated to
30 June for Australia and 1 April of the year indicated to 31 March for New Zealand. For
Japan, data regarding sub-sectors of general government and expenditures by COFOG
(Classification of the Functions of Government) refer to fiscal year.
The data based on the System of National Accounts (SNA) were extracted from the OECD
National Accounts Statistics (database) on 12 August 2013.
Country coverageGovernment at a Glance 2013 includes data for all 34 OECD member countries based on
available information. The statistical data for Israel are supplied by and under the
responsibility of the relevant Israeli authorities. The use of such data by the OECD is
without prejudice to the status of the Golan Heights, East Jerusalem and Israeli settlements
in the West Bank under the terms of international law.
Some additional countries, such as the Russian Federation (currently in the process of
accession to the OECD) and others that have participant status to the Public Governance
Committee of the OECD (Brazil, Egypt, South Africa, Ukraine) also supplied data for some
indicators. Data for non-member countries are presented separately at the end of tables
and figures.
GOVERNMENT AT A GLANCE 2013 © OECD 2013 11
READER’S GUIDE
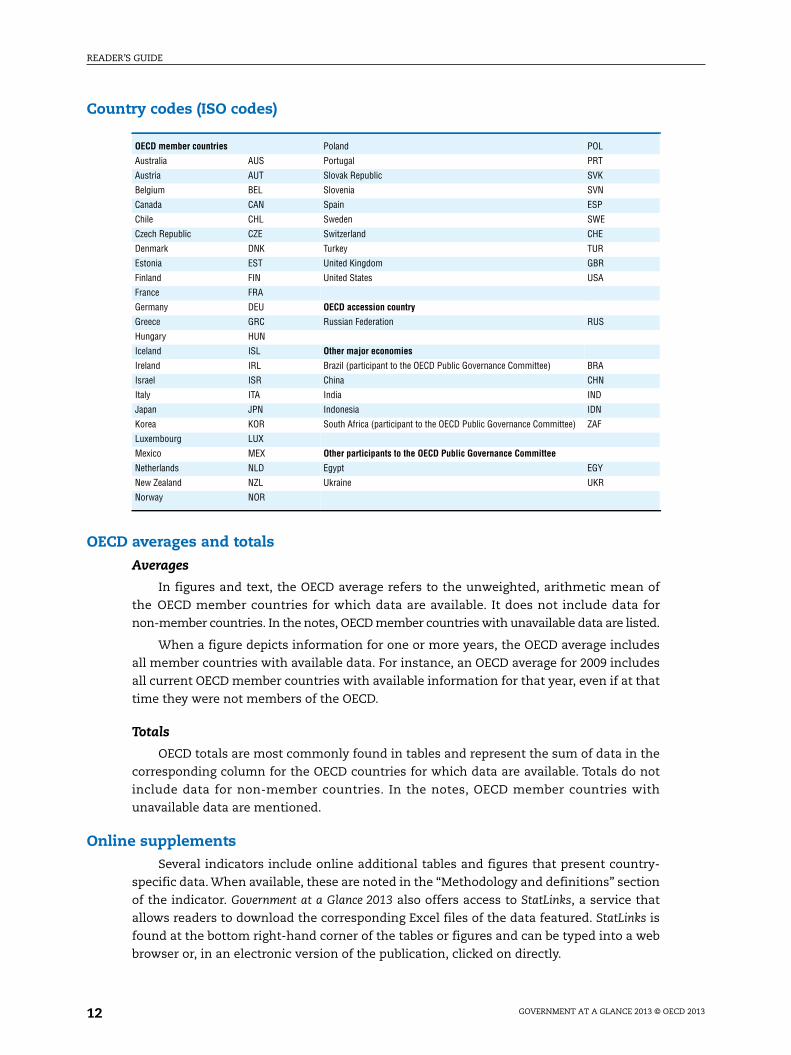
Country codes (ISO codes)
OECD averages and totals
Averages
In figures and text, the OECD average refers to the unweighted, arithmetic mean of
the OECD member countries for which data are available. It does not include data for
non-member countries. In the notes, OECD member countries with unavailable data are listed.
When a figure depicts information for one or more years, the OECD average includes
all member countries with available data. For instance, an OECD average for 2009 includes
all current OECD member countries with available information for that year, even if at that
time they were not members of the OECD.
Totals
OECD totals are most commonly found in tables and represent the sum of data in the
corresponding column for the OECD countries for which data are available. Totals do not
include data for non-member countries. In the notes, OECD member countries with
unavailable data are mentioned.
Online supplementsSeveral indicators include online additional tables and figures that present country-
specific data. When available, these are noted in the “Methodology and definitions” section
of the indicator. Government at a Glance 2013 also offers access to StatLinks, a service that
allows readers to download the corresponding Excel files of the data featured. StatLinks is
found at the bottom right-hand corner of the tables or figures and can be typed into a web
browser or, in an electronic version of the publication, clicked on directly.
OECD member countries Poland POL
Australia AUS Portugal PRT
Austria AUT Slovak Republic SVK
Belgium BEL Slovenia SVN
Canada CAN Spain ESP
Chile CHL Sweden SWE
Czech Republic CZE Switzerland CHE
Denmark DNK Turkey TUR
Estonia EST United Kingdom GBR
Finland FIN United States USA
France FRA
Germany DEU OECD accession country
Greece GRC Russian Federation RUS
Hungary HUN
Iceland ISL Other major economies
Ireland IRL Brazil (participant to the OECD Public Governance Committee) BRA
Israel ISR China CHN
Italy ITA India IND
Japan JPN Indonesia IDN
Korea KOR South Africa (participant to the OECD Public Governance Committee) ZAF
Luxembourg LUX
Mexico MEX Other participants to the OECD Public Governance Committee
Netherlands NLD Egypt EGY
New Zealand NZL Ukraine UKR
Norway NOR
GOVERNMENT AT A GLANCE 2013 © OECD 201312

READER’S GUIDE
In addition, the following supplementary material are available on line at
www.oecd.org/gov/govataglance.htm:
● Country fact sheets that present key data by country compared with the OECD average.
● The Government at a Glance statistical database that includes regularly updated data for a
selection of indicators (via OECD.Stat).
● Country contextual notes that present contextual information describing some key
features of the political and administrative structures for each member country.
Per capita indicatorsSome indicators (e.g. expenditures, revenues and government debt) are shown on a
per capita (e.g. per person) basis. The underlying population estimates are based on the
System of National Accounts notion of residency. They include persons who are resident in a
country for one year or more, regardless of their citizenship, and also include foreign
diplomatic personnel and defense personnel together with their families, students
studying and patients seeking treatment abroad, even if they stay abroad for more than
one year. The one-year rule means that usual residents who live abroad for less than one
year are included in the population, while foreign visitors (for example, vacationers) who
are in the country for less than one year are excluded. An important point to note in this
context is that individuals may feature as employees of one country (contributing to the
GDP of that country via production), but residents of another (with their wages and salaries
reflected in the gross national income of their resident country).
Purchasing Power ParitiesPurchasing Power Parities (PPPs) are the rates of currency conversion that equalise the
purchasing power of different countries by eliminating differences in price levels between
countries. When converted by means of PPPs, expenditures across countries are in effect
expressed at the same set of prices, meaning that an equivalent bundle of goods and
services will have the same cost in both countries, enabling comparisons across countries
that reflect only the differences in the volume of goods and services purchased.
2001 and 2009: PPPs for all European countries are annual benchmark results provided by
Eurostat. PPPs for non-European countries and the Russian Federation are OECD estimates.
2011: PPPs for all OECD member countries and the Russian Federation are preliminary
benchmark results calculated by the OECD. Estimates and preliminary results should be
interpreted with caution as they are subject to revision.
More information is available on the OECD PPP Internet site: www.oecd.org/std/prices-ppp.
Composite indicatorsThe publication includes several descriptive composite indexes in narrowly defined
areas related to conflict of interest and budget practices and procedures. These composite
indexes are a practical way of summarising discrete, qualitative information. The
composites presented in this publication were created in accordance with the steps
identified in the Handbook on Constructing Composite Indicators (Nardo et al., 2008).
Details about the variables and weights used to construct the budget practices and
procedures and conflict of interests’ composites are available in Annex C and Annex E
respectively. While the composite indicators were developed in co-operation with member
countries and are based on theory and/or best practices, the variables composing the
indexes and their relative weights are based on expert judgments and, as a result, may
GOVERNMENT AT A GLANCE 2013 © OECD 2013 13
READER’S GUIDE
change over time. The composites on budget practices and procedures are not comparable
with those in the 2009 edition of Government at a Glance, as the latest Budget Practices and
Procedures and Performance Budgeting surveys (2012) include questions that are worded
slightly differently from the 2007 survey versions. Moreover, additional questions were
included and some of the weights have been redefined.
Signs and abbreviations.. Missing value or not available
x Not applicable
EUR Euros
USD US dollars
p.p. Percentage points
GOVERNMENT AT A GLANCE 2013 © OECD 201314

INTRODUCTION
Introduction
ObjectivesThe recent economic crisis has highlighted the role of governments as major actors in
modern societies. Governments are expected to set the conditions to generate economic
growth that will increase the well-being of their citizens, regulate the behaviour of business
and individuals in the name of the common good, redistribute income in order to promote
fairness, and deliver public goods and services to their populations, while being faced with
fiscal constraints and demographic pressures. The ability of governments to operate
effectively and efficiently depends in part on their management policies and practices in
diverse areas such as budgeting, human resources management, procurement, etc.
The main objective of the Government at a Glance series is to provide reliable
internationally comparative data on government activities and their results in OECD
member countries and beyond. In turn, these data can be used by countries to benchmark
their governments’ performance, track their own and international developments over
time, and provide evidence to their public policy making.
The indicators in Government at a Glance are becoming a measuring standard in many
fields of public governance. In addition to the core indicators that constitute the trademark
of the publication, this third edition includes a selection of new indicators and additional
data sources, allowing for a more complete picture of public administrations across OECD
member countries.
What’s new in Government at a Glance 2013?Compared with Government at a Glance 2011, the 2013 edition presents several new
features. To start with, it includes three new chapters: “Strategic governance” (Chapter 2),
which aggregates elements from previous versions but also includes new indicators on trust in
institutions, risk management and the rule of law; “Women in government” (Chapter 6), which
analyses the participation of women in all areas of government, public administration, the
judiciary and parliament; and “Special feature – Serving citizens: Accessibility and quality of
public services” (Chapter 9), which is built on a new quality framework that contains the key
dimensions of service quality (access, responsiveness, reliability and satisfaction). Some key
features of these quality dimensions are measured for the policy sectors of education, health
care, justice and tax administration.
Data on public finances are presented for 2001, 2009 and 2011 showcasing years prior,
during and after the economic crisis. New indicators on debt, fiscal balance and investment
are presented by sub-levels of government, as a way of deepening the understanding of the
fiscal structure in member countries and the responsibility of states and municipalities.
GOVERNMENT AT A GLANCE 2013 © OECD 2013 15
INTRODUCTION
The Budget Practices and Procedures, Performance Budgeting, Public Procurement and
Compensation surveys were administered in 2012 allowing for the inclusion of a renewed
set of indicators on these topics. The updated versions of the surveys collected more
detailed and better quality information. For example, in the Compensation survey, data for
key service delivery occupations have been collected for the first time, allowing
comparison across OECD member countries of compensation levels and structures for
police inspectors and detectives, police officers, immigration officers, customs inspectors
and tax inspectors. As a special feature to this edition, an indicator on Information and
Communication Technologies (ICT) expenditures is included.
Definition of governmentData on public finances are based on the definition of the sector “general government”
found in the System of National Accounts (SNA). Accordingly, general government comprises
ministries/departments, agencies, offices and some non-profit institutions at the central,
state and local level, as well as social security funds. Data on revenues and expenditures
are presented for both central and sub-central (state and local) levels of government and
(where applicable) for social security funds. However, data on employment refer to the
public sector which includes general government and public corporations, such as publicly
owned banks, harbours and airports. Finally, data on public management practices and
processes refer to those practices and processes at the central level of government only.
FrameworkGovernment at a Glance covers more than the 34 OECD member countries. It contains
data, where available, on accession countries – e.g. the Russian Federation – as well as other
major economies in the world such as China, India, Indonesia and South Africa. For some
indicators, data from participant countries to the Public Governance Committee (Brazil,
Egypt, South Africa and Ukraine) have been included. These countries play a significant and
increasing role in the world economy and in international political structures.
This third edition of Government at a Glance includes contextual, input, process, output
and outcome indicators. The 2013 edition contains a broader set of indicators on key
aspects of governmental performance related to outputs and outcomes in selected sectors,
including for the first time the justice sector and dimensions of the quality of public
services in health care, education, justice and tax administration. Figure 0.1 presents the
conceptual framework for Government at a Glance.
Inputs
Inputs refer to the resources used by governments in their production function, as well
as the way in which they are mixed; these resources correspond to labour and capital.
The chapters that describe these inputs are “Public finance and economics”, “Public sector
employment and pay”, and “Women in government”. They include indicators on government
expenditures, production costs, employment and work-force characteristics. Differentiating
these indicators can make it easier to understand different capacities of governments in
producing public goods and delivering them to citizens.
Processes
Processes refer to the public management practices and procedures undertaken by
governments to implement policies. They directly address the means used by public
administrations to fulfil their duties and obtain their goals. In consequence, they are often
GOVERNMENT AT A GLANCE 2013 © OECD 201316

INTRODUCTION
essential for ensuring the rule of law, accountability and fairness, as well as openness of
government actions. Public sector reforms are usually targeted towards the improvement
of processes; as such, they capture most of the attention of the public. This edition includes
information on budgeting practices and procedures, public procurement, and open and
inclusive government.
Outputs and outcomes
The dividing line between outputs and outcomes can be blurry; while outputs refer to
the amount of goods and services produced by governments, outcomes show the effects of
policies and practices on citizens and businesses. The success of a given policy should be
measured, at a first stage, by outputs but should ultimately be judged by the outcomes it
achieves. This edition has made an effort to incorporate an increasing number of
indicators on outputs and outcomes. Aware of the difficulties in measuring outcomes, the
previously mentioned quality framework was developed as a tool to evaluate several
dimensions in place when governments deliver services to citizens. Examples of these
indicators can be found in the “Special feature – Serving citizens: Accessibility and quality
of public services” (Chapter 9).
Figure 0.1. Conceptual framework for Government at a Glance 2013
Outputs and outcomesWhat goods and services does government produce? What is the resulting impact on citizens and businesses?
Strategic governance (Chapter 2)
Serving citizens(Chapter 9)
ProcessesHow does government work? What does government do and how does it do it?
Budgeting practices and procedures(Chapter 4)
Public procurement(Chapter 7)
Open and inclusive government (Chapter 8)
InputsWhat is the size and role of government? How much revenue does government collect?
How much and what kind of resources does government use?
Public finance and economics(Chapter 3)
Public sector employment and pay(Chapter 5)
Women in government (Chapter 6)
Contextual factors and country notesWhat is the social, political and economic context in which government operates?
Contextual factors (online) and Country fact sheets (online)
GOVERNMENT AT A GLANCE 2013 © OECD 2013 17
INTRODUCTION
StructureGovernment at a Glance 2013 is structured as follows: it starts with a policy chapter that
focuses on trust in government, the current situation concerning trust in government and
the upcoming challenges faced by OECD member countries.
Chapters 2-9 include data on the following areas of public administration: “Strategic
governance”, “Public finance and economics”, “Budgeting practices and procedures”, “Public
sector employment and pay”, “Women in government”, “Public procurement”, “Open and
inclusive government”, and a special exploratory chapter called “Special feature – Serving
citizens: Accessibility and quality of public services”. These chapters highlight the need for
better evidence on the impact and usefulness of the various public management tools
adopted. The publication closes with a “Glossary” and several annexes on methodological
aspects.
Future challengesIn order to produce Government at Glance, the OECD works in close co-operation with
other organisations – including the International Labour Organization (ILO), The World
Justice Project, the European Commission for the Efficiency of Justice (CEPEJ), Gallup and
the European Commission – to provide a comprehensive view of what governments do and
how they do it, while avoiding duplication of data collection. Co-operation ensures the
comparability of data across the countries that are covered in the publication.
For future editions of the publication, the Government at a Glance team is planning to
work in the following areas:
● Mapping of public sector agencies and their characteristics.
● New data collection on regulatory management practices and their performance.
● Indicators on the structure, functions, powers, responsibilities and priorities of the
centre of government [the unit(s) that supports the collective work of the executive and
the prime minister or president].
● Possibly comparing private and public sector compensation levels and structures.
● New indicators on lobbying and political funding.
● A repeat of the survey on strategic human resources management practices.
GOVERNMENT AT A GLANCE 2013 © OECD 201318

Government at a Glance 2013
© OECD 2013
Chapter 1
Trust in government,policy effectiveness
and the governance agenda
The statistical data for Israel are supplied by and under the responsibility of the relevant Israeliauthorities. The use of such data by the OECD is without prejudice to the status of the Golan Heights,East Jerusalem and Israeli settlements in the West Bank under the terms of international law.
19
1. TRUST IN GOVERNMENT, POLICY EFFECTIVENESS AND THE GOVERNANCE AGENDA
IntroductionThe financial and economic crisis that started in 2008 led to a significant loss of trust in
government. By 2012, on average only four out of ten people in OECD member countriesexpressed confidence in their government. As governments search for a path to economicrecovery, the challenge they face is not only knowing what policies to choose, but also howto implement those policies. Yet, capacity to implement depends crucially on trust. Withouttrust in governments, markets and institutions, support for necessary reforms is difficult tomobilise, particularly where short-term sacrifices are involved and long-term gains might beless tangible. The sharp decline in trust in government is serving to underline that trust is anessential, yet often overlooked, ingredient in successful policy making.
A decline in trust can lead to lower rates of compliance with rules and regulations.Citizens and businesses can also become more risk-averse, delaying investment, innovationand employment decisions that are essential to regain competitiveness and jumpstartgrowth. Nurturing trust represents an investment in economic recovery and socialwell-being for the future. Trust is both an input to public sector reforms – necessary for theimplementation of reforms – and, at the same time, an outcome of reforms, as they influencepeople’s and organisations’ attitudes and decisions relevant for economic and socialwell-being. As a result, trust in government by citizens and businesses is essential for theeffective and efficient policy making both in good times and bad. Investing in trust should beconsidered as a new and central approach to restoring economic growth and reinforcingsocial cohesion, as well as a sign that governments are learning the lessons of the crisis.
The challenge of maintaining trust is complicated by a faster and more diversifiedflow of information across society, such as through civil society, the Internet and socialnetworks. Together these suggest a more complex environment for governments withrespect to maintaining the confidence of stakeholders. In this environment, good policydesign and economic recovery may not be sufficient to restore trust if citizens aresuspicious of the policy-making process and perceive the distribution of costs and benefitsas unfair. Understanding what drives trust in government is essential to build a virtuouscycle that is able to sustain economic growth and well-being in the medium term.
The objective of this chapter is to explore the links between trust in government andthe policies and institutions of public governance. It looks at how trust and specificallytrust in government can be defined, how it is measured and how it may influence citizens’attitudes and responses to public policies. Drawing on the available evidence, the chapterdiscusses what drives trust and identifies a number of ways to make policies more reliable,responsive, open, inclusive and fair. The analysis is a preliminary exploration of a subjectthat has been approached by governance experts, economists and sociologists from ratherdisparate angles in the past. Even though more research may be needed to build a commonperspective and stronger policy conclusions, trust in government already provides adifferent lens through which to look at public governance – a lens that pays much moreattention to people’s perceptions and how this influences their reaction to policy measuresand reforms. Understanding trust may thus make policy makers and analysts of publicgovernance more sensitive and responsive to the expectations of citizens.
GOVERNMENT AT A GLANCE 2013 © OECD 201320

1. TRUST IN GOVERNMENT, POLICY EFFECTIVENESS AND THE GOVERNANCE AGENDA
What do we mean by trust in government?Trust means holding a positive perception about the actions of an individual or an
organisation. It is a subjective phenomenon, reflected in the “eyes of the beholder” that
matters especially to the extent that it shapes behaviour. Trust in government represents
confidence of citizens in the actions of a “government to do what is right and perceived fair”
(Easton, 1965). It depends on the congruence between citizens’ preferences – their
interpretation of what is right and fair and what is unfair – and the perceived actual
functioning of government (Bouckaert and van de Walle, 2003). As citizens’ preferences are
diverse, they use a multitude of different criteria to evaluate government actions/performance.
What is considered right and fair by one individual may not be considered so by another. In
order to analyse what influences trust in government, the preferences of citizens need to be
compared to their perceptions of the functioning of government. As it is not the actual
performance of government but its perceived performance that matters for trust in
government, the drivers of perceptions besides governmental performance need to be
identified as well.
At a broad level, trust in government builds on two main components: 1) social trust,
that represents citizens’ confidence in their social community; and 2) political trust, when
citizens appraise government and its institutions. Political trust includes both macro-level
trust, which is diffuse and system based, and institution-based trust. Civic engagement in
the community and interpersonal trust have been shown to contribute to overall social
trust (Putnam, 2000). This relationship, however, is not mechanical and may be affected by
a number of contextual factors. For example, there are countries where people mistrust
each other – social trust is low –, and then rely on institutions to represent their interest
(Aghion et al., 2010).
Citizen expectations are key to their trust in government. As citizens become more
educated, their expectations of government performance rise. If citizens’ expectations rise
faster than the actual performance of governments, trust and satisfaction could decline.
These changes in expectations may explain more of the erosion of political support than
real government performance (Dalton, 2005) and may surprise policy makers that are
anchored in past diagnoses.
In addition, citizens’ trust towards government is influenced differently whether they
have a positive or negative experience with service delivery. A negative experience has a much
stronger impact on trust in government than a positive one. Targeting public policies
towards dissatisfied citizens will therefore have a stronger impact on trust in government
(Kampen et al., 2006).
Much of the analysis on citizens’ trust in government also applies to businesses and
even to the government’s own employees, but the formation of perceptions and the factors
that influence them may be different.
Why does trust in government matter?Trust in government has been identified as one of the most important foundations
upon which the legitimacy and sustainability of political systems are built. Trust is essential for
social cohesion and well-being as it affects governments ability to govern and enables them to
act without having to resort to coercion. Consequently, it is an efficient means of lowering
transaction costs in any social, economic and political relationship (Fukuyama, 1995). A
high level of trust in government might increase the efficiency and effectiveness of
government operations.
GOVERNMENT AT A GLANCE 2013 © OECD 2013 21

1. TRUST IN GOVERNMENT, POLICY EFFECTIVENESS AND THE GOVERNANCE AGENDA
Core levels of trust in government are necessary for the fair and effective functioning of
government institutions – such as adherence to the rule of law, or the delivery of basic public
services and the provision of infrastructure. The rule of law and independent judiciary are
particularly important as their proper functioning is a key driver of trust in government, as
established in several studies (Knack and Zak, 2003; Johnston, Krahn and Harrison, 2006;
Blind, 2007). As well-functioning government institutions matter for business investment
decisions, trust in them is a necessary ingredient to spur economic growth (Dasgupta,
2009; Algan and Cuha, 2013).
Trust in government institutions at the same time influences individual behaviour in
ways that could support desired policy outcomes. This may range from rather narrowly
defined policies and programmes (such as participation in vaccination campaigns) to
broader policy reforms (e.g. environmental regulation or pension reform). Trust is
important because many public programmes create the opportunity for free riding and
opportunistic behaviour. Trust could reduce the risk of such behaviour to the extent that
people are prepared to sacrifice some immediate benefits if they have positive
expectations of the longer-term outcome of public policies, either at a personal level
(pensions) or by contributing to the common good (redistribution of income through
taxation).
Trust in government may help governments to implement structural reforms with long term
benefits. Many reforms involve sacrificing short-term satisfaction for longer-term gains and
will require broader social and political consensus to be effective and sustainable. In a
high-trust environment, such reforms may not only be properly enacted and implemented,
but could be sustained long enough to bear their fruits. This extends the time frame for
policy decisions. In a low-trust climate, citizen will prioritise immediate, appropriable and
partial benefits, and will induce politicians to seek short-term and opportunistic gains
through free-riding and populist attitudes (Gyorffy, 2013).
Trust in government could improve compliance with rules and regulations and reduce the cost
of enforcement. Rules and regulations are never perfect or complete enough to eliminate
abuse. Their effectiveness depends on the extent to which people see them as fair and
legitimate enough to outweigh the benefits of non-compliance. This is particularly
important for regulations where the gap between the cost of compliance and personal
benefits is large and where control is more difficult. Taxation is an example of the first,
while traffic regulations are an example of the second. Trust in the regulator can lead to
higher voluntary compliance (Murphy, 2004).
Trust in government institutions could help to increase confidence in the economy by
facilitating economic decisions, such as on investment and consumption that foster
economic growth. Trust in institutions as well as interpersonal trust may reduce the
perception of risks linked to decisions ranging from the consumption of durables to job
mobility, worker hiring and investment. An increase in trust among people raises total
factor productivity, therefore fosters economic progress (Dasgupta, 2009). This, in turn,
supports economic growth and extends the planning horizon of economic agents,
increasing economic dynamism.
Trust in government seems to be especially critical in crisis situations, such as natural
disasters, economic crisis or political unrest which focuses attention on the core functions
of public governance. The capacity of governments to manage crises and to implement
successful exit strategies is often a condition for their survival and for their re-election. In
the aftermath of major disasters, lack of trust may hamper emergency and recovery
GOVERNMENT AT A GLANCE 2013 © OECD 201322
1. TRUST IN GOVERNMENT, POLICY EFFECTIVENESS AND THE GOVERNANCE AGENDA
procedures causing great harm to society and damaging government’s capacity to act.
Likewise, the current economic crisis may reveal dimensions of trust that were not evident
in the gradual evolution of countries in the years that preceded it.
Trust may run in different directions. It is not only trust of citizens and organisations in
government that matters for policy effectiveness; trust of government in citizens and
organisations and trust within government may shape policy design and its outcomes
(Bouckaert, 2012). How much citizens and businesses are trusted by government is reflected
in how government functions and how public services are organised as well as their
efficiency and effectiveness – e.g. the tax system, the use of self-regulation and
self-monitoring. In addition, citizens’ and businesses’ trust in government and governments’
trust in citizens and businesses feed off one another. An open and responsive government is
an enabling environment to reinforce trust between government and citizens in both
directions. Unfortunately, trust from and within government is considerably less documented
in the literature than trust in government.
While trust takes time to be established, it can be lost quickly. It is not sufficient to discuss
the impact of trust in government on the performance of government, the economy and
society, it is also necessary to describe what might happen if there is an increasing distrust
in government. This might lead to less willingness on the part of citizens (and businesses) to
obey the law, to make sacrifices during crises or to pay taxes. This could raise costs for
government – resulting in declining efficiency – or erode revenues. Declining trust in
government might also make it more difficult to attract and retain talent to work for
government institutions.
Measuring trust in governmentTrust is based on perceptions and its measurement is fraught with many challenges.
This is true at the national level, and even more so at the international level. As trust
represents a positive perception of government, it is measured by perception surveys,
asking citizens, businesses or experts whether they trust (or have confidence) in
government, leadership, and/or specific government institutions (e.g. local authorities or
the justice system). Questions are often asked also about their satisfaction with public
services, such as the local police, education or health care, although they represent a
somewhat different concept than trust.
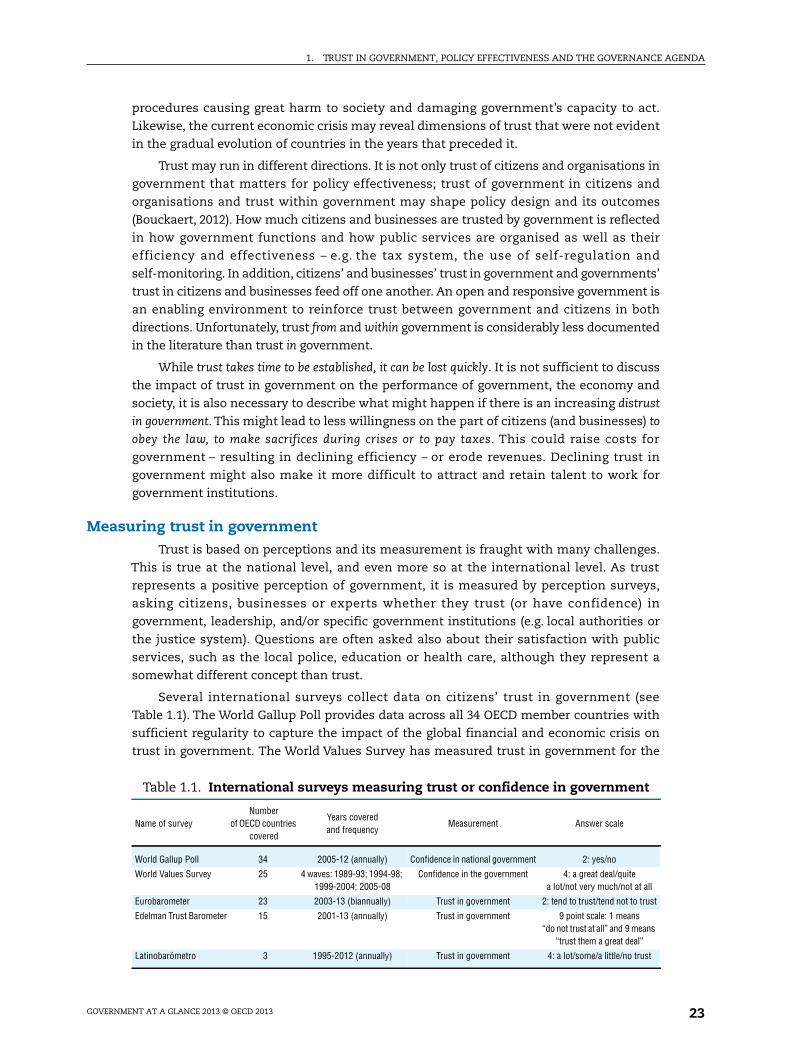
Several international surveys collect data on citizens’ trust in government (see
Table 1.1). The World Gallup Poll provides data across all 34 OECD member countries with
sufficient regularity to capture the impact of the global financial and economic crisis on
trust in government. The World Values Survey has measured trust in government for the
Table 1.1. International surveys measuring trust or confidence in government
Name of surveyNumber
of OECD countriescovered
Years coveredand frequency
Measurement Answer scale
World Gallup Poll 34 2005-12 (annually) Confidence in national government 2: yes/no
World Values Survey 25 4 waves: 1989-93; 1994-98;1999-2004; 2005-08
Confidence in the government 4: a great deal/quitea lot/not very much/not at all
Eurobarometer 23 2003-13 (biannually) Trust in government 2: tend to trust/tend not to trust
Edelman Trust Barometer 15 2001-13 (annually) Trust in government 9 point scale: 1 means“do not trust at all” and 9 means
“trust them a great deal”
Latinobarómetro 3 1995-2012 (annually) Trust in government 4: a lot/some/a little/no trust
GOVERNMENT AT A GLANCE 2013 © OECD 2013 23
1. TRUST IN GOVERNMENT, POLICY EFFECTIVENESS AND THE GOVERNANCE AGENDA
longest period of time, but the dataset is fragmented, and data is only available for multiple
year periods, the latest wave being 2005-07. The European Union’s Eurobarometer provides
the most consistent dataset (including biannual data points) but unfortunately covers only
23 OECD member countries. The Edelman Trust barometer provides time series only for a
restricted sample of the population (sampling criteria includes college educated and
household income in the top quartile).
As international surveys were designed to offer cross country comparisons, their
questions measuring trust in government are subject to ambiguity and they are often
restricted down to the respondent’s interpretation as no definition of the term government
is usually provided. The international surveys apply similar methodologies in terms of
sampling, but diverge in terms of question formulation (e.g. nuances between a question
on confidence and a question on trust in government, different response scales) and also in
terms of other measures of trust that could provide comparators (e.g. trust in national
parliament, financial institutions, politicians, civil servants, international organisations,
public services such as health care and education, businesses, religious institutions).
The limitations of international surveys make it difficult to gain a thorough
understanding of how citizens’ trust in government is evolving over time and what
influences levels of trust in government across OECD countries and beyond. The incidence
of cultural factors on how people approach public institutions makes pure cross country
comparisons of trust in government especially challenging. Perhaps most importantly for
the purpose of this analysis, the existing surveys were not designed to support policy
analysis or lead to policy recommendations.
Although national surveys measuring trust in government cannot be used in a cross
country comparative exercise, they better support policy analysis for many reasons.
Compared to international surveys, they provide greater insight into the drivers of trust
and can be corrected for election cycles. For example, the Barometer of Citizen Confidence
conducted by Metroscopia in Spain publishes data on a monthly basis that allows
government satisfaction to be compared with the perception of the economy. National
surveys also cover trust across the public spectrum more in depth. For example, IPSOS Mori
in the United Kingdom publishes twice a year trends of trust across public institutions
(e.g. different levels of government, parliament), public services, economic policies
(e.g. economic growth, unemployment, inflation, purchasing power), political parties and
political representatives (leaders in the executive, politicians, members of parliament), and
perceptions of corruption in government. National surveys can also provide measures of
trust on existing policies. For example, IFOP in France asks citizens whether they trust their
government to meet specific policy targets announced when they took office. National
surveys also usually have much longer time series, for example the PEW Research Center
in the United States provides trust in government data since the late 1950s.
The discussion above suggests that more could be done to increase comparability of data
on citizens’ trust from perception surveys and support policy discussion. First, surveys may be
made more representative. Current surveys work with small sample sizes and are seldom
representative geographically inside a country. Additional respondents’ characteristics – such
as their age, gender, race, educational level, marital status, income level, whether they have
used a government service or not, etc. – influence their perception of government so it would
be worthwhile that the sample reflect these as well. Second, survey questions could be
improved. Key terms need to be defined precisely: e.g. in the GallupWorld Poll, respondents are
asked about how much confidence they have in national government, without any explanation
of what is meant by that. Respondents might equate government with political leadership or
GOVERNMENT AT A GLANCE 2013 © OECD 201324

1. TRUST IN GOVERNMENT, POLICY EFFECTIVENESS AND THE GOVERNANCE AGENDA
or not?nd anderland
940740
0102030405060708090100%
the bureaucracy. Survey questions and the attached response categories need also to be
worded in ways that allow governments to act upon – e.g. change their behaviour – based on
the information gained. Lastly, collection of information at regular intervals will allow, in
addition to cross-country comparisons at one point in time, to detect changes over time and
trends both in individual countries and across countries.
Patterns and trends of trust in government in OECD countriesDespite the methodological difficulties in measuring trust in government, the
available data reveals some distinct patterns, trends and correlations that are revealing of
the state of trust in government in OECD countries and may assist policy makers in digging
deeper into the subject.
First, the most recent data available for OECD countries indicates that when citizens
are asked about their confidence in the national government, their answers differ
substantially across countries, with an average well below 50% (Figure 1.1). In other words,
when asked through surveys, less than half the citizens of OECD countries respond that
they have confidence in their national government. National averages rank between
almost 80% in Switzerland and 12% in Greece. The distribution within this range does not
appear to reflect standards of living, per capita GDP levels or speed of growth. While Japan
and Korea – an upper income and fast growing country respectively – score below the OECD
average, Turkey, with a lower per capita GDP scores well above it. This suggests that trust
in government may not respond to long-term economic developments or absolute
standards of living as much as it does to cultural factors, evolving expectations and
political developments. This conclusion is reinforced by the available evidence for some
emerging countries, which underscores the influence of expectations on government
action of citizens on government on their levels of trust (Box 1.1).
Figure 1.1. Confidence in national government in 2012 and its change since 2007Arranged in descending order according to percentage point change between 2007 and 2012
Note: Data refer to percentage of “yes” answers to the question: “In this country, do you have confidence in each of the following,How about national government?” Data for Chile, Germany and the United Kingdom are for 2011 rather than 2012. Data for IcelaLuxembourg are for 2008 rather than 2007. Data for Austria, Finland, Ireland, Norway, Portugal, the Slovak Republic, Slovenia, Switzare for 2006 rather than 2007.Source: Gallup World Poll.
1 2 http://dx.doi.org/10.1787/888932
-40-30-20-10
0102030405060708090
100
Percentage point change 2007-12 (left axis) % in 2012 (right axis)
Slovak
Rep
ublic
Switzerl
andIsr
ael
United
Kingdo
mFra
nce
Poland
German
y
Sweden
Icelan
d
New Ze
aland
Korea Ita
ly
Norway
Turke
y
Hunga
ry
United
States
OECD
Denmark
Japa
n
Luxe
mbour
g
Mexico
Netherl
ands
Czech
Rep
ublic
Austra
liaChil
e
Austri
a
Canad
aSpa
in
Eston
ia
Belgium
Finlan
d
Portug
al
Sloven
ia
Greece
Irelan
d
Percentage points
GOVERNMENT AT A GLANCE 2013 © OECD 2013 25

1. TRUST IN GOVERNMENT, POLICY EFFECTIVENESS AND THE GOVERNANCE AGENDA
Second, the evidence shows that the average level of trust in government in 2012 was
below its pre-crisis level in 2007 (lower panel in Figure 1.1). The share of respondents
expressing confidence in national government in 2012 is lower on average by five
percentage points (from 45% to 40%) than in 2007. This comparison masks much larger
variations at the country level, as more than two-thirds of OECD countries reported a loss
of confidence in government from 2007 to 2012. The larger drops in trust occurred in
countries facing either a political, fiscal or economic crisis, such as Greece, Slovenia,
Box 1.1. Confidence in national government in BRIICS countries (2012)
On average across BRIICS countries, a majority of citizens expressed confidence innational government (54%) in 2012. Confidence in national government was the highest inIndonesia and China (two-thirds of citizens) and the lowest in South Africa, Brazil and theRussian Federation (all within a range of 45-47%). Trust in government in all BRIICScountries was higher than the OECD average (40%). Over the 2007-12 period, confidence innational government decreased on average by three percentage points across the BRIICScountries (excluding China), which was less than across OECD member countries (fivepercentage point decrease on average). Confidence increased the most in Indonesia(15 percentage points) and decreased the most in India (27 percentage points). Higherlevels of confidence across BRIICS countries compared to most OECD member countriescan be due to cultural and context-specific factors, but can also be explained by differentexpectations that citizens have of government services and performance due to differentstages of socio-economic development. Nevertheless, there is an agreement amongresearchers that reaching the optimal level of trust is more important than reaching themaximum level of trust (Knack and Keefer, 1997; Nooteboom, 2006; Dasgputa, 2009;Bouckeart, 2012).
Confidence in national government in BRIICS countriesis higher than in OECD
Note: Data refer to percentage of “yes” answers to the question: “In this country, do you have confidence ineach of the following, or not? How about national government?”Source: Gallup World Poll.
1 2 http://dx.doi.org/10.1787/888932940740
0
10
20
30
40
50
60
70
80
90
100% 2012 2007
Indon
esia
China
India
South
Africa
Brazil
Russia
n Fed
eratio
nOEC
D
GOVERNMENT AT A GLANCE 2013 © OECD 201326

1. TRUST IN GOVERNMENT, POLICY EFFECTIVENESS AND THE GOVERNANCE AGENDA
Ireland, Spain, Belgium and Portugal. In other countries, however, confidence in
government increased, notably in the Slovak Republic, Israel, the United Kingdom, Poland,
France, Switzerland, Germany, and Sweden.
Third, trust in government is, on average, similar to trust on two key institutions of the
private sector: a) financial institutions and banks; and b) the media, but, again, with
significant variations across OECD countries. Overall across OECD countries financial
institutions and banks are trusted slightly more (43%) than government (40%) (see
Figure 1.2). In some countries, which were least affected by the 2008 financial crisis,
financial institutions and banks enjoy a high level of trust, such as Canada, Poland,
Finland, Norway, Mexico, Australia and Japan. Conversely, in some countries that were
most affected, trust in government tends to be relatively higher than in financial
institutions, such as in Ireland, Spain, and Italy.
Trust in the media was significantly higher than trust in government in Ireland, Spain
and Portugal in 2010 – the year for which data are available – while it was significantly
lower in Turkey, Sweden, the Netherlands and Luxembourg (see Figure 1.3). As countries in
the first group include the ones with the largest deterioration in trust in government in the
course of the crisis and the ones in the second are among the countries with highest and
most stable levels of trust, the comparison may be more revealing of the evolution of trust
in government than of trust in the media. The opposite may be happening in the
comparison between trust in government and trust in financial institutions, with the
dynamics of the latter dominating over the former.
Figure 1.2. Trust in financial institutions compared to governmentComparison of confidence in financial institutions/banks and government (2012)
Note: Confidence in national government data refer to percentage of “yes” answers to the question: “In this country,do you have confidence in each of the following, or not? How about national government?” Confidence in financialinstitutions and banks data refer to percentage of “yes” answers to the question: “In this country, do you haveconfidence in each of the following, or not? How about financial institutions or banks?” Data for Chile, Germany andthe United Kingdom are for 2010 rather than 2011. In the countries below the line, confidence in financial institutionsand banks is higher than confidence in government.Source: Gallup World Poll.
1 2 http://dx.doi.org/10.1787/888932940759
CHELUX
NORSWENZLFINNLD
DNKTUR CANGBR
BELFRA
AUSDEU
AUTSVKIRL
USA ISRESP MEXCHL
ITA EST POLISL SVN PRT
KORHUN CZE JPNGRC
0
10
20
30
40
50
60
70
80
90
100
0 10 20 30 40 50 60 70 80 90 100
Confidence in national government (%)
Confidence in financial institutions and banks (%)
OECD
GOVERNMENT AT A GLANCE 2013 © OECD 2013 27

1. TRUST IN GOVERNMENT, POLICY EFFECTIVENESS AND THE GOVERNANCE AGENDA
Drivers of trust in governmentTrust in government is multifaceted and based on a mix of economic, social and
political interactions between citizens and government. A broad empirical literature1
discusses the relationships between trust in government and economic, social and
governance parameters. It identifies four broad groups of drivers of trust in government:
1) culture; 2) institutional setting; 3) economic and social outcomes; and 4) performance of
institutions. While there is more or less a consensus on the range of drivers involved, the
evidence is conflicting on the magnitude of their influence and the depth of their reciprocal
relationship with trust. A general finding is that trust and most of its drivers are interlinked
and self-fulfilling, and therefore complementary in their relationship to public governance
and economic development.
Bouckaert (2012) argues that trust in government can be analysed at three levels. At
the macro-level, trust relates to political institutions and the functioning of democracy. At the
meso-level, trust relates to policy making – the ability of governments to manage economic
and social issues, and to generate positive expectations for future well-being. Finally, at the
micro-level, trust refers to the impact of government on people’s daily lives through service
delivery. Although distinct, these three levels interact and a significant lag in trust at one
level may affect trust at other levels and influence policy outcomes. Efforts to strengthen
trust therefore need to reinforce synergies across each of these different spheres.
Bouckaert’s taxonomy is especially useful for two reasons. First, because it suggests that
trust is not just something that happens to governments but something that governments
can influence through their actions and policies. Second, because it suggests that when it
comes to influencing trust, it is not only the what of public policies that matters, but also the
how, the for whom and the with whom. Consequently, not only the final results but the
processes used to get there are also important for the citizens and business.
Figure 1.3. Trust in the media and governmentComparison of confidence in national government and the media (2010)
Note: Confidence in national government data refer to percentage of “yes” answers to the question: “In this country,do you have confidence in each of the following, or not? How about national government?” Confidence in media datarefer to percentage of “yes” answers to the question: “In this country, do you have confidence in each of the following,or not? How about quality and integrity of the media?” Data for Iceland and Norway refer to 2008 rather than 2010.Data for Switzerland and Estonia refer to 2009 rather than 2010. In the countries below the line, confidence in themedia is higher than confidence in government.Source: Gallup World Poll.
1 2 http://dx.doi.org/10.1787/888932940778
0
10
20
30
40
50
60
70
80
90
100
0 10 20 30 40 50 60 70 80 90 100
LUX
NZLNLD
AUSSWE
DNK
CHE CANTUR
NORGBR AUT
CHLFINISRUSA
FRA
DEU MEX
BELCZEITA
POLIRL
SVNKOR
SVK ESPJPN
PRTHUN
ISLGRC
EST
Confidence in national government (%)
Confidence in the media (%)
OECD
GOVERNMENT AT A GLANCE 2013 © OECD 201328
1. TRUST IN GOVERNMENT, POLICY EFFECTIVENESS AND THE GOVERNANCE AGENDA
The public governance dimension – the institutional setting and its performance – of
trust may be better understood when this concept is broken down into a set of inter-related
process components that encapsulate what citizens expect from government. The OECD
has proposed the following components:
● Reliability: the ability of governments to minimise uncertainty in the economic, social and
political environment of their citizens, and to act in a consistent and predictable manner.
● Responsiveness: the provision of accessible, efficient and citizen-oriented public services
that effectively address the needs and expectations of the public.
● Openness and inclusiveness: a systemic, comprehensive approach to institutionalising a
two-way communication with stakeholders, whereby relevant, usable information is
provided, and interaction is fostered as a mean to improve transparency, accountability
and engagement.
● Integrity: the alignment of government and public institutions with broader principles
and standards of conduct that contribute to safeguarding the public interest while
preventing corruption.
● Fairness: in a procedural sense the consistent treatment of citizens (and businesses) in
the policy-making and policy-implementation processes.
In what follows, we use Bouckaert’s three-level framework to identify potential drivers of
trust in the governance domain and point at evidence from international surveys that is
suggestive of a statistical correlation. This is still a preliminary exercise that is far from
conclusive on causality relations, but one that could guide further research and discussion.
Macro-level
At the macro-level what matters for trust in government are political institutions and the
functioning of democracy. A crucial prerequisite of becoming a member of the OECD is to be
a democracy with well-developed political institutions.2
Regarding political institutions, at least in the European countries for which data are
available, citizens consistently express more trust in government than in political parties
(see Figure 1.4 and Figure 1.5). In 2013 among the European OECD member countries only
in one country – Denmark – do people trust government and political parties at a similar
level; in all other countries political parties are less trusted. Political parties are trusted the
least – below 10% of respondents – in the countries most affected by the fiscal crises,
e.g. Slovenia, Greece, Spain, Italy and Portugal. These are the same countries where trust in
government is also the lowest.
A basic tenet of democracy, beside free and fair elections, is the adherence to the rule
of law – which is both an outcome and a process measure – meaning that no one, including
government, is above the law, where laws protect fundamental rights, and justice is
accessible to all. This is reflected in a strong correlation between the confidence people
have in their national government and in the judicial system (see Figure 1.6). Confidence in
the judicial system represents both an outcome and a key governance dimension, most
closely related to integrity.
Another conventionally used proxy measure for trust in the political system is voters’
turn-out. However, there are competing hypotheses regarding the relationship between
voters’ turn-out and trust – the first one being that larger voter turn-out might reflect a
higher trust in the political system; while the competing one: lower trust in the incumbent
government might lead to higher propensity to vote in order to defeat it. However, the
correlation coefficient between trust in government and voters’ turn-out is negligible.
GOVERNMENT AT A GLANCE 2013 © OECD 2013 29
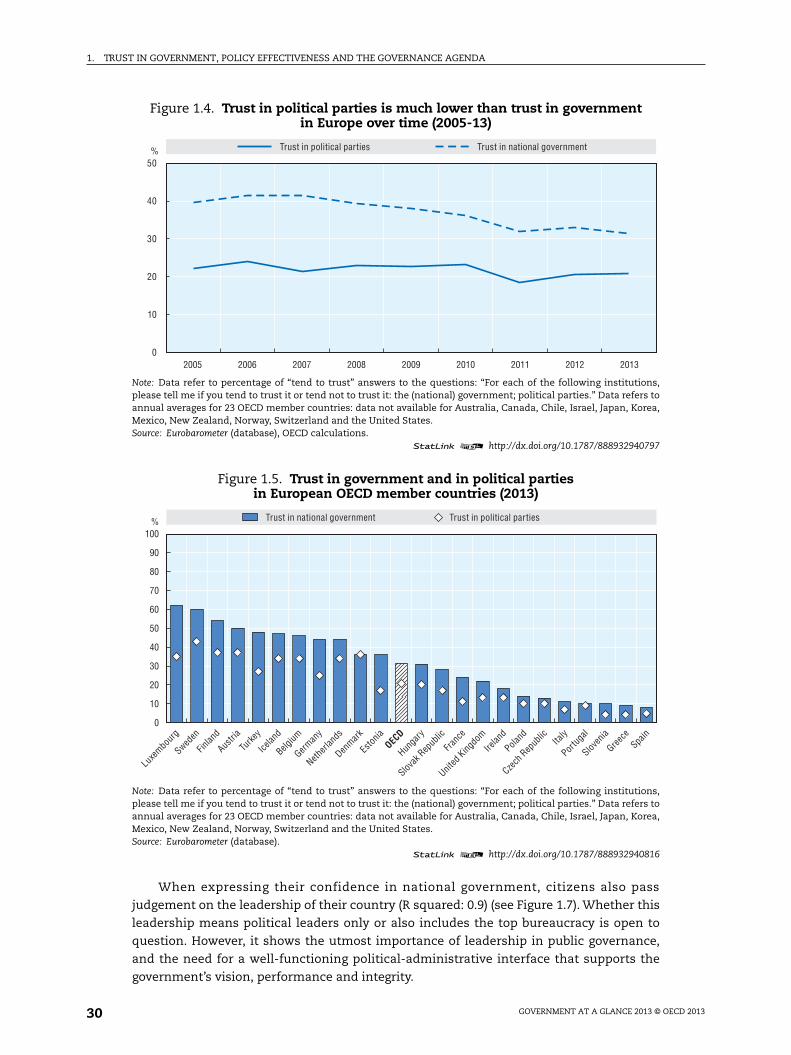
1. TRUST IN GOVERNMENT, POLICY EFFECTIVENESS AND THE GOVERNANCE AGENDA
When expressing their confidence in national government, citizens also pass
judgement on the leadership of their country (R squared: 0.9) (see Figure 1.7). Whether this
leadership means political leaders only or also includes the top bureaucracy is open to
question. However, it shows the utmost importance of leadership in public governance,
and the need for a well-functioning political-administrative interface that supports the
government’s vision, performance and integrity.
Figure 1.4. Trust in political parties is much lower than trust in governmentin Europe over time (2005-13)
Note: Data refer to percentage of “tend to trust” answers to the questions: “For each of the following institutions,please tell me if you tend to trust it or tend not to trust it: the (national) government; political parties.” Data refers toannual averages for 23 OECD member countries: data not available for Australia, Canada, Chile, Israel, Japan, Korea,Mexico, New Zealand, Norway, Switzerland and the United States.Source: Eurobarometer (database), OECD calculations.
1 2 http://dx.doi.org/10.1787/888932940797
Figure 1.5. Trust in government and in political partiesin European OECD member countries (2013)
Note: Data refer to percentage of “tend to trust” answers to the questions: “For each of the following institutions,please tell me if you tend to trust it or tend not to trust it: the (national) government; political parties.” Data refers toannual averages for 23 OECD member countries: data not available for Australia, Canada, Chile, Israel, Japan, Korea,Mexico, New Zealand, Norway, Switzerland and the United States.Source: Eurobarometer (database).
1 2 http://dx.doi.org/10.1787/888932940816
2005 2006 2007 2008 2009 2010 2011 2012 20130
10
20
30
40
50% Trust in national governmentTrust in political parties
0
10
20
30
40
50
60
70
80
90
100% Trust in political partiesTrust in national government
Luxe
mbourg
Sweden
Finlan
d
Austri
a
Turke
y
Icelan
d
Belgium
German
y
Netherl
ands
Denmark
Eston
iaOEC
D
Hunga
ry
Slovak
Rep
ublic
Franc
e
United
Kingdo
mIre
land
Poland
Czech
Rep
ublic Ita
ly
Portug
al
Sloven
ia
Greece
Spain
GOVERNMENT AT A GLANCE 2013 © OECD 201330
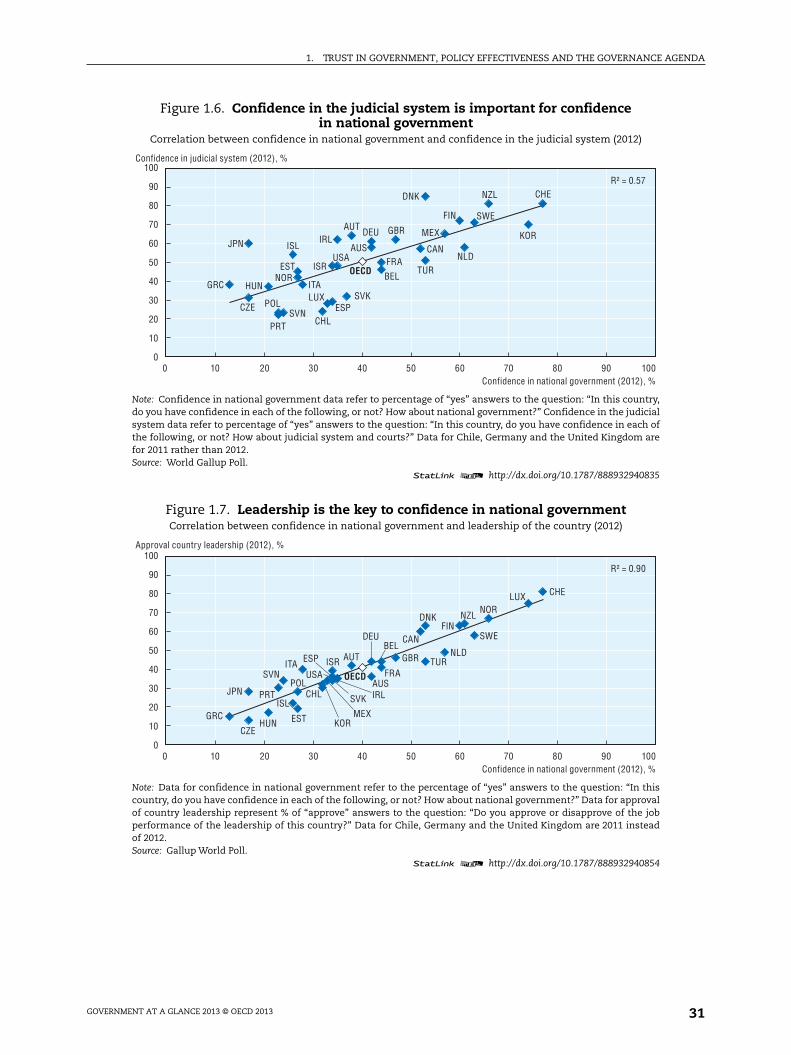
1. TRUST IN GOVERNMENT, POLICY EFFECTIVENESS AND THE GOVERNANCE AGENDA
Figure 1.6. Confidence in the judicial system is important for confidencein national government
Correlation between confidence in national government and confidence in the judicial system (2012)
Note: Confidence in national government data refer to percentage of “yes” answers to the question: “In this country,do you have confidence in each of the following, or not? How about national government?” Confidence in the judicialsystem data refer to percentage of “yes” answers to the question: “In this country, do you have confidence in each ofthe following, or not? How about judicial system and courts?” Data for Chile, Germany and the United Kingdom arefor 2011 rather than 2012.Source: World Gallup Poll.
1 2 http://dx.doi.org/10.1787/888932940835
Figure 1.7. Leadership is the key to confidence in national governmentCorrelation between confidence in national government and leadership of the country (2012)
Note: Data for confidence in national government refer to the percentage of “yes” answers to the question: “In thiscountry, do you have confidence in each of the following, or not? How about national government?” Data for approvalof country leadership represent % of “approve” answers to the question: “Do you approve or disapprove of the jobperformance of the leadership of this country?” Data for Chile, Germany and the United Kingdom are 2011 insteadof 2012.Source: Gallup World Poll.
1 2 http://dx.doi.org/10.1787/888932940854
0
10
20
30
40
50
60
70
80
90
100
0 10 20 30 40 50 60 70 80 90 100
AUS
AUT
BEL
CAN
CHLCZE
DNK
EST
FIN
FRA
DEU
GRC HUN
ISLIRL
ISR
ITA
JPNKOR
LUX
MEX
NLD
NZL
NOR
POL
PRT
SVK
SVN ESP
SWE
CHE
TUR
GBR
USA
R² = 0.57
Confidence in judicial system (2012), %
Confidence in national government (2012), %
OECD
0
10
20
30
40
50
60
70
80
90
100
0 10 20 30 40 50 60 70 80 90 100
R² = 0.90
AUS
AUTBEL
CAN
CHL
CZE
DNK
EST
FIN
FRA
DEU
GRCHUN
ISLIRL
ISRITA
JPN
KOR
LUX
MEX
NLD
NZLNOR
POLPRT SVK
SVN
ESP
SWE
CHE
TURGBR
USA
Approval country leadership (2012), %
Confidence in national government (2012), %
OECD
GOVERNMENT AT A GLANCE 2013 © OECD 2013 31
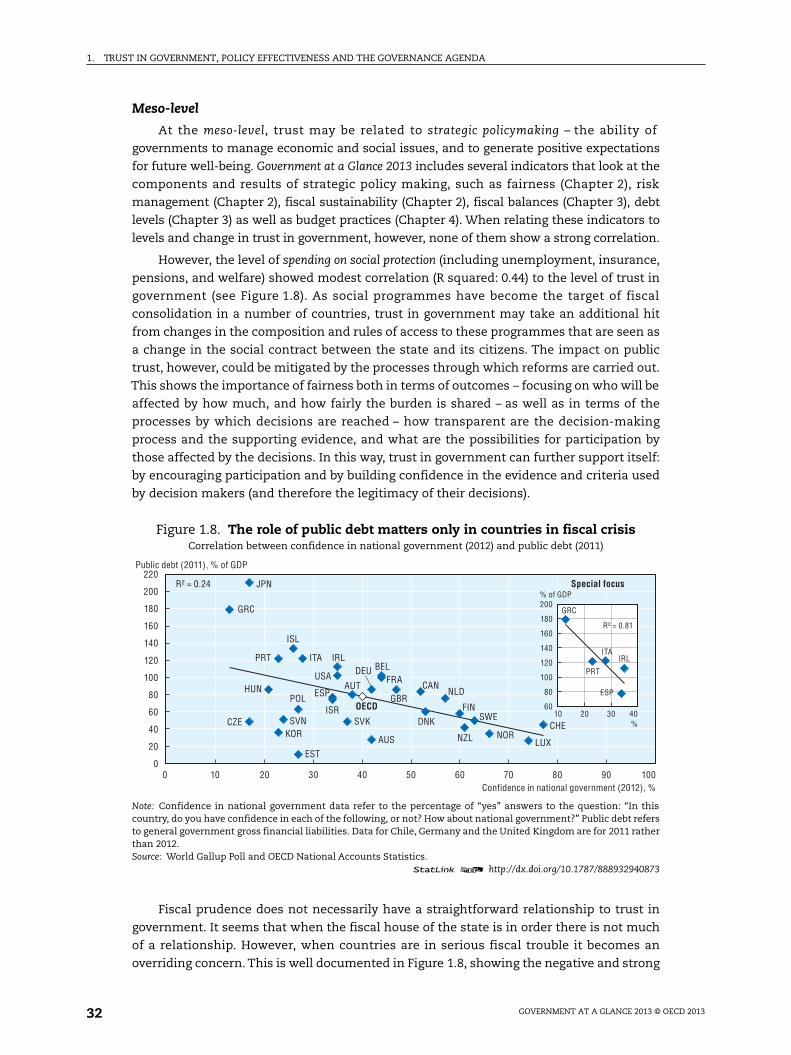
1. TRUST IN GOVERNMENT, POLICY EFFECTIVENESS AND THE GOVERNANCE AGENDA
Meso-level
At the meso-level, trust may be related to strategic policymaking – the ability of
governments to manage economic and social issues, and to generate positive expectations
for future well-being. Government at a Glance 2013 includes several indicators that look at the
components and results of strategic policy making, such as fairness (Chapter 2), risk
management (Chapter 2), fiscal sustainability (Chapter 2), fiscal balances (Chapter 3), debt
levels (Chapter 3) as well as budget practices (Chapter 4). When relating these indicators to
levels and change in trust in government, however, none of them show a strong correlation.
However, the level of spending on social protection (including unemployment, insurance,
pensions, and welfare) showed modest correlation (R squared: 0.44) to the level of trust in
government (see Figure 1.8). As social programmes have become the target of fiscal
consolidation in a number of countries, trust in government may take an additional hit
from changes in the composition and rules of access to these programmes that are seen as
a change in the social contract between the state and its citizens. The impact on public
trust, however, could be mitigated by the processes through which reforms are carried out.
This shows the importance of fairness both in terms of outcomes – focusing on who will be
affected by how much, and how fairly the burden is shared – as well as in terms of the
processes by which decisions are reached – how transparent are the decision-making
process and the supporting evidence, and what are the possibilities for participation by
those affected by the decisions. In this way, trust in government can further support itself:
by encouraging participation and by building confidence in the evidence and criteria used
by decision makers (and therefore the legitimacy of their decisions).
Fiscal prudence does not necessarily have a straightforward relationship to trust in
government. It seems that when the fiscal house of the state is in order there is not much
of a relationship. However, when countries are in serious fiscal trouble it becomes an
overriding concern. This is well documented in Figure 1.8, showing the negative and strong
Figure 1.8. The role of public debt matters only in countries in fiscal crisisCorrelation between confidence in national government (2012) and public debt (2011)
Note: Confidence in national government data refer to the percentage of “yes” answers to the question: “In thiscountry, do you have confidence in each of the following, or not? How about national government?” Public debt refersto general government gross financial liabilities. Data for Chile, Germany and the United Kingdom are for 2011 ratherthan 2012.Source: World Gallup Poll and OECD National Accounts Statistics.
1 2 http://dx.doi.org/10.1787/888932940873
0
20
40
60
80
100
120
140
160
180
220
200
0 10 20 30 40 50 60 70 80 90 100
R² = 0.24
AUS
AUT
BEL
CAN
CZE DNK
EST
FIN
FRADEU
GRC
HUN
ISL
IRL
ISR
ITA
JPN
KORLUX
NLD
NZL NOR
POL
PRT
SVKSVN
ESP
SWECHE
GBR
USA
10 20 30 40%
60
80
100
120
140
160
180
200% of GDP
PRT
IRLITA
GRC
ESP
R² = 0.81
Public debt (2011), % of GDP
Confidence in national government (2012), %
OECD
Special focus
GOVERNMENT AT A GLANCE 2013 © OECD 201332
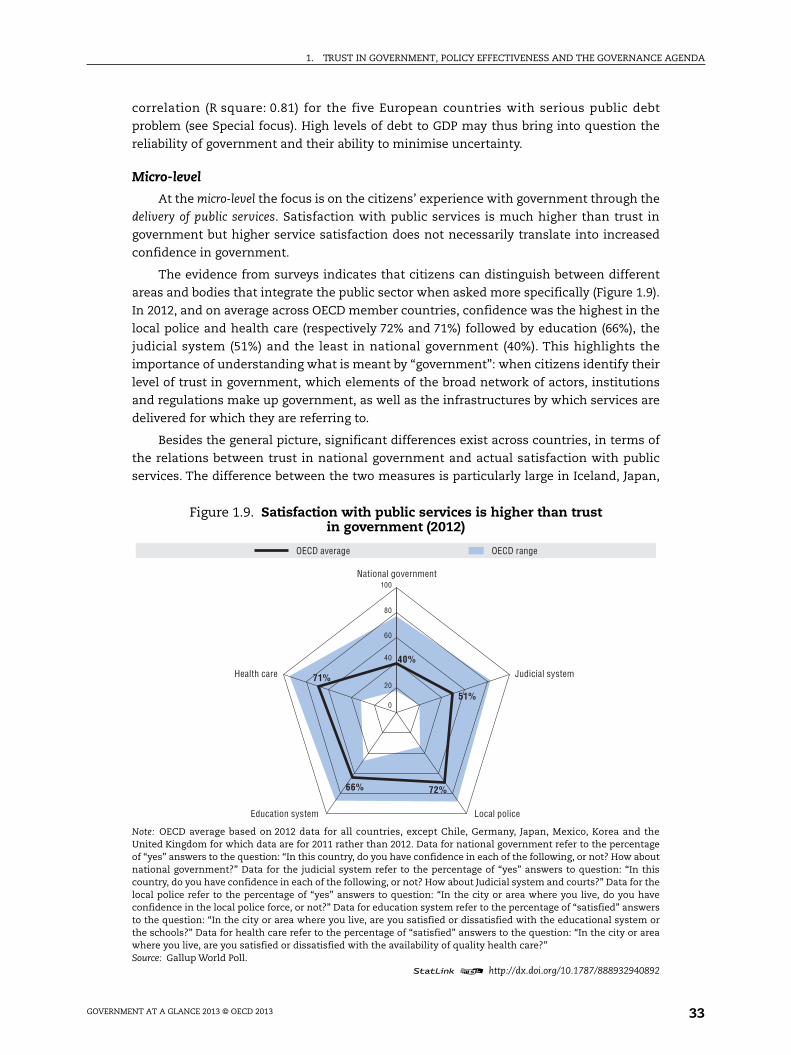
1. TRUST IN GOVERNMENT, POLICY EFFECTIVENESS AND THE GOVERNANCE AGENDA
correlation (R square: 0.81) for the five European countries with serious public debt
problem (see Special focus). High levels of debt to GDP may thus bring into question the
reliability of government and their ability to minimise uncertainty.
Micro-level
At the micro-level the focus is on the citizens’ experience with government through the
delivery of public services. Satisfaction with public services is much higher than trust in
government but higher service satisfaction does not necessarily translate into increased
confidence in government.
The evidence from surveys indicates that citizens can distinguish between different
areas and bodies that integrate the public sector when asked more specifically (Figure 1.9).
In 2012, and on average across OECD member countries, confidence was the highest in the
local police and health care (respectively 72% and 71%) followed by education (66%), the
judicial system (51%) and the least in national government (40%). This highlights the
importance of understanding what is meant by “government”: when citizens identify their
level of trust in government, which elements of the broad network of actors, institutions
and regulations make up government, as well as the infrastructures by which services are
delivered for which they are referring to.
Besides the general picture, significant differences exist across countries, in terms of
the relations between trust in national government and actual satisfaction with public
services. The difference between the two measures is particularly large in Iceland, Japan,
Figure 1.9. Satisfaction with public services is higher than trustin government (2012)
Note: OECD average based on 2012 data for all countries, except Chile, Germany, Japan, Mexico, Korea and theUnited Kingdom for which data are for 2011 rather than 2012. Data for national government refer to the percentageof “yes” answers to the question: “In this country, do you have confidence in each of the following, or not? How aboutnational government?” Data for the judicial system refer to the percentage of “yes” answers to question: “In thiscountry, do you have confidence in each of the following, or not? How about Judicial system and courts?” Data for thelocal police refer to the percentage of “yes” answers to question: “In the city or area where you live, do you haveconfidence in the local police force, or not?” Data for education system refer to the percentage of “satisfied” answersto the question: “In the city or area where you live, are you satisfied or dissatisfied with the educational system orthe schools?” Data for health care refer to the percentage of “satisfied” answers to the question: “In the city or areawhere you live, are you satisfied or dissatisfied with the availability of quality health care?”Source: Gallup World Poll.
1 2 http://dx.doi.org/10.1787/888932940892
100
0
20
40
60
80
40%
51%
72%66%
71%
OECD rangeOECD average
National government
Judicial system
Local policeEducation system
Health care
GOVERNMENT AT A GLANCE 2013 © OECD 2013 33
1. TRUST IN GOVERNMENT, POLICY EFFECTIVENESS AND THE GOVERNANCE AGENDA
Slovenia, the Czech Republic where satisfaction with public services is high, whilst in
Switzerland, Luxembourg and Turkey confidence in national government and satisfaction
with public services are very close to each other. This reinforces the view that current
answers to questions on the confidence in the national government as displayed through
the available data may capture more short-term perceptions on the political system in
some countries than on the government and the public administrations as institutions.
Trust tends to be highest at the local level, where services are delivered and where the
link with government performance is most concrete. Trust also tends to be higher for actual
users of public services than for the non-users. An exploration of the variations of trust
across levels of governments and across different types of public institutions would provide
some clues on the factors that shape public perceptions of government and on the different
policy levers that can improve the perception of those areas of public administration.
Chapter 9 on the quality of public services is based on a general framework on service
quality (Table 1.2). The chapter is built on existing service quality indicators presented by
key dimensions of quality: access, timeliness, reliability and service satisfaction. In
addition, data on the take-up of online government services are also presented, given the
increased reliance of governments, businesses and citizens on them. These service quality
dimensions overlap with some of the key governance dimensions that matter for citizens,
such as inclusiveness (access), responsiveness and reliability. As there are many facets of
these key dimensions of quality, as a first attempt, one facet is presented for each of the
four policy areas when data are available: affordability, timeliness, accuracy and reported
satisfaction with services.
Integrity: A cross cutting issue
Integrity seems to be essential to trust in government, as the correlation between
perception of corruption and trust in government is high (see Figure 1.10). Integrity tools and
mechanisms, that are essential public governance processes, are aimed at preventing
corruption (which is the outcome) and fostering high standards of behaviour, helping to
reinforce the credibility and legitimacy of the actors involved in policy decision making,
safeguarding the public interest and restoring a sense of fairness of policy decisions. Policy
tools addressing high-risk areas at the intersection of the public and private sectors – including
effective management of conflict of interests, high standards of behaviour in the public sector
and adequate lobbying and political finance regulation – can be leveraged to limit undue
influence and build safeguards to protect the public interest.
Table 1.2. The service quality framework
Access Responsiveness Reliability Satisfaction
Affordability Timeliness Accuracy/competence/customer rights(possibilities to file complaints,suggestions, receive supportand/or compensation
Reported satisfaction(perception)
Geographic proximity “Match” of service to needs Tangible function (facilities,machines, etc.)
Reported confidence/trust(perception)
Adaptations for thosewith disabilities
Customer service(courtesy and treatment)
Consistency/fairness
Adaptations to different cultures(e.g. languages, etc.)
Integrated services(across delivery channels)
Security (confidentiality, safety)
Access to electronic services(digital divide)
GOVERNMENT AT A GLANCE 2013 © OECD 201334
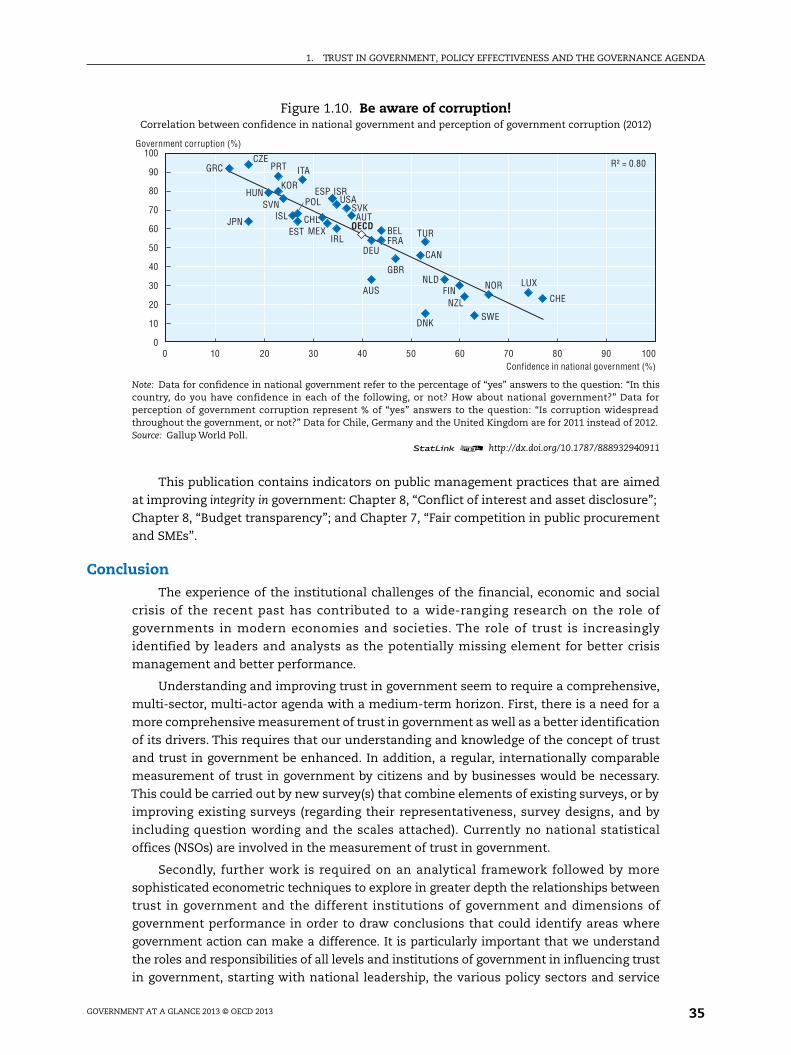
1. TRUST IN GOVERNMENT, POLICY EFFECTIVENESS AND THE GOVERNANCE AGENDA
This publication contains indicators on public management practices that are aimed
at improving integrity in government: Chapter 8, “Conflict of interest and asset disclosure”;
Chapter 8, “Budget transparency”; and Chapter 7, “Fair competition in public procurement
and SMEs”.
ConclusionThe experience of the institutional challenges of the financial, economic and social
crisis of the recent past has contributed to a wide-ranging research on the role of
governments in modern economies and societies. The role of trust is increasingly
identified by leaders and analysts as the potentially missing element for better crisis
management and better performance.
Understanding and improving trust in government seem to require a comprehensive,
multi-sector, multi-actor agenda with a medium-term horizon. First, there is a need for a
more comprehensive measurement of trust in government as well as a better identification
of its drivers. This requires that our understanding and knowledge of the concept of trust
and trust in government be enhanced. In addition, a regular, internationally comparable
measurement of trust in government by citizens and by businesses would be necessary.
This could be carried out by new survey(s) that combine elements of existing surveys, or by
improving existing surveys (regarding their representativeness, survey designs, and by
including question wording and the scales attached). Currently no national statistical
offices (NSOs) are involved in the measurement of trust in government.
Secondly, further work is required on an analytical framework followed by more
sophisticated econometric techniques to explore in greater depth the relationships between
trust in government and the different institutions of government and dimensions of
government performance in order to draw conclusions that could identify areas where
government action can make a difference. It is particularly important that we understand
the roles and responsibilities of all levels and institutions of government in influencing trust
in government, starting with national leadership, the various policy sectors and service
Figure 1.10. Be aware of corruption!Correlation between confidence in national government and perception of government corruption (2012)
Note: Data for confidence in national government refer to the percentage of “yes” answers to the question: “In thiscountry, do you have confidence in each of the following, or not? How about national government?” Data forperception of government corruption represent % of “yes” answers to the question: “Is corruption widespreadthroughout the government, or not?” Data for Chile, Germany and the United Kingdom are for 2011 instead of 2012.Source: Gallup World Poll.
1 2 http://dx.doi.org/10.1787/888932940911
0
10
20
30
40
50
60
70
80
90
100
0 10 20 30 40 50 60 70 80 90 100
AUS
AUTBEL
CAN
CHL
CZE
DNK
EST
FIN
FRADEU
GRC
HUN
ISL
IRL
ISR
ITA
JPN
KOR
LUX
MEX
NLD
NZL
NOR
POL
PRT
SVKSVNESP
SWE
CHE
TUR
GBR
USA
R² = 0.80
Government corruption (%)
Confidence in national government (%)
OECD
GOVERNMENT AT A GLANCE 2013 © OECD 2013 35

1. TRUST IN GOVERNMENT, POLICY EFFECTIVENESS AND THE GOVERNANCE AGENDA
delivery agents at local level of government in how decisions are made, transmitted and
implemented. The OECD could assist in developing international comparisons, and help
countries to exchange with each other in terms of strategies and actions that have succeeded
in rebuilding trust in government. A precursor to this work could be country specific case
studies carried out – among others – as part of the OECD’s Public Governance Reviews.
Most important of all, however, a renewed focus on trust in government can bring a new
perspective to public governance, enhancing the role of the citizens. At an institutional level,
this should reinforce the notion of a social contract between citizens and the state, where the
former contribute not only by paying taxes and obeying the law, but also by being receptive
to public policies and co-operating in their design and implementation. To gain this support
from citizens, however, governments need to be more inclusive, more transparent, more
receptive and more efficient. Recognising and better understanding the critical role that trust
plays in effective public policies should assist governments better shape their policy and
reform agendas, improving outcomes for all.
Notes
1. See GOV/PGC(2013)1 (www2.oecd.org/oecdinfo/info.aspx?app=OLIScoteEN&Ref=GOV/PGC(2013)1).
2. This publication (available on line in the “Country Contextual Factors Annex”) contains basicinformation on political institutions, as well as government structure for each member country.How those institutions function is captured by other indicators in the publication.
Bibliography
Aghion, P., Y. Algan, P. Cahuc and A. Shleifer (2010), “Regulation and distrust”, The Quarterly Journal ofEconomics, Vol. 125(3), Oxford, pp. 1015-1049.
Algan, Y. and P. Cahuc (2010), Handbook of Economic Growth, Vol. 1, North-Holland Publishing, Amsterdam.
Blind, P.K. (2007), “Building trust in government in the twenty-first century: Review of literature andemerging issues”, in 7th Global Forum on Reinventing Government Building Trust in Government, pp. 26-29.
Bouckaert, G. (2012), “Trust and Public Administration”, Administration, Vol. 60, No. 1, pp. 91-115.
Bouckaert, G. and S. van de Walle (2003), “Comparing measures of citizen trust and user satisfaction asindicators of ’good governance’: Difficulties in linking trust and satisfaction indicators”, InternationalReview of Administrative Sciences, Vol. 69(3), pp. 329-344.
Dalton, R.J. (2005), “The social transformation of Trust in Government”, International Review of Sociology,Vol. 15, No. 1, March, pp. 133-154.
Dasgupta, P. (2009), “A Matter of Trust: Social Capital and Economic Development”, prepared forpresentation at the Annual Bank Conference on Development Economics (ABCDE), Seoul, June.
Easton, D. (1965), A Systems Analysis of Political Life, John Wiley, New York.
Fukuyama, F. (1995), Trust: the Social Virtues and the Creation of Prosperity, Free Press, New York.
Gyorffy, D. (2013), Institutional Trust and Economic policy, Central European University Press, Budapest.
Johnston, W., H. Krahn and T. Harrison (2006), “Democracy, Political Institutions, and Trust: The Limitsof Current Electoral Reform Proposals”, The Canadian Journal of Sociology, Vol. 31.2, pp. 165-182.
Kampen, J.K., S.V. De Walle and G. Bouckaert (2006), “Assessing the relation between satisfaction withpublic service delivery and trust in government: The impact of the predisposition of citizenstoward government on evaluations of its performance”, Public Performance and Management Review,Vol. 29(4), pp. 387-404.
Knack, S. and P.J. Zak (2003), “Building trust: Public policy, interpersonal trust, and economicdevelopment”, Supreme Court Economic Review, No. 10, pp. 91-107.
Knack, S. and P. Keefer (1997), “Does social capital have an economic payoff? A cross countryinvestigation”, The Quarterly Journal of Economics, Vol. 112(4), Oxford, pp. 1251-1288.
GOVERNMENT AT A GLANCE 2013 © OECD 201336
1. TRUST IN GOVERNMENT, POLICY EFFECTIVENESS AND THE GOVERNANCE AGENDA
Murphy, K. (2004), “The role of trust in nurturing compliance: A study of accused tax avoiders”, Law andHuman Behavior, Vol. 28(2), pp. 187-209.
Nooteboom, B. (2006), Social Capital, Institutions and Trust, Tilburg University.
Putnam, R. (2000), Bowling Alone: The Collapse and Revival of American Community, Simon and Schuster,New York.
International surveys measuring trust or confidence in government: Weblinks
World Gallup Poll: www.gallup.com/strategicconsulting/en-us/worldpoll.aspx.
World Values Survey: www.worldvaluessurvey.org.
Eurobarometer: www.ec.europa.eu/public_opinion/index_en.htm.
Edelman Trust Barometer: www.edelman.com/insights/intellectual-property/trust-2013.
Latinóbarometro: www.latinobarometro.org.
GOVERNMENT AT A GLANCE 2013 © OECD 2013 37


GOVERNMENT AT A GLANCE 2013 © OEC
2. STRATEGIC GOVERNANCE
This chapter contains key strategic outcome indicators for governments. Some of theseindicators relate to the performance of selected policy sectors and government activities (suchas efficiency and effectiveness measures for the health care, education and justice sectors aswell as for tax administration), based on conventions developed for their measurement bythose policy communities. Others represent the performance of the “whole of government”,such as the indicators on the rule of law, risk management or fiscal sustainability. Someindicators also reflect key good governance principles, such as the rule of law and fairnessthrough the lens of the role of government in reducing income inequalities, as well as efficiencyand effectiveness. Most indicators focus on a short time span (values are shown for a few,selected years), while fiscal sustainability projects the fiscal position of a governmentuntil 2030. The diversity of these indicators shows the varied expectations citizens andbusinesses have of governments, as well as the wide-ranging responsibilities governmentscarry out. All of these indicators are strategic: they are important to the well-being of societiesand economies. Many of them reflect performance of government functions that cannot becarried out by other actors, e.g. rule of law, risk management.
D 2013 39
2. STRATEGIC GOVERNANCE
Trust in government
Trust in government represents the confidence of citizensand businesses in the actions of government to do what isright and perceived as fair. It is one of the most importantfoundations upon which the legitimacy and sustainabilityof political systems are built. Trust in government is essen-tial for social cohesion and well-being as it affects thegovernment’s ability to govern and enables government toact without coercion. Consequently, it is necessary for thefair and effective functioning of public institutions.
Trust in government and its institutions also depends on thecongruence between citizens’ and businesses’ preferences,their interpretation of what is right and fair and what isunfair, and the perceived performance of government. As aresult, trust in government is very much culturally definedand context dependent. There are high-trust countries, suchas Switzerland, Luxembourg, Norway and Sweden andlow-trust countries, such as the eastern European countries(Figure 2.1), and the level of trust in government could beaffected by many contextual factors, such as the economicenvironment, natural disasters or the extent of corruption.
Trust in government is measured primarily by perceptionsurveys. Due to the impact of cultural and other contextualfactors, comparison across countries needs to be interpretedwith great care. Instead of focusing on absolute levels oftrust in government, changes in trust levels over time canprovide better insight. From 2007 to 2012, confidence innational governments on average across OECD membercountries has declined by 5 percentage points from 45%to 40%. The largest decline was experienced in Slovenia,Portugal, Greece and Ireland – countries severely affected bythe financial, economic and fiscal crisis. At the same time inthe Slovak Republic, Switzerland, Israel, the United Kingdomand France, trust in government increased during thisperiod. Further analysis indicates that when people areasked about their confidence in the national government,they are evaluating political leadership.
Government is also the provider of key public services sucheducation, health care, public safety and judicial services.The provision of these services in most OECD membercountries is the main responsibility of local government,except the judiciary, which is independent. Citizenshave higher confidence in – or satisfaction with – thesepublic services than in the abstract notion of the national
government (Figure 2.2). In 2012 on average across OECDmember countries, confidence/satisfaction was highestwith police (72% of respondents expressing confidence inthe police) followed very closely by health care (71%),education (66%) and, finally, the judicial system (50%).
Further reading
OECD (forthcoming), Trust in government, assessing the evidence,understanding the policies, OECD Publishing, Paris.
Figure notes
Data for Chile, Germany and the United Kingdom are for 2011 ratherthan 2012. Data for Iceland and Luxembourg are for 2008 ratherthan 2007. Data for Austria, Finland, Ireland, Norway, Portugal, theSlovak Republic, Slovenia and Switzerland are for 2006 ratherthan 2007.
2.1: Data refer to the percentage who answered “yes” to the question:“Do you have confidence in national government?”
2.2: Data for Japan, Korea and Mexico are for 2011 rather than 2012.Judicial system data refer to the percentage who answered “yes” tothe question: “In this country, do you have confidence in each of thefollowing, or not? How about Judicial system and courts?” Localpolice data refer to the percentage of “yes” to the question: “In thecity or area where you live, do you have confidence in the local policeforce, or not?” Education system data refer to the percentage whoanswered “satisfied” to the question: “In the city or area where youlive, are you satisfied or dissatisfied with the educational system orthe schools?” Health care data refer to the percentage who answered“satisfied” to the question: “In the city or area where you live, are yousatisfied or dissatisfied with the availability of quality health care?”
Information on data for Israel: http://dx.doi.org/10.1787/888932315602.
Methodology and definitions
Data was collected by Gallup World Poll. The World Polluses proportional stratified probability sampling andhas a sample size of 1000 citizens in each country.There is more information at www.gallup.com/strategic-consulting/en-us/worldpoll.aspx.
GOVERNMENT AT A GLANCE 2013 © OECD 201340
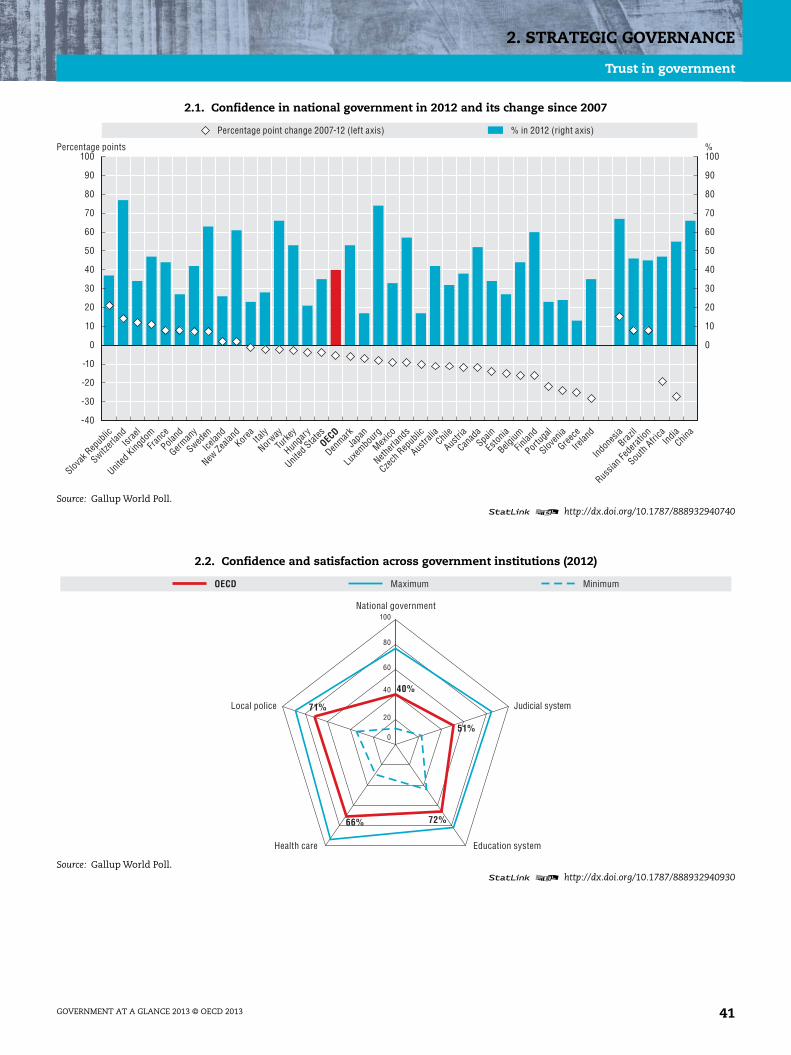
2. STRATEGIC GOVERNANCE
Trust in government
2.1. Confidence in national government in 2012 and its change since 2007
Source: Gallup World Poll.1 2 http://dx.doi.org/10.1787/888932940740
2.2. Confidence and satisfaction across government institutions (2012)
Source: Gallup World Poll.1 2 http://dx.doi.org/10.1787/888932940930
%
0
10
20
30
40
50
60
70
80
90
100
-40
-30
-20
-10
0
10
20
30
40
50
60
70
80
90
100Percentage points
% in 2012 (right axis)Percentage point change 2007-12 (left axis)
Slovak
Rep
ublic
Switzerl
andIsr
ael
United
Kingdo
mFra
nce
Poland
German
y
Sweden
Icelan
d
New Ze
aland
Korea Ita
ly
Norway
Turke
y
Hunga
ry
United
States
OECD
Denmark
Japa
n
Luxe
mbourg
Mexico
Netherl
ands
Czech
Rep
ublic
Austra
liaChil
e
Austri
a
Canad
aSpa
in
Eston
ia
Belgium
Finlan
d
Portug
al
Sloven
ia
Greece
Irelan
d
Indon
esiaBraz
il
Russia
n Fed
eratio
n
South
Africa
IndiaChin
a
100
0
20
40
60
80
Maximum MinimumOECD
National government
Judicial system
Education systemHealth care
Local police
40%
51%
72%66%
71%
GOVERNMENT AT A GLANCE 2013 © OECD 2013 41
2. STRATEGIC GOVERNANCE
Improving fairness through selected government policies
One of the major tasks of government is to level the playingfield for citizens by ensuring fairness in both the processesit follows – procedural justice – and the results it achieves– distributive justice. A key element of the latter is to allowincome differences to exist to the extent that they acknow-ledge and reward performance, accepting individuals’differential contributions to economic and social well-being. At the same time, governments should seek tominimise economic and social harm that can arise frominequality and take into account the societal consensus.These twin objectives lead to reduced income inequalitiesthrough progressive taxation and the use of cash transfers(e.g. pensions, unemployment insurance).
Since the 1980s the income gap between rich and poor haswidened (OECD 2011, Divided We Stand: Why Inequality KeepsRising) in the majority of OECD member countries, demon-strating that the benefits of economic growth have not beenequally shared among individuals. Globalisation, technolog-ical change, regulatory and institutional reforms have allbeen identified as main drivers of rising income inequalities.The global economic crisis further accelerated these devel-opments by unevenly affecting different groups of the popu-lation, with the majority of the burden of the crisis beingborne by the unemployed and the underemployed.
Most OECD member countries have adopted a mix of publicpolicies in order to reduce income inequality in society and itslong-term costs on economic development. Social protectionand insurance systems have worked through a combinationof cash transfers and progressive income taxation. In addi-tion, specific fiscal stimulus packages were created to boostdemand and cushion poorer households to reduce the impactof the crisis. These measures aimed at addressing incomeinequality by redistributing income between rich and poorand also on an intergenerational basis, in order to providesupport to age groups in greater need.
The Gini coefficient is considered the main indicator assess-ing the level of income inequality in a country. The impact ofthe social protection system enacted by central govern-ments through transfers and taxes can be measured bycomparing the coefficient before and after taxes andtransfers. On average, income inequality levels before taxesin a pool of OECD member countries have not changed inmagnitude between 2005 and 2010 (0.47). Nonetheless, somecountries have observed a consistent increase in theirpre-tax and transfers inequality in the last five years, as inthe case of Ireland. Government intervention proved essen-tial in these situations, reaching a reduction in the Ginicoefficient of about 0.26 (versus an average of 0.16). On theother hand, Chile remains the country achieving the leastredistribution in both years, with an impact of 0.02 on theGini index. All countries seem also to retain a progressiveincome tax system, with Poland and Chile holding fewerdifferent tax rates than Ireland.
Further reading
OECD (2013), Taxing Wages 2013, OECD Publishing, Paris,http://dx.doi.org/10.1787/tax_wages-2013-en.
OECD (2011), Divided We Stand: Why Inequality Keeps Rising,OECD Publishing, Paris, http://dx.doi.org/10.1787/9789264119536-en.
Figure notes2.3: Data for Hungary, Mexico and Turkey are not available. Data for
Switzerland are not available in 2005. 2005: Data for Australia,Finland, Germany, Italy, Norway and Sweden are for 2004. Data forChile, Japan and Korea are for 2006. Data for New Zealand arefor 2003. 2010: Data for Chile, Ireland, Japan, New Zealand andSwitzerland are for 2009.
2.4: Wage figures for Turkey are based on the old definition of averageworker (ISIC D, Rev. 3). Data refer to personal income taxes plusemployee contributions to social security (as % of gross wageearnings). In Chile average earnings are exempt from incometaxation and consequently the income tax has a small incidence ontotal tax revenues.
Information on data for Israel: http://dx.doi.org/10.1787/888932315602.
Methodology and definitions
The values of the Gini coefficient range between 0, inthe case each share of the population has the sameincome, and 1, in the case where the richest individualhas all the income. Gaps between poorest and richestare computed as the ratio of average income of thebottom 10% to average income of the top 10%. Redistri-bution is measured by comparing Gini coefficients formarket income (i.e. gross income not adjusted forpublic cash transfers and household taxes) and fordisposable income (i.e. net of transfers and taxes). Thedisposable household income definition does not takeinto account in-kind transfers. The data have beendrawn from the OECD Income Distribution Database,whose information has been collected through anetwork of national data providers in order to bench-mark countries’ performance in income inequality.
The tax data, derived from OECD Taxing Wages, usetax rates applicable to the tax year. For Australia,New Zealand and the United Kingdom, the tax year isnot the calendar year. The data show the differencebetween two scenarios: a single person without depen-dents earning 67% of the average wage, and a singleperson without dependants earning 167% of the averagewage. The average rates are expressed as a percentageof gross wage earnings. Average wage measures theaverage annual gross wage earnings of adult, full-timemanual and non-manual workers in the industry.
GOVERNMENT AT A GLANCE 2013 © OECD 201342
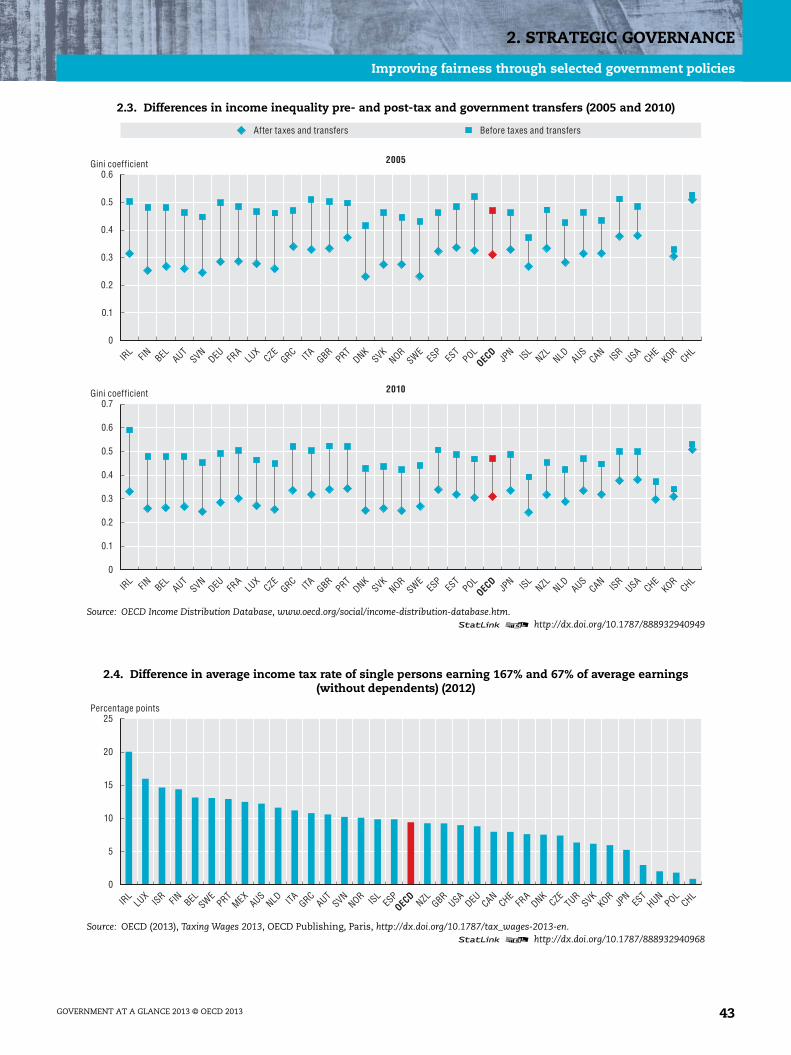
2. STRATEGIC GOVERNANCE
Improving fairness through selected government policies
2.3. Differences in income inequality pre- and post-tax and government transfers (2005 and 2010)
Source: OECD Income Distribution Database, www.oecd.org/social/income-distribution-database.htm.1 2 http://dx.doi.org/10.1787/888932940949
2.4. Difference in average income tax rate of single persons earning 167% and 67% of average earnings(without dependents) (2012)
Source: OECD (2013), Taxing Wages 2013, OECD Publishing, Paris, http://dx.doi.org/10.1787/tax_wages-2013-en.1 2 http://dx.doi.org/10.1787/888932940968
2005
2010
0
0.1
0.2
0.3
0.4
0.5
0.6
0
0.1
0.2
0.3
0.4
0.5
0.6
0.7
IRL FIN BEL AUT
SVNDEU FR
ALU
XCZE
GRC ITA GBRPRT
DNKSVK
NORSWE
ESP
EST
POLJP
N ISLNZL NLD AUS
CAN ISRUSA
CHEKOR
CHL
Before taxes and transfersAfter taxes and transfers
Gini coefficient
Gini coefficient
OECD
IRL FIN BEL AUT
SVNDEU FR
ALU
XCZE
GRC ITA GBRPRT
DNKSVK
NORSWE
ESP
EST
POLOEC
DJP
N ISLNZL NLD AUS
CAN ISRUSA
CHEKOR
CHL
0
5
10
15
20
25
IRL
LUX
ISR FIN BELSWE
PRTMEX
AUSNLD ITA GRC
AUTSVN
NOR ISLES
PNZL GBR
USADEU CAN
CHEFR
ADNK
CZETUR
SVKKOR
JPN
EST
HUNPOL
CHL
Percentage points
OECD
GOVERNMENT AT A GLANCE 2013 © OECD 2013 43
2. STRATEGIC GOVERNANCE
Rule of law
Rule of law means that no one, including government isabove the law, where laws protect fundamental rights, andjustice is accessible to all. It implies a set of commonstandards for action, which are defined by law andenforced in practice through procedures and accountabilitymechanisms for reliability, predictability and “administra-tion through law”. Rule of law has been considered as oneof the key dimensions that determine the quality and goodgovernance of a country.
There are several interpretations of the rule of law. We use theone developed for The World Justice Project’s (WJP) Rule ofLaw Index as one of the most comprehensive and systematicapproaches. Accordingly, the rule of law encompasses thefollowing four universal principles: “the government and itsofficials and agents are accountable under the law; the lawsare clear, publicised, stable and fair, and protect fundamentalrights, including the security of persons and property; theprocess by which laws are enacted, administered andenforced is accessible, efficient and fair; justice is delivered bycompetent, ethical, and independent representatives andneutrals, who are of sufficient number, have adequateresources, and reflect the makeup of the communities theyserve.”
Based on these four principles, WJP developed nine keyfactors that form the basis of their Rule of Law Index. Fromthose we have selected four for presentation here, being themost crucial for good governance. These are: limited govern-ment powers, fundamental rights, regulatory enforcementand civil justice. In addition open government data will bepresented separately. Information summarised in thesefactors represents the perception of experts and citizens.
Limited government powers
Limited government powers is a combination of seven keyelements (subfactors): that government powers are definedin fundamental law; that they are effectively limited by thelegislature; that they are effectively limited by the judiciary;that they are effectively limited by independent auditingand review; that government officials are sanctioned formisconduct; that government powers are subject to non-governmental checks and transition of power is subject tothe law. This composite indicator measures whetherauthority is distributed, whether by formal rules or byconvention, in a way that ensures that no single govern-ment organ has the ability to exercise unchecked power.
Even within OECD member countries there is a markedvariation on the extent of limitations on governmentpowers. The Nordic countries have the most limitations ongovernment powers followed by Australia and New Zealand,while government powers are the least controlled in Turkey,Mexico and Greece. As expected, the average score of OECDmember countries on this indicator is high, showing thatthere are substantial checks on government powers. Inpartner, participant and accession countries, controls ofgovernment powers are more limited, including theRussian Federation, Ukraine and China.
When looking at the OECD average for the subfactors that areaggregated to this composite indicator, the best developed,with the highest score, are the laws related to the transition ofpower (0.87) (where 1 signifies highest adherence to the ruleof law), while least developed are sanctions for governmentofficials in case of misconduct (0.67) and the role of indepen-dent auditing and reviews should also be increased (0.73).
Fundamental rights
This composite indicator captures the protection of funda-mental human rights and as a result, it is a normativemeasure. It includes evaluation of eight key elements:equal treatment and the absence of discrimination; effec-tive guarantees to the right to life and security of person;due process of law and rights of the accused; effectiveguarantee of freedom of opinion and expression; effectiveguarantee of freedom of belief and religion; freedom fromarbitrary interference with privacy; effectively guaranteedassembly and association and fundamental labour rights. Itcovers a relatively modest menu of rights that are firmlyestablished under international laws and are most closelyrelated to rule of law and good governance concerns.
The average score for the OECD member countries is high atalmost 0.8, meaning that the guarantee of fundamental rightsis strong in most countries. Similarly as in the case of limitedgovernment powers, fundamental rights are best guaranteedby the Nordic countries (Sweden, Denmark, Norway andFinland) followed by New Zealand and Spain, while leastguaranteed in the same three countries, Turkey, Mexico andGreece. This indicates that there is a strong associationbetween ensuring that government powers are limited andsecuring fundamental rights (R2 equal to 0.81). However,regulatory enforcement is weaker on average across OECDmember countries as compared to the adherence to funda-mental rights. It is more diverse in the partner and participantcountries, where fundamental rights are well guaranteed– although still below the OECD average – in Brazil andSouth Africa, while improvements may be needed in theremaining countries, especially China and Egypt.
On average in the OECD member countries equal treatmentand absence of discrimination is the area where furtheraction is needed (0.7), while the guarantee of freedom ofthe right to life and security of the person is the bestdeveloped (0.86).
Regulatory enforcement
The regulatory enforcement composite indicator measuresthe extent to which regulations are fairly and effectivelyenforced. It does not assess what and how governmentregulates, just how regulations are implemented andenforced. It considers areas of regulation that all countriesregulate to some degree, such as public health, workplacesafety, environmental protection and commercial activity.The key elements include whether government regulationsare effectively enforced; government regulations are applied
GOVERNMENT AT A GLANCE 2013 © OECD 201344
2. STRATEGIC GOVERNANCE
Rule of law
and enforced without undue influence; administrativeproceedings are conducted without unreasonable delay;due process is respected in those proceedings; and thegovernment does not appropriate without reasonablecompensation. As a result, this indicator is different fromthe regulatory quality management indicators included inGovernment at a Glance 2009, which focused on consultation,regulatory impact assessment and regulatory simplification.
Regulatory enforcement is strongest in Sweden, Japan,Denmark and Austria, closely followed by Australia, Norway,the Netherlands, Finland and New Zealand, while it needsimprovement in Mexico, Greece, Turkey and Italy. Overall,there is room for considerable improvement in many OECDmember countries, as the OECD average amounts to 0.71.Partner and participant countries all scored below the OECDaverage. The best performers are Brazil and South Africa,and the worst is Ukraine.
Looking at the elements of regulatory enforcement,improper influence of the application and enforcement ofgovernment regulations are the rare, receiving the highestscore (0.77), while their effective enforcement could beimproved the most (0.67).
Civil justice
The civil justice composite measures whether ordinarypeople can resolve their grievances effectively through thecivil justice system, which requires that the system beaccessible, affordable, effective, impartial and culturallycompetent. The components cover whether people canaccess and afford civil justice; whether civil justice is free ofdiscrimination; whether civil justice is free of corruption;whether civil justice is free of improper government influ-ence; whether civil justice is not subject to unreasonabledelays; whether civil justice is effectively enforced; andwhether alternative dispute resolutions are accessible,impartial and effective.
Access to civil justice is the highest in the Nordic countries,as well as in the Netherlands and Germany. Italy, Mexico andTurkey are the OECD member countries with the lowestscores for civil justice. Of the four key contributors to rule oflaw examined – limited government powers, fundamentalrights, regulatory enforcement and access to civil justice –the average performance of OECD member countries is thelowest in the case of civil justice (0.69), just slightly below
regulatory enforcement (0.71), while Brazil and South Africaperform the best among partner countries.
The biggest access problem for the civil justice system acrossOECD member countries is timeliness (0.47), while civil justicefree of corruption recorded the highest score (0.8).
Further reading
Aghast, M. et al. (2013), WJP Rule of Law Index 2012-2013, TheWorld Justice Project, Washington.
Figure notes
Data for Iceland, Ireland, Israel, Luxembourg, the Slovak Republic andSwitzerland are not available. Data for Hungary are not displayed.
For Italy changes in the legislation introduced in 2013 are not reflected.
Information on data for Israel: http://dx.doi.org/10.1787/888932315602.
Methodology and definitions
Data is collected by The World Justice Project by a set offive questionnaires, based on the Rule of Law Index’sconceptual framework. The questionnaires are admin-istered to experts and the general public in thecountries. On average there are more than 300 potentiallocal experts per country qualified to respond to thequestionnaires and the services of local polling compa-nies are engaged to administer the survey to the public.Data are available for 28 OECD member countries aswell as 8 partner and participant countries. All variablesused to score each of the composite indicators arecoded and normalised to range between 0 and 1, where1 signifies the highest score and 0 the lowest. Moredetailed information on the selected factors of limitedgovernment powers (2.10), fundamental rights (2.11),regulatory enforcement (2.12) and civil justice (2.13)is available on line at http://dx.doi.org/10.1787/888932943172, http://dx.doi.org/10.1787/888932943191,http://dx.doi.org/10.1787/888932943210, http://dx.doi.org/10.1787/888932943229 respectively.
GOVERNMENT AT A GLANCE 2013 © OECD 2013 45
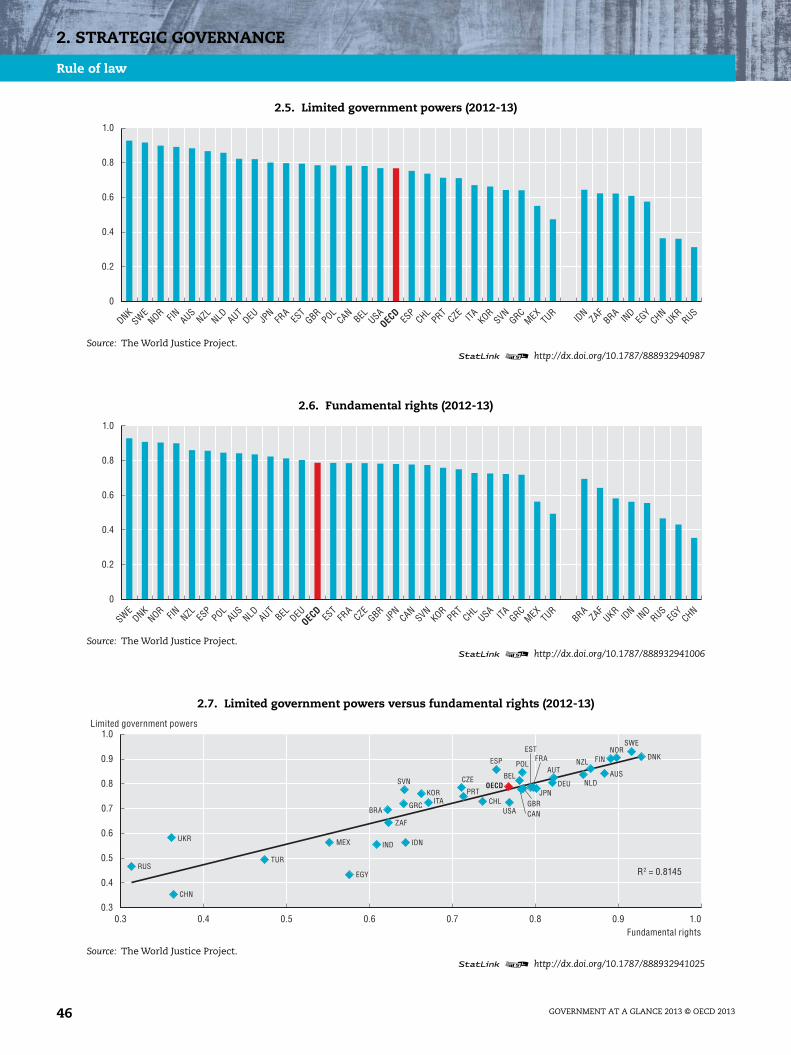
2. STRATEGIC GOVERNANCE
Rule of law
2.5. Limited government powers (2012-13)
Source: The World Justice Project.1 2 http://dx.doi.org/10.1787/888932940987
2.6. Fundamental rights (2012-13)
Source: The World Justice Project.1 2 http://dx.doi.org/10.1787/888932941006
2.7. Limited government powers versus fundamental rights (2012-13)
Source: The World Justice Project.1 2 http://dx.doi.org/10.1787/888932941025
0
0.2
0.4
0.6
0.8
1.0
DNKSWE
NOR FIN AUSNZL NLD AUT
DEU JPN
FRA
EST
GBRPOL
CANBEL USA
ESP
CHLPRT
CZE ITA KORSVN
GRCMEX
TURID
NZAF
BRAIN
DEG
YCHN
UKRRUS
OECD
0
0.2
0.4
0.6
0.8
1.0
SWEDNK
NOR FIN NZL ESP
POLAUS
NLD AUTBEL DEU ES
TFR
ACZE
GBRJP
NCAN
SVNKOR
PRTCHL
USA ITA GRCMEX
TURBRA
ZAFUKR
IDN
IND
RUSEG
YCHN
OECD
0.3 0.4 0.5 0.6 0.7 0.8 0.9 1.00.3
0.4
0.5
0.6
0.7
0.8
0.9
1.0
R2 = 0.8145
AUSAUTBEL
GBRCHL
CZE
DNKEST
FINFRA
DEU
GRC ITAJPNKOR
MEX
NLD
NZL
NOR
POL
PRTSVN
ESP
SWE
TUR
CANUSABRA
CHN
EGY
IND IDN
RUS
ZAF
UKR
Fundamental rights
Limited government powers
OECD
GOVERNMENT AT A GLANCE 2013 © OECD 201346

2. STRATEGIC GOVERNANCE
Rule of law
2.8. Regulatory enforcement (2012-13)
Source: The World Justice Project.1 2 http://dx.doi.org/10.1787/888932941044
2.9. Civil justice (2012-13)
Source: The World Justice Project.1 2 http://dx.doi.org/10.1787/888932941063
0
0.2
0.4
0.6
0.8
1.0
Sweden
Japa
n
Denmark
Austri
a
Austra
lia
Norway
Netherl
ands
Finlan
d
New Ze
aland
United
Kingdo
m
Canad
a
Franc
e
German
y
Eston
iaOEC
D
United
States
BelgiumKor
eaSpa
inChil
e
Poland
Czech
Rep
ublic
Sloven
ia
Portug
alIta
ly
Turke
y
Greece
Mexico
Brazil
South
Africa
Indon
esia
Egyp
tInd
iaChin
a
Ukraine
Russia
n Fed
eratio
n
0
0.2
0.4
0.6
0.8
1.0
Norway
Netherl
ands
German
y
Finlan
d
Denmark
Sweden
Japa
n
New Ze
aland
Austri
a
United
Kingdo
m
Austra
lia
Canad
aKor
ea
Eston
iaOEC
DFra
nce
Belgium Chil
e
United
States
Czech
Rep
ublic
Spain
Poland
Portug
al
Greece
Sloven
iaIta
ly
Turke
y
Mexico
Brazil
South
Africa
Ukraine
Russia
n Fed
eratio
n
Indon
esia
Egyp
tInd
iaChin
a
GOVERNMENT AT A GLANCE 2013 © OECD 2013 47
2. STRATEGIC GOVERNANCE
Risk management
OECD member countries have been significantly affectedby disruptive shocks events over the past decades, withincreasing economic impacts.
In the last 30 years the number of shocks has increased fromaround 100 to at times more than 300 each year across OECDmember countries, causing hundreds of billions in annuallosses. They present governments with many challenges,threaten many citizens’ lives, and have the potential todisrupt the activity of small and medium-sized businessesand transnational corporations alike. Large critical infra-structure can also be at risk, with devastating impacts asdemonstrated in the Great East Japan Earthquake in 2011.Such large scale disruptive shocks have led countries tostrengthen risk management policies, including the identifi-cation and assessment of risks as well as the implementa-tion of measures that increase resilience.
Addressing critical risks across OECD member countriesrequires support from the highest political level, butequally an engagement for managing risk reduction acrossall governmental sectors and territorial levels, includinglocal communities. This requires strategic frameworks,incorporating and co-ordinating strategy, capability, andgovernance to enable risk-informed policy making. Riskreduction is overseen by the Centre of Government (mostlyprime minister’s office) in four OECD countries and centralco-ordination is assured in most others, often located inthe national civil protection departments.
Risk management policy has also been mainstreamedacross sectors, through strategies, plans and tools. Nearlyall OECD member countries that initiated inter-disciplinaryreviews of progress in integrating risk management inpublic policy and investment systematically considerdisaster risk management in sectoral public investmentstrategies and planning. However, only two-thirds useanalyses of the costs and benefits of risk management inthe design and operation of major public investments. Theimportance attributed to the local level is reflected by thefact that 86% of OECD member countries have establisheda legal framework for local responsibilities and almosttwo-thirds developed risk sensitive regulation in landzoning and private real estate development. Still, the shareof local governments that receive a regular allocation fordisaster risk reduction, namely 62%, is much lower. Thelegal enabling environment will remain ineffective if localgovernments are not provided with necessary resources tocarry out risk reduction activities.
The challenge for governments is to organise integratedpolicy responses that address multidisciplinary challenges.In this respect, the National Risk Assessments represent animportant tool, which can help build an all-hazard inte-grated risk management strategy. However, over half ofOECD member countries conduct their assessments in anintegrated manner, based on an all-hazard approach andfuture probable risks in their assessments.
In comparison to the challenges faced in lower incomecountries, the standards attained in risk managementacross the OECD are high. Nevertheless, with growing
exposure and changing hazard profiles, economic lossescontinue to increase, despite a downward trend in disasterfatalities. Early warning systems have allowed warnings tobe transmitted effectively to affected communities that, inturn, generally know how act upon them. Risk awarenesshas also been raised in many countries, not least as theresult of effective public campaigns and integration of riskmanagement tenets in the standard curricula of primary,secondary and tertiary education institutions.
Further reading
OECD (2012), Disaster Risk Assessment and Risk Financing: AG20/OECD Methodological Framework, OECD, Paris,www.oecd.org/gov/risk/G20disasterriskmanagement.pdf.
SwissRe (2011), “Closing the financial gap: New partnershipsbetween the public and private sectors to finance disasterrisks”, SwissRe Economic Research and Consulting,Zurich, http://media.swissre.com/documents/pub-closing-the-financial-gap_w1.pdf.
UNISDR (2013), Global Assessment Report on Disaster RiskReduction – From Shared Risk to Shared Value: The BusinessCase for Disaster Risk Reduction, United Nations Office forDisaster Risk Reduction, Geneva, www.preventionweb.net/english/hyogo/gar/2013/en/home/index.html.
Table note
Data for Austria, Belgium, Denmark, Estonia, Iceland, Ireland, Israel,Luxembourg and the Slovak Republic are not available.
2.16: Information on Canada draws on HFA data for the period 2009-11.
Methodology and definitions
Data on disasters are based on EM-DAT, the OFDA/CREDInternational Disaster Database (www.emdat.be) developedby the Catholic university of Louvain-Brussels inBelgium. Losses are based on SwissRe estimations. Theonline platform managed by the UN’s InternationalStrategy for Disaster Risk Reduction provides access tocountry reports on progress towards the Hyogo Frame-work for Action objectives (www.preventionweb.net/english/hyogo/). Data reported here reflect the latestreporting period (2011-13). The progress reports arebased on a self-assessment undertaken through multi-stakeholder processes. Finally, information wasobtained through a set of OECD questionnaires,followed by phone interviews in 2012, in collaborationwith public officials, and other risk experts from theOECD High Level Risk Forum.
Figure 2.17, Total number of annual disasters 1980-2010,is available on line at http://dx.doi.org/10.1787/888932941101.
GOVERNMENT AT A GLANCE 2013 © OECD 201348
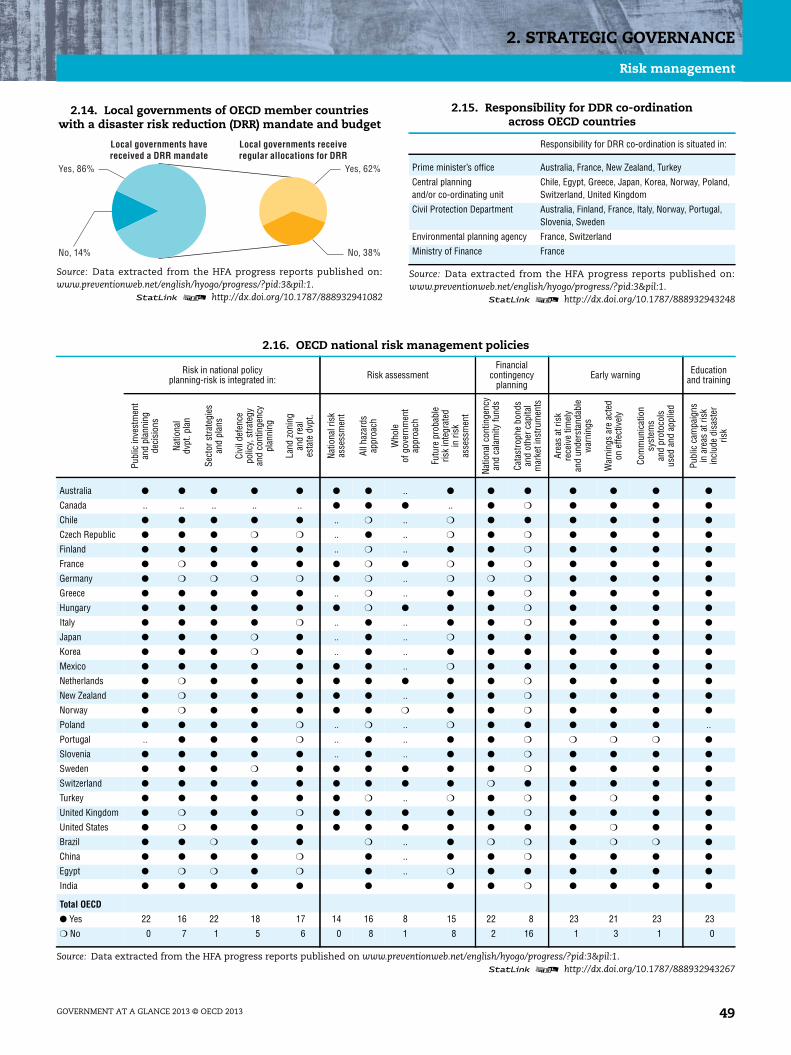
2. STRATEGIC GOVERNANCE
Risk management
2.14. Local governments of OECD member countrieswith a disaster risk reduction (DRR) mandate and budget
Source: Data extracted from the HFA progress reports published on:www.preventionweb.net/english/hyogo/progress/?pid:3&pil:1.
1 2 http://dx.doi.org/10.1787/888932941082
Local governments havereceived a DRR mandate
Local governments receiveregular allocations for DRR
No, 14%
Yes, 62%
No, 38%
Yes, 86%
GOVERNMENT AT A GLANCE 2013 © OECD 2013
2.15. Responsibility for DDR co-ordinationacross OECD countries
Responsibility for DRR co-ordination is situated in:
Prime minister’s office Australia, France, New Zealand, Turkey
Central planningand/or co-ordinating unit
Chile, Egypt, Greece, Japan, Korea, Norway, Poland,Switzerland, United Kingdom
Civil Protection Department Australia, Finland, France, Italy, Norway, Portugal,Slovenia, Sweden
Environmental planning agency France, Switzerland
Ministry of Finance France
Source: Data extracted from the HFA progress reports published on:www.preventionweb.net/english/hyogo/progress/?pid:3&pil:1.
1 2 http://dx.doi.org/10.1787/888932943248
2.16. OECD national risk management policies
Risk in national policyplanning-risk is integrated in: Risk assessment
Financialcontingency
planningEarly warning Education
and training
Publ
icin
vest
men
tan
dpl
anni
ngde
cisi
ons
Natio
nal
dvpt
.pla
n
Sect
orst
rate
gies
and
plan
s
Civi
ldef
ence
polic
y,st
rate
gyan
dco
ntin
genc
ypl
anni
ng
Land
zoni
ngan
dre
ales
tate
dvpt
.
Natio
nalr
isk
asse
ssm
ent
Allh
azar
dsap
proa
ch
Who
leof
gove
rnm
ent
appr
oach
Futu
repr
obab
leris
kin
tegr
ated
inris
kas
sess
men
t
Natio
nalc
ontin
genc
yan
dca
lam
ityfu
nds
Cata
stro
phe
bond
san
dot
herc
apita
lm
arke
tins
trum
ents
Area
sat
risk
rece
ive
timel
yan
dun
ders
tand
able
war
ning
s
War
ning
sar
eac
ted
onef
fect
ivel
y
Com
mun
icat
ion
syst
ems
and
prot
ocol
sus
edan
dap
plie
d
Publ
icca
mpa
igns
inar
eas
atris
kin
clud
edi
sast
erris
k
Australia ● ● ● ● ● ● ● .. ● ● ● ● ● ● ●
Canada .. .. .. .. .. ● ● ● .. ● ❍ ● ● ● ●
Chile ● ● ● ● ● .. ❍ .. ❍ ● ● ● ● ● ●
Czech Republic ● ● ● ❍ ❍ .. ● .. ❍ ● ❍ ● ● ● ●
Finland ● ● ● ● ● .. ❍ .. ● ● ❍ ● ● ● ●
France ● ❍ ● ● ● ● ❍ ● ❍ ● ❍ ● ● ● ●
Germany ● ❍ ❍ ❍ ❍ ● ❍ .. ❍ ❍ ❍ ● ● ● ●
Greece ● ● ● ● ● .. ❍ .. ● ● ❍ ● ● ● ●
Hungary ● ● ● ● ● ● ❍ ● ● ● ❍ ● ● ● ●
Italy ● ● ● ● ❍ .. ● .. ● ● ❍ ● ● ● ●
Japan ● ● ● ❍ ● .. ● .. ❍ ● ● ● ● ● ●
Korea ● ● ● ❍ ● .. ● .. ● ● ● ● ● ● ●
Mexico ● ● ● ● ● ● ● .. ❍ ● ● ● ● ● ●
Netherlands ● ❍ ● ● ● ● ● ● ● ● ❍ ● ● ● ●
New Zealand ● ❍ ● ● ● ● ● .. ● ● ❍ ● ● ● ●
Norway ● ❍ ● ● ● ● ● ❍ ● ● ❍ ● ● ● ●
Poland ● ● ● ● ❍ .. ❍ .. ❍ ● ● ● ● ● ..
Portugal .. ● ● ● ❍ .. ● .. ● ● ❍ ❍ ❍ ❍ ●
Slovenia ● ● ● ● ● .. ● .. ● ● ❍ ● ● ● ●
Sweden ● ● ● ❍ ● ● ● ● ● ● ❍ ● ● ● ●
Switzerland ● ● ● ● ● ● ● ● ● ❍ ● ● ● ● ●
Turkey ● ● ● ● ● ● ❍ .. ❍ ● ❍ ● ❍ ● ●
United Kingdom ● ❍ ● ● ❍ ● ● ● ● ● ❍ ● ● ● ●
United States ● ❍ ● ● ● ● ● ● ● ● ● ● ❍ ● ●
Brazil ● ● ❍ ● ● ❍ .. ● ❍ ❍ ● ❍ ❍ ●
China ● ● ● ● ❍ ● .. ● ● ❍ ● ● ● ●
Egypt ● ❍ ❍ ● ❍ ● .. ❍ ● ● ● ● ● ●
India ● ● ● ● ● ● ● ● ❍ ● ● ● ●
Total OECD
● Yes 22 16 22 18 17 14 16 8 15 22 8 23 21 23 23
❍ No 0 7 1 5 6 0 8 1 8 2 16 1 3 1 0
Source: Data extracted from the HFA progress reports published on www.preventionweb.net/english/hyogo/progress/?pid:3&pil:1.1 2 http://dx.doi.org/10.1787/888932943267
49

2. STRATEGIC GOVERNANCE
Fiscal sustainability
Fiscal sustainability is the ability of a government to main-tain public finances at a credible and serviceable positionover the long term. Ensuring long-term fiscal sustainabilityrequires that governments engage in continual strategicforecasting of future revenues and liabilities, environ-mental factors and socio-economic trends in order to adaptfinancial planning accordingly. High and increasing debtlevels are harmful to governments’ fiscal positions and cancause a vicious cycle of growing debt, reducing the poten-tial for economic growth as funds are diverted away fromproductive investments. Many OECD member countriescontinue to face rising public debt-to-GDP ratios since thefinancial and economic crisis. The costs associated withaddressing the current economic slowdown, as well asprojected increases in ageing-related spending, presentserious challenges for the sustainability of public finances.
The OECD has produced estimates of increases in the under-lying primary balances that would be required to reduce grosspublic debt to 60% of GDP by 2030. According to this model,Greece, the United Kingdom, and the United States require atotal average increase from their respective 2012 primaryunderlying balances of over 6% of potential GDP (economyworking at full capacity), in order to reduce public debt to 60%of GDP in this time frame. Japan requires 13% of potential GDPto reduce its debt-to-GDP ratio to 60%, however the requiredconsolidation efforts are so large that it is not expected toreach this target by 2030 in this scenario. Conversely, thecurrent states of public finances (e.g. fiscal balances andlevels of debt) in Denmark, Estonia, Germany, Korea andSwitzerland are such that these countries are not expected torequire surpluses to reduce debt to reach the target of 60%of GDP.
On average, OECD member countries have implemented orannounced fiscal consolidation plans equivalent to over5.5% of GDP for the 2009-15 period, of which two-thirds arestructured around expenditure measures, and the remain-ing one-third around revenue measures. However, the sizeand composition of cumulative fiscal consolidation plansvary significantly across OECD member countries. Countrieswith the largest economic imbalances and the most rapiddeterioration in public finance require larger fiscal conso-lidation. As such, Greece, Ireland and Portugal haveannounced fiscal consolidation packages equalling morethan 12% of GDP. On the contrary, Canada, Sweden andSwitzerland have implemented or announced fiscal consoli-dation packages that are below 1.6% of GDP. Expendituremeasures account for the largest share of fiscal consolida-tion packages in most countries. Revenue measures repre-sent the largest share in only seven countries: Belgium, theCzech Republic, Denmark, Estonia, Italy, Poland, and Turkey.
Sound strategic forecasting exercises should consider thecosts associated with demographic changes; especiallysince most OECD member countries face growing budget-ary pressures due to expected increases in ageing-relatedspending and technological change on health care, long-term care and pensions. On average, without policychanges, ageing-related public spending in OECD membercountries is expected to increase by nearly three percent-age points of GDP between 2014 and 2030.
Further reading
OECD (2013), “OECD Economic Outlook No. 93”, OECD EconomicOutlook: Statistics and Projections (database), http://dx.doi.org/10.1787/data-00655-en.
OECD (2012), Restoring Public Finances, 2012 Update, OECD Pub-lishing, Paris, http://dx.doi.org/10.1787/9789264179455-en.
Figure notes
2.18 and 2.20: Data for Chile, Mexico and Turkey are not available. InDenmark, Estonia, Germany, Korea, Norway and Switzerland, noconsolidation is needed to achieve the 60% gross financial liability-to-GDP ratio by 2030. The OECD average is unweighted. Fiscal projec-tions are the consequence of applying a stylised fiscal consolidationpath and should not be interpreted as a forecast.
2.19: The data are the sum of annual incremental consolidationfrom 2009/10 until 2015 as reported by the national authorities. Onlythe following countries reported consolidation in 2009: Estonia,Hungary, Ireland, Poland and Slovenia. Hungary’s 2007-08 consolida-tion is not included. Austria reports consolidation until 2016. Thefollowing participating countries have not reported an announcedconcrete consolidation plan and are not included in the graph: Japan,Korea and the United States. Australia reports consolidation (espe-cially in 2013) but applies a broader definition of the term consolida-tion than in this survey. New Zealand and Slovenia have reportedsome revenue measures but they are not completely quantified.
2.20: For the ageing-related spending where projections are not availableover the period 2014-30, linear interpolation has been applied.
Information on data for Israel: http://dx.doi.org/10.1787/888932315602.
Methodology and definitions
The data for Figures 2.18 and 2.20 are drawn from theOECD Economic Outlook, No. 93. Total consolidationneeded to achieve a government gross financialliability-to-GDP ratio equal to 60% of GDP by 2030 ismeasured in two time spans: between 2012 and 2014as the change in the underlying primary balance, andfrom 2014 to 2030 as the difference between the levelreached in 2014 and its average over the latest period.The assumptions made to generate the primarybalance required to reduce the debt-to-GDP ratio to60% can be found in the OECD Economic Outlook,No. 93, in Box 4.5 and Table 4.2.
The data for Figure 2.19 are drawn from the 2012 OECDSurvey on Fiscal Consolidation.
For most countries, data on gross debt used for thepurpose of these calculations refer to the liabilities(short-term and long-term) in the general govern-ment as defined in the System of National Accounts.This definition differs from the definition of debtunder the Maastricht Treaty which is used to assessEU fiscal positions.
GOVERNMENT AT A GLANCE 2013 © OECD 201350

2. STRATEGIC GOVERNANCE
Fiscal sustainability
2.18. Total consolidation requirements between 2012 and 2030 in order to reduce governmentgross financial liabilities to 60% of GDP
Source: OECD calculations; OECD (2013), “OECD Economic Outlook No. 93”, OECD Economic Outlook: Statistics and Projections (database),May 2013, http://dx.doi.org/10.1787/data-00655-en.
1 2 http://dx.doi.org/10.1787/888932941120
2.19. Expenditure-based and revenue-based fiscal consolidation as percentage of GDP (2009-15)
Source: 2012 OECD Survey on Fiscal Consolidation.1 2 http://dx.doi.org/10.1787/888932941139
2.20. Fiscal consolidation requirements and projected change in ageing-related expenditures (2014 to 2030)
Source: OECD calculations; OECD (2013), “OECD Economic Outlook No. 93”, OECD Economic Outlook: Statistics and Projections (database),May 2013, http://dx.doi.org/10.1787/data-00655-en.
1 2 http://dx.doi.org/10.1787/888932941158
0
2
4
6
8
10
12
14
JPN
GBRUSA
GRCPRT
IRL
ESP
FRA
SVK ISLPOL
AUSNLD CAN FIN ISR
SVNBEL NZL ITA HUN
CZESWE
LUX
AUTDNK
EST
DEU KORNOR
CHE
% of potential GDP
OECD
02468
101214161820
GRC IRL
PRT ISLHUN
ESP
GBR ITA SVKCZE
SVNPOL
NZL BEL FRA
AUTDEU NLD LU
XDNK FIN ES
TTUR
MEXCAN
SWECHE
Expenditure reductions Revenue enhancements
% of GDP
OECD
0
2
4
6
8
10
12
0 1 2 3 4 5 6 7
AUS AUT BELCAN
CZEDNKEST
FINFRA
DEU
GRC
HUN
IRL
ISLISR
ITA
JPN
KOR LUXNLD
NORNZL
POL
PRT
SVKSVN
ESP
SWECHE
GBR
USA
Projected change in public spending on health care and pensions (percentage points of GDP)
Required change in underlying balance to reduce gross financial liabilities to 60% of GDP (% of potential GDP)
OECD
GOVERNMENT AT A GLANCE 2013 © OECD 2013 51

2. STRATEGIC GOVERNANCE
Public sector efficiency
Estimating efficiency concerns the assessment of the rela-tionship between inputs invested and outputs producedwith those resources. The improvement of this measure asa way of controlling expenditures is a key objective of OECDgovernments. The fiscal crises faced by many countriesboth before and after the great economic and financialrecession put public sector performance at the forefront.
Efficiency indicators compare output measures with inputmeasures. Together, they are able to express efficiency in itstwo dimensions, i.e. technical (or operational) and allocativeefficiency. Performance assessments and measurementshould be based on economic (or cost) efficiency, i.e. theproduct of both operational and allocative efficiency.
Efficiency indicators are presented for: health care,education, justice and tax administration, where bothinput and output data exist and there is a developingconsensus among countries on how to measure efficiencyin an internationally comparable way.
Health care
There are several measures of health care efficiency in thesector, among which a key figure is the average length ofstay (ALOS) in hospitals. All other factors being constant, ashorter stay is expected to reduce the cost per dischargeand transfer care from inpatient care to less expensiverecovery settings. However, shorter stays tend to be moreservice intensive and more costly per day. Too short alength of stay may also cause adverse effects on healthoutcomes, or reduce the comfort and recovery of thepatient. In 2011 the average length of stay in hospitals forall conditions reached an OECD average of eight days.Mexico and Turkey had the shortest length of stay, at lessthan half the OECD average. On the other side, hospitalstays were highest in Japan, where it reached almost18 days, more than double the OECD average. In mostcountries, ALOS has fallen over the past decade, from anaverage of 9.2 days in 2000 to 8.0 days in 2011. At the systemlevel, factors such as practice guidelines or paymentsystems affect ALOS in hospitals. In Japan, for example, theabundant supply of beds and the structure of hospitalpayments provide incentives to keep patients longer.
Justice sector
Governments are under great pressure to deliver efficientand responsive judicial services in order to avoid additionaltime and monetary costs for citizens seeking justice,including the expenses of legal representation. A pivotalindicator of efficiency of the civil judicial systems can beobtained by associating the cost of trial as a percentage ofthe value of the claim (i.e. the input) to the national averagetrial length of the first instance (i.e. the output). Slowercourts decrease confidence in the justice sector and in thelong run can increase costs for businesses and deter privateinvestments. In addition, longer trials also mean a greatereconomic burden for both citizens and the state. The cost
of trial amounts on average to 19% of the value of the claimin OECD member countries, while first instances last onaverage around eight months. Korea, New Zealand andNorway prove to be at the top of performance scale, whilelonger and more expensive trials are held in theSlovak Republic. Furthermore, institutional frictions and anuneven geographical distribution of judicial resourcesseem to be the main causes for the remarkable length ofItalian first instances. However, efficiency comparisons inthe sector should not be considered as measures of qualityof service and due process, or of the quality of the court’sdecision.
Education
Human capital development and accumulation is essentialto ensure the creation of a highly-skilled workforce, well-equipped to compete in the international labour marketand to become active citizens of responsive democracies.Educational attainments of individuals are considered asuitable measure of output of human capital production.When compared to the national cumulative expenditureper student (i.e. the educational input), they can offer aninsight into which systems are able to deliver moreefficient services. The PISA (Programme for InternationalStudent Assessment) measure of proficiency in readingand mathematics is positively correlated to expenditure forboth primary and secondary studies, though the relation-ship seems to hold particularly for low levels of cumulativeexpenditure per student (OECD PISA in Focus 13). In additionto expenditures, student performance also depends on thequality of teachers, individual socio-economic back-grounds and school management practices, among otherfactors. Countries such as Finland, Korea and New Zealandspend less than the OECD average per student, but achievebetter performances. On the other hand, Austria andLuxembourg have higher per student expendituresalthough their scores are below average.
Tax administration
Tax collection from citizens and businesses is the mainresource on which governments rely to support the provi-sion of public services. The “cost of collection” ratio is astandard measure of efficiency often adopted by revenuebodies, comparing the annual costs of administration withthe total revenue collected over the fiscal year. A downwardtrend of the ratio can constitute, all the other things beingequal, evidence of a reduction in relative costs (improvedefficiency) or improved tax compliance (improved effective-ness). For most countries, a decreasing or stable trend overtime can be observed between 2005 and 2008, most likelydue to decreased costs. On the other hand, some revenuebodies observed an inversion in their trend from 2008to 2011, with ratios increasing most likely because ofreduced tax receipts in the aftermath of the economic crisis.
GOVERNMENT AT A GLANCE 2013 © OECD 201352

2. STRATEGIC GOVERNANCE
Public sector efficiency
International comparisons of the efficiency of tax admi-nistrations must be made with caution. Differences in taxrates and the overall legislated tax burden; variations in therange and in the nature of taxes collected; macroeconomicconditions affecting tax receipts; and differences in theunderlying cost structures resulting from institutionalarrangements (e.g. multiple bodies involved in revenueadministration, as in Italy), and/or the conduct of non-taxfunctions (e.g. customs) are all factors affecting theefficiency ratios presented here.
Further reading
OECD (2013a), Tax Administration 2013: Comparative Informa-tion on OECD and other Advanced and Emerging Economies,OECD Publishing, Paris, http://dx.doi.org/10.1787/9789264200814-en.
OECD (2013b, forthcoming), Health at a Glance 2013: OECDIndicators, OECD Publishing, Paris.
OECD (2012), Education at a Glance 2012: OECD Indicators, OECDPublishing, Paris, http://dx.doi.org/10.1787/eag-2012-en.
Palumbo, G. et al. (2013), “Judicial Performance and its Deter-minants: A Cross-Country Perspective”, OECD EconomicPolicy Papers, No. 5, OECD Publishing, Paris, http://dx.doi.org/10.1787/5k44x00md5g8-en.
Figure notes
2.21: The data for Canada, Japan and the Netherlands refer to averagelength of stay for curative (acute) care (resulting in an under-estimation). Data related to 2011: data for Australia, Belgium,Canada, Chile, China, France, Norway and the Russian Federation arefor 2010; data for Iceland are for 2009; data for Greece and Indonesiaare for 2008. Data related to 2000: data for China and Korea arefor 1999; data for Austria and Chile are for 2001; data for Luxembourgare for 2002.
2.22: Data for the United Kingdom only cover England and Wales. For moreinformation about the data, please refer to Doing Business (database).
2.23: Expenditure data for Canada are for 2008. Expenditure data for Chileare for 2010. Expenditure data for Hungary, Ireland, Italy, Poland,Portugal, Slovenia, Switzerland, Brazil and the Russian Federationrefer to public institutions only.
2.24: SSC and excises are not included for the Czech Republic, France,Germany, Poland, Portugal and the Slovak Republic. SSC are notincluded for Austria, Belgium, Japan, Korea, Luxembourg, Mexicoand Spain. Excises are not included for Finland, Indonesia,New Zealand and Slovenia. For Brazil, Ireland and South Africa costsinclude customs. For Estonia costs include customs for 2005. ForSpain costs include customs for 2008 and 2011. For Chile and Swedencosts exclude debt collection. For Switzerland VAT administrationonly is considered. For Iceland the computed ratios for these yearsare understated as not all costs appear to have been quantified forsurvey reporting purposes. For Italy the computed ratios for theseyears significantly understate the true ratio as they do not takeaccount of expenditure incurred on tax related work carried out byother agencies that have not been quantified. For the United Statesratios indicated vary from IRS-published ratios owing to use of “net”and not “gross” revenue collections as the denominator. Data forItaly does not reflect the undergoing fiscal reform to streamline therevenue collection.
Information on data for Israel: http://dx.doi.org/10.1787/888932315602.
Methodology and definitions
Average length of stay (ALOS) refers to the averagenumber of days that patients spend in hospital. It isgenerally measured by dividing the total number ofdays stayed by all inpatients during a year by thenumber of admissions or discharges. Day cases areexcluded. The data cover all inpatients cases (includ-ing not only curative/acute care cases).
Justice data on civil trials have been drawn byOECD “Judicial Performance and its Determinants: ACross-Country Perspective”. Trial length is estimated(further information on page 159). Total private cost oftrial (as a share of the value of the claim) discounted ofthe expected probability of receiving legal aid refers toa specific civil law case, from beginning to end. It istaken from the World Bank, Doing Business (database)and encompasses three different types of costsnecessary to resolve a commercial dispute: court fees,enforcement costs and average lawyers’ fees.
Data on expenditures per student refer to the 2009financial year. Spending per student equals the totalexpenditure by education institutions (both publicand private, where not specified differently) dividedby the corresponding full-time equivalent enrolmentand includes both core and ancillary services. Due todifferences across countries in the duration ofcourses, annual spending per student may not fullyreflect the total spent on a student. The achievementscores were based on assessments of 15-year oldsadministered as part of the PISA programme.
Data on tax administration are provided by surveyedrevenue bodies or extracted from official countryreports. Tax administration expenditures includethree categories: administrative costs, salary costsand IT costs. IT expenditure was defined as the totalcosts of providing IT support for all administrativeoperations (both tax and non-tax related). Forcomparison purposes, efforts have been made toseparately identify the resources used and the costsof tax and non-tax related functions.
GOVERNMENT AT A GLANCE 2013 © OECD 2013 53

2. STRATEGIC GOVERNANCE
Public sector efficiency
2.21. Average length of stay for all conditions (2000 and 2011)
Source: OECD Health Statistics 2013.1 2 http://dx.doi.org/10.1787/888932941177
2.22. Trial length in days of first instance and trial cost (as a share of the value of the claim, 2012)
Source: World Bank, Doing Business (database); and Palumbo, G. et al. (2013), “Judicial Performance and its Determinants: A Cross-CountryPerspective”, OECD Economic Policy Papers, No. 5, OECD Publishing, Paris, http://dx.doi.org/10.1787/5k44x00md5g8-en.
1 2 http://dx.doi.org/10.1787/888932941196
0
5
10
15
20
25
17.9
16.4
11.4
10.2
9.8
9.3
9.3
9.2
8.9
8.8
8.6
8.1
8.0
8.0
8.0
7.8
7.7
7.7
7.7
7.4
7.3
7.3
6.8
6.6
6.3
6.1
6.1
5.9
5.9
5.8
5.8
5.5
4.5
3.9
3.9
12.6
10.3
5.6
4.3
2000 2011Days
Japa
nKor
ea
Finlan
d
Hunga
ry
Czech
Rep
ublic
German
y
Switzerl
and
Franc
e
Portug
al
Luxe
mbourg
New Ze
aland
Belgium Ita
ly
Slovak
Rep
ublic
OECD
Austri
a
Canad
a
Eston
iaSpa
in
Poland
Sloven
ia
United
Kingdo
m
Norway
Greece
Irelan
d
Icelan
d
United
States
ChileIsr
ael
Austra
lia
Netherl
ands
Sweden
Denmark
Mexico
Turke
y
Russia
n Fed
eratio
nChin
a
South
Africa
Indon
esia
100
150
200
250
300
350
400
450
500
550
600
6 8 10 12 14 16 18 20 22 24 26 28 30 32Total cost of trial net of legal aid (as a percentage of the value of the claim)
Trial length in days, first instance
Austria
DenmarkEstoniaFinland
France
England and Wales
Hungary
Korea
Netherlands
NorwayNew Zealand
Turkey
Slovak Republic
Slovenia
Italy
Japan
OECD16
GOVERNMENT AT A GLANCE 2013 © OECD 201354
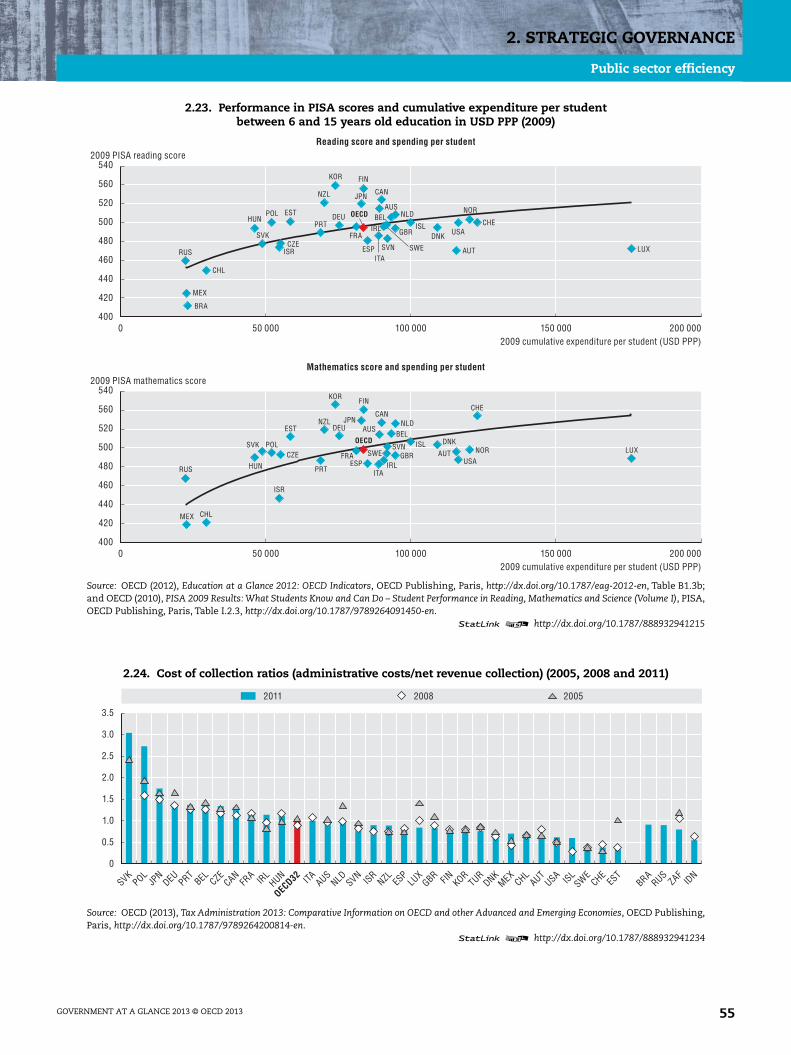
2. STRATEGIC GOVERNANCE
Public sector efficiency
2.23. Performance in PISA scores and cumulative expenditure per studentbetween 6 and 15 years old education in USD PPP (2009)
Source: OECD (2012), Education at a Glance 2012: OECD Indicators, OECD Publishing, Paris, http://dx.doi.org/10.1787/eag-2012-en, Table B1.3b;and OECD (2010), PISA 2009 Results: What Students Know and Can Do – Student Performance in Reading, Mathematics and Science (Volume I), PISA,OECD Publishing, Paris, Table I.2.3, http://dx.doi.org/10.1787/9789264091450-en.
1 2 http://dx.doi.org/10.1787/888932941215
2.24. Cost of collection ratios (administrative costs/net revenue collection) (2005, 2008 and 2011)
Source: OECD (2013), Tax Administration 2013: Comparative Information on OECD and other Advanced and Emerging Economies, OECD Publishing,Paris, http://dx.doi.org/10.1787/9789264200814-en.
1 2 http://dx.doi.org/10.1787/888932941234
400
420
440
460
480
500
520
540
560
400
420
440
460
480
500
520
540
560
0 50 000 100 000 150 000 200 000
0 50 000 100 000 150 000 200 000
AUS
AUT
BEL
CAN
CHL
CZE
DNK
EST
FIN
FRA
DEU
HUN
ISL
IRL
ISR
ITA
JPN
KOR
LUX
MEX
NLDNZL
NORPOL
PRT
SVK SVN
ESPSWE
CHE
GBRUSA
RUS
AUS
AUT
BEL
CAN
CHL
CZEDNK
EST
FIN
FRA
DEUHUNISLIRL
ISRITA
JPN
KOR
LUX
MEX
NLD
NZL
NORPOLPRT
SVK
SVNESP SWE
CHEGBR USA
BRA
RUS
2009 PISA reading scoreReading score and spending per student
2009 cumulative expenditure per student (USD PPP)
2009 PISA mathematics scoreMathematics score and spending per student
2009 cumulative expenditure per student (USD PPP)
OECD
OECD
0
0.5
1.0
1.5
2.0
2.5
3.0
3.5
2011 2008 2005
SVKPOL
JPN
DEU PRTBEL CZE
CANFR
A IRL
HUN ITA AUSNLD SVN ISR
NZL ESP
LUX
GBR FIN KORTUR
DNKMEX
CHLAUT
USA ISLSWE
CHEES
TBRA
RUSZAF
IDN
OECD32
GOVERNMENT AT A GLANCE 2013 © OECD 2013 55

2. STRATEGIC GOVERNANCE
Public sector cost-effectiveness
Whereas the concept of efficiency measures performancein terms of whether resources invested are productivelytransformed into the desired output, the concept of effec-tiveness measures the extent to which an activity attainsits desired objectives. Cost-effectiveness, i.e. the ratio of aninput to an intermediate or final outcome, reflects therelationship between resources expended and resultsachieved and is critical for the evaluation of the success ofgovernment policies.
Government performance assessment is particularlycrucial in sectors such as education and health care thatare fundamental to citizens’ well-being and to countries’economic and social development. These two sectors havealso sufficiently developed and standardised internation-ally the measurement of inputs and outcomes, therebyallowing their effectiveness to be meaningfully compared.
Education
In the education sector, human capital creation and skillsdevelopment are two key objectives for the public sectordue to their beneficial effects on employment prospectsand the life-long earnings. In addition, a better educatedworkforce contributes to higher economic growth andconsequently, a more prosperous society. These effects willalso be reflected in the resources available to governments:more employable and better skilled individuals potentiallyincrease the revenue-base through larger contributions,while simultaneously decreasing the need for publicspending on social assistance.
One of the key outcome measures for the education sectoris the public Net Present Value (NPV) of schooling. NPVmeasures the economic returns of public investmentsin the sector, after considering their costs. Additionalschooling creates economic benefits for governments byraising supplementary revenues from higher earnings andnew entrants to the labour market. On average, OECDmember countries attain a NPV for tertiary educationexceeding USD 100 000. When compared to the size ofpublic investment, on average one-third of the NPV, the
incentives for governments to invest in higher educationbecome evident. Among OECD member countries, Hungary,Ireland and the United States are attaining the greatestpublic NPV from tertiary education, while lower gains areachieved on average from investment in upper secondaryeducation, the worst case being Estonia, where costsactually exceed benefits.
Health care
Similarly, governments have a vested interest in evaluatingthe cost-effectiveness of their health systems not onlybecause of the remarkable importance of its outcomes, butalso because expenditure for this sector represents one ofthe largest shares of aggregate public spending and hasbeen boosted consistently by technological changes andpopulation ageing.
In order to assess cost-effectiveness, improvements in lifeexpectancy (the most adopted and comparable outcome) arecompared to total health expenditure per capita in coun-tries. Conclusions, however, should be drawn with care, asmany other factors beyond total health spending have amajor impact on life expectancy and total health expendi-ture comprises both public and private expenditures (theprivate share of health spending being particularly large incountries such as the United States and Mexico). Resultsshow that there is a positive relationship between totalhealth expenditure per capita and life expectancy, suggest-ing that higher health spending is associated with betterhealth outcomes for individuals. Italy, Japan and Spain standout as having relatively high life expectancy relative to theirexpenditure. On the other side, Hungary, Mexico and theUnited States have a relatively low life expectancy, giventheir total health spending. Similar results (see online figure)have shown that the overall positive relationship with lifeexpectancy is not affected when considering only publichealth spending. Nonetheless, the extent to which Mexicoand the United States have a relatively low life expectancycompared to the OECD average is slightly reduced when onlypublic spending on health care is taken into account.
GOVERNMENT AT A GLANCE 2013 © OECD 201356
2. STRATEGIC GOVERNANCE
Public sector cost-effectiveness
Further reading
OECD (2013a), Education at a Glance 2013: OECD Indicators, OECDPublishing, Paris, http://dx.doi.org/10.1787/eag-2013-en.
OECD (2013b, forthcoming), Health at a Glance 2013: OECDIndicators, OECD Publishing, Paris.
Figure notes
2.25: Data for upper secondary for Belgium and the Netherlands are notincluded because these education levels are compulsory. Data forupper secondary for Japan are not included because lower and uppersecondary education is not broken down. Data for Italy, theNetherlands and Poland are for 2008. Data for Japan are for 2007.Data for Turkey are for 2005. See Annex 3 for notes (www.oecd.org/edu/eag.htm).
2.26: Expenditure data for Belgium and New Zealand excludeinvestments. Expenditure data for the Netherlands are for currentexpenditure. Expenditure data for Belgium, Mexico and New Zealanduse a different methodology. Expenditure data for Chile, Israel andMexico are estimates. Life expectancy data for Australia, Belgium,Chile, France, Italy and the United States are estimates. Expendituredata for Australia, Israel, Japan and Luxembourg are for 2009.Expenditure data for Turkey are for 2008. Life expectancy data forCanada are for 2009.
Information on data for Israel: http://dx.doi.org/10.1787/888932315602.
Methodology and definitions
The public economic returns to education for malesare measured in terms of NPV. Public costs includelost income tax receipts during the schooling years.Public expenditures are related to educational attain-ment, taking into account the duration of studies, andinclude direct expenditure and public-private trans-fers. The benefits for the public sector are additionaltax and social contribution receipts associated withhigher earnings, and savings from transfers that thepublic sector does not have to pay above a certainearnings level. Values of data to compute the NPV forupper secondary education are based on the differ-ence between people who attained upper secondaryor post-secondary non-tertiary education and thosewho have not. Values of data to compute the NPV fortertiary education are based on the differencebetween people who attained tertiary education andthose who have attained upper secondary education.
Life expectancy measures how long on averagepeople would live based on a given set of age-specificdeath rates. Life expectancy at birth for the totalpopulation is calculated as the unweighted average ofmen and women. Total expenditure on healthmeasures the final consumption of health goods andservices (i.e. current expenditure), plus capital invest-ment in health care infrastructure. This includesspending by both public and private sources on medi-cal services and goods, public health and preventionprogrammes, and administration.
Figure 2.27, Life expectancy at birth and publicexpenditure on health care per capita (2011), is availableon line at http://dx.doi.org/10.1787/888932941291.
GOVERNMENT AT A GLANCE 2013 © OECD 2013 57

2. STRATEGIC GOVERNANCE
Public sector cost-effectiveness
2.25. Public net present value for a man obtaining upper secondary or post-secondary non-tertiary educationand tertiary education as part of initial education (2009 or latest available year)
Source: OECD (2013), Education at a Glance 2013: OECD Indicators, OECD Publishing, Paris, Table A7.2a and Table A7.4a, http://dx.doi.org/10.1787/eag-2013-en.
1 2 http://dx.doi.org/10.1787/888932941253
0 50 000 100 000 150 000 200 000 250 000 300 000020 00040 00060 00080 000100 000120 000140 000
21 724
27 525
27 605
35 654
37 640
43 983
49 427
56 593
62 143
67 411
69 283
80 061
81 333
83 217
97 476
98 091
104 071
104 194
104 737
118 266
120 165
129 064
133 560
140 717
168 693
169 064
207 728220 792
230 722
251 155
11 371
-6 138
17 739
60 018
16 422
21 551
55 434
30 835
59 202
34 403
43 145
22 713
14 148
22 837
80 179
16 263
53 735
37 984
1 921
36 89296 404
54 788
39 235
36 716
60 903
70 185
36 690
Total benefits Total cost
Upper secondary or post-secondary non-tertiary education Tertiary education
TurkeyEstoniaSpain
SwedenNew Zealand
KoreaDenmarkGreeceNorwayJapan
CanadaSlovak Republic
FranceIsrael
PortugalUnited Kingdom
FinlandAustraliaOECD29Poland
Czech RepublicAustria
NetherlandsGermany
ItalyBelgiumSloveniaIreland
United StatesHungary
Net presentvalue
Net present value
GOVERNMENT AT A GLANCE 2013 © OECD 201358
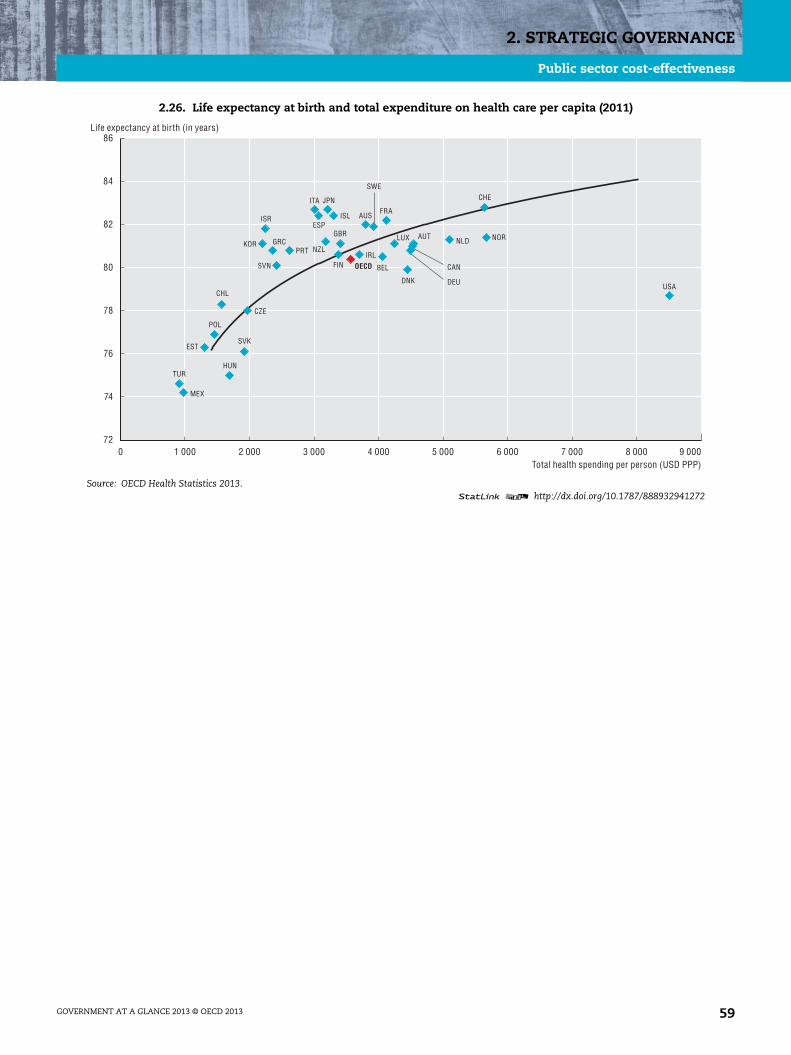
2. STRATEGIC GOVERNANCE
Public sector cost-effectiveness
2.26. Life expectancy at birth and total expenditure on health care per capita (2011)
Source: OECD Health Statistics 2013.1 2 http://dx.doi.org/10.1787/888932941272
72
74
76
78
80
82
84
86
0 1 000 2 000 3 000 4 000 5 000 6 000 7 000 8 000 9 000
AUS
AUT
BEL CAN
CHL
CZE
DNK
EST
FIN
FRA
DEU
GRC
HUN
ISL
IRL
ISR
ITA JPN
KORLUX
MEX
NLDNZL
NOR
POL
PRT
SVK
SVN
ESP
SWECHE
TUR
GBR
USA
Total health spending per person (USD PPP)
Life expectancy at birth (in years)
OECD
GOVERNMENT AT A GLANCE 2013 © OECD 2013 59

GOVERNMENT AT A GLANCE 2013 © OEC
3. PUBLIC FINANCE AND ECONOMICS
Governments have two main responsibilities: to provide goods and services(e.g. education and health care) and to redistribute income (e.g. through social benefits andsubsidies). Among many other responsibilities, governments are also responsible formanaging risks, addressing fairness in society, fighting corruption and protecting theenvironment. To finance these activities, governments raise money in the form of revenues(e.g. taxation) and/or through borrowing.
The health of public finances in most OECD member countries strongly deteriorated in theaftermath of the global financial and economic crisis. However, fiscal balance have been improvingin most OECD member countries since 2010, due to fiscal rules, new budget practices and fiscalconsolidation plans implemented in response to the crisis. Although these improvements indicatethat governments are on the right path, public debt levels continue to rise within a weak economicrecovery environment. Most OECD countries therefore still face the complex challenge of balancingfiscal consolidation and the urgent need to stimulate economic growth.
This chapter describes and analyses the variation among member countries in keyindicators in public finance and economics, helping to shed light on how governments areresponding to fiscal pressures. It includes indicators on government deficits/surpluses anddebts. It assesses trends in the size and structure of government revenues and expenditures,the costs of producing public goods and services, and the role of government in providing these,as well as the magnitude of government investment. Given the importance of information andcommunication technologies (ICT) for government innovation and productivity, the chapterpresents exploratory data on government ICT expenditures. In order to offer insights intolonger-term trends and the impact of the economic crisis, data for most indicators arepresented for 2001 (the base year), 2009 (the year in the midst of the crisis) and the latest yearfor which data are available (in most cases, 2011).
D 2013 61
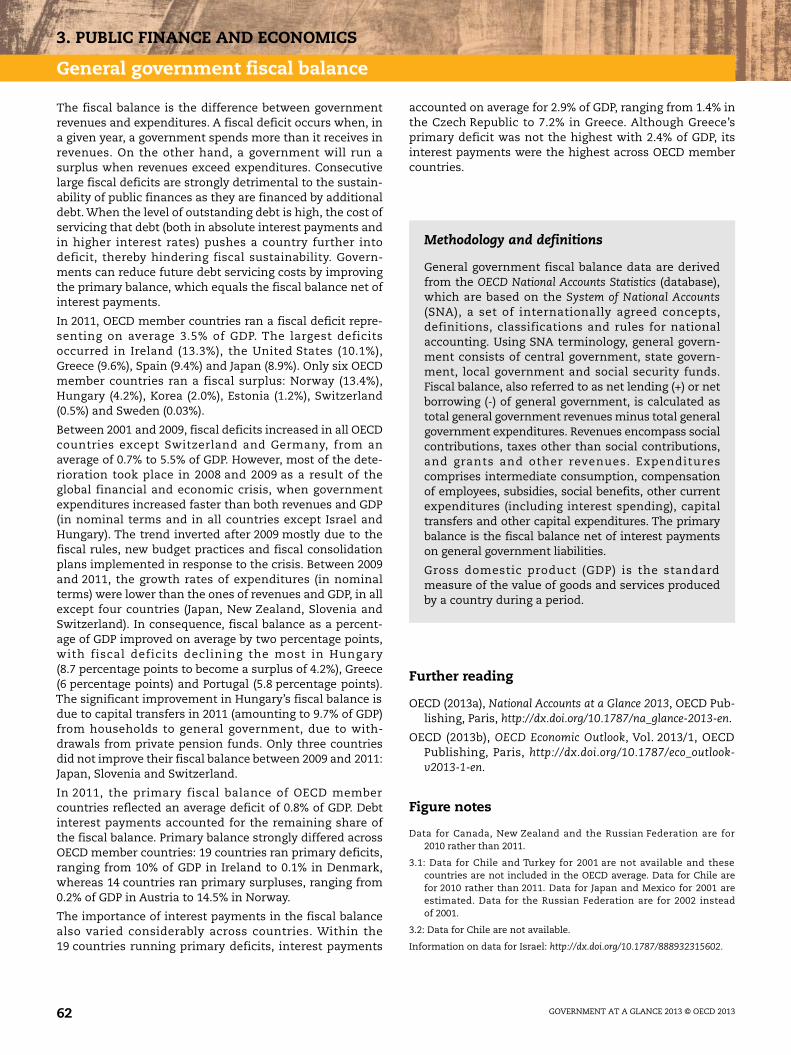
3. PUBLIC FINANCE AND ECONOMICS
General government fiscal balance
The fiscal balance is the difference between governmentrevenues and expenditures. A fiscal deficit occurs when, ina given year, a government spends more than it receives inrevenues. On the other hand, a government will run asurplus when revenues exceed expenditures. Consecutivelarge fiscal deficits are strongly detrimental to the sustain-ability of public finances as they are financed by additionaldebt. When the level of outstanding debt is high, the cost ofservicing that debt (both in absolute interest payments andin higher interest rates) pushes a country further intodeficit, thereby hindering fiscal sustainability. Govern-ments can reduce future debt servicing costs by improvingthe primary balance, which equals the fiscal balance net ofinterest payments.
In 2011, OECD member countries ran a fiscal deficit repre-senting on average 3.5% of GDP. The largest deficitsoccurred in Ireland (13.3%), the United States (10.1%),Greece (9.6%), Spain (9.4%) and Japan (8.9%). Only six OECDmember countries ran a fiscal surplus: Norway (13.4%),Hungary (4.2%), Korea (2.0%), Estonia (1.2%), Switzerland(0.5%) and Sweden (0.03%).
Between 2001 and 2009, fiscal deficits increased in all OECDcountries except Switzerland and Germany, from anaverage of 0.7% to 5.5% of GDP. However, most of the dete-rioration took place in 2008 and 2009 as a result of theglobal financial and economic crisis, when governmentexpenditures increased faster than both revenues and GDP(in nominal terms and in all countries except Israel andHungary). The trend inverted after 2009 mostly due to thefiscal rules, new budget practices and fiscal consolidationplans implemented in response to the crisis. Between 2009and 2011, the growth rates of expenditures (in nominalterms) were lower than the ones of revenues and GDP, in allexcept four countries (Japan, New Zealand, Slovenia andSwitzerland). In consequence, fiscal balance as a percent-age of GDP improved on average by two percentage points,with fiscal deficits declining the most in Hungary(8.7 percentage points to become a surplus of 4.2%), Greece(6 percentage points) and Portugal (5.8 percentage points).The significant improvement in Hungary’s fiscal balance isdue to capital transfers in 2011 (amounting to 9.7% of GDP)from households to general government, due to with-drawals from private pension funds. Only three countriesdid not improve their fiscal balance between 2009 and 2011:Japan, Slovenia and Switzerland.
In 2011, the primary fiscal balance of OECD membercountries reflected an average deficit of 0.8% of GDP. Debtinterest payments accounted for the remaining share ofthe fiscal balance. Primary balance strongly differed acrossOECD member countries: 19 countries ran primary deficits,ranging from 10% of GDP in Ireland to 0.1% in Denmark,whereas 14 countries ran primary surpluses, ranging from0.2% of GDP in Austria to 14.5% in Norway.
The importance of interest payments in the fiscal balancealso varied considerably across countries. Within the19 countries running primary deficits, interest payments
accounted on average for 2.9% of GDP, ranging from 1.4% inthe Czech Republic to 7.2% in Greece. Although Greece’sprimary deficit was not the highest with 2.4% of GDP, itsinterest payments were the highest across OECD membercountries.
Further reading
OECD (2013a), National Accounts at a Glance 2013, OECD Pub-lishing, Paris, http://dx.doi.org/10.1787/na_glance-2013-en.
OECD (2013b), OECD Economic Outlook, Vol. 2013/1, OECDPublishing, Paris, http://dx.doi.org/10.1787/eco_outlook-v2013-1-en.
Figure notes
Data for Canada, New Zealand and the Russian Federation are for2010 rather than 2011.
3.1: Data for Chile and Turkey for 2001 are not available and thesecountries are not included in the OECD average. Data for Chile arefor 2010 rather than 2011. Data for Japan and Mexico for 2001 areestimated. Data for the Russian Federation are for 2002 insteadof 2001.
3.2: Data for Chile are not available.
Information on data for Israel: http://dx.doi.org/10.1787/888932315602.
Methodology and definitions
General government fiscal balance data are derivedfrom the OECD National Accounts Statistics (database),which are based on the System of National Accounts(SNA), a set of internationally agreed concepts,definitions, classifications and rules for nationalaccounting. Using SNA terminology, general govern-ment consists of central government, state govern-ment, local government and social security funds.Fiscal balance, also referred to as net lending (+) or netborrowing (-) of general government, is calculated astotal general government revenues minus total generalgovernment expenditures. Revenues encompass socialcontributions, taxes other than social contributions,and grants and other revenues. Expenditurescomprises intermediate consumption, compensationof employees, subsidies, social benefits, other currentexpenditures (including interest spending), capitaltransfers and other capital expenditures. The primarybalance is the fiscal balance net of interest paymentson general government liabilities.
Gross domestic product (GDP) is the standardmeasure of the value of goods and services producedby a country during a period.
GOVERNMENT AT A GLANCE 2013 © OECD 201362

3. PUBLIC FINANCE AND ECONOMICS
General government fiscal balance
3.1. General government fiscal balance as a percentage of GDP (2001, 2009 and 2011)
Source: Data for OECD member countries: OECD National Accounts Statistics (database). Data for the other major economies (excluding theRussian Federation): International Monetary Fund (2013), Economic Outlook, April 2013, IMF, Washington, DC.
1 2 http://dx.doi.org/10.1787/888932941310
3.2. General government primary balance and interest spending as a percentage of GDP (2011)
Source: OECD National Accounts Statistics (database).1 2 http://dx.doi.org/10.1787/888932941329
% 2011
-20
-15
-10
-5
0
5
10
15
2009 2001
Irelan
d
United
States
GreeceSpa
inJa
pan
United
Kingdo
m
New Ze
aland
Sloven
ia
Icelan
d
Canad
a
Franc
e
Slovak
Rep
ublic
Poland
Netherl
ands
Israe
l
Portug
al
Austra
lia
Belgium Ita
lyOEC
D
Czech
Rep
ublic
Austri
a
Denmark
Finlan
d
Turke
y
German
yChil
e
Luxe
mbourg
Mexico
Sweden
Switzerl
and
Eston
iaKor
ea
Hunga
ry
Norway
India
South
Africa
Ukraine
BrazilChin
a
Russia
n Fed
eratio
n
Indon
esia
%
- 15
- 10
- 5
0
5
10
15
20
Irelan
d
United
States
Greece
Spain
Japa
n
United
Kingdo
m
New Ze
aland
Sloven
ia
Icelan
d
Canad
a
Franc
e
Slovak
Rep
ublic
Poland
Israe
l
Portug
al
Netherl
ands
Austra
lia
Belgium Ita
lyOEC
D
Czech
Rep
ublic
Austri
a
Denmark
Finlan
d
Turke
y
German
y
Luxe
mbourg
Mexico
Sweden
Switzerl
and
Eston
iaKor
ea
Hunga
ry
Norway
Russia
n Fed
eratio
n
Fiscal balancePrimary balance Interest
GOVERNMENT AT A GLANCE 2013 © OECD 2013 63

3. PUBLIC FINANCE AND ECONOMICS
General government debt
When expenditures exceed revenues, governments needadditional resources to finance their deficits, consequentlythey borrow money and increase the level of public debt.Changes in debt over time reflect the behaviour of pastfiscal balances; recurring large deficits will result in higherdebt levels. On the contrary, a succession of surpluses willreduce debt levels. In general, the higher a government’sliabilities, the higher the perceived probability by marketsof a government defaulting on loans and therefore thehigher risk premium required by the market, which in turn,raises the cost of debt.
On average, general government debt across OECD membercountries represented 78.8% of GDP in 2011; this figurevaried from 10% in Estonia to 228% in Japan. Debt in themajority of the OECD member countries was higher in 2011than it was in 2001. However, this result stems fromcombined patterns, with debt-to-GDP ratios droppinguntil 2007 mainly as a result of economic growth. Debt hascontinuously increased since then, mostly due to the globalfinancial crisis, and more specifically as a result of lowerrevenue collections, declines in economic activity and/oradditional spending on stimulus packages and inter-ventions to support financial institutions. Over this periodthe biggest increases took place in Japan (76.6 percentagepoints), Ireland (67 p.p.), the United Kingdom (55.1 p.p.),and the United States (48.1 p.p.).
The debt burden per capita varies considerably, rangingfrom USD 2 207 in Estonia to USD 77 134 in Japan. Onaverage the figure is USD 26 774 for OECD membercountries. Despite the high debt levels in Japan, themajority of government debt is owned by Japanese citizens,and therefore the risk of default (and hence the need to payrisk premiums) is considered to be lower.
With the exception of Australia and Estonia, securitiesother than shares are the preferred debt instrument forOECD member countries. A debt structure relying highly onsecurities other than shares is linked to market fluctua-tions, affecting the cost of debt.
Further reading
OECD (2013), OECD Factbook 2013: Economic, Environmentaland Social Statistics, OECD Publishing, Paris, http://dx.doi.org/10.1787/factbook-2013-en.
Figure notes
Data for Iceland, New Zealand and Turkey are not available. Data forChile, Japan, Korea and the United Kingdom are reported on a non-consolidated basis. Data for Switzerland are for 2010 rather than 2011.
3.3: Data for 2001 for Chile and Luxembourg and for 2011 for Mexico arenot available and these countries are not included in the OECDaverage. Data for Korea are for 2002 rather than 2001. Data forDenmark are for 2003 rather than 2001.
3.4 and 3.5: Data for Mexico are not available.
Information on data for Israel: http://dx.doi.org/10.1787/888932315602.
Methodology and definitions
Data are derived from the OECD National AccountsStatistics (database), which are based on the System ofNational Accounts (SNA), a set of internationally agreedconcepts, definitions, classifications and rules fornational accounting. Debt is a commonly usedconcept, defined as a specific subset of liabilities iden-tified according to the types of financial instrumentsincluded or excluded. Generally, debt is defined as allliabilities that require payment or payments of interestor principal by the debtor to the creditor at a date ordates in the future. Consequently, all debt instrumentsare liabilities, but some liabilities such as shares,equity and financial derivatives are not debt.
Debt is thus obtained as the sum of the followingliability categories (according to the 1993 System ofNational Accounts), whenever available/applicable inthe financial balance sheet of the institutional sector:currency and deposits; securities other than shares,except financial derivatives; loans; insurance techni-cal reserves; and other accounts payable. According tothe SNA, most debt instruments are valued at marketprices (although some countries might not apply thisvaluation, in particular for securities other thanshares, except financial derivatives).
These data are not always comparable across countriesdue to different definitions or treatment of debt compo-nents. Notably, they include the unfunded governmentsponsored retirement schemes for some OECD coun-tries (e.g. Australia and Canada) as well as for the coun-tries whose data source is the IMF Economic Outlook. Thedebt position for these countries is thus overstatedrelative to countries that have large unfunded liabilitiesfor pensions, and that are not recorded in the coreaccounts of the 1993 SNA.
The SNA definition of debt differs from the definitionapplied under the Maastricht Treaty, which is used toassess EU fiscal positions. Figure 3.7, Maastricht generalgovernment debt by debt holder (2011), is availableon line at http://dx.doi.org/10.1787/888932941424.
Government debt per capita was calculated byconverting government debt to USD 2011 using theOECD/Eurostat purchasing power parities (PPP) for GDPand dividing them by population. For the countrieswhose data source is the IMF Economic Outlook, animplied PPP conversion rate was used. PPP is thenumber of units of country B’s currency needed topurchase the same quantity of goods and services inCountry A. Figure 3.6, Annual growth rate of realgovernment debt per capita (from 2001 to 2011), is avail-able on line at http://dx.doi.org/10.1787/888932941405.
GOVERNMENT AT A GLANCE 2013 © OECD 201364
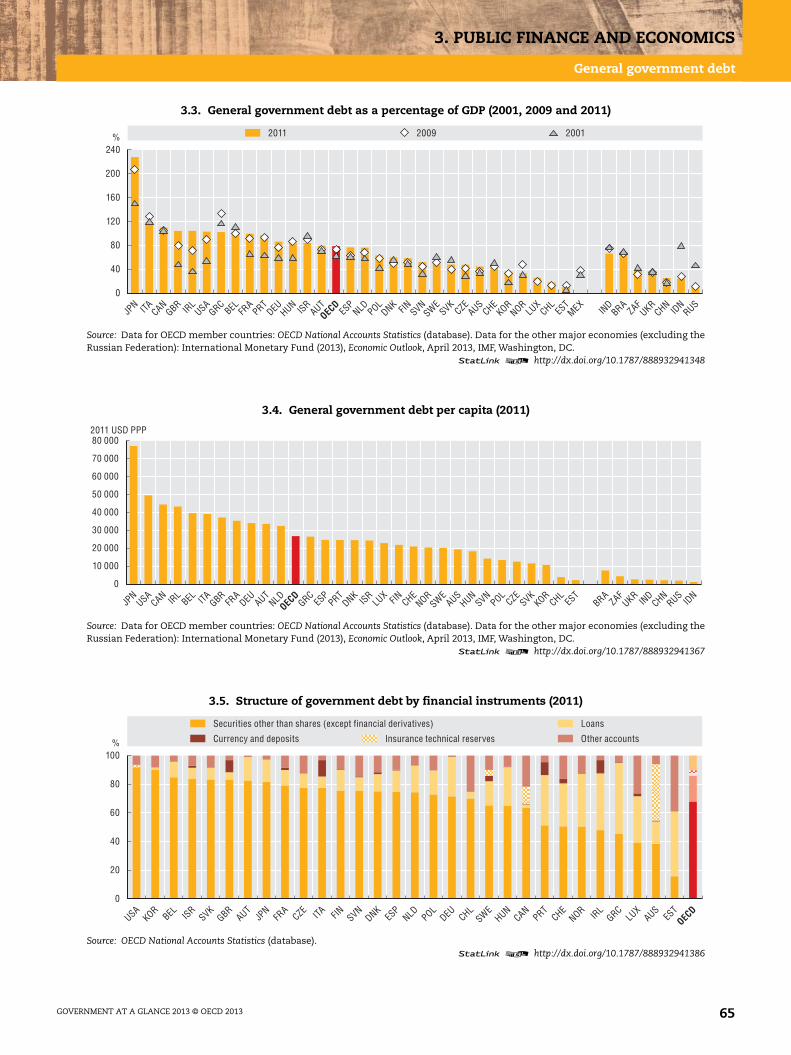
3. PUBLIC FINANCE AND ECONOMICS
General government debt
3.3. General government debt as a percentage of GDP (2001, 2009 and 2011)
Source: Data for OECD member countries: OECD National Accounts Statistics (database). Data for the other major economies (excluding theRussian Federation): International Monetary Fund (2013), Economic Outlook, April 2013, IMF, Washington, DC.
1 2 http://dx.doi.org/10.1787/888932941348
3.4. General government debt per capita (2011)
Source: Data for OECD member countries: OECD National Accounts Statistics (database). Data for the other major economies (excluding theRussian Federation): International Monetary Fund (2013), Economic Outlook, April 2013, IMF, Washington, DC.
1 2 http://dx.doi.org/10.1787/888932941367
3.5. Structure of government debt by financial instruments (2011)
Source: OECD National Accounts Statistics (database).1 2 http://dx.doi.org/10.1787/888932941386
%
0
40
80
120
160
200
240
JPN ITA CAN
GBR IRL
USAGRC
BEL FRA
PRTDEU HUN ISR
AUTES
PNLD POL
DNK FIN SVNSWE
SVKCZE
AUSCHE
KORNOR
LUX
CHLES
TMEX
IND
BRAZAF
UKRCHN
IDN
RUS
2011 2009 2001
OECD
0
10 000
20 000
30 000
40 000
50 000
60 000
70 000
80 000
IDN
RUSCHN
IND
UKRZAF
BRAES
TCHL
KORSVK
CZEPOL
SVNHUN
AUSSWE
NORCHEFINLU
XISR
DNKPRT
ESP
GRCNLDAUT
DEUFRA
GBRITABELIRL
CANUSA
JPN
2011 USD PPP
OECD
%
0
20
40
60
80
100
USAKOR
BEL ISRSVK
GBRAUT
JPN
FRA
CZE ITA FIN SVNDNK
ESP
NLD POLDEU CHL
SWEHUN
CANPRT
CHENOR IR
LGRC
LUX
AUSES
T
Currency and deposits Insurance technical reserves
Securities other than shares (except financial derivatives) Loans
Other accounts
OECD
GOVERNMENT AT A GLANCE 2013 © OECD 2013 65

3. PUBLIC FINANCE AND ECONOMICS
Fiscal balance and debt by level of government
Central governments share different degrees of sovereigntywith sub-central governments. As a consequence thosesub-central governments may encounter diverse fiscalsituations. Different political systems are characterised byvarying degrees of autonomy at state and local levels toincur debt; sub-national governments are usually subject totight fiscal rules, and, in particular, their capacity to incurdebt is often limited. Liabilities from sub-national govern-ments resulting from the need to finance deficits throughborrowing are considered as debt of the sub-nationalgovernments. Even modest increases in debt by a largenumber of government entities (e.g. states or municipalities)may increase general government debt (across all levels ofgovernment), thereby affecting budget balances and poten-tially interest rates on public debt.
When compared to central governments, the revenue baseof sub-national governments is in most cases small. As aconsequence, most sub-national governments in OECDmember countries rely on transfers from the centralgovernments. In 2011, and on average across OECD membercountries, central governments had a fiscal deficit repre-senting 3.2% of GDP, only 0.2 percentage points lower thangeneral governments. In the cases of Australia, Canada,Germany and Spain, over a third of the general governmentbalance is driven by the balance at the state level.
Overall, sub-national debt levels are not significantly largeacross OECD member countries when compared to generalgovernment debt, with the exception of a few (mainly federaland quasi-federal) countries. In 2011, sub-national debtaccounted for an average of 11.8% of GDP, with local level debtranging from 1.3% of GDP in Greece to 38% of GDP in Japan. Inthe cases of Canada, Germany, the United States (state andlocal governments) and Spain, state government debt levelsas a share of GDP were respectively 53.3%, 26.0%, 24.7%and 18.7%.
Between 2001 and 2011, no major changes occurred in thedebt structure across government levels for OECD membercountries. In the case of the United Kingdom, sub-nationalgovernment debt was reduced by 7.1 percentage points,however this trend is likely to be inverted for upcomingyears as a consequence of the Housing Revenue Account’sreform, which may increase borrowing from local govern-ments. Similarly, a considerable decline in the share ofsub-national debt also occurred in Japan, the Netherlandsand the United States. However, as overall debt levels havecontinued to increase in these countries, these declines canbe attributed to a slower growth of debt at the sub-nationallevels compared to the growth of debt at the central level. Inaddition, sub-national governments are often submitted tostrict fiscal rules and required by central governments toparticipate in national consolidation efforts.
Further reading
Teresa Ter-Minassian (2007), “Fiscal Rules for SubnationalGovernments: Can They Promote Fiscal Discipline?”,OECD Journal on Budgeting, Vol. 6/3, OECD Publishing,Paris, http://dx.doi.org/10.1787/budget-v6-art17-en.
Vammalle, C. and C. Hulbert (2013), “Sub-National Financesand Fiscal Consolidation: Walking on Thin Ice”, OECDRegional Development Working Papers, No. 2013/02, OECDPublishing, Paris, http://dx.doi.org/10.1787/5k49m8cqkcf3-en.
Figure notes
Data for Chile are not available. Local government is included in stategovernment for Australia and the United States. Australia does notoperate public social insurance schemes. Social security funds areincluded in central government in Norway, the United Kingdom andthe United States.
3.8: Data for Canada and New Zealand are for 2010 rather than 2011.
3.9: Data for Mexico, New Zealand, Switzerland and Turkey are notavailable. Data for central government are not available for Icelandand Ireland and these countries are not included in the OECD average.Data for Japan, Korea, the United Kingdom and the United States arereported on a non-consolidated basis. Data for Switzerland are for2010 rather than 2011.
3.10: Data for Iceland, Mexico, New Zealand and Turkey are not available.Data for 2001 for Israel and Luxembourg are not available and thesecountries are not included in the OECD average. Data are reported ona non-consolidated basis (apart from Australia). Data for Switzerlandare for 2010 rather than 2011. Data for Korea are for 2002 ratherthan 2001. Data for Denmark are for 2003 rather than 2001.
Information on data for Israel: http://dx.doi.org/10.1787/888932315602.
Methodology and definitions
Data are derived from the OECD National AccountsStatistics (database), based on the System of NationalAccounts (SNA), a set of internationally agreed concepts,definitions, classifications and rules for nationalaccounting. Using SNA terminology, general govern-ment consists of central, state and local governments,and social security funds. State government is onlyapplicable to the nine OECD member countries that arefederal states: Australia, Austria, Belgium, Canada, Ger-many, Mexico, Spain (considered a quasi-federal coun-try), Switzerland and the United States.
Fiscal balance, also referred to as net lending (+) or netborrowing (-) of general government, is calculated astotal general government revenues minus total generalgovernment expenditures.
For additional information on debt, see the “metho-dology and definitions” section of the “Generalgovernment debt” indicator on page 64.
GOVERNMENT AT A GLANCE 2013 © OECD 201366
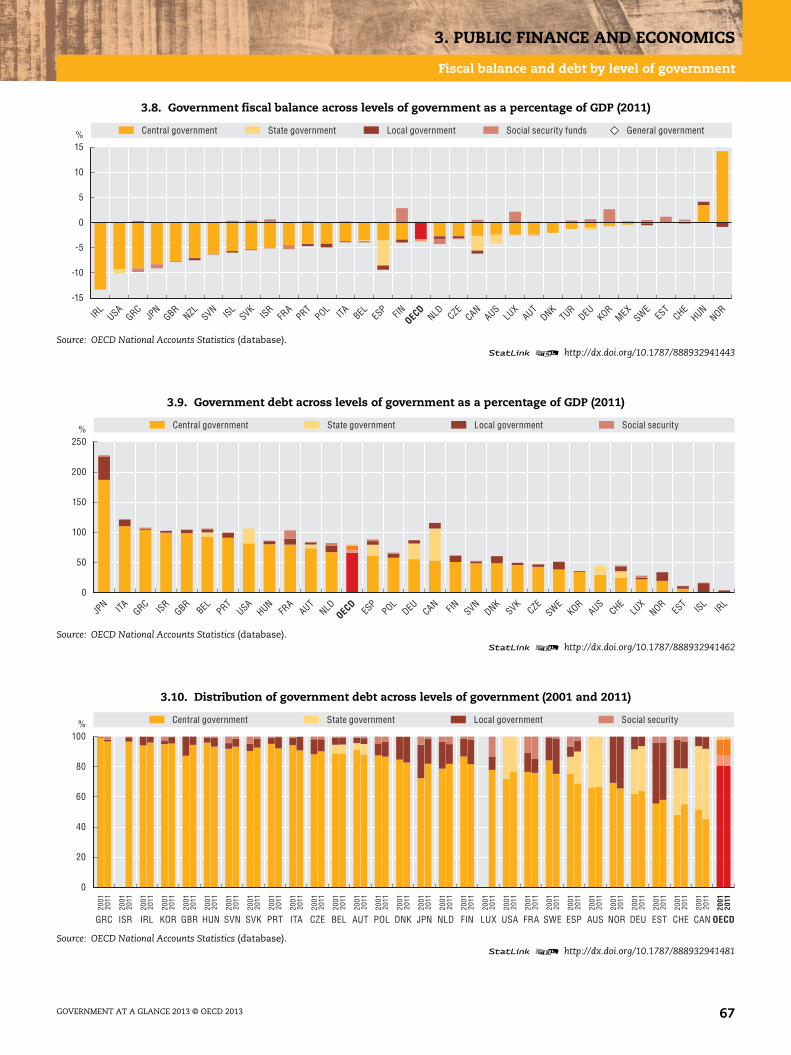
3. PUBLIC FINANCE AND ECONOMICS
Fiscal balance and debt by level of government
3.8. Government fiscal balance across levels of government as a percentage of GDP (2011)
Source: OECD National Accounts Statistics (database).1 2 http://dx.doi.org/10.1787/888932941443
3.9. Government debt across levels of government as a percentage of GDP (2011)
Source: OECD National Accounts Statistics (database).1 2 http://dx.doi.org/10.1787/888932941462
3.10. Distribution of government debt across levels of government (2001 and 2011)
Source: OECD National Accounts Statistics (database).1 2 http://dx.doi.org/10.1787/888932941481
-15
-10
-5
0
5
10
15%
IRL
USAGRC
JPN
GBRNZL SVN ISL
SVKISR
FRA
PRTPOL ITA BEL ES
P FIN NLD CZECAN
AUSLU
XAUT
DNKTUR
DEU KORMEX
SWEES
TCHE
HUNNOR
Central government State government Local government Social security funds General government
OECD
0
50
100
150
200
250%
JPN ITA GRC
ISRGBR
BEL PRTUSA
HUNFR
AAUT
NLD ESP
POLDEU CAN FIN SVN
DNKSVK
CZESWE
KORAUS
CHELU
XNOR
EST ISL
IRL
Central government State government Local government Social security
OECD
%
0
20
40
60
80
100
GRC ISR IRL KOR GBR HUN SVN SVK PRT ITA CZE BEL AUT POL DNK JPN NLD FIN LUX USA FRA SWE ESP AUS NOR DEU EST CHE CAN
2001
2001
2001
2001
2001
2001
2001
2001
2001
2001
2001
2001
2001
2001
2001
2001
2001
2001
2001
2001
2001
2001
2001
2001
2001
2001
2001
2001
2001
2001
2011
2011
2011
2011
2011
2011
2011
2011
2011
2011
2011
2011
2011
2011
2011
2011
2011
2011
2011
2011
2011
2011
2011
2011
2011
2011
2011
2011
2011
2011
Central government State government Local government Social security
OECD
GOVERNMENT AT A GLANCE 2013 © OECD 2013 67
3. PUBLIC FINANCE AND ECONOMICS
General government revenues
Governments collect revenues mainly for two purposes: tofinance the goods and services they deliver to citizens andbusinesses and to fulfil their redistributive role. Majorsources of revenues of governments are taxes collected fromhouseholds and corporations as well as social contributions.Comparing levels of government revenues across OECDmember countries, as a share of GDP or per capita, providesan indication of the importance of the public sector in theeconomy in terms of available financial resources. The totalamount of revenues collected by governments is determinedby past and current political decisions that are themselvesbased on cultural expectations for social redistribution,fiscal constraints and economic fluctuations and perfor-mance. As such, levels of government revenues stronglydiffer across OECD member countries.
In 2011, general government revenues represented 41.9% ofGDP on average across OECD countries, a level only0.2 percentage points higher than a decade earlier (41.7%in 2001). The levels collected across countries vary signifi-cantly, from 57.3% in Norway to 22.7% in Mexico. Nordiccountries tend to collect higher revenues than other groupsof countries, as most of their social benefits to householdsare taxable. Although government revenues as a share ofGDP remained stable across OECD member countriesbetween 2001 and 2011, there were significant fluctuationsacross countries. They increased the most in Hungary(10.1 percentage points) and in Portugal (6.6 percentagepoints), although this increase occurred mostly since2009 for both countries in response to the fiscal crisis inthose countries. Government revenues as a share of GDPdecreased the most during the same period in Israel(7.3 percentage points) and Sweden (4.9 percentage points),although in Israel they rose between 2009 and 2011.Government revenues increased in two-thirds of OECDmember countries during 2009-11.
On average across the OECD, government revenues repre-sented USD 15 141 PPP per capita in 2011. When expressedin terms of population, the difference in magnitudebetween the highest and lowest collectors of governmentrevenues across OECD countries is over 9 fold (USD 36 800per capita in Luxembourg compared to almost USD 4 000 inMexico), whereas it is only 2.5 fold when expressed as ashare of GDP.
Government revenues per capita increased on averageby 1.5% every year across OECD member countriesbetween 2001 and 2011. The highest average annualincreases occurred in Estonia (5.3%) and Korea (5.0%).Government revenues declined in only four OECD countries
during the same period, though very moderately, rangingbetween 0.1% and 0.3% on average per year: Italy, theUnited States, Spain and Canada.
Further reading
OECD (2013), National Accounts at a Glance 2013, OECD Pub-lishing, Paris, http://dx.doi.org/10.1787/na_glance-2013-en.
Figure notes
Data for Chile are not available. Data for Canada, New Zealand and theRussian Federation are for 2010 rather than 2011. Data for Japan andMexico for 2001 data are estimated. Data for the Russian Federationare for 2002 rather than 2001.
3.11: Data for Turkey for 2001 are not available and this country is notincluded in the OECD average.
3.12: Data for Turkey are not available.
Information on data for Israel: http://dx.doi.org/10.1787/888932315602.
Methodology and definitions
Government revenues data are derived from the OECDNational Accounts Statistics (database), which are basedon the System of National Accounts (SNA), a set of inter-nationally agreed concepts, definitions, classifica-tions and rules for national accounting. Using SNAterminology, general government consists of centralgovernment, state government, local government andsocial security funds. Revenues encompass socialcontributions, taxes other than social contributions,and grants and other revenues. Gross domesticproduct (GDP) is the standard measure of the value ofgoods and services produced by a country during aperiod.
Government revenues per capita were calculated byconverting total revenues to USD 2011 using theOECD/Eurostat purchasing power parities (PPP) forGDP and dividing them by population. For thecountries whose data source is the IMF EconomicOutlook an implied PPP conversion rate was used. PPPis the number of units of country B’s currency neededto purchase the same quantity of goods and servicesin country A.
GOVERNMENT AT A GLANCE 2013 © OECD 201368
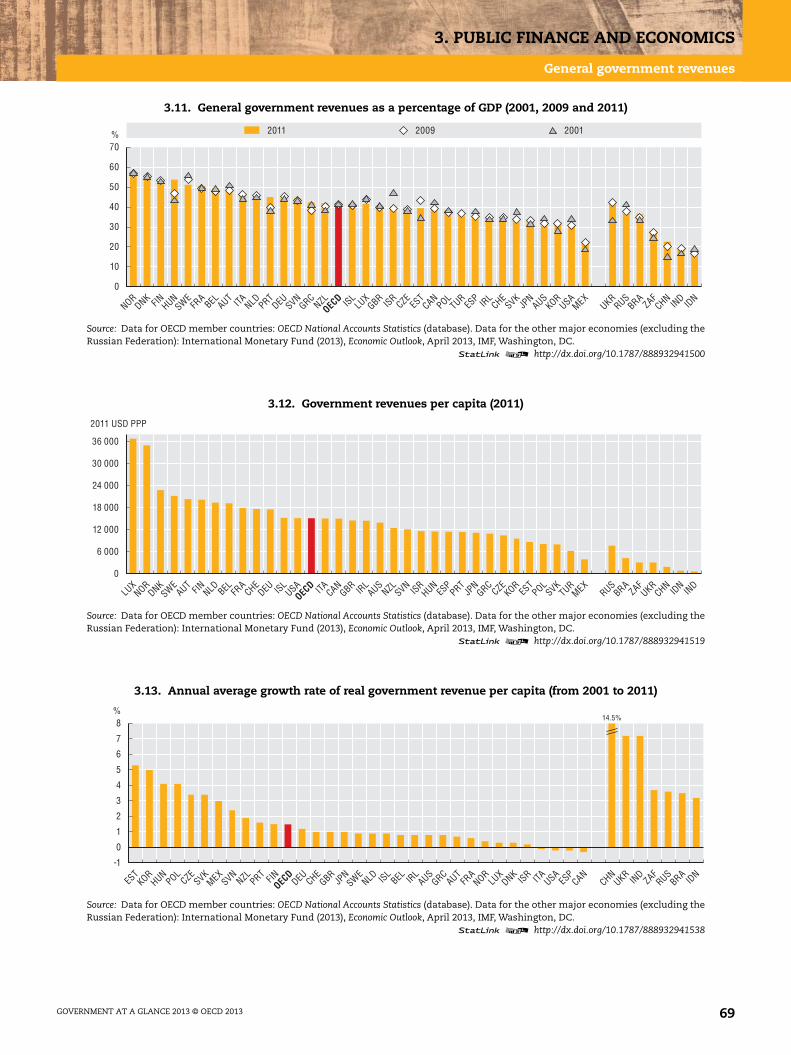
3. PUBLIC FINANCE AND ECONOMICS
General government revenues
3.11. General government revenues as a percentage of GDP (2001, 2009 and 2011)
Source: Data for OECD member countries: OECD National Accounts Statistics (database). Data for the other major economies (excluding theRussian Federation): International Monetary Fund (2013), Economic Outlook, April 2013, IMF, Washington, DC.
1 2 http://dx.doi.org/10.1787/888932941500
3.12. Government revenues per capita (2011)
Source: Data for OECD member countries: OECD National Accounts Statistics (database). Data for the other major economies (excluding theRussian Federation): International Monetary Fund (2013), Economic Outlook, April 2013, IMF, Washington, DC.
1 2 http://dx.doi.org/10.1787/888932941519
3.13. Annual average growth rate of real government revenue per capita (from 2001 to 2011)
Source: Data for OECD member countries: OECD National Accounts Statistics (database). Data for the other major economies (excluding theRussian Federation): International Monetary Fund (2013), Economic Outlook, April 2013, IMF, Washington, DC.
1 2 http://dx.doi.org/10.1787/888932941538
% 2011
0
10
20
30
40
50
60
70
NORDNK FIN HUN
SWEFR
ABEL AUT ITA NLD PRT
DEU SVNGRC
NZL ISLLU
XGBR ISR
CZEES
TCAN
POLTUR
ESP IR
LCHE
SVKJP
NAUS
KORUSA
MEXUKR
RUSBRA
ZAFCHN
IND
IDN
2009 2001
OECD
0
6 000
12 000
18 000
24 000
30 000
36 000
IND
IDN
CHNUKR
ZAFBRA
RUSMEX
TURSVK
POLES
TKOR
CZEGRC
JPN
PRTES
PHUNISR
SVNNZLAUSIR
LGBR
CANITAUSAISLDEUCHE
FRA
BELNLDFINAUTSWE
DNKNOR
LUX
2011 USD PPP
OECD
%
-1
0
1
2
3
4
5
6
7
8
IDN
BRARUS
ZAFIN
DUKR
CHNCAN
ESP
USAITAISRDNK
LUX
NORFR
AAUT
GRCAUSIR
LBELISL
NLDSWEJP
NGBR
CHEDEUFINPRT
NZLSVNMEX
SVKCZE
POLHUN
KORES
TOEC
D
14.5%
GOVERNMENT AT A GLANCE 2013 © OECD 2013 69

3. PUBLIC FINANCE AND ECONOMICS
Structure of general government revenues
Analysing the structure of general government revenuesprovides an indication of the relative contributions fromcitizens and/or sectors of the economy to finance govern-ment expenditures.
In 2011, and on average across OECD member countries,over 60% of general government revenues were collectedthrough taxes other than social contributions, almost 25%through social contributions, while the remainder werecollected through grants and other revenues. Governmentexpenditures are financed differently across OECD membercountries. Denmark and Australia, for example, arerelatively more dependent on taxes other than socialcontributions (over 80% of total revenues), and thereforefinance welfare spending through general taxation. On theother hand, the Czech Republic, France, Germany, Japan,the Slovak Republic and Spain rely relatively more on socialcontributions (almost 40% of total revenues). Norway is theonly country whose contribution of grants and other reve-nues exceeded 25% of total revenues (mostly explained bydividend and interest earned by the government sovereignwealth fund, from which the capital is built up throughaccumulation of net revenues from the petroleum sector).
Between 2009 and 2011, the structure of government revenuesremained fairly stable on average across OECD membercountries. The share of taxes other than social contributionsincreased by 0.4 percentage points, the share of social contri-butions decreased by 0.6 percentage points – due to theimpact of the economic crisis reducing employment andthereby social contributions – and grants and other revenuesincreased by 0.2 percentage points. The structure of govern-ment revenues changed the most significantly in Hungary(grants and other contributions increased by 16.7 percentagepoints), Mexico (taxes other than social contributionsincreased by 9.3 percentage points) and Portugal (grants andother contributions increased by 6.8 percentage points).
On average across OECD member countries, a third of totaltax revenues (including social security contributions)in 2010 were generated by taxes on income and profits,another third by taxes on goods and services (of whichvalue added tax (VAT) constitutes a significant share), overa quarter from social security contributions and theremaining from property taxes (5.4%), payroll taxes (1%)and other taxes (0.6%). This breakdown was very similarin 2001. However, OECD member countries place differentemphasis on different taxes. For instance, the majority oftax revenues in Denmark, Australia and New Zealand arecollected through taxes on income and profits.
Further reading
OECD (2012), Revenue Statistics 2012, OECD Publishing, Paris,http://dx.doi.org/10.1787/rev_stats-2012-en-fr.
OECD (2010), Tax Policy Reform and Economic Growth, OECDTax Policy Studies, No. 20, OECD Publishing, Paris, http://dx.doi.org/10.1787/9789264091085-en.
Figure notes
3.14 and 3.15: Data for Chile are not available. Data for Japan and Turkeyfor 2001 are not available and these countries are not included in theOECD average. Australia does not collect revenues via social contri-butions because it does not operate government social insuranceschemes. Capital taxes are not available for the Russian Federation.Data for Canada, New Zealand and the Russian Federation are for2010 rather than 2011. Data for Mexico are for 2003 rather than 2001.Data for the Russian Federation are for 2002 rather than 2001.
3.16: For the OECD member countries, part of the European Union total tax-ation includes custom duties collected on behalf of the European Union.
Information on data for Israel: http://dx.doi.org/10.1787/888932315602.
Methodology and definitions
Revenues data are derived from the OECD NationalAccounts Statistics (database), which are based on theSystem of National Accounts (SNA), a set of internation-ally agreed concepts, definitions, classifications andrules for national accounting. Using SNA terminology,general government consists of central, state, localgovernment and social security funds. Revenuesencompass taxes other than social contributions(e.g. taxes on consumption, income, wealth, propertyand capital), social contributions (e.g. contributions forpensions, health care and social security), and grants(from foreign governments or international organisa-tions) and other revenues (e.g. sales, fees, propertyincome and subsidies). These aggregates are notdirectly available in the OECD National AccountsStatistics (database), and were constructed using sub-account line items (see Annex A). The data presentedin Figure 3.16 are from OECD Revenue Statistics.
The OECD Revenue Statistics and the SNA differ in theirdefinitions of tax revenues. In the SNA, taxes arecompulsory unrequited payments, in cash or in kind,made by institutional units to the general govern-ment. Social contributions are actual or imputedpayments to social insurance schemes to makeprovision for social insurance benefits. These contri-butions may be compulsory or voluntary and theschemes may be funded or unfunded. OECD RevenueStatistics treat compulsory social security contribu-tions as taxes whereas the SNA considers them socialcontributions because the receipt of social securitybenefits depends, in most countries, upon appro-priate contributions having been made, even thoughthe size of the benefits is not necessarily related tothe amount of the contributions.
GOVERNMENT AT A GLANCE 2013 © OECD 201370
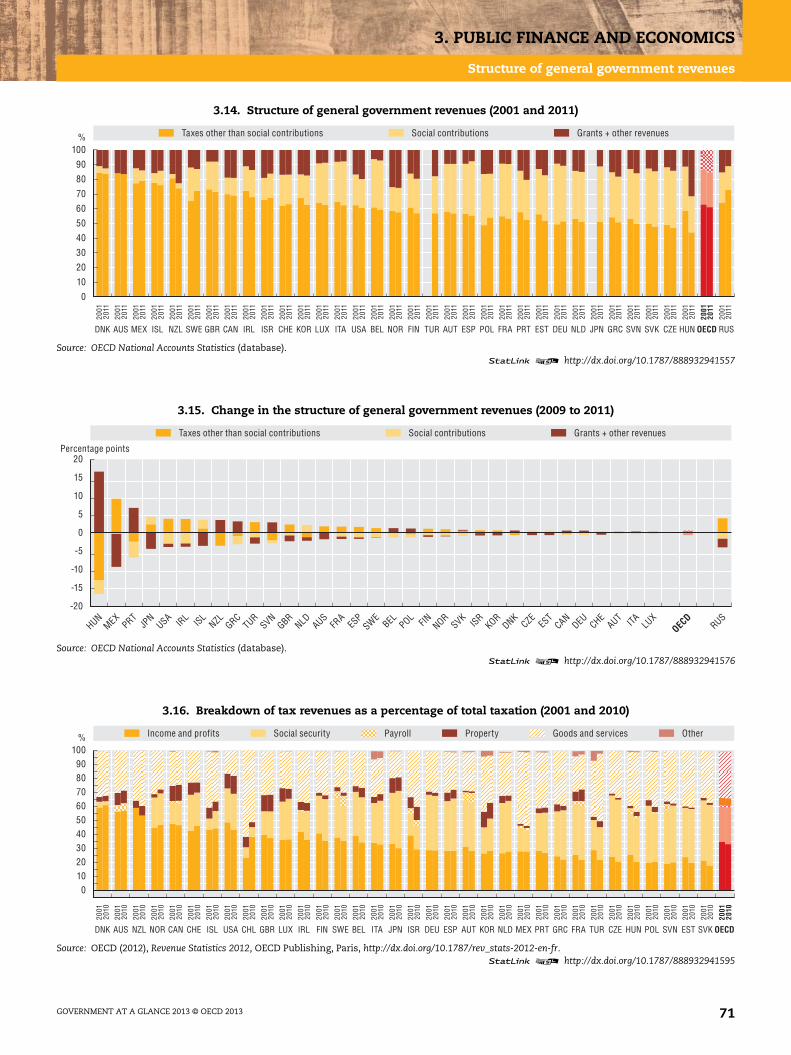
3. PUBLIC FINANCE AND ECONOMICS
Structure of general government revenues
3.14. Structure of general government revenues (2001 and 2011)
Source: OECD National Accounts Statistics (database).1 2 http://dx.doi.org/10.1787/888932941557
3.15. Change in the structure of general government revenues (2009 to 2011)
Source: OECD National Accounts Statistics (database).1 2 http://dx.doi.org/10.1787/888932941576
3.16. Breakdown of tax revenues as a percentage of total taxation (2001 and 2010)
Source: OECD (2012), Revenue Statistics 2012, OECD Publishing, Paris, http://dx.doi.org/10.1787/rev_stats-2012-en-fr.1 2 http://dx.doi.org/10.1787/888932941595
%
0
10
20
30
40
50
60
70
80
90
100
DNK AUS MEX ISL NZL SWE GBR CAN IRL ISR CHE KOR LUX ITA USA BEL NOR FIN TUR AUT ESP POL FRA PRT EST DEU NLD JPN GRC SVN SVK CZE HUN RUS
2001
2001
2001
2001
2001
2001
2001
2001
2001
2001
2001
2001
2001
2001
2001
2001
2001
2001
2001
2001
2001
2001
2001
2001
2001
2001
2001
2001
2001
2001
2001
2001
2001
2001
2001
2011
2011
2011
2011
2011
2011
2011
2011
2011
2011
2011
2011
2011
2011
2011
2011
2011
2011
2011
2011
2011
2011
2011
2011
2011
2011
2011
2011
2011
2011
2011
2011
2011
2011
2011
Taxes other than social contributions Social contributions Grants + other revenues
OECD
-20
-15
-10
-5
0
5
10
15
20
HUNMEX
PRTJP
NUSA IR
L ISLNZL GRC
TURSVN
GBRNLD AUS
FRA
ESP
SWEBEL POL FIN NOR
SVKISR
KORDNK
CZEES
TCAN
DEU CHEAUT ITA LU
XRUS
Taxes other than social contributions Social contributions Grants + other revenues
Percentage points
OECD
%
0102030405060708090
100
DNK AUS NZL NOR CAN CHE ISL USA CHL GBR LUX IRL FIN SWE BEL ITA JPN ISR DEU ESP AUT KOR NLD MEX PRT GRC FRA TUR CZE HUN POL SVN EST SVK
2001
2001
2001
2001
2001
2001
2001
2001
2001
2001
2001
2001
2001
2001
2001
2001
2001
2001
2001
2001
2001
2001
2001
2001
2001
2001
2001
2001
2001
2001
2001
2001
2001
2001
2001
2010
2010
2010
2010
2010
2010
2010
2010
2010
2010
2010
2010
2010
2010
2010
2010
2010
2010
2010
2010
2010
2010
2010
2010
2010
2010
2010
2010
2010
2010
2010
2010
2010
2010
2010
Income and profits Social security Payroll Property Goods and services Other
OECD
GOVERNMENT AT A GLANCE 2013 © OECD 2013 71
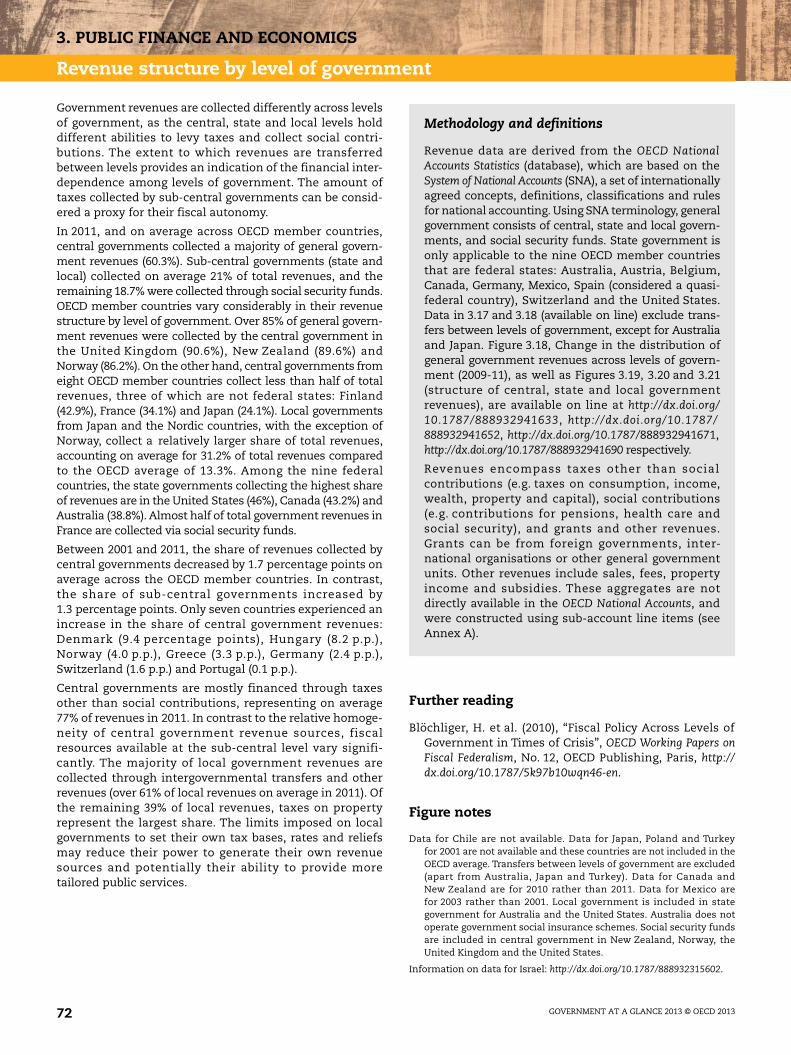
3. PUBLIC FINANCE AND ECONOMICS
Revenue structure by level of government
Government revenues are collected differently across levelsof government, as the central, state and local levels holddifferent abilities to levy taxes and collect social contri-butions. The extent to which revenues are transferredbetween levels provides an indication of the financial inter-dependence among levels of government. The amount oftaxes collected by sub-central governments can be consid-ered a proxy for their fiscal autonomy.
In 2011, and on average across OECD member countries,central governments collected a majority of general govern-ment revenues (60.3%). Sub-central governments (state andlocal) collected on average 21% of total revenues, and theremaining 18.7% were collected through social security funds.OECD member countries vary considerably in their revenuestructure by level of government. Over 85% of general govern-ment revenues were collected by the central government inthe United Kingdom (90.6%), New Zealand (89.6%) andNorway (86.2%). On the other hand, central governments fromeight OECD member countries collect less than half of totalrevenues, three of which are not federal states: Finland(42.9%), France (34.1%) and Japan (24.1%). Local governmentsfrom Japan and the Nordic countries, with the exception ofNorway, collect a relatively larger share of total revenues,accounting on average for 31.2% of total revenues comparedto the OECD average of 13.3%. Among the nine federalcountries, the state governments collecting the highest shareof revenues are in the United States (46%), Canada (43.2%) andAustralia (38.8%). Almost half of total government revenues inFrance are collected via social security funds.
Between 2001 and 2011, the share of revenues collected bycentral governments decreased by 1.7 percentage points onaverage across the OECD member countries. In contrast,the share of sub-central governments increased by1.3 percentage points. Only seven countries experienced anincrease in the share of central government revenues:Denmark (9.4 percentage points), Hungary (8.2 p.p.),Norway (4.0 p.p.), Greece (3.3 p.p.), Germany (2.4 p.p.),Switzerland (1.6 p.p.) and Portugal (0.1 p.p.).
Central governments are mostly financed through taxesother than social contributions, representing on average77% of revenues in 2011. In contrast to the relative homoge-neity of central government revenue sources, fiscalresources available at the sub-central level vary signifi-cantly. The majority of local government revenues arecollected through intergovernmental transfers and otherrevenues (over 61% of local revenues on average in 2011). Ofthe remaining 39% of local revenues, taxes on propertyrepresent the largest share. The limits imposed on localgovernments to set their own tax bases, rates and reliefsmay reduce their power to generate their own revenuesources and potentially their ability to provide moretailored public services.
Further reading
Blöchliger, H. et al. (2010), “Fiscal Policy Across Levels ofGovernment in Times of Crisis”, OECD Working Papers onFiscal Federalism, No. 12, OECD Publishing, Paris, http://dx.doi.org/10.1787/5k97b10wqn46-en.
Figure notes
Data for Chile are not available. Data for Japan, Poland and Turkeyfor 2001 are not available and these countries are not included in theOECD average. Transfers between levels of government are excluded(apart from Australia, Japan and Turkey). Data for Canada andNew Zealand are for 2010 rather than 2011. Data for Mexico arefor 2003 rather than 2001. Local government is included in stategovernment for Australia and the United States. Australia does notoperate government social insurance schemes. Social security fundsare included in central government in New Zealand, Norway, theUnited Kingdom and the United States.
Information on data for Israel: http://dx.doi.org/10.1787/888932315602.
Methodology and definitions
Revenue data are derived from the OECD NationalAccounts Statistics (database), which are based on theSystem of National Accounts (SNA), a set of internationallyagreed concepts, definitions, classifications and rulesfor national accounting. Using SNA terminology, generalgovernment consists of central, state and local govern-ments, and social security funds. State government isonly applicable to the nine OECD member countriesthat are federal states: Australia, Austria, Belgium,Canada, Germany, Mexico, Spain (considered a quasi-federal country), Switzerland and the United States.Data in 3.17 and 3.18 (available on line) exclude trans-fers between levels of government, except for Australiaand Japan. Figure 3.18, Change in the distribution ofgeneral government revenues across levels of govern-ment (2009-11), as well as Figures 3.19, 3.20 and 3.21(structure of central, state and local governmentrevenues), are available on line at http://dx.doi.org/10.1787/888932941633, http://dx.doi.org/10.1787/888932941652, http://dx.doi.org/10.1787/888932941671,http://dx.doi.org/10.1787/888932941690 respectively.
Revenues encompass taxes other than socialcontributions (e.g. taxes on consumption, income,wealth, property and capital), social contributions(e.g. contributions for pensions, health care andsocial security), and grants and other revenues.Grants can be from foreign governments, inter-national organisations or other general governmentunits. Other revenues include sales, fees, propertyincome and subsidies. These aggregates are notdirectly available in the OECD National Accounts, andwere constructed using sub-account line items (seeAnnex A).
GOVERNMENT AT A GLANCE 2013 © OECD 201372
3. PUBLIC FINANCE AND ECONOMICS
Revenue structure by level of government
3.17. Distribution of general government revenues across levels of government (2001 and 2011)
Source: OECD National Accounts Statistics (database).1 2 http://dx.doi.org/10.1787/888932941614
%
0
10
20
30
40
50
60
70
80
90
100
GBR NZL NOR MEX IRL ISR ISL GRC PRT EST DNK CZE HUN LUX TUR AUS KOR NLD SWE BEL USA SVN POL ITA SVK AUT FIN CAN FRA CHE ESP DEU JPN
2001
2001
2001
2001
2001
2001
2001
2001
2001
2001
2001
2001
2001
2001
2001
2001
2001
2001
2001
2001
2001
2001
2001
2001
2001
2001
2001
2001
2001
2001
2001
2001
2001
2001
2011
2011
2011
2011
2011
2011
2011
2011
2011
2011
2011
2011
2011
2011
2011
2011
2011
2011
2011
2011
2011
2011
2011
2011
2011
2011
2011
2011
2011
2011
2011
2011
2011
2011
Central government State government Local government Social security
OECD
GOVERNMENT AT A GLANCE 2013 © OECD 2013 73
3. PUBLIC FINANCE AND ECONOMICS
General government expenditures
Governments spend money mainly for two purposes: toproduce and/or pay for the goods and services delivered tocitizens and businesses and to redistribute income.Comparing government expenditures across OECDmember countries, as a share of GDP or per capita, providesa measure of the size of the government sector in the econ-omy in terms of financial resources spent. Similarly togovernment revenues, government expenditures are deter-mined by past and current political decisions that arethemselves based on cultural expectations for social redis-tribution and levels of goods and services to be provided,fiscal constraints, and economic fluctuations and perfor-mance. Levels of government expenditures thereforestrongly differ across OECD member countries. It isimportant to note that the size of expenditures is not anindication of government efficiency or productivity.
In 2011, general government expenditures accounted for45.4% of GDP on average across OECD member countries.Differences across countries ranged from 57.6% inDenmark to 22.8% in Mexico. In general, governmentexpenditures in OECD-EU member countries represent ahigher share of GDP. The largest government sectors are inDenmark, France and Finland, with government expendi-tures equal or above 55% of GDP, whereas the smallest arein Korea and Mexico, with shares of 30% and 23% of GDPrespectively.
Over the 2001-11 period, government expenditures as a shareof GDP across OECD member countries underwent strongfluctuations. They increased significantly between 2001and 2009, by 4.5 percentage points on average, and most nota-bly in Ireland (15.4 percentage points), the United Kingdom(11.1 percentage points) and Estonia (10.7 percentage points).However, most of the increase across OECD countries duringthis period occurred after 2007: as overall economic activitycontracted, automatic stabilisers came into force and discre-tionary expenditures were introduced. Only three countriesreduced government expenditures as a share of GDP duringthe 2001-09 period: Israel (8.1 percentage points), theSlovak Republic (2.9 percentage points) and Switzerland(0.7 percentage points). Between 2009 and 2011, the overalltrend reverted as the share of government expenditure in GDPdecreased on average by 1.4 percentage points, mostly due tothe slowdown (or reduction in some cases) of expenditurescompared to the growth of GDP. The strongest reductionsoccurred in Estonia (7.2 percentage points), Sweden, Icelandand the Slovak Republic (all above 3 percentage points). Overthe same period, the share of expenditures in GDP increasedin only three countries, New Zealand (6.6 percentage pointsbetween 2009 and 2010, due to fiscal stimulus packages),Slovenia (1.4 percentage points) and Japan (0.1 percentagepoints).
On average across the OECD member countries, govern-ment expenditures represented USD 16 240 PPP per capitain 2011. In terms of population, the difference in magni-tude between the highest and lowest levels of governmentexpenditures across OECD member countries is over 9 fold
(USD 37 000 PPP per capita in Luxembourg compared toalmost USD 4 000 PPP in Mexico), whereas it is only 2.5 foldwhen expressed as a share of GDP.
Between 2001 and 2011, government expenditures percapita increased on average by 2.2% on an annual basisacross OECD member countries. The strongest increasesoccurred in Korea (6.1% average annual increase) andEstonia (5%), whereas government expenditures declinedonly in Israel, though moderately (0.1%).
Further reading
OECD (2013), National Accounts at a Glance 2013, OECD Pub-lishing, Paris, http://dx.doi.org/10.1787/na_glance-2013-en.
Figure notes
Data for Chile are not available. Data for Canada, New Zealand and theRussian Federation are for 2010 rather than 2011. Data for Japan andMexico for 2001 are estimated. Data for the Russian Federation arefor 2002 rather than 2001.
3.22: Data for Turkey for 2001 are not available and this country is notincluded in the OECD average.
3.24: Data for Turkey are not available.
Information on data for Israel: http://dx.doi.org/10.1787/888932315602.
Methodology and definitions
Government expenditures data are derived from theOECD National Accounts Statistics (database), which arebased on the System of National Accounts (SNA), a set ofinternationally agreed concepts, definitions, classifi-cations and rules for national accounting. In SNAterminology, general government consists of central,state and local governments and social securityfunds. Expenditures encompass intermediateconsumption, compensation of employees, subsidies,social benefits, other current expenditures (includinginterest spending), capital transfers and other capitalexpenditures.
Gross domestic product (GDP) is the standardmeasure of the value of goods and services producedby a country during a period. Government expendi-tures per person were calculated by converting totalgovernment expenditures to USD 2011 using theOECD/Eurostat purchasing power parities (PPP) forGDP and dividing by population (for the countrieswhose data source is the IMF Economic Outlook animplied PPP conversion rate was used). PPP is thenumber of units of country B’s currency needed topurchase the same quantity of goods and services incountry A.
GOVERNMENT AT A GLANCE 2013 © OECD 201374
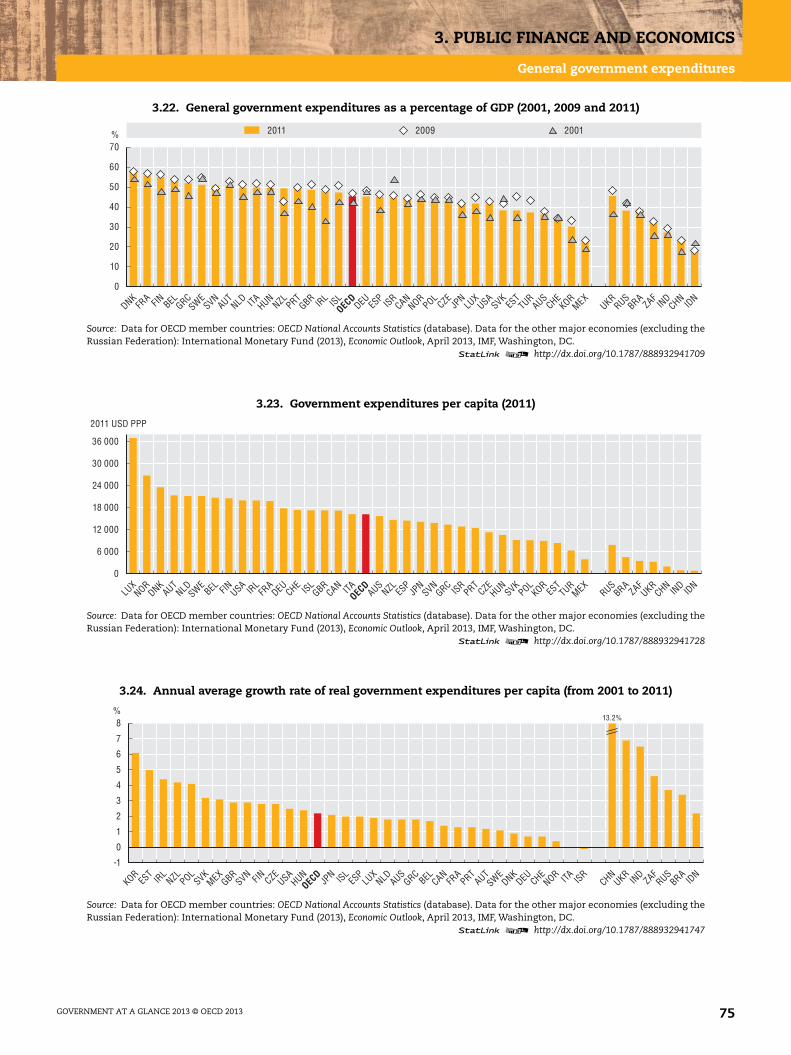
3. PUBLIC FINANCE AND ECONOMICS
General government expenditures
3.22. General government expenditures as a percentage of GDP (2001, 2009 and 2011)
Source: Data for OECD member countries: OECD National Accounts Statistics (database). Data for the other major economies (excluding theRussian Federation): International Monetary Fund (2013), Economic Outlook, April 2013, IMF, Washington, DC.
1 2 http://dx.doi.org/10.1787/888932941709
3.23. Government expenditures per capita (2011)
Source: Data for OECD member countries: OECD National Accounts Statistics (database). Data for the other major economies (excluding theRussian Federation): International Monetary Fund (2013), Economic Outlook, April 2013, IMF, Washington, DC.
1 2 http://dx.doi.org/10.1787/888932941728
3.24. Annual average growth rate of real government expenditures per capita (from 2001 to 2011)
Source: Data for OECD member countries: OECD National Accounts Statistics (database). Data for the other major economies (excluding theRussian Federation): International Monetary Fund (2013), Economic Outlook, April 2013, IMF, Washington, DC.
1 2 http://dx.doi.org/10.1787/888932941747
% 2011
0
10
20
30
40
50
60
70
2009 2001
DNKFR
A FIN BEL GRCSWE
SVNAUT
NLD ITA HUNNZL PRT
GBR IRL ISL
DEU ESP
ISRCAN
NORPOL
CZEJP
NLU
XUSA
SVKES
TTUR
AUSCHE
KORMEX
UKRRUS
BRAZAF
IND
CHNID
NOEC
D
0
6 000
12 000
18 000
24 000
30 000
36 000
IDN
IND
CHNUKR
ZAFBRA
RUSMEX
TURES
TKOR
POLSVK
HUNCZE
PRTISR
GRCSVN
JPN
ESP
NZLAUSITACANGBRISL
CHEDEUFR
AIRL
USAFINBELSWE
NLDAUTDNK
NORLU
X
2011 USD PPP
OECD
%
-1
0
1
2
3
4
5
6
7
8
IDN
BRARUS
ZAFIN
DUKR
CHNISRITANORCHE
DEUDNKSWE
AUTPRT
FRA
CANBELGRC
AUSNLDLU
XES
PISLJP
NHUN
USACZEFINSVN
GBRMEX
SVKPOL
NZLIRL
EST
KOR
13.2%
OECD
GOVERNMENT AT A GLANCE 2013 © OECD 2013 75
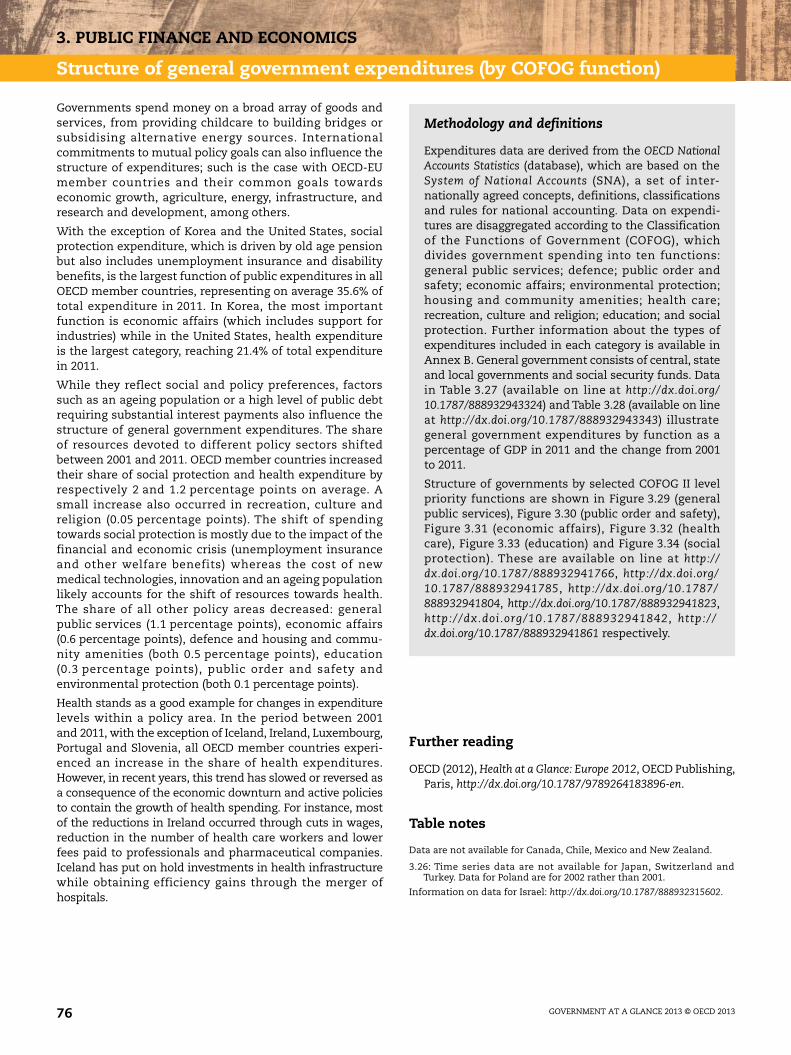
3. PUBLIC FINANCE AND ECONOMICS
Structure of general government expenditures (by COFOG function)
Governments spend money on a broad array of goods andservices, from providing childcare to building bridges orsubsidising alternative energy sources. Internationalcommitments to mutual policy goals can also influence thestructure of expenditures; such is the case with OECD-EUmember countries and their common goals towardseconomic growth, agriculture, energy, infrastructure, andresearch and development, among others.
With the exception of Korea and the United States, socialprotection expenditure, which is driven by old age pensionbut also includes unemployment insurance and disabilitybenefits, is the largest function of public expenditures in allOECD member countries, representing on average 35.6% oftotal expenditure in 2011. In Korea, the most importantfunction is economic affairs (which includes support forindustries) while in the United States, health expenditureis the largest category, reaching 21.4% of total expenditurein 2011.
While they reflect social and policy preferences, factorssuch as an ageing population or a high level of public debtrequiring substantial interest payments also influence thestructure of general government expenditures. The shareof resources devoted to different policy sectors shiftedbetween 2001 and 2011. OECD member countries increasedtheir share of social protection and health expenditure byrespectively 2 and 1.2 percentage points on average. Asmall increase also occurred in recreation, culture andreligion (0.05 percentage points). The shift of spendingtowards social protection is mostly due to the impact of thefinancial and economic crisis (unemployment insuranceand other welfare benefits) whereas the cost of newmedical technologies, innovation and an ageing populationlikely accounts for the shift of resources towards health.The share of all other policy areas decreased: generalpublic services (1.1 percentage points), economic affairs(0.6 percentage points), defence and housing and commu-nity amenities (both 0.5 percentage points), education(0.3 percentage points), public order and safety andenvironmental protection (both 0.1 percentage points).
Health stands as a good example for changes in expenditurelevels within a policy area. In the period between 2001and 2011, with the exception of Iceland, Ireland, Luxembourg,Portugal and Slovenia, all OECD member countries experi-enced an increase in the share of health expenditures.However, in recent years, this trend has slowed or reversed asa consequence of the economic downturn and active policiesto contain the growth of health spending. For instance, mostof the reductions in Ireland occurred through cuts in wages,reduction in the number of health care workers and lowerfees paid to professionals and pharmaceutical companies.Iceland has put on hold investments in health infrastructurewhile obtaining efficiency gains through the merger ofhospitals.
Further reading
OECD (2012), Health at a Glance: Europe 2012, OECD Publishing,Paris, http://dx.doi.org/10.1787/9789264183896-en.
Table notes
Data are not available for Canada, Chile, Mexico and New Zealand.
3.26: Time series data are not available for Japan, Switzerland andTurkey. Data for Poland are for 2002 rather than 2001.
Information on data for Israel: http://dx.doi.org/10.1787/888932315602.
Methodology and definitions
Expenditures data are derived from the OECD NationalAccounts Statistics (database), which are based on theSystem of National Accounts (SNA), a set of inter-nationally agreed concepts, definitions, classificationsand rules for national accounting. Data on expendi-tures are disaggregated according to the Classificationof the Functions of Government (COFOG), whichdivides government spending into ten functions:general public services; defence; public order andsafety; economic affairs; environmental protection;housing and community amenities; health care;recreation, culture and religion; education; and socialprotection. Further information about the types ofexpenditures included in each category is available inAnnex B. General government consists of central, stateand local governments and social security funds. Datain Table 3.27 (available on line at http://dx.doi.org/10.1787/888932943324) and Table 3.28 (available on lineat http://dx.doi.org/10.1787/888932943343) illustrategeneral government expenditures by function as apercentage of GDP in 2011 and the change from 2001to 2011.
Structure of governments by selected COFOG II levelpriority functions are shown in Figure 3.29 (generalpublic services), Figure 3.30 (public order and safety),Figure 3.31 (economic affairs), Figure 3.32 (healthcare), Figure 3.33 (education) and Figure 3.34 (socialprotection). These are available on line at http://dx.doi.org/10.1787/888932941766, http://dx.doi.org/10.1787/888932941785, http://dx.doi.org/10.1787/888932941804, http://dx.doi.org/10.1787/888932941823,http://dx.doi.org/10.1787/888932941842 , http://dx.doi.org/10.1787/888932941861 respectively.
GOVERNMENT AT A GLANCE 2013 © OECD 201376
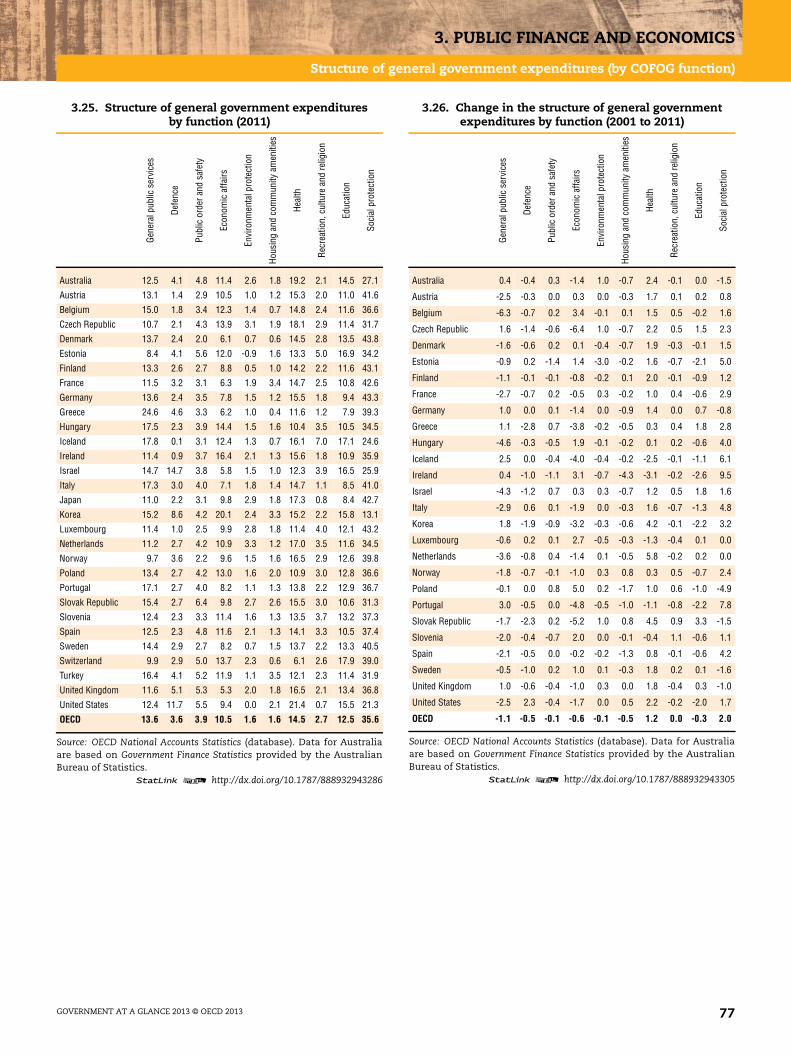
3. PUBLIC FINANCE AND ECONOMICS
Structure of general government expenditures (by COFOG function)
3.25. Structure of general government expendituresby function (2011)
Gene
ralp
ublic
serv
ices
Defe
nce
Publ
icor
dera
ndsa
fety
Econ
omic
affa
irs
Envi
ronm
enta
lpro
tect
ion
Hous
ing
and
com
mun
ityam
eniti
es
Heal
th
Recr
eatio
n,cu
lture
and
relig
ion
Educ
atio
n
Soci
alpr
otec
tion
Australia 12.5 4.1 4.8 11.4 2.6 1.8 19.2 2.1 14.5 27.1
Austria 13.1 1.4 2.9 10.5 1.0 1.2 15.3 2.0 11.0 41.6
Belgium 15.0 1.8 3.4 12.3 1.4 0.7 14.8 2.4 11.6 36.6
Czech Republic 10.7 2.1 4.3 13.9 3.1 1.9 18.1 2.9 11.4 31.7
Denmark 13.7 2.4 2.0 6.1 0.7 0.6 14.5 2.8 13.5 43.8
Estonia 8.4 4.1 5.6 12.0 -0.9 1.6 13.3 5.0 16.9 34.2
Finland 13.3 2.6 2.7 8.8 0.5 1.0 14.2 2.2 11.6 43.1
France 11.5 3.2 3.1 6.3 1.9 3.4 14.7 2.5 10.8 42.6
Germany 13.6 2.4 3.5 7.8 1.5 1.2 15.5 1.8 9.4 43.3
Greece 24.6 4.6 3.3 6.2 1.0 0.4 11.6 1.2 7.9 39.3
Hungary 17.5 2.3 3.9 14.4 1.5 1.6 10.4 3.5 10.5 34.5
Iceland 17.8 0.1 3.1 12.4 1.3 0.7 16.1 7.0 17.1 24.6
Ireland 11.4 0.9 3.7 16.4 2.1 1.3 15.6 1.8 10.9 35.9
Israel 14.7 14.7 3.8 5.8 1.5 1.0 12.3 3.9 16.5 25.9
Italy 17.3 3.0 4.0 7.1 1.8 1.4 14.7 1.1 8.5 41.0
Japan 11.0 2.2 3.1 9.8 2.9 1.8 17.3 0.8 8.4 42.7
Korea 15.2 8.6 4.2 20.1 2.4 3.3 15.2 2.2 15.8 13.1
Luxembourg 11.4 1.0 2.5 9.9 2.8 1.8 11.4 4.0 12.1 43.2
Netherlands 11.2 2.7 4.2 10.9 3.3 1.2 17.0 3.5 11.6 34.5
Norway 9.7 3.6 2.2 9.6 1.5 1.6 16.5 2.9 12.6 39.8
Poland 13.4 2.7 4.2 13.0 1.6 2.0 10.9 3.0 12.8 36.6
Portugal 17.1 2.7 4.0 8.2 1.1 1.3 13.8 2.2 12.9 36.7
Slovak Republic 15.4 2.7 6.4 9.8 2.7 2.6 15.5 3.0 10.6 31.3
Slovenia 12.4 2.3 3.3 11.4 1.6 1.3 13.5 3.7 13.2 37.3
Spain 12.5 2.3 4.8 11.6 2.1 1.3 14.1 3.3 10.5 37.4
Sweden 14.4 2.9 2.7 8.2 0.7 1.5 13.7 2.2 13.3 40.5
Switzerland 9.9 2.9 5.0 13.7 2.3 0.6 6.1 2.6 17.9 39.0
Turkey 16.4 4.1 5.2 11.9 1.1 3.5 12.1 2.3 11.4 31.9
United Kingdom 11.6 5.1 5.3 5.3 2.0 1.8 16.5 2.1 13.4 36.8
United States 12.4 11.7 5.5 9.4 0.0 2.1 21.4 0.7 15.5 21.3
OECD 13.6 3.6 3.9 10.5 1.6 1.6 14.5 2.7 12.5 35.6
Source: OECD National Accounts Statistics (database). Data for Australiaare based on Government Finance Statistics provided by the AustralianBureau of Statistics.
1 2 http://dx.doi.org/10.1787/888932943286
3.26. Change in the structure of general governmentexpenditures by function (2001 to 2011)
Gene
ralp
ublic
serv
ices
Defe
nce
Publ
icor
dera
ndsa
fety
Econ
omic
affa
irs
Envi
ronm
enta
lpro
tect
ion
Hous
ing
and
com
mun
ityam
eniti
es
Heal
th
Recr
eatio
n,cu
lture
and
relig
ion
Educ
atio
n
Soci
alpr
otec
tion
Australia 0.4 -0.4 0.3 -1.4 1.0 -0.7 2.4 -0.1 0.0 -1.5
Austria -2.5 -0.3 0.0 0.3 0.0 -0.3 1.7 0.1 0.2 0.8
Belgium -6.3 -0.7 0.2 3.4 -0.1 0.1 1.5 0.5 -0.2 1.6
Czech Republic 1.6 -1.4 -0.6 -6.4 1.0 -0.7 2.2 0.5 1.5 2.3
Denmark -1.6 -0.6 0.2 0.1 -0.4 -0.7 1.9 -0.3 -0.1 1.5
Estonia -0.9 0.2 -1.4 1.4 -3.0 -0.2 1.6 -0.7 -2.1 5.0
Finland -1.1 -0.1 -0.1 -0.8 -0.2 0.1 2.0 -0.1 -0.9 1.2
France -2.7 -0.7 0.2 -0.5 0.3 -0.2 1.0 0.4 -0.6 2.9
Germany 1.0 0.0 0.1 -1.4 0.0 -0.9 1.4 0.0 0.7 -0.8
Greece 1.1 -2.8 0.7 -3.8 -0.2 -0.5 0.3 0.4 1.8 2.8
Hungary -4.6 -0.3 -0.5 1.9 -0.1 -0.2 0.1 0.2 -0.6 4.0
Iceland 2.5 0.0 -0.4 -4.0 -0.4 -0.2 -2.5 -0.1 -1.1 6.1
Ireland 0.4 -1.0 -1.1 3.1 -0.7 -4.3 -3.1 -0.2 -2.6 9.5
Israel -4.3 -1.2 0.7 0.3 0.3 -0.7 1.2 0.5 1.8 1.6
Italy -2.9 0.6 0.1 -1.9 0.0 -0.3 1.6 -0.7 -1.3 4.8
Korea 1.8 -1.9 -0.9 -3.2 -0.3 -0.6 4.2 -0.1 -2.2 3.2
Luxembourg -0.6 0.2 0.1 2.7 -0.5 -0.3 -1.3 -0.4 0.1 0.0
Netherlands -3.6 -0.8 0.4 -1.4 0.1 -0.5 5.8 -0.2 0.2 0.0
Norway -1.8 -0.7 -0.1 -1.0 0.3 0.8 0.3 0.5 -0.7 2.4
Poland -0.1 0.0 0.8 5.0 0.2 -1.7 1.0 0.6 -1.0 -4.9
Portugal 3.0 -0.5 0.0 -4.8 -0.5 -1.0 -1.1 -0.8 -2.2 7.8
Slovak Republic -1.7 -2.3 0.2 -5.2 1.0 0.8 4.5 0.9 3.3 -1.5
Slovenia -2.0 -0.4 -0.7 2.0 0.0 -0.1 -0.4 1.1 -0.6 1.1
Spain -2.1 -0.5 0.0 -0.2 -0.2 -1.3 0.8 -0.1 -0.6 4.2
Sweden -0.5 -1.0 0.2 1.0 0.1 -0.3 1.8 0.2 0.1 -1.6
United Kingdom 1.0 -0.6 -0.4 -1.0 0.3 0.0 1.8 -0.4 0.3 -1.0
United States -2.5 2.3 -0.4 -1.7 0.0 0.5 2.2 -0.2 -2.0 1.7
OECD -1.1 -0.5 -0.1 -0.6 -0.1 -0.5 1.2 0.0 -0.3 2.0
Source: OECD National Accounts Statistics (database). Data for Australiaare based on Government Finance Statistics provided by the AustralianBureau of Statistics.
1 2 http://dx.doi.org/10.1787/888932943305
GOVERNMENT AT A GLANCE 2013 © OECD 2013 77

3. PUBLIC FINANCE AND ECONOMICS
Expenditures structure by level of government
Different levels of government share the responsibility forfinancing public goods and services and redistributingincome. The degree to which each level is responsible forexpenditures is affected by the institutional structure ineach country and the distribution of spending power acrosslevels of governments. When sub-central levels have ahigher level of autonomy they might be better suited forshaping policies and programmes.
In 2011 and on average across OECD member countries46% of general government expenditures were undertakenby central government. Sub-central governments (state andlocal) covered 32% and social security funds accounted forthe remaining share. However, the level of fiscal decentrali-sation varies considerably across countries. In Ireland, forexample, 76.4% of total expenditure is carried out by centralgovernment, representing an increase of 27.1 percentagepoints as compared to 2001. In contrast, central governmentaccounts for less than 20% of total expenditures in Germanyand Switzerland, both federal states.
In general, central governments spend a relatively largeproportion of their budgets on social protection (e.g. pensionsand unemployment benefits), general public services(e.g. executive and legislative organs, public debt transac-tions) and defence. In over half of OECD member countries,expenditures on social protection represent the largest shareof central government budgets. In Belgium and Spain, centralgovernments allocate over 60% of their budgets to generalpublic services.
With the exception of Austria, education represents thelargest share of expenditure, at both the state and local levels.In addition, environmental protection, housing and commu-nity amenities and recreation, culture and religion are mostlyfinanced by sub-levels of government, displaying a moreimmediate and tangible link of these levels with citizens.
There is a positive relation between sub-central expendi-tures and revenues across OECD member countries. How-ever, a wide variation of sub-central tax autonomy exists.Limits on sub-central governments’ ability to set their ownlocal tax bases, rates and reliefs reduce the power to gener-ate their own revenue sources, adapt to economic shocksby increasing tax rates, and potentially their ability toprovide more tailored public services. As a consequence,local governments tend to rely heavily on transfers fromcentral government. No clear trend exists in OECD membercountries towards fiscal decentralisation.
Further reading
Blöchliger, H. and C. Vammalle (2012), Reforming FiscalFederalism and Local Government: Beyond the Zero-SumGame, OECD Fiscal Federalism Studies, OECD Publishing,Paris, http://dx.doi.org/10.1787/9789264119970-en.
OECD (2013), National Accounts at a Glance 2013, OECD Pub-lishing, Paris, http://dx.doi.org/10.1787/na_glance-2013-en.
Figure notes
Data for Chile are not available. Transfers between levels of governmentare excluded (apart from Australia, Japan and Turkey). Data forCanada and New Zealand are for 2010 rather than 2011.
3.35: Data for Japan, Poland and Turkey for 2001 are not available andthese countries are not included in the OECD average. Data forMexico are for 2003 rather than 2001. Local government is includedin state government for Australia and the United States. Australiadoes not operate government social insurance schemes. Socialsecurity funds are included in central government in New Zealand,Norway, the United Kingdom and the United States.
Information on data for Israel: http://dx.doi.org/10.1787/888932315602.
Methodology and definitions
Expenditures data are derived from the OECD NationalAccounts Statistics (database), which are based on theSystem of National Accounts (SNA), a set of internation-ally agreed concepts, definitions, classifications andrules for national accounting. Data on expendituresare disaggregated according to the Classification ofthe Functions of Government (COFOG), which dividesgovernment spending into ten functions: generalpublic services; defence; public order and safety;economic affairs; environmental protection; housingand community amenities; health care; recreation,culture and religion; education; and social protection.Further information about the types of expendituresincluded in each category is available in Annex B.General government consists of central, state andlocal governments and social security funds. Stategovernment is only applicable to the nine OECDmember countries that are federal states: Australia,Austria, Belgium, Canada, Germany, Mexico, Spain(considered a quasi-federal country), Switzerland andthe United States.
Data in Figures 3.35 and 3.37 (Change in the distribu-tion of general government expenditures across levelsof government in 2009-11) exclude transfers betweenlevels of government and thus provide a rough proxyof the overall responsibility for providing goods andservices borne by each level of government. However,data on expenditures at the central, state and locallevels (Tables 3.38, 3.39 and 3.40) include transfersbetween the different levels of government and there-fore illustrate how much is spent on each function ateach level of government. Figure 3.37 (http://dx.doi.org/10.1787/888932941918), and Tables 3.38 (http://dx.doi.org/10.1787/888932941937), 3.39 (http://dx.doi.org/10.1787/888932941956) and 3.40 (http://dx.doi.org/10.1787/888932941975) are available on line.
GOVERNMENT AT A GLANCE 2013 © OECD 201378

3. PUBLIC FINANCE AND ECONOMICS
Expenditures structure by level of government
3.35. Distribution of general government expenditures across levels of government (2001 and 2011)
Source: OECD National Accounts Statistics (database).1 2 http://dx.doi.org/10.1787/888932941880
3.36. Fiscal decentralisation: Sub-central government’s share in general government revenues and expenditures (2011)
Source: OECD National Accounts Statistics (database).1 2 http://dx.doi.org/10.1787/888932941899
%
0
10
20
30
40
50
60
70
80
90
100
NZL IRL GBR ISR EST NOR TUR AUS PRT CZE USA ISL GRC SVN HUN LUX SVK KOR SWE AUT MEX POL JPN FRA DNK ITA NLD FIN CAN BEL ESP DEU CHE
2001
2001
2001
2001
2001
2001
2001
2001
2001
2001
2001
2001
2001
2001
2001
2001
2001
2001
2001
2001
2001
2001
2001
2001
2001
2001
2001
2001
2001
2001
2001
2001
2001
2001
2011
2011
2011
2011
2011
2011
2011
2011
2011
2011
2011
2011
2011
2011
2011
2011
2011
2011
2011
2011
2011
2011
2011
2011
2011
2011
2011
2011
2011
2011
2011
2011
2011
2011
Central government State government Local government Social security
OECD
0
10
20
30
40
50
70
60
0 10 20 30 40 50 60 70
AUS
AUT
BEL
CAN
CHE
CZE
DEU
DNK
ESP
EST
FIN
FRA
GBR
GRC
HUNIRL
ISL
ISRITA
JPN
KOR
LUXMEX
NLD
NORNZL
POL
PRT SVK
SVN
SWE
TUR
USA
Sub-central spending as share of total government spending
Sub-central own revenues as share of total government revenues
OECD
GOVERNMENT AT A GLANCE 2013 © OECD 2013 79

3. PUBLIC FINANCE AND ECONOMICS
Government investment spending
One of the main reasons for government investments is thepromotion of economic growth; this is achieved, amongother ways, through the financing of public infrastructureprojects (roads, housing, schools, hospitals and communi-cation networks). Moreover, some projects with desiredsocial returns (public goods) are not profitable for theprivate sector and thus are developed by the public sector.Public direct investment can be used by governments forcountercyclical policy objectives. For instance, as a result ofthe recent economic downturn, many OECD governmentsintroduced stimulus plans through an increase in invest-ments in soft and hard infrastructures.
In 2011, government expenditures on direct investment rep-resented, on average, 15.5% of total investment in OECDmember countries. For 23 OECD member countries, this figureis lower than in 2009 due to the implementation of austerityprogrammes. Between 2009 and 2011, the share of govern-ment direct investment in total investment continued toincrease in Poland (3.6 percentage points), Ireland (1.9 p.p.),Denmark (1.8 p.p.), Hungary (1.8 p.p.), Canada (1.3 p.p.),Australia (0.4 p.p.), Belgium and Switzerland (both 0.1 p.p.).
The share of direct investment in general governmentexpenditure varies greatly across countries. The differ-ences are linked to the existing infrastructure stock. Onaverage in 2011, OECD member countries direct investmentrepresented 6.7% of general government expenditure. FourOECD member countries have experienced a continuousincrease of the share of direct investment in generalgovernment expenditure for both periods 2001-09and 2009-11, namely Poland (5.4 percentage points),Canada (3.5 p.p.), Sweden (1.3 p.p.) and Denmark (0.3 p.p.).In turn, the share of direct investment for 11 OECD membercountries has continuously declined for both periods, themost in Ireland (7.5 percentage points), Korea (7.2 p.p.) andIceland (6.6 p.p.). In countries where the crisis was the mostacute, government direct investment suffered the mostsignificant reductions during the subsequent consolidationphases. This result illustrates a mix of higher expenditurefor other items (unemployment insurance and otherautomatic welfare expenditure) and consolidation policiesaffecting investment.
The distribution of direct investment spending acrosslevels of government is closely linked to the countries’political structure. Investments at the state level are onlyrelevant for federal countries, where they represent, onaverage, over a quarter of public direct investment, butreaching levels of 84% in the United States and 66% inAustralia. On average for OECD member countries, about62% of government direct investment is carried out by sub-national governments compared to 37.3% undertaken bythe central government. For the period between 2001and 2011, no common trend exists toward investmentdecentralisation. While some countries, such as theSlovak Republic and Hungary, have experienced significantreallocations from the central to local governments, others,such as Ireland and Poland, have seen the opposite trend.
Further readingOECD (2013, forthcoming), Investing Together: Working
Effectively across Levels of Government, OECD Publishing,Paris, http://dx.doi.org/10.1787/9789264197022-en.
OECD (2011), Making the Most of Public Investment in a TightFiscal Environment: Multi-level Governance Lessons from theCrisis, OECD Publishing, Paris, http://dx.doi.org/10.1787/9789264114470-en.
OECD/Korea Institute of Public Finance (2012), Institutionaland Financial Relations across Levels of Government,OECD Fiscal Federalism Studies, OECD Publishing, Paris,http://dx.doi.org/10.1787/9789264167001-en.
Figure notesData for Canada and the Russian Federation are for 2010 rather than 2011.
Data for Mexico are for 2003 rather than 2001. Data for theRussian Federation are for 2002 rather than 2001. Differences in thedata availability between Figures 3.41 and 3.42 are due to the use of dif-ferent data tables within the OECD National Accounts Statistics (database).
3.41: Data for Iceland are not available. The following countries are notincluded in the OECD average due to missing time-series: Chile(2001), Greece (2001), Turkey (2001), Israel (2009-11) and New Zealand(2009-11). Data for Australia and Chile are for 2010 rather than 2011.Data for Ireland are for 2002 rather than 2001.
3.42: Data for Chile are not available. Data for Japan and Turkey for2001 are not available and these countries are not included in theOECD average. Data for New Zealand are for 2010 rather than 2011.
3.43: Data for Chile are not available. Data for New Zealand are for2010 rather than 2011. Local government is included in state govern-ment for Australia and the United States. Australia does not operategovernment social insurance schemes. Social security funds areincluded in central government in New Zealand, Norway, theUnited Kingdom and the United States.
Information on data for Israel: http://dx.doi.org/10.1787/888932315602.
Methodology and definitions
Data are derived from the OECD National AccountsStatistics (database), which are based on the System ofNational Accounts (SNA), a set of internationally agreedconcepts, definitions, classifications and rules fornational accounting. General government investmentincludes direct investment (measured by gross fixedcapital formation) and indirect investment (measuredby capital transfers). In this analysis, only directinvestment has been taken into account. Gross fixedcapital formation consists mainly of road infrastruc-ture but also includes infrastructure such as officebuildings, housing, schools and hospitals.
Total investment refers to the investment spending ofthe entire economy, including expenditures by generalgovernment, non-financial corporations, financialcorporations, households and non-profit institutions.
Government consists of central, state and localgovernments and social security funds. State govern-ment is only applicable to the nine OECD membercountries that are federal states: Australia, Austria,Belgium, Canada, Germany, Mexico, Spain (consid-ered a quasi-federal country), Switzerland and theUnited States. Figure 3.44, Change in the distributionof investment spending across levels of government(2001-11), is available on line at http://dx.doi.org/10.1787/888932942051.
GOVERNMENT AT A GLANCE 2013 © OECD 201380
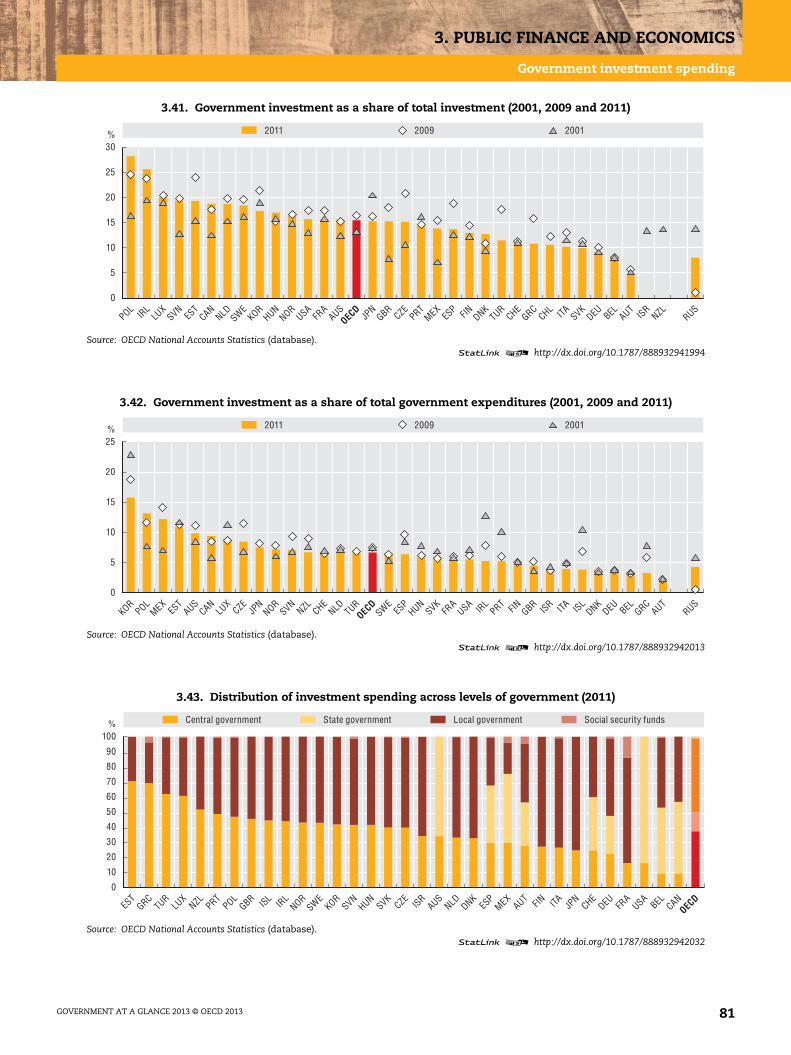
3. PUBLIC FINANCE AND ECONOMICS
Government investment spending
3.41. Government investment as a share of total investment (2001, 2009 and 2011)
Source: OECD National Accounts Statistics (database).1 2 http://dx.doi.org/10.1787/888932941994
3.42. Government investment as a share of total government expenditures (2001, 2009 and 2011)
Source: OECD National Accounts Statistics (database).1 2 http://dx.doi.org/10.1787/888932942013
3.43. Distribution of investment spending across levels of government (2011)
Source: OECD National Accounts Statistics (database).1 2 http://dx.doi.org/10.1787/888932942032
2011 2009 2001%
0
5
10
15
20
25
30
POLIR
LLU
XSVN
EST
CANNLD SWE
KORHUN
NORUSA
FRA
AUSJP
NGBR
CZEPRT
MEXES
P FIN DNKTUR
CHEGRC
CHL ITA SVKDEU BEL AUT
ISRNZL RUS
OECD
0
5
10
15
20
25%
KORPOL
MEXES
TAUS
CANLU
XCZE
JPN
NORSVN
NZL CHENLD TUR
SWEES
PHUN
SVKFR
AUSA IR
LPRT FIN GBR ISR ITA ISL
DNKDEU BEL GRC
AUTRUS
2011 2009 2001
OECD
0
10
20
30
40
50
60
70
80
90
100%
EST
GRCTUR
LUX
NZL PRTPOL
GBR ISLIR
LNOR
SWEKOR
SVNHUN
SVKCZE
ISRAUS
NLD DNKES
PMEX
AUT FIN ITA JPN
CHEDEU FR
AUSA
BEL CAN
Central government State government Local government Social security funds
OECD
GOVERNMENT AT A GLANCE 2013 © OECD 2013 81
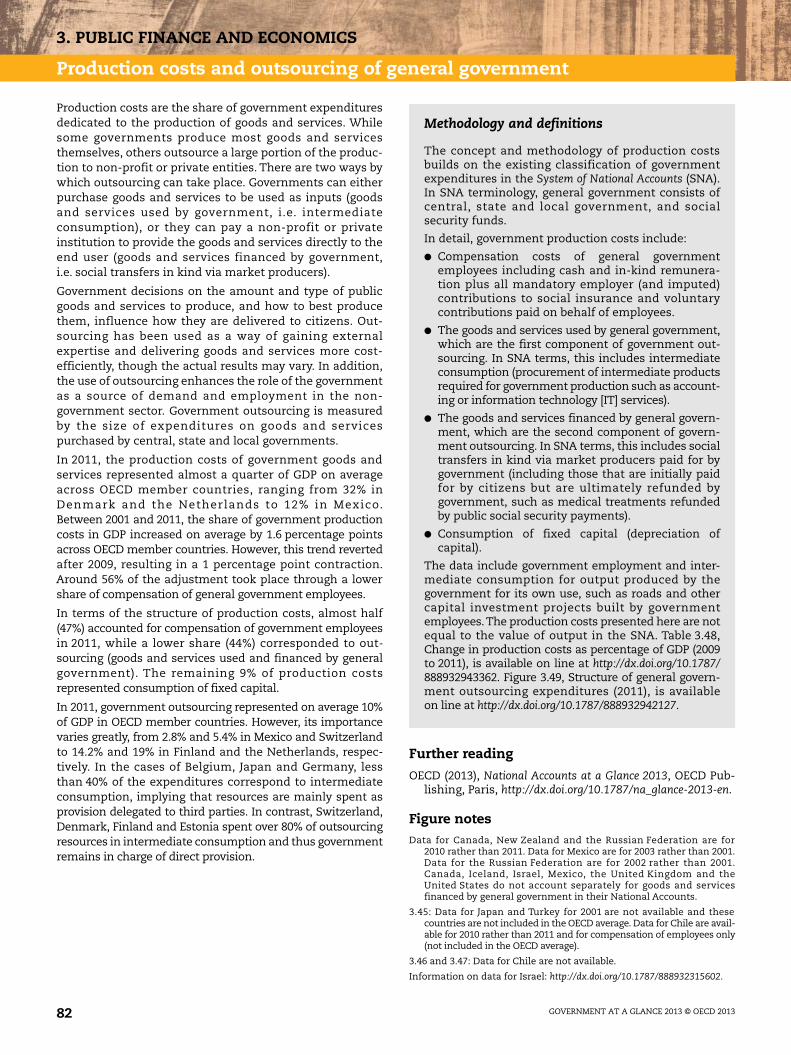
3. PUBLIC FINANCE AND ECONOMICS
Production costs and outsourcing of general government
Production costs are the share of government expendituresdedicated to the production of goods and services. Whilesome governments produce most goods and servicesthemselves, others outsource a large portion of the produc-tion to non-profit or private entities. There are two ways bywhich outsourcing can take place. Governments can eitherpurchase goods and services to be used as inputs (goodsand services used by government, i.e. intermediateconsumption), or they can pay a non-profit or privateinstitution to provide the goods and services directly to theend user (goods and services financed by government,i.e. social transfers in kind via market producers).
Government decisions on the amount and type of publicgoods and services to produce, and how to best producethem, influence how they are delivered to citizens. Out-sourcing has been used as a way of gaining externalexpertise and delivering goods and services more cost-efficiently, though the actual results may vary. In addition,the use of outsourcing enhances the role of the governmentas a source of demand and employment in the non-government sector. Government outsourcing is measuredby the size of expenditures on goods and servicespurchased by central, state and local governments.
In 2011, the production costs of government goods andservices represented almost a quarter of GDP on averageacross OECD member countries, ranging from 32% inDenmark and the Netherlands to 12% in Mexico.Between 2001 and 2011, the share of government productioncosts in GDP increased on average by 1.6 percentage pointsacross OECD member countries. However, this trend revertedafter 2009, resulting in a 1 percentage point contraction.Around 56% of the adjustment took place through a lowershare of compensation of general government employees.
In terms of the structure of production costs, almost half(47%) accounted for compensation of government employeesin 2011, while a lower share (44%) corresponded to out-sourcing (goods and services used and financed by generalgovernment). The remaining 9% of production costsrepresented consumption of fixed capital.
In 2011, government outsourcing represented on average 10%of GDP in OECD member countries. However, its importancevaries greatly, from 2.8% and 5.4% in Mexico and Switzerlandto 14.2% and 19% in Finland and the Netherlands, respec-tively. In the cases of Belgium, Japan and Germany, lessthan 40% of the expenditures correspond to intermediateconsumption, implying that resources are mainly spent asprovision delegated to third parties. In contrast, Switzerland,Denmark, Finland and Estonia spent over 80% of outsourcingresources in intermediate consumption and thus governmentremains in charge of direct provision.
Further reading
OECD (2013), National Accounts at a Glance 2013, OECD Pub-lishing, Paris, http://dx.doi.org/10.1787/na_glance-2013-en.
Figure notesData for Canada, New Zealand and the Russian Federation are for
2010 rather than 2011. Data for Mexico are for 2003 rather than 2001.Data for the Russian Federation are for 2002 rather than 2001.Canada, Iceland, Israel, Mexico, the United Kingdom and theUnited States do not account separately for goods and servicesfinanced by general government in their National Accounts.
3.45: Data for Japan and Turkey for 2001 are not available and thesecountries are not included in the OECD average. Data for Chile are avail-able for 2010 rather than 2011 and for compensation of employees only(not included in the OECD average).
3.46 and 3.47: Data for Chile are not available.
Information on data for Israel: http://dx.doi.org/10.1787/888932315602.
Methodology and definitions
The concept and methodology of production costsbuilds on the existing classification of governmentexpenditures in the System of National Accounts (SNA).In SNA terminology, general government consists ofcentral, state and local government, and socialsecurity funds.
In detail, government production costs include:
● Compensation costs of general governmentemployees including cash and in-kind remunera-tion plus all mandatory employer (and imputed)contributions to social insurance and voluntarycontributions paid on behalf of employees.
● The goods and services used by general government,which are the first component of government out-sourcing. In SNA terms, this includes intermediateconsumption (procurement of intermediate productsrequired for government production such as account-ing or information technology [IT] services).
● The goods and services financed by general govern-ment, which are the second component of govern-ment outsourcing. In SNA terms, this includes socialtransfers in kind via market producers paid for bygovernment (including those that are initially paidfor by citizens but are ultimately refunded bygovernment, such as medical treatments refundedby public social security payments).
● Consumption of fixed capital (depreciation ofcapital).
The data include government employment and inter-mediate consumption for output produced by thegovernment for its own use, such as roads and othercapital investment projects built by governmentemployees.The production costs presented here are notequal to the value of output in the SNA. Table 3.48,Change in production costs as percentage of GDP (2009to 2011), is available on line at http://dx.doi.org/10.1787/888932943362. Figure 3.49, Structure of general govern-ment outsourcing expenditures (2011), is availableon line at http://dx.doi.org/10.1787/888932942127.
GOVERNMENT AT A GLANCE 2013 © OECD 201382
3. PUBLIC FINANCE AND ECONOMICS
Production costs and outsourcing of general government
3.45. Production costs as a percentage of GDP (2001 and 2011)
Source: OECD National Accounts Statistics (database). Data for Australia are based on a combination of Government Finance Statistics and National Accountsdata provided by the Australian Bureau of Statistics.
1 2 http://dx.doi.org/10.1787/888932942070
3.46. Structure of production costs (2011)
Source: OECD National Accounts Statistics (database). Data for Australia are based on a combination of Government Finance Statistics and National Accountsdata provided by the Australian Bureau of Statistics.
1 2 http://dx.doi.org/10.1787/888932942089
3.47. Expenditures on general government outsourcing as a percentage of GDP (2011)
Source: OECD National Accounts Statistics (database). Data for Australia are based on a combination of Government Finance Statistics and National Accountsdata provided by the Australian Bureau of Statistics.
1 2 http://dx.doi.org/10.1787/888932942108
%
DNK NLD FIN SWE ISL FRA ISR BEL CAN GBR NOR SVN NZL HUN CZE GRC PRT DEU ESP EST JPN IRL USA AUS ITA AUT POL SVK LUX TUR KOR CHE MEX CHL RUS
0
5
10
15
20
25
30
35
2001
2001
2001
2001
2001
2001
2001
2001
2001
2001
2001
2001
2001
2001
2001
2001
2001
2001
2001
2001
2001
2001
2001
2001
2001
2001
2001
2001
2001
2001
2001
2001
2001
2001
2001
2001
2011
2011
2011
2011
2011
2011
2011
2011
2011
2011
2011
2011
2011
2011
2011
2011
2011
2011
2011
2011
2011
2011
2011
2011
2011
2011
2011
2011
2011
2011
2011
2011
2011
2011
2011
2011
Compensation of general government employees Costs of goods and services used and financed by general government
Consumption of fixed capital
OECD
%
RUSMEX
DNKNOR IR
LGRC
SVNES
PCHE ISL
CANPOL
EST ITA USA
PRTBEL
SWEFR
ATUR FIN AUT
AUSISR
GBRLU
XHUN
NZL KORSVK
DEU CZENLD JP
N0
102030405060708090
100
Compensation of employees Costs of goods and services used and financed by general government Consumption of fixed capital
OECD
%
NLD FIN DEU ISRSWE
GBRJP
NCZE ISL
NZL BEL FRA
DNKCAN
HUNAUT
AUSSVK
PRTUSA
SVNES
TES
P ITA NORLU
XTUR
GRC IRL
POLKOR
CHEMEX
RUS0
4
8
12
16
20
Goods and services used by general government Goods and services financed by general government
OECD
GOVERNMENT AT A GLANCE 2013 © OECD 2013 83
3. PUBLIC FINANCE AND ECONOMICS
Special feature: Central government ICT spending
Central government ICT spending is the share of total centralgovernment budgets dedicated to ICTs (e.g. investments inhardware and software, running costs of IT infrastructures,salaries for ICT specialists and training). Governments look tothe use of technology, and especially the Internet, as a leverfor more efficient internal operations, greater public servicequality, and better and more open policy making.
The expectations to deliver policy-relevant results are alsohigh because spending on ICTs is considerable. Examplesof the absolute amounts spent illustrate why it is importantto understand underlying patterns and to optimise theuse of ICTs: USD 75 billion at central government in theUnited States; USD 10 billion in the United Kingdom;between USD 4 billion and 5 billion in Canada, France andAustralia. Some ICT spending volumes can represent over2% of a central government’s budget. However, it would notbe correct to interpret high or low shares of ICT expen-diture as an indication of prioritisation, performance orefficiency. Important context factors need to be considered,although their role is not yet entirely clear. The countrieswhere central governments spend more than 1.5% of theirbudget on ICT include both highly centralised countries(New Zealand, Finland) and federal countries (theUnited States, Canada, Switzerland), as well as both largeand small countries measured by population.
The absolute size of the public administration can alsoinfluence spending patterns. Governments in Slovenia andEstonia have similar employment numbers and spend asimilar amount on ICT capital and operations per employee;Italy, Spain and Germany have larger public administrationsand spend more on ICT per employee (around USD 3 000-4 000 PPP). The United States stand out with an average ICTspend per employee of over USD 26 000 PPP, followed bySwitzerland, the United Kingdom, Korea and Australia.
At the same time, the size of public administration does notexplain everything. Central governments in Australia andKorea have similar sizes too, but spend around three timesmore on ICT per employee than those in Chile or Finland.France and the United States have high central governmentemployment volumes compared to the sample, but theUnited States spends a significantly higher amount on ICTsper employee. One could expect economies of scale toreduce the average spending per employee in larger admin-istrations; at the same time, larger administrations havepotentially higher complexities in implementing publicpolicies, which would reduce economies of scale.
Some countries have used dedicated ICT spending reviewsto better understand spending patterns, consider domesticcontext factors and improve returns on government ICT use.
More detailed information on ICT spending, includingcomparisons of disaggregated data, could help improve ICTexpenditure decisions. Analysis of such data could illustrate
how individual ICT spending categories develop over time,e.g. public employment costs compared to outsourcing; howcentral government ICT spending interacts with spending atlocal levels where most public services are delivered; or howthe use of technology supports the attainment of policyobjectives in areas like health care, education or justice.
Further reading
OECD (2010), OECD E-government Studies: Indicators Project,available at www.oecd.org/governance/public-innovation.
Figure notes
Data for Australia, Germany, Italy, Korea, Spain, and Switzerlandare for 2010 rather than 2011. Data for Belgium and Slovenia arefor 2009 rather than 2011. Data for France, New Zealand and theUnited Kingdom are for 2008 rather than 2011.
3.50: Total ICT expenditures include capital, operating and humanresources expenditures except for those countries where HR expendi-tures are not available: Austria, Belgium, Estonia, Germany, Iceland,Slovenia, Switzerland and the United Kingdom. Data for Austria andPortugal are for 2010 rather than 2011. Data for Iceland are for2008 rather than 2011. Chile provided detailed ICT spending data butis not displayed due to missing central government expenditures.
3.51: ICT expenditures in this figure include only capital and operatingexpenditures as the areas where economies of scale can most likely beexpected (data for the Netherlands, New Zealand and the United Statesinclude HR expenditures). Data for Austria, Iceland and Portugal arenot available. Central government employment data is provided asthe number of employees except for France, Korea, New Zealand,Switzerland and the United Kingdom where data represent full-timeequivalents (FTEs). As a result, the comparison understates employ-ment numbers and overstates the combined ICT capital and operatingexpenditures per employee for these five countries.
Methodology and definitions
ICT spending data is available in 21 countries andcovers capital, operating and human resourcesexpenditures. Data comes from an OECD survey ofgovernment ICT expenditures conducted in 2010and 2011 with central government officials in theOECD Network on E-government. Additional data wasextracted from publicly available official data sources.This is the first time that data collection and harmon-isation was undertaken for such a large number ofcountries. Data presented here are therefore prelimi-nary and pending further harmonisation.
GOVERNMENT AT A GLANCE 2013 © OECD 201384
3. PUBLIC FINANCE AND ECONOMICS
Special feature: Central government ICT spending
3.50. Total ICT expenditures as a share of central government expenditures(2011 or latest available year)
Source: OECD Survey of ICT Expenditures, 2010-11; OECD National Accounts Statistics (database).1 2 http://dx.doi.org/10.1787/888932942146
3.51. ICT capital and operating expenditures per central government employee comparedto central government employment (2011 or latest available year)
Source: OECD Survey of ICT Expenditures, 2010-11; International Labour Organization (ILO), LABORSTA (database).Data for Chile, France, Korea, Switzerland and the United Kingdom for employment are from OECD PublicEmployment Survey 2010.
1 2 http://dx.doi.org/10.1787/888932942165
%
0
0.5
1.0
1.5
2.0
2.5
New Ze
aland
United
States
Canad
a
Finlan
d
Switzerl
and
Netherl
ands
Austra
lia
Mexico
Eston
iaKor
ea
United
Kingdo
m
Icelan
dSpa
in
Franc
e
Sloven
ia
Portug
al
Belgium
Austri
aIta
ly
German
y
5 000
0
10 000
15 000
20 000
25 000
30 000
500 0000 1 000 000 1 500 000 2 000 000 2 500 000 3 000 000
CHE
USA
AUS
GBR
KOR
CAN
NLD
NZL
FINITA
BEL
CHL
ESP
DEUFRA
MEX
SVNEST
ICT capital and operating expenditures per central government employee (USD PPP)
Central government employment
GOVERNMENT AT A GLANCE 2013 © OECD 2013 85


GOVERNMENT AT A GLANCE 2013 © OEC
4. BUDGETING PRACTICESAND PROCEDURES
Successful fiscal outcomes are mainly the result of three features: the generalperformance of the economy, political commitment to fiscal discipline and the institutionalarrangements for budgeting. This chapter focuses on the last of these features.Well-functioning budget institutions are a necessary condition to improve fiscal health,achieve stable taxes and guarantee inter-generational fairness. Moreover, a nation’s publicexpenditure system must promote fiscal discipline, the allocation of resources where they aremost valuable and the efficient operation of government.
This chapter presents indicators comprising key budgetary institutional features. Theseare the existence of fiscal rules as a tool to seek fiscal sustainability by setting constraints, thedegree to which budgets have incorporated a medium-term perspective to ensure thatmulti-year consequences of expenditure measures are considered, the amount of autonomygiven to government organisations on their budgetary decisions, whether or not performanceinformation is used in budget formulation, the assessment of public-private partnerships(compared to traditional infrastructure projects), and finally whether countries haveestablished an independent fiscal institution as a support mechanism to ensure the prudentmanagement of public finances. Although these are presented as separate features of soundbudgetary designs, they build on each other and should be understood as a package.
The results of this chapter are based upon countries’ responses to OECD surveys andrepresent their own assessment. The composite indexes represent calculations by staffmembers with the purpose of summarising discrete, qualitative information of budgetarypractices into aggregated indicators, which are easier to interpret than several separatedvariables; composite indexes are calculated with the purpose of furthering the discussion andconsequently may evolve over time.
D 2013 87
4. BUDGETING PRACTICES AND PROCEDURES
Fiscal rules
A fiscal rule is a long-term constraint on fiscal policythrough numerical limits on the budgetary aggregates.Without overall limits, incremental budgeting can becomean open-ended process in which governments accommo-date demands by spending more than they have. A fiscalrule has two fundamental characteristics. First, it presentsa constraint that binds political decisions made by thelegislature and by the executive. And second, it serves as aconcrete indicator of the executive’s fiscal management.While fiscal rules can help governments to achieve fiscalobjectives and discipline, there is no one-size-fits-all rulefor every country.
Fiscal rules may focus on different elements of governmentfiscal performance: revenues, expenditures, budget balance,and public debt. Across OECD member countries, the mostcommon types of fiscal rules are budget balance rules(28 member countries) and debt rules (23), due to obligationsfor European Union countries. Revenue rules are the leastcommon, as only five OECD member countries have them inplace (Australia, France, Greece, the Netherlands, and theSlovak Republic).
Fiscal rules can have different national legal foundations,and may be enshrined in constitutions, or primary orsecondary legislation. Other countries may stipulate fiscalrules in public political commitments or in internal rules setout by the ministries of finance. Australia is an interestingexample as it has in place all four kinds of rules. The legalbasis for three of them is the Budget Honesty Act, which is astrong political commitment; in the case of the debt rule, itis founded in legislation. Japan and Korea have only expen-diture rules, in both cases as internal rules and policies.
Finally, some countries must also ascribe to fiscal rulesfixed in international law. In the case of countries in theEuropean Union, for instance, the Maastricht Treaty esta-blishes a debt and two budget balance rules. As a result ofthe new Fiscal Compact and the – Six Pack – measures forfiscal consolidation, EU authorities have requested to raisefiscal rules to constitutional status as a way of increasingthe political costs of non-compliance. Ten countries(Austria, Belgium, the Czech Republic, Germany, Hungary,Italy, Poland the Slovak Republic, Spain and Switzerland)have fiscal rules stipulated in their constitutions.
One of the most important lessons from past experience isthat unduly rigid rules tend to be unworkable and could beinsensitive to economic or political circumstances. In turn,strong fiscal rules regimes may rely rather on the strengthof political commitment, monitoring by independent fiscalinstitutions and other actors, as well as clear and effectiveenforcement procedures for non-compliance. Concerningthe latter, different kinds of measures can be implemented,from the need to present a corrective proposal to the legis-lature to automatic correction mechanisms and sanctions.Countries belonging to the EU are subject to ExcessiveDeficit Procedures (EDP), a multi-step revision process ofthe country fiscal situation, which can lead to sanctions.
The recent changes in the economic governance frame-work have loosened the requirements to start an EDP.Across OECD member countries, with the exception ofEDPs, automatic correction mechanisms are the mostcommon enforcement tool for budget balance rules,whereas a requirement for the indebted institution toadopt measures is the most common correction mecha-nism for debt rules. Automatic sanctions for breaking anykind of fiscal rules are only used in five OECD membercountries (the Netherlands, the United States, Switzerland,Poland and the Slovak Republic).
Further reading
Anderson, B. and J. Sheppard (2010), “Fiscal futures,institutional budget reforms, and their effects: Whatcan be learned?”, OECD Journal on Budgeting, Vol. 9/3,http://dx.doi.org/10.1787/budget-9-5kmh6dnl056g.
Schick, A. (2010), “Post-Crisis Fiscal Rules: Stabilising PublicFinance while Responding to Economic Aftershocks”,OECD Journal on Budgeting, Vol. 10/2, http://dx.doi.org/10.1787/budget-10-5km7rqpkqts1.
Table notes
4.1 and 4.2: Data not available for Iceland. Data reflect countries’ multiplefiscal rules. New Zealand and Turkey do not have fiscal rules in placeand are not displayed in the table.
4.1: For Italy Law No. 243/2012 introduced the structural budget rule, theexpenditure and debt rule in line with European requirements. Thefirst two will enter into force by 2014 and the debt rule by 2015.
Information on data for Israel: http://dx.doi.org/10.1787/888932315602.
Methodology and definitions
Data refer to 2012 and draw upon country responses toquestions from the 2012 OECD Survey on BudgetingPractices and Procedures. Survey respondents werepredominately senior budget officials in OECDmember countries. Responses represent the countries’own assessments of current practices and procedures.Data refer only to central/federal governments andexclude budgeting practices at state/local levels.
Primary legislation (also referred to as principal legisla-tion or primary law) is regulations which must beapproved by the legislature.Secondary regulations areregulations that can be approved by the head ofgovernment, by an individual minister or by the Cabinet– that is, by an authority other than the legislature.Secondary regulations are susceptible to disallowanceby the legislature.
GOVERNMENT AT A GLANCE 2013 © OECD 201388
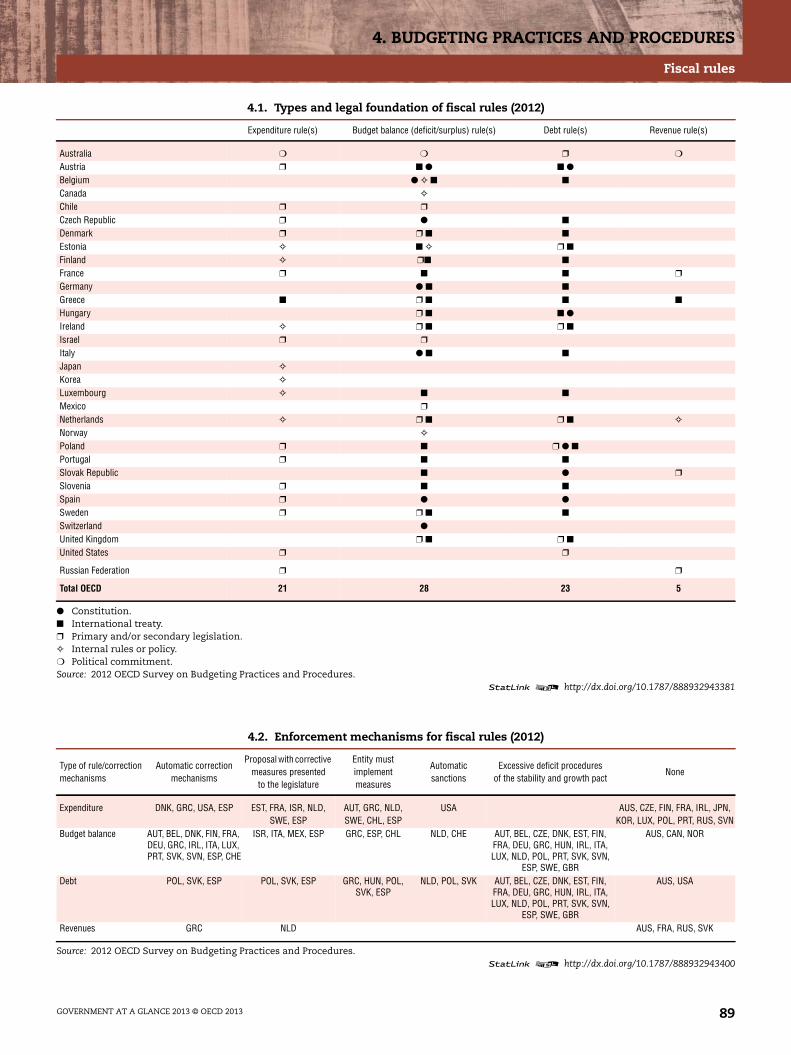
4. BUDGETING PRACTICES AND PROCEDURES
Fiscal rules
4.1. Types and legal foundation of fiscal rules (2012)
Expenditure rule(s) Budget balance (deficit/surplus) rule(s) Debt rule(s) Revenue rule(s)
Australia ❍ ❍ ❒ ❍
Austria ❒ ■ ● ■ ●
Belgium ● ✧ ■ ■
Canada ✧
Chile ❒ ❒
Czech Republic ❒ ● ■
Denmark ❒ ❒ ■ ■
Estonia ✧ ■ ✧ ❒ ■
Finland ✧ ❒■ ■
France ❒ ■ ■ ❒
Germany ● ■ ■
Greece ■ ❒ ■ ■ ■
Hungary ❒ ■ ■ ●
Ireland ✧ ❒ ■ ❒ ■
Israel ❒ ❒
Italy ● ■ ■
Japan ✧
Korea ✧
Luxembourg ✧ ■ ■
Mexico ❒
Netherlands ✧ ❒ ■ ❒ ■ ✧
Norway ✧
Poland ❒ ■ ❒ ● ■
Portugal ❒ ■ ■
Slovak Republic ■ ● ❒
Slovenia ❒ ■ ■
Spain ❒ ● ●
Sweden ❒ ❒ ■ ■
Switzerland ●
United Kingdom ❒ ■ ❒ ■
United States ❒ ❒
Russian Federation ❒ ❒
Total OECD 21 28 23 5
● Constitution.■ International treaty.❒ Primary and/or secondary legislation.✧ Internal rules or policy.❍ Political commitment.Source: 2012 OECD Survey on Budgeting Practices and Procedures.
1 2 http://dx.doi.org/10.1787/888932943381
4.2. Enforcement mechanisms for fiscal rules (2012)
Type of rule/correctionmechanisms
Automatic correctionmechanisms
Proposal with correctivemeasures presented
to the legislature
Entity mustimplementmeasures
Automaticsanctions
Excessive deficit proceduresof the stability and growth pact
None
Expenditure DNK, GRC, USA, ESP EST, FRA, ISR, NLD,SWE, ESP
AUT, GRC, NLD,SWE, CHL, ESP
USA AUS, CZE, FIN, FRA, IRL, JPN,KOR, LUX, POL, PRT, RUS, SVN
Budget balance AUT, BEL, DNK, FIN, FRA,DEU, GRC, IRL, ITA, LUX,PRT, SVK, SVN, ESP, CHE
ISR, ITA, MEX, ESP GRC, ESP, CHL NLD, CHE AUT, BEL, CZE, DNK, EST, FIN,FRA, DEU, GRC, HUN, IRL, ITA,LUX, NLD, POL, PRT, SVK, SVN,
ESP, SWE, GBR
AUS, CAN, NOR
Debt POL, SVK, ESP POL, SVK, ESP GRC, HUN, POL,SVK, ESP
NLD, POL, SVK AUT, BEL, CZE, DNK, EST, FIN,FRA, DEU, GRC, HUN, IRL, ITA,LUX, NLD, POL, PRT, SVK, SVN,
ESP, SWE, GBR
AUS, USA
Revenues GRC NLD AUS, FRA, RUS, SVK
Source: 2012 OECD Survey on Budgeting Practices and Procedures.1 2 http://dx.doi.org/10.1787/888932943400
GOVERNMENT AT A GLANCE 2013 © OECD 2013 89
4. BUDGETING PRACTICES AND PROCEDURES
Medium-term expenditure frameworks
Medium-term expenditure frameworks (MTEFs) helpcentral/federal government organisations to adopt a mediumterm budgetary perspective rather than solely an annual one.MTEFs typically span a period of three to five years, includ-ing the budgeted fiscal year, and combine prescriptive yearlyceilings with descriptive forward estimates.
There is an international consensus about the importance ofadopting a medium-term perspective in the budget process.In the first place, MTEFs are a key element available tocentral budget authorities to help manage expendituresacross central government and ensure fiscal discipline:expenditure estimates capture information on the cost ofexisting policies and programmes and form the baselines forthe following years’ budgets, while expenditure ceilingsprovide a top-down constraint on spending in future years.MTEFs also help control spending by allowing for the incor-poration of multi-year policies that may require an extendedtime horizon for implementation, such as large capitalprojects, new programmes, and organisational restructures.Furthermore, from the point of view of line ministry andagency managers, the medium-term perspective signals thedirection of policy and funding changes thereby giving themtime to adjust and better plan their operations.
The impact of a medium-term perspective in the budget,however, depends ultimately on the credibility of theexpenditure estimates and ceilings as well as how thisinformation is used by decision makers and members ofcivil society. Failure to achieve medium-term budget objec-tives is often related to weak arrangements surroundingthe preparation, legislation and implementation of budget-ary targets.
Medium-term expenditure ceilings are set in all but fourOECD countries (Belgium, Israel, Hungary and Luxembourg),most often spanning a period of four years. The strength ofthese frameworks varies greatly across OECD membercountries, reflected by the degree to which they are stipu-lated in legislation, decided by the executive or the legisla-tive, and subsequently monitored by the legislative orindependent bodies. Most often, expenditure ceilings are setfor total aggregate expenditures. Some countries (Austria,Germany, Italy, Korea, the Netherlands, and New Zealand)have additional ceilings in place by programme, sector,and/or organisation. In order for MTEFs to be effective,monitoring and enforcement mechanisms should be inplace whereby the executive reports to the legislature or anindependent fiscal institution on compliance.
Further reading
OECD (2013, forthcoming), Budgeting Practices and Proceduresin OECD Countries, OECD Publishing, Paris.
OECD (2002), “OECD Best Practices for Budget Transparency”,OECD Journal on Budgeting, Vol. 1/3, pp. 7-14, http://dx.doi.org/10.1787/budget-v1-art14-en.
World Bank (2013), Beyond the Annual Budget – GlobalExperience with Medium-Term Expenditure Frameworks,International Bank for Reconstruction and Development,The World Bank, Washington, DC, http://dx.doi.org/10.1596/978-0-8213-9625-4.
Figure and table notes
Data not available for Iceland
4.3: In the case of Germany the legal foundation of the MTEF is theFinanzplan which is discussed in parallel with the parliamentaryapproval of the budget, it includes the budget ceilings. In the case ofthe Netherlands, organisational expenditures are included in thetotal and sector expenditures for the Netherlands
4.4: Index country scores for Belgium, Hungary, Israel and Luxembourgare 0 as they reported not having an MTEF in place.
Information on data for Israel: http://dx.doi.org/10.1787/888932315602.
Methodology and definitions
Data refer to 2012 and draw upon country responses toquestions from the 2012 OECD Survey on BudgetingPractices and Procedures. Survey respondents werepredominately senior budget officials in OECDmember countries. Responses represent the countries’own assessments of current practices and procedures.Data refer only to central/federal governments andexclude budgeting practices at state/local levels.
An MTEF was defined as a framework for integratingfiscal policy and budgeting over the medium-term bylinking aggregate fiscal forecasting to a disciplinedprocess of maintaining detailed medium-term budgetestimates by ministries reflecting existing governmentpolicies. Forward estimates of expenditures becomethe basis of budget negotiations in the years followingthe budget and the forward estimates are reconciledwith final outcomes in fiscal outcome reports.
The composite index in Figure 4.4 contains 10 variablesthat cover information on the existence medium-termperspective in the budget process, the number of yearsthe estimate covers, the types of expenditures includedin the frameworks, the possibility of carry over unusedfunds from one year to another and how they aremonitored. It should be noted that the index does notpurport to measure the overall quality of MTEF systemsbut is descriptive in nature. Annex C contains a descrip-tion of the methodology used to construct this index,including the specific weights assigned to each variable.
GOVERNMENT AT A GLANCE 2013 © OECD 201390
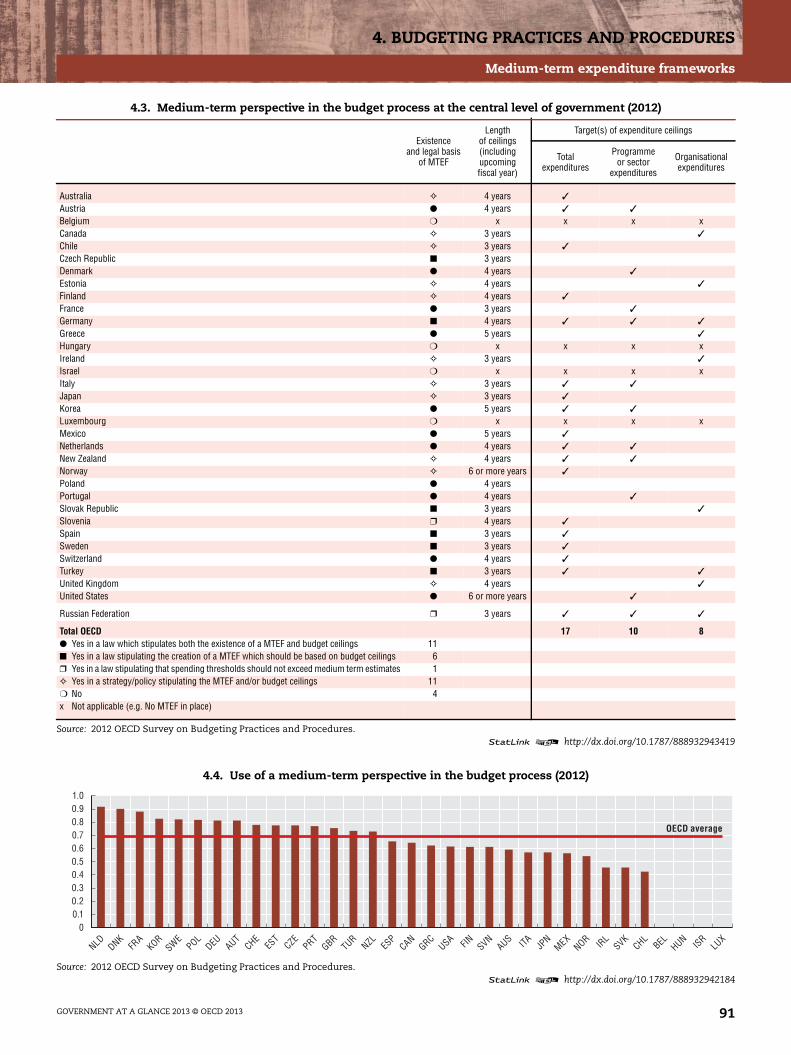
4. BUDGETING PRACTICES AND PROCEDURES
Medium-term expenditure frameworks
4.3. Medium-term perspective in the budget process at the central level of government (2012)
Existenceand legal basis
of MTEF
Lengthof ceilings(includingupcomingfiscal year)
Target(s) of expenditure ceilings
Totalexpenditures
Programmeor sector
expenditures
Organisationalexpenditures
Australia ✧ 4 years ✓
Austria ● 4 years ✓ ✓
Belgium ❍ x x x xCanada ✧ 3 years ✓
Chile ✧ 3 years ✓
Czech Republic ■ 3 yearsDenmark ● 4 years ✓
Estonia ✧ 4 years ✓
Finland ✧ 4 years ✓
France ● 3 years ✓
Germany ■ 4 years ✓ ✓ ✓
Greece ● 5 years ✓
Hungary ❍ x x x xIreland ✧ 3 years ✓
Israel ❍ x x x xItaly ✧ 3 years ✓ ✓
Japan ✧ 3 years ✓
Korea ● 5 years ✓ ✓
Luxembourg ❍ x x x xMexico ● 5 years ✓
Netherlands ● 4 years ✓ ✓
New Zealand ✧ 4 years ✓ ✓
Norway ✧ 6 or more years ✓
Poland ● 4 yearsPortugal ● 4 years ✓
Slovak Republic ■ 3 years ✓
Slovenia ❒ 4 years ✓
Spain ■ 3 years ✓
Sweden ■ 3 years ✓
Switzerland ● 4 years ✓
Turkey ■ 3 years ✓ ✓
United Kingdom ✧ 4 years ✓
United States ● 6 or more years ✓
Russian Federation ❒ 3 years ✓ ✓ ✓
Total OECD 17 10 8● Yes in a law which stipulates both the existence of a MTEF and budget ceilings 11■ Yes in a law stipulating the creation of a MTEF which should be based on budget ceilings 6❒ Yes in a law stipulating that spending thresholds should not exceed medium term estimates 1✧ Yes in a strategy/policy stipulating the MTEF and/or budget ceilings 11❍ No 4x Not applicable (e.g. No MTEF in place)
Source: 2012 OECD Survey on Budgeting Practices and Procedures.1 2 http://dx.doi.org/10.1787/888932943419
4.4. Use of a medium-term perspective in the budget process (2012)
Source: 2012 OECD Survey on Budgeting Practices and Procedures.1 2 http://dx.doi.org/10.1787/888932942184
00.10.20.30.40.50.60.70.80.91.0
NLD DNKFR
AKOR
SWEPOL
DEU AUTCHE
EST
CZEPRT
GBRTUR
NZL ESP
CANGRC
USA FIN SVNAUS ITA JP
NMEX
NOR IRL
SVKCHL
BEL HUN ISRLU
X
OECD average
GOVERNMENT AT A GLANCE 2013 © OECD 2013 91

4. BUDGETING PRACTICES AND PROCEDURES
Executive budget flexibility
A feature of budget reforms in many OECD countries is therelaxing of input controls by the central budget authority togive government organisations greater flexibility andautonomy to achieve their objectives efficiently and effect-ively. It is based upon the premise that heads of individualgovernment organisations are the best positioned toachieve their policy and programme objectives (let manag-ers manage). Moreover, even with a sound budget formula-tion process, economic assumptions can change, inputprices can fluctuate and evolving political priorities can callfor the reallocation of budgeted resources. Greater flexi-bility for line managers permits them to adjust spendingaccording to such changing conditions.
On the other hand, if this authority is unreserved andunchecked, it can undermine fiscal sustainability. Potentialrisks include opportunities for the abuse of power bygovernment managers, increased government deficits andweakened efficiency. Too much flexibility may also under-mine the intent of legislators’ and appropriations, asresources could be diverted away from their priorities.Therefore, although models vary, the majority of OECDmember countries adopt some balance between top-downdirectives and oversight for performance with varyingdegrees of ministerial flexibility. The Central BudgetAuthority sets the top-down budget constraints, based onpolitical priorities and medium-term expenditure consider-ations, while line ministries, agencies and other publicorganisations are given responsibility for the allocationand use of those funds to meet agreed-upon programmeobjectives. With such freedom however also comes greaterneed for accountability and the use of performance manage-ment (see indicator on performance budgeting). This canenhance efficiency and effectiveness in light of new priori-ties, new circumstances and new knowledge. It alsostrengthens the incentive for politicians to focus on outputsand outcomes rather than inputs alone.
A key aspect of executive budget flexibility is the use oflump sum appropriations, which provides managers withmore flexibility to allocate funds across and withinprogrammes as they see fit. The majority of membercountries place sub-limits on these lump sums, mostcommonly on spending on wages and compensation ofemployees. Similarly, a limited number of line item appro-priations in the approved budget provide the executivewith more flexibility. Only a quarter of OECD membercountries have fewer than 300 line items. The majority ofCBAs in member countries also permit line ministries andagencies to carry over unspent appropriations from oneyear to the next, albeit with restrictions such as complyingwith thresholds, needing to request approval or both.Generally speaking there is greater flexibility with regardsto investment spending over operational expenditure since
capital projects often span several years. In addition, somecountries permit the executive to borrow against futureappropriations. Of the seven countries that follow thispractice, however, all have in place a threshold limiting theamount that can be overspent in the current fiscal year.The executive may also have permission to increase or cutspending during the budget year without prior legislativeapproval. This additional flexibility is often granted basedon the notion that it can facilitate the optimal use of publicresources and provide incentives to improve the efficiencyof public expenditure.
Further reading
OECD (2013, forthcoming), Budgeting Practices and Proceduresin OECD Countries, OECD Publishing, Paris.
Table notes
4.5: Data are not available for Iceland. In Germany line ministries mayborrow against future appropriations provided that the followingfiscal year’s budget contains an item of expenditure having the samepurpose, and that there is an intention to balance the cash positionin the current fiscal year. If additional spending cannot be treated asadvance expenditure, it must be treated as excess expenditure. InSpain, line ministries do not receive lump-sum appropriations,however they may, within limits, reallocate funds. In Finland, Koreaand Slovenia, only certain kinds of expenditures may be carried overto the following fiscal year. In Australia, annual appropriations donot lapse at the end of the financial year and may be drawn againstto the limit of the available appropriation, generally, annual appro-priations are available until they are spent, reduced in accordancewith the reduction provisions in the annual Appropriation Acts, orthe relevant annual Appropriation Act is repealed by another Act. Inthe United States, data apply to large departments/line ministriesonly. In Turkey some appropriations can be exceptionally carriedover, this is determined on a yearly basis in Annual CentralGovernment Budget Law and the authority to decide on the carryover is given to the Minister of Finance
Information on data for Israel: http://dx.doi.org/10.1787/888932315602.
Methodology and definitions
Data refer to 2012 and draw upon country responses toquestions from the 2012 OECD Survey on BudgetingPractices and Procedures. Survey respondents werepredominately senior budget officials in OECDmember countries. Responses represent the countries’own assessments of current practices and procedures.Data refer only to central/federal governments andexclude budgeting practices at state/local levels.
GOVERNMENT AT A GLANCE 2013 © OECD 201392

4. BUDGETING PRACTICES AND PROCEDURES
Executive budget flexibility
4.5. Ability of line ministries to carry over unused funds and borrow against future appropriations (2012)
Number of sub-limitson line ministries’ lump
sum appropriations
Ability of line ministries to borrowagainst future appropriations
Ability of line ministries to carry over unusedfunds or appropriations from one year to the next
Operating expenditure Investment expenditure Operating expenditure Investment expenditure
Australia 0 ❍ ❍ x x
Austria x (no lump sums) ❍ ❍ ● ●
Belgium 2 ❍ ❍ ❍ ❍
Canada 2 ❍ ❍ ■ ■
Chile 3 or more ❍ ❍ ❍ ❍
Czech Republic 3 or more ❍ ❍ ● ●
Denmark 1 ■ ❍ ● ●
Estonia 1 ❍ ❍ ■ ●
Finland 0 ❍ ❍ ● ●
France 0 ❍ ❍ ■ ■
Germany x (no lump sums) ■ ■ ❍ ❍
Greece 3 or more ❍ ❍ ❍ ❍
Hungary 1 ❍ ■ ● ●
Ireland 0 ❍ ❍ ❍ ■
Israel 3 or more ❍ ❍ ● ●
Italy 1 ❍ ■ ❍ ■
Japan 0 ❍ ❍ ● ●
Korea 3 or more ❍ ❍ ● ●
Luxembourg 1 ❍ ■ ❍ ●
Mexico 3 or more ❍ ❍ ❍ ❍
Netherlands 0 ❍ ❍ ■ ■
New Zealand 0 ■ ■ ■ ■
Norway 0 ❍ ❍ ■ ■
Poland 0 ❍ ❍ ❍ ❍
Portugal 1 ❍ ❍ ● ●
Slovak Republic 2 ❍ ❍ ❍ ●
Slovenia 1 ❍ ❍ ● ●
Spain x (no lump sums) ❍ ❍ ■ ■
Sweden 0 ■ ■ ■ ■
Switzerland 0 ❍ ❍ ● ●
Turkey x (no lump sums) ❍ ❍ ❍ ❍
United Kingdom x (no lump sums) ❍ ❍ ■ ■
United States 3 or more ❍ ❍ ■ ■
Russian Federation 3 or more ■ ■ ■ ●
OECD total
● Yes, without threshold 0 0 11 14
■ Yes, up to certain threshold 4 6 10 11
❍ No, not permitted 29 27 11 7
Source: 2012 OECD Survey on Budgeting Practices and Procedures.1 2 http://dx.doi.org/10.1787/888932943438
GOVERNMENT AT A GLANCE 2013 © OECD 2013 93
4. BUDGETING PRACTICES AND PROCEDURES
Performance budgeting
Governments are increasingly incorporating performanceinformation in the budgeting and governance processes as ameans of achieving better results, promoting greater valuefor money, and increasing the transparency of spendingdecisions. Good performance information can contribute tobetter decisions regarding the use of resources and how torun particular programmes. Greater transparency of perfor-mance and resource allocation also increases the account-ability of government agencies for their expenditures.
Although performance budgeting practices are widely usedin OECD member countries, there are vast differences inthe approaches taken and there is no consensus on theoptimal type of regime that should be applied. However,the OECD has identified three broad categories of perfor-mance budgeting systems: i) presentational performancebudgeting whereby performance information is producedand shown alongside funding allocations, but not neces-sarily utilised to make spending decisions; ii) performance-informed budgeting where such information explicitlyinfluences the allocation of resources; and iii) direct perfor-mance budgeting (formula-based budgeting) in whichfunding is strictly linked to outputs and outcomes. Themajority of OECD member countries fall into the first orsecond categories, with few adopting the latter for selecttypes of expenditures (e.g. funding of higher education orhospitals).
Results from the 2011 OECD Survey on PerformanceBudgeting indicate that the practice is generally decentral-ised within central/federal government. That is, it is morecommon that line ministries apply performance budgetingpractices in the allocation of their own budget envelopesacross agencies/divisions. The exceptions are spendingreviews, where central budget authorities and chief execu-tives play a more central role. Some countries howeveradopt a more centralised approach, and have in place agovernment-wide framework for developing performanceinformation (evaluations and performance measures),integrating performance information into budget andaccountability processes, using it in decision making,and monitoring and reporting on results. For instance,countries such as Korea, Mexico and Canada have standardand comprehensive frameworks for line ministries andagencies including such elements as guidelines, reportingtemplates and performance ratings. In the majority ofcountries however, failure to achieve performance targetsmost often triggers no financial consequences, but is ratherfollowed by publication of the poor performance and moreintense monitoring in the future.
Performance information can take many forms, includingfinancial and operational data, evaluations, and even inde-pendent statistics and reports from outside government. Byfar the most commonly used information in budgetnegotiations are input measures, such as financial andoperational data (Table 4.6).
Further reading
OECD (2008), “Performance Budgeting: A User’s Guide”,OECD Policy Brief, OECD Publishing, Paris, www.oecd.org/governance/budgeting/40357919.pdf.
OECD (2007), Performance Budgeting in OECD Countries,OECD Publishing, Paris, http://dx.doi.org/10.1787/9789264034051-en.
Figure and table notesData are not available for Iceland and Israel. For Austria Performance
information is not yet used for budgeting negotiations but during thebudget implementation and to improve efficiency.
Methodology and definitions
Data refer to 2011 and draw upon country responsesto questions from the 2011 OECD Survey on Perfor-mance Budgeting. Survey respondents were predo-minately senior budget officials in OECD membercountries. Responses represent the countries’ ownassessments of current practices and procedures.Data refer only to central/federal governments andexclude performance budgeting practices at the state/local levels. For EU member countries, results excludeany EU funding.
Spending reviews are a specific kind of governmentevaluation, and are commissioned with the specificobjective of identifying budgetary savings acrossgovernment. The OECD value-for-money projectdifferentiates spending reviews from other types ofevaluation through three main characteristics:
1. Spending reviews not only look at programme effect-iveness and efficiency under current funding levels,but also examine the consequences for outputs andoutcomes of alternative funding levels. They may befunctional in nature (e.g. focus on operationalefficiency) and/or strategic (e.g. focus both onefficiency and on whether initiatives are aligned withhigh-level policy priorities).
2. The responsibility for the spending review proce-dure is under the responsibility of either theMinistry of Finance or the prime minister’s office.
3. The follow-up of spending reviews is decided in thebudget process.
This composite index in Figure 4.7 contains 11 variablesthat cover information on the availability and type ofperformance information developed, processes formonitoring and reporting on results and whether (andhow) performance information is used on budgetnegotiations and decision making by the central budgetauthorities, line ministries and politicians. It should benoted that the index does not purport to measure theoverall quality of performance budgeting systems but isdescriptive in nature. Annex C contains a description ofthe methodology used to construct this index, includingthe specific weights assigned to each variable.
GOVERNMENT AT A GLANCE 2013 © OECD 201394
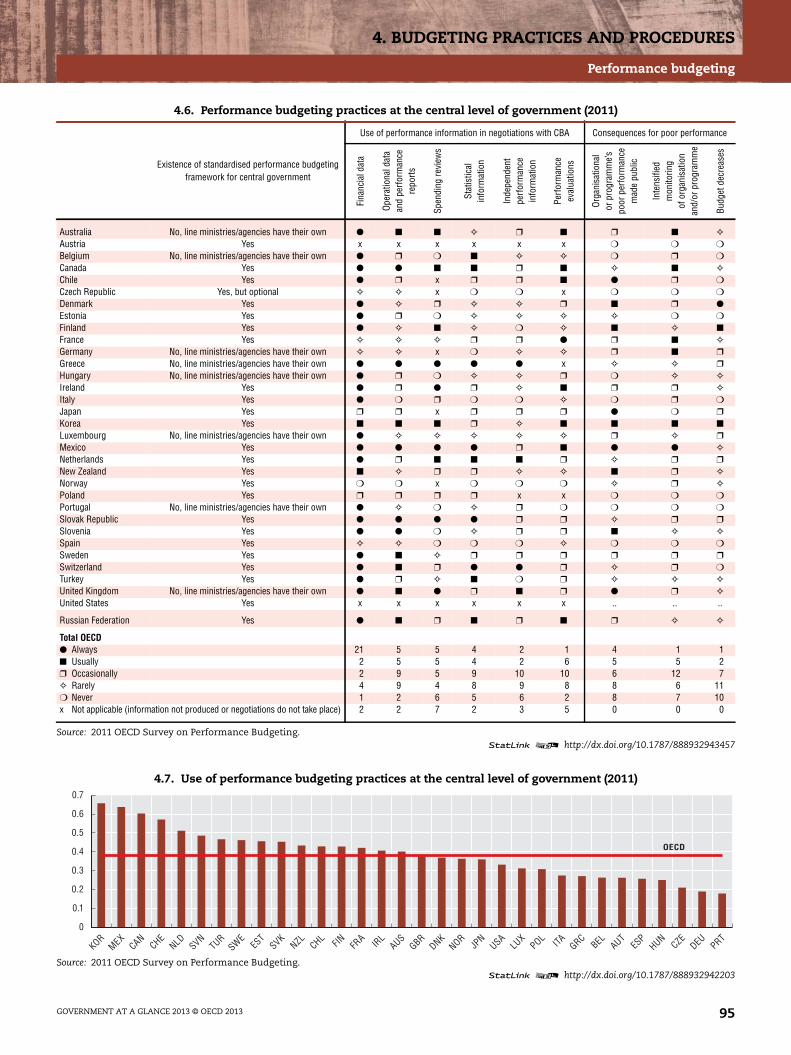
4. BUDGETING PRACTICES AND PROCEDURES
Performance budgeting
4.6. Performance budgeting practices at the central level of government (2011)
Existence of standardised performance budgetingframework for central government
Use of performance information in negotiations with CBA Consequences for poor performance
Fina
ncia
ldat
a
Oper
atio
nald
ata
and
perf
orm
ance
repo
rts
Spen
ding
revi
ews
Stat
istic
alin
form
atio
n
Inde
pend
ent
perf
orm
ance
info
rmat
ion
Perf
orm
ance
eval
uatio
ns
Orga
nisa
tiona
lor
prog
ram
me’s
poor
perf
orm
ance
mad
epu
blic
Inte
nsifi
edm
onito
ring
ofor
gani
satio
nan
d/or
prog
ram
me
Budg
etde
crea
ses
Australia No, line ministries/agencies have their own ● ■ ■ ✧ ❒ ■ ❒ ■ ✧
Austria Yes x x x x x x ❍ ❍ ❍
Belgium No, line ministries/agencies have their own ● ❒ ❍ ■ ✧ ✧ ❍ ❒ ❍
Canada Yes ● ● ■ ■ ❒ ■ ✧ ■ ✧
Chile Yes ● ❒ x ❒ ❒ ■ ● ❒ ❍
Czech Republic Yes, but optional ✧ ✧ x ❍ ❍ x ❍ ❍ ❍
Denmark Yes ● ✧ ❒ ✧ ✧ ❒ ■ ❒ ●
Estonia Yes ● ❒ ❍ ✧ ✧ ✧ ✧ ❍ ❍
Finland Yes ● ✧ ■ ✧ ❍ ✧ ■ ✧ ■
France Yes ✧ ✧ ✧ ❒ ❒ ● ❒ ■ ✧
Germany No, line ministries/agencies have their own ✧ ✧ x ❍ ✧ ✧ ❒ ■ ❒
Greece No, line ministries/agencies have their own ● ● ● ● ● x ✧ ✧ ❒
Hungary No, line ministries/agencies have their own ● ❒ ❍ ✧ ✧ ❒ ❍ ✧ ✧
Ireland Yes ● ❒ ● ❒ ✧ ■ ❒ ❒ ✧
Italy Yes ● ❍ ❒ ❍ ❍ ✧ ❍ ❒ ❍
Japan Yes ❒ ❒ x ❒ ❒ ❒ ● ❍ ❒
Korea Yes ■ ■ ■ ❒ ✧ ■ ■ ■ ■
Luxembourg No, line ministries/agencies have their own ● ✧ ✧ ✧ ✧ ✧ ❒ ✧ ❒
Mexico Yes ● ● ● ● ❒ ■ ● ● ✧
Netherlands Yes ● ❒ ■ ■ ■ ❒ ✧ ❒ ❒
New Zealand Yes ■ ✧ ❒ ❒ ✧ ✧ ■ ❒ ✧
Norway Yes ❍ ❍ x ❍ ❍ ❍ ✧ ❒ ✧
Poland Yes ❒ ❒ ❒ ❒ x x ❍ ❍ ❍
Portugal No, line ministries/agencies have their own ● ✧ ❍ ✧ ❒ ❍ ❍ ❍ ❍
Slovak Republic Yes ● ● ● ● ❒ ❒ ✧ ❒ ❒
Slovenia Yes ● ● ❍ ✧ ❒ ❒ ■ ✧ ✧
Spain Yes ✧ ✧ ❍ ❍ ❍ ✧ ❍ ❍ ❍
Sweden Yes ● ■ ✧ ❒ ❒ ❒ ❒ ❒ ❒
Switzerland Yes ● ■ ❒ ● ● ❒ ✧ ❒ ❍
Turkey Yes ● ❒ ✧ ■ ❍ ❒ ✧ ✧ ✧
United Kingdom No, line ministries/agencies have their own ● ■ ● ❒ ■ ❒ ● ❒ ✧
United States Yes x x x x x x .. .. ..
Russian Federation Yes ● ■ ❒ ■ ❒ ■ ❒ ✧ ✧
Total OECD● Always 21 5 5 4 2 1 4 1 1■ Usually 2 5 5 4 2 6 5 5 2❒ Occasionally 2 9 5 9 10 10 6 12 7✧ Rarely 4 9 4 8 9 8 8 6 11❍ Never 1 2 6 5 6 2 8 7 10x Not applicable (information not produced or negotiations do not take place) 2 2 7 2 3 5 0 0 0
Source: 2011 OECD Survey on Performance Budgeting.1 2 http://dx.doi.org/10.1787/888932943457
4.7. Use of performance budgeting practices at the central level of government (2011)
Source: 2011 OECD Survey on Performance Budgeting.1 2 http://dx.doi.org/10.1787/888932942203
0
0.1
0.2
0.3
0.4
0.5
0.6
0.7
KORMEX
CANCHE
NLD SVNTUR
SWEES
TSVK
NZL CHL FIN FRA IR
LAUS
GBRDNK
NORJP
NUSA
LUX
POL ITA GRCBEL AUT
ESP
HUNCZE
DEU PRT
OECD
GOVERNMENT AT A GLANCE 2013 © OECD 2013 95

4. BUDGETING PRACTICES AND PROCEDURES
Public-private partnerships
Public-private partnerships (PPPs) are long-term contrac-tual agreements between the government and a privatepartner whereby the latter typically finances and deliverspublic services using a capital asset (e.g. transport orenergy infrastructure, hospital or school buildings). Theprivate party may be tasked with the design, construction,financing, operation, management and delivery of theservice for a pre-determined period of time, receiving itscompensation from fixed unitary payments or tollscharged to users. PPPs account for less than 15% of annualcapital central government expenditure, and there is agreat variation across countries in the extent to which PPPsare used: the United Kingdom has the most projects (648),followed by Korea (567) and Australia (127).
Governments may choose to pursue PPPs since, comparedto more traditional forms of infrastructure procurement,these partnerships may allow them to better harness theprivate sector’s expertise in combining the design andoperation of an asset, allowing services to be provided in amore efficient manner. Governments with sufficient expe-rience and enough data to make a judgement regardingPPPs report that these outperform traditional infrastruc-ture projects with respect to timeliness, construction costsand quality (Figure 4.8). Experiences from some OECDmember countries, however, suggest that not all PPPs arewell-managed, and therefore may not deliver the expectedbenefits. Long-term contracts for certain services can betoo inflexible given the changing needs of the public sectorand changing technology, and the PPP procurement processhas often been lengthy, complex and costly for both thepublic and the private sector. Countries also report thattransaction costs for the public and private parties for PPPsis higher than for traditional infrastructure procurement.Last, there have been incentives in some countries to usePPPs in order to finance assets off the public balancesheets. If designed with such a purpose, PPP projects can beexcluded from public sector net debt. This in turn entails alack of transparency of future liabilities and fiscal risks.
In response to these challenges, the OECD developedPrinciples for Public Governance of Public Private Partnerships.The Principles provide specific guidance under three broadheadings: i) establishing clear, predictable and legitimateinstitutional frameworks for PPPs supported by competentand well-resourced authorities; ii) grounding the selectionof PPPs in value for money; and iii) using the budgetaryprocess transparently to minimise fiscal risks and ensurethe integrity of the procurement process.
There is no clear answer as to whether one of the procure-ment methods consistently outperforms the other whencalculated over the whole life of the asset. Greater use ofvalue-for-money assessments is recommended to ascertainex ante whether a particular project is a good candidate for aPPP agreement. A project’s value for money should beevaluated in all its phases with a focus on the full life-cyclecosts of the asset and the potential risks the project repre-sents to the public sector. However, while the majority ofmember countries (21) conduct relative value-for-money
assessments of PPPs compared to TIPs, the majority of thesedo so for only certain projects (Table 4.9). Absolute value-for-money assessments are more commonplace. Somecountries have put dedicated PPP units in place to ensurerobust value-for-money assessments of PPPs, to align statedobjectives with the profit objectives of the private sector, andto ensure that they are administered in a transparentmanner. In 2010, 17 OECD countries had set up such units,with more countries beginning to follow this trend.
Further reading
Burger, P. and I. Hawkesworth (2013), “Capital budgeting andprocurement practices – towards an integrated approach?”,presented at the OECD Annual Network Meeting of SeniorPublic-Private Partnership Officials, 15-16 April 2013.
OECD (2012), Principles for Public Governance of Public PrivatePartnerships, May 2012, OECD, Paris, www.oecd.org/gov/budgeting/PPPnoSG.pdf.
OECD (2010), Dedicated Public-Private Partnership Units: A Surveyof Institutional and Governance Structures, OECD Publishing,Paris, http://dx.doi.org/10.1787/9789264064843-en.
Figure and table notes
4.8 and 4.9: Data are not available for Chile, Iceland and the United States.
Information on data for Israel: http://dx.doi.org/10.1787/888932315602.
Methodology and definitions
Data are from the 2012 OECD Survey on BudgetingPractices and Procedures. Survey respondents werepredominately senior budget officials. Responsesrepresent the countries’ own assessments of currentpractices and procedures. Data refer only to central/federal governments and exclude budgeting practicesat state/local levels.
The PPP concept includes both – pure PPPs –,e.g. projects where the main source of revenue for theprivate partners is government (in the form of regularpayments or a unit charge), as well as concessions(where the main source of revenue is user chargeslevied by the private partners on the beneficiaries ofthe services).
Relative value for money tests compare several forms ofprocuring the asset in order to determine which formrepresents the most value for money. Absolute value formoney tests determine whether a project overall (e.g. adam, an airport, a high-way) represents value for moneyfor society. Methodologies for both kinds of assess-ments vary by country.
GOVERNMENT AT A GLANCE 2013 © OECD 201396
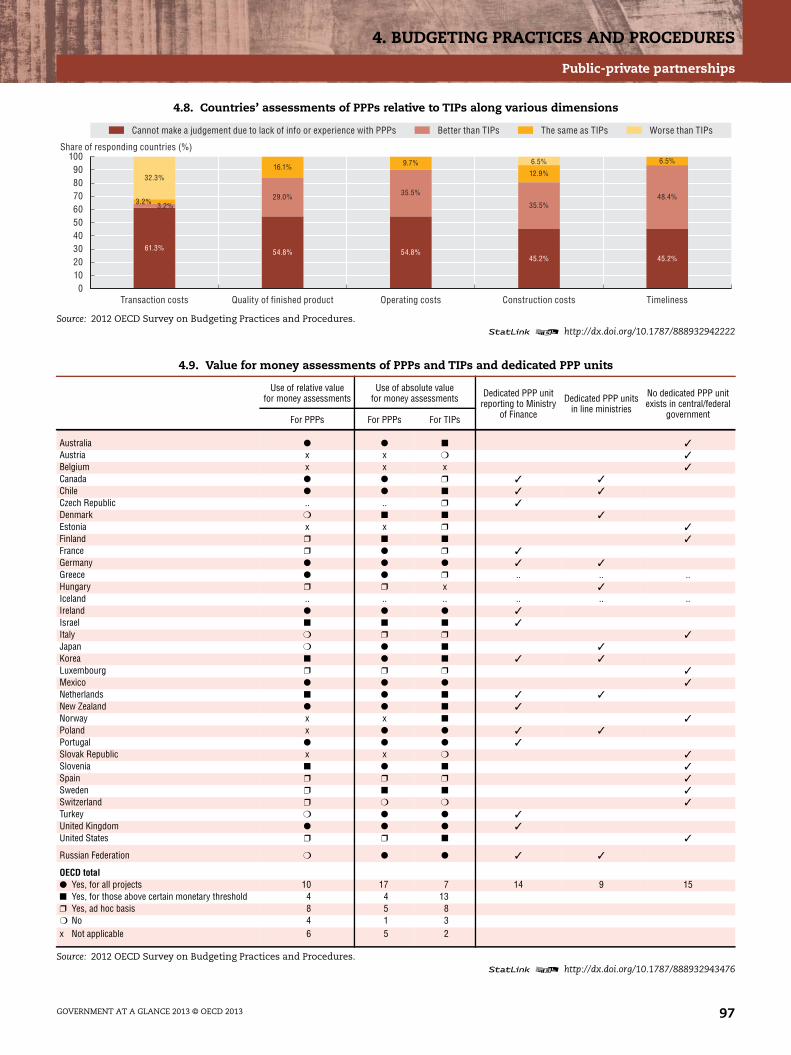
4. BUDGETING PRACTICES AND PROCEDURES
Public-private partnerships
4.8. Countries’ assessments of PPPs relative to TIPs along various dimensions
Source: 2012 OECD Survey on Budgeting Practices and Procedures.1 2 http://dx.doi.org/10.1787/888932942222
4.9. Value for money assessments of PPPs and TIPs and dedicated PPP units
Use of relative valuefor money assessments
Use of absolute valuefor money assessments Dedicated PPP unit
reporting to Ministryof Finance
Dedicated PPP unitsin line ministries
No dedicated PPP unitexists in central/federal
governmentFor PPPs For PPPs For TIPs
Australia ● ● ■ ✓
Austria x x ❍ ✓
Belgium x x x ✓
Canada ● ● ❒ ✓ ✓
Chile ● ● ■ ✓ ✓
Czech Republic .. .. ❒ ✓
Denmark ❍ ■ ■ ✓
Estonia x x ❒ ✓
Finland ❒ ■ ■ ✓
France ❒ ● ❒ ✓
Germany ● ● ● ✓ ✓
Greece ● ● ❒ .. .. ..Hungary ❒ ❒ x ✓
Iceland .. .. .. .. .. ..Ireland ● ● ● ✓
Israel ■ ■ ■ ✓
Italy ❍ ❒ ❒ ✓
Japan ❍ ● ■ ✓
Korea ■ ● ■ ✓ ✓
Luxembourg ❒ ❒ ❒ ✓
Mexico ● ● ● ✓
Netherlands ■ ● ■ ✓ ✓
New Zealand ● ● ■ ✓
Norway x x ■ ✓
Poland x ● ● ✓ ✓
Portugal ● ● ● ✓
Slovak Republic x x ❍ ✓
Slovenia ■ ● ■ ✓
Spain ❒ ❒ ❒ ✓
Sweden ❒ ■ ■ ✓
Switzerland ❒ ❍ ❍ ✓
Turkey ❍ ● ● ✓
United Kingdom ● ● ● ✓
United States ❒ ❒ ■ ✓
Russian Federation ❍ ● ● ✓ ✓
OECD total● Yes, for all projects 10 17 7 14 9 15■ Yes, for those above certain monetary threshold 4 4 13❒ Yes, ad hoc basis 8 5 8❍ No 4 1 3x Not applicable 6 5 2
Source: 2012 OECD Survey on Budgeting Practices and Procedures.1 2 http://dx.doi.org/10.1787/888932943476
0102030405060708090
100
The same as TIPsCannot make a judgement due to lack of info or experience with PPPs Worse than TIPsBetter than TIPs
Share of responding countries (%)
Transaction costs Quality of finished product Operating costs Construction costs Timeliness
61.3% 54.8% 54.8%45.2% 45.2%
3.2%29.0% 35.5%
35.5%48.4%
3.2%
16.1% 9.7%12.9%
6.5%
32.3%
6.5%
GOVERNMENT AT A GLANCE 2013 © OECD 2013 97
4. BUDGETING PRACTICES AND PROCEDURES
Independent fiscal institutions
In the mid-1990s, academic economists floated the idea thatcountries could adapt some of the good experiences of inde-pendent central banking to the fiscal sphere. However, it wasonly after the surge of government deficits and debts follow-ing the recent crisis that a growing number of countriesdecided to create independent fiscal institutions (IFIs, typi-cally referred to as fiscal councils or parliamentary budgetoffices) in a growing number of OECD member countries.
With the creation of these councils, governments areseeking to reinforce fiscal rules that had proved inadequateon their own to ensure prudent management of publicfinances, as well as signal their commitment to actvirtuously after the crisis. This is particularly true in theEuropean Union where new regulations require memberstates to have independent bodies monitor compliancewith fiscal rules and produce or endorse macroeconomicforecasts. Other recent examples (Canada, Australia) wereestablished to increase fiscal transparency and enhancethe role of the legislature in the budget process. In additionto this new generation of IFIs are a handful of much olderinstitutions, such as the Congressional Budget Office (CBO)in the United States and the Netherlands Bureau forEconomic Policy Analysis (CPB).
Today’s independent fiscal institutions are extremelydiverse: their roles, resources and structures vary consider-ably across countries. In addition to analysis of fiscal policyand budget proposals, common functions include a role inforecasting, monitoring compliance with fiscal rules,analysis of long-term fiscal sustainability, costing of policyproposals and analytical studies on selected issues.
Requirements in the new EU regulations would pointtowards a dominant model in the European Union,although individual country needs and the local institu-tional environment continue to determine many of theoptions chosen. With the exception of the Netherlands CPB(and until recently the Danish Economic Council), all of thefiscal councils in OECD member countries within the EUare tasked with monitoring compliance with the fiscalrules. None of the institutions in OECD member countriesthat are outside the EU have this task.
Institutions’ role in forecasting takes several forms. TheNetherlands CPB and the United Kingdom’s Office forBudget Responsibility (OBR) have been tasked with produc-ing the official forecasts. Others produce alternativeforecasts (e.g. the United States and Canada). While othersprovide an opinion on the government’s forecasts(e.g. France, Ireland and Sweden). The vast majority ofinstitutions also provide analysis of long-term fiscal sustain-ability. Just under half of institutions in OECD membercountries have a role in costing policy proposals, with thisfunction more typically found in parliamentary budgetoffices. Both the Netherlands CPB and the AustralianParliamentary Budget Officer (PBO) are also tasked withcosting election platforms.
There is similar diversity in the structure and resources ofIFIs. Some are under the statutory authority of the execu-tive, while a smaller number are under the legislature
(Australia, Canada, Italy [established by Law approved inDecember 2012 expected to become operational in 2014]and the United States). Two have been established asautonomous units within the national audit institution(Finland and France). They may have an individual orcollegial (council) leadership structure. The CBO has thelargest budget at USD 45 million and a staff of around 250,while the Irish Fiscal Advisory Council operates for underEUR 1 million with fewer than five secretariat staff. Thoseinstitutions with a role in policy costing – one of the mostresource intensive tasks that require staff with specificprogramme knowledge – tend to have larger staffs. Threeinstitutions have budgets with multi-annual fundingcommitments, a practice which can enhance indepen-dence and help insulate the institution from political pres-sure (Australia, the Netherlands and the United Kingdom).
Further reading
Calmfors, L. and S. Wren-Lewis (2011), “What Should FiscalCouncils Do?”, Centre for Economic Studies and IFO Institute forEconomic Research (CESifo), Vol. 26, No. 68, pp. 649-695,London.
Hagemann, R. (2011), “How Can Fiscal Councils StrengthenFiscal Performance?”, OECD Journal: Economic Studies,Vol. 2011/1, http://dx.doi.org/10.1787/eco_studies-2011-5kg2d3gx4d5c.
Kopits, G. (2011), “Independent Fiscal Institutions: DevelopingGood Practices”, OECD Journal on Budgeting, Vol. 11/3,pp. 35-52, http://dx.doi.org/10.1787/budget-11-5kg3pdgcpn42.
OECD (2013, forthcoming), Principles for Independent FiscalInstitutions and Country Notes, OECD Publishing, Paris.
Table notes
See StatLink for country specific note.
Methodology and definitions
The data, collected via a set of questions for in-depthcountry notes on independent fiscal institutionsin 2012-13, focuses on institutions in 17 OECD membercountries. In preparing the notes, the OECD Secretariatconsulted extensively with officials in the selectedindependent fiscal institutions, as well as with parlia-mentary officials, government officials, academics,and other stakeholders as appropriate. Further data onnew institutions is currently being collected.
Chile established a Fiscal Advisory body in early 2013.Spain has put forward legislation for an IndependentFiscal Authority that is expected to pass in late 2013.
GOVERNMENT AT A GLANCE 2013 © OECD 201398

4. BUDGETING PRACTICES AND PROCEDURES
Independent fiscal institutions
4.10. Roles and resources of independent fiscal institutions in OECD countries (2013)
Institutionname
Established Budget Staff
Rolein forecasts of
macroeconomicassumptions
Analysisof long-term
fiscalsustainability
Rolein monitoringcompliance
with fiscal rules
Role in policycosting
Role in costingelection
platforms
Australia ParliamentaryBudget Office
(PBO)
2011 AUD 2.4 M over fouryears with additionalshort-term funding
during election period
Recruitment of 30-35 staffongoing
✧ ● ❍ ● ●
Austria Government DebtCommittee (GDC)
1970 Data not available 15 Committee members,3 secretariat staff
■ ● ● ❍ ❍
Belgium High Councilof Finance (HCF)
1936 Data not available 27 Council members,14 secretariat staff
■ ● ● ❍ ❍
Canada ParliamentaryBudget Officer
(PBO)
2008 CAD 2.8 M 15 ❒ ● ❍ ● ❍
Denmark Economic Council 1962 DKK 23.5 M 25 Council members,30 secretariat staff
❒ ● ● ❍ ❍
Finland Fiscal Policy Auditand Executive
Office
2013 EUR 1.4 M 7 (plus supportand communications staff)
■ ● ● ❍ ❍
France High Councilfor Public Finances
(HCFP)
2013 EUR 782 000 (FY 2013) 10 Council members,recruitment
of 5 staff ongoing
■ ❍ ● ❍ ❍
Ireland Fiscal AdvisoryCouncil
2011 EUR 800 000 (FY 2013) 5 Council members,3 secretariat staff
■ ❍ ● ❍ ❍
Korea National AssemblyBudget Office
(NABO)
2003 USD 12.7 M 125 ❒ ● ❍ ● ❍
Mexico Centro de Estudiosde las FinanzasPúblicas (CEFP)
1998 MXN 50.9 M (FY 2009) 59 ❒ ● ❍ ● ❍
Netherlands Bureaufor Economic
Policy Analysis
1945 EUR 13.5 M 117 ✦ ● ❍ ● ●
Portugal Conselhodas Finanças
Públicas (CFP)
2011 EUR 2.65 M (FY 2013) 5 Council members,recruitment
of 15-20 staff ongoing
■ ● ● ❍ ❍
Slovak Republic Council for BudgetResponsibility
(CBR)
2012 EUR 2 M (FY 2013) 3 Council members,recruitment
of 15-20 staff ongoing
✧ ● ● ● ❍
Slovenia Fiscal Council 2009 EUR 100 000 (FY 2012) 7 Council members,no secretariat staff
■ ● ● ❍ ❍
Sweden Fiscal PolicyCouncil (FPC)
2007 SEK 7.55 M 6 Council members,5 secretariat staff
■ ● ● ❍ ❍
United Kingdom Office for BudgetResponsibility
(OBR)
2010 GBP 1.75 M 3-person BudgetResponsibility Committee,2 non-executive members,
17 secretariat staff
✦ ● ● ● ❍
United States CongressionalBudget Office
(CBO)
1974 USD 45.2 M 250 ❒ ● ❍ ● ❍
● Yes.❍ No.✧ No role.✦ Prepare official forecasts.■ Assess forecasts only.❒ Prepare alternative forecasts.Source: OECD (2013, forthcoming), Principles for Independent Fiscal Institutions and Country Notes, OECD Publishing, Paris.
1 2 http://dx.doi.org/10.1787/888932943495
GOVERNMENT AT A GLANCE 2013 © OECD 2013 99

GOVERNMENT AT A GLANCE 2013 © OEC
5. PUBLIC SECTOR EMPLOYMENT AND PAY
The size of government is often associated with the number of people working forgovernment, although with increasing outsourcing of government functions, employment ingovernment is less and less an accurate measure of the reach of government. However, incertain key occupations – such as teachers, nurses, doctors and police officers – government isstill the largest employer.
In this chapter, we examine the trends in public sector employment 2001 and 2011. Ourdata proves again that public employment is “sticky”. While many OECD member countries hadannounced hiring freezes and employment reductions as part of their fiscal consolidation plans,few could sustain significant reductions in public employment. As demand for public servicesdoes not diminish, there are two ways to reduce employment for the long run: productivity gains,that are seldom quantifiable, but assumed to be rather modest; and outsourcing, wheregovernment still pays for the service but it is carried out by the private sector.
Beside the public employment data, few other topics attract more interest than how muchgovernment employees are paid. Compared to the 2011 edition, the most comprehensive,internationally comparable compensation data is presented. The data were collected with animproved survey instrument for an extended group of key central government occupations. Inaddition to that of senior and middle managers, professionals and secretaries, compensationof key service provision occupations are also shown, such as teachers, immigration officers,tax/customs officers and police officers. The number of countries participating in the datacollection increased from 20 countries in 2011 to 26 countries in 2013. However, not allparticipating countries could provide data for all the occupations.
D 2013 101
5. PUBLIC SECTOR EMPLOYMENT AND PAY
Employment in general government and public corporations
Individual governments choose what public services todeliver and how to deliver them. Some countries use morepublic employees than others to provide services: teachers,health care providers, security and emergency workers andgovernment administrators, for instance, are consideredcivil servants in many member countries and deliver impor-tant services. Other countries, however, make greater use ofthe private and non-profit sectors. The proportion of thelabour force working for the government reflects this choiceand is one factor in determining the ultimate cost of servicedelivery to tax-payers. The relative size of governmentemployment can also have an effect on the labour market,with potential to impact the productivity of the economy.
The size of government employment varies significantlyamong OECD member countries, with governments in Nordiccountries employing a higher proportion of the labour forcethan others. In 2011 for example, the governments of Norwayand Denmark employed about 30% of the labour force,compared to 9% or less in Korea, Japan, Greece and Mexico.
Across the OECD member countries, general governmentemployment as a percentage of the labour force remainedrelatively stable between 2001 and 2011, at just under 16% onaverage. Overall during this period, the share decreased onlynominally, with the Slovak Republic, Sweden, Mexico andPortugal having the largest decreases at just over 2 percentagepoints. Employment in public corporations – such as postoffices and railways in some OECD member countries – is aminor part of the labour force and tends to be smaller thangeneral government employment. In general, public corpora-tions in Central Eastern and European countries employ arelatively larger share of the labour force compared to otherOECD member countries, despite the strong wave of privati-sation in these countries during the early 1990s. Overall,employment in public corporations as a percentage of thelabour force decreased in the majority of OECD membercountries, from an average of 5.7% in 2001 to 4.7% in 2011.
Further reading
OECD (2011), Public Servants as Partners for Growth: Toward aStronger, Leaner and More Equitable Workforce, OECD Pub-lishing, Paris, http://dx.doi.org/10.1787/9789264166707-en.
Pilichowski, E. and E. Turkisch (2008), “Employment inGovernment in the Perspective of the Production Costsof Goods and Services in the Public Domain”, OECDWorking Papers on Public Governance, No. 8, OECD Publish-ing, Paris, http://dx.doi.org/10.1787/245160338300.
Figure notes
Data for Iceland are not available. Data for Australia and Chile refer tothe public sector (general government and public corporations). Datafor Germany, Ireland, Sweden, the United Kingdom and Ukraine arefor 2010 rather than 2011. Data for Hungary, Japan, Mexico, Braziland the Russian Federation are for 2009 rather than 2011. Data forChile, Greece, Portugal and Switzerland are for 2008 rather than 2011.Data for France are for 2006 rather than 2011. Data for Ukraine are for2002 rather than 2001.
5.1: Data for 2001 for Korea and Turkey are not available and thesecountries are not included in the OECD average. Data for Norway arefor 2010 rather than 2011. Data for South Africa are for 2006 ratherthan 2011.
5.2: Data on public corporations for Austria, Belgium, Hungary, Israel,Italy, Japan, Korea, Portugal, and the United States are missing andthus these countries are not presented. Data for the Czech Republicare for 2010 rather than 2011. Data for Finland are for 2008 ratherthan 2011. Data for Norway are for 2007 rather than 2011. Data forthe Netherlands are for 2005 rather than 2011.
Information on data for Israel: http://dx.doi.org/10.1787/888932315602.
Methodology and definitions
Data refer to 2001 and 2011 and were collected by theInternational Labour Organization (ILO) and OECD.The data are based on System of National Accounts(SNA) definitions and cover employment in generalgovernment and public corporations. The generalgovernment sector comprises all levels of govern-ment (central, state, local and social security funds)and includes core ministries, agencies, departmentsand non-profit institutions that are controlled andmainly financed by public authorities. Public corpora-tions are legal units mainly owned or controlled bythe government which produce goods and servicesfor sale in the market. Public corporations alsoinclude quasi-corporations.
Data represent the number of employees except forAustria, the Czech Republic, Italy, the Netherlandsand New Zealand where data represent full-timeequivalents (FTEs). As a result, employment numbersfor these five countries are understated in compari-son. The labour force, or active population, comprisesall persons who fulfill the requirements for inclusionamong the employed or the unemployed. Forpurposes of international comparability, the workingage population is commonly defined as persons aged15 years and older, although this might vary in somecountries. Labour force refers to all persons ofworking age who furnish the supply of labour for theproduction of goods and services during a specifiedtime-reference period.
GOVERNMENT AT A GLANCE 2013 © OECD 2013102

5. PUBLIC SECTOR EMPLOYMENT AND PAY
Employment in general government and public corporations
5.1. Employment in general government as a percentage of the labour force (2001 and 2011)
Sources: International Labour Organization (ILO), LABORSTA (database); OECD Labour Force Statistics (database). Data for Korea were provided bygovernment officials.
1 2 http://dx.doi.org/10.1787/888932942241
5.2. Employment in general government and public corporations as a percentage of the labour force (2001 and 2011)
Sources: International Labour Organization (ILO), LABORSTA (database); OECD Labour Force Statistics (database).1 2 http://dx.doi.org/10.1787/888932942260
0
5
10
15
20
25
30
35
2011 2001%
Norway
Denmark
Sweden
Finlan
d
Franc
e
Hunga
ry
Eston
ia
United
Kingdo
m
Luxe
mbourg
Canad
a
Belgium
Irelan
dIsr
ael
Sloven
ia
Austra
liaOEC
D
United
States Ita
lySpa
in
Slovak
Rep
ublic
Czech
Rep
ublic
Netherl
ands
Portug
al
Turke
y
Austri
a
German
y
Poland
Switzerl
and
New Ze
aland
Chile
Mexico
Greece
Japa
nKor
ea
Russia
n Fed
eratio
nBraz
il
South
Africa
Ukraine
0
5
10
15
20
25
30
35
40%
NOR DNK CZE SWE LUX FIN FRA EST SVN NLD GRC POL GBR CAN IRL SVK AUS CHE DEU ESP TUR NZL MEX CHL RUS UKR BRA
2001
2001
2001
2001
2001
2001
2001
2001
2001
2001
2001
2001
2001
2001
2001
2001
2001
2001
2001
2001
2001
2001
2001
2001
2001
2001
2001
2011
2011
2011
2011
2011
2011
2011
2011
2011
2011
2011
2011
2011
2011
2011
2011
2011
2011
2011
2011
2011
2011
2011
2011
2011
2011
2011
General government Public corporations
GOVERNMENT AT A GLANCE 2013 © OECD 2013 103

5. PUBLIC SECTOR EMPLOYMENT AND PAY
General government employment across levels of government
The proportion of staff employed at sub-central levels ofgovernment is an indicator of the level of decentralisationof public administrations. In general, larger shares ofgovernment employees at the sub-central level indicatethat more responsibilities are delegated to regional andlocal governments for providing public services. Althoughdecentralisation can increase the responsiveness ofgovernment to local needs and priorities, it can also resultin variations in service delivery within countries.
In 2011, most countries had more employees at thesub-central level than at the central level of government.Federal states employ less than one-third of all governmentemployees at the central level, indicating higher levels ofdecentralisation. The variance in the proportion of govern-ment employees at the central level of government is muchlarger in unitary states, ranging from less than 20% inJapan and Sweden to about 90% in Ireland, Turkey andNew Zealand.
Between 2001 and 2011, the percentage of government staffemployed at the central level has remained relatively stable,with a slight trend towards greater decentralisation in themajority of OECD member countries. A few countries haveexperienced significant decentralisation in this period,including Spain, the Czech Republic and Japan, where theshare of government staff employed at the sub-central levelhas increased by 10 percentage points or more. In the case ofSpain, this increase was due to the delegation of responsibil-ities to the sub-central level together with staff reductionsimplemented since 2010. Only one country – Norway –experienced a notable centralisation of government staffduring this period, with a 13 percentage point increase in theshare of staff employed at the central level, although nearlytwo-thirds of government employees continue to beemployed at the sub-central level. Further reading
Charbit, C. and M. Michalun (2009), “Mind the Gaps: Manag-ing Mutual Dependence in Relations among Levels ofGovernment”, OECD Working Papers on Public Governance,No. 14, OECD Publishing, Paris, http://dx.doi.org/10.1787/221253707200.
OECD (2011), Public Servants as Partners for Growth: Toward aStronger, Leaner and More Equitable Workforce, OECD Pub-lishing, Paris, http://dx.doi.org/10.1787/9789264166707-en.
Figure notes
Data for Australia, Austria, Chile, Iceland, Korea, Poland, theSlovak Republic and the United Kingdom are not available. Socialsecurity funds are not separately identified (i.e. recorded under centraland/or sub-central government) for Canada, Estonia, Ireland, Japan,New Zealand, Norway, Spain, Switzerland and the United States. Datafor Germany, Ireland, Norway and Sweden are for 2010 ratherthan 2011. Data for Japan, Mexico and the Russian Federation arefor 2009 rather than 2011. Data for Greece, Hungary and Switzerlandare for 2008 rather than 2011. Data for the Czech Republic are for 2007rather than 2011. Data for France and South Africa are for 2006 ratherthan 2011.
5.3: Data for Brazil are for 2009. Data for Portugal are for 2008.
5.4: Data for Portugal are not available.
Information on data for Israel: http://dx.doi.org/10.1787/888932315602.
Methodology and definitions
Data were collected by the International LabourOrganization (ILO) and the OECD and refer to 2001and 2011, except where indicated. The data are basedon the System of National Accounts (SNA) definitions andcover employment in central and sub-central levels ofgovernment. Sub-central government is comprised ofstate and local government including regions, prov-inces and municipalities. Together the central andsub-central levels comprise general government. Inaddition, countries provided information on employ-ment in the social security funds component ofgeneral government, which include all central, state,and local institutional units whose principal activity isto provide social benefits. As social security funds referto different levels of government, employment in thiscategory has been recorded separately unless other-wise stated. However, in most countries, with theexceptions of France, Mexico, and Germany, socialsecurity funds employ a small number of staff andrepresent a small percentage of the total workforce.The following countries are federal states in thedataset: Belgium, Brazil, Canada, Germany, Mexico, theRussian Federation, Spain (considered a quasi-federalcountry), Switzerland and the United States.
Data represent the number of employees except forItaly, the Netherlands and New Zealand where datarepresent full-time equivalents (FTEs). As a result,employment numbers for these three countries areunderstated in comparison.
GOVERNMENT AT A GLANCE 2013 © OECD 2013104
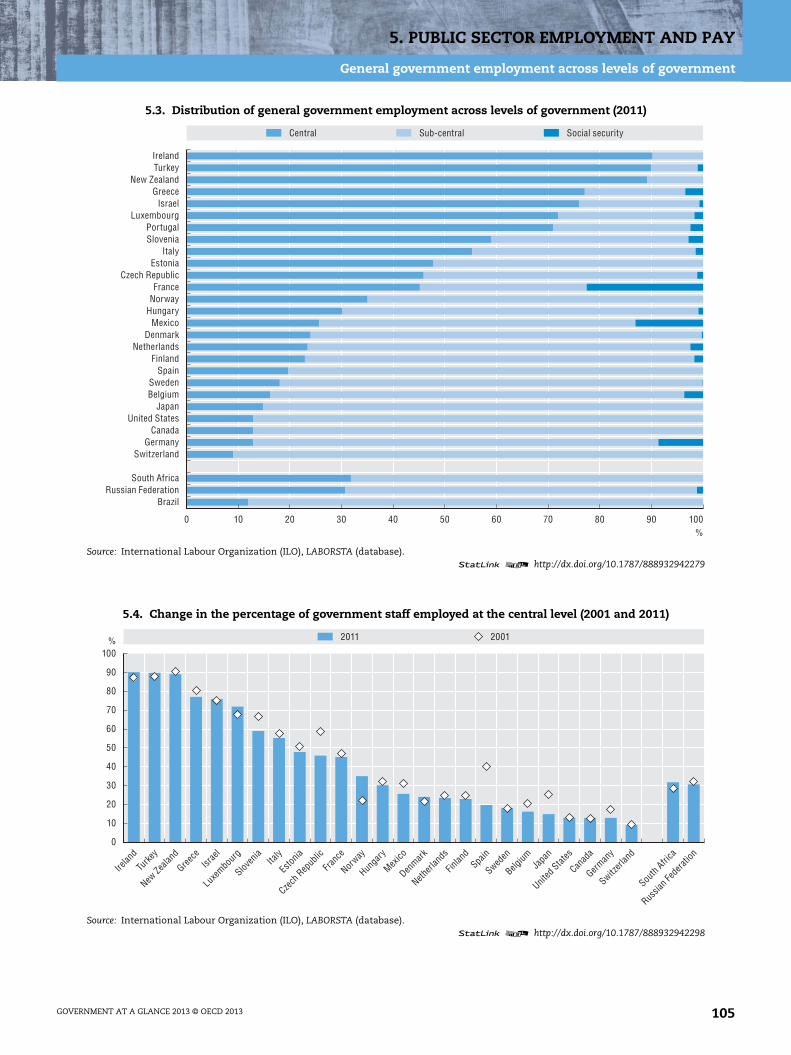
5. PUBLIC SECTOR EMPLOYMENT AND PAY
General government employment across levels of government
5.3. Distribution of general government employment across levels of government (2011)
Source: International Labour Organization (ILO), LABORSTA (database).1 2 http://dx.doi.org/10.1787/888932942279
5.4. Change in the percentage of government staff employed at the central level (2001 and 2011)
Source: International Labour Organization (ILO), LABORSTA (database).1 2 http://dx.doi.org/10.1787/888932942298
%0 10 20 30 40 50 60 70 80 90 100
Central Sub-central Social security
BrazilRussian Federation
South Africa
SwitzerlandGermany
CanadaUnited States
JapanBelgiumSweden
SpainFinland
NetherlandsDenmark
MexicoHungaryNorwayFrance
Czech RepublicEstonia
ItalySloveniaPortugal
LuxembourgIsrael
GreeceNew Zealand
TurkeyIreland
% 2011 2001
0
10
20
30
40
50
60
70
80
90
100
Irelan
d
Turke
y
New Ze
aland
Greece
Israe
l
Luxe
mbourg
Sloven
iaIta
ly
Eston
ia
Czech
Rep
ublic
Franc
e
Norway
Hunga
ry
Mexico
Denmark
Netherl
ands
Finlan
dSpa
in
Sweden
Belgium
Japa
n
United
States
Canad
a
German
y
Switzerl
and
South
Africa
Russia
n Fed
eratio
n
GOVERNMENT AT A GLANCE 2013 © OECD 2013 105
5. PUBLIC SECTOR EMPLOYMENT AND PAY
Compensation of senior managers
The level of total compensation for senior managers in thepublic sector is one indicator of the attractiveness of thepublic sector and of its ability to keep talent for positionswith high levels of responsibility in government. Compensa-tion in these positions represents a minimal share of publicexpenditures, but holds symbolic value as it concerns staffwho have a leading role in government policy making andexecution and whose appointment is often discretionary.
D1 managers are top public servants below the minister orSecretary of State, and D2 are just below D1 (see Annex Dfor details). D1 managers earn on average 32% more thanD2 managers, but can sometimes earn less thanD2 managers because they have less seniority, e.g. havebeen in their position for less time.
On average, D1 level senior managers’ compensationamounts to around USD 230 000 PPP, including aboutUSD 36 000 PPP in employers’ social contributions andUSD 31 000 PPP for working time correction. D2 level manag-ers’ total compensation reaches around USD 175 000 PPP(including employers’ social contributions and holidays).Differences in compensation levels across countries resultfrom differences in the share of highly qualified employees,seniority levels and the share of women in senior occupa-tions. Differences can also be the result of different organ-isational structures in countries. Relative to GDP per capita(accounting for the differences in economic development ofthe countries), D1 senior managers in Italy, New Zealand,and Chile experienced the highest compensations whilein Iceland, the Slovak Republic and Norway, D1 seniormanagers had among the lowest levels of earnings.
Differences in compensation levels can also result fromdifferences in national labour markets, in particular theremuneration in the private sector for comparable skills.Part of this effect is captured by comparing the averagecompensation of senior managers to the compensation oftertiary-educated employees. On average, a D1 seniormanager’s compensation is 3.4 times higher than theaverage tertiary educated employee’s compensation.
Further reading
OECD (2012), Public Sector Compensation in Times of Austerity,OECD Publishing, Paris, http://dx.doi.org/10.1787/9789264177758-en.
Figure notes
Data for Canada, the Czech Republic, Hungary, Ireland, Luxembourg,Mexico, Switzerland and Turkey are not available.
Compensation data for D2 positions are mixed with D1 positions inFinland and Slovenia. Belgium: Ministries of Education and Environ-ment are not included because they do not belong to the federalauthority. Denmark: Ministry of Education is not included becausemany of its tasks have been moved to other ministries. Estonia: datafor the Ministries of Education and Environment are not available.Greece, New Zealand: only data on entry level and maximum level ofcompensation are available, the average is hence not the actualaverage but the mean between the entry level and the maximum level.Iceland: the Ministry of Justice belongs to the Ministry of Interior. Italy:a law in 2011 limits the level of compensation for senior managersfrom 2012 onwards to a maximum of USD 370 000 PPP. Japan: data areprovided in terms of entry and maximum level of total compensation,the arithmetic mean has been taken into account in the OECDaverage. The Slovak Republic: only half of the employees in theMinistry of Justice are included for statistical reasons (consistency ofISCO codes). The head of civil service (one employee of each ministry;D1) is entitled for the coverage of unavoidable expenses in service andother personal expenses to untaxed flat rate compensation eachmonth in the amount of 121% of the highest salary tariff (the highestsalary tariff is EUR 935.5). This amount is not included in the data.Spain: data for D1 positions do not include incentive payments.Sweden: the Ministry of Interior belongs to the prime minister’s officeand is not included in the data. The United Kingdom: data arefor 2012 (using PPP 2012) and the average is the median rather thanthe arithmetic mean.
Please see also Annex D for additional notes.
Information on data for Israel: http://dx.doi.org/10.1787/888932315602.
Methodology and definitions
Data refer to 2011 and were collected by the 2012OECD Survey on the Compensation of Employees inCentral/Federal Governments. Officials from centralMinistries and Agencies responded through the OECDNetwork on Public Employment and Management.
Data are for six central government Ministries/Departments (Interior, Finance, Justice, Education,Health and Environment or their equivalents). Theclassification and the definition of the occupationsare an adaptation of the International Standard Clas-sification of Occupation (ISCO) developed by theInternational Labour Organization (ILO). Compensa-tion levels are calculated by averaging the compensa-tion of the staff in place.
Total compensation includes wages and salaries, andemployers’ social contributions, both funded andunfunded. Social contributions are restricted tohealth and pensions systems, in order to have consis-tent data across countries.
Compensation was converted to USD using PPPsfor GDP from the OECD National Accounts Statistics(database). The data are not adjusted for hoursworked per week, since managers are formally orinformally expected to work longer hours butadjusted for the average number of holidays.
See Annex D for the full methodology.
GOVERNMENT AT A GLANCE 2013 © OECD 2013106
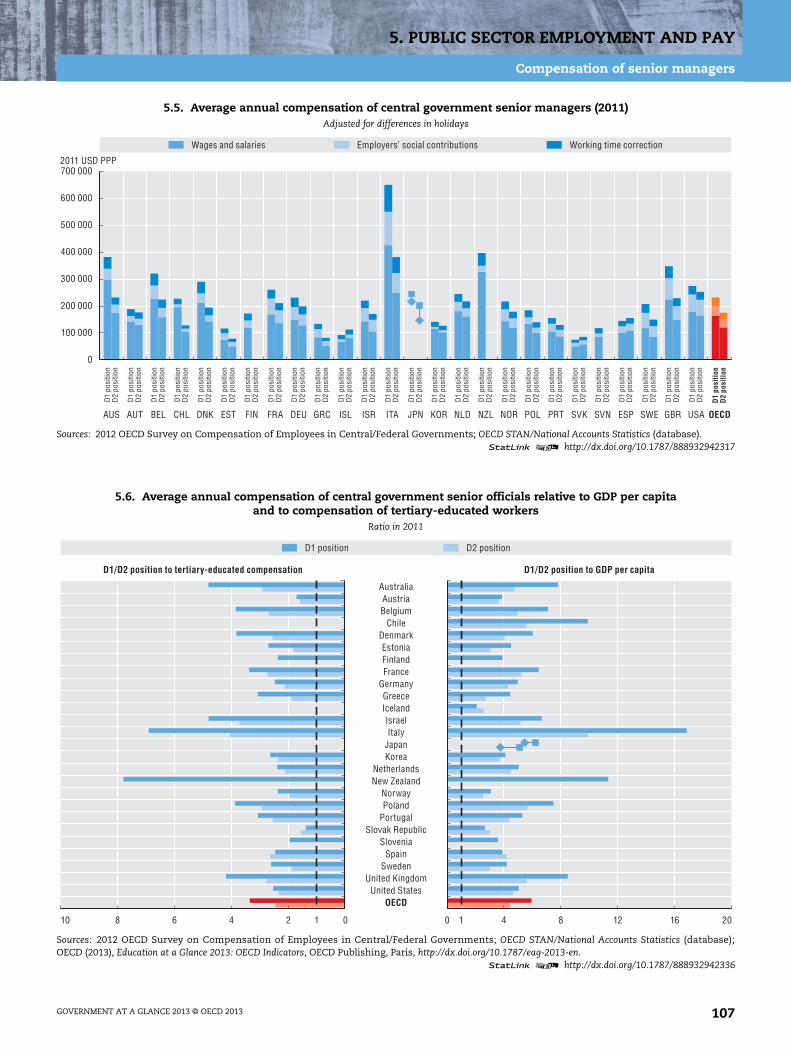
5. PUBLIC SECTOR EMPLOYMENT AND PAY
Compensation of senior managers
5.5. Average annual compensation of central government senior managers (2011)Adjusted for differences in holidays
Sources: 2012 OECD Survey on Compensation of Employees in Central/Federal Governments; OECD STAN/National Accounts Statistics (database).1 2 http://dx.doi.org/10.1787/888932942317
5.6. Average annual compensation of central government senior officials relative to GDP per capitaand to compensation of tertiary-educated workers
Ratio in 2011
Sources: 2012 OECD Survey on Compensation of Employees in Central/Federal Governments; OECD STAN/National Accounts Statistics (database);OECD (2013), Education at a Glance 2013: OECD Indicators, OECD Publishing, Paris, http://dx.doi.org/10.1787/eag-2013-en.
1 2 http://dx.doi.org/10.1787/888932942336
0
100 000
200 000
300 000
400 000
500 000
600 000
700 000
AUS AUT BEL CHL DNK EST FIN FRA DEU GRC ISL ISR ITA JPN KOR NLD NZL NOR POL PRT SVK SVN ESP SWE GBR USA
D1
posi
tion
D1
posi
tion
D1
posi
tion
D1
posi
tion
D1
posi
tion
D1
posi
tion
D1
posi
tion
D1
posi
tion
D1
posi
tion
D1
posi
tion
D1
posi
tion
D1
posi
tion
D1
posi
tion
D1
posi
tion
D1
posi
tion
D1
posi
tion
D1
posi
tion
D1
posi
tion
D1
posi
tion
D1
posi
tion
D1
posi
tion
D1
posi
tion
D1
posi
tion
D1
posi
tion
D1
posi
tion
D1
posi
tion
D1
posi
tion
D2
posi
tion
D2
posi
tion
D2
posi
tion
D2
posi
tion
D2
posi
tion
D2
posi
tion
D2
posi
tion
D2
posi
tion
D2
posi
tion
D2
posi
tion
D2
posi
tion
D2
posi
tion
D2
posi
tion
D2
posi
tion
D2
posi
tion
D2
posi
tion
D2
posi
tion
D2
posi
tion
D2
posi
tion
D2
posi
tion
D2
posi
tion
D2
posi
tion
D2
posi
tion
D2
posi
tion
D2
posi
tion
D2
posi
tion
D2
posi
tion
Wages and salaries Employers’ social contributions Working time correction
2011 USD PPP
OECD
02 146810 0 4 8 12 16 201
D1 position D2 position
D1/D2 position to tertiary-educated compensation D1/D2 position to GDP per capita
AustraliaAustriaBelgium
ChileDenmarkEstoniaFinlandFrance
GermanyGreeceIcelandIsraelItaly
JapanKorea
NetherlandsNew Zealand
NorwayPoland
PortugalSlovak Republic
SloveniaSpain
SwedenUnited Kingdom
United StatesOECD
GOVERNMENT AT A GLANCE 2013 © OECD 2013 107

5. PUBLIC SECTOR EMPLOYMENT AND PAY
Compensation of middle managers
Middle managers are located between senior managementand professionals in the central government workforcehierarchy. Hence they have a key intermediate position toimplement human resource management reforms and tointeract and build trust and social dialogue with all publicemployees.
On average, D3 level middle managers’ compensationamounts to around USD 126 000 PPP, of which 17% repre-sents employers’ social contributions and 14% the workingtime adjustment. D4 middle managers’ total compensationreaches around USD 113 000 PPP (including employers’social contributions and holidays).
D3 managers plan, direct and co-ordinate the functioningof a directorate/administrative unit within the ministryand D4 are just below D3 (see Annex C for details). Thedifference in compensation between D3 and D4 positions issmaller than the difference between the two seniorpositions. D3 managers earn on average 10% more thanD4 managers. In addition, the compensation of middlemanagers is significantly lower than that of seniormanagers – senior managers in D1 positions earn 84%more of what middle managers in D3 positions earn, andalmost twice as much what managers in D4 positions earn.This difference between D1 and D4 positions is highest inItaly, Australia, the United Kingdom and Israel, and lowestin the United States and Korea.
Relative to GDP per capita, D3 middle managers in Polandand Chile reached top compensation levels while inNorway and Estonia they earned the lowest levels in thisposition. Similarly, D4 middle managers earnings recordedhighest ratios in the United States but lowest ratios werefound in Norway, Israel and Greece.
Differences in compensation levels can also result from dif-ferences in national labour markets. On average, aD3 middle manager’s compensation is 1.8 times higherthan a tertiary-educated employee’s compensation.D3 positions seem relatively better compensated in Polandand, on the contrary, there can be a lower level of attrac-tiveness in Austria, Estonia and the Slovak Republic.D4 positions in the United States and Belgium were morecompetitive in the public sector and, on the contrary weakin Austria, Israel and Norway as compared to the compen-sation of the tertiary-educated workers.
Further reading
OECD (2012), Public Sector Compensation in Times of Austerity,OECD Publishing, Paris, http://dx.doi.org/10.1787/9789264177758-en.
Figure notes
Data for Canada, the Czech Republic, Hungary, Ireland, Luxembourg,Mexico, New Zealand, Switzerland and Turkey are not available.
Compensation data for D4 positions are mixed with D3 in Estonia,Finland, Japan and Slovenia. Belgium: Ministries of Education andEnvironment are not included because they do not belong to thefederal authority. Denmark: the Ministry of Education is notincluded because many of its tasks have been moved to other minis-tries. Estonia: data for the Ministries of Education and Environmentare not available. Greece: only data on entry level and maximumlevel of compensation are available; the average is hence not theactual average but the mean between the entry level and the maxi-mum level. Iceland: the Ministry of Justice belongs to the Ministry ofInterior. Japan: data for D3 position are provided in terms of entryand maximum level of total compensation, the arithmetic mean hasbeen taken into account in the OECD average. The Slovak Republic:only half of the employees in the Ministry of Justice are included forstatistical reasons (consistency of ISCO codes). Sweden: the Ministryof Interior belongs to the prime minister’s office and is not includedin the data. The United Kingdom: data are for 2012 (using PPP 2012)and the average is the median rather than the arithmetic mean.
Please see also Annex D for additional notes.
Information on data for Israel: http://dx.doi.org/10.1787/888932315602.
Methodology and definitions
Data refer to 2011 and were collected by the 2012OECD Survey on the Compensation of Employees inCentral/Federal Governments. Officials from centralMinistries and Agencies responded through the OECDNetwork on Public Employment and Management.
Data are for six central government Ministries/Departments (Interior, Finance, Justice, Education,Health and Environment or their equivalents). Theclassification and the definition of the occupationsare an adaptation of the International StandardClassification of Occupation (ISCO) developed by theInternational Labour Organization (ILO). Compensa-tion levels are calculated by averaging the compensa-tion of the staff in place.
Total compensation includes gross wages and sala-ries, and employers’ social contributions, both fundedand unfunded. Social contributions are restricted tohealth and pensions systems, in order to have consis-tent data across countries.
Compensation was converted to USD using PPPs forGDP from the OECD National Accounts Statistics (data-base). The data are not adjusted for hours worked perweek, since managers are formally or informallyexpected to work longer hours but adjusted for theaverage number of holidays.
See Annex D for the full methodology.
GOVERNMENT AT A GLANCE 2013 © OECD 2013108
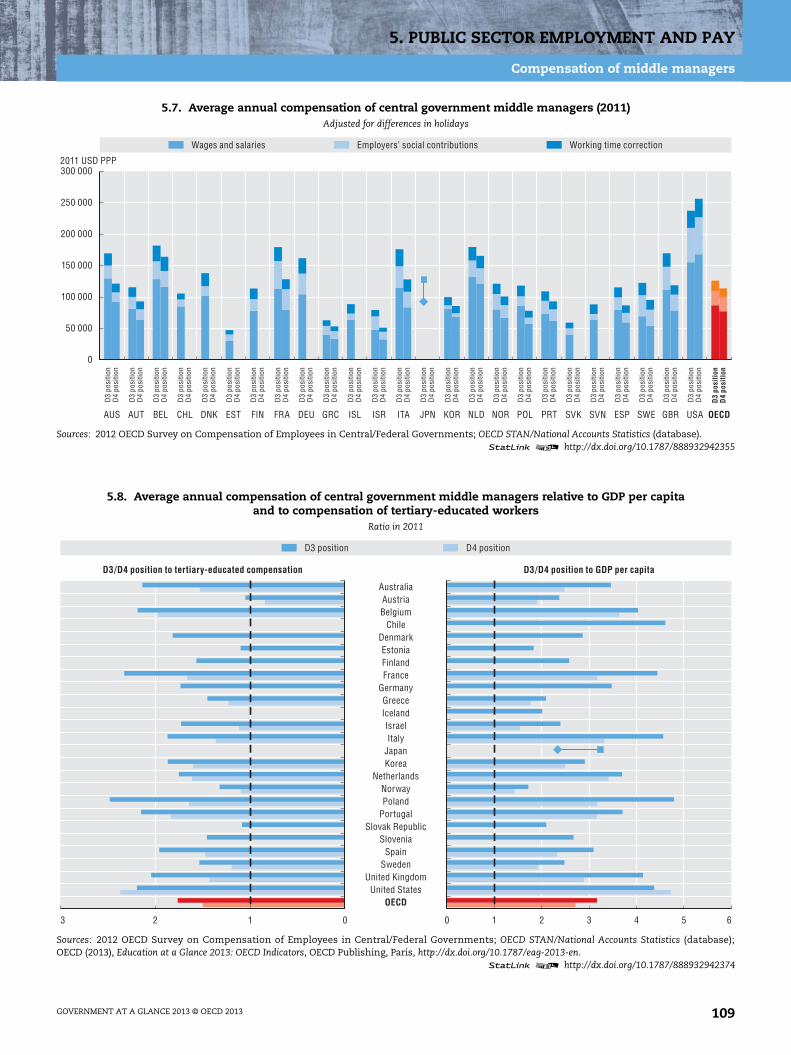
5. PUBLIC SECTOR EMPLOYMENT AND PAY
Compensation of middle managers
5.7. Average annual compensation of central government middle managers (2011)Adjusted for differences in holidays
Sources: 2012 OECD Survey on Compensation of Employees in Central/Federal Governments; OECD STAN/National Accounts Statistics (database).1 2 http://dx.doi.org/10.1787/888932942355
5.8. Average annual compensation of central government middle managers relative to GDP per capitaand to compensation of tertiary-educated workers
Ratio in 2011
Sources: 2012 OECD Survey on Compensation of Employees in Central/Federal Governments; OECD STAN/National Accounts Statistics (database);OECD (2013), Education at a Glance 2013: OECD Indicators, OECD Publishing, Paris, http://dx.doi.org/10.1787/eag-2013-en.
1 2 http://dx.doi.org/10.1787/888932942374
0
AUS AUT BEL CHL DNK EST FIN FRA DEU GRC ISL ISR ITA JPN KOR NLD NOR POL PRT SVK SVN ESP SWE GBR USA
50 000
100 000
150 000
200 000
250 000
300 000
D3
posi
tion
D3
posi
tion
D3
posi
tion
D3
posi
tion
D3
posi
tion
D3
posi
tion
D3
posi
tion
D3
posi
tion
D3
posi
tion
D3
posi
tion
D3
posi
tion
D3
posi
tion
D3
posi
tion
D3
posi
tion
D3
posi
tion
D3
posi
tion
D3
posi
tion
D3
posi
tion
D3
posi
tion
D3
posi
tion
D3
posi
tion
D3
posi
tion
D3
posi
tion
D3
posi
tion
D3
posi
tion
D3
posi
tion
D4
posi
tion
D4
posi
tion
D4
posi
tion
D4
posi
tion
D4
posi
tion
D4
posi
tion
D4
posi
tion
D4
posi
tion
D4
posi
tion
D4
posi
tion
D4
posi
tion
D4
posi
tion
D4
posi
tion
D4
posi
tion
D4
posi
tion
D4
posi
tion
D4
posi
tion
D4
posi
tion
D4
posi
tion
D4
posi
tion
D4
posi
tion
D4
posi
tion
D4
posi
tion
D4
posi
tion
D4
posi
tion
D4
posi
tion
Wages and salaries Employers’ social contributions Working time correction
2011 USD PPP
OECD
02 13 0 61 2 3 4 5
D3 position D4 position
D3/D4 position to tertiary-educated compensation D3/D4 position to GDP per capita
AustraliaAustriaBelgium
ChileDenmarkEstoniaFinlandFrance
GermanyGreeceIcelandIsraelItaly
JapanKorea
NetherlandsNorwayPoland
PortugalSlovak Republic
SloveniaSpain
SwedenUnited Kingdom
United StatesOECD
GOVERNMENT AT A GLANCE 2013 © OECD 2013 109

5. PUBLIC SECTOR EMPLOYMENT AND PAY
Compensation of professionals in central government
Economists’ and policy analysts’ analytical skills are crucialfor improving the government ability to take decisionsbased on evidence. Professionals do not have managerialresponsibilities (beyond managing maximum three staff)and are above the ranks of administrative/secretarial staff(see Annex C for details). Data are presented for senior andjunior professionals.
On average, senior professionals’ compensation amountsto about USD 89 000 PPP, of which 17% each representsemployers’ contributions and working time adjustment.Junior professional compensation is almost USD 72 000 PPP(including employers’ social contributions and workinghours and holidays).
Senior professionals earn on average 24% more than juniorprofessionals. The difference between the two levels ishighest in Belgium, Chile and Denmark and lowest inKorea. D1 senior managers earn on average 2.6 times morethan the senior professionals. The difference betweenD1 senior managers and senior professionals is highestin Italy and the United Kingdom and lowest in theSlovak Republic, Spain and Iceland. The survey suggeststhat the differences in the level of compensation betweencountries for these two professional groups across coun-tries are less pronounced than for senior managers andmiddle managers.
Differences in compensation levels can result from variousfactors that are not controlled for. Relative to GDP percapita, professionals in Chile recorded the highest levels ofcompensation, while Greece, Estonia and Iceland experi-enced the lowest relative earnings in this occupationalgroup. On average, when compared to the compensation oftertiary-educated workers, the category of junior profes-sionals has almost the same levels of remuneration.
Further reading
OECD (2012), Public Sector Compensation in Times of Austerity,OECD Publishing, Paris, http://dx.doi.org/10.1787/9789264177758-en.
Figure notes
Data for Australia, Canada, the Czech Republic, Hungary, Ireland, Japan,Luxembourg, Mexico, New Zealand, Norway, Switzerland and Turkeyare not available.
Senior and junior professionals are mixed for Austria, Estonia, Greece,Iceland, Israel, Italy, Portugal, the Slovak Republic, Spain and theUnited States. Belgium: the Ministries of Education and Environmentare not included because they do not belong to the federal authority.Denmark: the Ministry of Education is not included because many ofits tasks have been moved to other ministries. Estonia: the Ministriesof Education and of Environment are not available. Germany: thedistinction between both categories is based on the differenteducation levels and not on the grade of experience. Greece: only dataon entry level and maximum level of compensation are available; theaverage is hence not the actual average but the mean between theentry level and the maximum level. Italy: the number of employeesincludes full-time and part-time employees. Iceland: the Ministry ofJustice belongs to the Ministry of Interior. The Slovak Republic: onlyhalf of the employees in the Ministry of Justice are included forstatistical reasons (consistency of ISCO codes). Sweden: the Ministryof Interior belongs to the prime minister’s office and is not included inthe data. The United Kingdom: data are for 2012 (using PPP 2012) andthe average is the median rather than the arithmetic mean.
Please see Annex D for additional notes.
Information on data for Israel: http://dx.doi.org/10.1787/888932315602.
Methodology and definitions
Data refer to 2011 and were collected by the 2012OECD Survey on the Compensation of Employees inCentral/Federal Governments. Officials from centralMinistries and Agencies responded to the surveythrough the OECD Network on Public Employmentand Management.
Data are for six central government Ministries/Departments (Interior, Finance, Justice, Education,Health and Environment or their equivalents). Theclassification and the definition of the occupationsare an adaptation of the International Standard Clas-sification of Occupation (ISCO) developed by theInternational Labour Organization (ILO). Compensa-tion levels are calculated by averaging the compensa-tion of the staff in place.
Total compensation includes gross wages and sala-ries, and employers’ social contributions, both fundedand unfunded. Social contributions are restricted tohealth and pensions systems, in order to have consis-tent data across countries.
Compensation was converted to USD using PPPs forGDP from the OECD National Accounts Statistics(database). Working time adjustment compensatesfor differences in time worked, taking into accountboth the average number of working days/hours andthe average number of holidays.
See Annex D for the full methodology.
GOVERNMENT AT A GLANCE 2013 © OECD 2013110

5. PUBLIC SECTOR EMPLOYMENT AND PAY
Compensation of professionals in central government
5.9. Average annual compensation of senior and junior professionals in central government (2011)Adjusted for differences in working hours and holidays
Sources: 2012 OECD Survey on Compensation of Employees in Central/Federal Governments; OECD STAN/National Accounts Statistics (database).1 2 http://dx.doi.org/10.1787/888932942393
5.10. Average annual compensation of senior and junior professionals in central government relative to GDP per capitaand to compensation of tertiary-educated workers
Ratio in 2011
Sources: 2012 OECD Survey on Compensation of Employees in Central/Federal Governments; OECD STAN/National Accounts Statistics (database);OECD (2013), Education at a Glance 2013: OECD Indicators, OECD Publishing, Paris, http://dx.doi.org/10.1787/eag-2013-en.
1 2 http://dx.doi.org/10.1787/888932942412
0
AUT BEL CHL DNK EST FIN FRA DEU GRC ISL ISR ITA KOR NLD POL PRT SVK SVN ESP SWE GBR USA
40 000
80 000
120 000
160 000
Seni
or p
rofe
ssio
nal
Seni
or p
rofe
ssio
nal
Seni
or p
rofe
ssio
nal
Seni
or p
rofe
ssio
nal
Seni
or p
rofe
ssio
nal
Seni
or p
rofe
ssio
nal
Seni
or p
rofe
ssio
nal
Seni
or p
rofe
ssio
nal
Seni
or p
rofe
ssio
nal
Seni
or p
rofe
ssio
nal
Seni
or p
rofe
ssio
nal
Seni
or p
rofe
ssio
nal
Seni
or p
rofe
ssio
nal
Seni
or p
rofe
ssio
nal
Seni
or p
rofe
ssio
nal
Seni
or p
rofe
ssio
nal
Seni
or p
rofe
ssio
nal
Seni
or p
rofe
ssio
nal
Seni
or p
rofe
ssio
nal
Seni
or p
rofe
ssio
nal
Seni
or p
rofe
ssio
nal
Seni
or p
rofe
ssio
nal
Seni
or p
rofe
ssio
nal
Juni
or p
rofe
ssio
nal
Juni
or p
rofe
ssio
nal
Juni
or p
rofe
ssio
nal
Juni
or p
rofe
ssio
nal
Juni
or p
rofe
ssio
nal
Juni
or p
rofe
ssio
nal
Juni
or p
rofe
ssio
nal
Juni
or p
rofe
ssio
nal
Juni
or p
rofe
ssio
nal
Juni
or p
rofe
ssio
nal
Juni
or p
rofe
ssio
nal
Juni
or p
rofe
ssio
nal
Juni
or p
rofe
ssio
nal
Juni
or p
rofe
ssio
nal
Juni
or p
rofe
ssio
nal
Juni
or p
rofe
ssio
nal
Juni
or p
rofe
ssio
nal
Juni
or p
rofe
ssio
nal
Juni
or p
rofe
ssio
nal
Juni
or p
rofe
ssio
nal
Juni
or p
rofe
ssio
nal
Juni
or p
rofe
ssio
nal
Juni
or p
rofe
ssio
nal
Wages and salaries Employers’ social contributions Working time correction
2011 USD PPP
OECD
02.0 0 51 2 3 40.51.01.5
Senior economist Junior economist
Senior/junior economist to tertiary-educated compensation Senior/junior economist to GDP per capita
AustriaBelgium
ChileDenmarkEstoniaFinlandFrance
GermanyGreeceIcelandIsraelItaly
KoreaNetherlands
PolandPortugal
Slovak RepublicSlovenia
SpainSweden
United KingdomUnited States
OECD
GOVERNMENT AT A GLANCE 2013 © OECD 2013 111
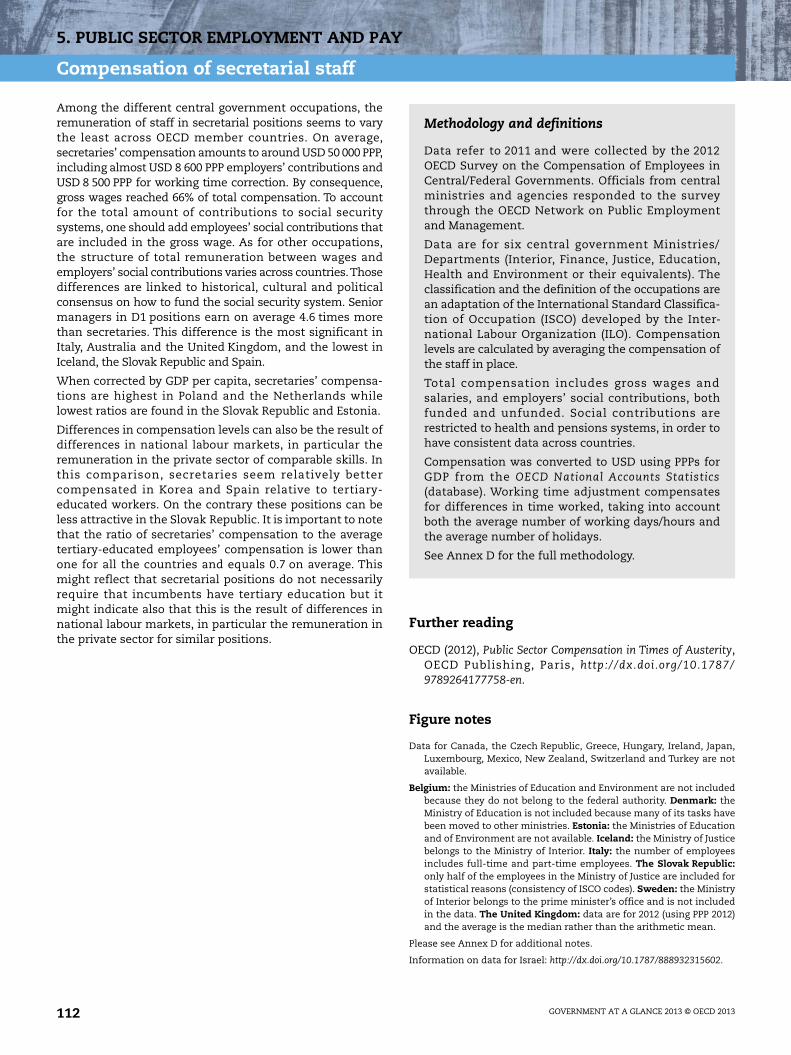
5. PUBLIC SECTOR EMPLOYMENT AND PAY
Compensation of secretarial staff
Among the different central government occupations, theremuneration of staff in secretarial positions seems to varythe least across OECD member countries. On average,secretaries’ compensation amounts to around USD 50 000 PPP,including almost USD 8 600 PPP employers’ contributions andUSD 8 500 PPP for working time correction. By consequence,gross wages reached 66% of total compensation. To accountfor the total amount of contributions to social securitysystems, one should add employees’ social contributions thatare included in the gross wage. As for other occupations,the structure of total remuneration between wages andemployers’ social contributions varies across countries.Thosedifferences are linked to historical, cultural and politicalconsensus on how to fund the social security system. Seniormanagers in D1 positions earn on average 4.6 times morethan secretaries. This difference is the most significant inItaly, Australia and the United Kingdom, and the lowest inIceland, the Slovak Republic and Spain.
When corrected by GDP per capita, secretaries’ compensa-tions are highest in Poland and the Netherlands whilelowest ratios are found in the Slovak Republic and Estonia.
Differences in compensation levels can also be the result ofdifferences in national labour markets, in particular theremuneration in the private sector of comparable skills. Inthis comparison, secretaries seem relatively bettercompensated in Korea and Spain relative to tertiary-educated workers. On the contrary these positions can beless attractive in the Slovak Republic. It is important to notethat the ratio of secretaries’ compensation to the averagetertiary-educated employees’ compensation is lower thanone for all the countries and equals 0.7 on average. Thismight reflect that secretarial positions do not necessarilyrequire that incumbents have tertiary education but itmight indicate also that this is the result of differences innational labour markets, in particular the remuneration inthe private sector for similar positions.
Further reading
OECD (2012), Public Sector Compensation in Times of Austerity,OECD Publishing, Paris, http://dx.doi.org/10.1787/9789264177758-en.
Figure notes
Data for Canada, the Czech Republic, Greece, Hungary, Ireland, Japan,Luxembourg, Mexico, New Zealand, Switzerland and Turkey are notavailable.
Belgium: the Ministries of Education and Environment are not includedbecause they do not belong to the federal authority. Denmark: theMinistry of Education is not included because many of its tasks havebeen moved to other ministries. Estonia: the Ministries of Educationand of Environment are not available. Iceland: the Ministry of Justicebelongs to the Ministry of Interior. Italy: the number of employeesincludes full-time and part-time employees. The Slovak Republic:only half of the employees in the Ministry of Justice are included forstatistical reasons (consistency of ISCO codes). Sweden: the Ministryof Interior belongs to the prime minister’s office and is not includedin the data. The United Kingdom: data are for 2012 (using PPP 2012)and the average is the median rather than the arithmetic mean.
Please see Annex D for additional notes.
Information on data for Israel: http://dx.doi.org/10.1787/888932315602.
Methodology and definitions
Data refer to 2011 and were collected by the 2012OECD Survey on the Compensation of Employees inCentral/Federal Governments. Officials from centralministries and agencies responded to the surveythrough the OECD Network on Public Employmentand Management.
Data are for six central government Ministries/Departments (Interior, Finance, Justice, Education,Health and Environment or their equivalents). Theclassification and the definition of the occupations arean adaptation of the International Standard Classifica-tion of Occupation (ISCO) developed by the Inter-national Labour Organization (ILO). Compensationlevels are calculated by averaging the compensation ofthe staff in place.
Total compensation includes gross wages andsalaries, and employers’ social contributions, bothfunded and unfunded. Social contributions arerestricted to health and pensions systems, in order tohave consistent data across countries.
Compensation was converted to USD using PPPs forGDP from the OECD National Accounts Statistics(database). Working time adjustment compensatesfor differences in time worked, taking into accountboth the average number of working days/hours andthe average number of holidays.
See Annex D for the full methodology.
GOVERNMENT AT A GLANCE 2013 © OECD 2013112
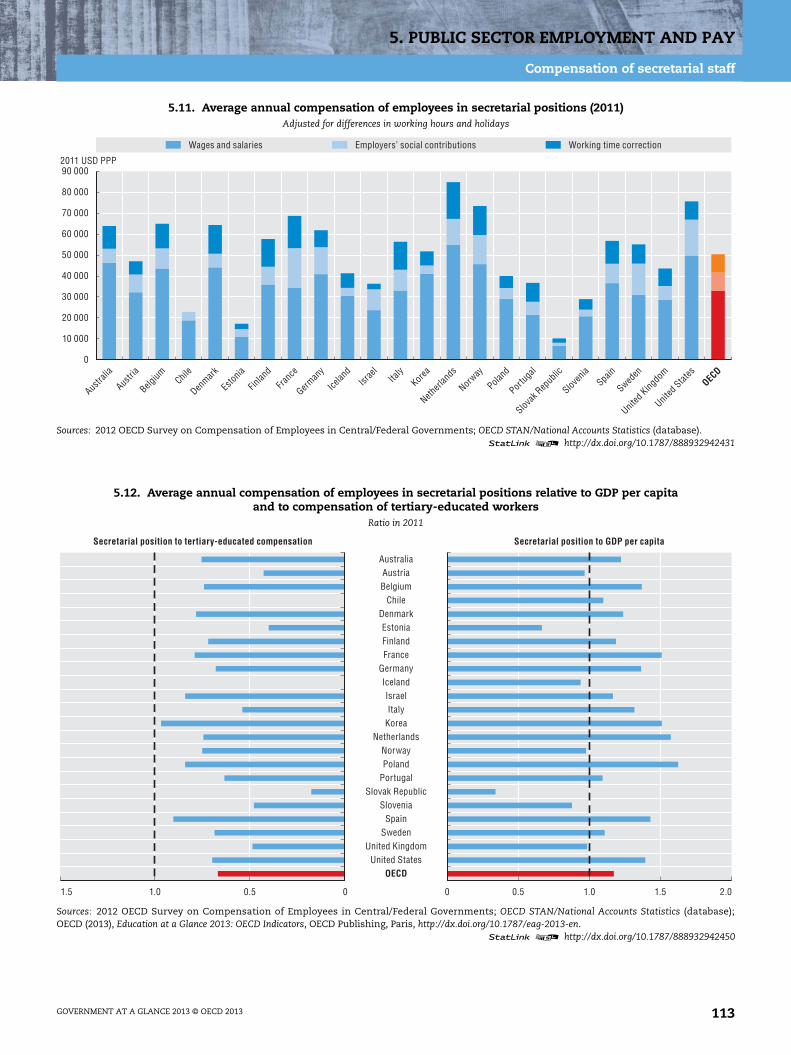
5. PUBLIC SECTOR EMPLOYMENT AND PAY
Compensation of secretarial staff
5.11. Average annual compensation of employees in secretarial positions (2011)Adjusted for differences in working hours and holidays
Sources: 2012 OECD Survey on Compensation of Employees in Central/Federal Governments; OECD STAN/National Accounts Statistics (database).1 2 http://dx.doi.org/10.1787/888932942431
5.12. Average annual compensation of employees in secretarial positions relative to GDP per capitaand to compensation of tertiary-educated workers
Ratio in 2011
Sources: 2012 OECD Survey on Compensation of Employees in Central/Federal Governments; OECD STAN/National Accounts Statistics (database);OECD (2013), Education at a Glance 2013: OECD Indicators, OECD Publishing, Paris, http://dx.doi.org/10.1787/eag-2013-en.
1 2 http://dx.doi.org/10.1787/888932942450
0
10 000
20 000
30 000
40 000
50 000
60 000
70 000
80 000
90 000
Austra
lia
Austri
a
Belgium Chil
e
Denmark
Eston
ia
Finlan
d
Franc
e
German
y
Icelan
dIsr
ael
Italy
Korea
Netherl
ands
Norway
Poland
Portug
al
Slovak
Rep
ublic
Sloven
iaSpa
in
Sweden
United
Kingdo
m
United
States
OECD
Wages and salaries Employers’ social contributions Working time correction
2011 USD PPP
01.5 0 2.00.51.0 0.5 1.0 1.5
Secretarial position to tertiary-educated compensation Secretarial position to GDP per capita
AustraliaAustriaBelgium
ChileDenmarkEstoniaFinlandFrance
GermanyIcelandIsraelItaly
KoreaNetherlands
NorwayPoland
PortugalSlovak Republic
SloveniaSpain
SwedenUnited Kingdom
United StatesOECD
GOVERNMENT AT A GLANCE 2013 © OECD 2013 113

5. PUBLIC SECTOR EMPLOYMENT AND PAY
Compensation in selected service occupations
Central government employees in service occupationswork on the front line interacting with users of publicservices. Data are included for occupations related to lawand order and tax administration: police inspectors anddetectives (called police inspectors), police officers, immi-gration officers, customs inspectors and tax inspectors.Though all countries have employees in charge of thesetasks, some of these functions are also carried out bysub-central governments. In some countries specificfunctions (immigration or tax) cannot be distinguished.
On average, police inspectors’ compensation amounts toaround USD 83 000 PPP, of which 18% represents employers’contributions and 19% working time adjustment. Policeofficers’ compensation is approximately USD 63 000 PPP(including employers’ social contributions and workinghours and holidays).
Differences in compensation levels are rather small amongthe five occupations. A police inspector earns 33% morethan a police officer on average. The United States and theUnited Kingdom invest proportionately more than othercountries in their police inspectors compared to their policeofficers. On the contrary, police officers and inspectors earnnearly the same amount in Iceland, the Netherlands andNorway.
Central governments seem to pay tax inspectors more thanpolice officers mostly in the Netherlands, Slovenia, Portugaland Spain. In addition, Portugal, the United Kingdom andthe United States to a large extent seem to invest more incustoms inspectors relative to police officers. The samegroup of countries plus the Netherlands seem to remunerateimmigration officers more than police officers.
As is the case for other occupations, the structure of totalremuneration between wages and salaries and employers’social contributions varies across countries. Thosedifferences are linked to historical, cultural and politicalconsensus on how to fund the social security system.
Relative to GDP per capita and when compared to theaverage tertiary-educated wage, two occupations were ana-lysed: police inspectors and police officers. On average, theratio of police inspectors’ compensation to the averagetertiary-educated compensation is nearly equal but slightlylower for police officers, meaning that earnings for thesepositions have the same level of attractiveness or lowerthan the average compensation of the whole economy.
Further reading
OECD (2012), Public Sector Compensation in Times of Austerity,OECD Publishing, Paris, http://dx.doi.org/10.1787/9789264177758-en.
Figure notesData for Canada, Chile, the Czech Republic, Germany, Greece, Hungary,
Ireland, Japan, Luxembourg, Mexico, New Zealand, Switzerland andTurkey are not available.
Immigration officers are included in police officers in Austria, Denmark,Iceland, Italy, Norway, the Slovak Republic and Spain. Police inspectorsand police officers are mixed in Israel, Korea and Sweden. Customsofficers are included in police officers in the Slovak Republic. Taxinspectors and immigration officers are included in police officers inIceland. Australia: municipal and local police officers and inspectorsrepresent the major share of police employees and are not included.Austria: only contractual workers are considered since they representthe majority of service delivery agents. Poland: services deliveryoccupations are outside the civil service except for tax inspectors. TheUnited Kingdom: data are for 2012 (using PPP 2012). Only data onentry level and maximum level of compensation are available, theaverage is hence not the actual average but the mean between theentry level and the maximum level.
Please see Annex D for additional notes.
Information on data for Israel: http://dx.doi.org/10.1787/888932315602.
Methodology and definitions
Data refer to 2011 and were collected by the 2012OECD Survey on the Compensation of Employees inCentral/Federal Governments. Officials from centralMinistries and Agencies responded to the surveythrough the OECD Network on Public Employmentand Management.
Data is for some frontline service delivery agents(detectives/police inspectors, police officers, immi-gration officers, customs inspectors and tax inspec-tors). The classification and the definition of theoccupations are an adaptation of the InternationalStandard Classification of Occupation (ISCO) devel-oped by the International Labour Organization (ILO).
Total compensation includes gross wages andsalaries, and employers’ social contributions, bothfunded and unfunded, including pension paymentspaid through the state budget rather than throughemployer social contributions (mostly for somepay-as-you-go systems). Social contributions arerestricted to health and pensions systems, in order tohave consistent data across countries.
Compensation was converted to USD using PPPs forGDP from the OECD National Accounts Statistics(database). Working time adjustment compensatesfor differences in time worked, taking into accountboth the average number of working days/hours andthe average number of holidays.
See Annex D for the full methodology.
GOVERNMENT AT A GLANCE 2013 © OECD 2013114

5. PUBLIC SECTOR EMPLOYMENT AND PAY
Compensation in selected service occupations
5.13. Average annual compensation of employees in service delivery occupations (2011)Adjusted for differences in working hours and holidays
Sources: 2012 OECD Survey on Compensation of Employees in Central/Federal Governments, OECD STAN/National Accounts Statistics (database).1 2 http://dx.doi.org/10.1787/888932942469
5.14. Average annual compensation of central government police inspectors and officers relative to GDP per capitaand to compensation of tertiary-educated workers
Ratio in 2011
Sources: 2012 OECD Survey on Compensation of Employees in Central/Federal Governments; OECD STAN/National Accounts Statistics (database);OECD (2013), Education at a Glance 2013: OECD Indicators, OECD Publishing, Paris, http://dx.doi.org/10.1787/eag-2013-en.
1 2 http://dx.doi.org/10.1787/888932942488
0
20 000
40 000
60 000
80 000
100 000
120 000
140 000
160 000
Police inspectors and detectives Police officers Immigration officers
Customs inspectors Tax inspectors
2011 USD PPP
Austra
lia
Austri
a
Belgium
Denmark
Eston
ia
Finlan
d
Franc
e
Icelan
dIsr
ael
Italy
Korea
Netherl
ands
Norway
Poland
Portug
al
Slovak
Rep
ublic
Sloven
iaSpa
in
Sweden
United
Kingdo
m
United
States
OECD
02.0 0 3.00.51.01.5 0.5 1.0 1.5 2.0 2.5
Police inspectors and detectives Police officers
Police inspector, detective/officer positionto tertiary-educated compensation
Police inspector, detective/officer positionto GDP per capita
AustraliaAustriaBelgiumDenmarkEstoniaFinlandFranceIcelandIsraelItaly
KoreaNetherlands
NorwayPortugal
Slovak RepublicSlovenia
SpainSweden
United KingdomUnited States
OECD
GOVERNMENT AT A GLANCE 2013 © OECD 2013 115
5. PUBLIC SECTOR EMPLOYMENT AND PAY
Teachers’ salaries
Teachers are the backbone of the education sector which isa crucial determinant of productivity and growth. Teachers’salaries represent the largest single cost item in the labour-intensive education system. Salaries and working condi-tions play an important role in attracting, motivating andretaining skilled teachers.
In most countries there are three categories of schoolteachers: primary, lower secondary and upper secondary.Salaries increase with qualifications, experience and jobcontent, meaning the level of education they teach. Thedata presented here compare the starting, mid-career andmaximum statutory gross wages of lower secondaryteachers, who have the minimum level of training, in publicinstitutions. However, international comparisons shouldconsider that statutory salaries are just one, albeit major,component of teachers’ overall compensation. Variationsbetween countries in social benefits, both employers’ socialcontributions and employees’ social contributions, as wellas bonuses and allowances can result in differences in totalcompensation. Moreover, teachers’ salaries have not beenadjusted for the differences in contractual working hoursand holidays that may be relevant for national and inter-national comparisons. However, these data can provide anindication of differences in the returns to teaching experi-ence in OECD member countries.
The annual statutory gross basic wages of lower secondaryteachers with 15 years of experience range from lessthan USD 15 000 PPP in Estonia, the Slovak Republic andHungary to over USD 60 000 PPP in Luxembourg, Germanyand the Netherlands in 2011. The average for OECDmember countries reaches nearly USD 40 000 PPP. In Korea,Japan and Mexico top-of-the scale salaries are more thandouble the starting salaries. Salaries at the top of the scaleare on average around 60% higher than starting salaries.
In general, teachers’ gross wages are lower than the averageannual gross wages for employees with a similar level ofeducation (full-time, full-year workers with a tertiary educa-tion aged 25-64 years). In Spain, Korea, Luxembourg andPortugal, teachers earn more. In New Zealand, Canada,Germany and Finland, teachers’ statutory salaries arealmost equal to the average earnings of tertiary-educatedworkers. However, in the Slovak Republic, Iceland, theCzech Republic, Hungary, Italy and Austria, teachers’salaries are considerably below the average earnings ofworkers with a tertiary degree.
Further reading
OECD (2013), Education at a Glance 2013: OECD Indicators, OECDPublishing, Paris, http://dx.doi.org/10.1787/eag-2013-en.
Figure notes
Belgium is presented as Belgium (Fr.) and Belgium (Fl.). TheUnited Kingdom is presented as England and Scotland.
5.15: Data for Switzerland and Turkey are not available.
5.16: Data for Greece, Japan, Mexico, Switzerland and Turkey are not avail-able. Data for Australia, Canada, Finland, Ireland, Italy, Luxembourg,the Netherlands, Norway, Poland, Portugal and Spain are for 2010.Data for France are for 2009. Data for Iceland are for 2006.
Information on data for Israel: http://dx.doi.org/10.1787/888932315602.
Methodology and definitions
Statutory salaries refer to scheduled salaries accord-ing to official pay scales. The salaries reported aregross (total sum paid by the employer before tax) lessthe employer’s contribution to social security andpension (according to existing salary scales). They arefor a full-time teacher with the minimum trainingnecessary to be fully qualified at the beginning of theteacher career, after 15 years of teaching experienceand at the maximum annual salary (top of the scale).
Statutory salaries as reported in this indicator mustbe distinguished from actual expenditures on wagesby governments and from teachers’ average salaries.
Gross teachers’ salaries were converted to USD usingPPPs from the OECD National Accounts Statistics(database).
The relative salary indicator is calculated for thelatest year with earnings data available. In this case,teachers’ salaries represent those actually paid after15 years of work experience. Earnings for workerswith a tertiary education are average earnings for full-time, full-year workers in the age group of 25-64 yearswith education at ISCED 5A/5B/6.
GOVERNMENT AT A GLANCE 2013 © OECD 2013116

5. PUBLIC SECTOR EMPLOYMENT AND PAY
Teachers’ salaries
5.15. Teachers’ salaries in lower secondary education in public institutions (2011)
Source: OECD (2013), Education at a Glance 2013: OECD Indicators, OECD Publishing, Paris, http://dx.doi.org/10.1787/eag-2013-en.1 2 http://dx.doi.org/10.1787/888932942507
5.16. Ratio of teachers’ salaries to the earnings of tertiary-educated workers (2011)
Source: OECD (2013), Education at a Glance 2013: OECD Indicators, OECD Publishing, Paris, http://dx.doi.org/10.1787/eag-2013-en.1 2 http://dx.doi.org/10.1787/888932942526
0
20 000
40 000
60 000
80 000
100 000
120 000
140 000
Starting salary/minimum trainingSalary after 15 years of experience/minimum training
Salary at top of scale/minimum training
Slovak
Rep
ublic
Luxe
mbourg
German
y
Netherl
ands
Canad
a
Irelan
d
Denmark
Austra
liaKor
ea
Scotla
nd
United
States
Japa
nSpa
in
Belgium
(Fl.)
Austri
a
Belgium
(Fr.)
Engla
nd
New Ze
aland
Finlan
dOEC
D
Portug
al
Norway
Franc
eIta
ly
Sweden
Sloven
ia
Greece
Icelan
dIsr
ael
Mexico Chil
e
Czech
Rep
ublic
Poland
Hunga
ry
Eston
ia
USD PPPs
0
1
2
Spain
Korea
Luxe
mbourg
Portug
al
New Ze
aland
Canad
a
German
y
Finlan
dIsr
ael
Engla
nd
Austra
lia
Denmark
Belgium
(Fl.)
OECD
Netherl
ands
Belgium
(Fr.)
Irelan
d
Sweden
Sloven
ia
Franc
e
Scotla
nd
Poland
Chile
Norway
United
States
Eston
ia
Austri
aIta
ly
Hunga
ry
Czech
Rep
ublic
Slovak
Rep
ublic
Icelan
d
GOVERNMENT AT A GLANCE 2013 © OECD 2013 117

GOVERNMENT AT A GLANCE 2013 © OEC
6. WOMEN IN GOVERNMENT
Women represent a large and growing share of the public workforce in the majority ofOECD member countries. Indeed, governments have taken a variety of steps to guaranteeequal opportunities for their female and male employees, such as implementing recruitmentand promotion targets and measures to facilitate greater work-life balance. Significant genderdisparities remain, however, between various occupations, and women still face barriers inreaching senior leadership positions in government. Such gender imbalances in the upperechelons of government compromise the role of women in decision making, including in thelegal system, where women are instrumental in protecting equal rights for all citizens. Furtherefforts are needed to close gender gaps and strengthen the capacity of governments to embedgender considerations in policy and programme design and implementation, thereby ensuringfairness and improving the responsiveness of government policies and services.
This chapter features indicators on the share of women in the executive, judicial andlegislative branches of government in OECD member countries. Data on women in part-timework and in various positions in government employment are presented, along with acomparison of female employment in the public sector with the total labour force. These dataindicate continued occupational segregation of women, with long-term impacts on pay andcareer prospects.
D 2013 119

6. WOMEN IN GOVERNMENT
Women in general government employment
The share of women in government employment is animportant indicator of openness and fairness in publicinstitutions. As governments continue to strengthenfundamental public service values such as merit and trans-parency, they are increasingly recognising the importanceof diversity measures, including gender representation.Moreover, creating a public sector that is representative ofthe population it serves contributes to improving thequality of public policies and responsiveness of services byfostering a better understanding of citizens’ needs. It is alsogood practice in terms of boosting public sector produc-tivity, by ensuring the government makes the best use ofthe available talent pool. Finally, promoting greater partici-pation of women in the government workforce can be ameans of enhancing social mobility.
On average in OECD member countries, women make up alarger portion of the general government workforce (56%)than the total labour force, where women account for about40-50% of the total labour force. Government employmentpolicies may be a significant draw for women in somecountries, since in many countries the public sector mayoffer more flexible working conditions, additional paidparental leave, and/or higher subsidised childcare or otherbenefits compared to those available in the private sector.However, disparities do exist across member countries: thedifference is largest in the Nordic countries, Estonia andSlovenia, where the share of women in general governmentis 20 percentage points higher than their share of totalemployment. Conversely, in Greece, Japan, the Netherlandsand Turkey, women are slightly better represented in thelabour force than in general government employment.
The share of women working in general governmentincreased between 2001 and 2010 in all 20 OECD membercountries for which data are available. Estonia experiencedthe largest rise in female employment over this period;women accounted for three quarters of general govern-ment employment in 2010, more than any other OECDmember country. In contrast, according to the most recentfigures, women represented only 24% and 36% of generalgovernment employees in Turkey and Greece, respectively.
Further reading
OECD (2012), Closing the Gender Gap: Act Now, OECD Publish-ing, Paris, http://dx.doi.org/10.1787/9789264179370-en.
OECD (2011), Public Servants as Partners for Growth: Toward aStronger, Leaner and More Equitable Workforce, OECD Pub-lishing, Paris, http://dx.doi.org/10.1787/9789264166707-en.
Figure notesData for Japan are for 2009 rather than 2010. Data for Canada, Chile,
Finland, Greece, Poland and Switzerland are for 2008 ratherthan 2010. Data for Norway and Sweden are for 2007 ratherthan 2010. Data for Turkey are for 2006 rather than 2010. Data for theNetherlands are for 2005 rather than 2010.
6.1: Data for the share of women in general government are from the ILOLABORSTA (database). Data for the share of women in the labourforce are from the OECD Labour Force Statistics (database).
Methodology and definitions
Data are from the International Labour Organization(ILO) and refer to 2001 and 2010. The general govern-ment sector comprises all levels of government, includ-ing: a) all units of central, state or local government;b) all social security funds at each level of government;and c) all non-market non-profit institutions that arecontrolled and mainly financed by government units.The labour force comprises all persons who fulfil therequirements for inclusion among the employed or theunemployed.
Data represent the number of employees except for theNetherlands and New Zealand, where the data repre-sent full-time equivalents (FTE). As a result, employ-ment numbers for these two countries are understatedin comparison. Data for Canada, Chile, Finland, Polandand Turkey are for the public sector (general govern-ment and public enterprises) instead of generalgovernment.
GOVERNMENT AT A GLANCE 2013 © OECD 2013120

6. WOMEN IN GOVERNMENT
Women in general government employment
6.1. Women in general government compared to women in labour force (2010)
Sources: International Labour Organization (ILO), LABORSTA (database); and OECD Labour Force Statistics (database).1 2 http://dx.doi.org/10.1787/888932942545
6.2. Women in general government (2001 and 2010)
Source: International Labour Organization (ILO), LABORSTA (database).1 2 http://dx.doi.org/10.1787/888932942564
0
10
20
30
40
50
60
70
80
90
100% Share of women in general government Share of women in total labour force
Eston
ia
Sweden
Finlan
d
Norway
Denmark
Sloven
ia
United
Kingdo
m
Canad
a
New Ze
aland
United
States
Poland
OECD
Spain
German
yChil
e
Switzerl
and
Luxe
mbour
g
Netherl
ands
Japa
n
Greece
Turke
y
2010
0
10
20
30
40
50
60
70
80
90
100% 2001
United
Kingdo
m
Eston
ia
Sweden
Finlan
d
Norway
Denmark
Sloven
ia
Canad
a
New Ze
aland
United
States
Poland
OECD
Spain
German
yChil
e
Switzerl
and
Luxe
mbourg
Netherl
ands
Japa
n
Greece
Turke
y
GOVERNMENT AT A GLANCE 2013 © OECD 2013 121
6. WOMEN IN GOVERNMENT
Women in central government employment
Central government employment represents a subset ofoverall general government employment and includes arange of professional, managerial and secretarial positionsin central government ministries or departments. Therepresentation of women in central government, includingsenior administrative positions is therefore an importantindicator of the role women play in policy making andimplementation in OECD member countries.
On average, women accounted for just over 50% of allcentral government employees in 2010 in the 22 countriesfor which data are available. This figure is slightly less thanthe share of women in general government employment(57%, see Figure 6.2), reflecting the inclusion of female-dominated occupations, such as teachers and nurses,occupations that are more commonly found at state andlocal levels. Chile, Italy and Poland continue to employ thelargest percentages of women in central government, atapproximately 70%, while Japan employs the smallestshare (16%), followed by Germany (39%). The representa-tion of women in central government remains slightlylarger than their employment in the labour force due to, inmany countries, policies such as more flexible workingconditions and paid parental leave.
The proportion of women in central government employ-ment increased between 2000 and 2010 in nearly all15 OECD member countries for which data are available (intwo countries – Estonia and Japan – the share dropped byless than 1 percentage point). However, despite the growthin women in central government employment over the lastdecade, women continue to be over-represented in lower-level positions. In 15 of 19 countries, women occupy morethan 50% of secretarial positions – in Slovenia and Austria,approximately 90% of secretarial positions are filled bywomen. Women are far less represented in higher tiers,where they occupy only 40% of middle management and29% of top management positions (see Figure 6.4).
In addition, women make up a disproportionate share ofpart-time workers in the central government. In all16 OECD member countries that provided data, two-thirdsor more of part-time workers were women in 2010, includ-ing more than 85% in Germany, Luxembourg and France.Although part-time work may be an attractive option foremployees seeking greater flexibility in order to balancework and family responsibilities, it generally leads to lowercompensation and fewer opportunities for career advance-ment over the long term. Providing a path from part-time tofull-time work is one way that countries can offer flexibilityto all employees without damaging their long-term careerprospects.
Further reading
OECD (2012), Closing the Gender Gap: Act Now, OECD Publish-ing, Paris, http://dx.doi.org/10.1787/9789264179370-en.
OECD (2011), Public Servants as Partners for Growth: Toward aStronger, Leaner and More Equitable Workforce, OECD Pub-lishing, Paris, http://dx.doi.org/10.1787/9789264166707-en.
Figure notes
Data for Luxembourg, Slovenia and Sweden are for 2011 ratherthan 2010. Data for France are for 2009 rather than 2010. Data for theNetherlands are in full-time equivalent.
6.3: Data for Estonia, Japan and Spain are for full-time employees only.Data for Finland are not available for 2010.
6.4: Data for Switzerland on secretarial positions also include technicalpositions.
Methodology and definitions
Data were collected through the OECD 2011 Survey onGender in Public Employment. Respondents werepredominately senior officials in central governmenthuman resource management departments.
Central government (also referred to as the nationalor federal government) refers to the ministries/departments and agencies controlled and financed atthe central level of government. Employment datarefer to staff employed under the General Employ-ment Framework, which covers the employmentconditions of most government employees, as well asthe majority of statutory employees. Part-timeemployment includes positions that involve fewerhours per week than a full-time job. The definition ofpart-time employment varies by country, but isusually fewer than 30 or 35 hours per week.
Top management positions are defined as those postssituated below ministers or deputy ministers. Middlemanagement is the level immediately below topmanagement down to positions responsible for themanagement of at least three people. These usuallyencompass heads of divisions/departments/unitswithin a ministry. Professionals are defined as staffbetween management and clerical/administrativesupport staff. Secretarial positions include staffresponsible for administrative tasks and generaloffice support.
GOVERNMENT AT A GLANCE 2013 © OECD 2013122

6. WOMEN IN GOVERNMENT
Women in central government employment
6.3. Share of central government employment filled by women (2000 and 2010)
Source: 2011 OECD Survey on Gender in Public Employment.1 2 http://dx.doi.org/10.1787/888932942583
6.4. Share of central government employment by occupation groups filled by women (2010)
Source: 2011 OECD Survey on Gender in Public Employment.1 2 http://dx.doi.org/10.1787/888932942602
6.5. Share of part-time positions in central government filled by women (2010)
Source: 2011 OECD Survey on Gender in Public Employment.1 2 http://dx.doi.org/10.1787/888932942621
2010
0
10
20
30
40
50
60
70
80
90
100% 2000
ITA POLCHL ISL
SVNNZL AUS
AUTCAN
OECD
GBRDNK
BEL EST
FRA
ESP
SWECHE
LUX
NORNLD DEU JP
N FIN
0
10
20
30
40
50
60
70
80
90
100%
EST
SVNAUT
SWEPRT
NORCAN
POLNZL DNK
CHLAUS
GBR ITA FIN BEL NLD FRA
DEU CHE
Middle management
Secretarial positions
Top management
Professionals
0
10
20
30
40
50
60
70
80
90
100%
DEU LUX
FRA
GBRNZL AUS
SVN ITA CANAUT ISL
CHEBEL
SWEDNK
NOR
GOVERNMENT AT A GLANCE 2013 © OECD 2013 123

6. WOMEN IN GOVERNMENT
Women in senior administrative positions in central government
Despite the growing share of women employed in centralgovernments (see also Figure 6.3), women remain under-represented in senior administrative or leadership posi-tions. The gender imbalance found in senior levels ofcentral government limits the role of women in thedecision-making process, adversely impacting the fairnessof public policies and laws. One key illustration of this isgender representation in the legal system, which is vital forupholding equal rights and eliminating gender-baseddiscrimination in judicial rulings.
On average, in OECD member countries women occupyover 50% of central government jobs, but only 29% of topmanagement positions in the 18 countries for which dataare available. The extent to which women hold senior-levelpositions in central government administrations variesconsiderably among member countries. In Poland, almost50% of top management jobs are filled by women, whereasthis figure is more than halved in countries such asBelgium and Switzerland. The largest gaps between theshare of women in central government and their presencein top senior positions can be found in Austria, Belgiumand Italy.
A similar trend can be found in many justice systems of theOECD member countries. In 2010, just under half of profes-sional judges in member countries with available data werewomen, but only 29% of seats for first and second instancecourt presidents were filled by women in the same year.Women are also relatively less represented on supremecourts (28% of justices). Women were presidents ofsupreme courts in only five member countries withavailable data (the Czech Republic, Ireland, Greece, Finlandand Sweden).
In an effort to improve these imbalances, some countriesimplement active policy responses in order to ensure equalemployment opportunities exist for women. These includethe use of diversity or gender quotas, equal pay rules/guidelines, leadership training and mentoring programmes,as well as work-life balance schemes like flexible workinghours. Some countries such as the United Kingdom andCanada have established special judicial commissionsworking to increase gender diversity in the pool of availablecandidates for judicial selection.
Further reading
CEPEJ (2012), Evaluation of European Judicial Systems– 2012 edition (2010 data), CEPEJ Studies No. 18, Council ofEurope Publishing, Strasbourg.
OECD (2012), Closing the Gender Gap: Act Now, OECD Publish-ing, Paris, http://dx.doi.org/10.1787/9789264179370-en.
Figure notes
6.6: Data on share of women in central government positions unavailablefor Portugal and Finland. Data for Luxembourg, Slovenia and Swedenare for 2011 rather than 2010. Data for France are for 2009 rather than2010. Data for Estonia, Japan and Spain are for full-time employeesonly. Data for the Netherlands are in full-time equivalent.
6.7: Data on share of court presidents for Iceland, Ireland, Switzerlandand Turkey refer to first instance courts only. Data for Spain refer tosecond instance courts only.
6.8: Data for Australia, Canada, Korea, Mexico, New Zealand, Switzerland,and Ukraine refer to 2010. Data for Chile, Norway and Israel referto 2011. Data for the United States and Japan refer to 2013.
Information on data for Israel: http://dx.doi.org/10.1787/888932315602.
Methodology and definitions
Data on number of women in top management posi-tions and central government were obtained from the2011 OECD Survey on Gender in Public Employment.Responses were collected from government officialsresponsible for central/federal HRM and employmentpolicies.
Data on the number of women professional judgesand women as presidents of courts were collectedfrom the Council of Europe’s Commission forEuropean Commission for the Efficiency of Justice(CEPEJ). Unless otherwise noted, the latter refer tofirst and second instance courts. Data concerningwomen supreme court justices were derived from theEuropean Commission Database on Women in DecisionMaking. The definition of supreme court adopted bythe European Commission refers to the highestjudicial body in each country in the domain of civiland penal jurisdiction. In some countries, however,the supreme court may also have administrativeand/or constitutional jurisdiction. Justices includepresidents of supreme courts.
GOVERNMENT AT A GLANCE 2013 © OECD 2013124
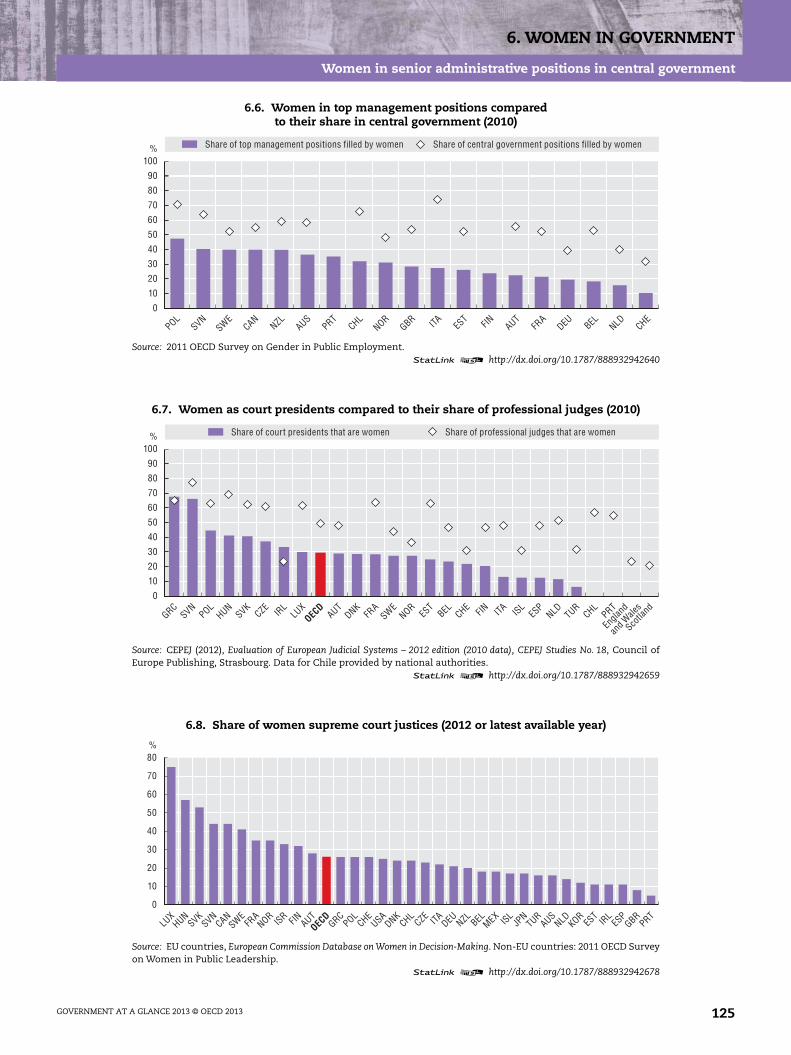
6. WOMEN IN GOVERNMENT
Women in senior administrative positions in central government
6.6. Women in top management positions comparedto their share in central government (2010)
Source: 2011 OECD Survey on Gender in Public Employment.1 2 http://dx.doi.org/10.1787/888932942640
6.7. Women as court presidents compared to their share of professional judges (2010)
Source: CEPEJ (2012), Evaluation of European Judicial Systems – 2012 edition (2010 data), CEPEJ Studies No. 18, Council ofEurope Publishing, Strasbourg. Data for Chile provided by national authorities.
1 2 http://dx.doi.org/10.1787/888932942659
6.8. Share of women supreme court justices (2012 or latest available year)
Source: EU countries, European Commission Database on Women in Decision-Making. Non-EU countries: 2011 OECD Surveyon Women in Public Leadership.
1 2 http://dx.doi.org/10.1787/888932942678
0
10
20
30
40
50
60
70
80
90
100%
POLSVN
SWECAN
NZL AUSPRT
CHLNOR
GBR ITA EST FIN AUT
FRA
DEU BEL NLD CHE
Share of top management positions filled by women Share of central government positions filled by women
0
10
20
30
40
50
60
70
80
90
100%
GRCSVN
POLHUN
SVKCZE
IRL
LUX
AUTDNK
FRA
SWENOR
EST
BEL CHE FIN ITA ISLES
PNLD TUR
PRTCHL
Share of court presidents that are women Share of professional judges that are women
Scotla
nd O
ECD
Engla
nd
and W
ales
0
10
20
30
40
50
60
70
80%
LUX
HUNSVK
SVNCAN
SWEFR
ANOR ISR FIN AUT
GRCPOL
CHEUSA
DNKCHL
CZE ITA DEU NZL BELMEX ISL
JPN
TURAUS
NLD KORES
TIR
LES
PGBR
PRTOEC
D
GOVERNMENT AT A GLANCE 2013 © OECD 2013 125
6. WOMEN IN GOVERNMENT
Women in politics
Women’s representation in politics is important not only interms of ensuring gender equality in the political process,but also for bringing attention to important socio-economic issues such as human development, gender-based violence, family-friendly policies, equal pay,pensions, electoral reform and the delivery of services. Yetwomen still face a “glass ceiling” blocking their full partici-pation in political life in the legislature and political execu-tive, and remain generally underrepresented in politics.
On average in the OECD, women held just over a quarterof seats in lower or single houses of parliament – as ofearly 2012 – with only 12 member countries reaching orsuperseding the 30% threshold recommended by theUnited Nations and Inter-Parliamentary Union for therepresentation of women. Compared to 2002, this marks asmall increase of 6 percentage points on average. Therepresentation of women in OECD parliaments is generallyhighest in Nordic countries, with 40% or more of seats heldby women in Sweden, Finland, Iceland and Norway. InTurkey, Japan, Chile and Hungary women held fewer than aquarter of seats.
Countries with proportional electoral systems tend to havemore women in legislature, possibly due to the practice ofselecting a more gender-balanced set of candidates in partylists. In the OECD, 9 out of 12 countries meeting the30% representation threshold use some form of propor-tional representation in the election of legislative represen-tatives. In addition to the type of electoral system in place,women’s political representation can also be impacted bycultural and financial barriers as well as by challenges inreconciling responsibilities of political and private life. Toaddress this gap, nine OECD member countries have intro-duced gender quotas as a means of promoting genderequality in parliaments. Application of these quotas,however, may vary, from quotas applied during thenomination process (e.g. rules for placing women on partylists or to be nominated in an electoral district) to results-based quotas whereby a certain share of number of seats inparliament are reserved for women.
In the political executive of OECD member countries, thepercentage of women ministers increased from 21% in 2005to 25% in 2012. Data from 2012 shows that the share of femaleministers ranges from over 50% in Norway, Sweden, Finlandand Iceland to less than 10% in Hungary, Estonia, Slovenia,Greece and Turkey. Women often hold social and culturalpolicy portfolios. Although the process of ministerial appoint-ments differs depending on the country’s political system(parliamentary voting or appointments versus presidentialappointments with or without parliamentary approval),women are not represented equally in any system.
Further reading
International IDEA (2007), Designing for Equality, Stockholm,Sweden.
OECD (2012), Closing the Gender Gap: Act Now, OECD Publishing,Paris, http://dx.doi.org/10.1787/9789264179370-en.
Figure notes
6.9: Data refer to share of women parliamentarians recorded as of31 October 2012 and 25 October 2002. Percentages represent thenumber of women parliamentarians as a share of total filled seats.2002 data for the Slovak Republic are unavailable.
6.10: Data represent women appointed ministers as of 1 January 2012and 1 January 2005. The total includes deputy prime ministers andministers. Prime ministers/heads of government were also includedwhen they held ministerial portfolios. Vice-presidents and heads ofgovernmental or public agencies have not been included.
Information on data for Israel: http://dx.doi.org/10.1787/888932315602.
Methodology and definitions
Data for women parliamentarians refer to lower orsingle houses of parliament and were obtained fromthe Inter-Parliamentary Union’s PARLINE database. Datarefer to share of women parliamentarians recorded asof 31 October 2012 and 25 October 2002.
Countries in light blue represent lower or single houseparliaments with legislated candidate quotas as ofJanuary 2013. Legislative quotas are enshrined in theelection law, political party law or other comparablelaw of a country. By definition, both forms are basedon legal provisions, obliging all political entitiesparticipating in elections to apply them equally.Non-compliance with legislative quotas can result inpenalties for those political entities that do not applyto them. Data on gender quotas were obtained fromthe Institute for Democracy and Electoral Assistance(IDEA) Global Database on Quotas for Women.
Data on women ministers were obtained from the InterParliamentary Union’s “Women in Politics” posters.Data represent appointed women ministers as of1 January 2012 and 1 January 2005. Data show womenas a share of total ministers, including deputy primeministers and ministers. Prime ministers/heads ofgovernment were also included when they heldministerial portfolios. Vice-presidents and heads ofgovernmental or public agencies have not beenincluded in the total.
GOVERNMENT AT A GLANCE 2013 © OECD 2013126

6. WOMEN IN GOVERNMENT
Women in politics
6.9. Share of women parliamentarians and legislated gender quotas (2012 and 2002)Lower or single house of Parliament
Note: Bars in light purple represent countries with lower or single house parliaments with legislated candidatequotas as of 21 January 2013.Sources: Inter-Parliamentary Union (IPU), PARLINE (database); and IDEA, Quota Project (database).
1 2 http://dx.doi.org/10.1787/888932942697
6.10. Share of women ministers (2005 and 2012)
Source: Inter-Parliamentary Union (IPU), “Women in Politics” Posters, 2012 and 2005.1 2 http://dx.doi.org/10.1787/888932942716
% 2012 2002
0
10
20
30
40
50
Sweden
Finlan
d
Icelan
d
Norway
Denmark
Netherl
ands
Belgium
Mexico
Spain
German
y
New Ze
aland
Sloven
ia
Portug
al
Switzerl
and
Austri
a
Franc
eOEC
D
Luxe
mbourg
Canad
a
Austra
lia
Poland
United
Kingdo
m
Czech
Rep
ublic Ita
ly
Greece
Israe
l
Eston
ia
Slovak
Rep
ublic
United
StatesKor
ea
Irelan
d
Turke
yChil
eJa
pan
Hunga
ry
2012% 2005
10
0
20
30
40
50
60
Norway
Sweden
Finlan
d
Icelan
d
Austri
a
Switzerl
and
Belgium
Denmark
German
y
Netherl
ands
Spain
New Ze
aland
United
States
Canad
a
Luxe
mbourg
OECD
Poland
Mexico
Franc
e
Austra
liaChil
e
Portug
al
United
Kingdo
mIta
ly
Irelan
d
Slovak
Rep
ublic
Czech
Rep
ublicJa
panKor
eaIsr
ael
Hunga
ry
Eston
ia
Sloven
ia
Greece
Turke
y
GOVERNMENT AT A GLANCE 2013 © OECD 2013 127

GOVERNMENT AT A GLANCE 2013 © OEC
7. PUBLIC PROCUREMENT
Representing an average of 13% of GDP in OECD countries, and 29% of generalgovernment expenditure, public procurement is a very important government activity. Thischapter provides an estimate of the spending power of public procurement and underscores itspotential as a policy lever to pursue economic, social and environmental goals while ensuringvalue for money and efficiency of spending.
A key concern for OECD member country governments today is achieving savings in order toconsolidate public finances and create fiscal space for other policies. Many OECD countriestherefore have used innovative vehicles to achieve economies of scale, restructuring theirpurchasing functions, consolidating their purchases and adopting ICTs in the procurement process.
Moreover, public procurement policies are utilised by many OECD member countries notonly to foster value for money but also to pursue other policy objectives. These policy objectivesare designed to spur innovation, promote sustainable growth, support the development ofSMEs and level the playing field to access economic opportunities. Information on these andother strategic approaches to public procurement are included in this chapter.
Increasingly important challenges for governments in the coming years will be to reconcilethe various objectives pursued through procurement, to increase monitoring and evaluation ofprocurement spending and results, and to address the gap in the professionalisation of theprocurement function.
D 2013 129
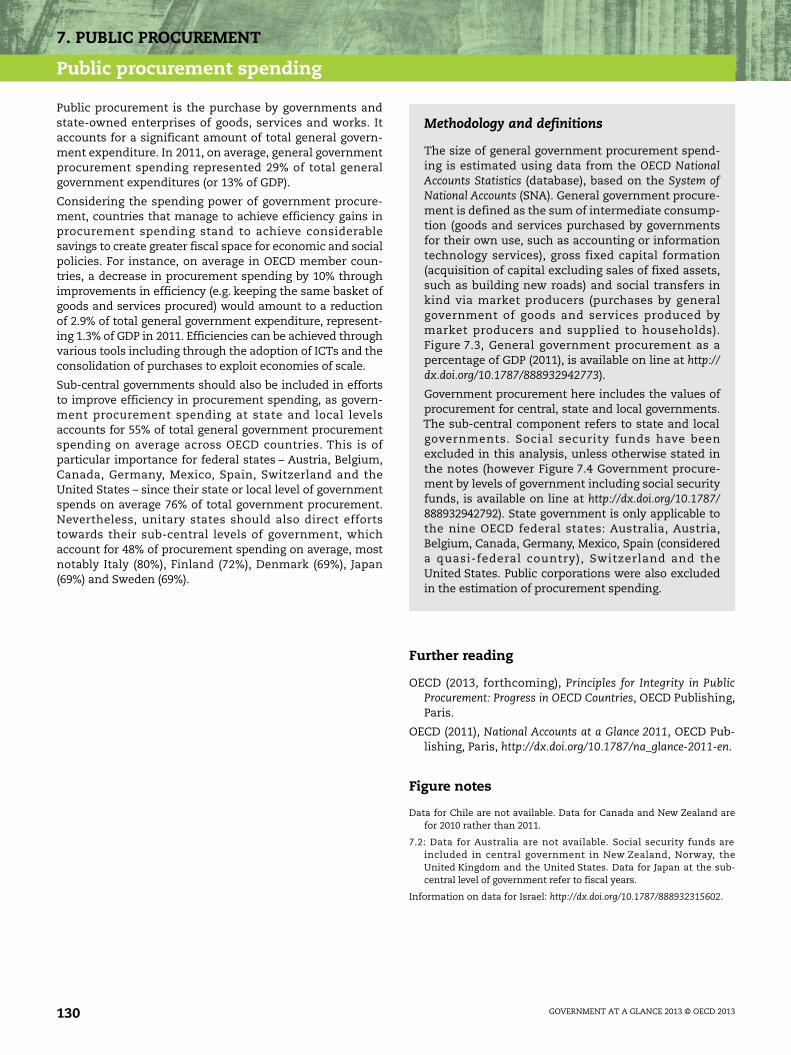
7. PUBLIC PROCUREMENT
Public procurement spending
Public procurement is the purchase by governments andstate-owned enterprises of goods, services and works. Itaccounts for a significant amount of total general govern-ment expenditure. In 2011, on average, general governmentprocurement spending represented 29% of total generalgovernment expenditures (or 13% of GDP).
Considering the spending power of government procure-ment, countries that manage to achieve efficiency gains inprocurement spending stand to achieve considerablesavings to create greater fiscal space for economic and socialpolicies. For instance, on average in OECD member coun-tries, a decrease in procurement spending by 10% throughimprovements in efficiency (e.g. keeping the same basket ofgoods and services procured) would amount to a reductionof 2.9% of total general government expenditure, represent-ing 1.3% of GDP in 2011. Efficiencies can be achieved throughvarious tools including through the adoption of ICTs and theconsolidation of purchases to exploit economies of scale.
Sub-central governments should also be included in effortsto improve efficiency in procurement spending, as govern-ment procurement spending at state and local levelsaccounts for 55% of total general government procurementspending on average across OECD countries. This is ofparticular importance for federal states – Austria, Belgium,Canada, Germany, Mexico, Spain, Switzerland and theUnited States – since their state or local level of governmentspends on average 76% of total government procurement.Nevertheless, unitary states should also direct effortstowards their sub-central levels of government, whichaccount for 48% of procurement spending on average, mostnotably Italy (80%), Finland (72%), Denmark (69%), Japan(69%) and Sweden (69%).
Further reading
OECD (2013, forthcoming), Principles for Integrity in PublicProcurement: Progress in OECD Countries, OECD Publishing,Paris.
OECD (2011), National Accounts at a Glance 2011, OECD Pub-lishing, Paris, http://dx.doi.org/10.1787/na_glance-2011-en.
Figure notes
Data for Chile are not available. Data for Canada and New Zealand arefor 2010 rather than 2011.
7.2: Data for Australia are not available. Social security funds areincluded in central government in New Zealand, Norway, theUnited Kingdom and the United States. Data for Japan at the sub-central level of government refer to fiscal years.
Information on data for Israel: http://dx.doi.org/10.1787/888932315602.
Methodology and definitions
The size of general government procurement spend-ing is estimated using data from the OECD NationalAccounts Statistics (database), based on the System ofNational Accounts (SNA). General government procure-ment is defined as the sum of intermediate consump-tion (goods and services purchased by governmentsfor their own use, such as accounting or informationtechnology services), gross fixed capital formation(acquisition of capital excluding sales of fixed assets,such as building new roads) and social transfers inkind via market producers (purchases by generalgovernment of goods and services produced bymarket producers and supplied to households).Figure 7.3, General government procurement as apercentage of GDP (2011), is available on line at http://dx.doi.org/10.1787/888932942773).
Government procurement here includes the values ofprocurement for central, state and local governments.The sub-central component refers to state and localgovernments. Social security funds have beenexcluded in this analysis, unless otherwise stated inthe notes (however Figure 7.4 Government procure-ment by levels of government including social securityfunds, is available on line at http://dx.doi.org/10.1787/888932942792). State government is only applicable tothe nine OECD federal states: Australia, Austria,Belgium, Canada, Germany, Mexico, Spain (considereda quasi-federal country), Switzerland and theUnited States. Public corporations were also excludedin the estimation of procurement spending.
GOVERNMENT AT A GLANCE 2013 © OECD 2013130
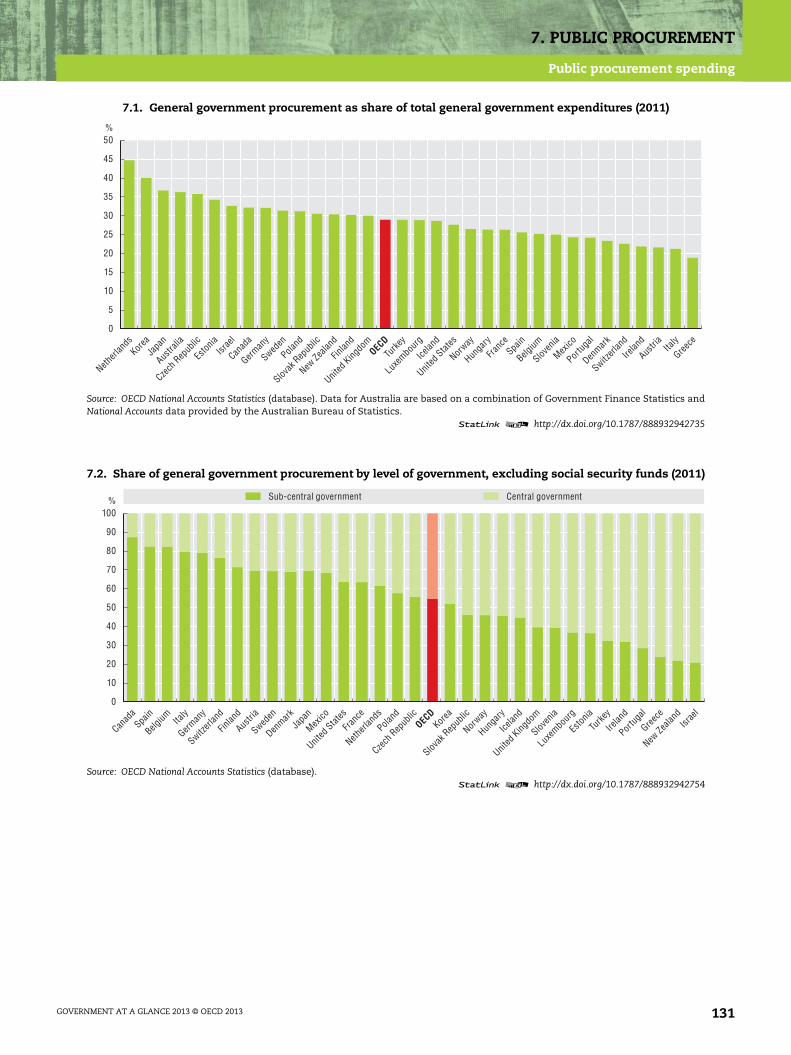
7. PUBLIC PROCUREMENT
Public procurement spending
7.1. General government procurement as share of total general government expenditures (2011)
Source: OECD National Accounts Statistics (database). Data for Australia are based on a combination of Government Finance Statistics andNational Accounts data provided by the Australian Bureau of Statistics.
1 2 http://dx.doi.org/10.1787/888932942735
7.2. Share of general government procurement by level of government, excluding social security funds (2011)
Source: OECD National Accounts Statistics (database).1 2 http://dx.doi.org/10.1787/888932942754
%
0
5
10
15
20
25
30
35
40
45
50
Netherl
ands
Korea
Japa
n
Austra
lia
Czech
Rep
ublic
Eston
iaIsr
ael
Canad
a
German
y
Sweden
Poland
Slovak
Rep
ublic
New Ze
aland
Finlan
d
United
Kingdo
mOEC
DTu
rkey
Luxe
mbour
g
Icelan
d
United
States
Norway
Hunga
ry
Franc
eSpa
in
Belgium
Sloven
ia
Mexico
Portug
al
Denmark
Switzerl
and
Irelan
d
Austri
aIta
ly
Greece
%
0
10
20
30
40
50
60
70
80
90
100
Sub-central government Central government
Canad
aSpa
in
Belgium Ita
ly
German
y
Switzerl
and
Finlan
d
Austri
a
Sweden
Denmark
Japa
n
Mexico
United
States
Franc
e
Netherl
ands
Poland
Czech
Rep
ublic
OECD
Korea
Slovak
Rep
ublic
Norway
Hunga
ry
Icelan
d
United
Kingdo
m
Sloven
ia
Luxe
mbourg
Eston
ia
Turke
y
Irelan
d
Portug
al
Greece
New Ze
aland
Israe
l
GOVERNMENT AT A GLANCE 2013 © OECD 2013 131

7. PUBLIC PROCUREMENT
Innovative tools in public procurement
Driven by the imperative to increase productivity in timesof austerity, many OECD member countries are investing ininnovative tools to streamline procurement proceduresand achieve greater value for money from procurementspending. In particular, these tools include the increaseduse of e-procurement platforms, framework agreements,pre-qualification systems, electronic reverse auctions andcontracts with options.
E-procurement – the use of information and communica-tion technologies in public procurement – can facilitateaccess to public tenders and increase competition. Inaddition, e-procurement tools can help reduce costs to gov-ernment by reducing administrative burdens, shorteningprocurement contract cycles and raising compliance levels.Many central governments have invested in e-procurementsystems; however, governments have yet to take fulladvantage of the potential benefits of such tools. In OECDmember countries, for instance, e-procurement systemscontinue to be primarily used as platforms to publish infor-mation rather than as a two-way communication tool withsuppliers. While almost all OECD member countries (97%)are announcing tenders in a national e-procurementsystem, only 48% offer potential suppliers the possibility ofsubmitting their bids electronically. The Public Procure-ment Service in Korea is one exception to this trend, havinglaunched a new bidding service in 2011 that allows thebidding process to take place via smartphones throughnewly developed security tokens and applications.
Countries are also implementing new procurement proce-dures to help reduce costs. In order to achieve economies ofscale, almost all OECD member countries (94%) use frame-work agreements. However, only about one-third of OECDmember countries calculate the savings resulting from theuse of these mechanisms to verify whether economies ofscale were achieved. Conversely, fewer than half (42%) ofresponding OECD member countries routinely use electronicreverse auctioning. When using this procurement vehicle,there are both conditions for success and potential adverseimpacts that need to be considered. While savings can beachieved if there is an increase in competition, there are alsoassociated risks such as difficulties for small and medium-sized enterprises – which often have lower productionvolumes and lower profit margins – to compete.
Further reading
European Commission (2011), Evaluation Report: Impact andEffectiveness of EU Public Procurement Legislation Part 1,Commission Staff Working Paper, SEC(2011)853 Final,Brussels.
European Commission (2010), Green Paper on Expanding theUse of E-procurement in the European Union, COM(2010)571Final, Brussels.
OECD (2013, forthcoming), Principles for Integrity in PublicProcurement: Progress in OECD Countries, OECD Publishing,Paris.
Figure and table notes
7.5: Data are unavailable for Greece. All European Union countries mustpublish procurement plans in the European Union public procure-ment website (www.ted.europa/eu). For Japan, the response reflectsthe functionalities of an e-procurement system that is expected to bein operation in 2013.
7.6: All enterprises employ 10 persons or more (excluding the financialsector). Data are unavailable for Australia, Canada, Chile, Israel,Japan, Korea, Mexico, New Zealand, Switzerland, Turkey and theUnited States. Data for Turkey are for 2011 rather than 2012.
Information on data for Israel: http://dx.doi.org/10.1787/888932315602.
Methodology and definitions
Data were collected through the 2011 OECD Survey onReporting Back on the 2008 Procurement Recommen-dation (29 OECD member countries responded), aswell as the 2012 OECD Survey on Public Procurement(33 OECD member countries responded). Respondentsto both surveys were country delegates responsiblefor procurement policies at the central governmentlevel.
In Figure 7.6, e-tendering refers to enterprises usingInternet for offering goods or services in public authori-ties’ electronic procurement systems in their country.
A contract with options refers to a contract underwhich the procuring entity has the option to obtainpredetermined additional goods or services, or toextend the contract by a pre-determined period,under conditions specified in the contract. Anelectronic reverse auction is a real-time purchasingtechnique conducted on line, used by the procuringentity to select the successful submission. It involvesthe presentation by suppliers or contractors ofsuccessively lowered bids during a scheduled periodof time and the automatic evaluation of bids.
The nature of framework agreements varies bycountry, but generally these are agreements betweenprocuring entities and suppliers that establish certainterms and can facilitate the awarding of futurecontracts. Framework agreements are conducted intwo stages: a first stage selects a supplier (or suppliers)or a contractor (or contractors) to be a party (or parties)to a framework agreement with the procuring entity. Ina second stage, a procurement contract is awardedunder the framework agreement to a supplier orcontractor party to the framework agreement.
A prequalification system is intended to identify, atan early stage, those suppliers or contractors that aresuitably qualified to perform the contract.
GOVERNMENT AT A GLANCE 2013 © OECD 2013132
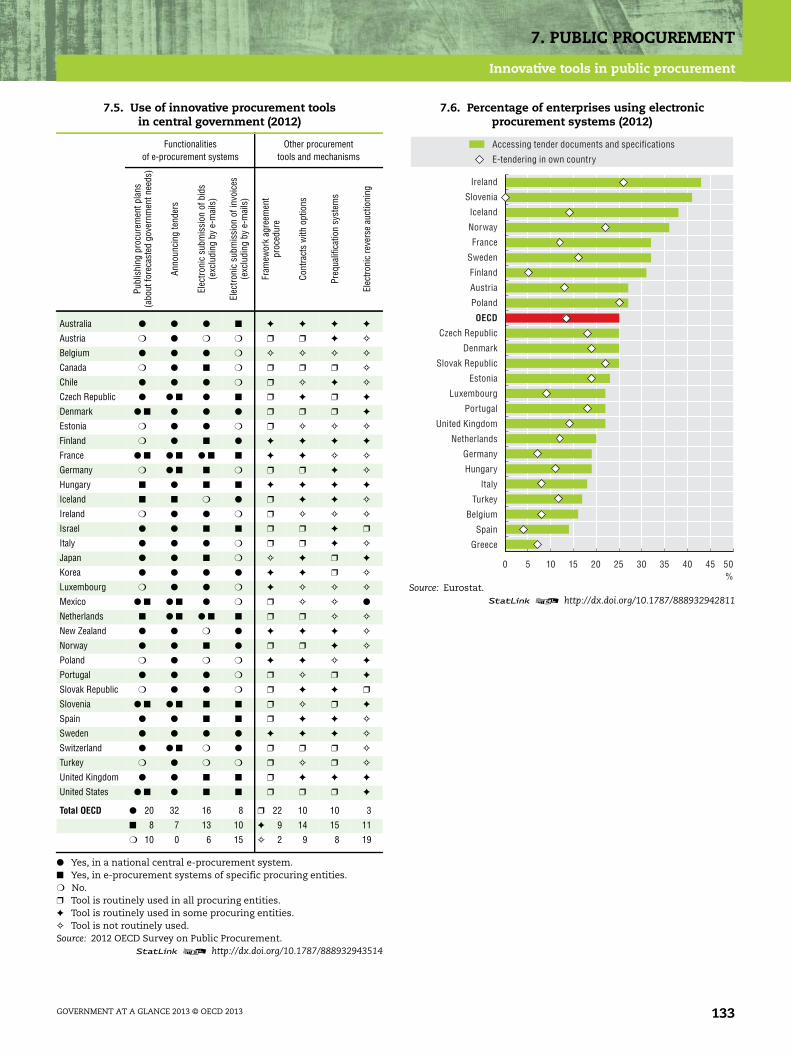
7. PUBLIC PROCUREMENT
Innovative tools in public procurement
7.5. Use of innovative procurement toolsin central government (2012)
Functionalitiesof e-procurement systems
Other procurementtools and mechanisms
Publ
ishi
ngpr
ocur
emen
tpla
ns(a
bout
fore
cast
edgo
vern
men
tnee
ds)
Anno
unci
ngte
nder
s
Elec
troni
csu
bmis
sion
ofbi
ds(e
xclu
ding
bye-
mai
ls)
Elec
troni
csu
bmis
sion
ofin
voic
es(e
xclu
ding
bye-
mai
ls)
Fram
ewor
kag
reem
ent
proc
edur
e
Cont
ract
sw
ithop
tions
Preq
ualif
icat
ion
syst
ems
Elec
troni
cre
vers
eau
ctio
ning
Australia ● ● ● ■ ✦ ✦ ✦ ✦
Austria ❍ ● ❍ ❍ ❒ ❒ ✦ ✧
Belgium ● ● ● ❍ ✧ ✧ ✧ ✧
Canada ❍ ● ■ ❍ ❒ ❒ ❒ ✧
Chile ● ● ● ❍ ❒ ✧ ✦ ✧
Czech Republic ● ● ■ ● ■ ❒ ✦ ❒ ✦
Denmark ● ■ ● ● ● ❒ ❒ ❒ ✦
Estonia ❍ ● ● ❍ ❒ ✧ ✧ ✧
Finland ❍ ● ■ ● ✦ ✦ ✦ ✦
France ● ■ ● ■ ● ■ ■ ✦ ✦ ✧ ✧
Germany ❍ ● ■ ■ ❍ ❒ ❒ ✦ ✧
Hungary ■ ● ■ ■ ✦ ✦ ✦ ✦
Iceland ■ ■ ❍ ● ❒ ✦ ✦ ✧
Ireland ❍ ● ● ❍ ❒ ✧ ✧ ✧
Israel ● ● ■ ■ ❒ ❒ ✦ ❒
Italy ● ● ● ❍ ❒ ❒ ✦ ✧
Japan ● ● ■ ❍ ✧ ✦ ❒ ✦
Korea ● ● ● ● ✦ ✦ ❒ ✧
Luxembourg ❍ ● ● ❍ ✦ ✧ ✧ ✧
Mexico ● ■ ● ■ ● ❍ ❒ ✧ ✧ ●
Netherlands ■ ● ■ ● ■ ■ ❒ ❒ ✧ ✧
New Zealand ● ● ❍ ● ✦ ✦ ✦ ✧
Norway ● ● ■ ● ❒ ❒ ✦ ✧
Poland ❍ ● ❍ ❍ ✦ ✦ ✧ ✦
Portugal ● ● ● ❍ ❒ ✧ ❒ ✦
Slovak Republic ❍ ● ● ❍ ❒ ✦ ✦ ❒
Slovenia ● ■ ● ■ ■ ■ ❒ ✧ ❒ ✦
Spain ● ● ■ ■ ❒ ✦ ✦ ✧
Sweden ● ● ● ● ✦ ✦ ✦ ✧
Switzerland ● ● ■ ❍ ● ❒ ❒ ❒ ✧
Turkey ❍ ● ❍ ❍ ❒ ✧ ❒ ✧
United Kingdom ● ● ■ ■ ❒ ✦ ✦ ✦
United States ● ■ ● ■ ■ ❒ ❒ ❒ ✦
Total OECD ● 20 32 16 8 ❒ 22 10 10 3
■ 8 7 13 10 ✦ 9 14 15 11
❍ 10 0 6 15 ✧ 2 9 8 19
● Yes, in a national central e-procurement system.■ Yes, in e-procurement systems of specific procuring entities.❍ No.❒ Tool is routinely used in all procuring entities.✦ Tool is routinely used in some procuring entities.✧ Tool is not routinely used.Source: 2012 OECD Survey on Public Procurement.
1 2 http://dx.doi.org/10.1787/888932943514
7.6. Percentage of enterprises using electronicprocurement systems (2012)
Source: Eurostat.1 2 http://dx.doi.org/10.1787/888932942811
%0 5 10 15 20 25 30 35 40 45 50
Ireland
Slovenia
Iceland
Norway
France
Sweden
Finland
Austria
Poland
Czech Republic
Denmark
Slovak Republic
Estonia
Luxembourg
Portugal
United Kingdom
Netherlands
Germany
Hungary
Italy
Belgium
Turkey
Spain
Greece
OECD
Accessing tender documents and specifications
E-tendering in own country
GOVERNMENT AT A GLANCE 2013 © OECD 2013 133
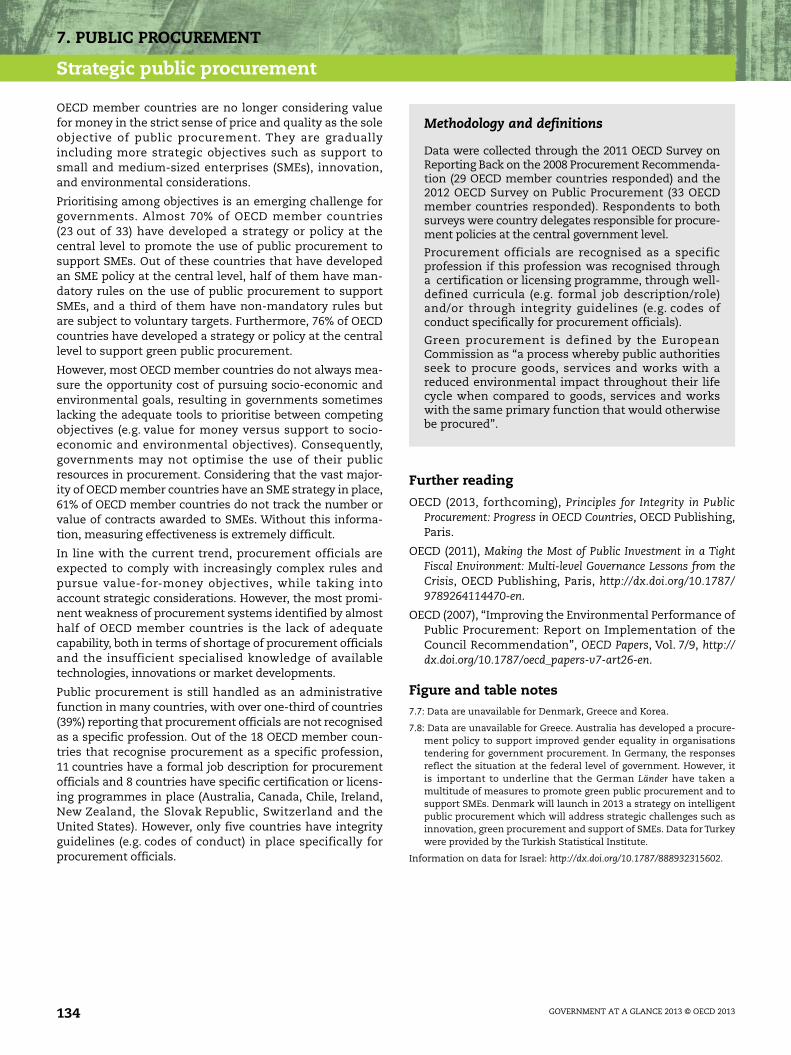
7. PUBLIC PROCUREMENT
Strategic public procurement
OECD member countries are no longer considering valuefor money in the strict sense of price and quality as the soleobjective of public procurement. They are graduallyincluding more strategic objectives such as support tosmall and medium-sized enterprises (SMEs), innovation,and environmental considerations.
Prioritising among objectives is an emerging challenge forgovernments. Almost 70% of OECD member countries(23 out of 33) have developed a strategy or policy at thecentral level to promote the use of public procurement tosupport SMEs. Out of these countries that have developedan SME policy at the central level, half of them have man-datory rules on the use of public procurement to supportSMEs, and a third of them have non-mandatory rules butare subject to voluntary targets. Furthermore, 76% of OECDcountries have developed a strategy or policy at the centrallevel to support green public procurement.
However, most OECD member countries do not always mea-sure the opportunity cost of pursuing socio-economic andenvironmental goals, resulting in governments sometimeslacking the adequate tools to prioritise between competingobjectives (e.g. value for money versus support to socio-economic and environmental objectives). Consequently,governments may not optimise the use of their publicresources in procurement. Considering that the vast major-ity of OECD member countries have an SME strategy in place,61% of OECD member countries do not track the number orvalue of contracts awarded to SMEs. Without this informa-tion, measuring effectiveness is extremely difficult.
In line with the current trend, procurement officials areexpected to comply with increasingly complex rules andpursue value-for-money objectives, while taking intoaccount strategic considerations. However, the most promi-nent weakness of procurement systems identified by almosthalf of OECD member countries is the lack of adequatecapability, both in terms of shortage of procurement officialsand the insufficient specialised knowledge of availabletechnologies, innovations or market developments.
Public procurement is still handled as an administrativefunction in many countries, with over one-third of countries(39%) reporting that procurement officials are not recognisedas a specific profession. Out of the 18 OECD member coun-tries that recognise procurement as a specific profession,11 countries have a formal job description for procurementofficials and 8 countries have specific certification or licens-ing programmes in place (Australia, Canada, Chile, Ireland,New Zealand, the Slovak Republic, Switzerland and theUnited States). However, only five countries have integrityguidelines (e.g. codes of conduct) in place specifically forprocurement officials.
Further reading
OECD (2013, forthcoming), Principles for Integrity in PublicProcurement: Progress in OECD Countries, OECD Publishing,Paris.
OECD (2011), Making the Most of Public Investment in a TightFiscal Environment: Multi-level Governance Lessons from theCrisis, OECD Publishing, Paris, http://dx.doi.org/10.1787/9789264114470-en.
OECD (2007), “Improving the Environmental Performance ofPublic Procurement: Report on Implementation of theCouncil Recommendation”, OECD Papers, Vol. 7/9, http://dx.doi.org/10.1787/oecd_papers-v7-art26-en.
Figure and table notes7.7: Data are unavailable for Denmark, Greece and Korea.
7.8: Data are unavailable for Greece. Australia has developed a procure-ment policy to support improved gender equality in organisationstendering for government procurement. In Germany, the responsesreflect the situation at the federal level of government. However, itis important to underline that the German Länder have taken amultitude of measures to promote green public procurement and tosupport SMEs. Denmark will launch in 2013 a strategy on intelligentpublic procurement which will address strategic challenges such asinnovation, green procurement and support of SMEs. Data for Turkeywere provided by the Turkish Statistical Institute.
Information on data for Israel: http://dx.doi.org/10.1787/888932315602.
Methodology and definitions
Data were collected through the 2011 OECD Survey onReporting Back on the 2008 Procurement Recommenda-tion (29 OECD member countries responded) and the2012 OECD Survey on Public Procurement (33 OECDmember countries responded). Respondents to bothsurveys were country delegates responsible for procure-ment policies at the central government level.
Procurement officials are recognised as a specificprofession if this profession was recognised througha certification or licensing programme, through well-defined curricula (e.g. formal job description/role)and/or through integrity guidelines (e.g. codes ofconduct specifically for procurement officials).
Green procurement is defined by the EuropeanCommission as “a process whereby public authoritiesseek to procure goods, services and works with areduced environmental impact throughout their lifecycle when compared to goods, services and workswith the same primary function that would otherwisebe procured”.
GOVERNMENT AT A GLANCE 2013 © OECD 2013134
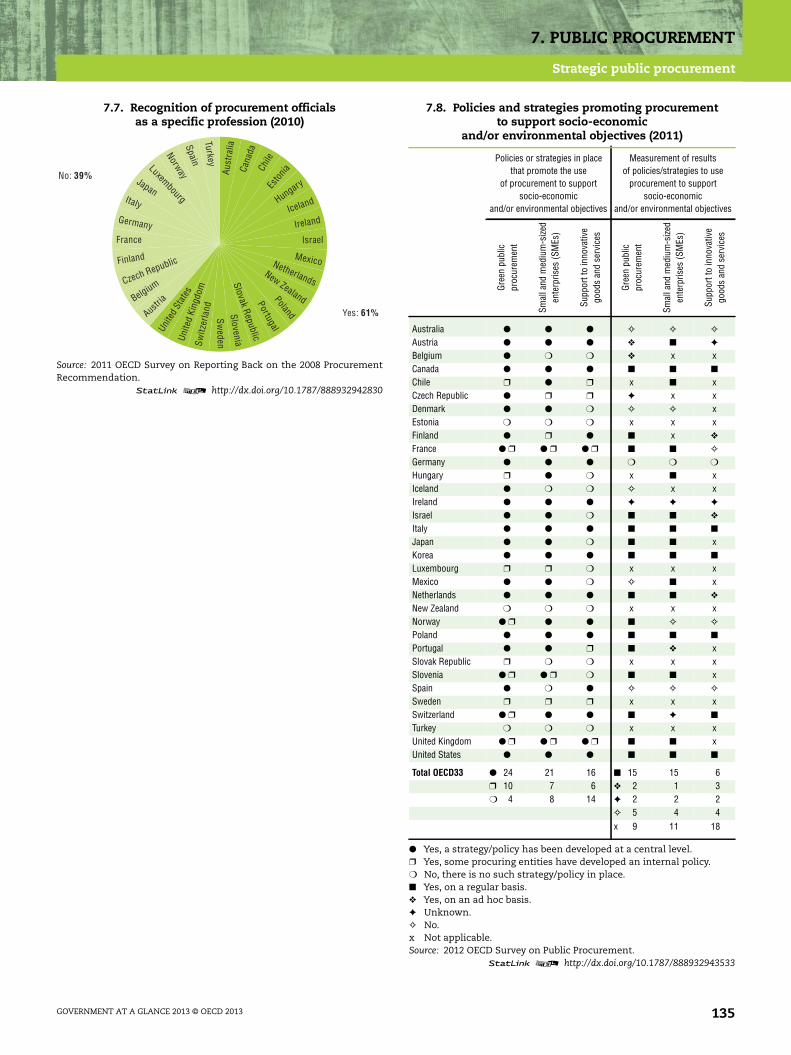
7. PUBLIC PROCUREMENT
Strategic public procurement
7.7. Recognition of procurement officialsas a specific profession (2010)
Source: 2011 OECD Survey on Reporting Back on the 2008 ProcurementRecommendation.
1 2 http://dx.doi.org/10.1787/888932942830
No: 39%
Yes: 61%
Aust
ralia
Cana
daCh
ileEs
tonia
Hungary
Iceland
Ireland
Israel
MexicoNetherlandsNew ZealandPoland
Portugal
Slovak Republic
Slovenia
SwedenSw
itzer
land
Unite
d Ki
ngdo
m
Unite
d St
ates
AustriaBelgiumCzech RepublicFinland
France
Germany
Italy
Japan
LuxembourgNorway
SpainTurkey
7.8. Policies and strategies promoting procurementto support socio-economic
and/or environmental objectives (2011)
Policies or strategies in placethat promote the use
of procurement to supportsocio-economic
and/or environmental objectives
Measurement of resultsof policies/strategies to use
procurement to supportsocio-economic
and/or environmental objectives
Gree
npu
blic
proc
urem
ent
Smal
land
med
ium
-size
den
terp
rises
(SM
Es)
Supp
ortt
oin
nova
tive
good
san
dse
rvic
es
Gree
npu
blic
proc
urem
ent
Smal
land
med
ium
-size
den
terp
rises
(SM
Es)
Supp
ortt
oin
nova
tive
good
san
dse
rvic
es
Australia ● ● ● ✧ ✧ ✧
Austria ● ● ● ❖ ■ ✦
Belgium ● ❍ ❍ ❖ x xCanada ● ● ● ■ ■ ■
Chile ❒ ● ❒ x ■ xCzech Republic ● ❒ ❒ ✦ x xDenmark ● ● ❍ ✧ ✧ xEstonia ❍ ❍ ❍ x x xFinland ● ❒ ● ■ x ❖
France ● ❒ ● ❒ ● ❒ ■ ■ ✧
Germany ● ● ● ❍ ❍ ❍
Hungary ❒ ● ❍ x ■ xIceland ● ❍ ❍ ✧ x xIreland ● ● ● ✦ ✦ ✦
Israel ● ● ❍ ■ ■ ❖
Italy ● ● ● ■ ■ ■
Japan ● ● ❍ ■ ■ xKorea ● ● ● ■ ■ ■
Luxembourg ❒ ❒ ❍ x x xMexico ● ● ❍ ✧ ■ xNetherlands ● ● ● ■ ■ ❖
New Zealand ❍ ❍ ❍ x x xNorway ● ❒ ● ● ■ ✧ ✧
Poland ● ● ● ■ ■ ■
Portugal ● ● ❒ ■ ❖ xSlovak Republic ❒ ❍ ❍ x x xSlovenia ● ❒ ● ❒ ❍ ■ ■ xSpain ● ❍ ● ✧ ✧ ✧
Sweden ❒ ❒ ❒ x x xSwitzerland ● ❒ ● ● ■ ✦ ■
Turkey ❍ ❍ ❍ x x xUnited Kingdom ● ❒ ● ❒ ● ❒ ■ ■ xUnited States ● ● ● ■ ■ ■
Total OECD33 ● 24 21 16 ■ 15 15 6❒ 10 7 6 ❖ 2 1 3❍ 4 8 14 ✦ 2 2 2
✧ 5 4 4x 9 11 18
● Yes, a strategy/policy has been developed at a central level.❒ Yes, some procuring entities have developed an internal policy.❍ No, there is no such strategy/policy in place.■ Yes, on a regular basis.❖ Yes, on an ad hoc basis.✦ Unknown.✧ No.x Not applicable.Source: 2012 OECD Survey on Public Procurement.
1 2 http://dx.doi.org/10.1787/888932943533
GOVERNMENT AT A GLANCE 2013 © OECD 2013 135
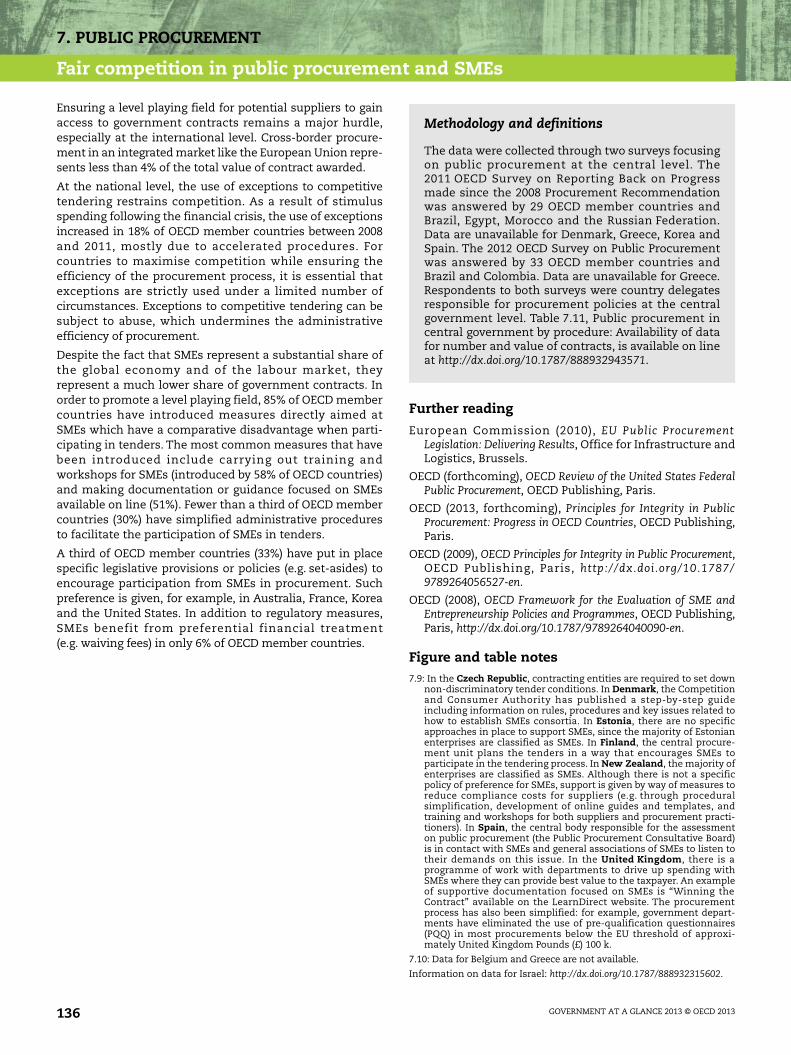
7. PUBLIC PROCUREMENT
Fair competition in public procurement and SMEs
Ensuring a level playing field for potential suppliers to gainaccess to government contracts remains a major hurdle,especially at the international level. Cross-border procure-ment in an integrated market like the European Union repre-sents less than 4% of the total value of contract awarded.
At the national level, the use of exceptions to competitivetendering restrains competition. As a result of stimulusspending following the financial crisis, the use of exceptionsincreased in 18% of OECD member countries between 2008and 2011, mostly due to accelerated procedures. Forcountries to maximise competition while ensuring theefficiency of the procurement process, it is essential thatexceptions are strictly used under a limited number ofcircumstances. Exceptions to competitive tendering can besubject to abuse, which undermines the administrativeefficiency of procurement.
Despite the fact that SMEs represent a substantial share ofthe global economy and of the labour market, theyrepresent a much lower share of government contracts. Inorder to promote a level playing field, 85% of OECD membercountries have introduced measures directly aimed atSMEs which have a comparative disadvantage when parti-cipating in tenders. The most common measures that havebeen introduced include carrying out training andworkshops for SMEs (introduced by 58% of OECD countries)and making documentation or guidance focused on SMEsavailable on line (51%). Fewer than a third of OECD membercountries (30%) have simplified administrative proceduresto facilitate the participation of SMEs in tenders.
A third of OECD member countries (33%) have put in placespecific legislative provisions or policies (e.g. set-asides) toencourage participation from SMEs in procurement. Suchpreference is given, for example, in Australia, France, Koreaand the United States. In addition to regulatory measures,SMEs benefit from preferential financial treatment(e.g. waiving fees) in only 6% of OECD member countries.
Further reading
European Commission (2010), EU Public ProcurementLegislation: Delivering Results, Office for Infrastructure andLogistics, Brussels.
OECD (forthcoming), OECD Review of the United States FederalPublic Procurement, OECD Publishing, Paris.
OECD (2013, forthcoming), Principles for Integrity in PublicProcurement: Progress in OECD Countries, OECD Publishing,Paris.
OECD (2009), OECD Principles for Integrity in Public Procurement,OECD Publishing, Paris, http://dx.doi.org/10.1787/9789264056527-en.
OECD (2008), OECD Framework for the Evaluation of SME andEntrepreneurship Policies and Programmes, OECD Publishing,Paris, http://dx.doi.org/10.1787/9789264040090-en.
Figure and table notes7.9: In the Czech Republic, contracting entities are required to set down
non-discriminatory tender conditions. In Denmark, the Competitionand Consumer Authority has published a step-by-step guideincluding information on rules, procedures and key issues related tohow to establish SMEs consortia. In Estonia, there are no specificapproaches in place to support SMEs, since the majority of Estonianenterprises are classified as SMEs. In Finland, the central procure-ment unit plans the tenders in a way that encourages SMEs toparticipate in the tendering process. In New Zealand, the majority ofenterprises are classified as SMEs. Although there is not a specificpolicy of preference for SMEs, support is given by way of measures toreduce compliance costs for suppliers (e.g. through proceduralsimplification, development of online guides and templates, andtraining and workshops for both suppliers and procurement practi-tioners). In Spain, the central body responsible for the assessmenton public procurement (the Public Procurement Consultative Board)is in contact with SMEs and general associations of SMEs to listen totheir demands on this issue. In the United Kingdom, there is aprogramme of work with departments to drive up spending withSMEs where they can provide best value to the taxpayer. An exampleof supportive documentation focused on SMEs is “Winning theContract” available on the LearnDirect website. The procurementprocess has also been simplified: for example, government depart-ments have eliminated the use of pre-qualification questionnaires(PQQ) in most procurements below the EU threshold of approxi-mately United Kingdom Pounds (£) 100 k.
7.10: Data for Belgium and Greece are not available.
Information on data for Israel: http://dx.doi.org/10.1787/888932315602.
Methodology and definitions
The data were collected through two surveys focusingon public procurement at the central level. The2011 OECD Survey on Reporting Back on Progressmade since the 2008 Procurement Recommendationwas answered by 29 OECD member countries andBrazil, Egypt, Morocco and the Russian Federation.Data are unavailable for Denmark, Greece, Korea andSpain. The 2012 OECD Survey on Public Procurementwas answered by 33 OECD member countries andBrazil and Colombia. Data are unavailable for Greece.Respondents to both surveys were country delegatesresponsible for procurement policies at the centralgovernment level. Table 7.11, Public procurement incentral government by procedure: Availability of datafor number and value of contracts, is available on lineat http://dx.doi.org/10.1787/888932943571.
GOVERNMENT AT A GLANCE 2013 © OECD 2013136
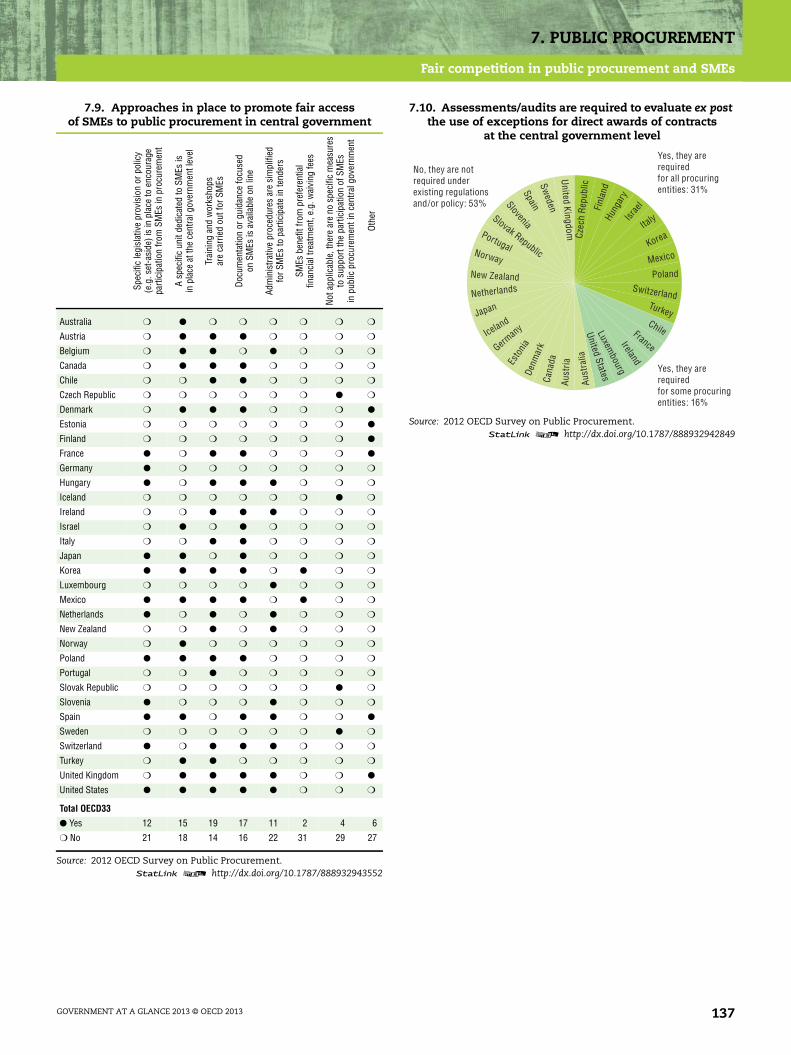
7. PUBLIC PROCUREMENT
Fair competition in public procurement and SMEs
7.9. Approaches in place to promote fair accessof SMEs to public procurement in central government
Spec
ific
legi
slat
ive
prov
isio
nor
polic
y(e
.g.s
et-a
side
)is
inpl
ace
toen
cour
age
parti
cipa
tion
from
SMEs
inpr
ocur
emen
t
Asp
ecifi
cun
itde
dica
ted
toSM
Esis
inpl
ace
atth
ece
ntra
lgov
ernm
entl
evel
Trai
ning
and
wor
ksho
psar
eca
rrie
dou
tfor
SMEs
Docu
men
tatio
nor
guid
ance
focu
sed
onSM
Esis
avai
labl
eon
line
Adm
inis
trativ
epr
oced
ures
are
sim
plifi
edfo
rSM
Esto
parti
cipa
tein
tend
ers
SMEs
bene
fitfro
mpr
efer
entia
lfin
anci
altre
atm
ent,
e.g.
wai
ving
fees
Nota
pplic
able
,the
rear
eno
spec
ific
mea
sure
sto
supp
ortt
hepa
rtici
patio
nof
SMEs
inpu
blic
proc
urem
enti
nce
ntra
lgov
ernm
ent
Othe
r
Australia ❍ ● ❍ ❍ ❍ ❍ ❍ ❍
Austria ❍ ● ● ● ❍ ❍ ❍ ❍
Belgium ❍ ● ● ❍ ● ❍ ❍ ❍
Canada ❍ ● ● ● ❍ ❍ ❍ ❍
Chile ❍ ❍ ● ● ❍ ❍ ❍ ❍
Czech Republic ❍ ❍ ❍ ❍ ❍ ❍ ● ❍
Denmark ❍ ● ● ● ❍ ❍ ❍ ●
Estonia ❍ ❍ ❍ ❍ ❍ ❍ ❍ ●
Finland ❍ ❍ ❍ ❍ ❍ ❍ ❍ ●
France ● ❍ ● ● ❍ ❍ ❍ ●
Germany ● ❍ ❍ ❍ ❍ ❍ ❍ ❍
Hungary ● ❍ ● ● ● ❍ ❍ ❍
Iceland ❍ ❍ ❍ ❍ ❍ ❍ ● ❍
Ireland ❍ ❍ ● ● ● ❍ ❍ ❍
Israel ❍ ● ❍ ● ❍ ❍ ❍ ❍
Italy ❍ ❍ ● ● ❍ ❍ ❍ ❍
Japan ● ● ❍ ● ❍ ❍ ❍ ❍
Korea ● ● ● ● ❍ ● ❍ ❍
Luxembourg ❍ ❍ ❍ ❍ ● ❍ ❍ ❍
Mexico ● ● ● ● ❍ ● ❍ ❍
Netherlands ● ❍ ● ❍ ● ❍ ❍ ❍
New Zealand ❍ ❍ ● ❍ ● ❍ ❍ ❍
Norway ❍ ● ❍ ❍ ❍ ❍ ❍ ❍
Poland ● ● ● ● ❍ ❍ ❍ ❍
Portugal ❍ ❍ ● ❍ ❍ ❍ ❍ ❍
Slovak Republic ❍ ❍ ❍ ❍ ❍ ❍ ● ❍
Slovenia ● ❍ ❍ ❍ ● ❍ ❍ ❍
Spain ● ● ❍ ● ● ❍ ❍ ●
Sweden ❍ ❍ ❍ ❍ ❍ ❍ ● ❍
Switzerland ● ❍ ● ● ● ❍ ❍ ❍
Turkey ❍ ● ● ❍ ❍ ❍ ❍ ❍
United Kingdom ❍ ● ● ● ● ❍ ❍ ●
United States ● ● ● ● ● ❍ ❍ ❍
Total OECD33
● Yes 12 15 19 17 11 2 4 6
❍ No 21 18 14 16 22 31 29 27
Source: 2012 OECD Survey on Public Procurement.1 2 http://dx.doi.org/10.1787/888932943552
7.10. Assessments/audits are required to evaluate ex postthe use of exceptions for direct awards of contracts
at the central government level
Source: 2012 OECD Survey on Public Procurement.1 2 http://dx.doi.org/10.1787/888932942849
No, they are notrequired underexisting regulationsand/or policy: 53%
Yes, they arerequiredfor all procuringentities: 31%
Yes, they arerequiredfor some procuringentities: 16%
Czec
h R
epub
licFi
nlan
dHu
ngar
yIsr
ael
Italy
Korea
Mexico
PolandSwitzerland
TurkeyChileFranceIreland
Luxembourg
United States
Aust
ralia
Aust
ria
Cana
da
Denm
ark
Esto
niaGerman
yIcelandJapan
NetherlandsNew Zealand
Norway
Portugal
Slovak Republic
SloveniaSpain
Sweden
United Kingdom
GOVERNMENT AT A GLANCE 2013 © OECD 2013 137


GOVERNMENT AT A GLANCE 2013 © OEC
8. OPEN AND INCLUSIVE GOVERNMENT
Citizens expect openness and inclusiveness from government: a systemic, comprehensiveapproach to institutionalising a two-way communication with stakeholders, whereby relevant,usable information is provided, and interaction is fostered as a means to improvetransparency, accountability and engagement. More open and inclusive policy-makingprocesses help to ensure that policies are better informed and will better match citizens’ needs.Facilitating the participation of citizens can enhance democratic engagement, build trust ingovernment and harness productive forms of responsibility, including in the delivery of publicservices. Access to information and open data policies are key concrete pillars for promotingopen government. An important additional contributor to openness is budget transparency, asthe budget is where policy objectives are reconciled and implemented in monetary terms.However, transparency does not automatically drive greater accountability. A government canbe open, in the sense of being transparent, even if it does not embrace new technology. Agovernment can provide open data and still remain deeply opaque and unaccountable.Inclusive policy making focuses on evaluating the impact of policies on key groups of societythat might be disadvantaged by that impact.
D 2013 139

8. OPEN AND INCLUSIVE GOVERNMENT
Open government data
Public organisations produce and collect a broad range of datain order to perform their tasks. Sharing these data with thepublic leads to greater transparency and increases publicawareness of government activities. Open government data(OGD) can also help generate insights on how to improve gov-ernment performance and hold governments accountable.OGD provide also the basis for meaningful public participa-tion and collaboration in the creation of innovative, respon-sive and value-added services and policies, and are ultimatelyexpected to improve the decision making of both govern-ments and individuals. The public shall be able to use govern-ment data for making more informed decisions that couldincrease the quality of their lives; while governments areexpected to more easily access a wider range of datasets tofoster evidence-based decision making. Finally, OGD are seenas a potential source of economic growth, and as a basis fornew forms of entrepreneurships and social innovation.
Nonetheless, OGD are still an emerging domain; the compa-rability of assessment of government performance in theprovision and quality of open data faces various challenges.First, strategies and policies on open government data arein constant evolution. Moreover, the administration andproduction of OGD is often delegated to regional and locallevels of government. Third, there are no commonly agreedinternational definitions, e.g. of a dataset.
OECD member countries are increasingly taking a strategicapproach to OGD: 56% of the countries have a nationalstrategy, 12% indicate the existence of separate strategies forindividual line ministries, and 28% specify the co-existenceof these strategies. Only in 4% of the countries are OGDstrategies absent.
Main strategic objectives related to OGD vary across OECDcountries. Most member countries appear to prioritise trans-parency and openness, volume increase for private sectorbusinesses and creation of new businesses. The potential ofOGD for improved service delivery seems also to be appre-ciated, whereas citizen engagement in public debates anddecision-making processes does not appear among the toppriorities. Understanding the main objectives is essential toidentify what type of data should be prioritised for releaseand in which format, as achievement of different objectivesrequires opening up different datasets. While accountabilityand transparency can be served by releasing aggregateddata, boosting economic growth may entail realising specificdatasets at a more granular level.
Data availability, accessibility and relevance for the users areessential for value creation. In terms of availability, Canada,the Netherlands, Slovenia and the United States appear tohave the most numerous datasets on their centralised“one-stop shop” OGD portal. However, cross-country compa-risons on dataset supply should be made with caution inorder to accommodate national differences in the concept ofdatasets applied, and in the publication model chosen,i.e. centralised “one-stop shop” OGD portal versus opengovernment portals of local authorities.
Further reading
Ubaldi, B. (2013), “Open Government Data: Towards EmpiricalAnalysis of Open Government Data Initiatives”, OECDWorking Papers on Public Governance, No. 22, OECD Publish-ing, Paris, http://dx.doi.org/10.1787/5k46bj4f03s7-en.
Figure and table notes
8.1: Data are unavailable for countries without a centralised “one-stopshop” open government data portal: Estonia, Finland, Ireland, Japan,and Switzerland. Data are unavailable for Australia, Denmark, Franceand Germany. Data for Australia cover only the Federal governmentdata initiative (http://data.gov.au). Data for Spain cover only the Centralgovernment data initiative (http://datos.gob.es).
8.2: Switzerland and Egypt do not have OGD policies/strategies currentlyin place in central/federal government.
Information on data for Israel: http://dx.doi.org/10.1787/888932315602.
Methodology and definitions
Data have been collected through the 2013 OECD Surveyon Open Government Data that focused on the avail-ability of public sector information at the central/federallevel. The survey collected responses from 25 OECDcountries and Egypt, the Russian Federation andUkraine. Respondents were delegates from countriesresponsible for e-government and public sectorinformation.
The definition of Open Government data includes bothany data and information produced or commissionedby public bodies and data that can be freely used,re-used and distributed by anyone, subject only – atthe most – to the requirement to attribute the sourceand share the same way. A dataset is conceived as acollection of data, usually presented in tabular form.
The policy objectives correspond to the open govern-ment data policy/strategy in place at the central/federallevel in the country. Countries were asked in the surveyto list the top five objectives in their policy; thereforeother objectives might apply. Re-use of governmentdata refers to inclusion of publicly released data andinformation in contexts different from their initialpurpose (like software development and press releases)and can be forbidden through copyright laws or allowedthrough licensing statements.
Table 8.3, Availability of Open Format Data on LineMinistries’ Websites (2013), is available on line at http://dx.doi.org/10.1787/888932943609.
GOVERNMENT AT A GLANCE 2013 © OECD 2013140

8. OPEN AND INCLUSIVE GOVERNMENT
Open government data
8.1. Number of datasets in centralised “one-stop shop” open government data portal (2013)
Source: 2013 OECD Survey on Open Government Data.1 2 http://dx.doi.org/10.1787/888932942868
8.2. Top five principal objectives of central/federal government open government data strategy (2013)
Increasetransparency
Increaseopenness
Improvepublic sector
performance bystrengtheningaccountabilityfor outputs/outcomes
Deliver publicservices more
effectivelyand efficientlyby improving
internaloperations andcollaboration
Deliver publicservices more
effectivelyand efficientlyby enabling
deliveryfrom private
sector throughdata re-use
Createeconomic valuefor the public
sector
Createeconomic valuefor the privatesector/increase
the volumeof private
sector businessactivity
Facilitatecreationof new
businesses
Facilitate citizenparticipation
in public debate
Enable citizenengagement in
decision-makingprocesses
Australia ❍ ● ❍ ● ● ❍ ● ❍ ❍ ●
Austria ● ● ❍ ❍ ● ❍ ● ❍ ● ❍
Belgium ❍ ● ❍ ● ● ❍ ● ● ❍ ❍
Canada ❍ ● ● ● ❍ ❍ ● ❍ ● ❍
Chile ● ❍ ● ❍ ● ❍ ❍ ❍ ● ●
Denmark ❍ ❍ ❍ ● ● ❍ ● ● ❍ ❍
Estonia ● ● ● ❍ ● ❍ ● ❍ ❍ ❍
Finland ● ❍ ● ❍ ● ❍ ● ● ❍ ❍
France ● ❍ ● ● ❍ ❍ ● ● ❍ ❍
Germany ● ❍ ❍ ● ❍ ❍ ❍ ● ● ●
Ireland ● ● ❍ ● ● ❍ ❍ ● ❍ ❍
Israel ● ● ❍ ● ● ❍ ❍ ● ❍ ❍
Italy ❍ ● ● ● ❍ ❍ ● ● ❍ ❍
Japan ● ● ❍ ❍ ● ❍ ● ● ❍ ❍
Korea ● ● ❍ ❍ ● ❍ ● ● ❍ ❍
Mexico ● ● ● ❍ ❍ ❍ ❍ ❍ ● ❍
Netherlands ❍ ● ● ❍ ❍ ❍ ● ❍ ● ❍
New Zealand ● ❍ ❍ ● ❍ ❍ ● ❍ ● ●
Norway ● ❍ ❍ ● ● ❍ ● ● ❍ ❍
Portugal ❍ ● ❍ ● ❍ ❍ ❍ ● ❍ ●
Slovenia ● ● ❍ ❍ ● ❍ ❍ ● ❍ ●
Spain ● ● ● ❍ ❍ ❍ ● ● ❍ ❍
Sweden ● ● ● ● ❍ ❍ ❍ ● ❍ ❍
Switzerland x x x x x x x x x xUnited Kingdom ● ❍ ● ● ❍ ❍ ● ❍ ❍ ●
Egypt x x x x x x x x x xRussian Federation ● ● ❍ ❍ ❍ ● ❍ ● ● ❍
Ukraine ● ❍ ❍ ● ❍ ● ● ❍ ● ❍
Total OECD 17 16 11 14 13 0 16 15 7 7
● Yes❍ NoSource: 2013 OECD Survey on Open Government Data.
1 2 http://dx.doi.org/10.1787/888932943590
0
2 000
4 000
6 000
8 000
10 000
1 000
3 000
5 000
7 000
9 000
CANGBR
NLD DEU SVNNZL CHL
MEXES
PNOR
KORAUT
AUSPRT ITA BEL ISR
EGY
188 921
9 782
4 3853 783
3 317
2 3231 948
1 338944 849 694 568 540 486 347 185 119 359
Number of datasets
GOVERNMENT AT A GLANCE 2013 © OECD 2013 141

8. OPEN AND INCLUSIVE GOVERNMENT
Conflict of interest and asset disclosure
Growing expectations of open and fair public decisionmaking, particularly following the financial and economiccrisis, have put mounting pressure on governments toensure that official decisions are not improperly affected byprivate interests. At the same time, new forms of partner-ship between governments and the private and non-profitsectors increase the complexity for policy makers and publicmanagers in ensuring integrity of these transactions. Safe-guarding the integrity of government decision making istherefore essential for restoring trust in government.
A conflict of interest arises when a public official’s privateinterests could potentially compromise his or her perfor-mance. If not adequately identified and managed, conflict-of-interest situations could lead to corruption. At the same time,an excessively strict approach can be costly and unworkable,and may deter experienced and competent potentialcandidates from entering public office or public service.
Practice shows that asset and private interest disclosure bydecision makers continues to be an essential tool for mana-ging conflict of interest. Figure 8.4 presents an aggregate ofthe level of disclosure and public availability of disclosedinformation by top decision makers in the three branches ofgovernment (executive, legislature and judiciary). The levelsare determined by whether top decision makers are requiredto disclose such private interests as their assets, liabilities,income source and amount, paid and unpaid outside posi-tions, gifts and previous employment.
Although asset and private interest disclosure by decision-makers continues to be common practice in OECD countries,there are different levels of disclosure in the three branchesof government. Disclosure practices are considerably higherin the executive and legislative branches than in thejudiciary. For example, disclosure is not required for judgesand prosecutors in the Czech Republic, France, Luxembourgand New Zealand. In Luxembourg, there are no disclosurerequirements for decision makers in any of the threebranches of government. Of the private interests covered,countries give the highest attention to paid outside positionsas well as the receipt of gifts, by either prohibiting these orby requesting their disclosure.
Much variation also exists in OECD member countries interms of the public availability of disclosed information bydecision-makers. In the majority of countries, information isonly partially made available to the public. In certaincountries, this is a result of the degree of importance assignedto privacy concerns. The vast majority of countries makeinformation on assets and income source publicly available.Previous employment and liabilities are made publiclyavailable by few countries.
Following the collection of disclosure forms, just over80% of OECD countries that have disclosure requirementsin place verify that disclosure forms are submitted(Table 8.5). However, less than half perform internal auditsof the submitted information for accuracy. No actions aretaken following the collection of the disclosure forms inIreland, Italy, Switzerland and Turkey. However, in Ireland
and Italy, most of the disclosed information is available tothe public, allowing citizens themselves to scrutinise theinformation submitted.
Further reading
OECD (2010), Post-Public Employment: Good Practices forPreventing Conflict of Interest, OECD Publishing, Paris,http://dx.doi.org/10.1787/9789264056701-en.
OECD (2007), OECD Guidelines for Managing Conflict of Interest inthe Public Service: Report on Implementation, OECD Publishing,Paris.
OECD (2003), Recommendation of the Council on Guidelines forManaging Conflict of Interest in the Public Service, OECDPublishing, Paris.
Figure and table notes
8.4: Data for Brazil, the Czech Republic, Greece, Israel, and theRussian Federation refer to 2010 rather than 2012. Data reflect practicesin member countries. Country-specific data and notes are available inAnnex E.
8.5: Data for the Czech Republic, Greece, and Israel are not available. ForAustralia, Austria, Canada, Chile, Denmark, Estonia, Germany, Hungary,Italy, Japan, Korea, Luxembourg, Mexico, Norway, the Slovak Republic,Spain, Switzerland, Turkey and the United States, information providedonly refers to the executive branch of government.
Information on data for Israel: http://dx.doi.org/10.1787/888932315602.
Methodology and definitions
Data refer to 2012 and were collected via the OECDSurvey on Managing Conflict of Interest. Respondents tothe survey were country delegates responsible forintegrity policies in central/federal government.
The term “public official” is defined as any personholding a legislative, executive, administrative orjudicial office of a country, whether appointed orelected, whether permanent or temporary, whetherpaid or unpaid, irrespective of that person’s seniority;and any other person who performs a public function,including for a public agency or public enterprise, orprovides a public service, as defined in the domesticlaw of the country. For decision makers, the term“executive branch” covers the positions of president,prime minister, and ministers or members of cabinet.The term “legislative branch” covers the positions ofupper and lower house legislators. The term “judicialbranch” covers judges and prosecutors.
When calculating an aggregate of the country-specificdata, all private interests and all positions were deemedequally important and were therefore assigned thesame weights. Annex E provides detailed data onconflict-of-interest disclosure.
GOVERNMENT AT A GLANCE 2013 © OECD 2013142
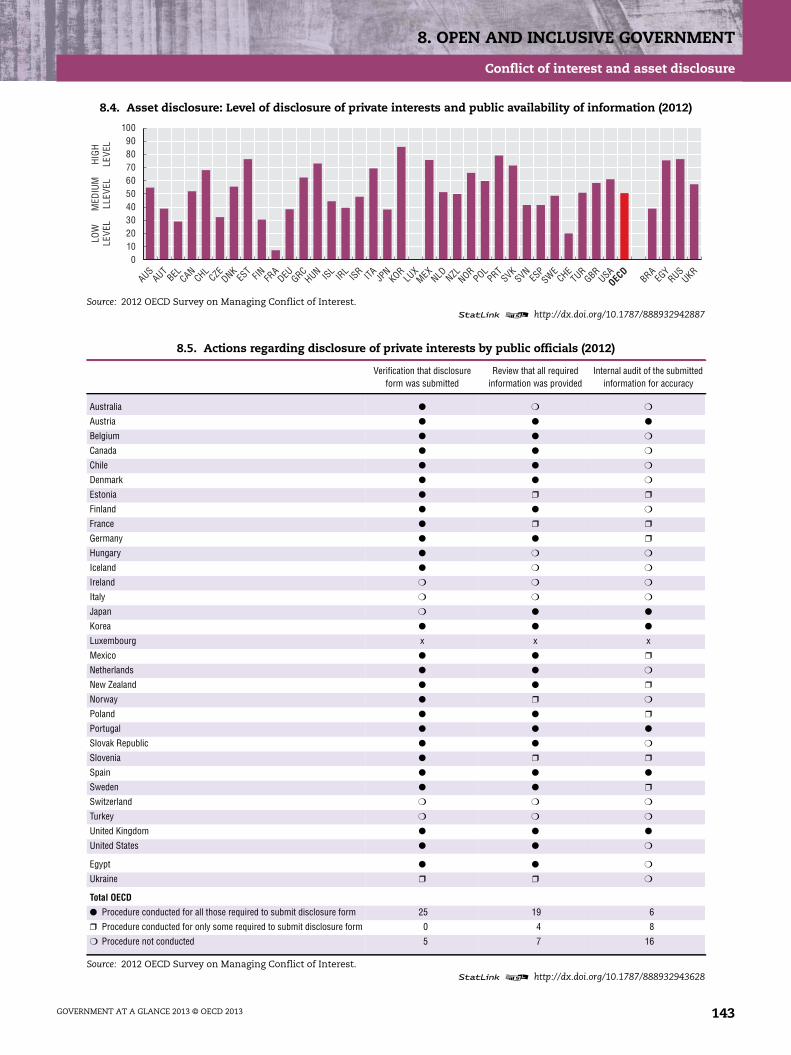
8. OPEN AND INCLUSIVE GOVERNMENT
Conflict of interest and asset disclosure
8.4. Asset disclosure: Level of disclosure of private interests and public availability of information (2012)
Source: 2012 OECD Survey on Managing Conflict of Interest.1 2 http://dx.doi.org/10.1787/888932942887
8.5. Actions regarding disclosure of private interests by public officials (2012)
Verification that disclosureform was submitted
Review that all requiredinformation was provided
Internal audit of the submittedinformation for accuracy
Australia ● ❍ ❍
Austria ● ● ●
Belgium ● ● ❍
Canada ● ● ❍
Chile ● ● ❍
Denmark ● ● ❍
Estonia ● ❒ ❒
Finland ● ● ❍
France ● ❒ ❒
Germany ● ● ❒
Hungary ● ❍ ❍
Iceland ● ❍ ❍
Ireland ❍ ❍ ❍
Italy ❍ ❍ ❍
Japan ❍ ● ●
Korea ● ● ●
Luxembourg x x x
Mexico ● ● ❒
Netherlands ● ● ❍
New Zealand ● ● ❒
Norway ● ❒ ❍
Poland ● ● ❒
Portugal ● ● ●
Slovak Republic ● ● ❍
Slovenia ● ❒ ❒
Spain ● ● ●
Sweden ● ● ❒
Switzerland ❍ ❍ ❍
Turkey ❍ ❍ ❍
United Kingdom ● ● ●
United States ● ● ❍
Egypt ● ● ❍
Ukraine ❒ ❒ ❍
Total OECD
● Procedure conducted for all those required to submit disclosure form 25 19 6
❒ Procedure conducted for only some required to submit disclosure form 0 4 8
❍ Procedure not conducted 5 7 16
Source: 2012 OECD Survey on Managing Conflict of Interest.1 2 http://dx.doi.org/10.1787/888932943628
AUSAUT
BEL CANCHL
CZEDNK
EST FIN FR
ADEU GRC
HUN ISLIR
LISR ITA JP
NKOR
LUX
MEXNLD NZL NOR
POLPRT
SVKSVN
ESP
SWECHE
TURGBR
USABRA
EGY
RUSUKR
0102030405060708090
100
HIG
HLE
VEL
MED
IUM
LLEV
ELLO
WLE
VEL
OECD
GOVERNMENT AT A GLANCE 2013 © OECD 2013 143

8. OPEN AND INCLUSIVE GOVERNMENT
Budget transparency
The national budget is one of the principal policy docu-ments of government, reflecting its policy objectives andspending priorities. Budget transparency – the disclosureand accessibility of key fiscal and budgetary information –is therefore at the core of good governance. The economicand social crisis underscored the need for greater budgettransparency, and it has become a core component ofcountries’ strategies for open government. The “OECD BestPractices for Budget Transparency” explicitly recognise theimportance of disclosing government budgetary informa-tion in a timely and systematic manner, as well as the needto ensure the quality, integrity and, very importantly, theaccessibility of this information in order to inform citizensand the legislature and hold government accountable.
Publicly available, comprehensive budget documentationcan make it easier for the public to understand fiscal policiesand government priorities. Budget disclosures can contrib-ute to fiscal discipline, the effective allocation of resourcesand operational efficiency. They can also enable govern-ments to be held accountable for producing realistic andsustainable budgets, and for the social and economic impactof planned policy measures. Because the availability of infor-mation within the budget document does not necessarilyassure its accuracy, budget transparency also allowscitizens, legislators and civil society organisations to usebudget information to hold the government accountable forachieving better budget outcomes. In such ways, budgettransparency also contributes to trust in government.
A key aspect of transparency is the extent to which theexecutive’s budget provides information on the budgetframework and the government’s policies and priorities.Countries vary in the amount and types of informationprovided. While fiscal policy objectives, macroeconomicassumptions, and medium-term perspective (see indicatoron MTEFs) are common in the budgets of all OECD membercountries, fewer countries include information on taxexpenditures, performance information and long-termfiscal projections. Arguably, there is no single factor moreresponsible for derailing fiscal objectives and projections ofdeficits or surpluses than the use of weak macroeconomicassumptions. According to survey results, around 95% ofOECD member countries make the medium-term fiscalpolicy objectives, the proposed and approved budgetspublicly available. The transparency of off-budget or extra-budgetary expenditures is also important, since incentivesmay exist to keep such appropriations off of the balancesheets. The most common off-budget expenditures inmember countries are social security funds (13 countries),public health care funds (10 countries), and loan guaran-tees (9 countries). The majority of these countries includethese expenditures in the budget, although exceptionsexist (see online Table 8.8).
While disclosure of government fiscal and budgetary infor-mation is essential and growing, it can also be complex andinadvertently reduce transparency and accountability.Indeed, non-expert audiences can easily be intimidated bytechnical language and by the volume of budget informa-tion presented to legislatures, or confused by the role and
extent of extra-budgetary activities. Some OECD membercountries (14) publish citizens’ budgets-easy to understandsummary documents of the main features of the annualbudget as presented to the legislature, including explana-tions and definitions of technical terms.
Further reading
IMF (2001, 2007), Manual on Fiscal Transparency, InternationalMonetary Fund, Washington, DC.
OECD (2013, forthcoming), Budgeting Practices and Proceduresin OECD Countries, OECD Publishing, Paris.
OECD (2002), “OECD Best Practices for Budget Transparency”,OECD Journal on Budgeting, Vol. 1/3, pp. 7-14, http://dx.doi.org/10.1787/budget-v1-art14-en.
Figure and table notes
Data unavailable for Iceland.
Information on data for Israel: http://dx.doi.org/10.1787/888932315602.
Methodology and definitions
Data refer to 2012 and draw upon country responses toquestions from the 2012 OECD Survey on BudgetingPractices and Procedures. Survey respondents werepredominately senior budget officials in OECDmember countries. Responses represent the countries’own assessments of current practices and procedures.Data refer only to central/federal governments andexclude budgeting practices at state/local levels.
Off-budget funds are special funds owned by thegovernment that are not part of the budget and thatreceive revenues from earmarked levies, possibly inaddition to other sources such as fees and contribu-tions from the general tax fund. Earmarked levies aredifferent from fees in that they do not reflect themarket value of the services that are financed fromthe revenues. In particular, they may be lower orhigher in view of social considerations.
A citizens’ guide to the budget is defined here as aneasy-to-understand summary of the main features ofthe annual budget as presented to the legislature. Itshould be a self-contained document that explainswhat is in the annual budget proposals and what theireffects are expected to be. While containing links orreferences to more detailed documents, the guideshould not require readers to refer to them, or to knowtheir contents, in order to understand the guide.
Table 8.8, Inclusion of off-budgetary expenditures in thebudget documentation, is available on line at http://dx.doi.org/10.1787/888932943666.
GOVERNMENT AT A GLANCE 2013 © OECD 2013144

8. OPEN AND INCLUSIVE GOVERNMENT
Budget transparency
8.6. Use of citizens’ budgets in OECD countries (2012)
Source: 2012 OECD Survey on Budgeting Practices and Procedures.1 2 http://dx.doi.org/10.1787/888932942906
Belg
ium
Czec
h Re
publ
icDe
nmar
kFr
ance
German
y
Greece
Hungary
Ireland
Luxembourg
PolandPortugal
Slovak RepublicSloveniaSpain
Switzerland
Turkey
United KingdomU
nited StatesAust
ralia
Aust
ria
Cana
daChileEstoniaFinland
IsraelItaly
Japan
Korea
Mexico
Netherlands
New ZealandNorway
Sweden
Russian Federation
Countrieswithout citizens’budgets: 18
Countrieswith citizens’budgets: 16
8.7. Budgetary information made publicly available (2012)
Med
ium
-term
fisca
lpol
icy
obje
ctiv
es
Budg
etpr
opos
al
Appr
oved
budg
et
Met
hodo
logy
and
econ
omic
assu
mpt
ions
fore
stab
lishi
ngfis
calp
roje
ctio
ns
Sens
itivi
tyan
alys
esof
fisca
lan
d/or
mac
roec
onom
icm
odel
s
Budg
etci
rcul
ar
Inde
pend
entr
evie
ws/
anal
yses
Pre-
budg
etre
port
Long
-term
pers
pect
ive
onto
tal
reve
nue
and
expe
nditu
re
Australia ● ● ● ● ● ❍ ❍ x ●
Austria ● ● ● ● ❍ ❍ ● x ●
Belgium ● ● ● ● x ● ● x x
Canada ● ● ● ● ● x ● x ●
Chile ● ● ● ● ❍ ● x ● x
Czech Republic ● ● ● ● ● ❍ ● x ❍
Denmark ● ● ● ● ❍ ❍ ❍ x x
Estonia ● ● ● ● ● ❍ ❍ ● x
Finland ● ● ● ● ❍ ● x x ●
France ● ● ● ● ● ● ● ● ❍
Germany ● ● ● ● ● ❍ ● x ●
Greece ● ● x ❍ x ❍ x ● x
Hungary ● ● ● ● ❍ ● ❍ ❍ x
Ireland ● ● ● ● ● ● ● ● x
Israel ● ● ● ● ❍ ❍ ❍ ● x
Italy x ● ● ● ● ● ● x x
Japan ● ● ● ● ● ● x ● ●
Korea ● ● ● ❍ ❍ ● ● x x
Luxembourg ● ● ● ● ● ❍ ● ● ●
Mexico ● ● ● ● ● ❍ x ● x
Netherlands ● ● ● ● ● ❍ ● x ●
New Zealand ● ● ● ● ● ❍ ❍ ● ●
Norway ● ● ● ❍ ❍ ● ❍ x x
Poland ● ● ● ● ● ● ❍ x x
Portugal ● ● ● ❍ ● ● ● ● x
Slovak Republic ● ● ● ❍ ❍ ● ● x x
Slovenia ❍ ● ● ● ● ● x ❍ ●
Spain ● ● ● ❍ ❍ ● ● ❍ x
Sweden ● ● ● ● ● ❍ ● ● ●
Switzerland ● ● ● ● ● ❍ x x ●
Turkey ● ● ● ● ❍ ● ❍ ● ❍
United Kingdom ● ❍ ● ● ● x ● ● ●
United States ● ● ● ● ● ● x x ●
Russian Federation ● ● ● ● ● ● ● ● ●
Total OECD
● Publicly available 31 32 32 27 20 17 16 14 14
❍ Not publicly available 1 0 0 6 11 14 9 3 3
x Not applicable 1 1 1 0 2 2 8 16 16
Source: 2012 OECD Survey on Budgeting Practices and Procedures.1 2 http://dx.doi.org/10.1787/888932943647
GOVERNMENT AT A GLANCE 2013 © OECD 2013 145
8. OPEN AND INCLUSIVE GOVERNMENT
Inclusive policy making
Open and inclusive policy making is transparent, evidence-driven, accessible and responsive to as wide a range ofcitizens as possible. It strives to include a diverse numberof voices and views in the policy-making process, includingtraditional cultures. To be successful, these elements mustbe applied at all stages of the design and delivery of publicpolicies and services. While inclusive policy makingenhances transparency, accountability and public partici-pation and builds civic capacity, it also offers a way forgovernments to improve their policy performance byworking with citizens, civil society organizations (CSOs),businesses and other stakeholders to deliver concreteimprovements in policy outcomes and the quality of publicservices.
Gender impact assessments (GIAs) are one kind of tool thatpolicy makers can use to assess, according to gender-relevant criteria, the impact that new legislation or policiesmay have on women and relative to men. Building aware-ness and understanding among policy makers of thepotentially different effects of policy choices on men andwomen is key to inclusive policy making in variousdomains. Nevertheless, seemingly gender-neutral policydecisions can have effects, whether intentional or not, onwomen’s chances of becoming equal participants insociety. They may make it more difficult for them to findemployment, secure an education, start a business, meetthe needs of their family, or ensure their human rights. Forexample, a workplace regulation that permits both parentsto take leave to care for a sick child is more likely to affectwomen as primary caregivers. GIAs can be conductedex ante (e.g. before the proposed law or policy has beenapproved or gone into effect) and ex post (e.g. followingimplementation). According to the OECD Survey on GenderPublic Policies and Leadership, ex ante evaluations are morecommonplace. Of the OECD responding countries, forinstance, 84% (16 countries) reported having requirementsfor ex ante GIAs on primary legislation compared to 37%(7 countries) for ex post. In general, however, it seems GIAsare not routine elements of policy making; the majority ofresponding countries reserve GIAs for primary and second-ary legislation rather than for policies and programmes.
Gender-responsive budgeting (GRB) is arguably the bestknown form of gender impact assessment. GRB inserts agender perspective at all stages of the budgetary cycle: itaims to avoid “gender-blind spending” and improve theeffectiveness of government programmes by identifyinggender-disproportionate consequences of spending appro-priations. Just over half of the responding countries (10)reported having requirements for GRB. Belgium, Finland,France, Israel, Korea, Mexico, Norway, the Slovak Republic,Spain and Sweden reported always conducting suchevaluations for the central/federal budgets.
Citizen consultation is a second way for governments toopen the policy-making process to citizens. The OECD Guide-lines on Open and Inclusive Policy Making state that all citizensshould have equal opportunities and multiple channels toaccess information, be consulted and participate. Every
reasonable effort should be made to engage with as wide avariety of people as possible. To accomplish this, govern-ments in OECD countries are exploiting the power of newinformation and communication technologies (ICT) toincrease awareness and participation. The use of ICT tools inconsultation varies extensively across countries, andtake-up on the part of citizens remains, on average, low incountries of the European Union. According to Eurostat’sInformation Society Statistics (database), on average, less than10% of citizens had reported using the Internet to take partin an online consultations or voting to define civic or politi-cal issues (e.g. urban planning, signing a petition). The pro-pensity to use online tools for consultation or voting washighest in the Nordic countries.
Further reading
OECD (2012), Closing the Gender Gap: Act Now, OECD Publishing,Paris, http://dx.doi.org/10.1787/9789264179370-en.
OECD (2009), Focus on Citizens: Public Engagement for BetterPolicy and Services, OECD Studies on Public Engagement,OECD Publishing, Paris, http://dx.doi.org/10.1787/9789264048874-en.
Figure and table notes
8.9: Data are not available for Austria, Canada, Denmark, Estonia,Hungary, Iceland, Italy, Japan, the Netherlands, Poland, Portugal,Slovenia, Turkey, the United Kingdom and the United States.
8.10: Data unavailable for Australia, Canada, Chile, Israel, Japan, Korea,Mexico, New Zealand, Switzerland, Turkey and the United States.
Information on data for Israel: http://dx.doi.org/10.1787/888932315602.
Methodology and definitions
Data refer to 2012 and draw upon country responses toquestions from the 2011 OECD Survey on GenderPublic Policies and Leadership. Respondents werepredominately senior budget officials in OECDmember countries. Responses represent the countries’own assessments of current practices and procedures.Data refer only to central/federal governments.
Indicators on citizens and businesses are collectedfrom Eurostat’s Information Society Statistics (database)which evaluates the share of citizens and businessesusing the Internet for online consultations or voting todefine civic or political issues (e.g. urban planning,signing a petition). Data are collected by national sta-tistical offices based on Eurostat’s annual Model Sur-vey on ICT Usage and E-Commerce in Businesses andannual Community Survey on ICT Usage in House-holds and by Individuals.
GOVERNMENT AT A GLANCE 2013 © OECD 2013146

8. OPEN AND INCLUSIVE GOVERNMENT
Inclusive policy making
8.9. Requirements for gender impact assessments at the central/federal level of government (2011)
Requirements for ministries/departments/agenciesto conduct gender impact assessments (ex ante)
Requirements for ministries/departments/agenciesto conduct gender impact assessments (ex post)
Requirementto undertake
gender-responsivebudgeting
at the centrallevel
Primarylegislation
Subordinateregulation
Governmentprogrammesand initiatives
Primarylegislation
Subordinateregulation
Governmentprogrammesand initiatives
Australia ✧ ✧ ■ ✧ ✧ ✧ ✧
Belgium ❍ ❍ ■ ❍ ❍ ❍ ●
Chile ■ ■ ■ ✧ ✧ ✧ ❍
Czech Republic ■ ■ ■ ■ ■ ■ ✧
Finland ● ■ ■ ■ ■ ■ ●
France ❍ ❍ ❍ ❍ ❍ ❍ ●
Germany ● ● ● ✧ ✧ ✧ ✧
Greece ■ ■ ■ ■ ■ ■ ❍
Ireland ■ ✧ ■ ✧ ✧ ✧ ✧
Israel ● ● ✧ ■ ■ ■ ●
Korea ● ● ● ● ● ● ●
Luxembourg ● ● ✧ ✧ ✧ ✧ ✧
Mexico ■ ✧ ■ ✧ ❍ ■ ●
New Zealand ■ ■ ■ ✧ ✧ ✧ ✧
Norway ● ✧ ■ ● ● ■ ●
Slovak Republic ● ✧ ✧ ✧ ✧ ✧ ✧
Spain ● ● ■ ✧ ✧ ✧ ●
Sweden ● ● ● ● ● ● ●
Switzerland ● ✧ ✧ ❍ ❍ ❍ ■
Total OECD
● Yes, always 10 6 3 3 3 2 9
■ Yes, sometimes 6 5 11 4 4 6 1
❍ No, but planned 2 2 1 3 4 3 2
✧ No, not planned 1 6 4 9 8 8 7
Source: 2011 OECD Survey on National Gender Frameworks, Gender Public Policies and Leadership.1 2 http://dx.doi.org/10.1787/888932943685
8.10. Percentage of individuals who have taken part in an online consultation or voting
Source: Eurostat, Information Society Statistics (database).1 2 http://dx.doi.org/10.1787/888932942925
0
5
10
15
20
25
30
35
ISLNLD LU
XNOR
DNK FIN SWEDEU ES
TAUT
PRTES
PFR
AGBR
GRC ITA SVNCZE
IRL
HUNBEL POL
SVK
Share of citizens
OECD
GOVERNMENT AT A GLANCE 2013 © OECD 2013 147


GOVERNMENT AT A GLANCE 2013 © OEC
9. SPECIAL FEATURE – SERVING CITIZENS:ACCESSIBILITY AND QUALITY OF PUBLICSERVICES
Governments in OECD member countries are increasingly focused on making qualitypublic goods and services accessible to as wide a range of citizens as possible while alsoensuring these are more responsive to the diversity of individual needs. Many countries areintroducing more stringent service and performance standards and implementing mechanismsto measure and integrate citizen feedback into delivery processes.
Several motives are driving the move towards more citizen-focused strategies. Moreeducated, well-informed citizens are judging governments on their performance, an importantaspect of which is service quality. Indeed, citizens’ experiences in interacting with governmentagencies – and their satisfaction with the treatment, goods and services they receive – caninfluence their perceptions of the capacity and fairness of government institutions and theirviews of whether they receive value for money from their tax contributions or fees paid.Moreover, in times of fiscal austerity, measuring service quality is also necessary to evaluatethe impact of spending cuts on services, and to ascertain whether government departmentsand organisations are achieving efficiency gains without adverse effects on the elements thatmatter most to citizens.
This chapter is a first attempt to compare dimensions of service quality not only acrosscountries but also across key public services: education, health care, justice and tax administration.It presents a selection of citizen-focused indicators along several dimensions of accessibility andquality: affordability, availability of online channels, timeliness, and reliability. In addition,perception data on citizens’ reported satisfaction with these services are also presented. There areseveral facets to each of these dimensions. For example, “accessibility” can refer to several factors,from geographic proximity to service providers to the accommodation of facilities or channels todifferent needs. This chapter, however, presents only a subset of indicators, chosen on the basis ofdata availability and comparability across member countries.
D 2013 149
9. SPECIAL FEATURE – SERVING CITIZENS
Access to public services: Affordability
The impact of basic public goods and services like education,health care and justice on citizens’ lives depends significantlyon the extent to which intended recipients are able to accessand consume them.The accessibility of public services can beconsidered a performance criterion for governments, reflect-ing their capacities to accurately recognise the diversity andnature of different needs, create and tailor delivery andcommunication channels accordingly, and ensure equity andfairness in delivery and distribution.
Barriers to access can take several forms including:geographical distance, inadequate facilities for usersrequiring special accommodations, insufficient number ofdelivery channels (Internet, phone, person-to-person, etc.),insufficient information or use of complex language, alack of interpreters or translators for non-native speakers,inconvenient opening times or excessive administrativeburdens. Such barriers can decrease awareness of eligibilityor existence of services or deter potential recipients.Affordability, or the economic costs of purchasing a good orservice relative to income, can be an important barrier toaccess. Financial accessibility can not only make thedifference between whether or not a good or service will beconsumed, but can also impact the confidence of citizensin the fairness of public institutions.
However, while governments have a vested interest inensuring that citizens, particularly low-income or othervulnerable groups, can afford basic services, they also facethe challenge of balancing concerns for equity and well-being with efforts to preserve consumer choice and incen-tivise better performance of public providers. Indeed, sub-sidising or providing services at below-market prices caninfluence users to consume goods that they do not need ordecrease competition, reducing the number of providersand decreasing the incentives for quality improvements.
Health care
While most OECD member countries provide universalhealth insurance coverage for a core set of services, citizensmay still have to pay for some services or medications.These costs could lead some citizens to forgo or delayseeing a doctor or undertaking a treatment, thus reducingoverall access to health care, or resulting in more costlyhospitalisation at a later stage. In addition, citizens ingreater need of health services may carry a heavier burdenof these costs, if they are not exempted from some of thesecosts or if there is no spending cap. There is significantvariation in out-of-pocket payments as a share of finalhousehold consumption across OECD member countries.Out-of-pocket payments represented 1.5% of final house-hold consumption in France, the Netherlands, Turkey andthe United Kingdom, but more than 4% in Chile, Korea,Mexico and Portugal (Figure 9.1). More important, however,is the distribution of those out-of-pocket payments byincome group. Many countries, for example, have exemp-tions and caps to out-of-pocket payments for lower incomegroups to protect health care access.
Justice
Citizens also face time and monetary costs when bringingforward or processing a case through the legal system. Ininstances where one may be a defendant or an accusedperson, there are also costs associated with maintaininglegal representation. The provision of legal aid can facilitateaccess to justice, ensuring that even those without thenecessary financial resources may still exercise their right toa fair trial. Legal aid as defined here can take the form ofgratuitous or subsidised legal representation, legal adviceand exempted fees. The share of cases receiving legal aidcan provide an indication of the extent to which publicfinancial support is made available. Of the 11 OECD membercountries for which data are available, in four countries– Finland, France, the Netherlands and Norway – citizensreceived legal aid in more than 10% of first-instance cases. Inthe remaining countries, citizens received legal aid in 6% orfewer of first-instance cases (Figure 9.2). In some countries,such as Austria, non-contested first-instance cases may notalways be eligible for legal aid, potentially misrepresentingthe ratio of cases benefitting from state assistance.
Education
In addition to direct costs, citizens can face indirect costs inaccessing public services. For example, in addition to tuitionfees, citizens will need to take into consideration livingexpenses as well as the potential earnings they give upwhen deciding to enter higher education. Public tertiaryeducation institutions in five countries – Chile, Japan,New Zealand, the United Kingdom and the United States –charged tuition fees that accounted for 14% or more of perperson disposable income (Figure 9.3). In five countries –Austria, Italy, the Netherlands, Spain and Switzerland –entry fees weighed significantly less on citizens’ income,ranging from 3% to 7% of per person disposable income. Infive countries – Denmark, Finland, Mexico, Norway andSweden – public tertiary education institutions did notcharge tuition fees.
In ten countries, at least half the students received financialaid. These countries included five of the six countries withabove-average tuition fees (Australia, Chile, New Zealand,the United Kingdom and the United States), a country wheretuition fees with respect to per person disposable incomewere relatively moderate (the Netherlands), and mostcountries with no tuition fees (Denmark, Finland, Norwayand Sweden). In these countries, on average, approximately71% of citizens of the relevant age cohort entered university-level education. In countries with less than half the studentsreceiving financial aid, on average, approximately 45% ofcitizens of the relevant age cohort entered university-leveleducation.
GOVERNMENT AT A GLANCE 2013 © OECD 2013150
9. SPECIAL FEATURE – SERVING CITIZENS
Access to public services: Affordability
Further reading
CEPEJ (2012), European Judicial Systems – Edition 2012 – Efficiencyand Quality of Justice, Council of Europe Publishing,Strasbourg.
OECD (2013a), Education at a Glance 2013: OECD Indicators, OECDPublishing, Paris, http://dx.doi.org/10.1787/eag-2013-en.
OECD (2013b, forthcoming), Health at a Glance 2013: OECDIndicators, OECD Publishing, Paris.
Figure notes
9.1: Data for Australia, Austria, Canada, Japan, Mexico, New Zealand andNorway are for 2010. Data for Israel are for 2009. Data for Turkey arefor 2008.
9.2: Non-criminal and criminal cases for all countries except Austria andFrance, where data refer to non-criminal cases only.
9.3: For the United States, figures on entry rates and the percentage ofstudents who benefit from public loans/scholarships are reported forall students (full-time national and full-time non-national/foreignstudents), and data on entry rates include both Type A and Type Bprogrammes. For France, average tuition fees ranging from USD 200 toUSD 1 402 for university programmes are dependent on the Ministryof Education. For Japan, tuition fees refer to public institutions;however, more than two-thirds of students are enrolled in privateinstitutions. For Chile, if only public institutions are taken intoaccount, the proportion of students who benefit from public loansand/or scholarships/grants is 68%. Data on loans/scholarships: datafor Australia exclude foreign students. Data for Mexico and theUnited Kingdom refer to academic year 2008-09. Data for Denmark,France, Mexico, the Netherlands and the United states include onlypublic universities, including tertiary/Type B in France. See Annex 3 ofEducation at a Glance 2013: OECD Indicators (OECD, 2013) for furthernotes (www.oecd.org/edu/eag.htm).
Information on data for Israel: http://dx.doi.org/10.1787/888932315602.
Methodology and definitions
Data on out-of-pocket payments are derived fromOECD Health Statistics 2013. Out-of-pocket paymentsare expenditures borne directly by a patient whereneither public nor private insurance cover the full costof the health good or service. They include cost-sharing and other expenditure paid directly by privatehouseholds, and also include estimations of informalpayments to health care providers in some countries.Only expenditure for medical spending (i.e. currenthealth spending less expenditure for the health part oflong-term care) is presented here, because the capacityof countries to estimate private long-term care expen-diture varies widely.
Data on legal aid and first-instance cases are derivedfrom the evaluation of judicial systems conducted bythe European Commission for the Efficiency of Justice(CEPEJ). Legal aid refers to cases receiving public fundsto subsidise or finance legal representation. It can alsoinclude cases that received gratuitous legal advice, orthat were granted exemptions from certain fees. Crite-ria for receiving aid vary by country, ranging from typesof individuals who may qualify for assistance to thekinds of cases eligible. Data on the estimated costs ofprocessing a case are obtained from the World BankGroup’s Doing Business (database). Cost is recorded as apercentage of the claim, assumed to be equivalent to200% of income per capita. No bribes are recorded.Three types of costs are recorded: court costs, enforce-ment costs and average attorney fees.
Data on tuition fees, financial aid and entry rates intoType A university-level education are derived fromEducation at a Glance 2013: OECD Indicators (OECD,2013). Tuition fees cover only Type A first-degree pro-grammes at public institutions (in PPPs-convertedUSD) for the academic year 2010-11. Adjusted dispo-sable income is defined as the maximum amountthat a unit can afford to spend on consumption goodsor services without having to reduce its financial ornon-financial assets or by increasing its liabilities,adjusted for government transfers. Entry rates refer tothe estimated percentage of people of an age cohortentering Type A university-level education for thefirst time.
GOVERNMENT AT A GLANCE 2013 © OECD 2013 151
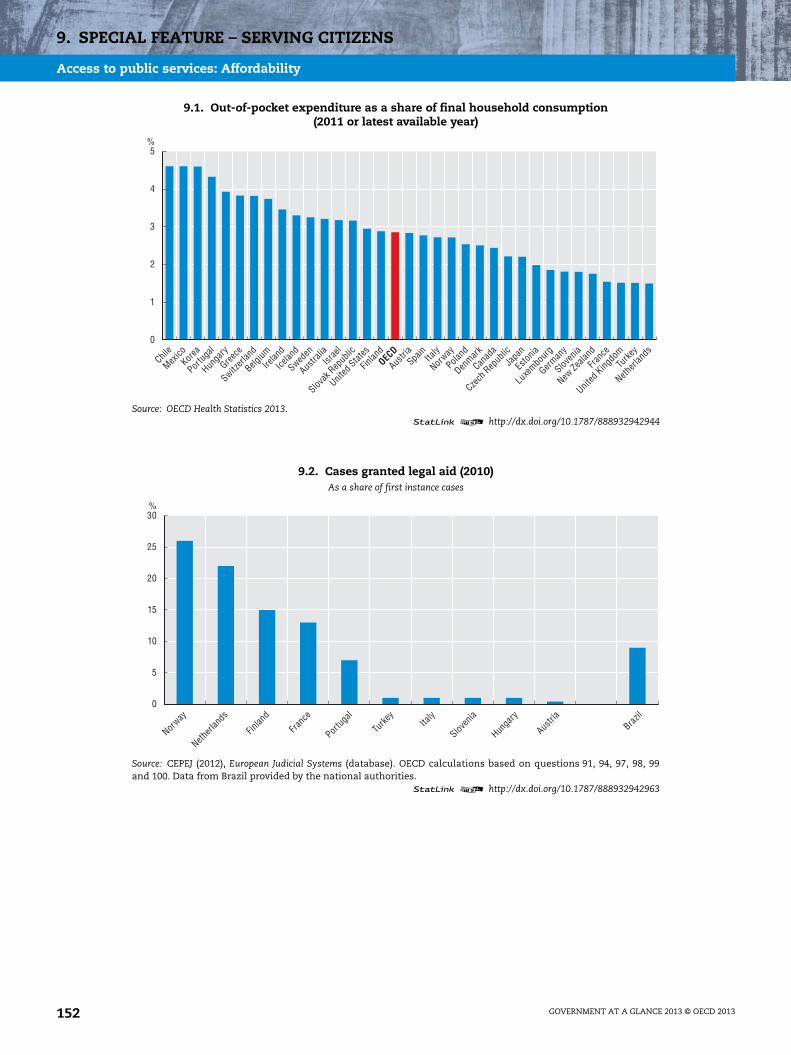
9. SPECIAL FEATURE – SERVING CITIZENS
Access to public services: Affordability
9.1. Out-of-pocket expenditure as a share of final household consumption(2011 or latest available year)
Source: OECD Health Statistics 2013.1 2 http://dx.doi.org/10.1787/888932942944
9.2. Cases granted legal aid (2010)As a share of first instance cases
Source: CEPEJ (2012), European Judicial Systems (database). OECD calculations based on questions 91, 94, 97, 98, 99and 100. Data from Brazil provided by the national authorities.
1 2 http://dx.doi.org/10.1787/888932942963
%
0
1
2
3
4
5
Chile
Mexico
Korea
Portug
al
Hunga
ry
Greece
Switzerl
and
Belgium
Irelan
d
Icelan
d
Sweden
Austra
liaIsr
ael
Slovak
Rep
ublic
United
States
Finlan
dOEC
D
Austri
aSpa
inIta
ly
Norway
Poland
Denmark
Canad
a
Czech
Rep
ublicJa
pan
Eston
ia
Luxe
mbourg
German
y
Sloven
ia
New Ze
aland
Franc
e
United
Kingdo
mTu
rkey
Netherl
ands
%
0
5
10
15
20
25
30
Norway
Netherl
ands
Finlan
d
Franc
e
Portug
al
Turke
yIta
ly
Sloven
ia
Hunga
ry
Austri
aBraz
il
GOVERNMENT AT A GLANCE 2013 © OECD 2013152
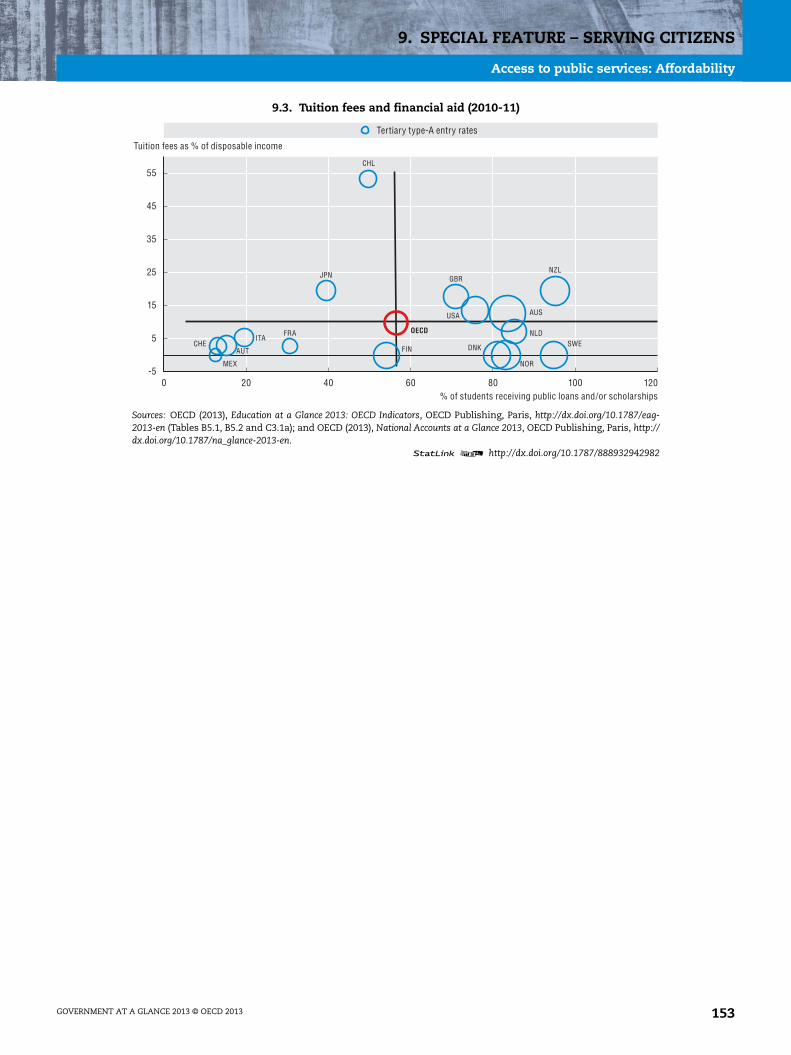
9. SPECIAL FEATURE – SERVING CITIZENS
Access to public services: Affordability
9.3. Tuition fees and financial aid (2010-11)
Sources: OECD (2013), Education at a Glance 2013: OECD Indicators, OECD Publishing, Paris, http://dx.doi.org/10.1787/eag-2013-en (Tables B5.1, B5.2 and C3.1a); and OECD (2013), National Accounts at a Glance 2013, OECD Publishing, Paris, http://dx.doi.org/10.1787/na_glance-2013-en.
1 2 http://dx.doi.org/10.1787/888932942982
-5
5
15
25
35
45
55
0 20 40 60 80 100 120
AUS
AUT
CHL
DNKFIN
FRAITA
JPN
MEX
NLD
NZL
NOR
SWECHE
GBR
USA
Tuition fees as % of disposable income
% of students receiving public loans and/or scholarships
Tertiary type-A entry rates
OECD
GOVERNMENT AT A GLANCE 2013 © OECD 2013 153
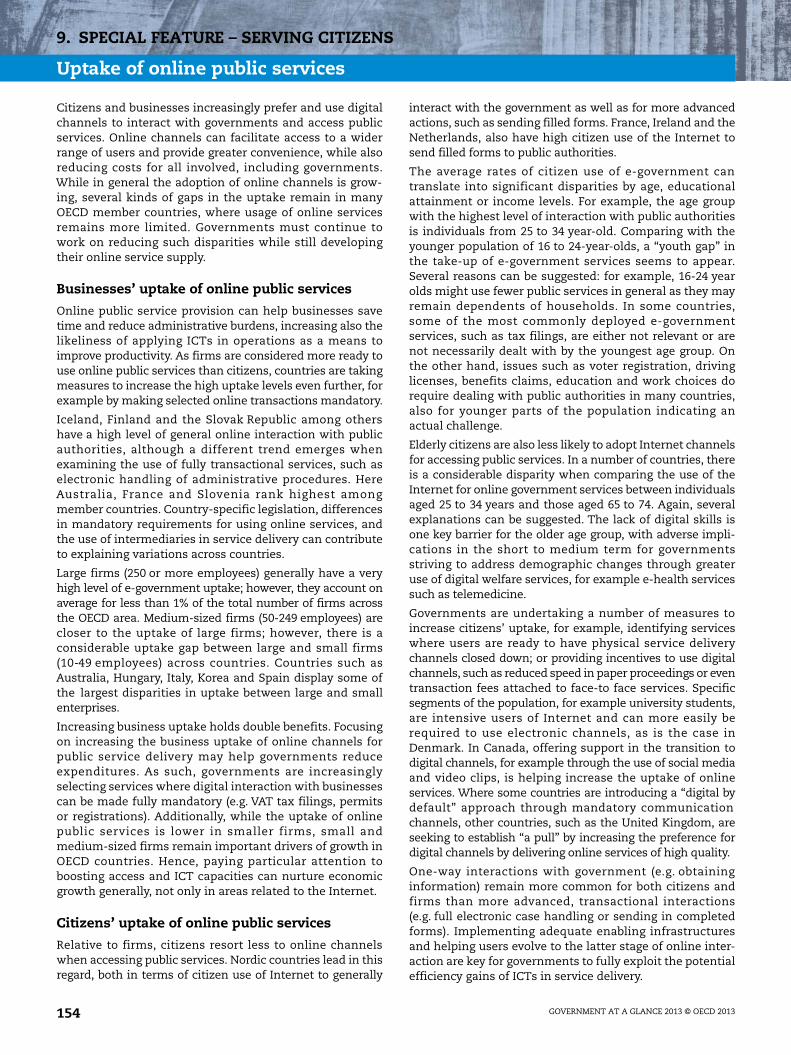
9. SPECIAL FEATURE – SERVING CITIZENS
Uptake of online public services
Citizens and businesses increasingly prefer and use digitalchannels to interact with governments and access publicservices. Online channels can facilitate access to a widerrange of users and provide greater convenience, while alsoreducing costs for all involved, including governments.While in general the adoption of online channels is grow-ing, several kinds of gaps in the uptake remain in manyOECD member countries, where usage of online servicesremains more limited. Governments must continue towork on reducing such disparities while still developingtheir online service supply.
Businesses’ uptake of online public services
Online public service provision can help businesses savetime and reduce administrative burdens, increasing also thelikeliness of applying ICTs in operations as a means toimprove productivity. As firms are considered more ready touse online public services than citizens, countries are takingmeasures to increase the high uptake levels even further, forexample by making selected online transactions mandatory.
Iceland, Finland and the Slovak Republic among othershave a high level of general online interaction with publicauthorities, although a different trend emerges whenexamining the use of fully transactional services, such aselectronic handling of administrative procedures. HereAustralia, France and Slovenia rank highest amongmember countries. Country-specific legislation, differencesin mandatory requirements for using online services, andthe use of intermediaries in service delivery can contributeto explaining variations across countries.
Large firms (250 or more employees) generally have a veryhigh level of e-government uptake; however, they account onaverage for less than 1% of the total number of firms acrossthe OECD area. Medium-sized firms (50-249 employees) arecloser to the uptake of large firms; however, there is aconsiderable uptake gap between large and small firms(10-49 employees) across countries. Countries such asAustralia, Hungary, Italy, Korea and Spain display some ofthe largest disparities in uptake between large and smallenterprises.
Increasing business uptake holds double benefits. Focusingon increasing the business uptake of online channels forpublic service delivery may help governments reduceexpenditures. As such, governments are increasinglyselecting services where digital interaction with businessescan be made fully mandatory (e.g. VAT tax filings, permitsor registrations). Additionally, while the uptake of onlinepublic services is lower in smaller firms, small andmedium-sized firms remain important drivers of growth inOECD countries. Hence, paying particular attention toboosting access and ICT capacities can nurture economicgrowth generally, not only in areas related to the Internet.
Citizens’ uptake of online public services
Relative to firms, citizens resort less to online channelswhen accessing public services. Nordic countries lead in thisregard, both in terms of citizen use of Internet to generally
interact with the government as well as for more advancedactions, such as sending filled forms. France, Ireland and theNetherlands, also have high citizen use of the Internet tosend filled forms to public authorities.
The average rates of citizen use of e-government cantranslate into significant disparities by age, educationalattainment or income levels. For example, the age groupwith the highest level of interaction with public authoritiesis individuals from 25 to 34 year-old. Comparing with theyounger population of 16 to 24-year-olds, a “youth gap” inthe take-up of e-government services seems to appear.Several reasons can be suggested: for example, 16-24 yearolds might use fewer public services in general as they mayremain dependents of households. In some countries,some of the most commonly deployed e-governmentservices, such as tax filings, are either not relevant or arenot necessarily dealt with by the youngest age group. Onthe other hand, issues such as voter registration, drivinglicenses, benefits claims, education and work choices dorequire dealing with public authorities in many countries,also for younger parts of the population indicating anactual challenge.
Elderly citizens are also less likely to adopt Internet channelsfor accessing public services. In a number of countries, thereis a considerable disparity when comparing the use of theInternet for online government services between individualsaged 25 to 34 years and those aged 65 to 74. Again, severalexplanations can be suggested. The lack of digital skills isone key barrier for the older age group, with adverse impli-cations in the short to medium term for governmentsstriving to address demographic changes through greateruse of digital welfare services, for example e-health servicessuch as telemedicine.
Governments are undertaking a number of measures toincrease citizens’ uptake, for example, identifying serviceswhere users are ready to have physical service deliverychannels closed down; or providing incentives to use digitalchannels, such as reduced speed in paper proceedings or eventransaction fees attached to face-to face services. Specificsegments of the population, for example university students,are intensive users of Internet and can more easily berequired to use electronic channels, as is the case inDenmark. In Canada, offering support in the transition todigital channels, for example through the use of social mediaand video clips, is helping increase the uptake of onlineservices. Where some countries are introducing a “digital bydefault” approach through mandatory communicationchannels, other countries, such as the United Kingdom, areseeking to establish “a pull” by increasing the preference fordigital channels by delivering online services of high quality.
One-way interactions with government (e.g. obtaininginformation) remain more common for both citizens andfirms than more advanced, transactional interactions(e.g. full electronic case handling or sending in completedforms). Implementing adequate enabling infrastructuresand helping users evolve to the latter stage of online inter-action are key for governments to fully exploit the potentialefficiency gains of ICTs in service delivery.
GOVERNMENT AT A GLANCE 2013 © OECD 2013154

9. SPECIAL FEATURE – SERVING CITIZENS
Uptake of online public services
Further reading
OECD/International Telecommunication Union (2011),M-Government: Mobile Technologies for ResponsiveGovernments and Connected Societies, OECD Publishing,Paris, http://dx.doi.org/10.1787/9789264118706-en.
OECD (2009), Rethinking e-Government Services: User-CentredApproaches, OECD Publishing, Paris, http://dx.doi.org/10.1787/9789264059412-en.
Figure notes
9.4: Data unavailable for Canada, Chile, Israel, Japan, Mexico, Turkey andthe United States. Data unavailable on full electronic interaction forSwitzerland and on obtaining information for Australia. Data forAustralia, Chile, Korea, New Zealand, and Switzerland refer only toobtaining information, not general interaction, and include thefinancial sector. Data for Australia refer to 2010, data for Iceland, theUnited Kingdom and New Zealand refer to 2012. Data for Belgium andFinland on Internet interaction refer to 2012; data for Belgium,Finland, Iceland and the United Kingdom on electronic administrativeprocedures refer to full electronic case handling in 2010.
9.5: Data unavailable for Canada, Chile, Israel, Japan, Mexico, Turkey andthe United States. Data for Australia, Korea, New Zealand andSwitzerland refer only to obtaining information, not generalinteraction, and include the financial sector. Data for Korea andSwitzerland refer to 2011. Data for Australia refer to 2010 and coveruse of the Internet to complete forms electronically.
9.6: Data unavailable for Korea, Mexico, Turkey and the United States.Data unavailable on sending filled forms for Australia, Israel andSwitzerland, and on interaction with public authorities for Japan.Data for Canada, Switzerland and New Zealand refer only toobtaining information, not general interaction. Data for Israel covercitizens aged 20 and above and cover both obtaining informationand filling in forms on line. Data for Canada refer to 2009, data forAustralia, Israel and Switzerland refer to 2010. Data for New Zealandrefer to downloading forms rather than sending filled forms.
9.7: Data unavailable for Japan, Korea, Mexico, Turkey and theUnited States. Data for Australia, Canada, New Zealand, Israel andSwitzerland refer only to obtaining information, not general inter-action. In these countries the age group “25-34 years old” refers ratherto individuals between 25 and 44 years of age. Data for Chile refer tothe 25-64 years age group. Data for Israel cover citizens aged 20 andabove and cover both obtaining information and filling in formson line. Data for Canada, Israel and Switzerland refer to 2010.
Information on data for Israel: http://dx.doi.org/10.1787/888932315602.
Methodology and definitions
Indicators on citizens and businesses are based onEurostat’s Information Society Statistics (database) andthe OECD’s ICT Database. The indicators evaluate theshare of citizens and businesses using the Internet tointeract with public authorities. The two sources aremethodologically comparable. Data are collected bynational statistical offices based on Eurostat’s annualModel Survey on ICT Usage and E-Commerce inBusinesses and annual Community Survey on ICTUsage in Households and by Individuals.
The data show interaction with public authorities bythe Internet. Public authorities refer to both publicservices and administration activities, at all levelsof government. Interaction is a derived indicatorcovering subcategories of various actions performedthrough the Internet, such as obtaining information,downloading and sending forms, or completingadministrative procedures and case handling. Whilethe use of intermediaries is widespread in a numberof countries, this is not captured in the survey data.
The e-government uptake indicator measures the per-centages of firms or citizens who have used the Internetto interact with public authorities in the last 12 monthspreceding the survey. The 12-month period allows forcomparisons across countries with differing schedulesof service transactions across sectors. Firms with 10 ormore employees are covered, not including the financialsector. Individuals between 16 and 74 are covered.
GOVERNMENT AT A GLANCE 2013 © OECD 2013 155
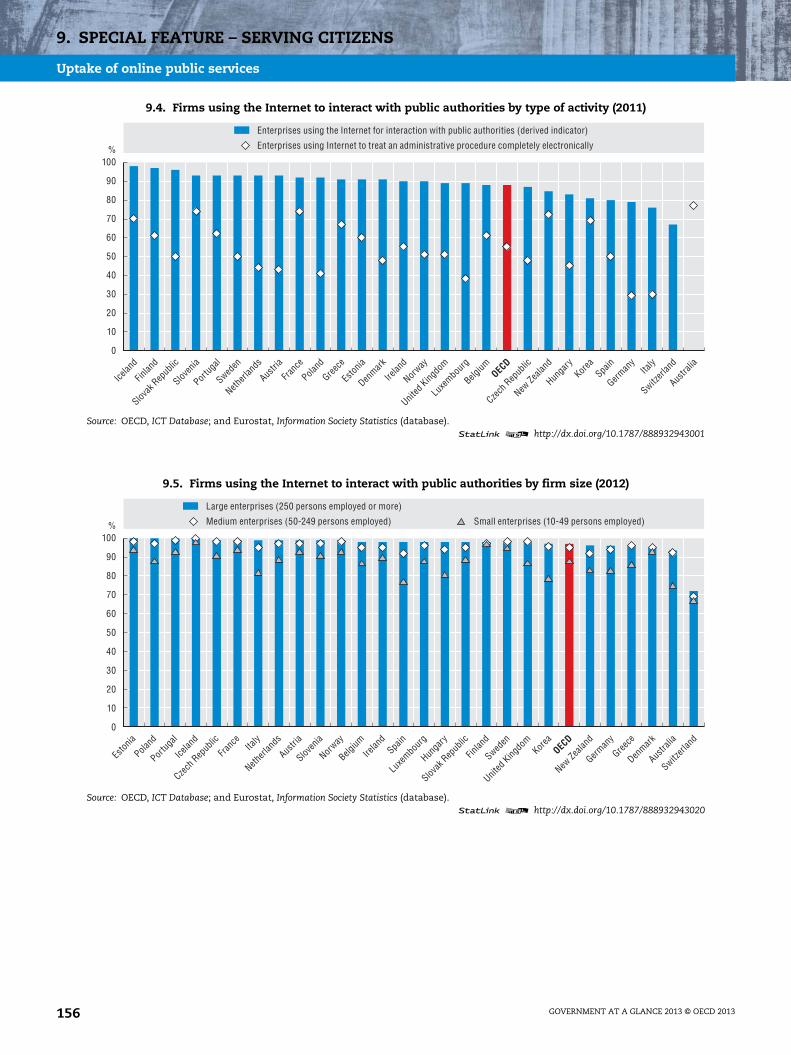
9. SPECIAL FEATURE – SERVING CITIZENS
Uptake of online public services
9.4. Firms using the Internet to interact with public authorities by type of activity (2011)
Source: OECD, ICT Database; and Eurostat, Information Society Statistics (database).1 2 http://dx.doi.org/10.1787/888932943001
9.5. Firms using the Internet to interact with public authorities by firm size (2012)
Source: OECD, ICT Database; and Eurostat, Information Society Statistics (database).1 2 http://dx.doi.org/10.1787/888932943020
0
10
20
30
40
50
60
70
80
90
100% Enterprises using Internet to treat an administrative procedure completely electronically
Enterprises using the Internet for interaction with public authorities (derived indicator)
Icelan
d
Finlan
d
Slovak
Rep
ublic
Sloven
ia
Portug
al
Sweden
Netherl
ands
Austri
a
Franc
e
Poland
Greece
Eston
ia
Denmark
Irelan
d
Norway
United
Kingdo
m
Luxe
mbourg
Belgium OEC
D
Czech
Rep
ublic
New Ze
aland
Hunga
ryKor
eaSpa
in
German
yIta
ly
Switzerl
and
Austra
lia
0
10
20
30
40
50
60
70
80
90
100% Small enterprises (10-49 persons employed)Medium enterprises (50-249 persons employed)
Large enterprises (250 persons employed or more)
Eston
ia
Poland
Portug
al
Icelan
d
Czech
Rep
ublic
Franc
eIta
ly
Netherl
ands
Austri
a
Sloven
ia
Norway
Belgium
Irelan
dSpa
in
Luxe
mbourg
Hunga
ry
Slovak
Rep
ublic
Finlan
d
Sweden
United
Kingdo
mKor
eaOEC
D
New Ze
aland
German
y
Greece
Denmark
Austra
lia
Switzerl
and
GOVERNMENT AT A GLANCE 2013 © OECD 2013156

9. SPECIAL FEATURE – SERVING CITIZENS
Uptake of online public services
9.6. Citizens using the Internet to interact with public authorities by type of activity (2012)
Source: OECD, ICT Database; and Eurostat, Information Society Statistics (database).1 2 http://dx.doi.org/10.1787/888932943039
9.7. Citizens using the Internet to interact with public authorities by age group (2012)
Source: OECD, ICT Database; and Eurostat, Information Society Statistics (database).1 2 http://dx.doi.org/10.1787/888932943058
0
10
20
30
40
50
60
70
80
90
100% Internet use: Sending filled forms (last 12 months)
Internet use: Interaction with public authorities (last 12 months)
Icelan
d
Denmark
Norway
Sweden
Finlan
d
Netherl
ands
Switzerl
and
Franc
e
Luxe
mbourg
Eston
ia
Austri
a
New Ze
aland
German
yOEC
D
Belgium
Irelan
d
Sloven
ia
Canad
aSpa
in
United
Kingdo
m
Hunga
ry
Slovak
Rep
ublic
Portug
al
Austra
lia
Greece
Poland
Czech
Rep
ublic
Israe
lIta
lyChil
eJa
pan
0
10
20
30
40
50
60
70
80
90
100% 65 to 74 years old16 to 24 years old25 to 34 years old
Denmark
Icelan
d
Sweden
Finlan
d
Norway
Franc
e
Netherl
ands
Switzerl
and
Eston
ia
Sloven
ia
German
y
Luxe
mbourg
Austri
a
Canad
a
Belgium
Portug
alOEC
DSpa
in
New Ze
aland
Irelan
d
Hunga
ry
Greece
Slovak
Rep
ublic
Poland
United
Kingdo
m
Austra
lia
Czech
Rep
ublic
Israe
lIta
lyChil
e
GOVERNMENT AT A GLANCE 2013 © OECD 2013 157
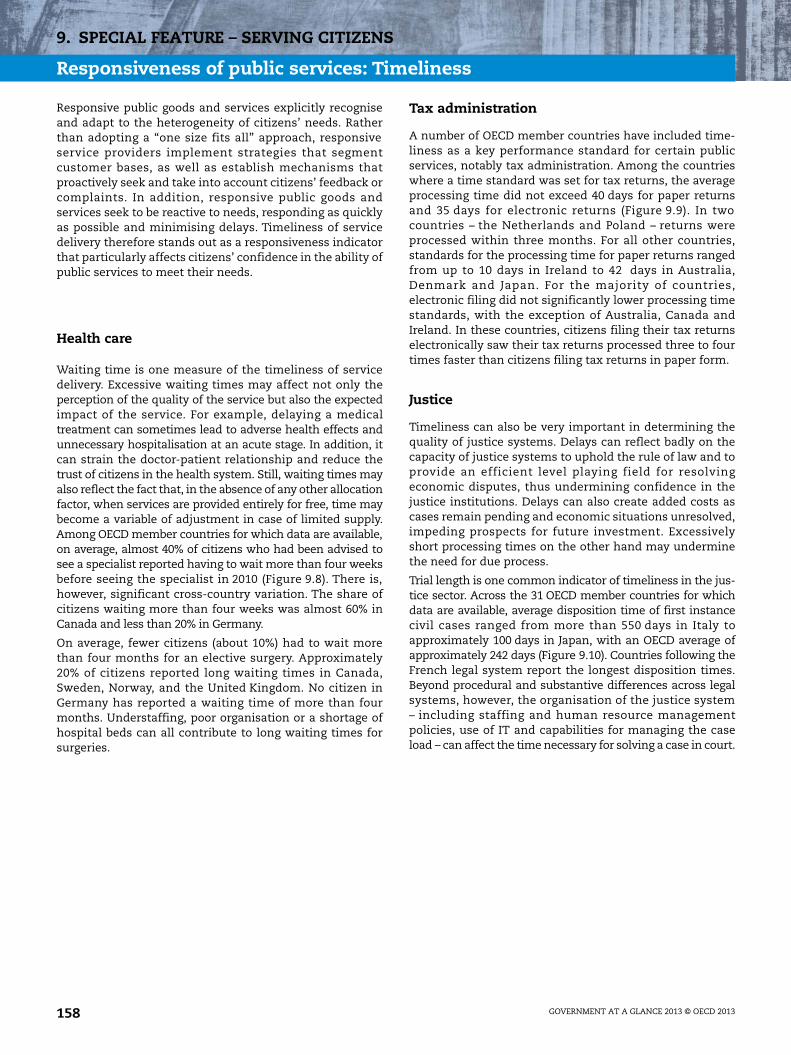
9. SPECIAL FEATURE – SERVING CITIZENS
Responsiveness of public services: Timeliness
Responsive public goods and services explicitly recogniseand adapt to the heterogeneity of citizens’ needs. Ratherthan adopting a “one size fits all” approach, responsiveservice providers implement strategies that segmentcustomer bases, as well as establish mechanisms thatproactively seek and take into account citizens’ feedback orcomplaints. In addition, responsive public goods andservices seek to be reactive to needs, responding as quicklyas possible and minimising delays. Timeliness of servicedelivery therefore stands out as a responsiveness indicatorthat particularly affects citizens’ confidence in the ability ofpublic services to meet their needs.
Health care
Waiting time is one measure of the timeliness of servicedelivery. Excessive waiting times may affect not only theperception of the quality of the service but also the expectedimpact of the service. For example, delaying a medicaltreatment can sometimes lead to adverse health effects andunnecessary hospitalisation at an acute stage. In addition, itcan strain the doctor-patient relationship and reduce thetrust of citizens in the health system. Still, waiting times mayalso reflect the fact that, in the absence of any other allocationfactor, when services are provided entirely for free, time maybecome a variable of adjustment in case of limited supply.Among OECD member countries for which data are available,on average, almost 40% of citizens who had been advised tosee a specialist reported having to wait more than four weeksbefore seeing the specialist in 2010 (Figure 9.8). There is,however, significant cross-country variation. The share ofcitizens waiting more than four weeks was almost 60% inCanada and less than 20% in Germany.
On average, fewer citizens (about 10%) had to wait morethan four months for an elective surgery. Approximately20% of citizens reported long waiting times in Canada,Sweden, Norway, and the United Kingdom. No citizen inGermany has reported a waiting time of more than fourmonths. Understaffing, poor organisation or a shortage ofhospital beds can all contribute to long waiting times forsurgeries.
Tax administration
A number of OECD member countries have included time-liness as a key performance standard for certain publicservices, notably tax administration. Among the countrieswhere a time standard was set for tax returns, the averageprocessing time did not exceed 40 days for paper returnsand 35 days for electronic returns (Figure 9.9). In twocountries – the Netherlands and Poland – returns wereprocessed within three months. For all other countries,standards for the processing time for paper returns rangedfrom up to 10 days in Ireland to 42 days in Australia,Denmark and Japan. For the majority of countries,electronic filing did not significantly lower processing timestandards, with the exception of Australia, Canada andIreland. In these countries, citizens filing their tax returnselectronically saw their tax returns processed three to fourtimes faster than citizens filing tax returns in paper form.
Justice
Timeliness can also be very important in determining thequality of justice systems. Delays can reflect badly on thecapacity of justice systems to uphold the rule of law and toprovide an efficient level playing field for resolvingeconomic disputes, thus undermining confidence in thejustice institutions. Delays can also create added costs ascases remain pending and economic situations unresolved,impeding prospects for future investment. Excessivelyshort processing times on the other hand may underminethe need for due process.
Trial length is one common indicator of timeliness in the jus-tice sector. Across the 31 OECD member countries for whichdata are available, average disposition time of first instancecivil cases ranged from more than 550 days in Italy toapproximately 100 days in Japan, with an OECD average ofapproximately 242 days (Figure 9.10). Countries following theFrench legal system report the longest disposition times.Beyond procedural and substantive differences across legalsystems, however, the organisation of the justice system– including staffing and human resource managementpolicies, use of IT and capabilities for managing the caseload – can affect the time necessary for solving a case in court.
GOVERNMENT AT A GLANCE 2013 © OECD 2013158
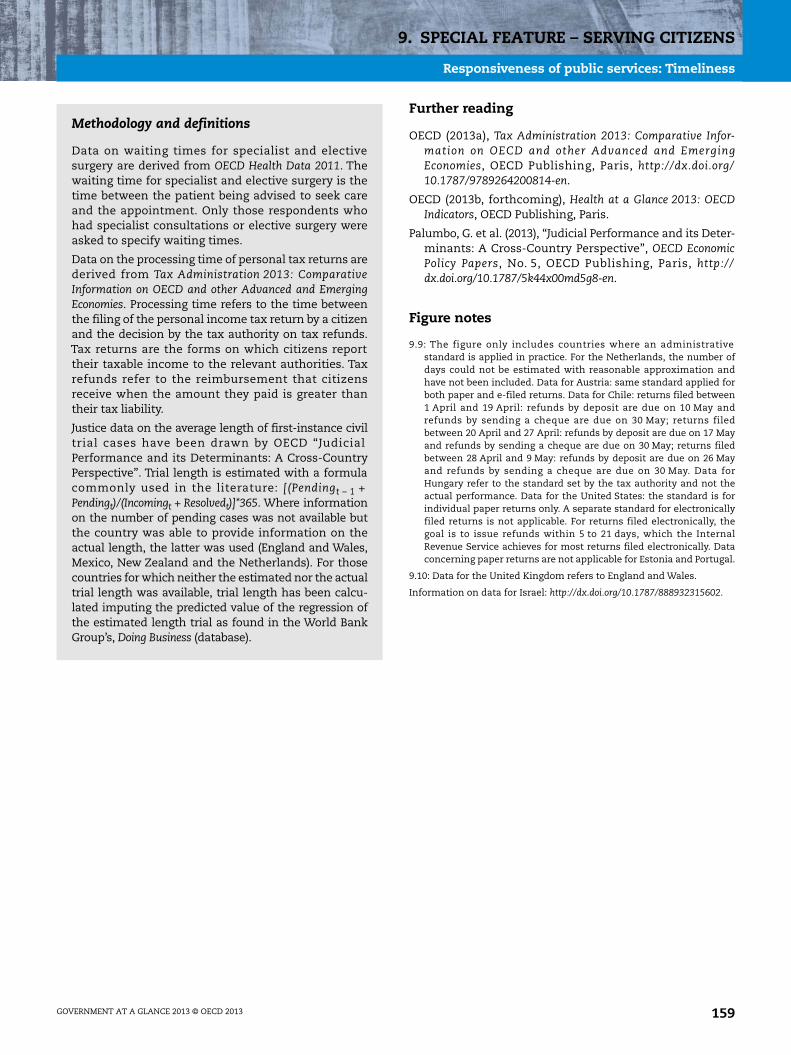
9. SPECIAL FEATURE – SERVING CITIZENS
Responsiveness of public services: Timeliness
Further reading
OECD (2013a), Tax Administration 2013: Comparative Infor-mation on OECD and other Advanced and EmergingEconomies, OECD Publishing, Paris, http://dx.doi.org/10.1787/9789264200814-en.
OECD (2013b, forthcoming), Health at a Glance 2013: OECDIndicators, OECD Publishing, Paris.
Palumbo, G. et al. (2013), “Judicial Performance and its Deter-minants: A Cross-Country Perspective”, OECD EconomicPolicy Papers, No. 5, OECD Publishing, Paris, http://dx.doi.org/10.1787/5k44x00md5g8-en.
Figure notes
9.9: The figure only includes countries where an administrativestandard is applied in practice. For the Netherlands, the number ofdays could not be estimated with reasonable approximation andhave not been included. Data for Austria: same standard applied forboth paper and e-filed returns. Data for Chile: returns filed between1 April and 19 April: refunds by deposit are due on 10 May andrefunds by sending a cheque are due on 30 May; returns filedbetween 20 April and 27 April: refunds by deposit are due on 17 Mayand refunds by sending a cheque are due on 30 May; returns filedbetween 28 April and 9 May: refunds by deposit are due on 26 Mayand refunds by sending a cheque are due on 30 May. Data forHungary refer to the standard set by the tax authority and not theactual performance. Data for the United States: the standard is forindividual paper returns only. A separate standard for electronicallyfiled returns is not applicable. For returns filed electronically, thegoal is to issue refunds within 5 to 21 days, which the InternalRevenue Service achieves for most returns filed electronically. Dataconcerning paper returns are not applicable for Estonia and Portugal.
9.10: Data for the United Kingdom refers to England and Wales.
Information on data for Israel: http://dx.doi.org/10.1787/888932315602.
Methodology and definitions
Data on waiting times for specialist and electivesurgery are derived from OECD Health Data 2011. Thewaiting time for specialist and elective surgery is thetime between the patient being advised to seek careand the appointment. Only those respondents whohad specialist consultations or elective surgery wereasked to specify waiting times.
Data on the processing time of personal tax returns arederived from Tax Administration 2013: ComparativeInformation on OECD and other Advanced and EmergingEconomies. Processing time refers to the time betweenthe filing of the personal income tax return by a citizenand the decision by the tax authority on tax refunds.Tax returns are the forms on which citizens reporttheir taxable income to the relevant authorities. Taxrefunds refer to the reimbursement that citizensreceive when the amount they paid is greater thantheir tax liability.
Justice data on the average length of first-instance civiltrial cases have been drawn by OECD “JudicialPerformance and its Determinants: A Cross-CountryPerspective”. Trial length is estimated with a formulacommonly used in the literature: [(Pendingt – 1 +Pendingt)/(Incomingt + Resolvedt)]*365. Where informationon the number of pending cases was not available butthe country was able to provide information on theactual length, the latter was used (England and Wales,Mexico, New Zealand and the Netherlands). For thosecountries for which neither the estimated nor the actualtrial length was available, trial length has been calcu-lated imputing the predicted value of the regression ofthe estimated length trial as found in the World BankGroup’s, Doing Business (database).
GOVERNMENT AT A GLANCE 2013 © OECD 2013 159
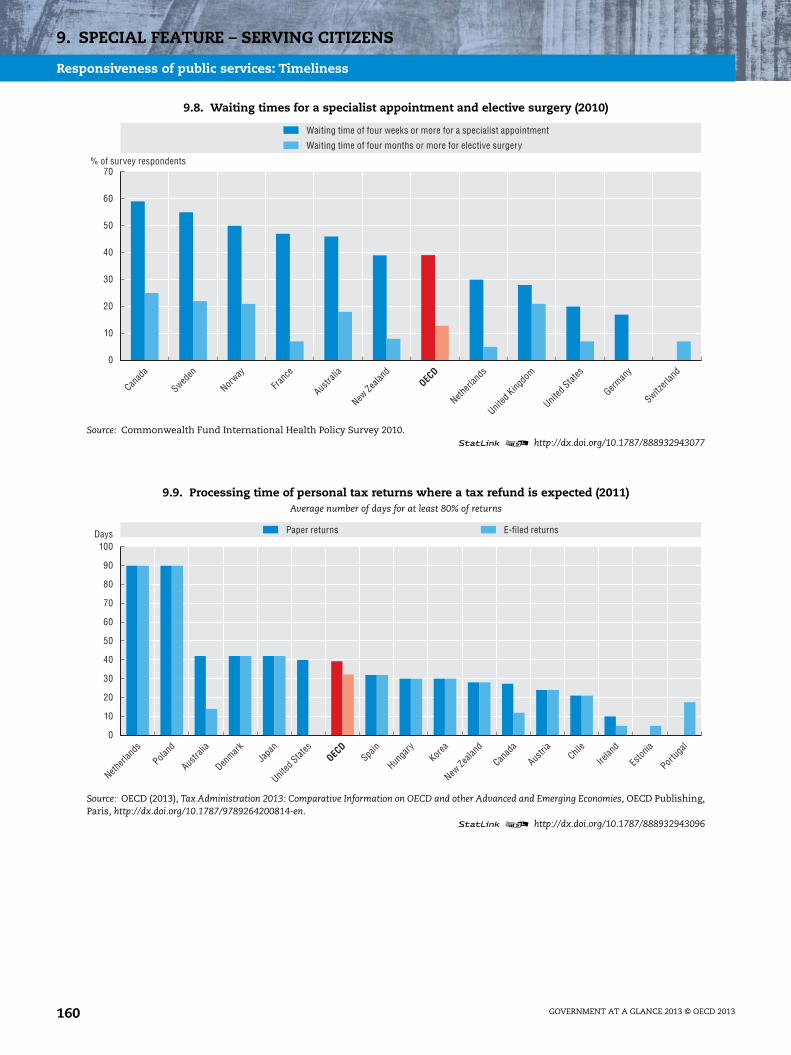
9. SPECIAL FEATURE – SERVING CITIZENS
Responsiveness of public services: Timeliness
9.8. Waiting times for a specialist appointment and elective surgery (2010)
Source: Commonwealth Fund International Health Policy Survey 2010.1 2 http://dx.doi.org/10.1787/888932943077
9.9. Processing time of personal tax returns where a tax refund is expected (2011)Average number of days for at least 80% of returns
Source: OECD (2013), Tax Administration 2013: Comparative Information on OECD and other Advanced and Emerging Economies, OECD Publishing,Paris, http://dx.doi.org/10.1787/9789264200814-en.
1 2 http://dx.doi.org/10.1787/888932943096
0
10
20
30
40
50
60
70
Waiting time of four months or more for elective surgery
Waiting time of four weeks or more for a specialist appointment
% of survey respondents
Canad
a
Sweden
Norway
Franc
e
Austra
lia
New Ze
aland
OECD
Netherl
ands
United
Kingdo
m
United
States
German
y
Switzerl
and
0
10
20
30
40
50
60
70
80
90
100
Paper returns E-filed returnsDays
Netherl
ands
Poland
Austra
lia
Denmark
Japa
n
United
States
OECD
Spain
Hunga
ryKor
ea
New Ze
aland
Canad
a
Austri
aChil
e
Irelan
d
Eston
ia
Portug
al
GOVERNMENT AT A GLANCE 2013 © OECD 2013160
9. SPECIAL FEATURE – SERVING CITIZENS
Responsiveness of public services: Timeliness
9.10. Trial length of first-instance cases in days (2012)
Source: OECD, CEPEJ, World Bank; and Palumbo, G. et al. (2013), “Judicial Performance and its Determinants: A Cross-Country Perspective”,OECD Economic Policy Papers, No. 5, OECD Publishing, Paris, http://dx.doi.org/10.1787/5k44x00md5g8-en.
1 2 http://dx.doi.org/10.1787/888932943115
0
100
200
300
400
500
600
Italy
Portug
al
Sloven
ia
Slovak
Rep
ublic
Engla
nd an
d Wale
s
Mexico
Netherl
ands
Israe
l
Franc
eSpa
in
Irelan
d
Luxe
mbourg
OECD
Belgium
Finlan
d
Turke
y
Icelan
d
Eston
ia
Hunga
ry
German
y
Denmark
Austra
lia
Sweden
New Ze
aland
Poland
Norway
Greece
Korea
Czech
Rep
ublic
Switzerl
and
Austri
aJa
pan
South
Africa
Russia
n Fed
eratio
n
Number of days
GOVERNMENT AT A GLANCE 2013 © OECD 2013 161
9. SPECIAL FEATURE – SERVING CITIZENS
Reliability of public services: Ensuring citizens’ rights
In any democratic society citizens will have a number of basicrights as well as obligations in relation to their governmentand its agencies. While measuring users’ satisfaction withpublic sector goods and services is considered to bean important indicator to evaluate performance of servicedelivery in OECD countries, few measures have been consen-sually developed on the extent to which governments designtheir institutional framework to allow citizens’ rights to beacknowledged and heard. Such a framework helps to ensurethe reliability of public services by informing citizens of theirrights and by providing them with channels of redress andquality assurance. Statements of citizens’ rights might alsopromulgate basic service and process standards, e.g. theCitizens’ Charter that existed in the United Kingdom.
The assessment of citizens’ rights recognition has becomeeven more compelling in a context of decreasing trust innational governments and in leadership. Few countrieshave a common definition of patient or taxpayer rights, letalone a standardised regulatory framework for the imple-mentation of complaint practices.
Tax administration
In the tax administration sector, the diversity of tax policiesacross countries creates different environments in whichrevenue bodies operate and, as a result, the specific detailsof taxpayer rights vary somewhat by country. Nonetheless,several common trends can be recognised and thereforeanalysed. At the beginning of last decade, the OECDCommittee of Fiscal Affairs Working Party No. 8 publisheda document displaying that, while most countries at thattime did not have an explicit “taxpayer charter”, the follow-ing basic taxpayer rights were present in all frameworks:“the right to be informed, assisted and heard; the right ofappeal; the right to pay no more than the correct amount oftax; the right to certainty; the right to privacy; and the rightto confidentiality and secrecy”.
Across OECD member countries, over the past years asignificant number of governments have developed ataxpayer or service charter in order to organise these basicrights. A taxpayer or service charter is constituted by a setof documents including statements about behavioursexpected from both officials and taxpayers. Differentpatterns concerning the characteristics related to thecharters can be found across OECD member countries. Insome cases, regulatory measures taken to protect tax-payers are consolidated into a “taxpayer charter” which islater widely published, but other settings exist. Therefore,international comparisons should take into account thatcountries without a taxpayer charter may nonethelessattach as much importance to taxpayer rights as countrieswith formal taxpayer charters statements.
As set out in Table 9.11, as of 2012 almost all revenuebodies conducting tax operations have a formalised set of
taxpayers rights set out in legislative and/or administrativeform. Of the 33 OECD member countries under analysis,30 countries have codified the rights (partly or in full) in taxlaw or other statutes, the only exceptions being Ireland,New Zealand and Turkey. On the other hand, 26 revenuebodies operate with a set of rights and obligations thatare elaborated in administrative documents (sometimesreferred to as “taxpayer” or “service” charters). Differentfactors, beyond cultural and legal issues, seem to affect thecountries’ decision to adopt a codified or an administrativeapproach in practice. On the one hand, reasons advanced insupport of adopting an administrative approach include:speed in the implementation process, a more “reader-friendly” language, broader scope (including, for example,broader rights that cannot fit the legislative process), greaterflexibility, and ease of redress. On the other hand, the bene-fits of a codified approach take into account the followingconsiderations: improved taxpayer perceptions by witness-ing a stronger commitment from the revenue bodies’ side;speed of adherence by staff to the adoption of the regulation;solidity of the document in the face of changes resultingfrom different political interests (longevity); and subjectingthe document to established mechanisms of redress andchallenge.
Health carre
In the health sector, patient rights and involvement – suchas the possibility to file a legal complaint – are consideredas basic standards in the assessment of attention given tousers in public service delivery. The analysis consideredfive elements: the existence of a formal definition orcharter for patients’ rights at the national level; whetherpatients can seek redress in courts in case of medical error;whether hospitals are required to have a patient desk forcollecting and resolving complaints; the existence of anOmbudsman office responsible for investigating andresolving complaints against health services; and whetherclass action suits are permitted against health providersand pharmaceutical companies.
The vast majority of OECD countries declared that a formaldefinition of patients’ rights exists at the national level(26 countries out of 33). Only Canada, Israel, Luxembourg,Sweden and Switzerland reported no such provision. In allcountries but Finland, Iceland, New Zealand and theSlovak Republic, patients can seek redress in courts in caseof medical errors. Hospitals are required as well to have apatient desk to register patients’ complaints in a majorityof countries (19).The vast majority of OECD countriesreported the existence of an Ombudsman in charge ofinvestigating and resolving patients’ complaints abouthealth services. Only Denmark, Japan, Korea, theNetherlands and Turkey do not have this type of mediation.
GOVERNMENT AT A GLANCE 2013 © OECD 2013162

9. SPECIAL FEATURE – SERVING CITIZENS
Reliability of public services: Ensuring citizens’ rights
Further reading
OECD (2013), Tax Administration 2013: Comparative Informa-tion on OECD and other Advanced and Emerging Economies,OECD Publishing, Paris, http://dx.doi.org/10.1787/9789264200814-en.
Paris, V., M. Devaux and L. Wei (2010), “Health Systems Insti-tutional Characteristics: A Survey of 29 OECD Countries”,OECD Health Working Papers, No. 50, OECD Publishing,Paris, http://dx.doi.org/10.1787/5kmfxfq9qbnr-en.
Figure notes
9.12: Canada: the Taxpayer Bill of Rights describes 15 rights, which are acombination of statutory rights and service rights. Statutory rightsare codified in the tax legislation and generally include a legal rightto redress. Service rights govern the revenue body relationship withtaxpayers and encompass an administrative redress process. Thisservice complaints process begins first with attempting to resolvethe matter with the relevant official in the case; if the taxpayer is notsatisfied, he/she can file a formal complaint through the ServiceComplaints Program; if he/she remains unsatisfied, he/she can file acomplaint with the Taxpayers’ Ombudsman who will provide animpartial and independent review. Chile: in February 2010, a newarticle was introduced in the Tax Code which specifies and detailsthe minimum taxpayers’ rights that are recognised and guaranteedby the law. Ireland: while there is an internal mechanism forprocessing complaints, customers can also make an appealunder statutory provisions via the Appeals Commissioners, theOmbudsman’s Office or the Equality Tribunal. Luxembourg: thetaxpayers’ rights formally defined in administrative documentsconcern direct taxes only.
Information on data for Israel: http://dx.doi.org/10.1787/888932315602.
Methodology and definitions
Data on taxpayers’ rights were drawn from TaxAdministration 2013: Comparative Information on OECDand other Advanced and Emerging Economies (OECD,2013). The information has been collected throughtwo surveys administered in OECD member countriesand a pool of other major economies: the IBFD TaxSurvey and the CIS Survey. A taxpayer or servicecharter is defined as a set of documents includingstatements about behaviours expected from bothofficials and taxpayers.
Data on patients’ right were taken from “HealthSystems Institutional Characteristics: A Survey of29 OECD Countries” (Paris et al., 2010). Informationwas collected through the OECD Survey on HealthSystem Characteristics (2008-09 and 2012). Thefollowing question was used to extract informationfrom the 2012 survey: Question 90: “Is there anyformal definition of patients’ rights at the nationallevel (e.g. through a law, a charter)?” The followingquestions were used from the 2008-09 survey:Question 76: “Are hospitals required to have a patientdesk in charge of collecting and resolving patientcomplaints?” Question 78: “What is the type of tortsystem in the country?” Question 80: “Can peopleengage in class action suits against health providers,pharmaceutical companies, etc.?” Question 81: “Arethere any Ombudsmen in charge of investigatingand resolving patients’ complaints about healthservices?” A class action suit can be defined as a legalaction brought by one or more persons on behalf ofthemselves and a much larger group, all of whomhave the same grounds for action.
GOVERNMENT AT A GLANCE 2013 © OECD 2013 163
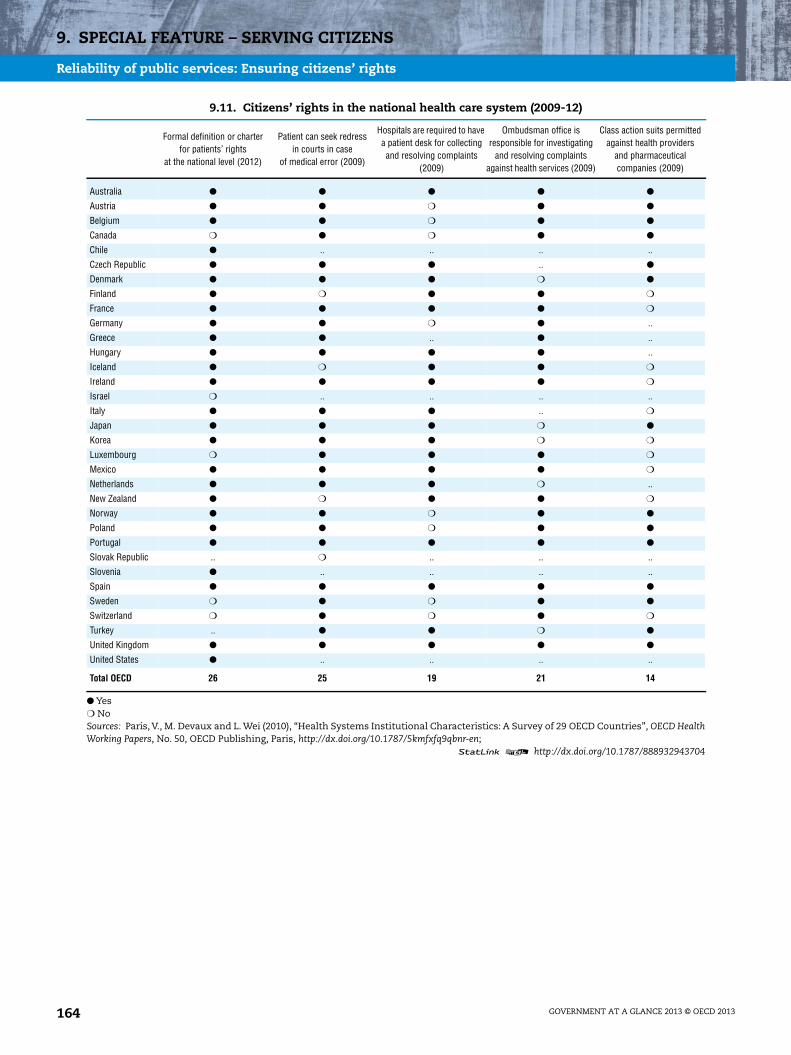
9. SPECIAL FEATURE – SERVING CITIZENS
Reliability of public services: Ensuring citizens’ rights
9.11. Citizens’ rights in the national health care system (2009-12)
Formal definition or charterfor patients’ rights
at the national level (2012)
Patient can seek redressin courts in case
of medical error (2009)
Hospitals are required to havea patient desk for collectingand resolving complaints
(2009)
Ombudsman office isresponsible for investigating
and resolving complaintsagainst health services (2009)
Class action suits permittedagainst health providers
and pharmaceuticalcompanies (2009)
Australia ● ● ● ● ●
Austria ● ● ❍ ● ●
Belgium ● ● ❍ ● ●
Canada ❍ ● ❍ ● ●
Chile ● .. .. .. ..
Czech Republic ● ● ● .. ●
Denmark ● ● ● ❍ ●
Finland ● ❍ ● ● ❍
France ● ● ● ● ❍
Germany ● ● ❍ ● ..
Greece ● ● .. ● ..
Hungary ● ● ● ● ..
Iceland ● ❍ ● ● ❍
Ireland ● ● ● ● ❍
Israel ❍ .. .. .. ..
Italy ● ● ● .. ❍
Japan ● ● ● ❍ ●
Korea ● ● ● ❍ ❍
Luxembourg ❍ ● ● ● ❍
Mexico ● ● ● ● ❍
Netherlands ● ● ● ❍ ..
New Zealand ● ❍ ● ● ❍
Norway ● ● ❍ ● ●
Poland ● ● ❍ ● ●
Portugal ● ● ● ● ●
Slovak Republic .. ❍ .. .. ..
Slovenia ● .. .. .. ..
Spain ● ● ● ● ●
Sweden ❍ ● ❍ ● ●
Switzerland ❍ ● ❍ ● ❍
Turkey .. ● ● ❍ ●
United Kingdom ● ● ● ● ●
United States ● .. .. .. ..
Total OECD 26 25 19 21 14
● Yes❍ NoSources: Paris, V., M. Devaux and L. Wei (2010), “Health Systems Institutional Characteristics: A Survey of 29 OECD Countries”, OECD HealthWorking Papers, No. 50, OECD Publishing, Paris, http://dx.doi.org/10.1787/5kmfxfq9qbnr-en;
1 2 http://dx.doi.org/10.1787/888932943704
GOVERNMENT AT A GLANCE 2013 © OECD 2013164
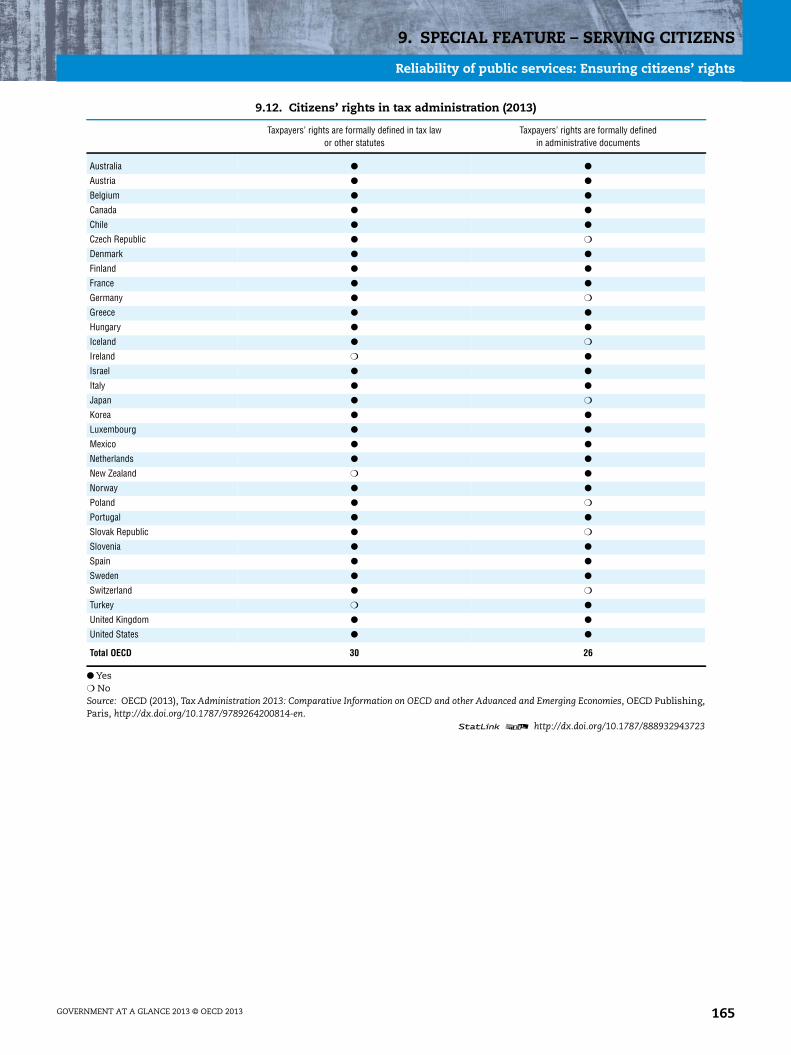
9. SPECIAL FEATURE – SERVING CITIZENS
Reliability of public services: Ensuring citizens’ rights
9.12. Citizens’ rights in tax administration (2013)
Taxpayers’ rights are formally defined in tax lawor other statutes
Taxpayers’ rights are formally definedin administrative documents
Australia ● ●
Austria ● ●
Belgium ● ●
Canada ● ●
Chile ● ●
Czech Republic ● ❍
Denmark ● ●
Finland ● ●
France ● ●
Germany ● ❍
Greece ● ●
Hungary ● ●
Iceland ● ❍
Ireland ❍ ●
Israel ● ●
Italy ● ●
Japan ● ❍
Korea ● ●
Luxembourg ● ●
Mexico ● ●
Netherlands ● ●
New Zealand ❍ ●
Norway ● ●
Poland ● ❍
Portugal ● ●
Slovak Republic ● ❍
Slovenia ● ●
Spain ● ●
Sweden ● ●
Switzerland ● ❍
Turkey ❍ ●
United Kingdom ● ●
United States ● ●
Total OECD 30 26
● Yes❍ NoSource: OECD (2013), Tax Administration 2013: Comparative Information on OECD and other Advanced and Emerging Economies, OECD Publishing,Paris, http://dx.doi.org/10.1787/9789264200814-en.
1 2 http://dx.doi.org/10.1787/888932943723
GOVERNMENT AT A GLANCE 2013 © OECD 2013 165

9. SPECIAL FEATURE – SERVING CITIZENS
Citizen satisfaction with public services
Measuring users’ satisfaction with public goods andservices is at the heart of a citizen-centric approach toservice delivery and an important component of organisa-tional performance strategies for continual improvement.Perception data are commonly used to evaluate citizens’experiences with government organisations and obtaintheir views on the outputs received. Such information canhelp public managers identify which elements of servicedelivery drive satisfaction, as well as monitor the impact ofreforms on end-users. Measuring citizen satisfaction is alsoa means of allowing policy makers and managers to betterunderstand their customer base, helping to identifysub-groups of users and needs or gaps in accessibility.Moreover, citizen satisfaction can be an important outcomeindicator of overall government performance.
In efforts to improve the responsiveness and quality of publicservices, more and more government organisations areproactively seeking and acting on feedback from citizensabout their experiences. Canada’s “common measurementtool” and Italy and France’s “quality barometers”, for example,are designed to allow different government organisations tomeasure and track service quality over time, and incorporateperception data from citizens. The French government has inplace a panel of respondents providing continuous feedbackon services delivered, particularly those corresponding tomajor life events.
In general across OECD member countries, public servicesare highly valued by the majority of citizens. In 2012, forinstance, 72% of citizens on average across OECD membercountries reported having confidence in their local policeforce. Almost the same percentage considered themselvessatisfied with the availability of quality health care, and66% were satisfied with the education system and schoolsin their city or area.
On average, levels of satisfaction remained fairly consistentduring and immediately following the economic and socialcrisis. Between 2007 and 2012, levels of citizen satisfactionincreased only marginally, by less than 2 percentage points,in all three service areas analysed here. There are, however,large differences between countries. Fewer OECD countriesexperienced an increase in confidence in local police(15 countries) than a rise in satisfaction with education(19 countries) and health care (19 countries). Confidence inlocal police increased the most in Estonia (by 14 percentagepoints) and the Slovak Republic (13 p.p.), whereas it consi-derably declined in Mexico (15 p.p.) and Hungary (7 p.p.).Satisfaction with the education system increased the mostin Israel and the United Kingdom (both by 9 p.p.) anddecreased the most in Chile (17 p.p.) and Mexico (11 p.p.).All except nine countries saw their level of satisfactionwith health care change within the 5 percentage pointrange, the strongest increases occurring in Hungary(10 p.p.) and the United Kingdom (8 p.p.), and the mostsignificant drops in Greece (23 p.p.) and Japan (10 p.p.).
Overall, satisfaction with services is higher than confi-dence in national government. On average in 2012 acrossOECD member countries, confidence in local police and
satisfaction with health care are both 30 percentage pointshigher than confidence in government, and satisfactionwith the education system is 26 percentage points higher.
Further reading
OECD (2012), Measuring Regulatory Performance: A Practitioner’sGuide to Perception Surveys, OECD Publishing, Paris, http://dx.doi.org/10.1787/9789264167179-en.
Figure notes
Data for Austria, Finland, France, Ireland, Portugal, the Slovak Republic,Slovenia and Switzerland are for 2006 rather than 2007. Data forChile, Germany and the United Kingdom are for 2011 ratherthan 2012. For confidence in local police and satisfaction with healthcare, data for Japan, Korea and Mexico are for 2011 rather than 2012.
Information on data for Israel: http://dx.doi.org/10.1787/888932315602.
Methodology and definitions
Data are drawn from the Gallup World Poll which isconducted in approximately 140 countries around theworld based on a common questionnaire, translatedinto the predominant languages of each country. Withfew exceptions, all samples are probability-based andnationally representative of the resident populationaged 15 and over in the entire country (including ruralareas). However, results may be affected by samplingand non-sampling errors. Sample sizes are a minimum1 000 persons in each country. See Chapter 1 for abroader discussion on the measurement of trust ingovernment.
Data for confidence in local police refer to thepercentage of “yes” answers to the question: “In thecity or area where you live, do you have confidence inthe local police force?”
Data for satisfaction with the education system andschools refer to the percentage of “satisfied” answersto the question: “In the city or area where you live, areyou satisfied or dissatisfied with the educationalsystem or the schools?”
Data for satisfaction with the availability of qualityhealth care: refer to the percentage of “satisfied”answers to the question: “In the city or area whereyou live, are you satisfied or dissatisfied with theavailability of quality health care?”
Figure 9.14, “Levels of satisfaction and confidenceacross selected public services compared to confi-dence in national government (2012)” can be foundon line at http://dx.doi.org/10.1787/888932943153.
GOVERNMENT AT A GLANCE 2013 © OECD 2013166
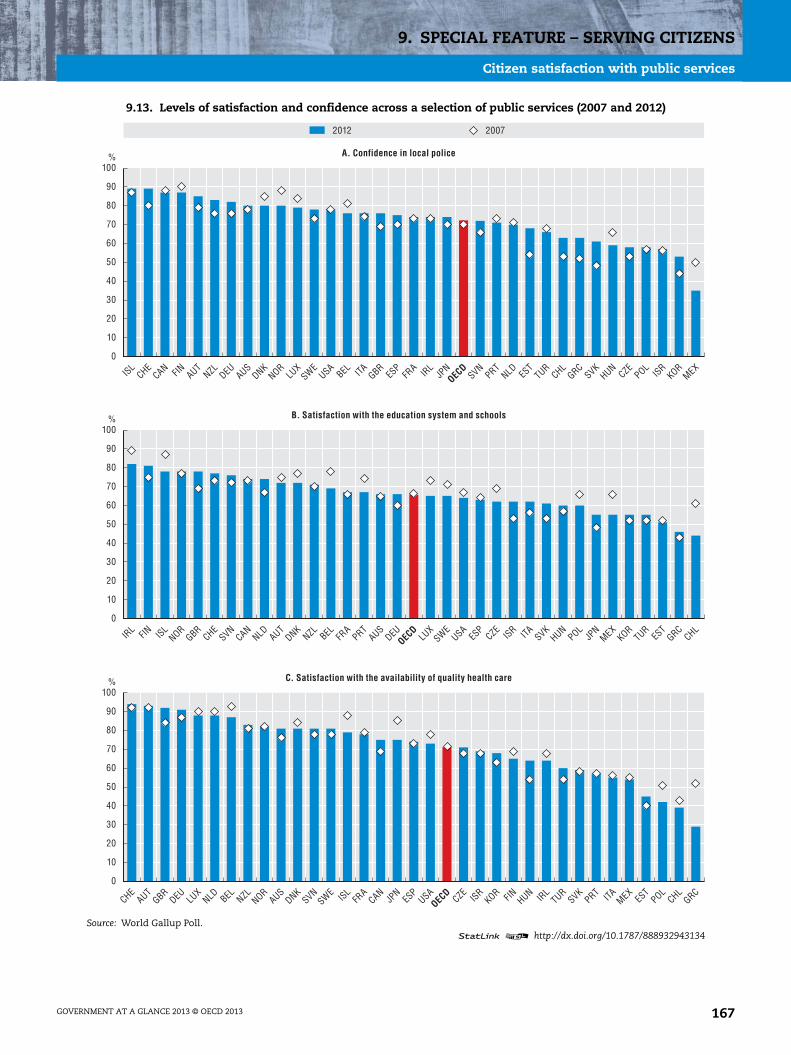
9. SPECIAL FEATURE – SERVING CITIZENS
Citizen satisfaction with public services
9.13. Levels of satisfaction and confidence across a selection of public services (2007 and 2012)
Source: World Gallup Poll.1 2 http://dx.doi.org/10.1787/888932943134
2012 2007
0
10
20
30
40
50
60
70
80
90
100
0
10
20
30
40
50
60
70
80
90
100
0
10
20
30
40
50
60
70
80
90
100
%
%
%
ISLCHE
CAN FIN AUTNZL DEU AUS
DNKNOR
LUX
SWEUSA
BEL ITA GBRES
PFR
A IRL
JPN
SVNPRT
NLD EST
TURCHL
GRCSVK
HUNCZE
POLISR
KORMEX
IRL FIN ISL
NORGBR
CHESVN
CANNLD AUT
DNKNZL BEL FR
APRT
AUSDEU LU
XSWE
USAES
PCZE
ISR ITA SVKHUN
POLJP
NMEX
KORTUR
EST
GRCCHL
CHEAUT
GBRDEU LU
XNLD BEL NZL NOR
AUSDNK
SVNSWE ISL
FRA
CANJP
NES
PUSA
CZEISR
KOR FIN HUN IRL
TURSVK
PRT ITA MEXES
TPOL
CHLGRC
A. Confidence in local police
B. Satisfaction with the education system and schools
C. Satisfaction with the availability of quality health care
OECD
OECD
OECD
GOVERNMENT AT A GLANCE 2013 © OECD 2013 167

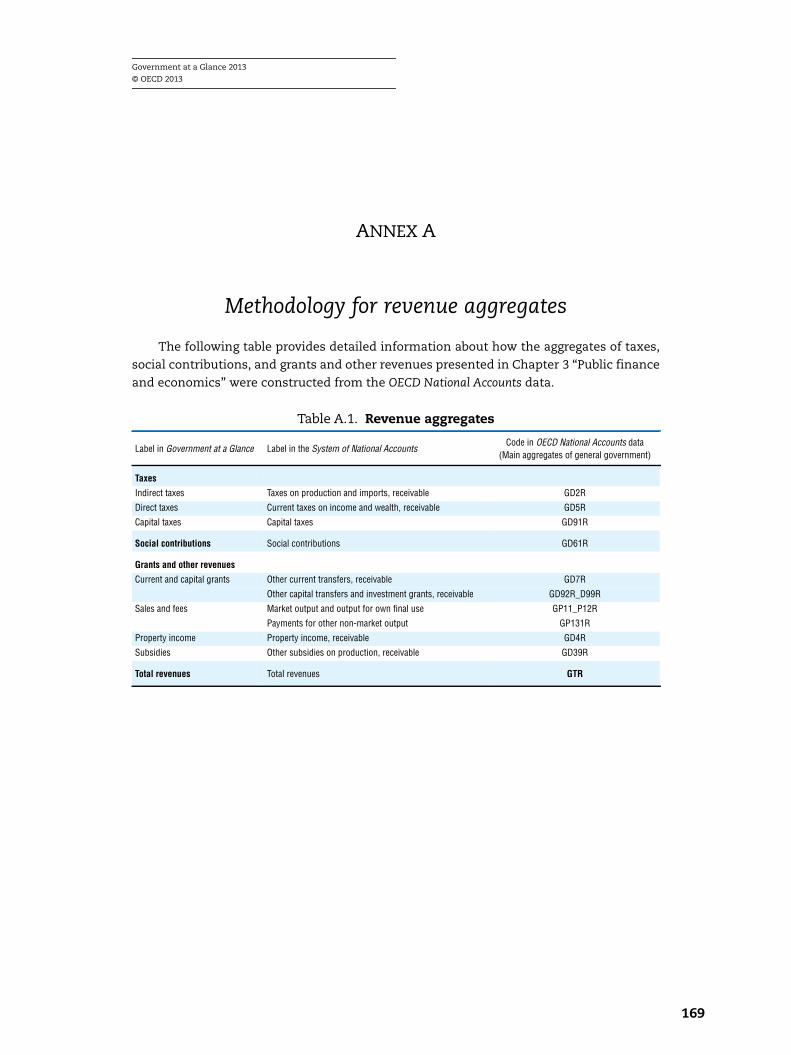
Government at a Glance 2013
© OECD 2013
ANNEX A
Methodology for revenue aggregates
The following table provides detailed information about how the aggregates of taxes,
social contributions, and grants and other revenues presented in Chapter 3 “Public finance
and economics” were constructed from the OECD National Accounts data.
Table A.1. Revenue aggregates
Label in Government at a Glance Label in the System of National AccountsCode in OECD National Accounts data
(Main aggregates of general government)
Taxes
Indirect taxes Taxes on production and imports, receivable GD2R
Direct taxes Current taxes on income and wealth, receivable GD5R
Capital taxes Capital taxes GD91R
Social contributions Social contributions GD61R
Grants and other revenues
Current and capital grants Other current transfers, receivable GD7R
Other capital transfers and investment grants, receivable GD92R_D99R
Sales and fees Market output and output for own final use GP11_P12R
Payments for other non-market output GP131R
Property income Property income, receivable GD4R
Subsidies Other subsidies on production, receivable GD39R
Total revenues Total revenues GTR
169
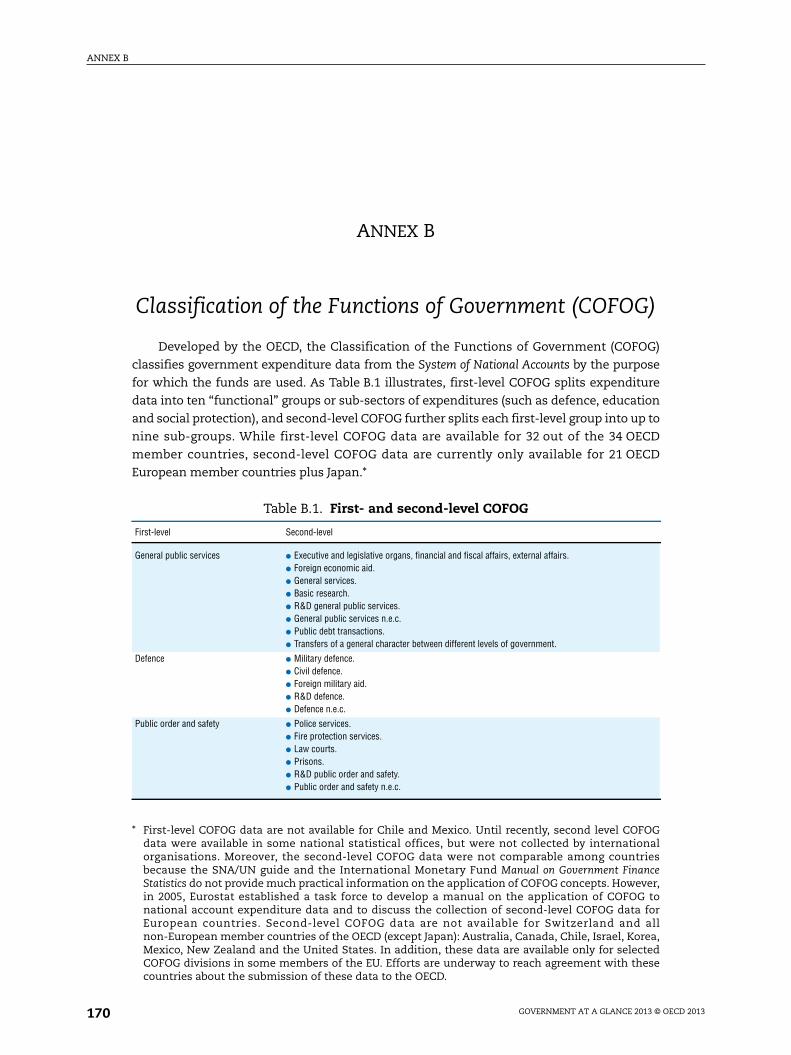
ANNEX B
ANNEX B
Classification of the Functions of Government (COFOG)
Developed by the OECD, the Classification of the Functions of Government (COFOG)
classifies government expenditure data from the System of National Accounts by the purpose
for which the funds are used. As Table B.1 illustrates, first-level COFOG splits expenditure
data into ten “functional” groups or sub-sectors of expenditures (such as defence, education
and social protection), and second-level COFOG further splits each first-level group into up to
nine sub-groups. While first-level COFOG data are available for 32 out of the 34 OECD
member countries, second-level COFOG data are currently only available for 21 OECD
European member countries plus Japan.*
Table B.1. First- and second-level COFOG
First-level Second-level
General public services ● Executive and legislative organs, financial and fiscal affairs, external affairs.● Foreign economic aid.● General services.● Basic research.● R&D general public services.● General public services n.e.c.● Public debt transactions.● Transfers of a general character between different levels of government.
Defence ● Military defence.● Civil defence.● Foreign military aid.● R&D defence.● Defence n.e.c.
Public order and safety ● Police services.● Fire protection services.● Law courts.● Prisons.● R&D public order and safety.● Public order and safety n.e.c.
* First-level COFOG data are not available for Chile and Mexico. Until recently, second level COFOGdata were available in some national statistical offices, but were not collected by internationalorganisations. Moreover, the second-level COFOG data were not comparable among countriesbecause the SNA/UN guide and the International Monetary Fund Manual on Government FinanceStatistics do not provide much practical information on the application of COFOG concepts. However,in 2005, Eurostat established a task force to develop a manual on the application of COFOG tonational account expenditure data and to discuss the collection of second-level COFOG data forEuropean countries. Second-level COFOG data are not available for Switzerland and allnon-European member countries of the OECD (except Japan): Australia, Canada, Chile, Israel, Korea,Mexico, New Zealand and the United States. In addition, these data are available only for selectedCOFOG divisions in some members of the EU. Efforts are underway to reach agreement with thesecountries about the submission of these data to the OECD.
GOVERNMENT AT A GLANCE 2013 © OECD 2013170

ANNEX B
Economic affairs ● General economic, commercial and labour affairs.● Agriculture, forestry, fishing and hunting.● Fuel and energy.● Mining, manufacturing and construction.● Transport.● Communication.● Other industries.● R&D economic affairs.● Economic affairs n.e.c.
Environmental protection ● Waste management.● Waste water management.● Pollution abatement.● Protection of biodiversity and landscape.● R&D environmental protection.● Environmental protection n.e.c.
Housing and community amenities ● Housing development.● Community development.● Water supply.● Street lighting.● R&D housing and community amenities.● Housing and community amenities n.e.c.
Health care ● Medical products, appliances and equipment.● Outpatient services.● Hospital services.● Public health services.● R&D health.● Health n.e.c.
Recreation, culture and religion ● Recreational and sporting services.● Cultural services.● Broadcasting and publishing services.● Religious and other community services.● R&D recreation, culture and religion.● Recreation, culture and religion n.e.c.
Education ● Pre-primary and primary education.● Secondary education.● Post-secondary non-tertiary education.● Tertiary education.● Education not definable by level.● Subsidiary services to education.● R&D education.● Education n.e.c.
Social protection ● Sickness and disability.● Old age.● Survivors.● Family and children.● Unemployment.● Housing.● Social exclusion n.e.c.● R&D social protection.● Social protection n.e.c.
n.e.c.: Not elsewhere classified.
Table B.1. First- and second-level COFOG
First-level Second-level
GOVERNMENT AT A GLANCE 2013 © OECD 2013 171
ANNEX C
ANNEX C
Composite indexes budget practices
This edition of Government at a Glance includes two composite indexes related to
budgetary practices: the use of a medium-term perspective in the budget process and the
use of a performance budgeting system. Data used for the construction of the composites
are derived from the 2012 OECD Survey on Budgeting Practices and Procedures and
the 2011 OECD Survey on Performance Budgeting. Survey respondents were predominantly
senior officials in the Ministry of Finance.
The narrowly defined composite indexes presented in Government at a Glance represent
the best way of summarising discrete, qualitative information on key aspects of budgetary
practices such as medium-term expenditure frameworks and performance budgeting.
“Composite indexes are much easier to interpret than trying to find a common trend in
many separate indicators” (Nardo et al., 2004). However, their development and use can be
controversial. These indexes are easily and often misinterpreted by users due to a lack of
transparency as to how they are generated and the resulting difficulty to truly unpack what
they are actually measuring.
The OECD has taken several steps to avoid or address common problems associated
with composite indexes. The composites presented in this publication adhere to the steps
identified in the Handbook on Constructing Composite Indicators (Nardo et al., 2008) that are
necessary for the meaningful construction of composite or synthetic indexes.
Each composite index is based on a theoretical framework representing an agreed-
upon concept in the area it covers. The variables comprising the indexes were selected
based on their relevance to the concept by a group of experts within the OECD and in
consultation with country delegates to the relevant working parties.
● Various statistical tools, such as factor analysis, were employed to establish that the
variables comprising each index are correlated and represent the same underlying concept.
● Different methods for imputing missing values have been explored.
● All sub-indicators and variables were normalised for comparability.
● To build the composites, all sub-indicators were aggregated using a linear method
according to the accepted methodology.
● Sensitivity analysis using Monte Carlo simulations was carried out to establish the
robustness of the indicators to different weighting options (e.g. equal weighting, factor
weighting and expert weighting). Expert weighting resulted as the most appropriate
weighting method.
GOVERNMENT AT A GLANCE 2013 © OECD 2013172
ANNEX C
The indexes do not purport to measure the overall quality of budgetary systems. To do
so would require a much stronger conceptual foundation and normative assumptions.
Rather, the composite indexes presented in Government at a Glance are descriptive in nature,
and have been given titles to reflect this. The survey questions used to create the indexes
are the same across countries, ensuring that the indexes are comparable.
While the composite indexes were developed in co-operation with member countries
and are based on best practices and/or theory, both the variables comprising the
composites and their weights are offered for debate and, consequently, may evolve over
time. The OECD is currently redefining best practices for budget transparency and is
revisiting the concept of budgetary flexibility; as such, no composites related to these
topics are presented in this edition. The composites displayed in the 2013 edition of
Government at a Glance are not comparable with those in the 2009 edition, as they are built
on renewed versions of the surveys including additional or differently worded questions
and different weights.
The composites were built according to the following methodology: each of the topics
was divided into broad categories comprising the theoretically relevant aspects for each of
the two subject areas (medium-term expenditure frameworks and performance
budgeting). A weight was assigned to each of these broad categories. Within each of the
broad categories, the relevant questions were identified, a sub-weight was assigned to each
question and a score was given to each of the answers within these questions. The country
scoring for each question is the product of the weight of the broad category and the
sub-weight of the question multiplied by the answer provided by each country (1 or 0). The
composite is the result of adding together these scores for each country. Both composites
vary from 0 to 1; a score of 1 implies the use of sound practices on a given topic.
GOVERNMENT AT A GLANCE 2013 © OECD 2013 173
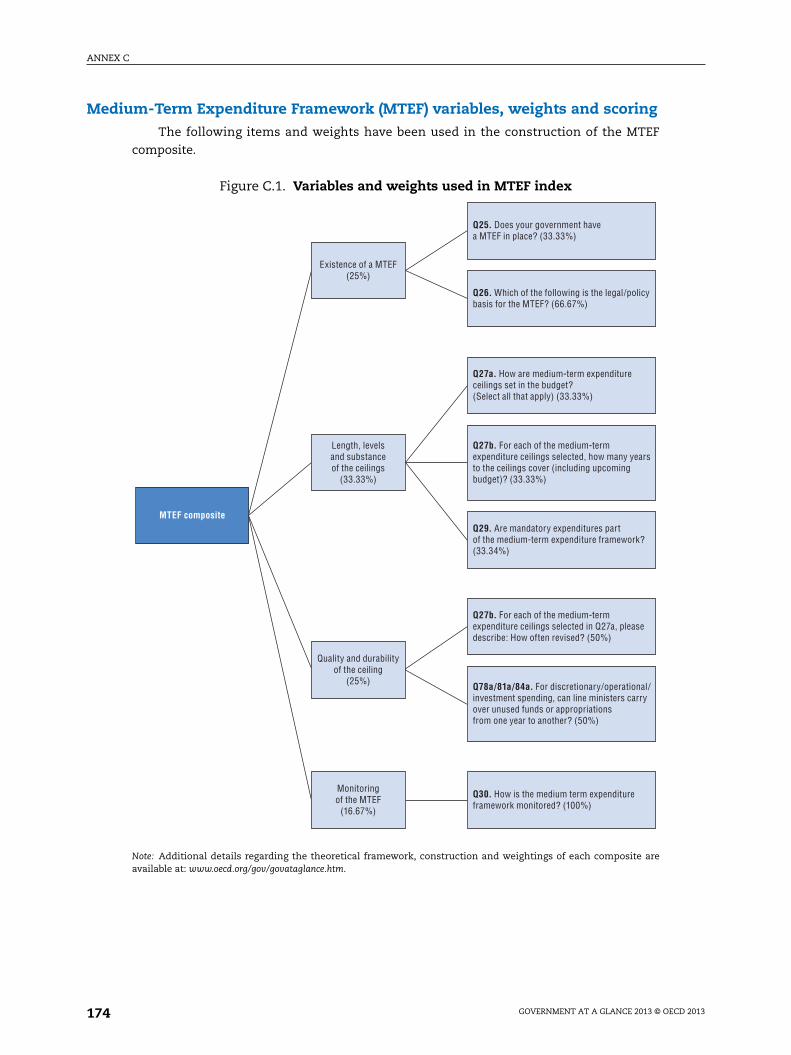
ANNEX C
Medium-Term Expenditure Framework (MTEF) variables, weights and scoringThe following items and weights have been used in the construction of the MTEF
composite.
Figure C.1. Variables and weights used in MTEF index
Note: Additional details regarding the theoretical framework, construction and weightings of each composite areavailable at: www.oecd.org/gov/govataglance.htm.
MTEF composite
Existence of a MTEF(25%)
Length, levelsand substanceof the ceilings
(33.33%)
Quality and durabilityof the ceiling
(25%)
Monitoringof the MTEF
(16.67%)
Q25. Does your government havea MTEF in place? (33.33%)
Q26. Which of the following is the legal/policybasis for the MTEF? (66.67%)
Q27a. How are medium-term expenditureceilings set in the budget?(Select all that apply) (33.33%)
Q27b. For each of the medium-termexpenditure ceilings selected, how many yearsto the ceilings cover (including upcomingbudget)? (33.33%)
Q29. Are mandatory expenditures partof the medium-term expenditure framework?(33.34%)
Q27b. For each of the medium-termexpenditure ceilings selected in Q27a, pleasedescribe: How often revised? (50%)
Q78a/81a/84a. For discretionary/operational/investment spending, can line ministers carryover unused funds or appropriationsfrom one year to another? (50%)
Q30. How is the medium term expenditureframework monitored? (100%)
GOVERNMENT AT A GLANCE 2013 © OECD 2013174

ANNEX C
Use of a performance budgeting system at the central level, weights and scoringThe following items and weights have been used in the construction of the MTEF.
Figure C.2. Variables and weights used in the performance budgeting index
Note: Additional details regarding the theoretical framework, construction and weightings of each composite areavailable at: www.oecd.org/gov/govataglance.htm.
Performancecomposite
Existence of performanceinformation (65%)
Use of performanceinformation in the budget
negotiations (20%)
Consequences of not achievingthe targets (15%)
Q11a. Does the CBA have in place a standardperformance budgeting framework? (16.7%)
Q11b. What are the key elementsof this standard framework? (16.7%)
Q22. When setting performance targets,against what benchmark(s) are they generallyset against? (16.7%)
Q61g. Are non-financial performance targets includedin the budget documents to the legislature? (16.67%)
Q13. Please indicate which institutions playimportant roles in: d) conducting evaluations (8.34%)
Q13. Please indicate which institutions playimportant roles in: c) generating performanceinformation (8.34%)
Q18. Please estimate what percentage of the totalperformance information provided by lineministries/agencies to the CBA as part of their budgetsubmissions falls into the followingcategories (16.67%)
Q14. How often do the Central Budget Authority (CBA)and line ministries utilise the following kindsof performance information in their budgetnegotiations? (10%)
Q16. How often do line ministries and agencies utilisethe following kinds of performance informationin their budget negotiations? (25%)
Q19. How do the sectors of central governmentgenerally utilise PI in their budget negotiationswith the CBA? The scores are based on averagesof the following sectors: education, health care,social protection, defence, public orderand general public services (65%)
Q24. If performance targets are not met by lineministries/agencies, how likely is it that anyof the following consequences are triggered? (100%)
GOVERNMENT AT A GLANCE 2013 © OECD 2013 175
ANNEX D
ANNEX D
Methodology and additional notes on compensationof government employees
Compensation plays an important role in both attracting and motivating qualified
workers in the public sector. As part of fiscal consolidation efforts in many OECD countries,
government employees’ compensation is being called into question, involving in some
cases decreases in salaries and/or benefits or pay freezes. In 2010, the OECD launched a
database, updated in 2012, on compensation levels for typical occupations in central
government in core ministries that contributes to a better understanding of the salary
structures and pay levels in the public sector. Since there is no common definition of
managerial positions and the number of managerial levels varies across countries and
ministries, this compensation survey offers a common typology for specific occupations in
central government. Comparing average compensation in the public sector can be
misleading because the public sector in different countries includes various and
heterogeneous occupations. However, this survey provides compensation data for
comparable occupations, hence improving our knowledge of the public sector.
The comparison of compensation levels for senior managers, middle managers,
professionals and secretaries shows their relative total remuneration across OECD
countries, which includes not only wages salaries but also contributions to health and
pension benefits. Therefore when comparing compensation levels, we have a more or less
full-cost approach that allows for consistent comparisons across countries.
Compensation data are also compared within countries to the average wage paid to
tertiary-educated workers, reflecting the relative attractiveness of these professions to
others requiring similar levels of education. Comparison must also take into account
various levels of economic development in the countries, hence the correction by GDP per
capita. However comparison between countries must be made with caution because of
different labour markets, different cultural and political consensus, and possible
differences in wage defining characteristics even for the same occupational groups across
countries, which are not corrected for in this analysis.
OccupationsThe survey on Compensation of Employees in Federal/Central Government provides
an update to the previous 2010 survey. The data collected through this survey will enable
The statistical data for Israel are supplied by and under the responsibility of the relevant Israeliauthorities. The use of such data by the OECD is without prejudice to the status of the Golan Heights,East Jerusalem and Israeli settlements in the West Bank under the terms of international law.
GOVERNMENT AT A GLANCE 2013 © OECD 2013176
ANNEX D
forled
ts.
on.
comparative analysis and further work on compensation policies and practices. This
survey aims at collecting information on annual compensation of employees for a sample
of occupations in central/federal/national government. The purpose is to build a database
on compensation levels for typical positions in central government that contributes to a
better understanding of the salary structures and pay levels in the public service.
The survey focuses on central/federal government level and excludes states, regional and
local levels and social security institutions. The survey excludes all public and quasi-public
corporations at all government levels. The survey doesn’t cover the subordinated offices/
organisations of central government ministries, often referred to as “agencies”. It also focuses
on employees working full-time, excluding consultants and short-term staff.
The questionnaire collects data for four typical occupational groups in central/federal
government: top managers, middle managers, professionals, and secretaries. These
occupations are considered relatively representative and comparable across countries.
Information for these occupations – except the service occupations – is collected from
three core ministries (Interior, Finance and Justice) and three sectoral ministries
(Education, Health and Environment). Box D.1 describes the typical responsibilities of the
ministries covered in this survey.
Box D.1. Typical responsibilities of the ministries covered in this survey
The following description of activities or functions of the ministries covered in this survey wasguidance only. In some countries the name of the ministry may be different or may be even caldepartment or secretariat.
Ministry of Interior/Home Affairs
● Ensures the representation of the State in the entire territory.
● Ensures the respect of citizens’ rights in general by universal suffrage.
● Ensures the respect of competencies of local authorities within the framework of devolution.
● Defines immigration policy.
● Establishes and co-ordinates national security policy.
● Ensures the maintenance of a peaceful and safe society.
● Ensures the preservation of internal security and the protection of the constitutional order.
Ministry of Finance
● Plans and prepares government’s budget.
● Analyses and designs tax policies.
● Develops and implements regulations for financial institutions.
● Monitors economic and financial developments.
● Administers the transfer of funds from national/central/federal government to sub-national governmen
Ministry of Justice
● Ensures the well functioning of the judiciary system.
● Prepares the text of law and regulations for some specific fields.
● Defines the main orientations of the public policy in terms of justice and looks after its implementati
● Provides support to the victims of crime.
● Provides fair, consistent, and effective enforcement of punishment and other sanctions.
GOVERNMENT AT A GLANCE 2013 © OECD 2013 177
ANNEX D
ool
of
the
to
te/adof
ndey
ivend
hete/cein
lar
Box D.2 contains the classification and definitions of the occupations covered in this
survey and which are considered to be relatively typical in every government. There is a
large focus on managers in general as the criteria for considering an official to be a
manager is to supervise and lead the work of at least three people. Because it is extremely
difficult to provide for more detailed descriptions of responsibilities that differentiate
across the different layers of management, the option has been chosen to focus on
hierarchical differentiation rather than a more detailed description of functions.
Box D.1. Typical responsibilities of the ministries covered in this survey (cont.)
Ministry of Education
● Regulates, co-ordinates, and organises the national educational system, generally from primary schto secondary or high school.
● Ensures equal access to public education.
● Controls and assesses schools and higher education institutions both private and public.
● Ensures an effective management of the teachers and administrative workforce.
Ministry of Health
● Designs and implements public health policy (prevention, sanitary organisation and formationprofessionals).
● Defines the policy relative to sport and for fighting drug addiction.
● In collaboration with other ministries, it defines industrial safety regulations and social security.
Ministry of Environment
● Defines and manages the legislative and regulatory framework related to the protection ofenvironment and the efficient use of natural resources.
● Certifies the facilities, land uses and industries across the country to ensure that potential risksenvironment, human health, safety and property are minimised.
Box D.2. Classification and definition of occupations
Top managers
D1 Managers (part of ISCO-08 1112) are top public servants just below the minister or Secretary of Stajunior minister. They can be a member of the senior civil service and/or appointed by the government or heof government. They advise government on policy matters, oversee the interpretation and implementationgovernment policies and, in some countries, have executive powers. D1 managers may be entitled to attesome Cabinet/Council of ministers meetings, but they are not part of the Cabinet/Council of ministers. Thprovide overall direction and management to the ministry/Secretary of State or a particular administratarea. In countries with a system of autonomous agencies, decentralised powers, flatter organisations aempowered managers. The precise job title can differ across countries.
D2 Managers (part of ISCO-08 11 and 112) are just below D1 managers. They formulate and review tpolicies and plan, direct, co-ordinate and evaluate the overall activities of the ministry or special directoraunit with the support of other managers. They may be part of the senior civil service. They provide guidanin the co-ordination and management of the programme of work and leadership to professional teamsdifferent policy areas. They determine the objectives, strategies, and programmes for the particuadministrative unit/department under their supervision.
GOVERNMENT AT A GLANCE 2013 © OECD 2013178
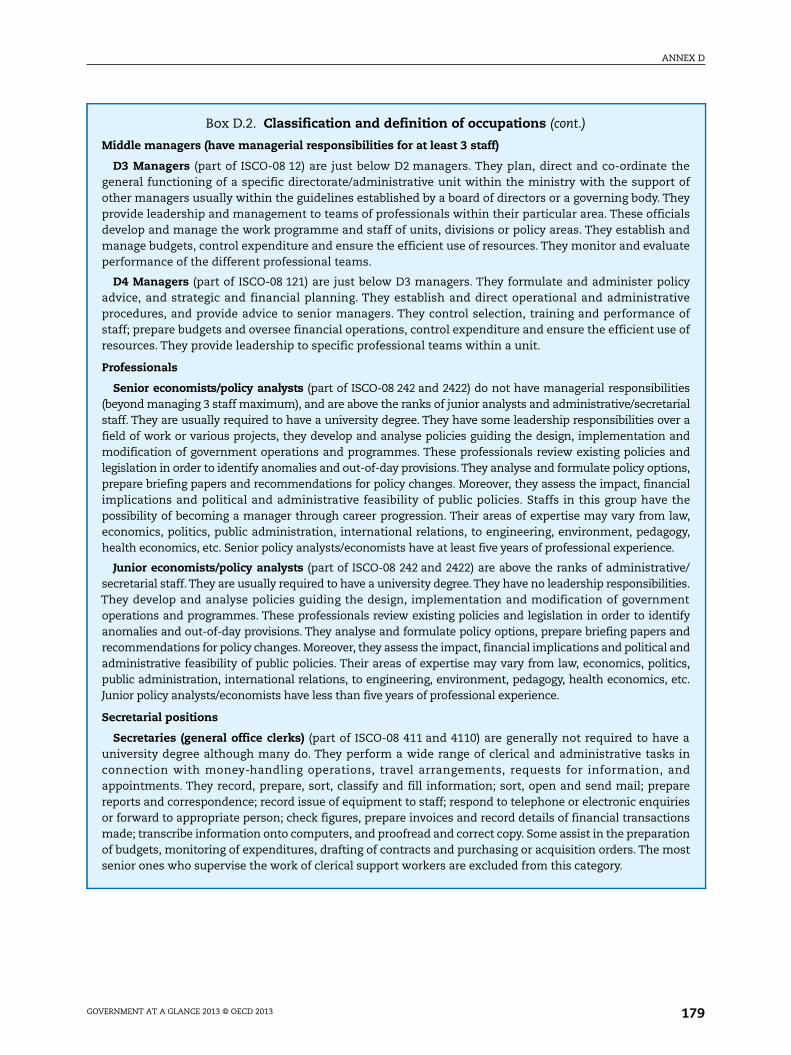
ANNEX D
heofey
alsndate
icyiveofof
iesrialr andndns,ial
theaw,gy,
ve/ies.nt
tifyndnd
ics,tc.
e ain
ndareiesns
ionost
Box D.2. Classification and definition of occupations (cont.)
Middle managers (have managerial responsibilities for at least 3 staff)
D3 Managers (part of ISCO-08 12) are just below D2 managers. They plan, direct and co-ordinate tgeneral functioning of a specific directorate/administrative unit within the ministry with the supportother managers usually within the guidelines established by a board of directors or a governing body. Thprovide leadership and management to teams of professionals within their particular area. These officidevelop and manage the work programme and staff of units, divisions or policy areas. They establish amanage budgets, control expenditure and ensure the efficient use of resources. They monitor and evaluperformance of the different professional teams.
D4 Managers (part of ISCO-08 121) are just below D3 managers. They formulate and administer poladvice, and strategic and financial planning. They establish and direct operational and administratprocedures, and provide advice to senior managers. They control selection, training and performancestaff; prepare budgets and oversee financial operations, control expenditure and ensure the efficient useresources. They provide leadership to specific professional teams within a unit.
Professionals
Senior economists/policy analysts (part of ISCO-08 242 and 2422) do not have managerial responsibilit(beyond managing 3 staff maximum), and are above the ranks of junior analysts and administrative/secretastaff. They are usually required to have a university degree. They have some leadership responsibilities ovefield of work or various projects, they develop and analyse policies guiding the design, implementation amodification of government operations and programmes. These professionals review existing policies alegislation in order to identify anomalies and out-of-day provisions. They analyse and formulate policy optioprepare briefing papers and recommendations for policy changes. Moreover, they assess the impact, financimplications and political and administrative feasibility of public policies. Staffs in this group havepossibility of becoming a manager through career progression. Their areas of expertise may vary from leconomics, politics, public administration, international relations, to engineering, environment, pedagohealth economics, etc. Senior policy analysts/economists have at least five years of professional experience.
Junior economists/policy analysts (part of ISCO-08 242 and 2422) are above the ranks of administratisecretarial staff. They are usually required to have a university degree. They have no leadership responsibilitThey develop and analyse policies guiding the design, implementation and modification of governmeoperations and programmes. These professionals review existing policies and legislation in order to idenanomalies and out-of-day provisions. They analyse and formulate policy options, prepare briefing papers arecommendations for policy changes. Moreover, they assess the impact, financial implications and political aadministrative feasibility of public policies. Their areas of expertise may vary from law, economics, politpublic administration, international relations, to engineering, environment, pedagogy, health economics, eJunior policy analysts/economists have less than five years of professional experience.
Secretarial positions
Secretaries (general office clerks) (part of ISCO-08 411 and 4110) are generally not required to havuniversity degree although many do. They perform a wide range of clerical and administrative tasksconnection with money-handling operations, travel arrangements, requests for information, aappointments. They record, prepare, sort, classify and fill information; sort, open and send mail; prepreports and correspondence; record issue of equipment to staff; respond to telephone or electronic enquiror forward to appropriate person; check figures, prepare invoices and record details of financial transactiomade; transcribe information onto computers, and proofread and correct copy. Some assist in the preparatof budgets, monitoring of expenditures, drafting of contracts and purchasing or acquisition orders. The msenior ones who supervise the work of clerical support workers are excluded from this category.
GOVERNMENT AT A GLANCE 2013 © OECD 2013 179
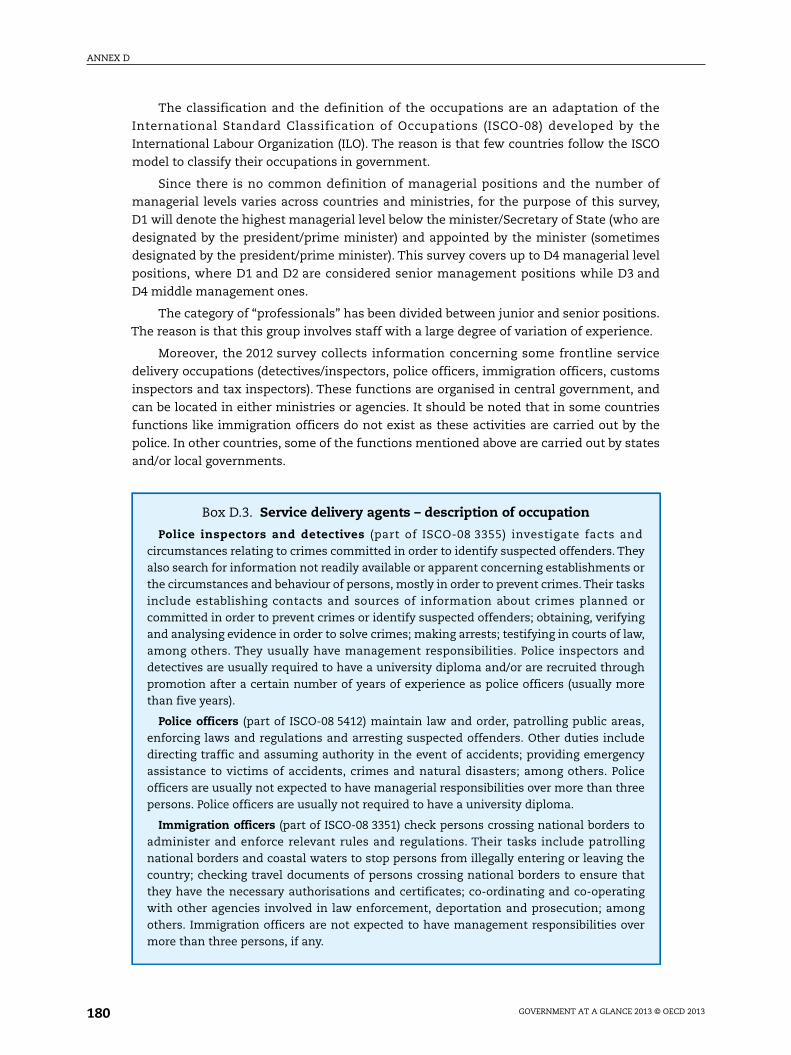
ANNEX D
The classification and the definition of the occupations are an adaptation of the
International Standard Classification of Occupations (ISCO-08) developed by the
International Labour Organization (ILO). The reason is that few countries follow the ISCO
model to classify their occupations in government.
Since there is no common definition of managerial positions and the number of
managerial levels varies across countries and ministries, for the purpose of this survey,
D1 will denote the highest managerial level below the minister/Secretary of State (who are
designated by the president/prime minister) and appointed by the minister (sometimes
designated by the president/prime minister). This survey covers up to D4 managerial level
positions, where D1 and D2 are considered senior management positions while D3 and
D4 middle management ones.
The category of “professionals” has been divided between junior and senior positions.
The reason is that this group involves staff with a large degree of variation of experience.
Moreover, the 2012 survey collects information concerning some frontline service
delivery occupations (detectives/inspectors, police officers, immigration officers, customs
inspectors and tax inspectors). These functions are organised in central government, and
can be located in either ministries or agencies. It should be noted that in some countries
functions like immigration officers do not exist as these activities are carried out by the
police. In other countries, some of the functions mentioned above are carried out by states
and/or local governments.
Box D.3. Service delivery agents – description of occupation
Police inspectors and detectives (part of ISCO-08 3355) investigate facts andcircumstances relating to crimes committed in order to identify suspected offenders. Theyalso search for information not readily available or apparent concerning establishments orthe circumstances and behaviour of persons, mostly in order to prevent crimes. Their tasksinclude establishing contacts and sources of information about crimes planned orcommitted in order to prevent crimes or identify suspected offenders; obtaining, verifyingand analysing evidence in order to solve crimes; making arrests; testifying in courts of law,among others. They usually have management responsibilities. Police inspectors anddetectives are usually required to have a university diploma and/or are recruited throughpromotion after a certain number of years of experience as police officers (usually morethan five years).
Police officers (part of ISCO-08 5412) maintain law and order, patrolling public areas,enforcing laws and regulations and arresting suspected offenders. Other duties includedirecting traffic and assuming authority in the event of accidents; providing emergencyassistance to victims of accidents, crimes and natural disasters; among others. Policeofficers are usually not expected to have managerial responsibilities over more than threepersons. Police officers are usually not required to have a university diploma.
Immigration officers (part of ISCO-08 3351) check persons crossing national borders toadminister and enforce relevant rules and regulations. Their tasks include patrollingnational borders and coastal waters to stop persons from illegally entering or leaving thecountry; checking travel documents of persons crossing national borders to ensure thatthey have the necessary authorisations and certificates; co-ordinating and co-operatingwith other agencies involved in law enforcement, deportation and prosecution; amongothers. Immigration officers are not expected to have management responsibilities overmore than three persons, if any.
GOVERNMENT AT A GLANCE 2013 © OECD 2013180

ANNEX D
CompensationThe survey focuses on total compensation, which has two main components: 1) gross
wages and salaries; and 2) employer’s social contributions. Data on remuneration levels
were asked for full time jobs:
1. Gross wages and salaries include the values of any social contributions, income taxes,
etc., payable to the employee even if they are actually withheld by the employer for
administrative convenience or other reasons and paid directly to social insurance
schemes, tax authorities, etc., on behalf of the employee. Employer’s social contributions
are not included in gross wages and salaries. In-kind compensation is excluded from the
survey. Gross wages and salaries include:
● Basic wages and salaries refer to the regular annual payments to employees for their
time worked and services delivered to government. Although salaries and wages are
paid at regular weekly, monthly or other intervals, for the purposes of this survey the
annual salary was requested. Overtime payments are excluded from the data.
● Additional payments – because of the difficulties in getting exhaustive data and
ensuring comparability across countries, additional payments have been limited to its
most significant categories including:
❖ Compensations for time not worked make reference to annual leave and statutory
holidays only.
❖ Bonuses and gratuities regularly paid refer to year-end and seasonal bonuses;
profit-sharing bonuses; and additional payments in respect of vacation,
supplementary to normal vacation pay and other bonuses and gratuities.
❖ Bonuses and gratuities not paid in a regular fashion (performance-related pay)
refer to ad hoc bonuses or other exceptional payments linked to the overall
performance of the employee to which he/she may be entitled.
Box D.3. Service delivery agents – description of occupation (cont.)
Customs inspectors (part of ISCO-08 3351) check vehicles crossing national borders toadminister and enforce relevant rules and regulations. Their duties include inspecting theluggage of persons crossing national borders to ensure that it conforms to governmentrules and regulations concerning import or exports of goods and currencies; examiningtransport documents and freight of vehicles crossing national borders to ensureconformity with government rules and regulations; detaining persons and seizingprohibited and undeclared goods found to be in violation of immigration and customs law;among others. Customs inspectors are not expected to have managerial responsibilitiesover more than three persons, if any.
Tax inspectors (part of ISCO-08 3352) examine tax returns, bills of sale and otherdocuments to determine the type and amount of taxes, duties and other types of fees to bepaid by individuals or businesses, referring exceptional or important cases to accountantsor senior government officials. They advise organisations, enterprises and the public ongovernment laws, rules and regulations concerning the determination and payments oftaxes, duties and other government fees, and on the public’s rights and obligations;examine tax returns, bills of sale and other relevant documents; investigate filed taxreturns and accounting records, systems and internal controls of organisations to ensurecompliance with taxation laws and regulations; among others. Tax inspectors are notexpected to have managerial responsibilities over more than three persons, if any.
GOVERNMENT AT A GLANCE 2013 © OECD 2013 181
ANNEX D
2. Employer’s social contributions are social contributions payable by employers to social
security funds or other employment-related social insurance schemes to secure social
benefits (health insurance, pensions) for their employees:
● Employer’s contribution to statutory social security schemes or to private funded
social insurance schemes for covering old age, pension, sickness and health.
Employer’s social contributions represent social contributions payable by employers to
social security funds or other employment-related social insurance schemes to secure
social benefits (health insurance, pensions) for their employees. In some countries,
these social contributions pay for public schemes, while in others they pay for private
schemes. Employer’s social contributions sometimes also include specific funds
created, for example, in social agreements. Data collected on employer’s social
contributions have been limited in the 2011 survey to health and pension plans, which
represent the majority of employer’s social contributions.
● Unfunded employees’ social benefits paid by employers limited to health and pension
benefits. The term “unfunded” refers to social benefits for which no social security
fund exists and there is no official tracking of social contributions. Unfunded pension
or health schemes exist in many countries: in that case, it is the general government
budget that pays for civil servants pensions/health benefits. In a number of countries,
the employee and employer contributions do not cover all the costs associated with
the social benefits of government employees. In those cases, special lines in the
budget are often dedicated to covering this unfunded part of social benefits.
Not all countries have been able to include the social contribution element in their
survey responses (mainly because of unfunded pension schemes). As a consequence, it has
been necessary to estimate this component using other data sources for those countries. In
the National Accounts, imputations for unfunded pension’s schemes are made
conceptually consistent across countries. Therefore, by using the National Accounts data it
was possible to estimate the overall rate of employer’s social contributions that was
reported in the different existing databases regarding government compensation of
employees. The rate to calculate compensation costs in the data for this publication has
been chosen after investigation and discussion with the countries. The source of National
Accounts for this share was selected in the following countries: Finland, Germany, Greece,
Japan and Norway. Moreover, for Belgium this share was estimated using a combination of
information from the compensation survey and National Accounts data.
We should note that, contrary to the compensation survey where employers’
contributions are restricted to health and pensions, data under the National Accounts
framework consider all employer’s social contributions. By consequence, the share
resulted, to a certain extent, was overestimated when this source was taken into account.
Moreover, National Accounts data provide ratios of employer’s social contributions for all
government employees. Using this ratio doesn’t accommodate any differences that may
exist for instance in ratios of social contributions across occupations. For the countries
which have provided data for employer’s social contributions in the survey, the exact data
for social contributions (that may vary across occupation) have been used.
The level of social contributions is only a proxy. The quantity and quality of benefits
that employees receive through the employers’ and employees’ social contributions
depend on many variables such as the quality and efficiency of the management of the
funds and services in each country.
GOVERNMENT AT A GLANCE 2013 © OECD 2013182
ANNEX D
Use of comparatorsCalculations have been made converting compensation data in USD using the PPP
methodology. This compensates for differences in exchange rates and in relative pricelevels. The PPP does not take into account the relatively different costs of living in capitalcities within and across countries. In many countries, the majority of central governmentemployees are employed in capital cities. Wages can tend to make up for the relativedifference in the costs of living in capital cities.
The OECD also compared countries with data normalised with GDP per capitaavailable through the OECD National Accounts Statistics (database). This normalisation is away to remove differences in levels of average wealth in the country.
The OECD also calculated ratios of average total compensation to average tertiaryeducated compensation (gross wages plus employer’s social contributions). Since centralgovernment employees occupations covered in the survey generally have a high level ofeducation, the ratio allows the issue of the comparability of the public sector compensationwith that of the whole economy. Data on tertiary educated compensation are based on acombination of sources as stated in the publication OECD Education at a Glance (2013 orprevious editions). However, even if corrected for the level of education, other characteristicsof the individuals in these occupations remain uncorrected, for example: seniority, age,gender, etc.
The ratios of compensation of employees relative to GDP per capita and to tertiaryeducated compensation were not corrected for working time. This approach was followedin order to maintain consistency between the three measures compared.
Adjustment for working timeThe differences between the time people actually work and the annual average
compensation (annual average gross salary plus employer’s social contributions) iscalculated so as to obtain an adjusted annual average compensation. Indeed, to put thecompensation of employees reported on a comparable basis across countries, thedifferences in the working time (number of hours worked per week in the civil service, thelegal or average holiday entitlement, and the number of days that apply to the civil service)are used for the calculation of the adjusted annual average compensation.
For all managers (namely D1, D2, D3 and D4 positions), since weekly working timesapply very unevenly to this category of employees, data was adjusted only for holidays.
The working time corrections are reported in Table D.1.
Average comparative annual compensation is as:
where:
= Average annual compensation of employees in country c within occupationalgroup o in PPP corrected for working time.
= Average annual compensation in domestic currency in country c withinoccupational group o in national currency.
Pc = Purchasing power parity of country c.
= Ratio of average working time in country c. This corresponds to average annualworking hours in country c (from survey data) divided by 2088. The number2 088 equals the theoretical working hours in year with 40 hours of work perweek, no holidays or leave of any kind. This also results in an average of261 working days per year with each working day including 8 hours of work.
Hca*
W =coa*
( )Pc
Wcoa
Wcoa*
Wcoa
Hca*
GOVERNMENT AT A GLANCE 2013 © OECD 2013 183

ANNEX D
icienting timetion,ection
00
00
00
00
00
00
00
00
00
00
00
00
00
00
00
00
00
00
00
00
00
00
00
00
00
00
: 2 088.s) from
hours
gth of
police,
ber of
er thano worko three
of age
inside
Table D.1. Working time corrections
Contractualworking time,
h/week
Average numberof holidays
Numberof average public
holidays thatapply to the civil
service
Averageworking days
per yearin country
Averageworking hours
per yearin country
Coefficientfor working time
corrections,weekly hoursand holidays
Coefficientfor working time
correction,holidays
Coefffor work
correcno corr
Australia 37.5 20 10 231 1 730 0.830 0.885 1.0
Austria 40 25 10 226 1 806 0.866 0.866 1.0
Belgium 38 26 10 225 1 708 0.819 0.862 1.0
Chile 44 15 9 237 2 083 0.999 0.908 1.0
Denmark 37 30 9 222 1 641 0.787 0.850 1.0
Estonia 40 34 5 222 1 774 0.850 0.850 1.0
Finland 36.3 32 7 222 1 607 0.771 0.850 1.0
France 35.5 25 7.5 228 1 620 0.777 0.875 1.0
Germany 41 29.5 10 221 1 814 0.870 0.848 1.0
Greece 40 25 12 224 1 790 0.858 0.858 1.0
Iceland 40 30 14 217 1 734 0.831 0.831 1.0
Israel 42.5 24 9 228 1 936 0.928 0.873 1.0
Italy 36 32.0 8 221 1 589 0.762 0.847 1.0
Japan 38.8 20 17 224 1 734 0.831 0.858 1.0
Korea 40 20 14 227 1 814 0.870 0.870 1.0
Netherlands 36 23 8 230 1 654 0.793 0.881 1.0
New Zealand 40 20 11 230 1 838 0.881 0.881 1.0
Norway 37.5 25 10 226 1 693 0.812 0.866 1.0
Poland 40 26 11 224 1 790 0.858 0.858 1.0
Portugal 35 25 11 225 1 573 0.754 0.862 1.0
Slovak Republic 37.5 25 15 221 1 655 0.794 0.847 1.0
Slovenia 40 29.9 15 216 1 727 0.828 0.828 1.0
Spain 37.5 22 14 225 1 685 0.808 0.862 1.0
Sweden 39.8 33 9 219 1 739 0.834 0.839 1.0
United Kingdom 37 25 8 228 1 685 0.808 0.873 1.0
United States 40 20 10 231 1 846 0.885 0.885 1.0
Notes: Figures in the table are rounded.Maximum working days per year if 5 out of 7 days per week are worked: 261. Maximum working hours per year if 8h per working dayAustria: From 1 January 2011 on, the amount of holidays depends on the age: an FTE is entitled to take 240 hours (30 days/6 weekthat year on, in which his/her 43rd birthday is before 1 July. If his/her 43rd birthday is after 30 June, he/she is entitled to take the 240in the next year.Estonia: The annual leave per year depends on the length of service. 35 calendar days = 28 working days + officials whose lenservice exceeds three years, receive one extra day each year, maximum 10 days.Finland: The number of days of annual leave per year is 30 or 38 days depending on the length of service.Germany: Contractual working time between public employees and civil servants is different.Italy: The number of legal working days of holidays varies. 30 days in the first three years of work, 32 from the fourth year. For thethere are two bands based on seniority: 36 days from 15 to 25 years of service, 45 days for more than 25 years.Korea: Civil servants are entitled to 3-21 days of annual leave per year depending on the length of service.Slovak Republic: The contractual working time in hours per week is 40 h/week or 37.5 h/week depending on the contract. The numdays of holidays depend on age: 25 days (under 33 years old); or 30 days (for more than 33 years old).Slovenia: The average number of days of annual leave is estimated. A worker is entitled to annual leave which may not be shortfour weeks. In addition, he has the right to one additional day of annual leave for every child under the age of 15. In relation tperformance a civil servant is also entitled to no more than three days of annual leave. The annual leave can be extended by up tdays in case of bad working conditions (noise, heat,…) or of bad health condition or for directing an organisational unit.Sweden: The number of working days varies with age according to the central collective agreement. Employees under 30 yearshave 28 days of holidays, between 30 and 39 years they are 31 days and for employees 40 years or older they have 35 days.The United Kingdom: The number of working hours in a week is 37 outside London, where most Civil Servants work, and 36London. The number of average working days per year of holiday’s entitlement varies depending on the department.Source: 2011 OECD Survey on Compensation of Employees in Central/Federal Government.
GOVERNMENT AT A GLANCE 2013 © OECD 2013184

ANNEX E
ANNEX E
Detailed data on conflict-of-interest disclosure
This annex provides data for each responding country on the types of private interests
that they require central government decision makers to disclose as well as the level of
transparency of these disclosures. The data underlie the summary of data presented in
Figure 8.4.
Notes of Table E.1Data for Brazil, the Czech Republic, Greece, Israel, and the Russian Federation refer
to 2010. Similarly, data for the legislative and judicial branch of Spain refer to 2010.
In Luxembourg, there are no requirements for the disclosure of private interests. In
the United States, the prosecutorial function is the executive branch. Senior officials in the
Department of Justice are required to file publicly available financial disclosure reports
under the same requirements as all other executive branch employees. Lower level federal
prosecutors have a separate, non-public, conflict of interest reporting system. Data
regarding judges in Norway exclude lay judges and judges in conciliation boards. In
New Zealand, judges and prosecutors are not required to disclose conflicts of interest.
However, there are “Guidelines for Judicial Conduct” in place (available through the Courts
website: www.courtsofnz.govt.nz/business/guidelines/guidelines-for-judicial-conduct). Also,
prosecutors are often lawyers and have professional ethical duties that must be complied
with (and can be sanctioned and even lose their practising certificate for breaching their
duties, depending upon the circumstances). In Brazil, a new law on conflict of interest for
executive branch public officials and prohibitions after leaving post (Law 12.813) entered
into force in July 2013.
Paid outside positions: In Austria and Belgium for all positions and in Iceland and
Switzerland for judges, any tenured civil servant is subject to the binding decision of the
government in the case that an outside paid position may result in a conflict of interest. In
Denmark, outside positions for judges can only be held (and must be disclosed) if these
positions are reserved for judges by law or if permitted to by a special board. In Estonia,
paid outside positions are prohibited by law for the prime minister, ministers, judges and
prosecutors, with the exceptions of research and teaching which should be disclosed. In
Japan, judges may not hold a paid outside position without obtaining the permission of the
Supreme Court during their terms of office. In principle, judges similarly have to obtain the
permission of the Supreme Court or supervisors in the case of unpaid outside positions as
The statistical data for Israel are supplied by and under the responsibility of the relevant Israeliauthorities. The use of such data by the OECD is without prejudice to the status of the Golan Heights,East Jerusalem and Israeli settlements in the West Bank under the terms of international law.
GOVERNMENT AT A GLANCE 2013 © OECD 2013 185

ANNEX E
well. However, there are cases where judges have not obtained the permission of the
Supreme Court or supervisors where they have taken up unpaid outside positions, such as,
for example, the position of PTA chairperson. If information about outside positions of
judges is requested, personal identification information of judges may not be publicly
available. In Poland, the prime minister and ministers cannot conduct certain types of
activities which may lead to a conflict-of-interest situation. Moreover, they are obliged to
inform on their membership in bodies of foundations, commercial law companies and
co-operatives, even if these positions are not paid.
Previous employment: In Estonia, no regulation requires members of the executive
and legislature to publish information about previous employment; however in practice
this information is proactively published.
Assets, liabilities, amounts and sources of income, and gifts: In Iceland, the prime
minister is only required to disclose loans that have been written off or changed to their
benefit. In Ireland, parliamentarians’ salaries and allowances are publicly available. In
addition, all parliamentarians, including office holders, must disclose their personal
interests, i.e. income from other sources (i.e. outside paid positions), shares, directorships,
land, gifts, below cost supply of a service or travel, consultancy work, and any interest in a
public contract in annual statements of interests under the Ethics Acts. These interests are
publicly available on the Registers of Members’ Interests. In Mexico, gifts must be declared
if they amount to equal or greater value of ten times the minimum wage. Information on
public servants is published on line if authorised by the public servants. In practice, about
66% of public servants make the information publicly available. In Poland, the prime
minister and ministers are obliged to disclose statements of means, which present for
example their assets, liabilities, and income source/amount. Although the statements are
not publicly available by law, almost all ministers agree to publish them on line.
Although no actions are taken following the collection of the disclosure forms in
Ireland and Italy, most of the disclosed information is available to the public, allowing
citizens themselves to scrutinise the information submitted.
GOVERNMENT AT A GLANCE 2013 © OECD 2013186

ANNEX E
Tabl
eE.
1.D
iscl
osu
reof
sele
cted
pri
vate
inte
rest
san
dp
ubl
icav
aila
bili
tyof
dis
clos
edin
form
atio
nin
the
thre
ebr
anch
esof
gove
rnm
ent
byco
un
try
(201
2)
AUS
AUT
BEL
CAN
CHL
CZE
DNK
EST
FIN
FRA
DEU
GRC
HUN
ISL
IRL
ISR
ITA
JPN
KOR
LUX
MEX
NLD
NZL
NOR
POL
PRT
SVK
SVN
ESP
SWE
CHE
TUR
GBR
USA
RUS
BRA
EGY
UKR
Executivebranch
President
Asse
tsx
❍x
x●
❍x
●❍
●❍
●■
❍❍
xx
x●
❍●
xx
x❒
●●
❒x
xx
❒x
●●
❒■
●
Liab
ilitie
sx
❍x
x●
❍x
●❍
●❍
❍●
❍❍
xx
x●
❍●
xx
x❒
●●
❒x
xx
❒x
●❒
❒■
●
Inco
me
sour
cex
❍x
x●
❍x
●❍
❍❍
●●
❍❍
xx
x●
❍●
xx
x❒
●●
❒x
xx
❒x
●●
❒■
●
Inco
me
amou
ntx
❍x
x❍
❍x
❒❍
❍❍
●●
❍❍
xx
x●
❍●
xx
x❒
●●
❒x
xx
❒x
●●
❒❍
●
Outs
ide
posi
tion:
Paid
xP
xx
●❍
x●
❍❍
PP
P❍
❍x
xx
■❍
●x
xx
❒P
●❒
xx
xP
x●
❍❒
P●
Outs
ide
posi
tion:
Non-
paid
xP
xx
●❍
x❍
❍❍
PP
P❍
❍x
xx
■❍
❍x
xx
❒P
●❒
xx
x■
x●
❍❒
P●
Gifts
xP
xx
P❍
x●
❍❍
❍❒
●❍
❍x
xx
●❍
❒x
xx
❍●
❍●
xx
xP
x●
P❍
P●
Prev
ious
empl
oym
ent
x❍
xx
❍❍
x●
❍❍
❍❍
❍❍
❍x
xx
●❍
●x
xx
❍●
●❒
xx
x■
x●
●❒
■●
Primeminister
Asse
ts●
❒■
●x
■●
●●
❒❍
●●
●●
❒●
■●
❍x
❒●
●●
●●
❒●
■❍
❒●
x●
x■
●
Liab
ilitie
s●
❒❍
●x
■❍
●●
❒❍
❍●
❍❍
❒■
■●
❍x
❒●
❍●
●●
❒●
❍❍
❒●
x❒
x■
●
Inco
me
sour
ce●
❍❍
❒x
■●
●●
❍❍
●●
●●
❒■
■●
❍x
❒●
●●
●●
❒❒
■❍
❒●
x●
x■
●
Inco
me
amou
nt❍
❍❍
❒x
■●
❒●
❍❍
●●
❍●
❒■
■●
❍x
❒❍
❍●
●●
❒❒
■❍
❒●
x●
x■
●
Outs
ide
posi
tion:
Paid
●P
●P
x■
P●
●❍
PP
P●
PP
❒P
■❍
xP
●●
●P
●❒
■P
PP
●x
Px
P●
Outs
ide
posi
tion:
Non-
paid
●❒
●●
x■
P❍
●❍
●P
P●
P❍
❒❍
■❍
xP
●●
●P
●❒
■P
P❒
●x
❍x
P●
Gifts
●P
❍●
x■
●●
●❍
❒❒
●●
●P
P■
■❍
x❒
●●
●●
❍●
❒P
❍P
●x
Px
P●
Prev
ious
empl
oym
ent
❍❍
❍❒
x❍
●●
❍❍
❍❍
❍●
❍❒
■❍
■❍
x■
❍●
❍●
●❒
■❍
❍❒
❍x
❒x
■●
Ministersormembersofcabinet
Asse
ts●
❒■
●●
■●
●●
❒❍
●●
●●
❒●
■●
❍●
❒●
●●
●●
❒●
■❍
❒●
■●
❒■
●
Liab
ilitie
s●
❒❍
●●
■❍
●●
❒❍
❍●
❍❍
❒■
■●
❍●
❒●
❍●
●●
❒●
❍❍
❒●
■❒
❒■
●
Inco
me
sour
ce●
❍❍
❒●
■●
●●
❍❍
●●
●●
❒■
❍●
❍●
❒●
●●
●●
❒❒
■❍
❒●
■●
❒■
●
Inco
me
amou
nt❍
❍❍
❒❍
■●
❒●
❍❍
●●
❍●
❒■
❍●
❍●
❒❍
❍●
●●
❒❒
■❍
❒●
■●
❒■
●
Outs
ide
posi
tion:
Paid
●P
●P
●■
P●
●❍
PP
P●
PP
❒P
■❍
●P
●●
●P
●❒
■P
PP
●■
P❒
P●
Outs
ide
posi
tion:
Non-
paid
●❒
●●
●■
P❍
●❍
❍P
P●
P❍
❒❍
■❍
❍P
●●
●P
●❒
■P
P❒
●■
❍❒
P●
Gifts
●P
❍●
P■
●●
●❍
❒❒
●●
●P
P❍
■❍
❒❒
●●
●●
❍●
❒P
❍P
●■
PP
P●
Prev
ious
empl
oym
ent
❍❍
❍❒
❍❍
●●
❍❍
❍❍
❍●
❍❒
■❍
■❍
●■
❍●
❍●
●❒
■❍
❍❒
❍■
●❒
■●
Legislativebranch
Upperhouselegislators
Asse
ts●
❍■
■●
■x
xx
❒x
xx
x●
x■
■x
❍■
❍x
x●
xx
❒❒
x❍
x●
■●
■■
xLi
abili
ties
●❍
❍■
●■
xx
x❒
xx
xx
❍x
■■
x❍
■❍
xx
●x
x❒
❒x
❍x
❍■
❒■
■x
Inco
me
sour
ce●
●❍
■●
■x
xx
❍x
xx
x●
x■
■x
❍■
❍x
x●
xx
❒❒
x❍
x●
■●
■■
xIn
com
eam
ount
❍●
❍❒
❍■
xx
x❍
xx
xx
●x
■■
x❍
■❍
xx
●x
x❒
❒x
❍x
●■
●■
■x
Outs
ide
posi
tion:
Paid
●●
●■
●■
xx
x❍
xx
xx
●x
■■
x❍
■●
xx
●x
x❒
●x
●x
●■
P■
■x
Outs
ide
posi
tion:
Non-
paid
●❒
●■
●■
xx
x❍
xx
xx
❍x
■❍
x❍
P●
xx
●x
x❒
●x
●x
●■
❍■
■x
Gifts
●P
❍■
P■
xx
x❍
xx
xx
●x
P■
x❍
■●
xx
●x
x●
❍x
❍x
●■
P❍
Px
Prev
ious
empl
oym
ent
❍❍
❍■
❍❍
xx
x❍
xx
xx
❍x
■❍
x❍
■❍
xx
❍x
x❒
●x
❍x
❍■
❍■
■x
Lowerhouselegislators
Asse
ts●
❍■
●●
■●
●❍
❒❍
●●
●●
❒■
■●
❍■
❍●
●●
●●
❒❒
■❍
❒●
■●
❒■
■
Liab
ilitie
s●
❍❍
●●
■❍
●❍
❒❍
❍●
❍❍
❒■
■●
❍■
❍●
❍●
●●
❒❒
❍❍
❒●
■❒
❒■
■
Inco
me
sour
ce●
●❍
●●
■●
●❍
❍●
●●
●●
❒■
■●
❍■
●●
●●
●●
❒❒
❍❍
❒●
■●
❒■
■
Inco
me
amou
nt❍
●❍
❒❍
■❍
❒❍
❍●
●●
❍●
❒■
■●
❍■
●❍
❍●
●●
❒❒
■❍
❒●
■●
❒■
■
Outs
ide
posi
tion:
Paid
●●
●●
●■
●●
❍❍
●P
P●
●P
■■
■❍
P●
●●
●●
●❒
●■
●P
●■
P❒
■■
Outs
ide
posi
tion:
Non-
paid
●❒
●❍
●■
❍❍
❍❍
●P
P●
❍P
■❍
■❍
P●
●●
●●
●❒
●■
●❒
❍■
❍❒
■■
Gifts
●P
❍●
P■
●●
❍❍
●❒
●●
●P
P■
■❍
■●
●●
●●
❍●
❍P
❍P
●■
P❍
P■
Prev
ious
empl
oym
ent
❍❍
❍●
❍❍
❍●
❍❍
●❍
❍●
❍❍
■❍
●❍
■❍
❍●
❍●
●❒
●■
❍❒
❍■
❍❒
■■
GOVERNMENT AT A GLANCE 2013 © OECD 2013 187

ANNEX E
Judicialbranch
Judges
Asse
ts❍
❍❍
❍■
❍❍
●❒
❍❍
❒❒
❍❍
❒■
❍●
❍■
❍❍
❍❒
❍●
❒❍
■❍
❒❍
■■
❒■
■
Liab
ilitie
s❒
❍❍
❍■
❍❍
●❒
❍❍
❒❒
❍❍
❒■
❍●
❍■
❍❍
❍❒
❍●
❒❍
❍❍
❒❍
■❒
❒■
■
Inco
me
sour
ce❍
❍❍
❍■
❍❒
●❒
❍❍
❒❒
❒❍
❒■
❒●
❍■
❍❍
●❒
❍●
❒❍
❍❍
❒❍
■■
❒■
■
Inco
me
amou
nt❍
❍❍
❍❍
❍❒
❒❒
❍❍
❒❒
❍❍
❒■
❒●
❍■
●❍
❍❒
❍●
❒❍
■❍
❒❍
■■
❒■
■
Outs
ide
posi
tion:
Paid
❒❒
❒❍
■❍
●P
■❍
❒P
P❒
❍P
■❒
■❍
P●
❍●
❒P
●❒
❒❍
❒P
P■
PP
P■
Outs
ide
posi
tion:
Non-
paid
❒❒
❒❍
■❍
●❍
■❍
❒P
P❍
❍❒
■❒
■❍
■●
❍●
❒P
❍❒
❒❍
❒❒
❍■
❍P
P■
Gifts
❍P
P❍
P❍
PP
❍❍
PP
❒❍
❍❒
P❍
■❍
PP
❍P
❍P
❍●
❍P
❍P
❍■
P❍
P■
Prev
ious
empl
oym
ent
❒❒
❍❍
❍❍
❍❒
❍❍
❒❍
❍❍
❍❒
■❒
■❍
■❍
❍●
❍❍
❍❒
❍❍
❍❒
❍■
❒❒
■■
Prosecutors
Asse
ts❍
❍❍
❒■
❍❍
●❒
❍❍
❒❒
❍❒
❒■
❍●
❍■
❍❍
❍❒
❍●
❒❍
■❍
❒❍
❍●
❒■
■
Liab
ilitie
s❍
❍❍
❒■
❍❍
●❒
❍❍
❒❒
❍❍
❒■
❍●
❍■
❍❍
❍❒
❍❍
❒❍
❍❍
❒❍
❍❒
❒■
■
Inco
me
sour
ce❍
❍❍
❍■
❍❍
●❒
❍❍
❒❒
❒❍
❒■
❒●
❍■
❍❍
❍❒
❍❍
❒❍
❍❍
❒❍
❍●
❒■
■
Inco
me
amou
nt❍
❍❍
❍❍
❍❍
❒❒
❍❍
❒❒
❍❍
❒■
❒●
❍■
❍❍
❍❒
❍❍
❒❍
■❍
❒❍
❍■
❒■
■
Outs
ide
posi
tion:
Paid
❒❒
❒❒
■❍
❍P
■❍
❒P
P❒
❒P
■❒
■❍
P●
❍❒
❒P
❒❒
❒❍
❒P
P❍
P❒
P■
Outs
ide
posi
tion:
Non-
paid
❒❒
❒❒
■❍
❍❍
■❍
❒P
P❍
❍❍
■❒
■❍
■●
❍❒
❒P
❍❒
❒❍
❒❒
❍❍
❍❒
P■
Gifts
❒P
P❒
P❍
P●
❍❍
PP
❒❍
❒P
P■
■❍
PP
❍P
❍P
❍●
❍P
❒P
❍❍
P❍
P■
Prev
ious
empl
oym
ent
❍❒
❍❍
❍❍
❍❒
❍❍
❒❍
❍❍
❍❒
■❍
■❍
■●
❍●
❍❍
❍❒
❍❍
❍❒
❍❍
❒❒
■■
●In
form
atio
nis
dis
clos
edan
dp
ubl
icly
avai
labl
eon
lin
eor
pri
nt.
❒In
form
atio
nis
dis
clos
edan
dn
otp
ubl
icly
avai
labl
e.■
Info
rmat
ion
isd
iscl
osed
and
pu
blic
lyav
aila
ble
up
onre
qu
est.
❍D
iscl
osu
reis
not
req
uir
ed.
PPr
ohib
ited
.x
Ind
icat
esn
otap
pli
cabl
e(e
.g.c
oun
try
has
no
Pres
iden
t).
Sou
rce:
2012
OEC
DSu
rvey
onM
anag
ing
Con
flic
tof
Inte
rest
.1
2 h
ttp:
//dx
.doi
.org
/10.
1787
/888
9329
4374
2
Tabl
eE.
1.D
iscl
osu
reof
sele
cted
pri
vate
inte
rest
san
dp
ubl
icav
aila
bili
tyof
dis
clos
edin
form
atio
nin
the
thre
ebr
anch
esof
gove
rnm
ent
byco
un
try
(201
2)(c
ont.
)
AUS
AUT
BEL
CAN
CHL
CZE
DNK
EST
FIN
FRA
DEU
GRC
HUN
ISL
IRL
ISR
ITA
JPN
KOR
LUX
MEX
NLD
NZL
NOR
POL
PRT
SVK
SVN
ESP
SWE
CHE
TUR
GBR
USA
RUS
BRA
EGY
UKR
GOVERNMENT AT A GLANCE 2013 © OECD 2013188
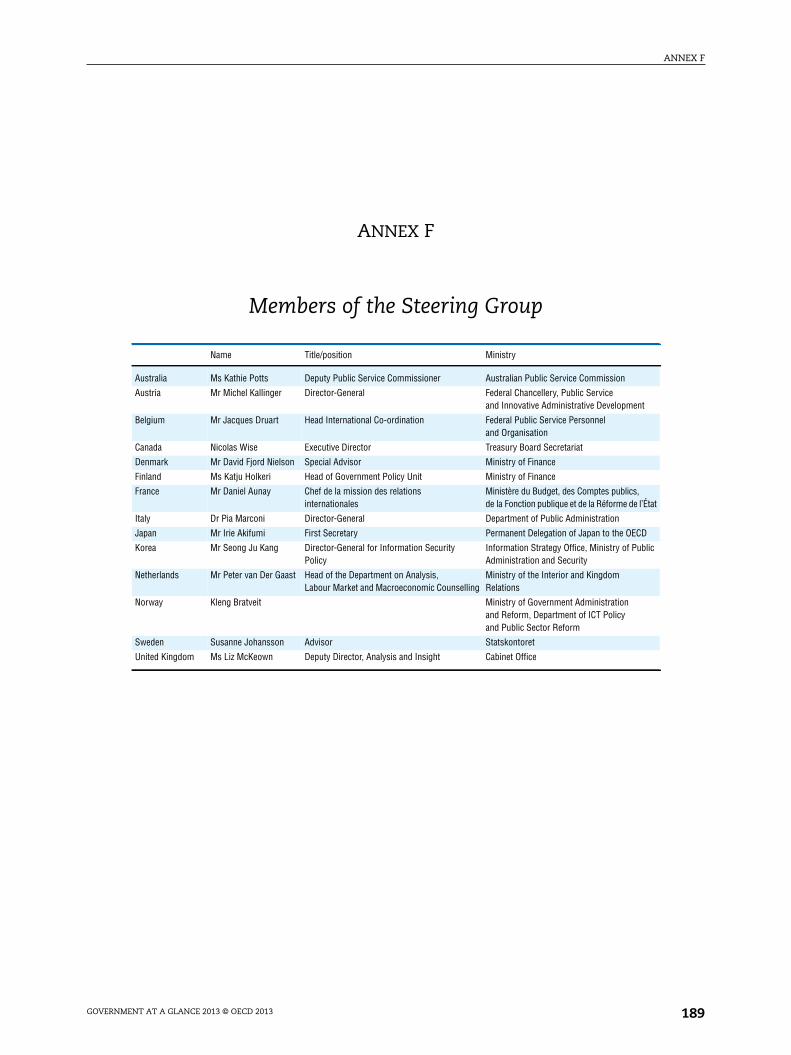
ANNEX F
ANNEX F
Members of the Steering Group
Name Title/position Ministry
Australia Ms Kathie Potts Deputy Public Service Commissioner Australian Public Service Commission
Austria Mr Michel Kallinger Director-General Federal Chancellery, Public Serviceand Innovative Administrative Development
Belgium Mr Jacques Druart Head International Co-ordination Federal Public Service Personneland Organisation
Canada Nicolas Wise Executive Director Treasury Board Secretariat
Denmark Mr David Fjord Nielson Special Advisor Ministry of Finance
Finland Ms Katju Holkeri Head of Government Policy Unit Ministry of Finance
France Mr Daniel Aunay Chef de la mission des relationsinternationales
Ministère du Budget, des Comptes publics,de la Fonction publique et de la Réforme de l’État
Italy Dr Pia Marconi Director-General Department of Public Administration
Japan Mr Irie Akifumi First Secretary Permanent Delegation of Japan to the OECD
Korea Mr Seong Ju Kang Director-General for Information SecurityPolicy
Information Strategy Office, Ministry of PublicAdministration and Security
Netherlands Mr Peter van Der Gaast Head of the Department on Analysis,Labour Market and Macroeconomic Counselling
Ministry of the Interior and KingdomRelations
Norway Kleng Bratveit Ministry of Government Administrationand Reform, Department of ICT Policyand Public Sector Reform
Sweden Susanne Johansson Advisor Statskontoret
United Kingdom Ms Liz McKeown Deputy Director, Analysis and Insight Cabinet Office
GOVERNMENT AT A GLANCE 2013 © OECD 2013 189

GLOSSARY
Glossary
Term Use in Government at a GlanceBudget A comprehensive statement of government financial plans
which include expenditures, revenues, deficit or surplus and
debt. The budget is the government’s main economic policy
document, demonstrating how the government plans to use
public resources to meet policy goals, and to some extent
indicating where its policy priorities.
Cash transfers Benefits provided to eligible individuals by governments that are
not required to be spent on a specific good or service. Examples
of cash transfers include pensions, unemployment benefits and
development aid.
Central Budget The Central Budget Authority (CBA) is a public entity, or several
Authority (CBA) co-ordinated entities, located at the central/national/federal level of
government, which is responsible for the custody and management
of the national/federal budget. In many countries, the CBA is often
part of the Ministry of Finance. Specific responsibilities vary by
country, but generally, the CBA is responsible for formulating
budget proposals, conducting budget negotiations, allocating or
reallocating funds, ensuring compliance with the budget laws and
conducting performance evaluations and/or efficiency reviews.
This Authority regulates budget execution but does not necessarily
undertake the treasury function of disbursing public funds. Lastly, a
very important role of the Central Budget Authority is monitoring
and maintaining aggregate/national fiscal discipline and enforcing
the effective control of budgetary expenditure.
Citizen’s budget A citizens’ guide to the budget is defined here as an easy-to-
understand summary of the main features of the annual budget
as presented to the legislature. It should be a self-contained
document that explains what is in the annual budget proposals
and what their effects are expected to be. While containing links
or references to more detailed documents, the guide should not
require readers to refer to them, or to know their contents, in
order to understand the guide.
Collective goods Goods and services that benefit the community at large.
and services Examples include government expenditures on defence, and
public safety and order.
Composite index An indicator formed by compiling individual indicators into a single
index on the basis of an underlying model (Nardo et al., 2005).
GOVERNMENT AT A GLANCE 2013 © OECD 2013190
GLOSSARY
Dataset A set of indicators or variables concerning a single topic
(e.g. regulatory quality).
Efficiency Achieving maximum output from a given level of resources used
to carry out an activity (OECD Glossary of Statistical Terms).
Effectiveness The extent to which the activity’s stated objectives have been
met (OECD Glossary of Statistical Terms).
European System An internationally compatible accounting framework used by
of National Accounts members of the European Union for a systematic and detailed
description of a total economy (that is a region, country or group
of countries), its components and its relations with other total
economies (OECD Glossary of Statistical Terms). It is fully
consistent with the System of National Accounts (SNA).
Federal state A country that has a constitutionally delineated division of
political authority between one central and several regional or
state autonomous governments.
Fiscal rule For purposes of this book, the OECD utilises a similar definition
as the European Commission. A numerical fiscal rule refers to a
permanent constraint on fiscal policy aggregates (e.g. in-year
rules are excluded).
Full-time equivalent The number of full-time equivalent jobs, defined as total hours
(FTE) worked divided by average annual hours worked in full-time jobs
(OECD Glossary of Statistical Terms).
Gender Socially constructed and socially learned behaviours and
expectations associated with females and males. All cultures
interpret and elaborate the biological differences between
women and men into a set of social expectations about what
behaviours and activities are appropriate, and what rights,
resources and power women and men possess. Like race,
ethnicity and class, gender is a social category that largely
establishes one’s life chances. It shapes one’s participation in
society and in the economy.
General Employment It usually concerns the employment conditions of most
Framework in the public government employees, and certainly concerns most statutory
service employees. Casual employees, by this definition, are not
employed under the General Employment Framework for
government employees. Please note that in a number of
countries, all employees, including those employed on a short
term basis, are employed under the General Employment
framework, with a few exceptions (few casual employees in
those cases, if any).
General government The general government sector consists of: a) All units of central,
state or local government; b) All social security funds at each level
of government; and c) All non-market non-profit institutions that
are controlled and mainly financed by government units. The
sector does not include public corporations, even when all the
equity of such corporations is owned by government units. It also
does not include quasi-corporations that are owned and
GOVERNMENT AT A GLANCE 2013 © OECD 2013 191

GLOSSARY
controlled by government units. However, unincorporated
enterprises owned by government units that are not quasi-
corporations remain integral parts of those units and, therefore,
must be included in the general government sector (1993 System of
National Accounts).
Governance The exercise of political, economic and administrative authority.
Gross domestic The standard measure of the value of the goods and services
product (GDP) produced by a country during a period. Specifically, it is equal to
the sum of the gross values added of all resident institutional
units engaged in production (plus any taxes, and minus any
subsidies, on products not included in the value of their outputs).
The sum of the final uses of goods and services (all uses except
intermediate consumption) measured in purchasers’ prices, less
the value of imports of goods and services, or the sum of primary
incomes distributed by resident producer units (OECD Glossary of
Statistical Terms).
Independent Fiscal A publicly funded, independent body under the statutory
Institution (IFI) authority of the executive or the legislature which provides
non-partisan oversight and analysis of, and in some cases advice
on, fiscal policy and performance. IFIs have a forward-looking
ex ante diagnostic task (in contrast to public audit institutions
which perform an equally indispensable ex post task).
Indicator “… quantitative or qualitative measure derived from a series of
observed facts that can reveal relative positions (e.g. of a
country) in a given area. When evaluated at regular intervals, an
indicator can point out the direction of change across different
units and through time.” (Nardo et al., 2005)
Individual goods Goods and services that mainly benefit individuals. Examples
and services include education, health and social insurance programmes.
Input Units of labour, capital, goods and services used in the
production of goods and services.
“Taking the health service as an example, input is defined as the
time of medical and non-medical staff, the drugs, the electricity
and other inputs purchased, and the capital services from the
equipment and buildings used.” (Lequiller, 2005)
Labour force The labour force, or currently active population, comprises all
persons who fulfil the requirements for inclusion among the
employed or the unemployed during a specified brief reference
period (OECD Glossary of Statistical Terms).
Outcome Refers to what is ultimately achieved by an activity. Outcomes
reflect the intended or unintended results of government
actions, but other factors outside of government actions are also
implicated (OECD Glossary of Statistical Terms).
Output In performance assessment in government, outputs are defined
as the goods or services produced by government agencies
(e.g. teaching hours delivered, welfare benefits assessed and
paid) (OECD Glossary of Statistical Terms).
GOVERNMENT AT A GLANCE 2013 © OECD 2013192
GLOSSARY
Performance Performance information can be generated by both government
information and non-governmental organisations, and can be both qualitative
and quantitative. Performance information refers to metrics/
indicators/general information on the inputs, processes, outputs
and outcomes of government policies/programmes/organisations,
and can be ultimately used to assess the effectiveness, cost
effectiveness and efficiency of the same. Performance information
can be found in: statistics; the financial and/or operational
accounts of government organisations; performance reports
generated by government organisations; evaluations of policies,
programmes or organisations; or spending reviews, for instance.
Productivity Productivity is commonly defined as a ratio of a volume measure
of output to a volume measure of input use (OECD Statistical
Glossary). Economists distinguish between total productivity,
namely total output divided by change in (weighted) input(s) and
marginal productivity, namely change in output divided by
change in (weighted) input(s) (Coelli et al., 1999).
Public sector The general government sector plus (quasi) public corporations
(1993 System of National Accounts).
Public sector process Structures, procedures and management arrangements with a
broad application within the public sector.
Public services Services that are performed for the benefit of the public or its
institutions. Public services are provided by government to its
citizens, either directly (through the public sector) or by
financing private provision of services. The term is associated
with a social consensus that certain services should be available
to all, regardless of income. Even where public services are
neither publicly provided nor publicly financed, for social and
political reasons they are usually subject to regulation going
beyond that applying to most economic sectors.
System of National The System of National Accounts (SNA) consists of a coherent,
Accounts consistent and integrated set of macroeconomic accounts,
balance sheets and tables based on a set of internationally
agreed concepts, definitions, classifications and accounting
rules (SNA 1.1).
The System of National Accounts 1993 (SNA) has been prepared
under the joint responsibility of the United Nations, the
International Monetary Fund, the Commission of the European
Communities, the OECD and the World Bank (OECD Glossary of
Statistical Terms).
The 2008 SNA has recently been finalised and includes a number
of changes to the 1993 SNA. For all OECD countries except
Australia (as well as Canada for government debt), the indicators
presented under the SNA are based on the 1993 SNA. It is
important to note that it will take a certain number of years
(2014 for most countries) before the national accounts will reflect
these changes (that will have, to a certain extent, an impact on
selected indicators presented in this publication).
GOVERNMENT AT A GLANCE 2013 © OECD 2013 193
GLOSSARY
Unitary states Countries that do not have a constitutionally delineated division
of political authority between one central and several regional or
state autonomous governments. However, unitary states may
have administrative divisions that include local and provincial or
regional levels of government.
Variable A characteristic of a unit being observed that may assume more
than one of a set of values to which a numerical measure or a
category from a classification can be assigned (e.g. income, age,
weight, etc., and “occupation”, “industry”, “disease”, etc.) (OECD
Glossary of Statistical Terms).
Working time Adjustment applied to annual average compensation of
adjustment government employees that compensates for differences in time
worked taking into account, where applicable, the average
number of working days and the average number of hours
worked per week.
GOVERNMENT AT A GLANCE 2013 © OECD 2013194

ORGANISATION FOR ECONOMIC CO-OPERATIONAND DEVELOPMENT
The OECD is a unique forum where governments work together to address the economic, social and
environmental challenges of globalisation. The OECD is also at the forefront of efforts to understand and
to help governments respond to new developments and concerns, such as corporate governance, the
information economy and the challenges of an ageing population. The Organisation provides a setting
where governments can compare policy experiences, seek answers to common problems, identify good
practice and work to co-ordinate domestic and international policies.
The OECD member countries are: Australia, Austria, Belgium, Canada, Chile, the Czech Republic,
Denmark, Estonia, Finland, France, Germany, Greece, Hungary, Iceland, Ireland, Israel, Italy, Japan, Korea,
Luxembourg, Mexico, the Netherlands, New Zealand, Norway, Poland, Portugal, the Slovak Republic, Slovenia,
Spain, Sweden, Switzerland, Turkey, the United Kingdom and the United States. The European Union takes
part in the work of the OECD.
OECD Publishing disseminates widely the results of the Organisation’s statistics gathering and
research on economic, social and environmental issues, as well as the conventions, guidelines and
standards agreed by its members.
OECD PUBLISHING, 2, rue André-Pascal, 75775 PARIS CEDEX 16
(42 2013 20 1 P) ISBN 978-92-64-20132-3 – No. 60809 2013

Preliminary version
Government at a Glance 2013
Govern
ment at a G
lance 2013
Government at a Glance 2013