Preface - in.gov2).pdf · unhealthy lifestyle behaviors 19and habits into adulthood. Strategies to...
27
1
Transcript of Preface - in.gov2).pdf · unhealthy lifestyle behaviors 19and habits into adulthood. Strategies to...

1

2
Preface
Over the past several years, Indiana has made great strides in reducing the burden of cancer. While
cancer incidence continues to decline, cancer is still the second leading cause of death, affecting every
individual, family and community. Healthy lifestyle behaviors are the most effective in preventing
cancers. These include avoiding tobacco products, maintaining a healthy weight and meeting national
guidelines for healthy eating and recommended physical activity.
The “Burden of Obesity Related Cancers and the Promotion of Physical Activity in Indiana” describes the
burden of cancers associated with obesity and the extent that obesity-related cancers are affecting
Hoosiers. In addition, the report outlines policy, systems and environmental change strategies that can
be adopted at the state, community and school district level to provide opportunities for increased
physical activity in adults and children by making the healthy choice the easy choice.
The Cancer Control Section and the Indiana Cancer Consortium (the state’s only comprehensive cancer
control coalition) use the Indiana Cancer Control Plan 2010-2014 to guide cancer control efforts and
promote collaborations between organizations and the residents of Indiana. The “Burden of Obesity
Related Cancers and the Promotion of Physical Activity in Indiana” furthers that effort. This report can be
used to:
Educate communities, organizations, school districts, employers and decision makers about the
burden of obesity related cancers, the current state of physical activity and overweight and
obesity trends in Indiana
Educate key stakeholders about evidence-based physical activity strategies aimed at improving
levels of physical activity
Inform decision makers how policy, systems and environmental change strategies in schools and
communities can encourage physical activity by making the healthy choice the easy choice
Select populations at risk for obesity related cancers as recipients for health promotion efforts
Raising awareness about the impact people and evidence-based interventions can have on health is a
step towards cancer prevention. Progress towards cancer control cannot be made without every
Hoosier working together to fight this disease.
For more information, contact:
Emily Jones Cancer Policy and Research Director Cancer Control Section [email protected] Amanda Raftery, M.P.H., R.D., C.D. Cancer Epidemiologist Division of Chronic Disease Epidemiology [email protected]

3
Acknowledgements Cancer Control Section Keylee Wright, M.A., Director Dawn Swindle, Health Education and Communications Director Cardiovascular Health and Diabetes Section Greg Budney, M.P.H., Epidemiologist Division of Chronic Disease Epidemiology Champ Thomaskutty, M.P.H., Director Division of Chronic Disease Prevention and Control Ann Alley, Director Division of Nutrition and Physical Activity Lindsey Bouza, M.P.H., C.H.E.S., P.A.P.H.S., Wellness and Physical Activity Coordinator Indiana Cancer Consortium Caleb Levell, Coalition Coordinator Indiana Healthy Weight Initiative April Hammerand, Coalition Coordinator

4
Introduction
Cancer is the second leading cause of death in Indiana, impacting every individual, family and
community. About 2.4 million Hoosiers or two in five people will eventually develop cancer.1 Tellingly,
while the incidence rates for many cancers are declining, the incidence rates for cancers associated with
obesity are increasing in the United States.2 The World Cancer Research Fund estimates about one-
quarter to one-third of new cancer cases expected to occur in the United States during 2013 will be
related to overweight or obesity, physical inactivity and poor nutrition.3
Over the past three decades, the adult obesity rate has doubled and almost two-thirds of Indiana adults
are considered overweight or obese. Many factors influence overweight and obesity; however,
unhealthy lifestyle choices play a large role. For example, sedentary lifestyles and decreased
opportunities for physical activity make it extremely difficult to be active on a regular basis. As a result,
most Americans consume more calories than they burn, contributing to weight gain and obesity.
Obesity is not only a risk factor for cancer, but also for many other chronic conditions such as
cardiovascular disease, hypertension and diabetes; thus, many of America’s disease burdens associated
with overweight and obesity can be prevented. The Centers for Disease Control and Prevention (CDC)
have studied several methods to reduce and prevent this national epidemic. The CDC provides tools and
resources for individuals, communities and organizations to use a framework for reducing obesity.
Policy, systems and environmental change strategies can evoke sustainable, far reaching impact to
reduce obesity. In Indiana, changes to built environments and increased opportunities for physical
activity are being explored within community and school settings.
What is the burden of overweight and obesity in the United States and Indiana?
Obesity is a common and serious public health concern. Obesity is considered a national epidemic with
rates that have more than doubled in adults and children, and tripled in adolescents during the past 30
years.4,5 In 2011-2012, more than one-third, or 34.9 percent, of adults aged 20 and over in the United
States were obese.6 Childhood obesity rates are also concerning and have been increasing during the
past several decades. In the United States 17 percent, or 12.5 million, children and adolescents ages two
through 19 were considered obese in 2009-2010.7
Adults, children and adolescents of all races and backgrounds greatly suffer from overweight and obesity
in Indiana. In 2010, roughly three million Indiana adults or 65.4 percent were overweight or obese which
is an increase of 10 percentage points since 1995.8 The Indiana adult obesity prevalence has consistently
risen, mirroring increases seen across the United States. Appendix A displays the progressive increase of
obesity rates throughout all 92 counties in Indiana from 2004-2009. While each county saw an increase
in obesity prevalence, the northern and southwest regions of the state have a noticeably higher
concentration. Among Indiana youth (10-17 years) 31.5 percent were considered overweight or obese in
2011-2012, and in 2011, 30.2 percent of high school students were also considered either overweight or
obese.9 A large body of evidence suggests obese children are likely to become obese adults10,11,12,13.
When obese, adults especially are at an increased risk for several types of cancer.

5

6
Obesity and cancer: What is the link?
The National Cancer Institute has investigated and found many cancers that are associated with excess
weight. These cancers, and possibly others, include postmenopausal breast, colon and rectum,
endometrial, esophagus, gallbladder, thyroid, kidney and pancreatic.14 In Indiana, the overall age-
adjusted (see Technical Notes, Appendix B) incidence rates for four of these cancers have significantly
increased from 1997 to 2010. Appendix B demonstrates how incidence rates for esophageal cancer have
increased from 4.0 to 5.1 per 100,000 persons; pancreatic cancer from 8.6 to 11.9 per 100,000 persons;
kidney and renal cancer from 12.1 to 18.1 per 100,000 persons; and thyroid cancer from 4.9 to 11.4 per
100,000 persons. For the same years, mortality rates significantly decreased for colon and rectum
cancer (23.3 to 15.7 per 100,000 persons) but increased for esophageal cancer (3.7 to 5.2 per 100,000
persons). Appendix B also displays incidence and mortality rates from 1997 to 2010 for the seven
cancers related to obesity. In addition, significant findings of the differences found between genders and
races for these cancers in Indiana are listed.
Several possible mechanisms have been suggested to explain the association of obesity with increased
risk of certain cancers. Some include fat tissues, which produce excess amounts of estrogen, have been
linked with the risk of breast, endometrial and some other cancers. Additionally, some suggest that fat
cells, which produce hormones that may stimulate or inhibit cell growth, have effects on other tumor
growth regulators. Other associations are obese people often have increased levels of insulin, which may
promote the development of certain tumors.
Estimates suggest overweight and obesity contribute to 14 to 20 percent of all cancer-related
mortality.15 Increasing evidence suggests being overweight increases the risk for cancer recurrence and
decreases the likelihood of survival for several cancers. Evidence also suggests that intentional weight
loss of at least 20 pounds or more can reduce risk of obesity related cancers.16 While it is important to
prevent overweight and obesity, making lifestyles changes show promise in reducing the risk of cancers
associated with overweight and obesity.

7

8
Physical activity as a risk factor for overweight and obesity
Making healthy lifestyle choices can greatly impact the risk of becoming overweight or obese. Leading a
physically active lifestyle is a recommended strategy to maintain a healthy weight. The CDC
recommends adults get at least 150 minutes of aerobic exercise every week and complete muscle-
strengthening activities on two more days of the week.17 However, nationally, less than half of all adults
meet those guidelines.18 Indiana, sadly, falls short of these low national statistics. Currently, only 17.3
percent of Indiana adults participated in 150 minutes or more of aerobic activity and at least two days of
muscle strengthening exercise per week.8 Many adults, about 29 percent, do not get any physical
activity outside of their normal work days, either.8
Children are also at risk of failing to meet requirements for physical activity. The CDC recommends
children get 60 minutes or more of physical activity each day. However, nationally, less than three in 10
high school students get at least 60 minutes of physical activity per day.18 Similar results exist in Indiana.
For instance, over half, about 56.5 percent, of Indiana high school students are not physically active five
days a week, and only 24 percent are physically active seven days a week.9 Many hours each day are
often consumed by television watching, playing video games or using computers for personal use
outside of school.9 Therefore it is increasingly important that adolescents establish healthy lifestyle
behaviors and prevent unhealthy habits, as it is easier and more effective than trying to reverse
unhealthy lifestyle behaviors and habits into adulthood.19
Strategies to promote physical activity
Several organizations like the CDC and Institute of Medicine (IOM) have conducted research aimed at
guiding and directing public health organizations to implement evidence-based strategies to improve
population health. Policy, systems and environmental change interventions encouraging physical activity
and healthy eating for adults and children demonstrate meaningful effects across all groups, regardless
of age, race, ethnicity and gender.
The Guide to Community Preventive Services20, also known as The Community Guide, lists intervention
key findings to direct states and communities’ public health efforts. Policy and environmental
approaches designed to provide opportunities, support, and cues to help people be physically active
involve the physical environment, social networks and norms, laws, and a broad network of partnerships
including public health professionals, legislators, park departments, transportation and the media.21 The
Community Guide describes four recommended environmental and policy approaches to increase
physical activity. The four strategies are:
Community-scale urban design and land use policies
Enhanced access to places for physical activity
Street-scale urban design and land use policies
Point-of-decision prompts to encourage use of stairs

9
These strategies are made to be implemented within community settings, workplaces, and organizations
aimed at making the healthy choice, the easy choice.
The IOM reviewed the current status of physical activity and physical education and provided
recommendations for strengthening and improving programs and policies for physical activity and
education in the school environment, encompassing before, during and after school, based on guiding
principles in Educating the Student Body: Taking Physical Activity and Physical Education to School.22
Schools have direct contact with children for multiple hours a day, and play a significant role in
supporting youth to be physically active by allowing time for physical activity. The IOM recognizes the
benefits associated with instilling strong values that encourage children to adopt lifelong physical
activity habits. Systems and policy changes are far reaching. Their impact is realized across different
population groups to achieve health equity among the younger generation. In Educating the Student
Body: Taking Physical Activity and Physical Education to School, recommendations were made using the
best available scientific evidence and promising approaches. The report took into account all types of
school environments and the diversity of students. A summary of recommendations are below:
Taking a Whole-of-School Approach
School and district administrators, parents and teachers should create a whole-of-school
approach that fosters and provides access to, and opportunities for, physical activity in the
school environment. This can be achieved by adopting or strengthening school wellness
policies to align with national recommendations for both number of weekly physical activity
minutes and physical education to increase the opportunity and availability of time and
places for children to be physically active.
Considering Physical Activity in All School-Related Policy Decisions
Schools should consider access to, and provision of, physical activity in all decisions related
to the school environment as a factor contributing to improved academic achievement and
development. Multi-component system interventions are promising strategies aimed at
increasing physical activity in schools. Potential actions for states, school districts, schools
and wellness committees include designating key individuals for physical activity related
opportunities and programs and specifying objectives for physical activity during all parts of
the day such as physical education, recess, classroom and transportation from and to
school.
Designing Physical Education as a Core Subject
Physical education is a foundation for lifelong health and learning and should be designated
as a core subject. All school-aged children should have access to health-enhancing subject
areas to develop knowledge, skills and motivation to engage in lifelong positive health
behaviors like physical activity. Federal and state agencies should consider finding
innovative application of physical education in sample states or districts to measure and

10
highlight outcomes. Non-governmental agencies have a unique opportunity develop
materials to educate key stakeholders.
Monitoring Physical Education and Opportunities for Physical Activity in School
Educators should develop and systemically collect school wellness policy content and health
behaviors to assist in policy and program planning, implementation and evaluation. Little
information is available on physical activity behaviors of students during schools hours.
Provide Pre-service training and Professional Development for Teachers
School administrators should continuously engage and educate K-12 physical education
teachers in professional development opportunities to enable them to embrace and
promote physical activity across the curriculum. Physical education and activity competency
should be established and highlight exemplary programs as best practices.
Ensuring Equity in Access to Physical Activity and Physical Educations
Ensure programs and policies address existing disparities in physical activity and all students
at all schools have equal access to and opportunities for physical activity and quality physical
education. Children of all backgrounds should engage in physical education meet the
recommended 60 minutes per day of physical activity.

11

12
What is Indiana doing?
The impact of cancer and overwhelmingly high rates of overweight and obesity in Indiana is clear. State
comprehensive cancer control programs are responding to these issues by implementing evidence-
based policy, systems and environmental change strategies to reduce the burden of cancer in Indiana.
The Cancer Control Section (CAS) at the Indiana State Department of Health (ISDH) provides technical
assistance to the Indiana Cancer Consortium (ICC), the state’s comprehensive cancer control coalition.
Together, the CAS and ICC plans, implements and evaluates the Indiana Cancer Control Plan 2010-2014
to reduce the burden of cancer. The CAS and ICC share a policy agenda that addresses the alarmingly
low rates of physical activity among children, adolescents and adults. Specifically, the policy agenda
addresses built environment strategies like increasing the number of complete streets and promoting
school-based policy and systems changes allowing children to accumulate 150 minutes of physical
activity a week in school.
Complete streets are roadways designed to safely and comfortably provide for the needs of all users,
like motorists, cyclists, pedestrians, transit and school bus riders, movers of commercial goods, persons
with disabilities, seniors and emergency users. Complete streets provide opportunities for increased
physical activity by incorporating features that promote regular walking, cycling and transit use into
almost every street. Interventions targeting built environment changes, such as complete streets, are
associated with increased levels of physical activity. Research shows people living in walkable
neighborhoods complete 35-45 more minutes of physical activity weekly and are substantially less likely
to be overweight or obese compared to people living in neighborhoods where walking is not as safe or
easy.23 Complete streets can decrease the dependence of automotive transportation. Evidence suggests
each additional hour spent in a car per day was associated with a 6 percent increase in the likelihood of
obesity.24 Ongoing collaborations between the CAS and ICC and internal and external partners, such as
the Division of Nutrition and Physical Activity (DNPA) at ISDH and Indiana Complete Streets Coalition,
has resulted in an increase in the percentage of Indiana residents covered by a complete streets policy.
Currently, approximately 40 percent of Indiana residents live in communities covered by a complete
streets policy.25 Indianapolis boasts the strongest complete streets policy in the nation and is looked to
as a leader in built environment strategies.26 As more Hoosiers gain access to complete streets,
opportunities for living a physically active life increases, thus benefits states’ comprehensive cancer
control efforts.
The CAS and the ICC support increased time for physical activity in elementary schools. In Indiana, most
school corporations are required to have a school wellness policy; however, time requirements for
physical activity are not mandated. Schools have the option to enhance their wellness policy by
incorporating increased time for physical activity. To increase school districts knowledge base, the ICC
educates its membership on the Indiana Model School Wellness Policy on Physical Activity and Nutrition
and Indiana Healthy Schools Toolkit. Created by partners from the DNPA, Indiana Healthy Weight
Initiative and InShape Indiana, the intent of the Indiana Model School Wellness Policy is to provide
language for physical activity and nutrition for a school corporation that aligns with best practice
recommendations. The Indiana Healthy Schools Toolkit provides a framework for action for schools to

13
follow that will allow for increased opportunities for students and staff to be physically active and also
eat healthy. Currently, there are 14 Indiana school corporations that have a wellness policy specifying
elementary children will receive 30 minutes a day of physical activity every day. The CAS and ICC
continue leveraging statewide partnerships to advance school wellness improvements in order to
prevent and control cancer in Indiana.
Conclusion
Promoting physical activity is a critical component to reducing and preventing obesity. The CAS provides
technical assistance to the ICC to better address cancer policy, systems and environmental change
strategies to decrease cancer risk through lifestyle behavioral interventions. ISDH supports evidence-
based strategies to prevent and control cancer. While advancements have been made to reduce cancer
incidence, many cancers associated with overweight and obesity are on the rise.2
The ICC’s mission is to reduce the cancer burden in Indiana by bringing together Indiana’s cancer
community; identifying disease challenges facing our state and local communities; and implementing
evidence-based solutions that make a difference.

14
Appendix A
Figures 1-6: Percent Obese Adults (Age 20+), by Year and County of Residence in Indiana, 2004-2009
Figure 1. Figure 2.
Figure 3. Figure 4.
2004 2005
2006 2007

15
Figures 1-6: Percent Obese Adults (Age 20+), by Year and County of Residence in Indiana, 2004-2009
(continued)
Figure 5. Figure 6.
2008 2009

16
Appendix B
Technical Notes
Age-Adjusted Rates
Older age groups generally have higher cancer rates than younger age groups. For example, in Indiana,
more than 60 percent of new lung cancer cases occur in those ages 60 and older. As a result, if one
county’s lung cancer incidence rate is higher than another, the first question asked is whether the
county with a higher rate has an older population. To address this issue, all mortality and incidence rates
presented in this report, unless otherwise noted, have been age-adjusted. This removes the impact of
different age distributions between populations and allows for direct comparisons of those populations.
Additionally, age-adjustment allows for a comparison of rates within a single population over time. An
age-adjusted rate is not a real measure of the burden of the disease on a population, but rather an
artificial measure that is used for comparison purposes.
All mortality and incidence rates in this publication were age-adjusted using the direct method. This
method weights the age-specific rates (i.e., rates calculated for each age group) for a given sex, race, or
geographic area by the age distribution of the standard population. The 2000 United States standard
million population and five-year age group population numbers were used to calculate all of the age-
adjusted rates in this report.

17
Trends in Incidence and Mortality Rates of Overweight and Obesity Related Cancers
Below are charts for age-adjusted incidence and mortality rates for those cancers related to overweight
and obesity in adults. Changes in rates for gender within race (white and black), between races and
genders for 1997-2010 were examined for statistical significance. Rates with counts consistently less
than 20 were not included as they are statistically unstable. Only findings that are statistically significant
with stable rates are mentioned here.
Incidence Rates
The rate for esophageal cancer incidence increased significantly for white males from 1997 to 2010.
The rate for colon and rectum cancer incidence decreased significantly for white males and white females from 1997 to 2010.
The rate for pancreatic cancer incidence increased significantly for white males and white females from 1997 to 2010.
The rate for kidney and renal pelvis cancer incidence increased significantly for white males and white females from 1997 to 2010.
The rate for thyroid cancer incidence increased significantly for white males and white females from 1997 to 2010.
The rate for post-menopausal breast cancer incidence decreased for white females from 1997 to 2010.
The colon and rectum cancer incidence rate was not significantly different between black and white females in 1997, however, by 2010, black females had a significantly higher rate than white females did.
The incidence rate for white males in 1997 and 2010 was significantly higher than white females for colon and rectum, kidney and renal pelvis, esophageal and pancreatic cancers.
The post-menopausal breast cancer incidence rate for white females was significantly higher than for black females in 1997; however, this difference disappeared by 2010.
The endometrial cancer incidence rate for white females was significantly higher than for black females in 1997; however, this difference disappeared by 2010.
Mortality Rates
The colon and rectum cancer mortality rate was significantly higher for black females when compared to white women in 1997. By 2010, the rates were not significantly higher for black females.
The colon and rectum cancer mortality rate decreased significantly for white males, white females and black females from 1997 to 2010.
The pancreatic cancer mortality rate was significantly higher for black males when compared to white males in 1997. By 2010, the rates were not significantly different between the two races.
The mortality rate for white males in 1997 and 2010 was significantly higher than white females for colon and rectum, kidney and renal pelvis, esophageal and pancreatic cancers.
The endometrial cancer mortality rate for black females was significantly higher than for white
females in 1997 and 2010.

18
9.6†‡7.2‡
1.31.2
0
5
10
15
20
25
30
35
40
45
50
20102009200820072006200520042003200220012000199919981997
Rat
e p
er 1
00,0
00 p
erso
ns
White Males White Females
49.8†§
64.1§
36.7†
60.3
67.4
47.5‡
0
10
20
30
40
50
60
70
80
90
100
20102009200820072006200520042003200220012000199919981997
Rat
e p
er 1
00,0
00 p
erso
ns
White Males White Females Black Male Black Females
49.3
48.8
Figure 2. Colorectal Cancer Incidence Rates by Race*—Indiana, 1997-2010
10
*Age-adjusted † The rate decreased significantly for white males and white females from 1997 to 2010. ‡ The rate was significantly higher for black females compared to white females in 2010 . § The rate was significantly higher for white males compared to white females in 1997 and 2010. Source Indiana State Cancer Registry
Figure 1. Esophageal Cancer Incidence Rates by Race*—Indiana, 1997-2010
*Age-adjusted for all esophageal cancers. Rates for races and genders not represented were too small to be stable. † The rate increased significantly for white males from 1997 to 2010. ‡ The rate was significantly higher for white males compared to white females in 1997 and 2010. Source Indiana State Cancer Registry

19
1.51.7
0
5
10
15
20
25
30
35
40
45
50
20102009200820072006200520042003200220012000199919981997
Ra
te p
er
10
0,0
00
pe
rso
ns
White Females
13.4†‡
9.6‡ 10.1†
7.2
16.215.715.2
12.1
0
5
10
15
20
25
30
35
40
45
50
20102009200820072006200520042003200220012000199919981997
Rat
e p
er 1
00,0
00 p
erso
ns
White Males White Females Black Male Black Females
Figure 3. Gallbladder Cancer Incidence Rates by Race*—Indiana, 1997-2010
10
*Age-adjusted. Rates for races and genders not represented were too small to be stable. Source Indiana State Cancer Registry
Figure 4. Pancreatic Cancer Incidence Rates by Race*—Indiana, 1997-2010
*Age-adjusted. † The rate increased significantly for white males and white females from 1997 to 2010. ‡ The rate was significantly higher for white males compared to white females in 1997 and 2010. Source Indiana State Cancer Registry

20
23.5†‡
16.7‡
13.4†
8.8
21.6
14.6 15.3
7.8
0
5
10
15
20
25
30
35
40
45
50
20102009200820072006200520042003200220012000199919981997
Rat
e p
er 1
00,0
00 p
erso
ns
White Males White Females Black Male Black Females
*Age-adjusted† The rate increased significantly for white males and white females from 1997 to 2010.‡ The rate was significantly higher for white males compared to whilte females in 1997 and 2010. Source Indiana State Cancer Registry
6.1†
2.8
17.9†‡
7.2‡
2.5
0.90
5
10
15
20
25
30
35
40
45
50
20102009200820072006200520042003200220012000199919981997
Rat
e p
er
10
0,0
00
pe
rso
ns
White Males White Females Black Male
Figure 5. Kidney and Renal Pelvis Cancer Incidence Rates by Race*—Indiana, 1997-2010
10
*Age-adjusted † The rate increased significantly for white males and white females from 1997 to 2010. ‡ The rate was significantly higher for white males compared to white females in 1997 and 2010. Source Indiana State Cancer Registry
Figure 6. Thyroid Cancer Incidence Rates by Race*—Indiana, 1997-2010
10
*Age-adjusted. Black females had counts too small to produce stable rates. † The rate increased significantly for white males and white females from 1997 to 2010. ‡ The rate was significantly higher for white females compared to white males in 1997 and 2010. Source Indiana State Cancer Registry

21
317.3†
353.7‡350.2
269.4
0
50
100
150
200
250
300
350
400
450
20102009200820072006200520042003200220012000199919981997
Ra
te p
er
10
0,0
00
pe
rso
ns
White Females Black Females
27.526.7†
21.7
16.9
0
5
10
15
20
25
30
35
40
45
50
20102009200820072006200520042003200220012000199919981997
Rat
e p
er 1
00,0
00 p
erso
ns
White Females Black Females
Figure 7. Female Post-Menopausal Breast Cancer Incidence Rates by Race*—Indiana, 1997-2010
10
*Crude rates for women 50 years of age and over. † The rate decreased significantly for white females from 1997 to 2010. ‡ The rate was significantly higher for white females compared to black females in 1997. Source Indiana State Cancer Registry
Figure 8. Endometrial (Corpus Uterus) Cancer Incidence Rates by Race*—Indiana, 1997-2010
10
* Age-adjusted † The rate was significantly higher for white females compared to black females in 1997. Source Indiana State Cancer Registry
22
9.3†‡6.7‡
1.81.4
0
5
10
15
20
25
30
35
40
45
50
20102009200820072006200520042003200220012000199919981997
Rat
e p
er
10
0,0
00
pe
rso
ns
White Males White Females
18.6‡§
26.4‡
12.4§
20.0
27.1
35.7
16.8§
30.8†
0
5
10
15
20
25
30
35
40
45
50
20102009200820072006200520042003200220012000199919981997
Rat
e p
er 1
00,0
00 p
erso
ns
White Males White Females Black Male Black Females
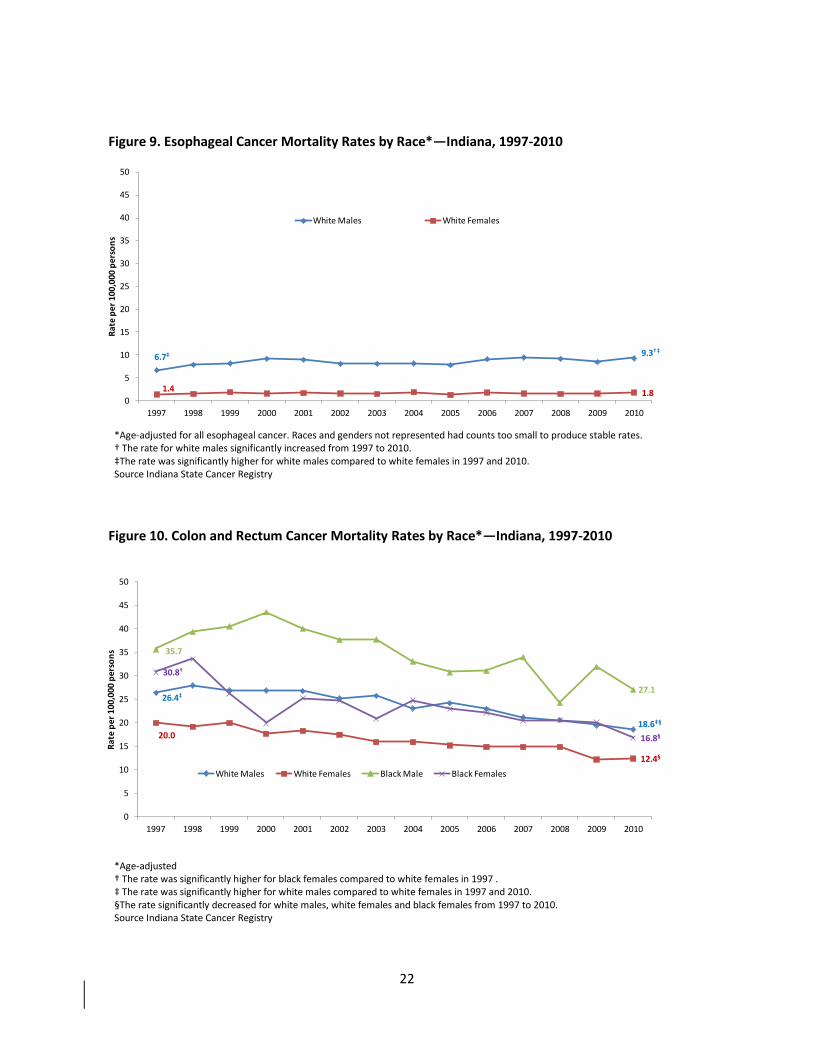
Figure 9. Esophageal Cancer Mortality Rates by Race*—Indiana, 1997-2010
10
*Age-adjusted for all esophageal cancer. Races and genders not represented had counts too small to produce stable rates. † The rate for white males significantly increased from 1997 to 2010. ‡The rate was significantly higher for white males compared to white females in 1997 and 2010. Source Indiana State Cancer Registry
Figure 10. Colon and Rectum Cancer Mortality Rates by Race*—Indiana, 1997-2010
10
10
*Age-adjusted † The rate was significantly higher for black females compared to white females in 1997 . ‡ The rate was significantly higher for white males compared to white females in 1997 and 2010. §The rate significantly decreased for white males, white females and black females from 1997 to 2010. Source Indiana State Cancer Registry
Cour
Source Indiana State Cancer Registry
Source Indiana State Cancer Registry

23
0
5
10
15
20
25
30
35
40
45
50
20102009200820072006200520042003200220012000199919981997
Ra
te p
er
10
0,0
00
pe
rso
ns
White Females
7.1†7.8†
3.33.7
0
5
10
15
20
25
30
35
40
45
50
20102009200820072006200520042003200220012000199919981997
Ra
te p
er
10
0,0
00
pe
rso
ns
White Males White Females
Figure 11. Gallbladder Cancer Mortality Rates by Race*—Indiana, 1997-2010
10
*Age-adjusted. Races and genders not represented had counts too small to produce stable rates. Source Indiana State Cancer Registry
Figure 12. Pancreatic Cancer Mortality Rates by Race*—Indiana, 1997-2010
10
10
*Age-adjusted. Races and genders not represented had counts too small to produce stable rates. Source Indiana State Cancer Registry

24
Figure 13. Thyroid Cancer Mortality Rates by Race—Indiana, 1997-2010
0
20102009200820072006200520042003200220012000199919981997
Ra
te p
er 1
00,0
00 p
erso
ns
7.1†7.8†
3.33.7
0
5
10
15
20
25
30
35
40
45
50
20102009200820072006200520042003200220012000199919981997
Ra
te p
er
10
0,0
00
pe
rso
ns
White Males White Females
Figure 14. Kidney and Renal Pelvis Cancer Mortality Rates by Race*—Indiana, 1997-2010
10
10
*Age-adjusted. Races and genders not represented had counts too small to produce stable rates. . †The rate was significantly higher for white males compared to white females in 1997 and 2010. Source Indiana State Cancer Registry
Counts are too low to provide stable rates

25
26.930.1
20.3
31.0
0
5
10
15
20
25
30
35
40
45
50
20102009200820072006200520042003200220012000199919981997
Ra
te p
er
10
0,0
00
pe
rso
ns
White Females Black Females
4.43.9
8.3†
11.2†
0
5
10
15
20
25
30
35
40
45
50
20102009200820072006200520042003200220012000199919981997
Ra
te p
er 1
00,0
00 p
erso
ns
White Females Black Females
Figure 15. Breast Cancer Mortality Rates by Race*—Indiana, 1997-2010
10
10
*Crude rates for women 50 years of age and over. Source Indiana State Cancer Registry
Figure 16. Endometrial (Corpus and Uterus) Cancer Mortality Rates by Race*—Indiana, 1997-2010
10
10
*Age-adjusted. The rates for black females for the years 1998,1999,2000,2001,2003,2004,2005, 2006, 2007, 2009 are based on <20 cases and are unstable. †The rate was significantly higher for black females compared to white females in 1997 and 2010. Source Indiana State Cancer Registry

26
References
1 Indiana Cancer Facts and Figures 2012. Accessed from http://indianacancer.org/resources-for-indiana-cancer-consortium-members/indianacancerfactsandfigures2012/ 2 Eheman, C. et al. (2012). Annual report to the Nation on the status of cancer, 1975-2008, featuring cancers associated with excess weight and lack of sufficient physical activity. Cancer, 118(9), 2338-66. 3 World Cancer Research Fund. Accessed from http://www.wcrf.org/cancer_statistics/preventability_estimates/preventability_estimates_food.php 4 Ogden CL, Carroll MD, Kit BK, Flegal KM. Prevalence of obesity and trends in body mass index among US children and adolescents, 1999-2010. Journal of the American Medical Association 2012, 307(5),483-490. 5 National Center for Health Statistics. Health, United States: With special features on socioeconomic status and health. Hyattsville, MD; US Department of Health and Human Services. 2012. Report No.: 2012-1232. 6 Ogden, C., Carroll, M., Kit, B., & Flegal, K. Prevalence of obesity among adults, United States, 2011-2012. NCHS data brief, no 131. Hyattsville, MD: National Center for Health Statistics. 2013. 7 Ogden, C., Carroll, M., Kit, B., & Flegal, K. Prevalence of obesity in the United States, 2009-2010. NCHS data brief, no 82. Hyattsville, MD: National Center for Health Statistics. 2012. 8Indiana State Department of Health. (2012). Behavioral Risk Factor Surveillance System 2011.
9 Indiana State Department of Health. (2012). Youth Risk Behavior Surveillance System—United States, 2011. 10 Guo SS, Chumlea WC. Tracking of body mass index in children in relation to overweight in adulthood. American Journal of Clinical Nutrition 1999;70:S145-148. 11 Freedman DS, Kettel L, Serdula MK, Dietz WH, Srinivasan SR, Berenson GS. (2005).The relation of childhood BMI to adult adiposity: the Bogalusa Heart Study. Pediatrics, 115, 22-27. 12 Freedman D, Wang J, Thornton JC, et al. (2009). Classification of body fatness by body mass index-for-age categories among children. Archives of Pediatric and Adolescent Medicine, 163, 801-811. 13 Freedman DS, Khan LK, Dietz WH, Srinivasan SA, Berenson GS. (2001) Relationship of childhood obesity to coronary heart disease risk factors in adulthood: the Bogalusa Heart Study. Pediatrics, 108, 712-718. 14
National Cancer Institute. Obesity and cancer risk. Accessed from http://www.cancer.gov/cancertopics/factsheet/Risk/obesity. 15 Calle, E, Rodriguez, C. Walker-Thurmound, K. and Thun, M. (2003). Overweight, obesity, and mortality from cancer in a prospectively studied cohort of U.S adults. N Engl J Med, 348(17), 1625-38. 16 Parker, E., and Folsom, A. (2003) Intentional weight loss and incidence of obesity-related cancers: the Iowa women’s health study. International Journal of Obesity, 27, 1447-1452. 17 United States Department of Health and Human Services. 2008 Physical activity guidelines for Americans. Accessed from http://www.health.gov/paguidelines/guidelines/default.aspx 18 Centers for Disease Control and Prevention. Facts about physical activity. Accessed from http://www.cdc.gov/physicalactivity/data/facts.html 19 Centers for Disease Control and Prevention. Adolescent and School Health. Accessed http://www.cdc.gov/healthyyouth/schoolhealth/ 20
The Guide to Community Preventive Services. Accessed from http://www.thecommunityguide.org 21 The Community Guide. Increasing physical activity: environmental and policy approaches. Accessed from http://www.thecommunityguide.org/pa/environmental-policy/index.html.
27
22 Institute of Medicine. Educating the student body: taking physical activity and physical education to school. 2013. Accessed from http://www.iom.edu/Reports/2013/Educating-the-Student-Body-Taking-Physical-Activity-and-Physical-Education-to-School.aspx. 23 Sallis, James F. et al (2009). “Neighborhood built environment and income: Examining multiple health outcomes.” Social Science and Medicine 68,1285-1293. 24 Frank, L., Andresen, M., & Schmid, T. (2004). Obesity relationships with community design, physical activity, and time spend in cars. American Journal of Preventive Medicine, 27(2), 87-96. 25
Indiana State Department of Health. Division of Nutrition and Physical Activity. Internal data. 26 Smart Growth America. 2013. The best complete streets policies of 2012. Accessed from http://www.smartgrowthamerica.org/documents/cs-2012-policy-analysis.pdf