PREDICTION OF RADI AL AND TANGENTIAL … PR ÓXIMO: UM EXEMPLO DE Tectona grandis DO TOGO E DE...
8
Cerne, Lavras, v.16, Suplemento, p. 66-73, jul.2010 PREDICTION OF RADIAL AND TANGENTIAL SHRINKAGES BY NEAR-INFRARED SPECTROSCOPY: AN EXAMPLE FOR Tectona grandis FROM TOGO AND FOR Liquidambar styraciflua FROM MADAGASCAR Gilles Chaix 1* , Adzo-Dzifa Kokutse 2 , Bruno Ratovomboahangy 3 , Daniel Guibal 4 , Honoré Randrianjafy 5 , Hery Rakotondraoelina 5 , Loïc Brancheriau 4 , Herizo Rakotovololonalimanana 3 , Paulo Ricardo Gherardi Hein 4 , Tahiana Ramananantoandro 3 ABSTRACT: Dimensional stability is one of the most important properties of wood used as timber. However, it is very time- consuming to measure this trait. Near-infrared spectroscopy is a tool adapted for prediction of many properties of wood, as chemical contents, basic density, and the time needed for the analysis is highly reduced. The issue here is to check the effectiveness of NIRS tool to build models and to predict the radial and tangential shrinkages of Teak (Togo) and Liquidambar (Madagascar) wood both from plantations. It was possible to predict the dimensional stability by means of NIR spectroscopy: For Teak, the transversal cross- section spectra yielded better NIRS-based models while for Liquidambar, the tangential surface gave the best statistics model. For the two species, the prediction models for tangential shrinkage showed similar results in term of efficiency. After independent validation or cross-validation, respectively for Teak, and for Liquidambar wood, we assume that NIRS can be used to predict radial and tangential shrinkages for screening. Key words: Dimensional stability, Liquidambar, Teak, NIRS. PREDIÇÃO DA RETRATIBILIDADE RADIAL E TANGENCIAL POR ESPECTROSCOPIA NO INFRAVERMELHO PRÓXIMO: UM EXEMPLO DE Tectona grandis DO TOGO E DE Liquidambar styraciflua DE MADAGASCAR RESUMO: A estabilidade dimensional é uma das mais importantes propriedades físicas da madeira como material estrutural. No entanto, a medição dessa propriedade consome tempo. A espectroscopia no infravermelho próximo é uma ferramenta adaptada para predição de muitas propriedades da madeira, como as químicas e a densidade básica e o tempo requerido para análise é altamente reduzido. A questão aqui é checar a efetividade da ferramenta NIRS para a construção de modelos e para a predição da retratibilidade radial e tangencial na madeira de teca (Togo) e âmbar (Madagascar) de plantações. O resultado mostrou o possível uso do NIRS para a predição da estabilidade dimensional; para Teca, os espectros medidos na face transversal renderam os melhores modelos, enquanto em Âmbar, os espectros tangenciais produziram as melhores estatísticas. Para as duas espécies, os modelos de predição para retratibilidade tangencial mostraram resultados similares em termos de eficiência. Após validação independente e validação cruzada, respectivamente, para a madeira de Teca e de Âmbar, assume-se que o NIRS pode ser utilizado para predizer a retratibilidade tangencial e radial para análises preliminares. Palavras-chave: Estabilidade dimensional, Âmbar, Teca, NIRS. 1 *Dr in Forest Genetic – CIRAD, BIOS Department – Genetic Diversity and Breeding of Forest Species Unit – BP 5035 – 34398 – Montpellier Cedex 5, France – [email protected] 2 Professor Dr. Wood Sciences – Laboratoire de Botanique et Ecologie Végétale – Faculté des Sciences Université de Lomé – BP1515 – Lomé, Togo – [email protected] 3 Professor Dr. Wood Sciences – ESSA-Forêts – Université d’Antananarivo – B.P. 175 – Antananarivo 101, Madagascar – [email protected], [email protected] 4 Dr in wood Sciences – CIRAD – PERSYST Department – Production and Processing of Tropical Woods Unit – Montpellier, France – [email protected], [email protected], [email protected] 5 Dr in Forest Sciences – DRFP/Fofifa – BP 904 – 101 – Antananarivo 101, Madagascar – [email protected], [email protected] 1 INTRODUCTION The main wood quality factors related to dimensional characteristics are tangential and radial shrinkages. Shrinkage is affected by several properties, extractives contents especially (HERNANDEZ, 2007; STAMM, 1971; TAYLOR, 2008). Teak has been reported as presenting shrinkage of 2.5 to 3.0% in the radial direction and 3.4 to 5.8% in the tangential direction (SIMATUPANG; YAMAMOTO, 2000; TROKENBRODT; JOSUE, 1999). The good dimensional stability of Teak wood is mainly due to the bulking effect of the ethanol and hot water soluble wood extractives located in the cell wall (SIMATUPANG; YAMAMOTO, 2000). Some results have been published
Transcript of PREDICTION OF RADI AL AND TANGENTIAL … PR ÓXIMO: UM EXEMPLO DE Tectona grandis DO TOGO E DE...

66
Cerne, Lavras, v.16, Suplemento, p. 66-73, jul.2010
CHAIX, G. et al.PREDICTION OF RADIAL AND TANGENTIAL SHRINKAGES BY NEAR-INFRAREDSPECTROSCOPY: AN EXAMPLE FOR Tectona grandis FROM TOGO AND
FOR Liquidambar styraciflua FROM MADAGASCAR
Gilles Chaix1*, Adzo-Dzifa Kokutse2, Bruno Ratovomboahangy3, Daniel Guibal4, Honoré Randrianjafy5,Hery Rakotondraoelina5, Loïc Brancheriau4, Herizo Rakotovololonalimanana3,
Paulo Ricardo Gherardi Hein4, Tahiana Ramananantoandro3
ABSTRACT: Dimensional stability is one of the most important properties of wood used as timber. However, it is very time-consuming to measure this trait. Near-infrared spectroscopy is a tool adapted for prediction of many properties of wood, as chemicalcontents, basic density, and the time needed for the analysis is highly reduced. The issue here is to check the effectiveness of NIRStool to build models and to predict the radial and tangential shrinkages of Teak (Togo) and Liquidambar (Madagascar) wood both fromplantations. It was possible to predict the dimensional stability by means of NIR spectroscopy: For Teak, the transversal cross-section spectra yielded better NIRS-based models while for Liquidambar, the tangential surface gave the best statistics model. For thetwo species, the prediction models for tangential shrinkage showed similar results in term of efficiency. After independent validationor cross-validation, respectively for Teak, and for Liquidambar wood, we assume that NIRS can be used to predict radial andtangential shrinkages for screening.
Key words: Dimensional stability, Liquidambar, Teak, NIRS.
PREDIÇÃO DA RETRATIBILIDADE RADIAL E TANGENCIAL POR ESPECTROSCOPIA NOINFRAVERMELHO PRÓXIMO: UM EXEMPLO DE Tectona grandis DO TOGO E
DE Liquidambar styraciflua DE MADAGASCAR
RESUMO: A estabilidade dimensional é uma das mais importantes propriedades físicas da madeira como material estrutural. Noentanto, a medição dessa propriedade consome tempo. A espectroscopia no infravermelho próximo é uma ferramenta adaptada parapredição de muitas propriedades da madeira, como as químicas e a densidade básica e o tempo requerido para análise é altamentereduzido. A questão aqui é checar a efetividade da ferramenta NIRS para a construção de modelos e para a predição da retratibilidaderadial e tangencial na madeira de teca (Togo) e âmbar (Madagascar) de plantações. O resultado mostrou o possível uso do NIRSpara a predição da estabilidade dimensional; para Teca, os espectros medidos na face transversal renderam os melhores modelos,enquanto em Âmbar, os espectros tangenciais produziram as melhores estatísticas. Para as duas espécies, os modelos de prediçãopara retratibilidade tangencial mostraram resultados similares em termos de eficiência. Após validação independente e validaçãocruzada, respectivamente, para a madeira de Teca e de Âmbar, assume-se que o NIRS pode ser utilizado para predizer a retratibilidadetangencial e radial para análises preliminares.
Palavras-chave: Estabilidade dimensional, Âmbar, Teca, NIRS.
1*Dr in Forest Genetic – CIRAD, BIOS Department – Genetic Diversity and Breeding of Forest Species Unit – BP 5035 – 34398 – Montpellier Cedex 5, France – [email protected] Dr. Wood Sciences – Laboratoire de Botanique et Ecologie Végétale – Faculté des Sciences Université de Lomé – BP1515 – Lomé, Togo – [email protected] Dr. Wood Sciences – ESSA-Forêts – Université d’Antananarivo – B.P. 175 – Antananarivo 101, Madagascar – [email protected], [email protected] in wood Sciences – CIRAD – PERSYST Department – Production and Processing of Tropical Woods Unit – Montpellier, France – [email protected], [email protected], [email protected] in Forest Sciences – DRFP/Fofifa – BP 904 – 101 – Antananarivo 101, Madagascar – [email protected], [email protected]
1 INTRODUCTION
The main wood quality factors related todimensional characteristics are tangential and radialshrinkages. Shrinkage is affected by several properties,extractives contents especially (HERNANDEZ, 2007;STAMM, 1971; TAYLOR, 2008). Teak has been reported
as presenting shrinkage of 2.5 to 3.0% in the radial directionand 3.4 to 5.8% in the tangential direction (SIMATUPANG;YAMAMOTO, 2000; TROKENBRODT; JOSUE, 1999). Thegood dimensional stability of Teak wood is mainly due tothe bulking effect of the ethanol and hot water solublewood extractives located in the cell wall (SIMATUPANG;YAMAMOTO, 2000). Some results have been published

Cerne, Lavras, v.16, Suplemento, p. 66-73, jul.2010
67Prediction of radial and tangential shrinkages...
on the shrinkage of Teak wood (BHAT, 1998; SANWO,1987; SIMATUPANG; YAMAMOTO, 2000). Shrinkage ofLiquidambar stryraciflua (Sweetgum), which is lessstudied, has been reported as presenting shrinkage of 7%in the radial direction and 13% in the tangential one(RAKOTONDRAOELINA; RAKOTOVAO, 2005).
Determination of shrinkage is based on tests thatrequire destructive sampling and extensive samplepreparation. Breeders and industries would benefit fromemploying a more rapid, non-destructive technique for theestimation of these properties. An option for the estimationof these wood properties is near infrared spectroscopy(NIRS). The potential application of NIRS to predict woodcharacteristics has been reported in the literature (KELLEYet al., 2004; SO et al. 2004; TSUCHIKAWA, 2007). Forstudies concerning forest product, there is few referencesin which NIRS is used to assess shrinkage (BAILLÈRES;DAVRIEUX; HAM-PICHAVANT, 2002; TAYLOR, 2008).
This paper evaluates the potential of NIRspectroscopy for the assessment of shrinkages for Tectonagrandis and Liquidambar styraciflua woods both fromplantations.
2 MATERIAL AND METHODS
2.1 Wood samples
Twenty trees of Teak were select and cut for analysisfrom two plots in Togo, namely Tchorogo (34 years old)and Oyou (40 years old). Twenty seven trees ofLiquidambar (3 by 9 provenances) were select and cut inprovenance trial (23 years old), namely Mandraka inMadagascar. Planks were cut radially (500 mm in thelongitudinal axis and 50mm in the tangential axis) betweena height of 1 and 1.5 meters. Four beams were cut per plankalong the diameter (20 x 20 x 500 mm) and lastly, 5 (Teak)and 2 (Liquidambar) wood samples (20 x 20 x 10 mm) werecut per beam. The samples were stabilized to a theoreticalMC of 12% in a climate chamber at 20°C and 65% humidity.A total of 393 and 35 samples were used for measuringdimensions, and NIR absorbance for Teak and Liquidambarrespectively. For Teak, 2 NIR measurements were recorded(LR and RT surfaces) per sample, for Liquidambar oneadditional was recorded (LT surface).
2.2 Determination of shrinkages
First, the samples were immersed in water untilsaturation after several sequences of vacuum and pressure.Then, the samples were dried to the anhydrous state, by
oven drying at 103 ± 2°C. For the two states, all sampleswere weighed and radial and tangential dimensions weremeasured with a displacement transducer. Radial shrinkage(RS) and tangential shrinkage (TS) were obtained usingthe equation (1) between the saturation state and the finaloven dried state:
SAT
SAT
DDDS %0�
� (1) where S: shrinkage, DSAT: saturated dimension, D0%: dried dimension.
2.3 Near infrared spectra collection
Near-infrared spectra were collected in the NIRregion from 12,500 to 3,800 cm-1 (800-2,850 nm) with an NIRspectrometer (Bruker model Vector 22/NI) in diffusereflectance mode at a spectral resolution of 8 cm-1. Spectrataken from tangential-radial (TR) and longitudinal-radial(LR) surfaces (sample used for dimensional stability) andlongitudinal-tangential (LT for Liquidambar only) wereused in the calibration modelling. Each spectrum wasobtained with 32 scans, and means were calculated andcompared to the gold standard in order to obtain theabsorption spectrum. Temperature and relative humiditywere kept constant (20°C, 65%) throughout the NIRprocessing.
2.4 Data processing
For Teak, a validation set was established by aselection of 100 samples among the 393 samples based onthe sample distances calculated by five components aftera principal component analysis on the spectral data. Weassumed that these covered the shrinkage ranges. Then,the spectra data from 293 remaining samples wereregressed against the TS and RS, and using 5 random crossvalidation groups, the number of Partial Least Squares(PLS) components (rank) was obtained using Unscrambler9.8 (Camo). The PLS models were then used to predict dataof the validation set, evaluating their predictive ability. ForLiquidambar, we used full cross-validation process becausethe low number of sample didn’t allow us to use the Teakapproach. According to Kokutse et al. (2010), we selectedSNV (standard normal variate) and derivative 2, for whicheffects were explained, as NIR spectra pre-processing.
We detected and discarded outliers samples whosethe predicted value lies outside the calibration range, andsamples whose Mahalanobis distance were too large,meaning that the similarity of the spectra compared to thecalibration spectra was too big. The quality and the finalselection of the models were assessed by coefficient of
68
Cerne, Lavras, v.16, Suplemento, p. 66-73, jul.2010
CHAIX, G. et al.
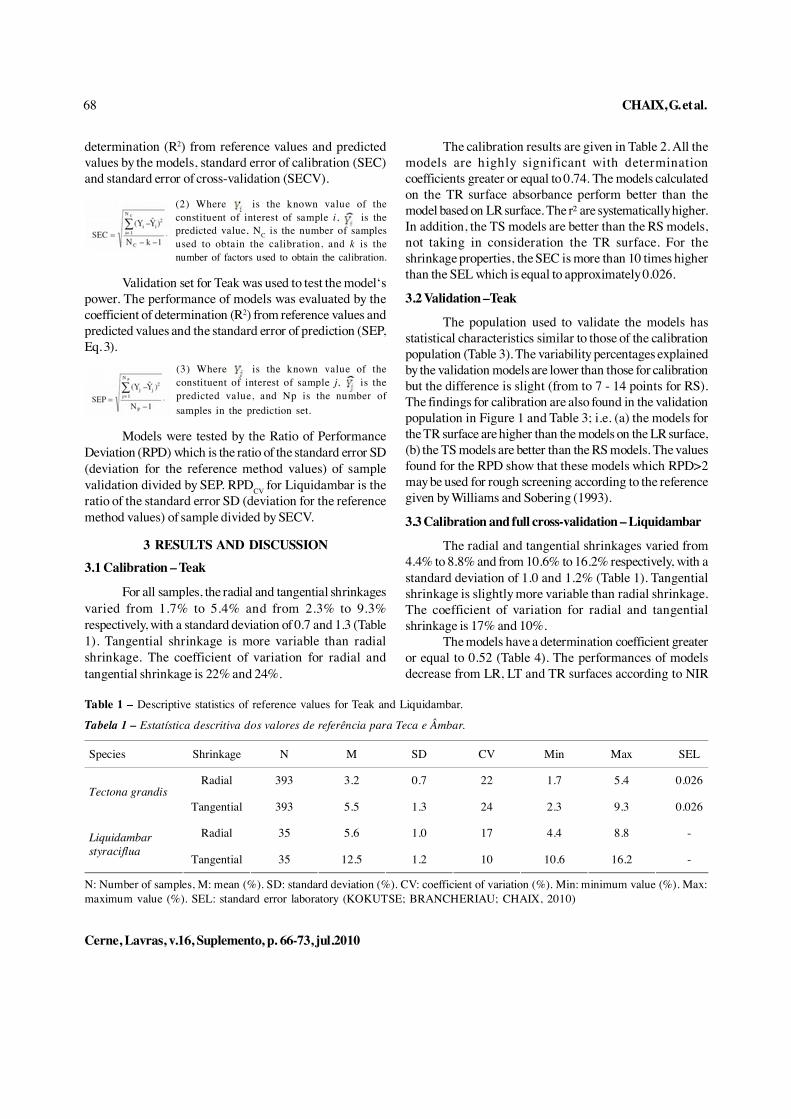
determination (R2) from reference values and predictedvalues by the models, standard error of calibration (SEC)and standard error of cross-validation (SECV).
(2) Where is the known value of theconstituent of interest of sample i, is thepredicted value, NC is the number of samplesused to obtain the calibration, and k is thenumber of factors used to obtain the calibration.
Validation set for Teak was used to test the model‘spower. The performance of models was evaluated by thecoefficient of determination (R2) from reference values andpredicted values and the standard error of prediction (SEP,Eq. 3).
(3) Where is the known value of theconstituent of interest of sample j, is thepredicted value, and Np is the number ofsamples in the prediction set.
Models were tested by the Ratio of PerformanceDeviation (RPD) which is the ratio of the standard error SD(deviation for the reference method values) of samplevalidation divided by SEP. RPDCV for Liquidambar is theratio of the standard error SD (deviation for the referencemethod values) of sample divided by SECV.
3 RESULTS AND DISCUSSION3.1 Calibration – Teak
For all samples, the radial and tangential shrinkagesvaried from 1.7% to 5.4% and from 2.3% to 9.3%respectively, with a standard deviation of 0.7 and 1.3 (Table1). Tangential shrinkage is more variable than radialshrinkage. The coefficient of variation for radial andtangential shrinkage is 22% and 24%.
Table 1 – Descriptive statistics of reference values for Teak and Liquidambar.
Tabela 1 – Estatística descritiva dos valores de referência para Teca e Âmbar.
Species Shrinkage N M SD CV Min Max SEL
Radial 393 3.2 0.7 22 1.7 5.4 0.026 Tectona grandis
Tangential 393 5.5 1.3 24 2.3 9.3 0.026
Radial 35 5.6 1.0 17 4.4 8.8 - Liquidambar styraciflua
Tangential 35 12.5 1.2 10 10.6 16.2 -
N: Number of samples, M: mean (%). SD: standard deviation (%). CV: coefficient of variation (%). Min: minimum value (%). Max:maximum value (%). SEL: standard error laboratory (KOKUTSE; BRANCHERIAU; CHAIX, 2010)
The calibration results are given in Table 2. All themodels are highly significant with determinationcoefficients greater or equal to 0.74. The models calculatedon the TR surface absorbance perform better than themodel based on LR surface. The r² are systematically higher.In addition, the TS models are better than the RS models,not taking in consideration the TR surface. For theshrinkage properties, the SEC is more than 10 times higherthan the SEL which is equal to approximately 0.026.
3.2 Validation –Teak
The population used to validate the models hasstatistical characteristics similar to those of the calibrationpopulation (Table 3). The variability percentages explainedby the validation models are lower than those for calibrationbut the difference is slight (from to 7 - 14 points for RS).The findings for calibration are also found in the validationpopulation in Figure 1 and Table 3; i.e. (a) the models forthe TR surface are higher than the models on the LR surface,(b) the TS models are better than the RS models. The valuesfound for the RPD show that these models which RPD>2may be used for rough screening according to the referencegiven by Williams and Sobering (1993).
3.3 Calibration and full cross-validation – Liquidambar
The radial and tangential shrinkages varied from4.4% to 8.8% and from 10.6% to 16.2% respectively, with astandard deviation of 1.0 and 1.2% (Table 1). Tangentialshrinkage is slightly more variable than radial shrinkage.The coefficient of variation for radial and tangentialshrinkage is 17% and 10%.
The models have a determination coefficient greateror equal to 0.52 (Table 4). The performances of modelsdecrease from LR, LT and TR surfaces according to NIR

Cerne, Lavras, v.16, Suplemento, p. 66-73, jul.2010
69Prediction of radial and tangential shrinkages...
measurement. The r² are systematically higher fortangential shrinkage models.
In spite of the difference of sample number becausethe work began for Liquidambar recently, the results showedthe same tendency. Increasing number of Liquidambarwood samples would confirm results obtained here andallow using NIRS for shrinkage prediction. The modelsdeveloped for the TR section are better than the modelsdeveloped for the LR section (Tables 3 and 4) for bothspecies and for LT surface (for Liquidambar). It is thoughtthat this observation may be explained, firstly by the factthat the width of the LR surface of the sample correspondsto the dimension of the infrared beam (10mm). Operationalerrors in positioning the samples may therefore have addednoise to the experiment measurements. Furthermore, theinfrared beam touches all the anatomical elements directlyon the TR surface while the same elements are measuredby diffuse reflection inside the material in the LR and LTsurfaces.
With respect to the shrinkage properties, the modelsfor TS are systematically better than the RS models both
Table 2 – Results of the PLS calibration and cross-validation on SNV and 2nd Derivate pre-processing spectral data for Teak.
Tabela 2 – Resultados da calibração e validação cruzada de PLS para os espectros tratados por SNV e segunda derivada paraTeca.
NIR surface Shrinkage N Outliers M SD Rank SEC SECV r²
Radial 293 10 3.1 0.68 4 0.35 0.39 0.74 LR
Tangential 293 10 5.5 1.24 4 0.52 0.59 0.83
Radial 293 10 3.1 0.7 5 0.26 0.30 0.86 TR
Tangential 293 12 5.5 1.23 5 0.43 0.48 0.88
N: number of sample. M: mean. SD: standard deviation. SEC: standard error of calibration. SECV: standard error of crossvalidation.
Table 3 – Results of PLS test-validation of shrinkage for Teak.
Tabela 3 – Resultados para teste de validação PLS da retratibilidade para Teca.
NIR surface Shrinkage N Outliers M SD SEP r² RPD
Radial 100 1 3.21 0.65 0.37 0.67 1.8 LR
Tangential 100 3 5.68 1.27 0.60 0.78 2.1
Radial 100 3 3.21 0.65 0.36 0.72 1.8 TR
Tangential 100 4 5.64 1.27 0.52 0.83 2.4
N: number of sample. M: mean. SD: standard deviation. SEP: standard error of prediction. RPD: ratio performance to deviation.
for the two species (Tables 2, 3, and 4). However, for radialshrinkage there is a higher measurement error than fortangential shrinkage, but according to the two species,the coefficient of variation for TS compared to RS is higherfor Teak and lower for Liquidambar. Radial shrinkageclosely depends on anatomic factors above and beyondindividual cell structure and composition. Among them,the major factor that affects shrinkage is the restraint ofradial shrinkage by rays because of the low shrinkagepotential and high stiffness as compared to tissues oflongitudinally aligned cells (BAILLÈRES; DAVRIEUX;HAM-PICHAVANT, 2002). RS is therefore probably moredependent on the cellular organization, which does notinfluence spectra measured by the NIRS technique(HERNANDEZ, 2007). Other explanation is the fact thatthe measurement error for TS (0.9%) is lower than the RSmeasurement error (1.6%). It is also thought that there isan operational effect, the measurements were always takenin the same order: tangential then radial. It is possibletherefore that additional humidity between the twomeasurements may have affected the radial measurements.

70
Cerne, Lavras, v.16, Suplemento, p. 66-73, jul.2010
CHAIX, G. et al.
Figure 1 – Validation results of PLS models: NIR-predicted versus laboratory determined for radial and tangential shrinkage inTectona grandis (A: NIR data from Longitudinal-Radial surface, B: NIR data from Tangential-Radial surface).
Figura 1 – Resultados de validação dos modelos PLS: valores preditos por NIR e determinados em laboratório para retratibilidaderadial e tangencial em Tectona grandis (A: NIR a partir da face longitudinal-radial, B: NIR a partir da face radial-tangencial).
Table 4 – Results of the PLS calibration and cross-validation on SNV and 2nd Derivate pre-processing spectral data for shrinkageof Liquidambar.
Tabela 4 – Resultados da calibração e validação cruzada PLS para os espectros tratados por SNV e segunda derivada pararetratibilidade do âmbar.
N: number of sample. M: mean. SD: standard deviation. SEC: standard error of calibration. SECV: standard error of crossvalidation. RPDcv: ratio performance to deviation.
NIR surface Shrinkage N Outliers M SD Rank SEC SECV r² RPDcv
Radial 35 3 5.4 0.64 3 0.30 0.38 0.67 1.7 LR
Tangential 35 2 12.5 1.30 5 0.22 0.42 0.89 3.1
Radial 35 3 5.4 0.65 4 0.19 0.35 0.71 1.9 TR
Tangential 35 0 12.5 1.30 2 0.57 0.63 0.76 2.1
Radial 35 1 5.4 0.79 3 0.44 0.56 0.52 1.4 LT
Tangential 35 1 12.4 1.20 4 0.28 0.48 0.85 2.5

Cerne, Lavras, v.16, Suplemento, p. 66-73, jul.2010
71Prediction of radial and tangential shrinkages...
Figure 2 – Cross-validation results of PLS models: NIR-predicted versus laboratory values determined for radial and tangentialshrinkage in Liquidambar styraciflua (A: NIR data from Longitudinal-Radial surface, B: NIR data from Tangential-Radial surface,C: NIR data from Longitudinal-Tangential surface).
Figura 2 – Resultados de validação cruzada dos modelos PLS: valores preditos por NIR versus valores determinados emlaboratório para retratibilidade radial e tangencial em Liquidambar styraciflua (A: NIR a partir da face longitudinal-radial, B:NIR a partir da face radial-tangencial, C: NIR a partir da face longitudinal-tangential).
The statistical models obtained by NIRS calibrationdemonstrate highly significant levels of correlation betweenthe predicted values and the reference values. Shrinkageis affected by the extractives (AREVALO FUENTES, 2002;BREMAUD, 2006; CHAFE, 1987; HERNANDEZ, 2007;
TAYLOR, 2008). Because of the relationship of densityand extractive content to wood shrinkage, it is perhapsnot surprising that NIR spectra could also provide goodpredictions of total volumetric shrinkage. In the transversedirection, the cellular organization and cross-sectional

72
Cerne, Lavras, v.16, Suplemento, p. 66-73, jul.2010
CHAIX, G. et al.
shape of the cells play an important role in shrinkage. Butthe anatomy of the material does not however appear toplay a determining role in adsorption.
4 CONCLUSIONThe findings of this study demonstrate the possible
use of NIRS to estimate the dimensional stability of Teakand Liquidambar woods. The precision of the modelsdeveloped is lower than the reference measurement but itsvalue and the rapidity of measurement undisputedly showadvantages for this approach. In accordance with thereference list commonly adopted, the RPD values obtainedafter validation for the best prediction models, whetherfrom ranges of solid woods, are sufficient for screening.
5 ACKNOWLEDGEMENTThe authors thank the Agence Universitaire de la
Francophonie for grants; the UPR39 and UPR40 of CIRAD(France) and URP Forêts and Biodiversité (Madagascar)for providing funds and technical support and FOFIFAand ESSA-Forêts (Madagascar) for technical support.
6 BIBLIOGRAPHICAL REFERENCESAREVALO FUENTES, R. L. Influence des composantessecondaires et de la structure anatomique sur lespropriétés physico-mécaniques du bois d’Acajou(Swietenia macrophylla King). 2002. 145 p. Thesis (Ph.D) -Université Laval, Québec, 2002.
BAILLÈRES, H.; DAVRIEUX, F.; HAM-PICHAVANT, F.Near infrared analysis as a tool for rapid screening of somemajor wood characteristics in a eucalyptus breedingprogramme. Annals of Forest Science, Les Ulis, v. 59, n. 5/6,p. 479-490, July/Oct. 2002.
BHAT, K. M. Properties of fast-grown Teakwood: impact onend-users’ requirements. Journal of Tropical ForestScience, Kuala Lumpur, v. 4, n. 1, p. 1-10, 1998.
BRÉMAUD, I. Diversité des bois utilisés ou utilisables enfacture d’instruments de musique. 2006. 294p. Thesis(Ph.D) - Université Montpellier II, Montpellier, 2006.
CHAFE, C. Collapse, volumetric shrinkage, specific gravityand extractives in Eucalyptus and others species, Part (II): theinfluence of wood extractives. Wood Science andTechnology, New York, v. 21, n. 1, p. 27-41, Dec. 1987.
HEIN, G. P. R.; LIMA, J. L.; CHAIX, G. Robustness ofmodels based on near infrared spectra to predict the basicdensity in Eucalyptus urophylla wood. Journal of NearInfrared Spectroscopy, Sussex, v. 17, n. 3, p. 141-150, 2009.
HERNANDEZ, R. E. Effects of extraneous substances, wooddensity and interlocked grain on fiber saturation point ofhardwoods. Journal of Wood MaterialScience and Engineering, Oxford, v. 2, n. 1, p. 45-53, June 2007.
KELLEY, S. S. et al. Use of near- infrared spectroscopy tomeasure the chemical and mechanical properties of solid wood.Wood Science and Technology, New York, v. 38, n. 4, p.257-276, July 2005.
KOKUTSE, A. D.; BRANCHERIAU, L.; CHAIX, G. Rapidprediction of shrinkages and fibre saturation point on Teak(Tectona grandis) wood based on near-infrared spectroscopy.Annals of Forest Science, Les Ulis, v. 67, n. 4, p. 1-10, Mar.2010.
RAKOTONDRAOELINA, H. A.; RAKOTOVAO, G. Le«Copalme d’Amérique», une belle espèce feuillue àcroissance rapide pour la production de bois d’œuvre.Madagascar : Le Centre National de la Recherche Appiliquê eau Dêveloppement Rural, 2005. (Fiche Technique Fofifa/DRFP, 818).
SANWO, S. K. The characteristics of the crown-formed andstem-formed wood in plantation grown Teak (Tectona grandisL.f) in Nigeria. Journal of the Institute of Wood Science,London, v. 11, n. 2, p. 85-88, 1987.
SIMATUPANG, H. M; YAMAMOTO, K. Properties ofTeakwood (Tectona grandis L.f) and Mahogany (Swieteniamacrophylla King) from manmade forest and influence onutilization. In: PROCEEDING OF SEMINAR ON HIGHVALUE TIMBER FOR PLANTATION ESTABLISHMENT,2000, Tawau. Proceedings…Tawau: Japan InternationalResearch Centre for Agricultural Sciences, 2000. (Report, 16).p. 103-114.
SO, C. L. et al. Near infrared spectroscopy in the forestproducts industry. Forest Products Journal, Madison, v. 54,n. 3, p. 6-16, Mar. 2004.
STAMM, A. J. Review of nine methods for determining thefiber saturation points of wood and wood products. WoodScience, Madison, v. 4, p. 114-128, 1971.

Cerne, Lavras, v.16, Suplemento, p. 66-73, jul.2010
73Prediction of radial and tangential shrinkages...
TAYLOR, A. M. et al. Wood shrinkage prediction using NIRspectroscopy. Wood and Fiber Science, Madison, v. 40, n. 2,p. 301-307, Apr. 2008.
TROKENBRODT, M.; JOSUE, J. Wood properties andutilisation potential of plantation Teak (Tectona grandis) inMalaysia: a critical review. Journal of Tropical ForestScience, Kuala Lumpur, v. 5, n. 1, p. 58-70, 1999.
TSUCHIKAWA, S. A Review of recent near infrared researchfor wood and paper. Applied Spectroscopy Reviews, NewYork, v. 42, n. 1, p. 43-71, Feb. 2007.
WILLIAMS, P. C.; SOBERING, D. C. Comparison ofcommercial near infrared transmittance and reflectanceinstruments for analysis of whole grains and seeds. Journal ofNear Infrared Spectroscopy, Sussex, v. 1, n. 1, p. 25-33, 1993.