Predicting Service Life of in Low Level and Mixed Waste ... GM... · Predicting Service Life of...
40
Predicting Service Life of Geomembranes in Low‐Level and Mixed‐ Waste Disposal Facilities Craig H. Benson, PhD, PE, NAE CRESP/University of Virginia [email protected] Webinar Performance & Risk Assessment Community of Practice 16 May 2016
Transcript of Predicting Service Life of in Low Level and Mixed Waste ... GM... · Predicting Service Life of...

Predicting Service Life of Geomembranes in Low‐Level and Mixed‐
Waste Disposal Facilities
Craig H. Benson, PhD, PE, NAECRESP/University of [email protected]
WebinarPerformance & Risk Assessment Community of Practice
16 May 2016

Professional Development Credit
If you would like 1.5 PDH credits for this webinar, please send an email request to me ([email protected]) with the following:
– Name (as you wish to appear on certificate)– Agency or Organization– Email address
2
Multi‐Component Liner Systems Used in LLW and MW Near Surface Disposal Facilities
3
• Double lining system with two composite liners
• Geomembrane over geosynthetic clay liner (upper)
• Geomembrane over clay liner (lower)
• Double collection system• Upper leachate collection system
• Lower “leak detection zone” with geocomposite drainage layer

Composite Barriers:Geomembranes & Soil Liners
Geomembrane:• Heavy polymer sheet to block flow. 1.5‐2.5 mm thick & often comprised of polyethylene. Generally textured to provide physical stability.
• Nearly impervious, but holes & seam defects inevitable.
4
Gm photo, composite barrier sketch
Deployed

Composite Barriers:Geomembranes & Soil Liners
Soil liner or Geosynthetic Clay Liner (GCL):•Mineral barrier with low hydraulic conductivity. Blocks flow passing through defects in geomembrane.
•GCL is prefabricated clay liner constructed in factory with bentonite clay
5
6‐10mm
Compacted Clay Liner (CCL)
Geosynthetic Clay Liner (GCL)

Example of Composite Lined CellWCS in Andrews, TX
6http://www.wcstexas.com/

Single Composite Liner Leakage Rates Very Low
7
GeomembraneLeachate
Defect
Clay or GCL
•1 L/ha‐d = 0.04 mm/y
•Typical primary liner leakage rates < 10 L/ha‐d, or 0.4 mm/yr

The Challenge – Extreme Service Life
• Regulations require service life > 1000 yr
• Analyze for 10,000 yr or peak.
• How long will geomembranes last?
• 10 yr, 50 yr, 100 yr, 5000 yr???
8
Monument on Final Cover over U tailings in disposal facility in Falls City, TX
Tian, K., Benson, C., and Tinjum, J. (2016), ANTIOXIDANT DEPLETION AND SERVICE LIFE PREDICTION FOR HDPE GEOMEMBRANES EXPOSED TO LOW‐LEVEL RADIOACTIVE WASTE LEACHATE, J. Geotechnical & Geoenvironmental Eng.

CRESP Research on HDPE Geomembranes in LLW & MW Facilities
• Objective 1: predict service life of HDPE geomembranes in LLW and MW disposal facilities based on current leachate composition (current conditions). – today’s webinar
• Objective 2: evaluate if service life affected by higher activity environment associated with higher activity waste acceptance criteria.
9

Composition of HDPE Geomembranes • Polyethylene (96‐98%) • Carbon black (2‐3%) for ultraviolet light stabilization
• Antioxidants (<1%) to inhibit oxidation: hindered phenols, hindered amines, phosphites
10

Oxidation: Primary Chemical Degradation Mechanism
Modified from Grassie & Scott (1985) and Rowe & Sangam (2002)11
RH = polyethylene chain R ● = reactive free radical ROOH ● = hydroperoxideROO ● =hydroperoxy radical
Dashed line represents antioxidant interrupting oxidation reactions by donating or capturing an electron OR reacting with free radicals to form a stable product
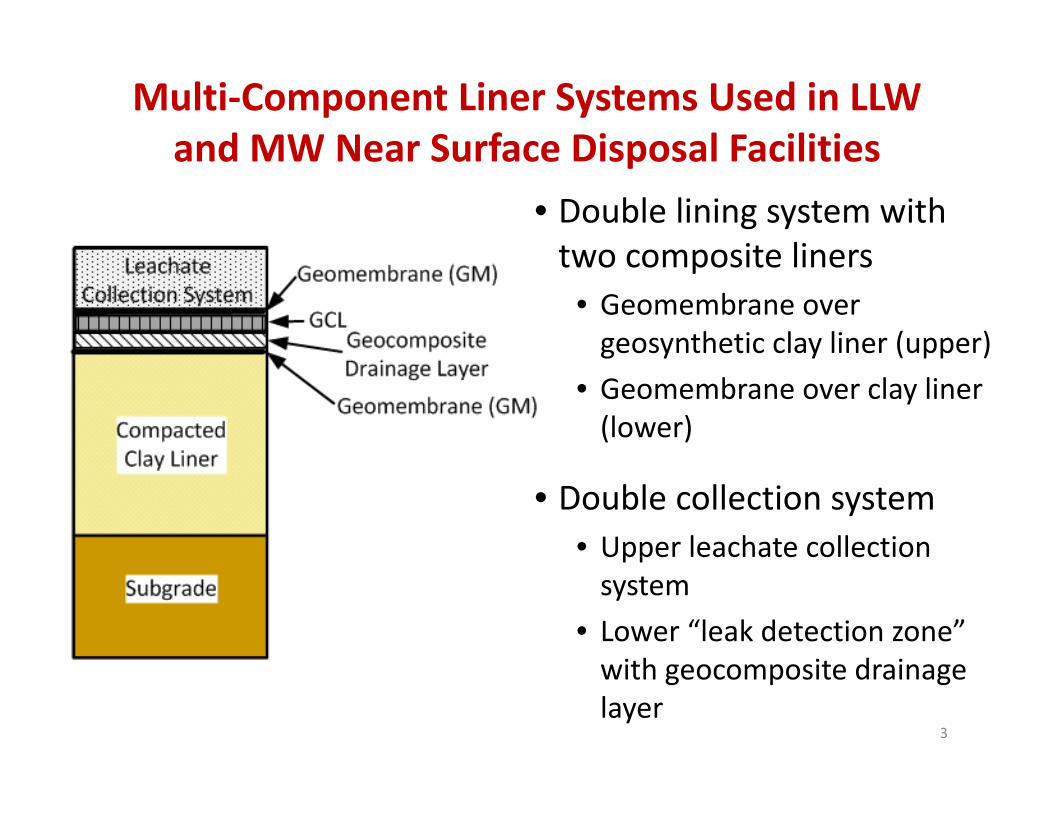
Three Stages of Polyethylene DegradationProp
ertyRe
tained
(%)
100
50
A B C
A = Antioxidant DepletionB = Induction Time C = 50% property degradation time
from Hsuan & Koerner (1998) and Koerner et al. (2011)
Original
Stage C
Photos from Rowe et al. 2009
12
Service Life T = TA + TB + TC
Time
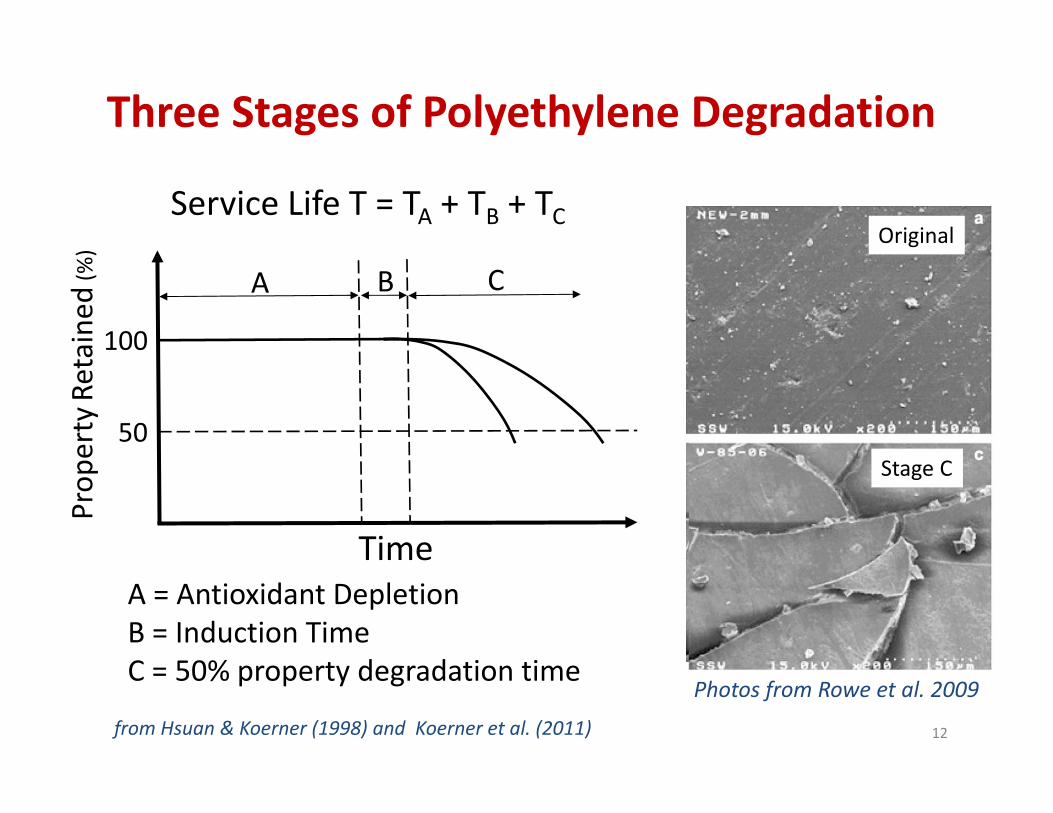
Antioxidants: Function & Depletion• Antioxidants
– stabilize free radicals – react with oxygen– diffuse in water
Antioxidants Oxygen13
Consumption Preventing Oxidation Loss Via Diffusion

Accelerated Testing Using Time‐Temperature Superposition.
• Oxidation reactions are temperature dependent, increasing rate at higher temperature.
• Conduct tests over range of temperatures, understand how rate varies with temperature.
• Use theory (Arrhenius model) to predict rate (s) for field conditions.
14
aE /(RT)s AeEa is the activation energy, R is the universal gas constant, T is absolute temperature (oK), and where A is a constant.

Stage A:Antioxidant Depletion Experiments
• Geomembranes contacted with synthetic LLW leachate at 25, 50, 70, and 90 °C.
• Immersion tests (two side exposure) & column tests (one side exposure) at elevated temperatures.
• Measure antioxidant depletion using oxidation induction time (OIT) using differential scanning calorimetry (DSC).
• Predict antioxidant depletion time using Arrhenius model.
• Evaluate physical properties: molecular weight, melt flow index, crystallinity. Consistent with Stage A?
15

Immersion Tests in Synthetic LLW Leachate• RSL, NSL, & DI water at 25, 50, 70, and 90 °C
• Samples removed monthly • OIT tests conducted to monitor antioxidant depletion.
16
RSL = radioactive synthetic LLW leachateNSL = non‐radioactive synthetic LLW leachate

Measuring Antioxidant Depletion• Standard oxidative induction time (OIT) Test (ASTM 3895) by Differential Scanning Calorimetry (DSC)
2cm
17

Data Sources for Leachate • ERDF, OSDF, ICDF, and EMWMF disposal facilities
• Segregated components into:– Inorganic macro‐components ‐major cations (Ca, Mg, Na, and K) and major anions (Cl, SO4
2‐, HCO3‐,
and NO3‐/NO2
‐) – Trace heavy metals, such as Al, As, Ba, Cu, Fe, Li, Mn, Ni, Sr, and Zn
– Radionuclides: e.g., uranium, Tc‐99, Sr‐90, and H‐3 – Organic compounds (Mean ~ 8 mg/L)
18

pH of LLW leachate
19
4
5
6
7
8
9
10
OSDF ERDF EWMWF ICDF All
pH
4
5
6
7
8
9
10
0 2 4 6 8 10 12
OSDFERDFEWMWFICDF
pH
Time (year)

Eh of LLW leachate
20
-400
-200
0
200
400
600
OSDF ERDF EMWMF ICDF All LLW
Eh
(mV
)
-400
-200
0
200
400
600
0 1 2 3 4 5 6 7 8
OSDFERDFEMWMFICDF
Eh
(mV)
Time (yr)

Major Cations: Calcium
21
10-2
10-1
100
101
102
103
OSDF ERDF EMWMF ICDF All LLW
Con
cent
ratio
n of
Ca
(mm
ol/L
)
10-2
10-1
100
101
102
103
0 2 4 6 8 10 12
OSDFERDFEMWMFICDF
Con
cent
ratio
n of
Ca
(mm
ol/L
)
Time (yr)

Major Anions: Sulfate
22
10-2
10-1
100
101
102
103
OSDF ERDF EMWMF ICDF ALL LLW
Con
cent
ratio
n of
Sul
fate
(mm
ol/L
)
10-2
10-1
100
101
102
103
0 2 4 6 8 10 12
OSDFERDFEMWMFICDF
Time (yr)
Con
cent
ratio
n of
Sul
fate
(mm
ol/L
)

Trace Metal: Copper
23
10-3
10-2
10-1
100
101
0 2 4 6 8 10 12
OSDFERDFEMWMFICDF
Time (yr)
Con
cent
ratio
n of
Cop
per (
µmol
/L)
10-3
10-2
10-1
100
OSDF ERDF EMWMF ICDF All LLW
Con
cent
ratio
n of
Cop
per (
µmol
/L/L
)

Radionuclides: Uranium
24
100
101
102
103
104
OSDF ERDF EMWMF ICDF All
Con
cent
ratio
n of
Ura
nium
(µg/
L)
100
101
102
103
104
0 2 4 6 8 10 12
OSDFERDFEMWMFICDF
Con
cent
ratio
n of
Ura
nium
( µg
/L)
Time (yr)

Radionuclides: Tc‐99
25
10-1
100
101
102
0 2 4 6 8 10 12
OSDFERDFEMWMFICDF
Con
cent
ratio
n of
Tec
hnet
ium
-99
(Bq/
L)
Time (yr)
10-1
100
101
102
OSDF ERDF EMWMF ICDF All LLW
Con
cent
ratio
n of
Tec
hnet
ium
-99
(Bq/
L)

Synthetic Leachate for Immersion Test
Major Cations/Anions (mM) Trace Metals (mM)Ca2+ 4 As 0.001 Al 0.03Mg2+ 6 Ba 0.002 Mn 0.01Na+ 7 Cu 0.0002 Ni 0.0003K+ 0.7 Fe 0.04 Sr 0.02
Sulfate 7.5 Li 0.02 Zn 0.0005Chloride 8 Chemical CharacteristicsNitrate 1.5 TOC (mg/L) 8Alkalinity 3.5 Eh (mv) 120
Radionuclides pH 7.2U‐238 (µg/L) 1500 Ionic Strength (mM) 43.6H‐3 (Bq/L) 4400 Ratio of monovalent to
divalent cations (M1/2)(Kolstad et al. 2004)
0.077Tc‐99 (Bq/L) 29
1) Radioactive Synthetic Leachate (RSL)2) Non‐radioactive Synthetic Leachate (NSL)3) Deionized Water (control)
26
27
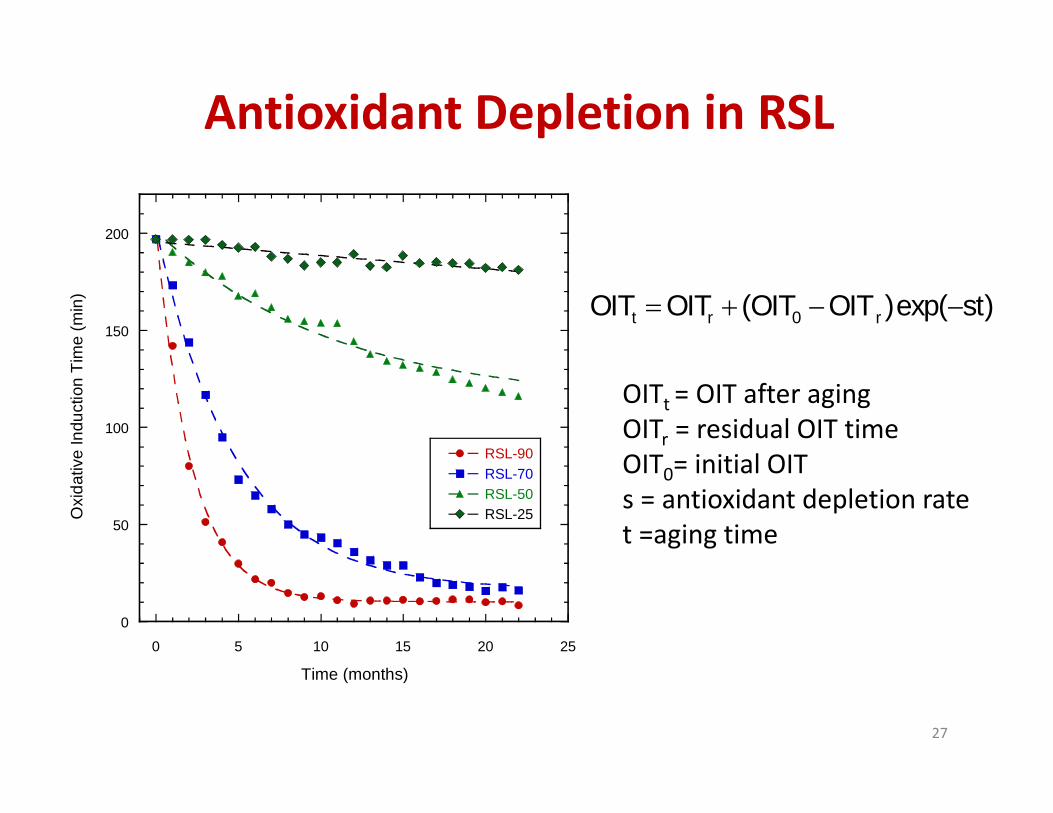
Antioxidant Depletion in RSL
OITt = OIT after agingOITr = residual OIT timeOIT0= initial OIT s = antioxidant depletion rate t =aging time
t r 0 rOIT OIT (OIT OIT )exp( st)
0
50
100
150
200
0 5 10 15 20 25
RSL-90RSL-70RSL-50RSL-25O
xida
tive
Indu
ctio
n Ti
me
(min
)
Time (months)
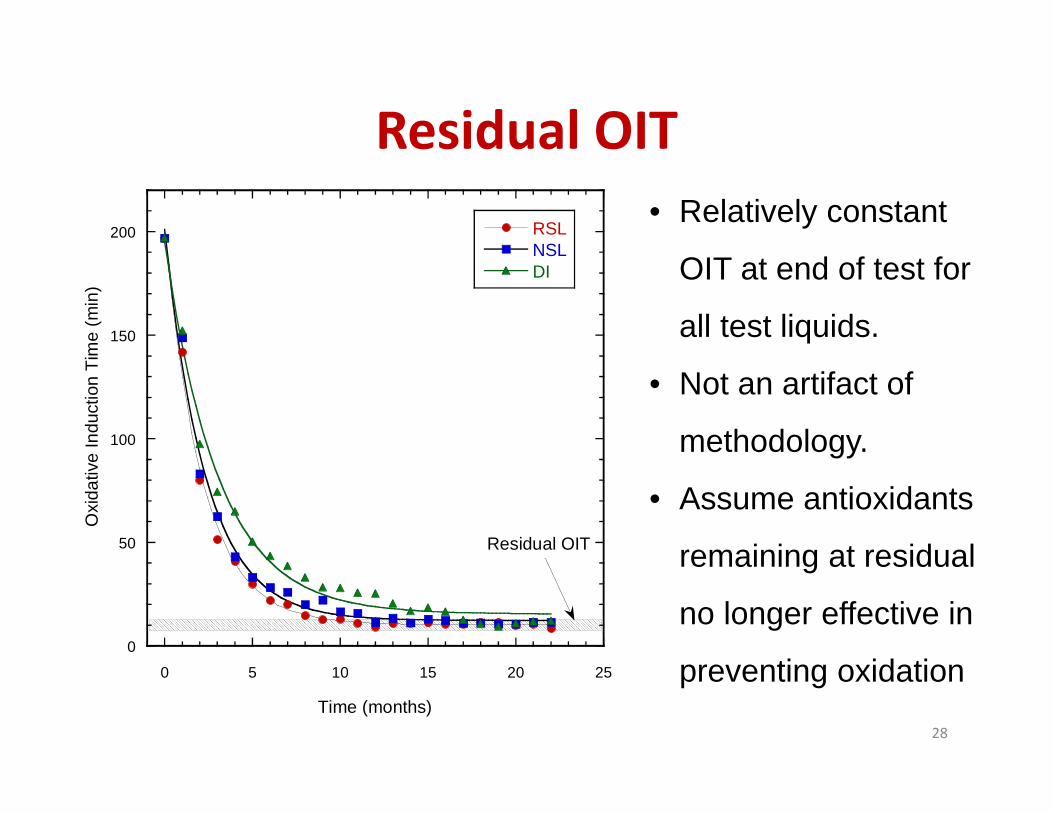
Residual OIT
28
• Relatively constant
OIT at end of test for
all test liquids.
• Not an artifact of
methodology.
• Assume antioxidants
remaining at residual
no longer effective in
preventing oxidation 0
50
100
150
200
0 5 10 15 20 25
RSLNSLDI
Oxi
dativ
e In
duct
ion
Tim
e (m
in)
Time (months)
Residual OIT

Effect of Radionuclides in Leachate
Effect of radiation from RSL on antioxidant depletion subtle, not statistically significant.
Rate slower than for municipal solid waste (MSW) leachate because little surfactants in LLW and MW leachates.
29
Temp(oC)
Antioxidant Depletion Rate, sln(min)/month
Ratio
NSL RSL RSL/NSL25 0.0043 0.0047 1.0950 0.0278 0.0277 1.0070 0.1789 0.1862 1.0490 0.4319 0.4569 1.06
-7.0
-5.6
-4.2
-2.8
-1.4
0.0
0.0026 0.0028 0.0030 0.0032 0.0034 0.0036
RSLNSL
ln(s
)
1/T (1/K)
s in unit: month-1

Physical Properties: Melt Flow Index
30
•Oxidation breaks down polymer chains, making polymer less viscous under a standard heat and pressure.
•No change in MFI until after residual OIT reached. Consistent with no oxidation.
•Drop after 14 months indicates Stage C, oxidative degradation
0.04
0.05
0.06
0.07
0.08
0.09
0.10
0.11
0.12
0 5 10 15 20 25
RSLNSL
Mel
t flo
w in
dex
(g/1
0 m
in)
Time (months)
Solid line: mean of unexposed HDPE GMDashed line: one/two standard deviation from the mean
OIT at residual
Stage C
Similar findings for crystallinity and tensile strength. Stages B and C
occurring after residual OIT reached.

Recap – Lessons Learned• Antioxidant depletion first order and sensitive to temperature (as expected).
• Reaching residual OIT indicates end of Stage A• Physical properties (melt flow index, crystallinity, tensile strength) consistent with Stages B and C occurring after residual OIT reached.
• Similar rates in RSL and NSL liquids – slightly more with radionuclides but not statistically significant.
31

Predicting Field Conditions: Arrhenius Model
aE /(RT)s AeEa = activation energyR = universal gas constantT = absolute temperature (oK)A = constant
Immersion Liquid Arrhenius Equation Activation Energy (Ea) (kJ/mol)ln(s) = ln(A) − (Ea/R) / T R2
RSL ln(s) = 20.043 − 7879 / T 0.99 65.4NSL ln(s) = 20.193 − 7922 / T 0.99 65.8DI ln(s) = 22.203 − 8383 / T 0.99 69.7
-7.0
-5.6
-4.2
-2.8
-1.4
0.0
0.0026 0.0028 0.0030 0.0032 0.0034 0.0036
RSLNSLDI
ln(s
)
1/T (1/K)
(b) s in unit: month-1
Use equation with parameters below to predict rate (s) at any temperature.

Scaling Two‐Side Immersion Test to One‐Sided Field Scenario
• One side exposed to represent field condition
• RSL or NSL over geomembrane at base.
• Lower surface of geomembrane not in contact with leachate.
33

Impact of Single‐Sided Exposure
34
Antioxidant depletion rate obtained from two‐sided immersion tests 3.5 times higher than from one‐sided test
0
50
100
150
200
0 5 10 15 20 25
Immersion-90One-Sided-90
Oxi
dativ
e In
duct
ion
Tim
e (m
in)
Time (month)
OITt= 11+186*e^(-0.4569*t)
OITt=11+186*e^(-0.1342*t)
HDPE GM in RSL, 90 °C(a)
0
50
100
150
200
0 5 10 15 20 25
Immersion -70One-Sided-70
Oxi
dativ
e In
duct
ion
Tim
e (m
in)
Time (months)
OITt=11+186*e^(-0.1862*t)
OITt=11+186*e^(-0.0542*t)
HDPE GM in RSL, 70 °C(b)

Predicting Duration of Stage A –Antioxidant Depletion
35
0
500
1000
1500
2000
0 10 20 30 40 50 60 70
RSL (Immersion test)NSL (Immersion test)DI (Immersion test)RSL (One-Sided)
Sta
ge I-
Ant
ioxi
dant
Dep
letio
n Ti
me
(yr)
Liner Temperature (°C)
•Use Arrhenius parameters.
•Account for single‐side exposure using 3.5x.
• Scale to liner temperature of 15 oC.
• Stage A completed in 730 yr. No deterioration in engineering properties at this time.

Predicting Service Life: Stages B and C
• Use Stage C data from large‐scale “landfill simulator” experiments by Rowe et al. (2009) using municipal solid waste leachates.
• Conservative, as MSW leachates more aggressive in degrading geomembranes.
36
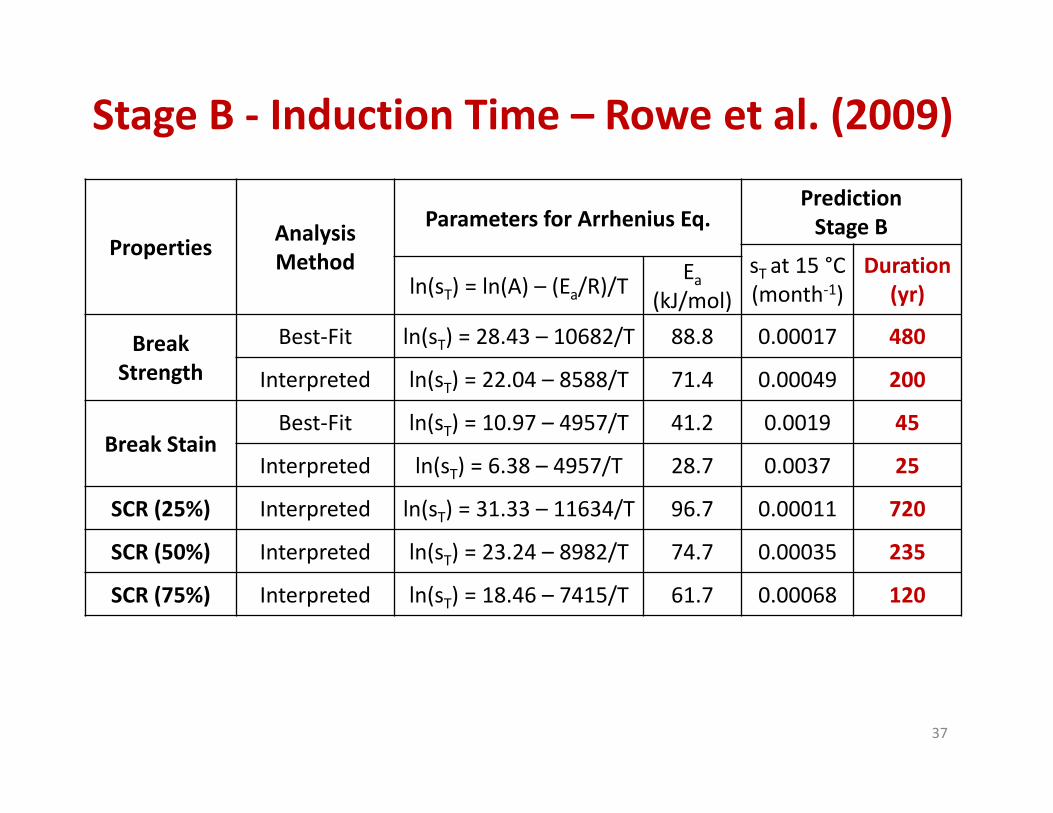
Stage B ‐ Induction Time – Rowe et al. (2009)
37
Properties Analysis Method
Parameters for Arrhenius Eq.PredictionStage B
sT at 15 °C(month‐1)
Duration (yr)ln(sT) = ln(A) – (Ea/R)/T
Ea (kJ/mol)
Break Strength
Best‐Fit ln(sT) = 28.43 – 10682/T 88.8 0.00017 480
Interpreted ln(sT) = 22.04 – 8588/T 71.4 0.00049 200
Break StainBest‐Fit ln(sT) = 10.97 – 4957/T 41.2 0.0019 45
Interpreted ln(sT) = 6.38 – 4957/T 28.7 0.0037 25
SCR (25%) Interpreted ln(sT) = 31.33 – 11634/T 96.7 0.00011 720
SCR (50%) Interpreted ln(sT) = 23.24 – 8982/T 74.7 0.00035 235
SCR (75%) Interpreted ln(sT) = 18.46 – 7415/T 61.7 0.00068 120

Stage C‐ 50% Property Degradation Time
38
Properties Temp.(°C)
Analysis Method
Prediction for Stage C
sT=85/sT=15Duration (yr) at
15 °C
Break Strength 85Best‐Fit 689.5 2880
Interpreted 689.5 2585
Break Stain 85Best‐Fit 689.5 1995
Interpreted 689.5 1495SCR (25%) 85 Interpreted 689.5 1400SCR (50%) 85 Interpreted 689.5 1220SCR (75%) 85 Interpreted 689.5 1045

Total Service Life (A + B + C)
39
DeterminationCriteria
Service Life(yr)
Based on break strength 3000−3575
Based on break strain 1735−2255
Stress Crack Resistance 1380−2335

Summary of Findings• Geomembranes undergo similar first‐order degradation in LLW‐MW leachate as observed in MSW leachate, but slower due to lack of surfactants. Radiation impact minimal for current waste streams.
• No degradation of engineering properties during Stage A, consistent with absence of oxidation.
• Stage A at least 730 yr for LLW and MW environments.
• Use rate data for Stages B and C from large‐scale experiments with MSW leachate (conservative). Predict 1400 yr as shortest service life.
40