Predicting Pattern Tooling and Casting Dimensions for - OSTI
70
Industrial Materials for the Future Managed by UT-Battelle, LLC Final Technical Report Predicting Pattern Tooling and Casting Dimensions for Investment Casting, Phase III December 2007 Principal Investigators: Nick Cannell Edison Materials Technology Center Adrian S. Sabau Oak Ridge National Laboratory ORNL/TM-2007/204
Transcript of Predicting Pattern Tooling and Casting Dimensions for - OSTI
Industrial Materials for the Future
Managed by UT-Battelle, LLC
Final Technical Report Predicting Pattern Tooling and Casting Dimensions for Investment Casting, Phase III December 2007 Principal Investigators:
Nick Cannell Edison Materials Technology Center Adrian S. Sabau Oak Ridge National Laboratory
ORNL/TM-2007/204
DOCUMENT AVAILABILITY
Reports produced after January 1, 1996, are generally available free via the U.S. Department of Energy (DOE) Information Bridge.
Web site http://www.osti.gov/bridge
Reports produced before January 1, 1996, may be purchased by members of the public from the following source.
National Technical Information Service 5285 Port Royal Road Springfield, VA 22161 Telephone 703-605-6000 (1-800-553-6847) TDD 703-487-4639 Fax 703-605-6900 E-mail [email protected] Web site http://www.ntis.gov/support/ordernowabout.htm
Reports are available to DOE employees, DOE contractors, Energy Technology Data Exchange (ETDE) representatives, and International Nuclear Information System (INIS) representatives from the following source.
Office of Scientific and Technical Information P.O. Box 62 Oak Ridge, TN 37831 Telephone 865-576-8401 Fax 865-576-5728 E-mail [email protected] Web site http://www.osti.gov/contact.html
FINAL TECHNICAL REPORT
Project Title: Predicting Pattern Tooling and Casting Dimensions for Investment Casting, Phase III
DOE Award Number: DE-FC36-04GO14230
Project Period: June 1, 2004–September 30, 2007
PI(s): Nick Cannell (EMTEC) (216) 408-7706 [email protected]
Adrian S. Sabau (ORNL) (865) 241-5145 [email protected]
Recipient Organization: Edison Materials Technology Center (EMTEC)
3155 Research Blvd. Kettering, OH 45420
National Laboratory: Oak Ridge National Laboratory Project Team:
Contact Company Bill Schrey Schrey & Sons Mold Bob Dzugan Buycastings.com Bob Horton Precision Metalsmiths, Inc. James A. Oti J & J, a DePuy Company Jerry Donohue Precision Colloids, LLC Jerry Kovatch Precision Metalsmiths, Inc. Jerry Snow Minco, Inc. Jim Gardner JEM Mfg. Nip Singh S & A Consulting Group, LLP Timothy Wolff Argueso & Co. Mike Payne Precision Castings, Inc. Nick Cannell EMTEC

ORNL/TM-2007/204
Predicting Pattern Tooling and Casting Dimensions for Investment Casting, Phase III
Nick Cannell Edison Materials Technology Center
Adrian S. Sabau
Oak Ridge National Laboratory
October 2007
Prepared by OAK RIDGE NATIONAL LABORATORY
P.O. Box 2008 Oak Ridge, Tennessee 37831-6283
managed by UT-Battelle, LLC
for the U.S. DEPARTMENT OF ENERGY
under contract DE-AC05-00OR22725
ii
Acknowledgments and Disclaimer Acknowledgments This report is based upon work supported by the U.S. Department of Energy, Energy Efficiency and Renewable Energy, Industries of the Future - Metal casting, under Award No. DE-FC36-04GO14230. We would like to thank Srinath Viswanathan of ORNL, who initiated phase I of the project, M. Argueso & Co., Inc., for providing the wax for this study; T. Wolf, P. A. Silverstein, W. R. Fricker, and I. Al-Rabadi of Argueso for assistance with the wax injection experiments; M. Radovic and R.M. Trejo of ORNL, for conducting rheometry measurements on filled waxes at HTML/ORNL, and W.D. Porter of ORNL for conducting high temperature dilatometry measurements for 17-4PH alloy. Thanks also go to J. Snow, D. Scott, and B. Sneider of Minco, Inc., for shell investment and for embedding thermocouples within the shell; E. Hatfield for casting assistance; Z. Wu, a University of Tennessee graduate student, for obtaining the shrinkage factors from measured dimensions; J. Kovatch and R. Abramczyk of Precision Metalsmiths, Inc. (PMI), for conducting casting experiments; Allen Bransford and Mike Payne, Precision Castings of Tennessee, Inc., for providing access to their foundry; B. Schrey, of Schrey & Sons Mold Co., for providing the sprue tooling; and Jim Gardner, J.E.M. Manufacturing, for casting design, providing wax patterns for the sprue, designing and coordinating the fabrication of a test bar, and coordinating wax injection, shell making, and casting at PCC, Inc., Viking Metalgraphics, Inc., and SeaCast, Inc; Schrey & Sons, Inc and McCaughin, Inc. for providing the test bar wax patterns, Remet, Inc. for providing waxes, and Dr. G. M. Rowe of Abatech, Inc. for conducting DMA experiments and determining the discrete relaxation spectra for the torsion DMA data set, H. Lobo and T. Bethard of Datapoint Labs, Inc., for conducting DSC and thermal conductivity measurements. Disclaimer This report was prepared as an account of work sponsored by an agency of the United States Government. Neither the United States Government nor any agency thereof, nor any of their employees, makes any warranty, express or implied, or assumes any legal liability or responsibility for the accuracy, completeness, or usefulness of any information, apparatus, product, or process disclosed, or represents that its use would not infringe privately owned rights. Reference herein to any specific commercial product, process, or service by trade name, trademark, manufacturer, or otherwise, does not necessarily constitute or imply its endorsement, recommendation, or favoring by the United States Government or any agency thereof. The views and opinions of authors expressed herein do not necessarily state or reflect those of the United States Government or any agency thereof.
iii
Contents List of Figures ................................................................................................................................... v List of Tables ..................................................................................................................................... vii Abbreviations, Acronyms, and Symbols ......................................................................................... viii 1. Executive Summary ............................................................................................................................. 1
1.1 Project Goal ............................................................................................................................. 1 1.2 Summary of Project Achievements ....................................................................................... 2
Phase I...................................................................................................................................... 2 Phase II .................................................................................................................................... 2 Phase III: Current Project ....................................................................................................... 3
1.3 Technology Transfer............................................................................................................... 3 1.4 Recommendations................................................................................................................... 4
2. Introduction .......................................................................................................................................... 6 3. Background .......................................................................................................................................... 7
3.1 Project Approach..................................................................................................................... 7 3.2 Review of Computer Models for Wax, Shell, and Alloy Deformation ............................... 7 3.3 Task Breakdown...................................................................................................................... 8
4. Results and Discussion ........................................................................................................................ 9
4.1 Shell Mold Properties ............................................................................................................. 9 4.1.1 Material Property Data for Shell Molds ....................................................................... 9 4.1.2 Material Property Data for Fused-silica Shell Molds ................................................. 12
4.2 Alloy Properties and Mechanical Interaction for the Shell-Alloy System .......................... 13 4.2.1 Thermophysical Material Property for 17-4PH steel.................................................. 13 4.2.2 Thermomechanical Material Property for 17-4PH steel ............................................ 15 4.2.3 Experimental Results for Alloy Shrinkage Factors .................................................... 18 4.2.4 Numerical Simulation Results for Casting Dimensions............................................. 21
4.3 Measurements of Material Properties for Filled Waxes ....................................................... 28 4.3.1 Thermophysical Properties of Waxes.......................................................................... 28 4.3.2 Measurement techniques for thermomechanical properties of waxes....................... 29 4.3.3 Viscoelastic property data of filled waxes .................................................................. 31
5. Accomplishments................................................................................................................................. 35
5.1 Shell Mold ............................................................................................................................... 35 5.2 Alloy Shrinkage Factors ......................................................................................................... 35 5.3 Wax Properties ........................................................................................................................ 35 5.4 Technology Transfer............................................................................................................... 36 5.5 Publications and Patents Resulting from Project .................................................................. 36
6. Conclusions .......................................................................................................................................... 37 7. Recommendations................................................................................................................................ 39
7.1 Shell ......................................................................................................................................... 39 7.2 Alloy ........................................................................................................................................ 39 7.3 Wax .......................................................................................................................................... 39

iv
7.4 Technology Transfer............................................................................................................... 39 8. References ............................................................................................................................................ 40 Appendices A. Thermo-mechanical Models of Alloys ....................................................................................... 43 B. Constitutive Equations for Modeling Wax Deformation........................................................... 44 C. DMA data from measurements conducted at HTML/ORNL.................................................... 46 D. Energy Savings............................................................................................................................. 55
v
List of Figures
1.1 Sketches of the investment casting process ............................................................................... 1 1.2 Dimensions in the investment casting process ............................................................................ 2 1.3 Flow chart illustrating the steps necessary for obtaining the dimensions and
ensuing shrinkage factors based on computer models ............................................................... 2 4.1 Measured linear thermal expansion for: (a) 17-4PH alloy and (b) shell mold .......................... 12 4.2 Thermophysical properties for 17-4PH alloy, (a) specific heat, (b) thermal conductivity, and (c)
fraction solid, (d) density. Density was obtained from thermal expansion data on heating. .... 14 4.3 Measured linear thermal expansion for 17-4PH alloy on heating and cooling.......................... 15 4.4 Modulus of elasticity for 17-4PH alloy (Experimental data from Rack, 1981) (a) over large
temperature domain, (b) at high temperature............................................................................... 16 4.5 Wax pattern dimensions [cm] and step index .............................................................................. 19 4.6 Pictures showing shell molds invested at Minco and cast at PMI: (a) wax pattern; (b) shell
mold; (c) steel casting.................................................................................................................... 19 4.7 Position of coordinate measurement points for (a) the width dimensions and
(b) length L2–5, between ends of Steps 2 and 5 .......................................................................... 20 4.8 Alloy shrinkage factors for the (a) width dimension and (b) length dimension, L2-5.............. 21 4.9 Casting configuration for numerical simulations......................................................................... 21 4.10 Evolution of the calculated solid fraction and temperature in the center of the steps ............... 22 4.11 Evolution of the calculated shrinkage the L5_2 dimension at the centerline for the (a) no-hole
pattern, (b) two-hole pattern.......................................................................................................... 23 4.12 Evolution of the shrinkage the width dimension at the center of steps ...................................... 24 4.13 Comparison between the experimental results and computed results for the length dimension,
L5_2: (a) part with no-holes and (b) part with two-holes ........................................................... 25 4.14 Comparison between experimental and computed shrinkage factors for the width dimension
along the length: (a) part with no-holes and (b) part with two-holes. ........................................ 25 4.15 Temperature profile and part shape at 4,080 s ............................................................................. 26 4.16 Equivalent plastic strain at 5,400s for the no-hole casting when thermal expansion used was
that measured on (a) heating and (b) cooling............................................................................... 26 4.17 Equivalent plastic strain at 5,400s for the two-hole casting when thermal expansion used was
that measured on (a) heating and (b) cooling............................................................................... 27 4.18 Density for CeritaTM F20-6 wax (a), specific heat (a) and thermal conductivity (b) for one
unfilled wax, CeritaTM 29-51 wax, and three filled waxes. ......................................................... 29 4.19 DMA experimental results for the (a) storage and (b) loss shear modulus (torsion) ................ 32 4.20 DMA experimental results for the (a) storage and (b) loss Youngs modulus (3-pt bending)... 33 4.21 Master curves for the storage (G’) and loss moduli (G”) obtained at the reference temperature
of 40oC from experimental data on (a) torsion and (b) 3-point bending.................................... 33 4.22 Linearized Arrhenius shift factor experimental data at Tref = 40oC on (a) torsion and (b) 3-point
bending, CeritaTM F20-6 wax ........................................................................................................ 34 A.1 True-strain true-stress data at temperatures of (a) 950 and (b) 1250 oC .................................... 43 A.2 True-strain true-stress data at a strain rate of 0.001 s-1 as a function of temperature used to
estimate the yield stress ................................................................................................................. 43

vi
vii
List of Tables
3.1 Proposed and actual budget........................................................................................................... 8 4.1 Shell systems used. The prime coat was zircon ........................................................................... 9 4.2 Thermophysical properties available from suppliers and property needed for numerical
simulations ..................................................................................................................................... 9 4.3 Thermo-mechanical properties available from suppliers and property needed for numerical
simulations ..................................................................................................................................... 10 4.4 Thermophysical properties reported in the literature for the investment casting shell molds .. 11 4.5 Heat transfer coefficients at metal-mold interface....................................................................... 11 4.6 Mechanical properties reported in the literature for alumino-silicates....................................... 11 4.7 References for Measured Data on Material Property .................................................................. 14 4.8 Thermo-mechanical properties available for 17-4PH or 15-5PH stainless steels ..................... 16 4.9 Yield stress as a function of temperature ..................................................................................... 17 4.10 Mechanical properties for other steels than 17-4PH ................................................................... 18 4.11 Index of wax patterns and castings............................................................................................... 20 4.12 Properties for the F20-6 wax provided by the wax supplier ....................................................... 28 4.13 Dimensional data ........................................................................................................................... 29 4.14 Operating parameters..................................................................................................................... 29 4.15 ASTM Standard for the DMA ...................................................................................................... 30 4.16 Tests used for determining wax properties .................................................................................. 31 4.17 Tests and fixtures recommended for investment casting waxes................................................. 31 B.1 Relaxation times, !i , and relaxation strengths,gi , determined from
experimental measurements by nonlinear regression analysis ................................................... 44 C.1 DMA results for Cerita F20-6 wax ............................................................................................... 46 C.2 DMA results for Remet PC-15 wax (former RR-15) .................................................................. 49 C.3 DMA results for Cerita F20-844B wax ........................................................................................ 52 D.1 Comparison of energy used and energy saved for existing versus new technology ................. 56
viii
Abbreviations, Acronyms, and Symbols ABAQUS computer simulation program 17-4PH steel AFS American Foundry Society as alloy shrinkage cs casting shrinkage C1, C2 thermocouples embedded in the shell cavity CMM coordinate measurement machine DSC differential scanning calorimeter DTA differential thermal analysis EMTEC Edison Materials Technology Center HTC heat transfer coefficient, W/m2K ICI Investment Casting Institute k thermal conductivity L2-5, L25 length between steps 2 and 5 ORNL Oak Ridge National Laboratory PCT Precision Casting of Tennessee, Inc. ProCAST casting simulation software PMI Precision Metalsmiths, Inc. T temperature, units indicated in graphs or tables ws wax shrinkage

ix

1
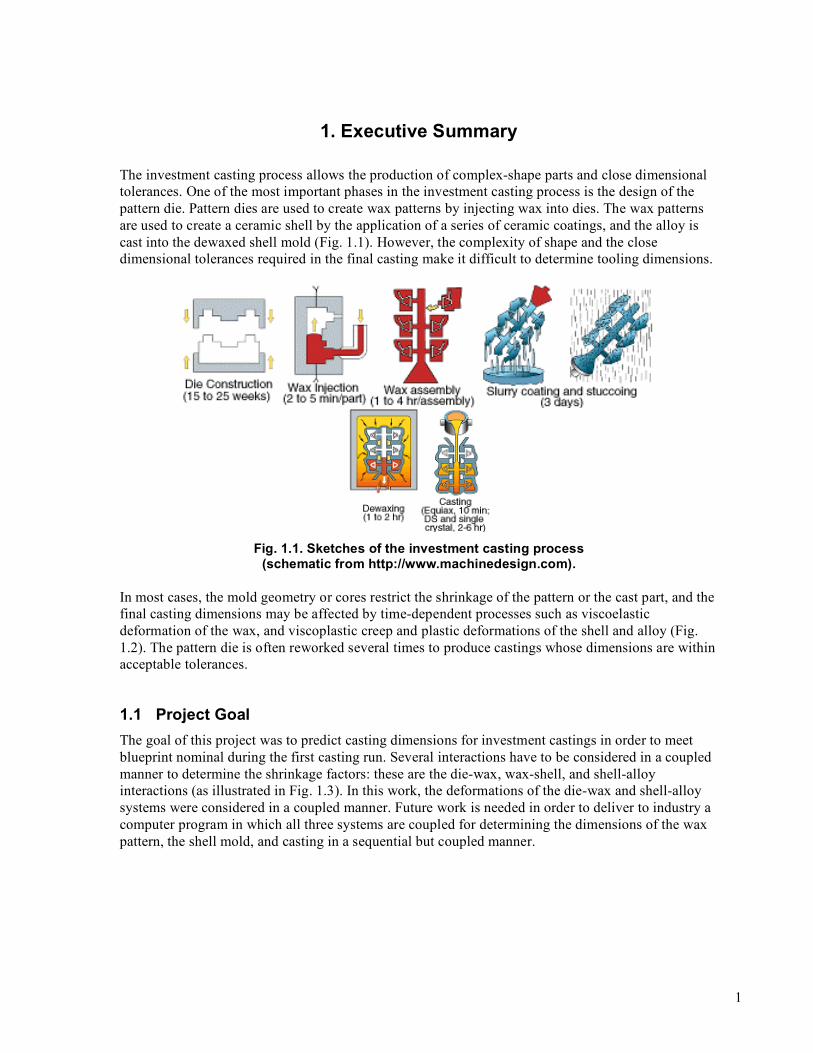
1. Executive Summary The investment casting process allows the production of complex-shape parts and close dimensional tolerances. One of the most important phases in the investment casting process is the design of the pattern die. Pattern dies are used to create wax patterns by injecting wax into dies. The wax patterns are used to create a ceramic shell by the application of a series of ceramic coatings, and the alloy is cast into the dewaxed shell mold (Fig. 1.1). However, the complexity of shape and the close dimensional tolerances required in the final casting make it difficult to determine tooling dimensions.
Fig. 1.1. Sketches of the investment casting process
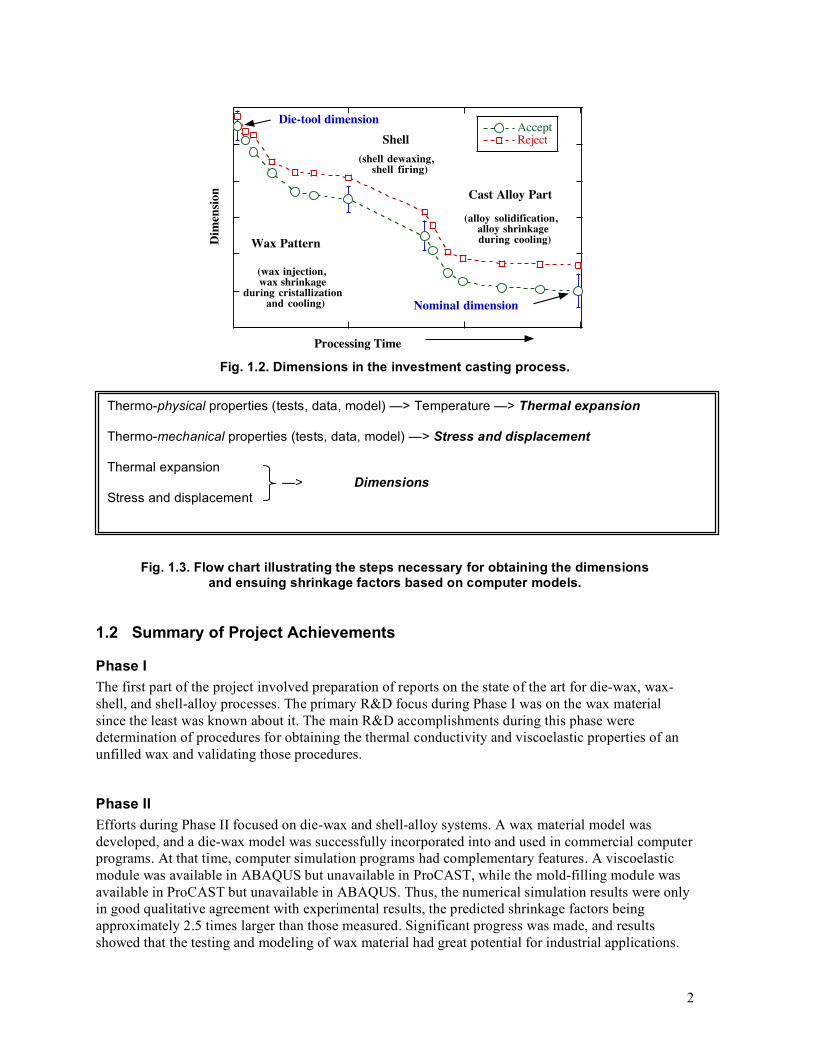
(schematic from http://www.machinedesign.com). In most cases, the mold geometry or cores restrict the shrinkage of the pattern or the cast part, and the final casting dimensions may be affected by time-dependent processes such as viscoelastic deformation of the wax, and viscoplastic creep and plastic deformations of the shell and alloy (Fig. 1.2). The pattern die is often reworked several times to produce castings whose dimensions are within acceptable tolerances.
1.1 Project Goal The goal of this project was to predict casting dimensions for investment castings in order to meet blueprint nominal during the first casting run. Several interactions have to be considered in a coupled manner to determine the shrinkage factors: these are the die-wax, wax-shell, and shell-alloy interactions (as illustrated in Fig. 1.3). In this work, the deformations of the die-wax and shell-alloy systems were considered in a coupled manner. Future work is needed in order to deliver to industry a computer program in which all three systems are coupled for determining the dimensions of the wax pattern, the shell mold, and casting in a sequential but coupled manner.
2
AcceptReject
Dim
ensi
on
Processing Time
Wax Pattern
(wax injection, wax shrinkage
during cristallization and cooling)
Cast Alloy Part
(alloy solidification, alloy shrinkage during cooling)
Shell
(shell dewaxing, shell firing)
Nominal dimension
Die-tool dimension
Fig. 1.2. Dimensions in the investment casting process.
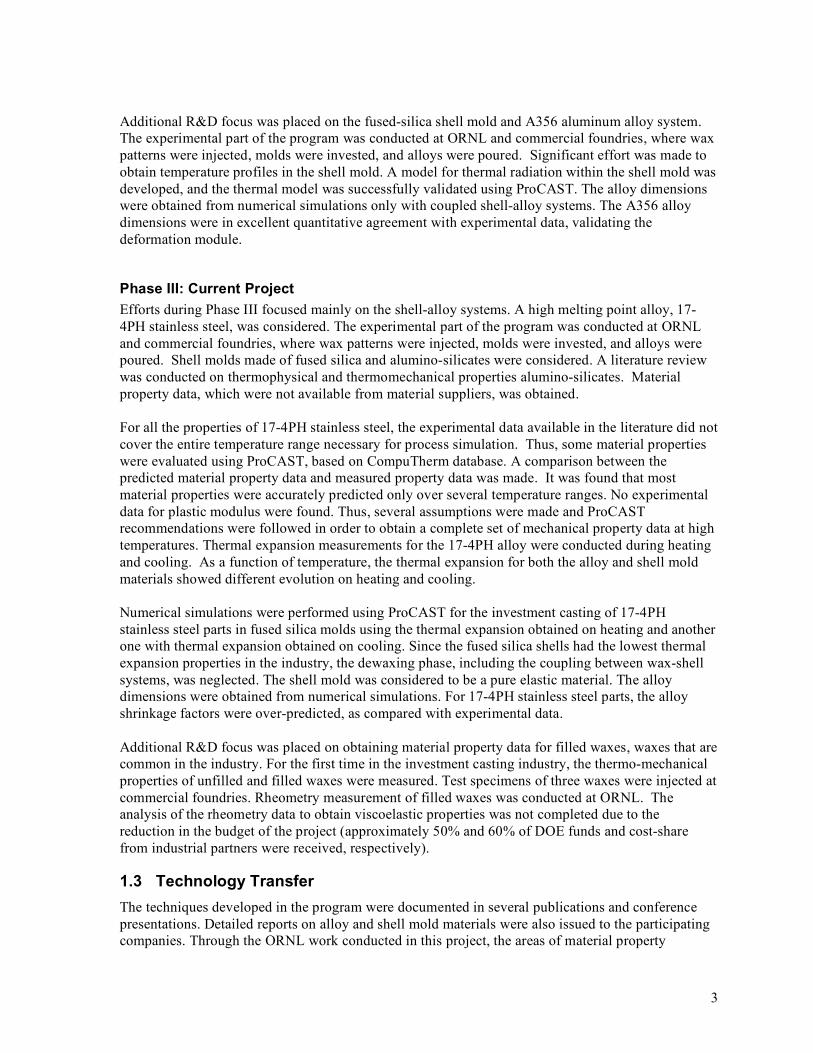
Fig. 1.3. Flow chart illustrating the steps necessary for obtaining the dimensions and ensuing shrinkage factors based on computer models.
1.2 Summary of Project Achievements
Phase I The first part of the project involved preparation of reports on the state of the art for die-wax, wax-shell, and shell-alloy processes. The primary R&D focus during Phase I was on the wax material since the least was known about it. The main R&D accomplishments during this phase were determination of procedures for obtaining the thermal conductivity and viscoelastic properties of an unfilled wax and validating those procedures.
Phase II Efforts during Phase II focused on die-wax and shell-alloy systems. A wax material model was developed, and a die-wax model was successfully incorporated into and used in commercial computer programs. At that time, computer simulation programs had complementary features. A viscoelastic module was available in ABAQUS but unavailable in ProCAST, while the mold-filling module was available in ProCAST but unavailable in ABAQUS. Thus, the numerical simulation results were only in good qualitative agreement with experimental results, the predicted shrinkage factors being approximately 2.5 times larger than those measured. Significant progress was made, and results showed that the testing and modeling of wax material had great potential for industrial applications.
Thermo-physical properties (tests, data, model) —> Temperature —> Thermal expansion Thermo-mechanical properties (tests, data, model) —> Stress and displacement Thermal expansion
—> Dimensions Stress and displacement
3
Additional R&D focus was placed on the fused-silica shell mold and A356 aluminum alloy system. The experimental part of the program was conducted at ORNL and commercial foundries, where wax patterns were injected, molds were invested, and alloys were poured. Significant effort was made to obtain temperature profiles in the shell mold. A model for thermal radiation within the shell mold was developed, and the thermal model was successfully validated using ProCAST. The alloy dimensions were obtained from numerical simulations only with coupled shell-alloy systems. The A356 alloy dimensions were in excellent quantitative agreement with experimental data, validating the deformation module.
Phase III: Current Project Efforts during Phase III focused mainly on the shell-alloy systems. A high melting point alloy, 17-4PH stainless steel, was considered. The experimental part of the program was conducted at ORNL and commercial foundries, where wax patterns were injected, molds were invested, and alloys were poured. Shell molds made of fused silica and alumino-silicates were considered. A literature review was conducted on thermophysical and thermomechanical properties alumino-silicates. Material property data, which were not available from material suppliers, was obtained. For all the properties of 17-4PH stainless steel, the experimental data available in the literature did not cover the entire temperature range necessary for process simulation. Thus, some material properties were evaluated using ProCAST, based on CompuTherm database. A comparison between the predicted material property data and measured property data was made. It was found that most material properties were accurately predicted only over several temperature ranges. No experimental data for plastic modulus were found. Thus, several assumptions were made and ProCAST recommendations were followed in order to obtain a complete set of mechanical property data at high temperatures. Thermal expansion measurements for the 17-4PH alloy were conducted during heating and cooling. As a function of temperature, the thermal expansion for both the alloy and shell mold materials showed different evolution on heating and cooling. Numerical simulations were performed using ProCAST for the investment casting of 17-4PH stainless steel parts in fused silica molds using the thermal expansion obtained on heating and another one with thermal expansion obtained on cooling. Since the fused silica shells had the lowest thermal expansion properties in the industry, the dewaxing phase, including the coupling between wax-shell systems, was neglected. The shell mold was considered to be a pure elastic material. The alloy dimensions were obtained from numerical simulations. For 17-4PH stainless steel parts, the alloy shrinkage factors were over-predicted, as compared with experimental data. Additional R&D focus was placed on obtaining material property data for filled waxes, waxes that are common in the industry. For the first time in the investment casting industry, the thermo-mechanical properties of unfilled and filled waxes were measured. Test specimens of three waxes were injected at commercial foundries. Rheometry measurement of filled waxes was conducted at ORNL. The analysis of the rheometry data to obtain viscoelastic properties was not completed due to the reduction in the budget of the project (approximately 50% and 60% of DOE funds and cost-share from industrial partners were received, respectively).
1.3 Technology Transfer The techniques developed in the program were documented in several publications and conference presentations. Detailed reports on alloy and shell mold materials were also issued to the participating companies. Through the ORNL work conducted in this project, the areas of material property

4
measurement and modeling of material behavior has matured, allowing the software vendors to develop appropriate modules in their codes, the next steps in technology transfer. Over the course of the project, ORNL assisted ProCAST with advice, information, material property data, mesh files, ProCAST setup files. Recommendations were made to Investment Casting Institute on measurement techniques for waxes. Recommendations for mechanical testing of waxes were made based on testing one unfilled wax and one filled wax, both used by the industry. The recommendations made could be used to establish new testing guidelines for waxes in the investment casting industry. Commercial adoption of the technologies developed in this program took place through the active participation of the American Foundry Society, Edison Materials Technology Center, and the industrial partners participating in this work. Most of the property data and constitutive equations developed in this program were implemented in ProCAST, the leading casting simulation software for the investment casting industry, allowing immediate dissemination of the information to industry. As a result of this work, ProCAST implemented a viscoelastic module that is currently being tested.
1.4 Recommendations This project laid the theoretical groundwork for predicting shrinkage factors. Further work on obtaining the alloy mechanical properties at high temperature needs to be performed. Numerical simulations need to be conducted based on more accurate mechanical properties and the accuracy of the deformation module needs to be assessed. Also, the creep properties of the shell molds must also be obtained, modeled, and validated. The analysis of the rheometry data for the filled wax must be completed. The potential for industrial applications of the wax testing must be assessed. Future work is needed for delivering to the industry a computer program in which the die-wax, wax-shell, and shell-alloy systems are coupled for determining the dimensions of the wax pattern, shell mold, and casting in a sequential but coupled manner. For technology dissemination, it is now recommended that a new project be started and conducted to incorporate the proposed methodologies into commercial casting software. The software vendors should collaborate with a team of users.

6
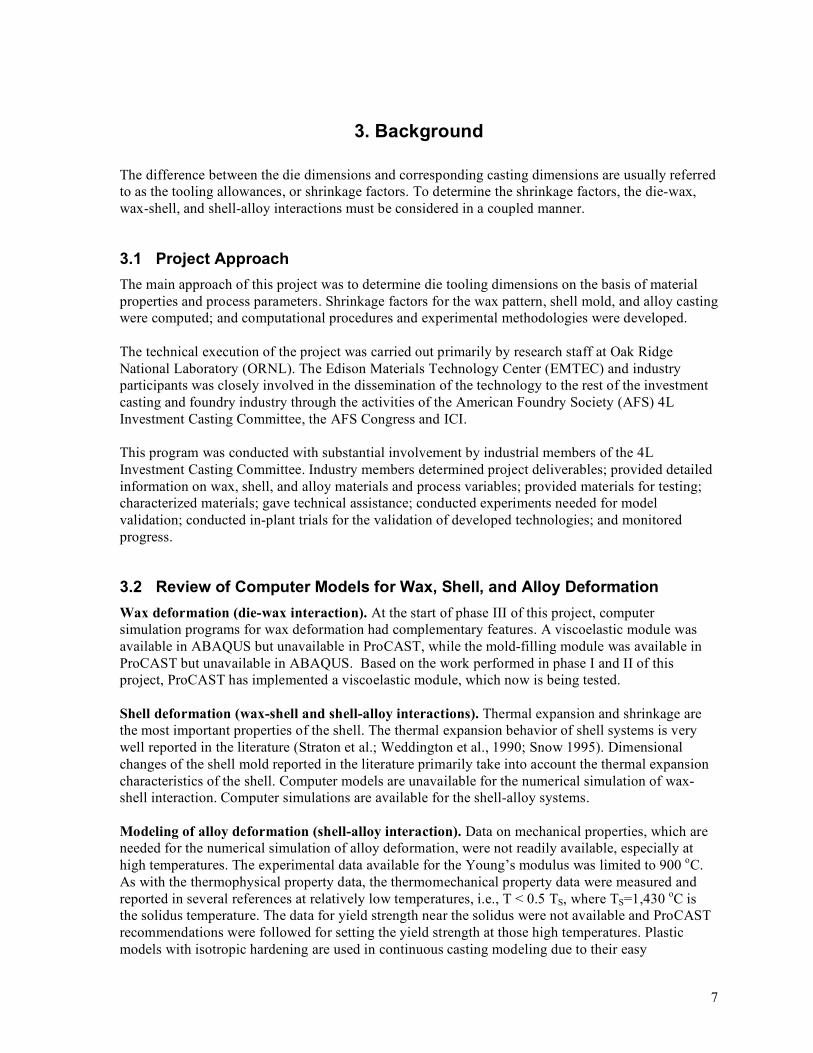
2. Introduction For the investment casting process, the tooling depends on dimensional changes associated with the wax pattern, ceramic molds, and cast alloys. The nominal casting dimensions can be achieved provided that the die tools were dimensioned with appropriate degree of accuracy. In most cases, the mold geometry or cores restrict the shrinkage of the pattern or the cast part, and the final casting dimensions may be affected by time-dependent processes such as viscoelastic deformation of the wax, and viscoplastic creep and plastic yield of the shell and alloy. Although there is significant information in the literature on these processes, and mathematical models have been developed for continuous and direct chill casting, there has been little or no application to shaped castings. In particular, although many commercial casting codes have stress modules to predict elastic stress, they cannot predict dimensional change or model the effects of geometrical restraint, viscoelastic creep, viscoplastic creep, and plastic yield. These processes occur primarily in investment casting, due to the extended time the casting is at high temperature, and occur to a much lesser extent in other casting processes. As a step towards predicting tooling dimensions, Sabau (2006) showed that, for the investment casting of aluminum alloys, alloy shrinkage factors were predicted with high degree of accuracy when the deformation of the mold is considered. Wax patterns are made by injecting wax into metal dies, ceramic shells are made by the successive application of ceramic coatings over the wax patterns, and the alloys are cast into the dewaxed shell molds. The dimensional changes associated with wax, shell mold, or alloy, are referred to as wax, shell mold, or alloy shrinkage factors (or tooling allowances), respectively. The usual practice to estimate the die tools’ dimensions is by adjusting the nominal casting dimensions with the shrinkage factors. To date, investment casting technology has been based on hands-on training and experience. Technical literature is limited to experimental, phenomenological studies aimed at obtaining empirical correlations for quick and easy application in industry. The pattern die is often reworked several times to produce castings whose dimensions are within acceptable tolerances. The complexity of shape and the close dimensional tolerances required in the final casting make it difficult to determine the appropriate pattern dimensions with existent casting simulation software except by trial and error. Improvements in industrial dimensional practices are hindered by (a) the complexity of physical phenomena that determine casting dimensions; (b) the lack of thermophysical property data for the wax, shell, and alloy; and (c) the lack of well-established, validated thermomechanical models that describe the deformation of the wax, shell, and alloy. Although not all of the commercial packages have all the features pertinent to investment casting (e.g., input for radiation heat transfer), most can be used to design gating systems and minimize areas of solidification shrinkage. However, none of the commercial packages can be used for determining the pattern tooling dimensions.
7
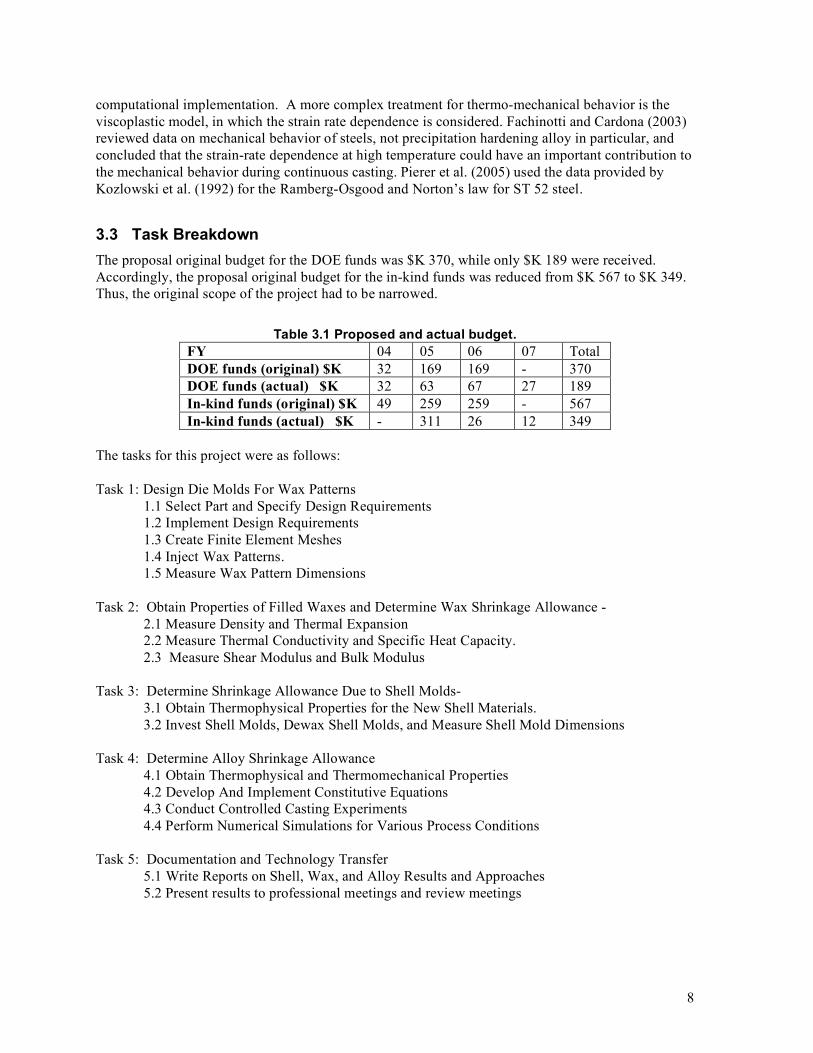
3. Background The difference between the die dimensions and corresponding casting dimensions are usually referred to as the tooling allowances, or shrinkage factors. To determine the shrinkage factors, the die-wax, wax-shell, and shell-alloy interactions must be considered in a coupled manner.
3.1 Project Approach The main approach of this project was to determine die tooling dimensions on the basis of material properties and process parameters. Shrinkage factors for the wax pattern, shell mold, and alloy casting were computed; and computational procedures and experimental methodologies were developed. The technical execution of the project was carried out primarily by research staff at Oak Ridge National Laboratory (ORNL). The Edison Materials Technology Center (EMTEC) and industry participants was closely involved in the dissemination of the technology to the rest of the investment casting and foundry industry through the activities of the American Foundry Society (AFS) 4L Investment Casting Committee, the AFS Congress and ICI. This program was conducted with substantial involvement by industrial members of the 4L Investment Casting Committee. Industry members determined project deliverables; provided detailed information on wax, shell, and alloy materials and process variables; provided materials for testing; characterized materials; gave technical assistance; conducted experiments needed for model validation; conducted in-plant trials for the validation of developed technologies; and monitored progress.
3.2 Review of Computer Models for Wax, Shell, and Alloy Deformation Wax deformation (die-wax interaction). At the start of phase III of this project, computer simulation programs for wax deformation had complementary features. A viscoelastic module was available in ABAQUS but unavailable in ProCAST, while the mold-filling module was available in ProCAST but unavailable in ABAQUS. Based on the work performed in phase I and II of this project, ProCAST has implemented a viscoelastic module, which now is being tested. Shell deformation (wax-shell and shell-alloy interactions). Thermal expansion and shrinkage are the most important properties of the shell. The thermal expansion behavior of shell systems is very well reported in the literature (Straton et al.; Weddington et al., 1990; Snow 1995). Dimensional changes of the shell mold reported in the literature primarily take into account the thermal expansion characteristics of the shell. Computer models are unavailable for the numerical simulation of wax-shell interaction. Computer simulations are available for the shell-alloy systems. Modeling of alloy deformation (shell-alloy interaction). Data on mechanical properties, which are needed for the numerical simulation of alloy deformation, were not readily available, especially at high temperatures. The experimental data available for the Young’s modulus was limited to 900 oC. As with the thermophysical property data, the thermomechanical property data were measured and reported in several references at relatively low temperatures, i.e., T < 0.5 TS, where TS=1,430 oC is the solidus temperature. The data for yield strength near the solidus were not available and ProCAST recommendations were followed for setting the yield strength at those high temperatures. Plastic models with isotropic hardening are used in continuous casting modeling due to their easy
8
computational implementation. A more complex treatment for thermo-mechanical behavior is the viscoplastic model, in which the strain rate dependence is considered. Fachinotti and Cardona (2003) reviewed data on mechanical behavior of steels, not precipitation hardening alloy in particular, and concluded that the strain-rate dependence at high temperature could have an important contribution to the mechanical behavior during continuous casting. Pierer et al. (2005) used the data provided by Kozlowski et al. (1992) for the Ramberg-Osgood and Norton’s law for ST 52 steel.
3.3 Task Breakdown The proposal original budget for the DOE funds was $K 370, while only $K 189 were received. Accordingly, the proposal original budget for the in-kind funds was reduced from $K 567 to $K 349. Thus, the original scope of the project had to be narrowed.
Table 3.1 Proposed and actual budget. FY 04 05 06 07 Total DOE funds (original) $K 32 169 169 - 370 DOE funds (actual) $K 32 63 67 27 189 In-kind funds (original) $K 49 259 259 - 567 In-kind funds (actual) $K - 311 26 12 349
The tasks for this project were as follows: Task 1: Design Die Molds For Wax Patterns
1.1 Select Part and Specify Design Requirements 1.2 Implement Design Requirements 1.3 Create Finite Element Meshes 1.4 Inject Wax Patterns. 1.5 Measure Wax Pattern Dimensions
Task 2: Obtain Properties of Filled Waxes and Determine Wax Shrinkage Allowance -
2.1 Measure Density and Thermal Expansion 2.2 Measure Thermal Conductivity and Specific Heat Capacity. 2.3 Measure Shear Modulus and Bulk Modulus
Task 3: Determine Shrinkage Allowance Due to Shell Molds-
3.1 Obtain Thermophysical Properties for the New Shell Materials. 3.2 Invest Shell Molds, Dewax Shell Molds, and Measure Shell Mold Dimensions
Task 4: Determine Alloy Shrinkage Allowance
4.1 Obtain Thermophysical and Thermomechanical Properties 4.2 Develop And Implement Constitutive Equations 4.3 Conduct Controlled Casting Experiments 4.4 Perform Numerical Simulations for Various Process Conditions
Task 5: Documentation and Technology Transfer
5.1 Write Reports on Shell, Wax, and Alloy Results and Approaches 5.2 Present results to professional meetings and review meetings
9
4. Results and Discussion In this work, deformations shell-alloy systems were considered in a coupled manner, but the coupled deformation of the wax-shell system was not considered. Therefore, the project contained tasks pertaining to each material and their interactions, which are described in distinct sections. Section 4.1 presents results for the work on shell mold material. Section 4.2 describes results for the alloy and shell-alloy deformation, and Section 4.3 deals with the wax materials.
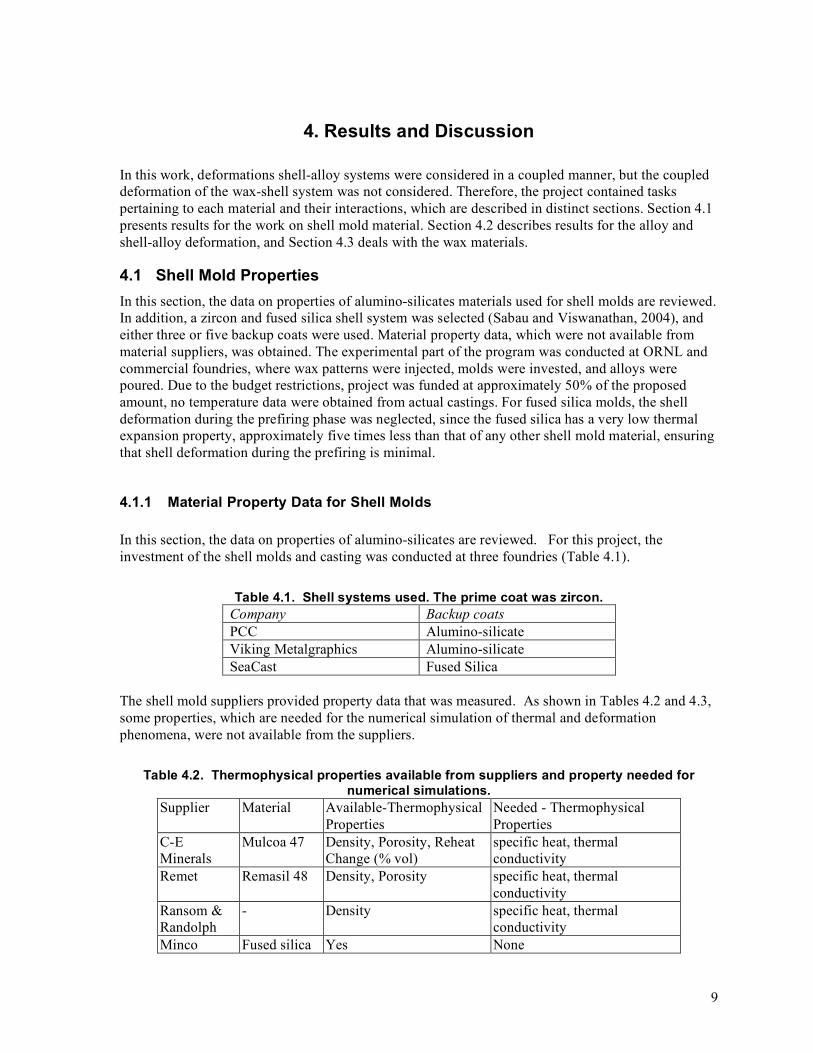
4.1 Shell Mold Properties In this section, the data on properties of alumino-silicates materials used for shell molds are reviewed. In addition, a zircon and fused silica shell system was selected (Sabau and Viswanathan, 2004), and either three or five backup coats were used. Material property data, which were not available from material suppliers, was obtained. The experimental part of the program was conducted at ORNL and commercial foundries, where wax patterns were injected, molds were invested, and alloys were poured. Due to the budget restrictions, project was funded at approximately 50% of the proposed amount, no temperature data were obtained from actual castings. For fused silica molds, the shell deformation during the prefiring phase was neglected, since the fused silica has a very low thermal expansion property, approximately five times less than that of any other shell mold material, ensuring that shell deformation during the prefiring is minimal.
4.1.1 Material Property Data for Shell Molds In this section, the data on properties of alumino-silicates are reviewed. For this project, the investment of the shell molds and casting was conducted at three foundries (Table 4.1).
Table 4.1. Shell systems used. The prime coat was zircon. Company Backup coats PCC Alumino-silicate Viking Metalgraphics Alumino-silicate SeaCast Fused Silica
The shell mold suppliers provided property data that was measured. As shown in Tables 4.2 and 4.3, some properties, which are needed for the numerical simulation of thermal and deformation phenomena, were not available from the suppliers.
Table 4.2. Thermophysical properties available from suppliers and property needed for numerical simulations.
Supplier Material Available-Thermophysical Properties
Needed - Thermophysical Properties
C-E Minerals
Mulcoa 47 Density, Porosity, Reheat Change (% vol)
specific heat, thermal conductivity
Remet Remasil 48 Density, Porosity specific heat, thermal conductivity
Ransom & Randolph
- Density specific heat, thermal conductivity
Minco Fused silica Yes None
10
Table 4.3. Thermo-mechanical properties available from suppliers and property needed for numerical simulations
Supplier Material Available-Thermo-mechanical Properties
***Needed – Thermo-mechanical Properties
C-E Minerals Mulcoa 47 None Thermal expansion, Youngs modulus, Poisson ratio
Remet Remasil 48 Coefficient of thermal expansion, Thermal expansion
Youngs modulus, Poisson ratio
Ransom & Randolph
- none Thermal expansion, Youngs modulus, Poisson ratio
Minco Fused silica Youngs modulus, (Snow, 2004)
Thermal expansion, Youngs modulus as a function of temperature, Poisson ratio
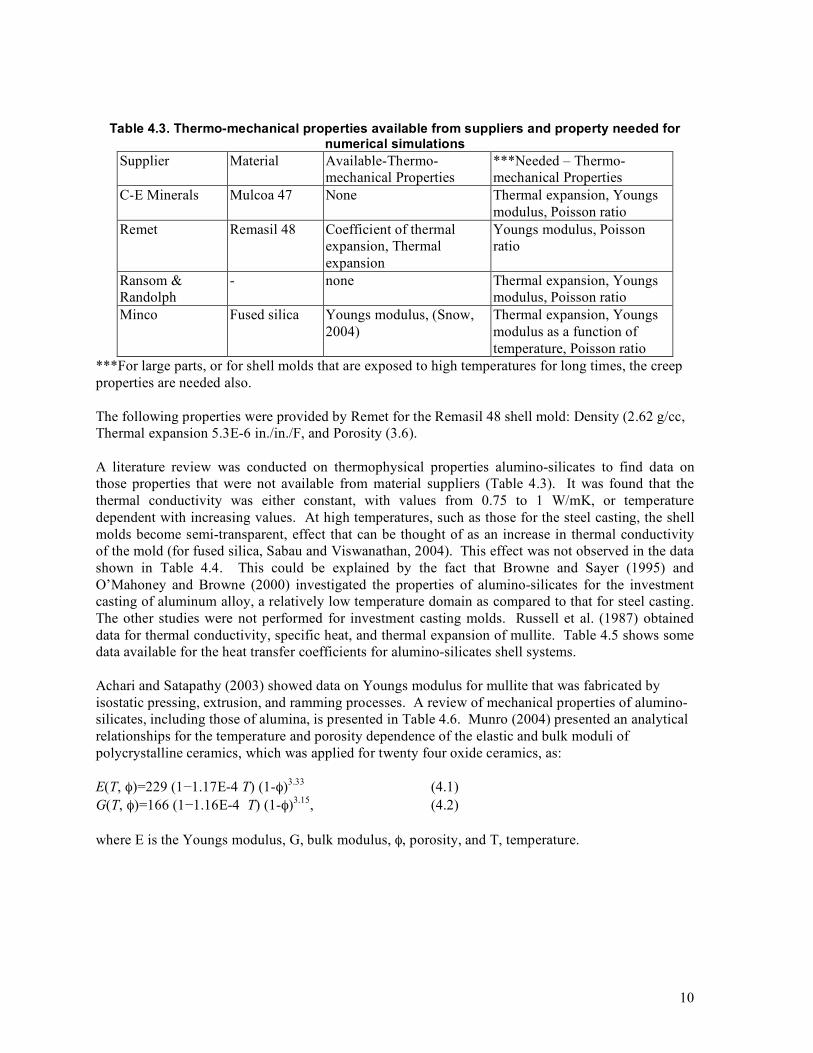
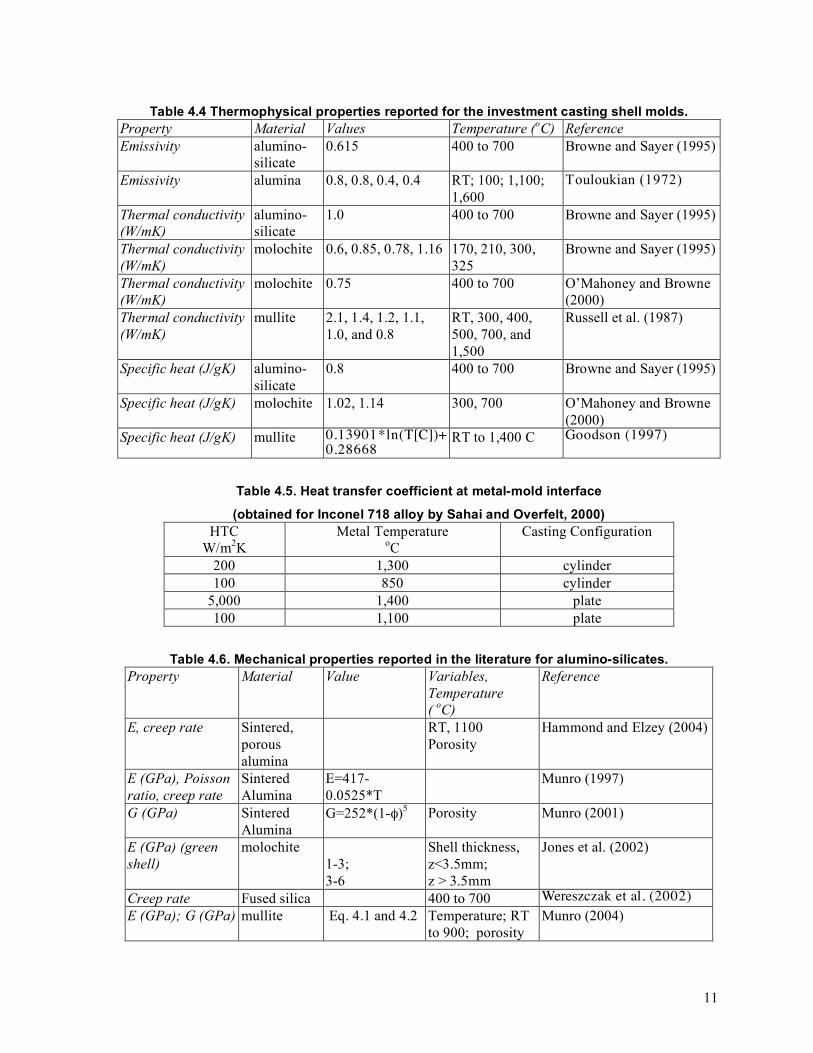
***For large parts, or for shell molds that are exposed to high temperatures for long times, the creep properties are needed also. The following properties were provided by Remet for the Remasil 48 shell mold: Density (2.62 g/cc, Thermal expansion 5.3E-6 in./in./F, and Porosity (3.6). A literature review was conducted on thermophysical properties alumino-silicates to find data on those properties that were not available from material suppliers (Table 4.3). It was found that the thermal conductivity was either constant, with values from 0.75 to 1 W/mK, or temperature dependent with increasing values. At high temperatures, such as those for the steel casting, the shell molds become semi-transparent, effect that can be thought of as an increase in thermal conductivity of the mold (for fused silica, Sabau and Viswanathan, 2004). This effect was not observed in the data shown in Table 4.4. This could be explained by the fact that Browne and Sayer (1995) and O’Mahoney and Browne (2000) investigated the properties of alumino-silicates for the investment casting of aluminum alloy, a relatively low temperature domain as compared to that for steel casting. The other studies were not performed for investment casting molds. Russell et al. (1987) obtained data for thermal conductivity, specific heat, and thermal expansion of mullite. Table 4.5 shows some data available for the heat transfer coefficients for alumino-silicates shell systems. Achari and Satapathy (2003) showed data on Youngs modulus for mullite that was fabricated by isostatic pressing, extrusion, and ramming processes. A review of mechanical properties of alumino-silicates, including those of alumina, is presented in Table 4.6. Munro (2004) presented an analytical relationships for the temperature and porosity dependence of the elastic and bulk moduli of polycrystalline ceramics, which was applied for twenty four oxide ceramics, as: E(T, φ)=229 (1−1.17E-4 T) (1-φ)3.33 (4.1) G(T, φ)=166 (1−1.16E-4 T) (1-φ)3.15, (4.2) where E is the Youngs modulus, G, bulk modulus, φ, porosity, and T, temperature.
11
Table 4.4 Thermophysical properties reported for the investment casting shell molds. Property Material Values Temperature (oC) Reference Emissivity alumino-
silicate 0.615 400 to 700 Browne and Sayer (1995)
Emissivity alumina 0.8, 0.8, 0.4, 0.4 RT; 100; 1,100; 1,600
Touloukian (1972)
Thermal conductivity (W/mK)
alumino-silicate
1.0 400 to 700 Browne and Sayer (1995)
Thermal conductivity (W/mK)
molochite 0.6, 0.85, 0.78, 1.16 170, 210, 300, 325
Browne and Sayer (1995)
Thermal conductivity (W/mK)
molochite 0.75 400 to 700 O’Mahoney and Browne (2000)
Thermal conductivity (W/mK)
mullite 2.1, 1.4, 1.2, 1.1, 1.0, and 0.8
RT, 300, 400, 500, 700, and 1,500
Russell et al. (1987)
Specific heat (J/gK) alumino-silicate
0.8 400 to 700 Browne and Sayer (1995)
Specific heat (J/gK) molochite 1.02, 1.14 300, 700 O’Mahoney and Browne (2000)
Specific heat (J/gK) mullite 0.13901*ln(T[C])+ 0.28668
RT to 1,400 C Goodson (1997)
Table 4.5. Heat transfer coefficient at metal-mold interface
(obtained for Inconel 718 alloy by Sahai and Overfelt, 2000) HTC
W/m2K Metal Temperature
oC Casting Configuration
200 1,300 cylinder 100 850 cylinder
5,000 1,400 plate 100 1,100 plate
Table 4.6. Mechanical properties reported in the literature for alumino-silicates. Property Material Value Variables,
Temperature ( oC)
Reference
E, creep rate Sintered, porous alumina
RT, 1100 Porosity
Hammond and Elzey (2004)
E (GPa), Poisson ratio, creep rate
Sintered Alumina
E=417-0.0525*T
Munro (1997)
G (GPa) Sintered Alumina
G=252*(1-φ)5 Porosity Munro (2001)
E (GPa) (green shell)
molochite 1-3; 3-6
Shell thickness, z<3.5mm; z > 3.5mm
Jones et al. (2002)
Creep rate Fused silica 400 to 700 Wereszczak et al. (2002) E (GPa); G (GPa) mullite Eq. 4.1 and 4.2 Temperature; RT
to 900; porosity Munro (2004)

12
4.1.2 Material Property Data for Fused-silica Shell Molds The thermal expansion of the shell mold was available from Snow (1995). The shell material shows extremely small thermal expansion on heating (Figure 4.1). Sintering is evidenced by a change from expansion to contraction at approximately 900 oC. The data were obtained by holding the shell mold for 2 hours at 1200 oC. During cooling, the thermal contraction of the shell is larger than the expansion for heating, reaching 0.3 % at 200 oC. Due to crystoballite formation, the thermal contraction occurs at a different rate from 200 oC to room temperature. The thermal expansion of the shell mold is still much smaller than the thermal expansion of the alloy. Since insignificant thermal expansion occurs during heating, the dimensions of the shell mold do not change from room temperature until the metal is poured. This distinct behavior during heating and cooling of the fused silica shell molds is very important since the shell dimensional changes prior to metal pouring can be neglected. For alumino-silicate molds, this is not the case since their thermal expansion is significantly larger than that of the fused silica molds. Moreover, since the shell is much less stiff than the steel, its contraction behavior below 1200 oC is expected to alter the gap between the mold and casting while inducing insignificant deformation in the steel casting.
-0.6
-0.5
-0.4
-0.3
-0.2
-0.1
0
0.1
0 200 400 600 800 1000 1200
heatingcooling
Lin
ear
ther
ma
l ex
pan
sio
n [
%]
Temperature [oC]
Figure 4.1. Measured linear thermal expansion for the shell mold (Snow, 1995). The shell mold contained the following types of substrates: face coats, intermediate coats, backup coats, and seal coats. Each coat was generally made of two layers, a slurry layer and a stucco layer. In this study, zircon and fused silica shell materials were used (Sabau and Viswanathan, 2004). The shell mold had eight coats: a zircon prime coat, one intermediate coat, five backup coats, and one seal coat. The shell mold thickness was approximately 8.5 mm.
In order to account for thermal radiation effects within the shell mold, the following relationship proposed by Sabau and Viswanathan, (2004) for temperature dependence of thermal conductivity, k, was used:
k(T) = ak + bk T3. (4.3)
For a shell mold with a thickness of approximately 8.5mm, parameters ak and bk were found to be 0.48 and 3.61 10-10, respectively (Sabau, 2005). The shell mold was considered to be a linear-elastic material, for which the Young’s modulus at 25 oC was approximately 2,586 MPa (Snow, 2004). The temperature dependence of Young’s modulus was that provided by Fukuhara and Sanpei (1994) and Munro (2004) for fused silica.
13
4.2 Alloy Properties and Mechanical Interaction for the Shell-Alloy System In this section, the first attempt to determine shrinkage factors for the investment casting of stainless steels is presented. For all the properties of 17-4PH stainless steel, the experimental data available in the literature did not cover the entire temperature range necessary for process simulation. Thus, some material properties were evaluated using ProCAST, based on CompuTherm database. A comparison between the predicted material property data and measured property data was made. It was found that most material properties were accurately predicted only over several temperature ranges. No experimental data for plastic modulus were found. Thus, several assumptions were made and ProCAST recommendations were followed in order to obtain a complete set of mechanical property data at high temperatures. Thermal expansion measurements for the 17-4PH alloy were conducted during heating and cooling. As a function of temperature, the thermal expansion for both the alloy and shell mold materials showed different evolution on heating and cooling. Section 4.2 is concerned with determining the alloy tooling allowances from a combined analysis of heat transfer and deformation of the casting process. The shell molds were made of fused silica with a zircon prime coat, as shown in previous sections. The wax patterns were invested at Minco, Inc., and casting experiments were conducted at Precision Metalsmiths, Inc. (PMI). Dimensions of the die tooling, wax pattern, and casting were measured using a Coordinate Measurement Machine. Numerical simulations were performed using ProCAST for the investment casting of 17-4PH stainless steel parts in fused silica molds using the thermal expansion obtained on heating and another one with thermal expansion obtained on cooling. Since the fused silica shells had the lowest thermal expansion properties in the industry, the dewaxing phase, including the coupling between wax-shell systems, was neglected. The shell mold was considered to be a pure elastic material. The alloy dimensions were obtained from numerical simulations. For 17-4PH stainless steel parts, the alloy shrinkage factors were over-predicted, as compared with experimental data.
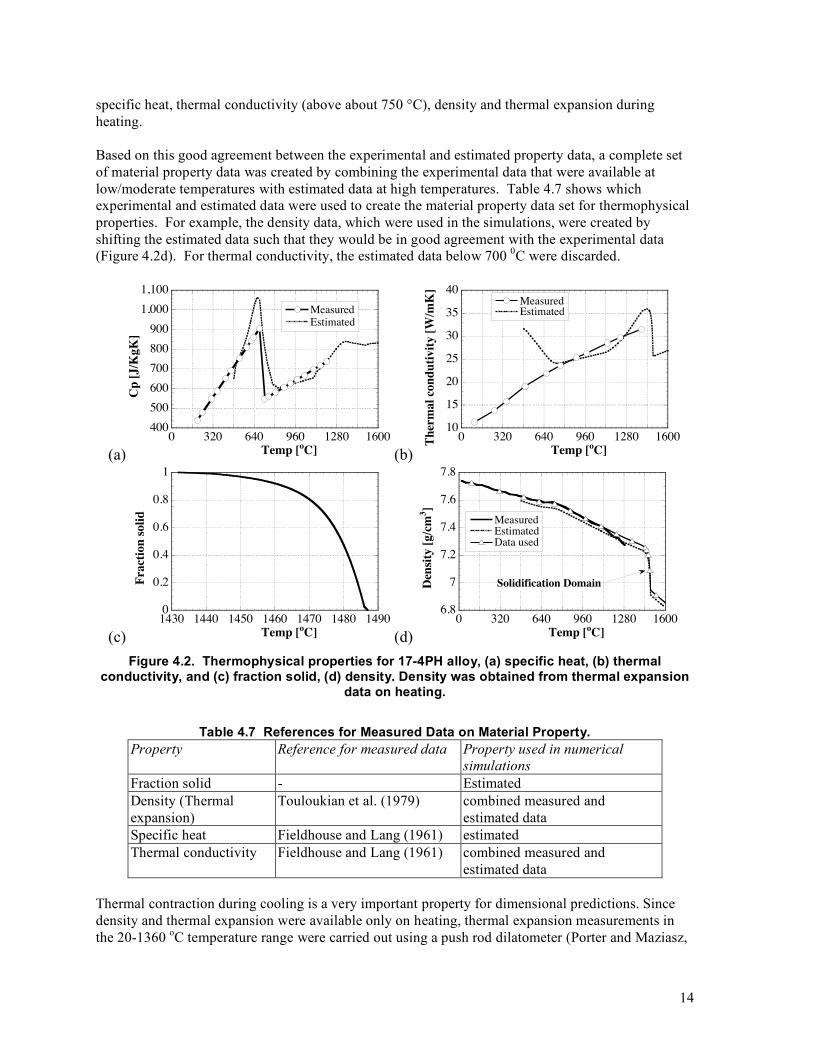
4.2.1 Thermophysical Material Property for 17-4PH steel The first step in predicting alloy shrinkage factors was to obtain data on thermophysical properties of 17-4PH alloy. Experimental data on material properties were reviewed. Experimentally measured data on specific heat and thermal conductivity were provided in Fieldhouse and Lang (1961) for temperatures less than 1200 and 1395 oC, respectively. Experimental data on density and thermal expansion were available from measurements reported for heating by Touloukian et al. (1979) and Rack (1981) (up to 940 oC). No experimental data were available for the solidification properties, such as solidus, liquidus, and distribution of solid fraction. Thus, it was found that the material properties for 17-4PH alloy, which were required for the numerical simulations, were not available over the entire temperature domain experienced in the process (from the liquidus to room temperature). In order to obtain the material property data at high temperatures, computational techniques were reviewed. Recent advances in thermodynamics and material science were exploited to obtain data on material properties (Guo and Samonds, 2007). For example, the CompuTherm database (Chen et al., 2003) for molar volume and thermal volume coefficients of expansion (CTE) of liquid, solid solution elements, and intermetallic phases, was used to estimate the densities of the liquid and solid phases (Guo and Samonds, 2007). However, these methods have not been validated for stainless steel alloys, such as 17-4PH. Next, CompuTherm software available with ProCASTTM was used to obtain the data on specific heat (Figure 4.2a), enthalpy, latent heat, electrical conductivity and resistivity, thermal conductivity (Figure 4.2b), solid fraction (Figure 4.2c), density (Figure 4.2d), and liquid viscosity. Where available, the experimental data are also shown in Figure 4.2. The composition, % wt, that used in CompuTherm simulations was Al 0.002, B 0.002, Cd 0.2, C 0.027, Cr 15.21, Co 0.05, Cu 3.47, Mn 0.63, Mo 0.1, Ni 4.44, N 0.02, P 0.028, Si 0.43, S 0.026, Ta 0.022, Ti 0.002, Fe balance. The estimated properties using ProCAST were compared against experimental data. It was found that the following properties were predicted with a high degree of accuracy:
14
specific heat, thermal conductivity (above about 750 °C), density and thermal expansion during heating. Based on this good agreement between the experimental and estimated property data, a complete set of material property data was created by combining the experimental data that were available at low/moderate temperatures with estimated data at high temperatures. Table 4.7 shows which experimental and estimated data were used to create the material property data set for thermophysical properties. For example, the density data, which were used in the simulations, were created by shifting the estimated data such that they would be in good agreement with the experimental data (Figure 4.2d). For thermal conductivity, the estimated data below 700 0C were discarded.
(a)
400
500
600
700
800
900
1,000
1,100
0 320 640 960 1280 1600
Measured
Estimated
Cp
[J/K
gK
]
Temp [oC] (b)
10
15
20
25
30
35
40
0 320 640 960 1280 1600
Measured
Estimated
Th
erm
al
con
du
tivit
y [
W/m
K]
Temp [oC]
(c)
0
0.2
0.4
0.6
0.8
1
1430 1440 1450 1460 1470 1480 1490
Fra
ctio
n s
oli
d
Temp [oC] (d)
6.8
7
7.2
7.4
7.6
7.8
0 320 640 960 1280 1600
Measured
Estimated
Data used
Den
sity
[g/c
m3]
Temp [oC]
Solidification Domain
Figure 4.2. Thermophysical properties for 17-4PH alloy, (a) specific heat, (b) thermal
conductivity, and (c) fraction solid, (d) density. Density was obtained from thermal expansion data on heating.
Table 4.7 References for Measured Data on Material Property. Property Reference for measured data Property used in numerical
simulations Fraction solid - Estimated Density (Thermal expansion)
Touloukian et al. (1979) combined measured and estimated data
Specific heat Fieldhouse and Lang (1961) estimated Thermal conductivity Fieldhouse and Lang (1961) combined measured and
estimated data Thermal contraction during cooling is a very important property for dimensional predictions. Since density and thermal expansion were available only on heating, thermal expansion measurements in the 20-1360 oC temperature range were carried out using a push rod dilatometer (Porter and Maziasz,
15
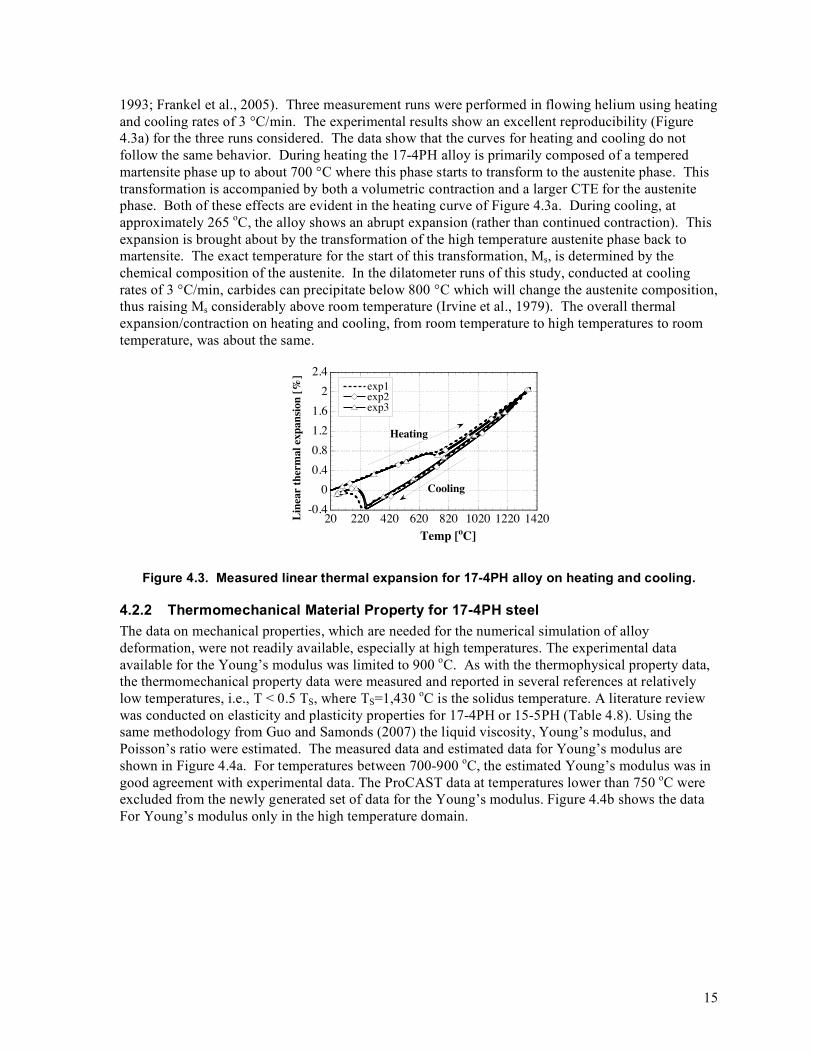
1993; Frankel et al., 2005). Three measurement runs were performed in flowing helium using heating and cooling rates of 3 °C/min. The experimental results show an excellent reproducibility (Figure 4.3a) for the three runs considered. The data show that the curves for heating and cooling do not follow the same behavior. During heating the 17-4PH alloy is primarily composed of a tempered martensite phase up to about 700 °C where this phase starts to transform to the austenite phase. This transformation is accompanied by both a volumetric contraction and a larger CTE for the austenite phase. Both of these effects are evident in the heating curve of Figure 4.3a. During cooling, at approximately 265 oC, the alloy shows an abrupt expansion (rather than continued contraction). This expansion is brought about by the transformation of the high temperature austenite phase back to martensite. The exact temperature for the start of this transformation, Ms, is determined by the chemical composition of the austenite. In the dilatometer runs of this study, conducted at cooling rates of 3 °C/min, carbides can precipitate below 800 °C which will change the austenite composition, thus raising Ms considerably above room temperature (Irvine et al., 1979). The overall thermal expansion/contraction on heating and cooling, from room temperature to high temperatures to room temperature, was about the same.
-0.4
0
0.4
0.8
1.2
1.6
2
2.4
20 220 420 620 820 1020 1220 1420
exp1exp2exp3
Lin
ear
ther
ma
l ex
pa
nsi
on
[%
]
Temp [oC]
Heating
Cooling
Figure 4.3. Measured linear thermal expansion for 17-4PH alloy on heating and cooling.
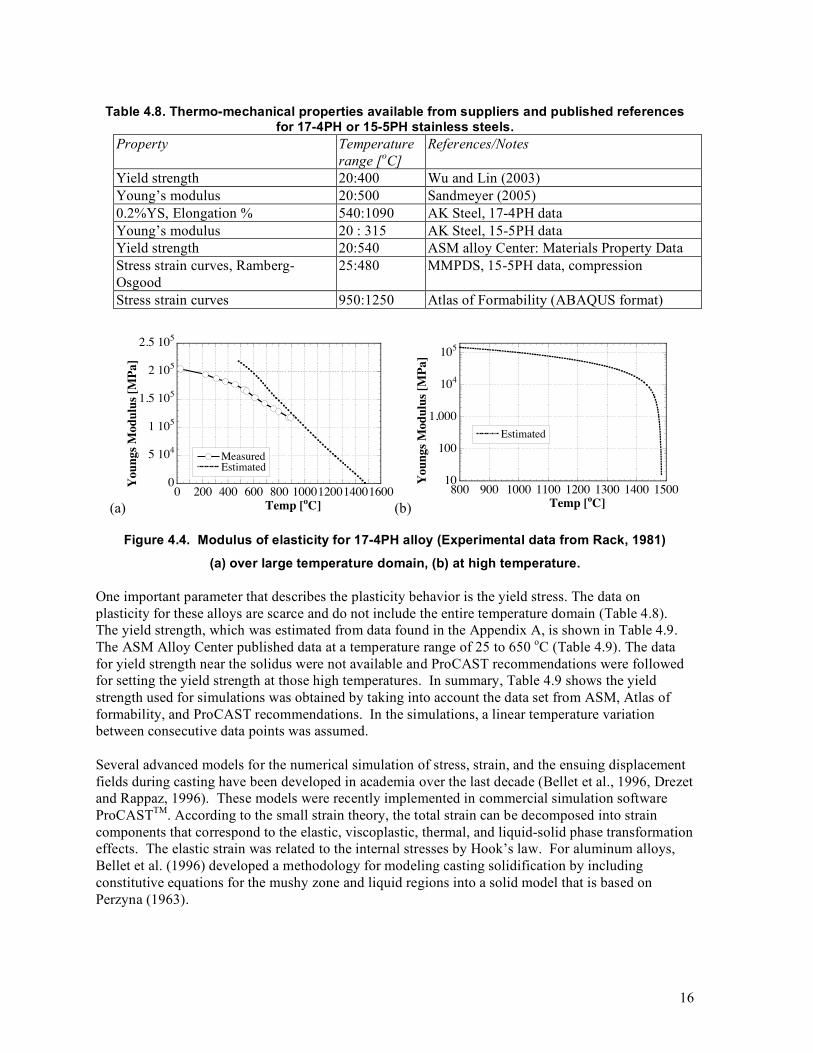
4.2.2 Thermomechanical Material Property for 17-4PH steel The data on mechanical properties, which are needed for the numerical simulation of alloy deformation, were not readily available, especially at high temperatures. The experimental data available for the Young’s modulus was limited to 900 oC. As with the thermophysical property data, the thermomechanical property data were measured and reported in several references at relatively low temperatures, i.e., T < 0.5 TS, where TS=1,430 oC is the solidus temperature. A literature review was conducted on elasticity and plasticity properties for 17-4PH or 15-5PH (Table 4.8). Using the same methodology from Guo and Samonds (2007) the liquid viscosity, Young’s modulus, and Poisson’s ratio were estimated. The measured data and estimated data for Young’s modulus are shown in Figure 4.4a. For temperatures between 700-900 oC, the estimated Young’s modulus was in good agreement with experimental data. The ProCAST data at temperatures lower than 750 oC were excluded from the newly generated set of data for the Young’s modulus. Figure 4.4b shows the data For Young’s modulus only in the high temperature domain.
16
Table 4.8. Thermo-mechanical properties available from suppliers and published references for 17-4PH or 15-5PH stainless steels.
Property Temperature range [oC]
References/Notes
Yield strength 20:400 Wu and Lin (2003) Young’s modulus 20:500 Sandmeyer (2005) 0.2%YS, Elongation % 540:1090 AK Steel, 17-4PH data Young’s modulus 20 : 315 AK Steel, 15-5PH data Yield strength 20:540 ASM alloy Center: Materials Property Data Stress strain curves, Ramberg-Osgood
25:480 MMPDS, 15-5PH data, compression
Stress strain curves 950:1250 Atlas of Formability (ABAQUS format)
(a)
0
5 104
1 105
1.5 105
2 105
2.5 105
0 200 400 600 800 1000120014001600
Measured
Estimated
You
ngs
Mod
ulu
s [M
Pa]
Temp [oC] (b)
10
100
1,000
104
105
800 900 1000 1100 1200 1300 1400 1500
Estimated
You
ngs
Mod
ulu
s [M
Pa]
Temp [oC]
Figure 4.4. Modulus of elasticity for 17-4PH alloy (Experimental data from Rack, 1981)
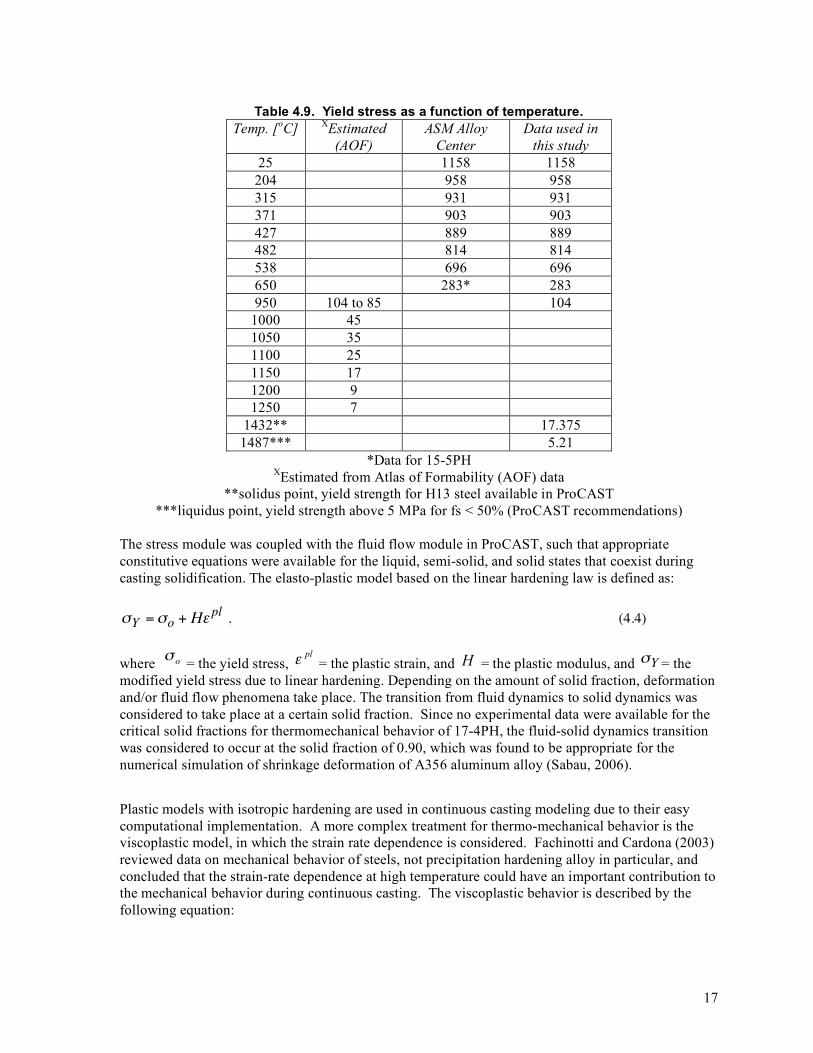
(a) over large temperature domain, (b) at high temperature. One important parameter that describes the plasticity behavior is the yield stress. The data on plasticity for these alloys are scarce and do not include the entire temperature domain (Table 4.8). The yield strength, which was estimated from data found in the Appendix A, is shown in Table 4.9. The ASM Alloy Center published data at a temperature range of 25 to 650 oC (Table 4.9). The data for yield strength near the solidus were not available and ProCAST recommendations were followed for setting the yield strength at those high temperatures. In summary, Table 4.9 shows the yield strength used for simulations was obtained by taking into account the data set from ASM, Atlas of formability, and ProCAST recommendations. In the simulations, a linear temperature variation between consecutive data points was assumed. Several advanced models for the numerical simulation of stress, strain, and the ensuing displacement fields during casting have been developed in academia over the last decade (Bellet et al., 1996, Drezet and Rappaz, 1996). These models were recently implemented in commercial simulation software ProCASTTM. According to the small strain theory, the total strain can be decomposed into strain components that correspond to the elastic, viscoplastic, thermal, and liquid-solid phase transformation effects. The elastic strain was related to the internal stresses by Hook’s law. For aluminum alloys, Bellet et al. (1996) developed a methodology for modeling casting solidification by including constitutive equations for the mushy zone and liquid regions into a solid model that is based on Perzyna (1963).
17
Table 4.9. Yield stress as a function of temperature. Temp. [oC] XEstimated
(AOF) ASM Alloy
Center Data used in
this study 25 1158 1158 204 958 958 315 931 931 371 903 903 427 889 889 482 814 814 538 696 696 650 283* 283 950 104 to 85 104
1000 45 1050 35 1100 25 1150 17 1200 9 1250 7
1432** 17.375 1487*** 5.21
*Data for 15-5PH XEstimated from Atlas of Formability (AOF) data
**solidus point, yield strength for H13 steel available in ProCAST ***liquidus point, yield strength above 5 MPa for fs < 50% (ProCAST recommendations)
The stress module was coupled with the fluid flow module in ProCAST, such that appropriate constitutive equations were available for the liquid, semi-solid, and solid states that coexist during casting solidification. The elasto-plastic model based on the linear hardening law is defined as:
!
"Y ="o + H# pl , (4.4)
where o! = the yield stress,
pl! = the plastic strain, and H = the plastic modulus, and
!
"Y = the modified yield stress due to linear hardening. Depending on the amount of solid fraction, deformation and/or fluid flow phenomena take place. The transition from fluid dynamics to solid dynamics was considered to take place at a certain solid fraction. Since no experimental data were available for the critical solid fractions for thermomechanical behavior of 17-4PH, the fluid-solid dynamics transition was considered to occur at the solid fraction of 0.90, which was found to be appropriate for the numerical simulation of shrinkage deformation of A356 aluminum alloy (Sabau, 2006). Plastic models with isotropic hardening are used in continuous casting modeling due to their easy computational implementation. A more complex treatment for thermo-mechanical behavior is the viscoplastic model, in which the strain rate dependence is considered. Fachinotti and Cardona (2003) reviewed data on mechanical behavior of steels, not precipitation hardening alloy in particular, and concluded that the strain-rate dependence at high temperature could have an important contribution to the mechanical behavior during continuous casting. The viscoplastic behavior is described by the following equation:
18
!
˙ " pl =1
#$ %$Y
n $
$ , (4.5)
where ! is the applied stress, n is the power exponent, ! is a viscous parameter. The operator < . > is defined as < f > = f when f ≥ 0 and zero otherwise. Both n and ! are temperature dependent coefficients. For example, at low temperatures when the alloy tends to behave elastoplastic, n has very large values while ! has very small values. The plasticity property data did not cover the entire temperature range needed and the data for plastic modulus were especially difficult to find. The only data available to estimate n and
!
" parameters were the true-stress true-strain data from the Atlas of Formability. The limited temperature range for the Atlas of Formability data hinders the use of this data, as data at low temperatures and near the solidus are not available. Other options would be to use viscoplastic data that were obtained for other steels (Table 4.10). Pierer et al. (2005) used the data provided by Kozlowski et al. (1992) for the Ramberg-Osgood and Norton’s law for ST 52 steel. Thus, for isotropic linear hardening, ProCAST recommends the use of a fraction of the Young’s modulus, i.e., H=E/20.
Table 4.10 Mechanical properties for other steels than 17-4PH. Property Material Equation, Property Temperature
Range ( oC) Reference
E, Y0.2 Stainless steel (304)
Ramberg-Osgood, stress-strain model
RT Abdella (2006)
E, Y0.2 , Y0.5 , Y1.5 , Y2.0
EN 1.4462, AISI 304
stress strain model RT to 960 Chen and Young (2006)
Creep rate Continuous casting steel
Creep law, stress-strain model
Below solidus Kajitani et al. (2001)
Creep rate Austenitic steels Norton’s law Below solidus Kozlowski et al. (1992) E, creep rate Low carbon
steels Viscoplasticity, hardening
Below solidus Fachinotti and Cardona (2003)
E – Young’s modulus, YX – Yield strength at x% of strain, T – temperature
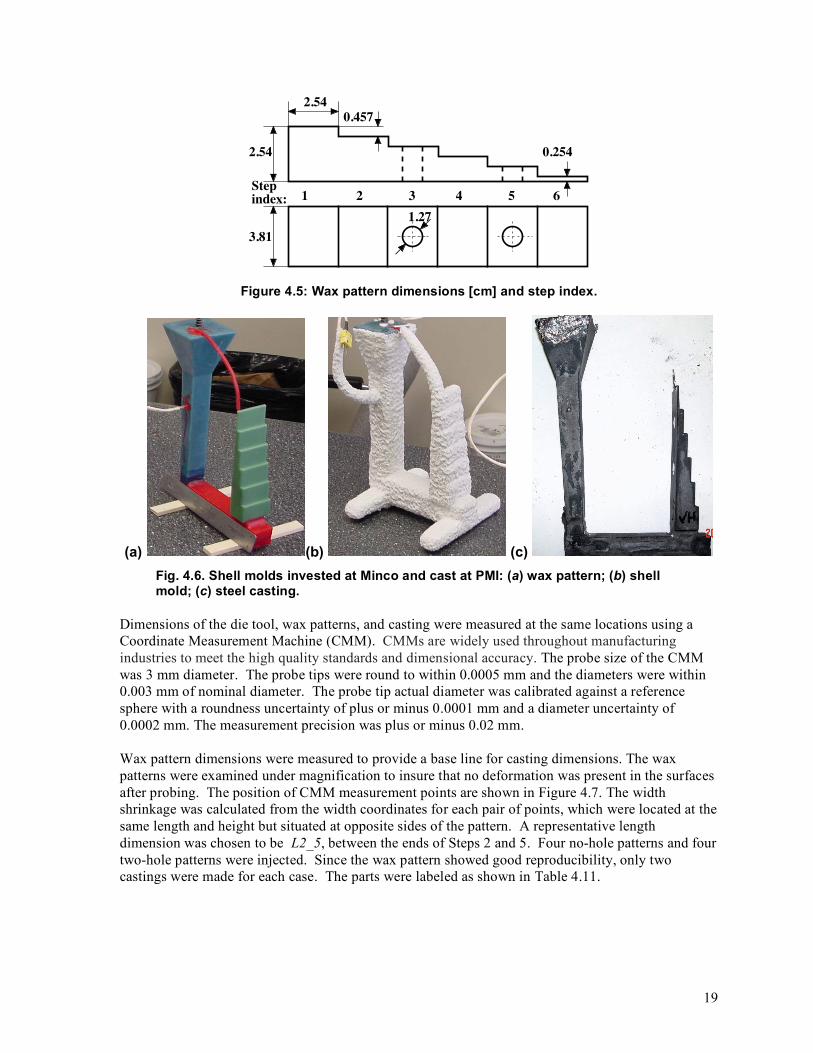
4.2.3 Experimental Results for Alloy Shrinkage Factors Parts with six steps were examined in this study (Figure 4.5). The 2.54-cm-thick step is considered to be Step 1. Two types of stepped parts were made: parts without holes and parts with holes on steps 3 and 5. In the remainder of this study, alloy castings and wax patterns are simply referred to as parts and patterns. The patterns without holes and patterns with two holes are referred to as no-hole, or unrestrained, patterns and two-hole, or restrained, patterns, respectively. The two-hole patterns were made by placing cores in the die. The two cores provided geometrical restraint on the length dimension of the part. For this work, wax patterns were made at M. Argueso & Co by injection of liquid unfilled wax, CeritaTM 29-51, at a pressure of 1.7 MPa (250 psi), at 65°C (150°F), with a dwell time of 120 s. The casting configuration considered in this study contains a downsprue, a runner, and one casting (Fig. 4.6). The sprue was dimensioned such that there was enough metallostatic head to fill the entire part. The height of the downsprue and pouring cup is 17cm and 6.35cm, respectively. The section dimensions for the pouring cup were 6.35 × 6.35, 2.54 × 2.54, and 2.54 × 1.9 cm at the top of pouring cup, end of pouring cup, and end of sprue, respectively. The molds were preheated at temperatures of 1000ºC (1830 ºF) for 45 min.
19
2.54
2.540.457
3.81
0.254
1.27
1 2 3 4 5 6Step index:
Figure 4.5: Wax pattern dimensions [cm] and step index.
(a) (b) (c) Fig. 4.6. Shell molds invested at Minco and cast at PMI: (a) wax pattern; (b) shell mold; (c) steel casting.
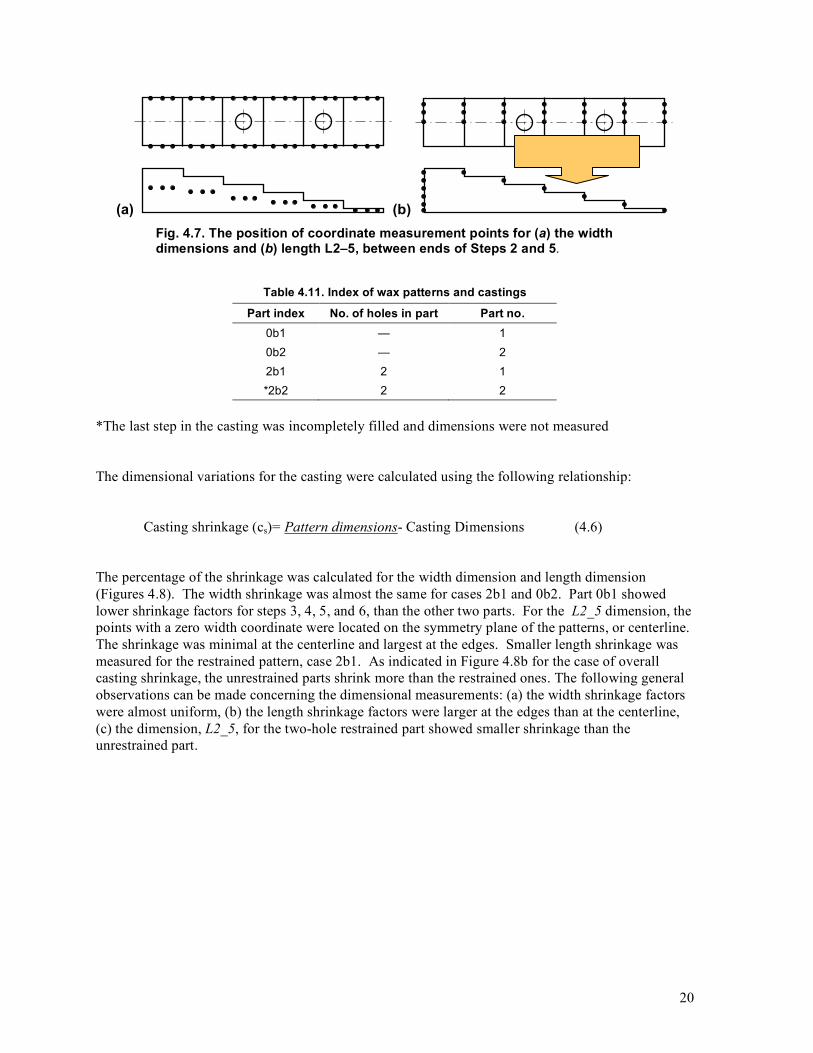
Dimensions of the die tool, wax patterns, and casting were measured at the same locations using a Coordinate Measurement Machine (CMM). CMMs are widely used throughout manufacturing industries to meet the high quality standards and dimensional accuracy. The probe size of the CMM was 3 mm diameter. The probe tips were round to within 0.0005 mm and the diameters were within 0.003 mm of nominal diameter. The probe tip actual diameter was calibrated against a reference sphere with a roundness uncertainty of plus or minus 0.0001 mm and a diameter uncertainty of 0.0002 mm. The measurement precision was plus or minus 0.02 mm. Wax pattern dimensions were measured to provide a base line for casting dimensions. The wax patterns were examined under magnification to insure that no deformation was present in the surfaces after probing. The position of CMM measurement points are shown in Figure 4.7. The width shrinkage was calculated from the width coordinates for each pair of points, which were located at the same length and height but situated at opposite sides of the pattern. A representative length dimension was chosen to be L2_5, between the ends of Steps 2 and 5. Four no-hole patterns and four two-hole patterns were injected. Since the wax pattern showed good reproducibility, only two castings were made for each case. The parts were labeled as shown in Table 4.11.
20
(a) (b) Fig. 4.7. The position of coordinate measurement points for (a) the width dimensions and (b) length L2–5, between ends of Steps 2 and 5.
Table 4.11. Index of wax patterns and castings
Part index No. of holes in part Part no. 0b1 — 1 0b2 — 2 2b1 2 1 *2b2 2 2
*The last step in the casting was incompletely filled and dimensions were not measured
The dimensional variations for the casting were calculated using the following relationship:
Casting shrinkage (cs)= Pattern dimensions- Casting Dimensions (4.6)
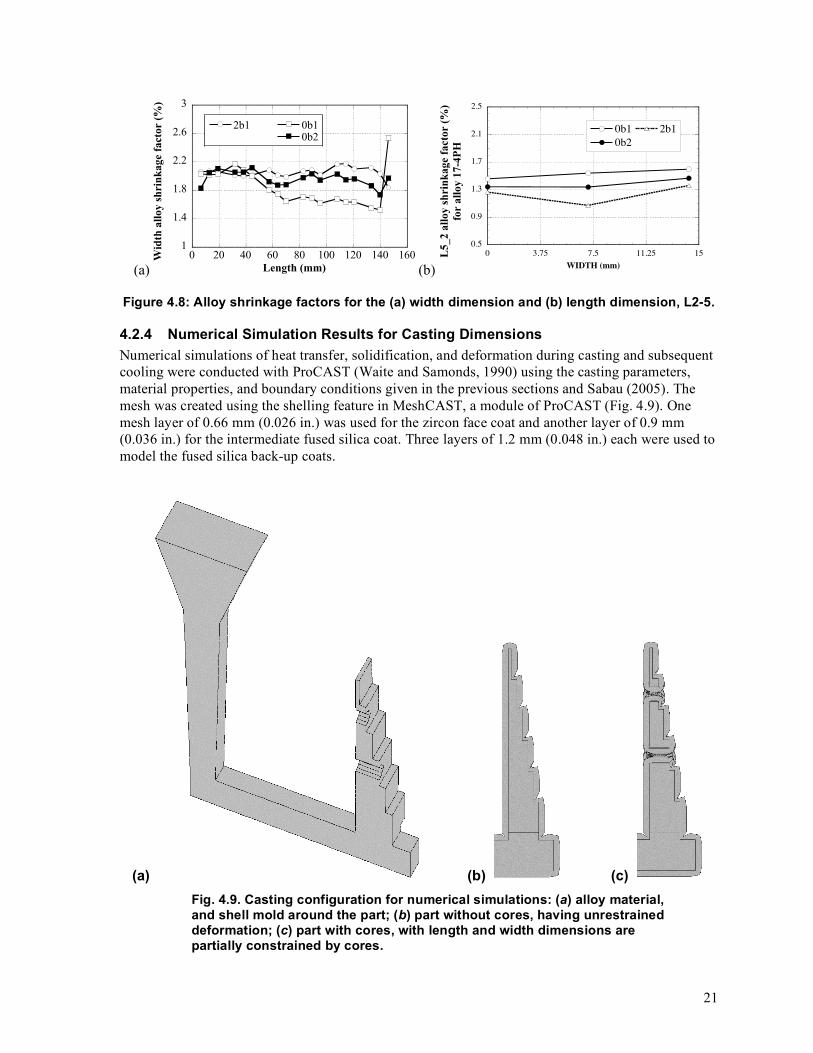
The percentage of the shrinkage was calculated for the width dimension and length dimension (Figures 4.8). The width shrinkage was almost the same for cases 2b1 and 0b2. Part 0b1 showed lower shrinkage factors for steps 3, 4, 5, and 6, than the other two parts. For the L2_5 dimension, the points with a zero width coordinate were located on the symmetry plane of the patterns, or centerline. The shrinkage was minimal at the centerline and largest at the edges. Smaller length shrinkage was measured for the restrained pattern, case 2b1. As indicated in Figure 4.8b for the case of overall casting shrinkage, the unrestrained parts shrink more than the restrained ones. The following general observations can be made concerning the dimensional measurements: (a) the width shrinkage factors were almost uniform, (b) the length shrinkage factors were larger at the edges than at the centerline, (c) the dimension, L2_5, for the two-hole restrained part showed smaller shrinkage than the unrestrained part.
21
(a)
1
1.4
1.8
2.2
2.6
3
0 20 40 60 80 100 120 140 160
2b1
2b2
0b1
0b2
Wid
th a
llo
y s
hri
nk
ag
e fa
cto
r (%
)
Length (mm) (b)
0.5
0.9
1.3
1.7
2.1
2.5
0 3.75 7.5 11.25 15
0b1
0b2
2b1
L5
_2
all
oy
sh
rin
kag
e fa
cto
r (%
)
for
all
oy
17
-4P
H
WIDTH (mm)
Figure 4.8: Alloy shrinkage factors for the (a) width dimension and (b) length dimension, L2-5.
4.2.4 Numerical Simulation Results for Casting Dimensions Numerical simulations of heat transfer, solidification, and deformation during casting and subsequent cooling were conducted with ProCAST (Waite and Samonds, 1990) using the casting parameters, material properties, and boundary conditions given in the previous sections and Sabau (2005). The mesh was created using the shelling feature in MeshCAST, a module of ProCAST (Fig. 4.9). One mesh layer of 0.66 mm (0.026 in.) was used for the zircon face coat and another layer of 0.9 mm (0.036 in.) for the intermediate fused silica coat. Three layers of 1.2 mm (0.048 in.) each were used to model the fused silica back-up coats.
(a) (b) (c) Fig. 4.9. Casting configuration for numerical simulations: (a) alloy material, and shell mold around the part; (b) part without cores, having unrestrained deformation; (c) part with cores, with length and width dimensions are partially constrained by cores.
22
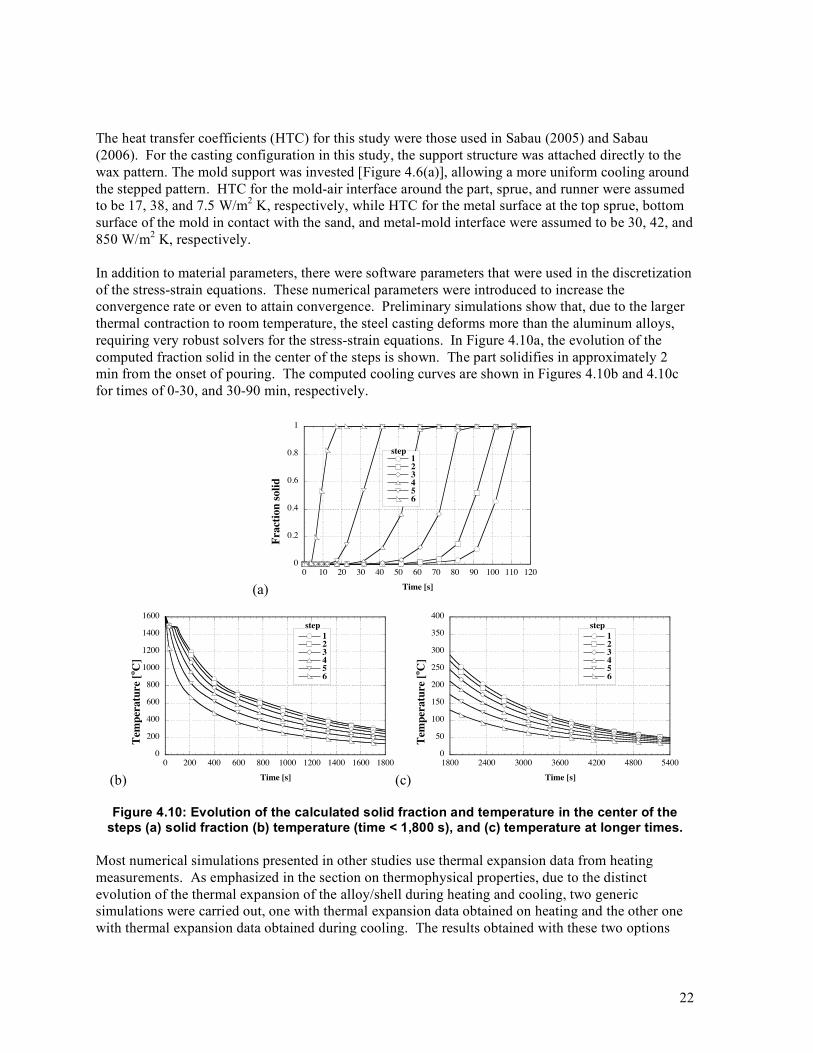
The heat transfer coefficients (HTC) for this study were those used in Sabau (2005) and Sabau (2006). For the casting configuration in this study, the support structure was attached directly to the wax pattern. The mold support was invested [Figure 4.6(a)], allowing a more uniform cooling around the stepped pattern. HTC for the mold-air interface around the part, sprue, and runner were assumed to be 17, 38, and 7.5 W/m2 K, respectively, while HTC for the metal surface at the top sprue, bottom surface of the mold in contact with the sand, and metal-mold interface were assumed to be 30, 42, and 850 W/m2 K, respectively. In addition to material parameters, there were software parameters that were used in the discretization of the stress-strain equations. These numerical parameters were introduced to increase the convergence rate or even to attain convergence. Preliminary simulations show that, due to the larger thermal contraction to room temperature, the steel casting deforms more than the aluminum alloys, requiring very robust solvers for the stress-strain equations. In Figure 4.10a, the evolution of the computed fraction solid in the center of the steps is shown. The part solidifies in approximately 2 min from the onset of pouring. The computed cooling curves are shown in Figures 4.10b and 4.10c for times of 0-30, and 30-90 min, respectively.
(a)
0
0.2
0.4
0.6
0.8
1
0 10 20 30 40 50 60 70 80 90 100 110 120
123456
Fra
ctio
n s
oli
d
Time [s]
step
(b)
0
200
400
600
800
1000
1200
1400
1600
0 200 400 600 800 1000 1200 1400 1600 1800
123456
Tem
per
atu
re [
oC
]
Time [s]
step
(c)
0
50
100
150
200
250
300
350
400
1800 2400 3000 3600 4200 4800 5400
123456
Tem
per
atu
re [
oC
]
Time [s]
step
Figure 4.10: Evolution of the calculated solid fraction and temperature in the center of the steps (a) solid fraction (b) temperature (time < 1,800 s), and (c) temperature at longer times.
Most numerical simulations presented in other studies use thermal expansion data from heating measurements. As emphasized in the section on thermophysical properties, due to the distinct evolution of the thermal expansion of the alloy/shell during heating and cooling, two generic simulations were carried out, one with thermal expansion data obtained on heating and the other one with thermal expansion data obtained during cooling. The results obtained with these two options
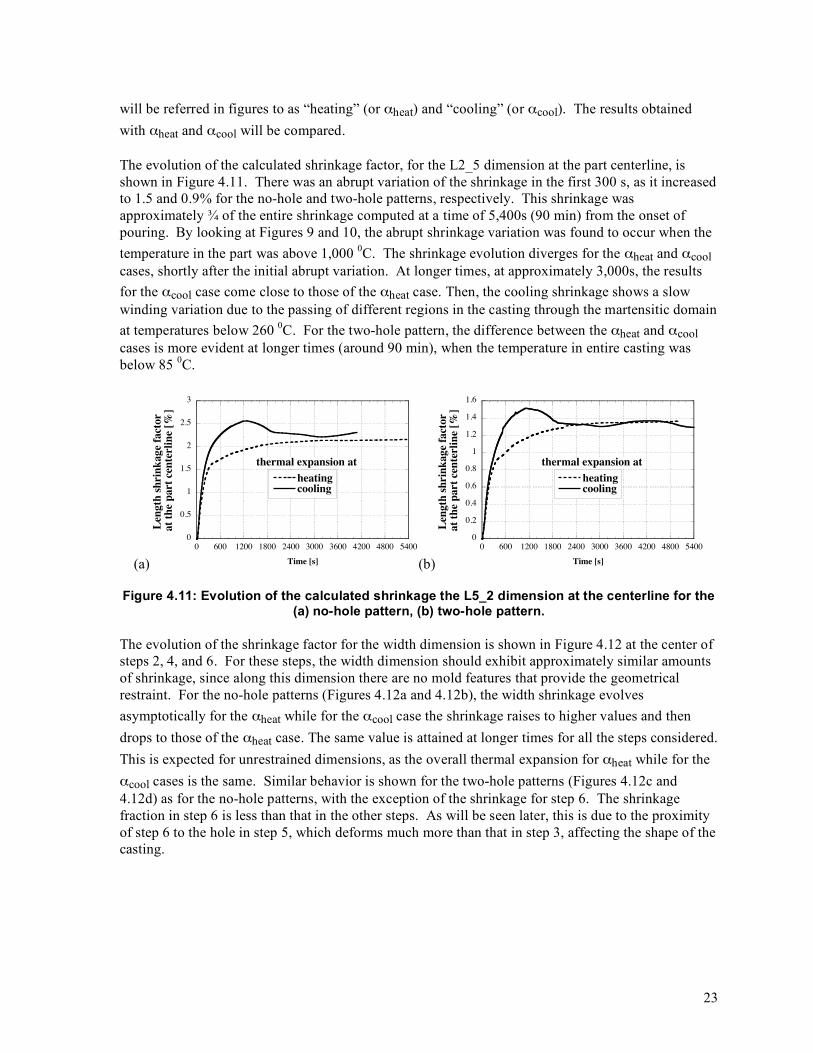
23
will be referred in figures to as “heating” (or αheat) and “cooling” (or αcool). The results obtained with αheat and αcool will be compared. The evolution of the calculated shrinkage factor, for the L2_5 dimension at the part centerline, is shown in Figure 4.11. There was an abrupt variation of the shrinkage in the first 300 s, as it increased to 1.5 and 0.9% for the no-hole and two-hole patterns, respectively. This shrinkage was approximately ¾ of the entire shrinkage computed at a time of 5,400s (90 min) from the onset of pouring. By looking at Figures 9 and 10, the abrupt shrinkage variation was found to occur when the temperature in the part was above 1,000 0C. The shrinkage evolution diverges for the αheat and αcool cases, shortly after the initial abrupt variation. At longer times, at approximately 3,000s, the results for the αcool case come close to those of the αheat case. Then, the cooling shrinkage shows a slow winding variation due to the passing of different regions in the casting through the martensitic domain at temperatures below 260 0C. For the two-hole pattern, the difference between the αheat and αcool cases is more evident at longer times (around 90 min), when the temperature in entire casting was below 85 0C.
(a)
0
0.5
1
1.5
2
2.5
3
0 600 1200 1800 2400 3000 3600 4200 4800 5400
heatingcooling
Len
gth
sh
rin
kag
e fa
ctor
at
the
pa
rt c
ente
rlin
e [%
]
Time [s]
thermal expansion at
(b)
0
0.2
0.4
0.6
0.8
1
1.2
1.4
1.6
0 600 1200 1800 2400 3000 3600 4200 4800 5400
heatingcooling
Len
gth
sh
rin
kag
e fa
ctor
at
the
pa
rt c
ente
rlin
e [%
]
Time [s]
thermal expansion at
Figure 4.11: Evolution of the calculated shrinkage the L5_2 dimension at the centerline for the (a) no-hole pattern, (b) two-hole pattern.
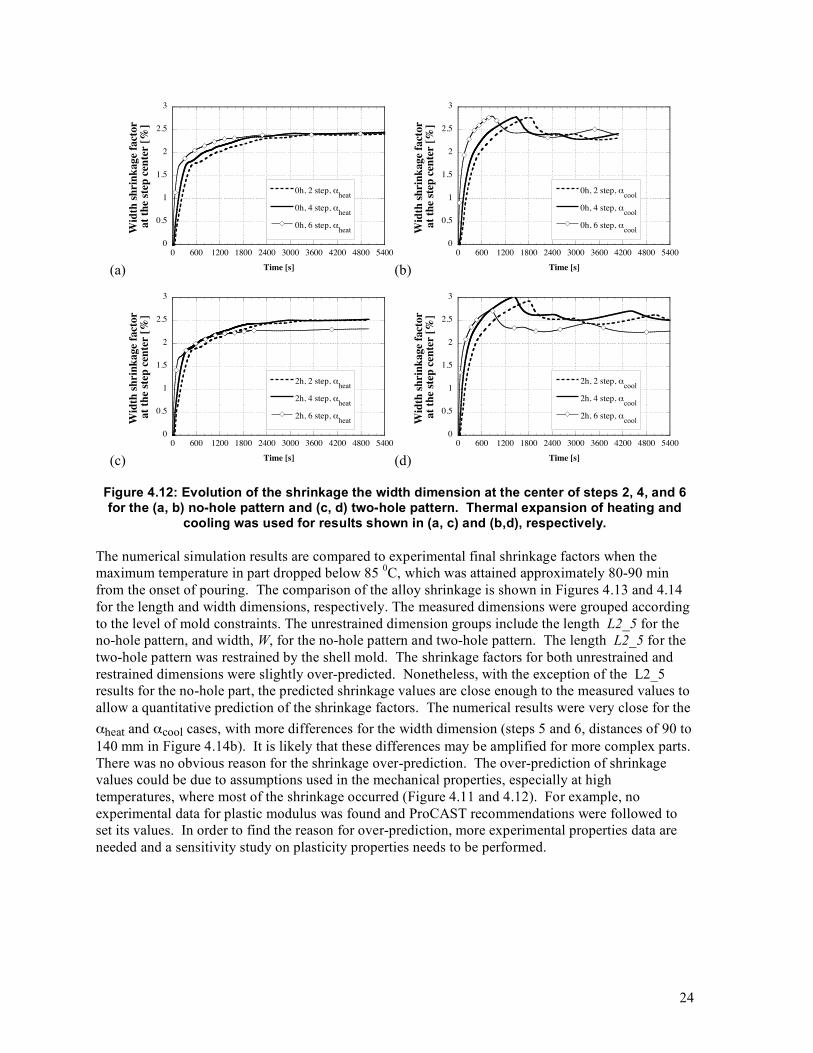
The evolution of the shrinkage factor for the width dimension is shown in Figure 4.12 at the center of steps 2, 4, and 6. For these steps, the width dimension should exhibit approximately similar amounts of shrinkage, since along this dimension there are no mold features that provide the geometrical restraint. For the no-hole patterns (Figures 4.12a and 4.12b), the width shrinkage evolves asymptotically for the αheat while for the αcool case the shrinkage raises to higher values and then drops to those of the αheat case. The same value is attained at longer times for all the steps considered. This is expected for unrestrained dimensions, as the overall thermal expansion for αheat while for the αcool cases is the same. Similar behavior is shown for the two-hole patterns (Figures 4.12c and 4.12d) as for the no-hole patterns, with the exception of the shrinkage for step 6. The shrinkage fraction in step 6 is less than that in the other steps. As will be seen later, this is due to the proximity of step 6 to the hole in step 5, which deforms much more than that in step 3, affecting the shape of the casting.
24
(a)
0
0.5
1
1.5
2
2.5
3
0 600 1200 1800 2400 3000 3600 4200 4800 5400
0h, 2 step, !heat
0h, 4 step, !heat
0h, 6 step, !heatW
idth
sh
rin
ka
ge
fact
or
at
the
step
cen
ter
[%]
Time [s] (b)
0
0.5
1
1.5
2
2.5
3
0 600 1200 1800 2400 3000 3600 4200 4800 5400
0h, 2 step, !cool
0h, 4 step, !cool
0h, 6 step, !coolW
idth
sh
rin
ka
ge
fact
or
at
the
step
cen
ter
[%]
Time [s]
(c)
0
0.5
1
1.5
2
2.5
3
0 600 1200 1800 2400 3000 3600 4200 4800 5400
2h, 2 step, !heat
2h, 4 step, !heat
2h, 6 step, !heatW
idth
sh
rin
ka
ge
fact
or
at
the
step
cen
ter
[%]
Time [s] (d)
0
0.5
1
1.5
2
2.5
3
0 600 1200 1800 2400 3000 3600 4200 4800 5400
2h, 2 step, !cool
2h, 4 step, !cool
2h, 6 step, !coolW
idth
sh
rin
ka
ge
fact
or
at
the
step
cen
ter
[%]
Time [s]
Figure 4.12: Evolution of the shrinkage the width dimension at the center of steps 2, 4, and 6 for the (a, b) no-hole pattern and (c, d) two-hole pattern. Thermal expansion of heating and
cooling was used for results shown in (a, c) and (b,d), respectively. The numerical simulation results are compared to experimental final shrinkage factors when the maximum temperature in part dropped below 85 0C, which was attained approximately 80-90 min from the onset of pouring. The comparison of the alloy shrinkage is shown in Figures 4.13 and 4.14 for the length and width dimensions, respectively. The measured dimensions were grouped according to the level of mold constraints. The unrestrained dimension groups include the length L2_5 for the no-hole pattern, and width, W, for the no-hole pattern and two-hole pattern. The length L2_5 for the two-hole pattern was restrained by the shell mold. The shrinkage factors for both unrestrained and restrained dimensions were slightly over-predicted. Nonetheless, with the exception of the L2_5 results for the no-hole part, the predicted shrinkage values are close enough to the measured values to allow a quantitative prediction of the shrinkage factors. The numerical results were very close for the αheat and αcool cases, with more differences for the width dimension (steps 5 and 6, distances of 90 to 140 mm in Figure 4.14b). It is likely that these differences may be amplified for more complex parts. There was no obvious reason for the shrinkage over-prediction. The over-prediction of shrinkage values could be due to assumptions used in the mechanical properties, especially at high temperatures, where most of the shrinkage occurred (Figure 4.11 and 4.12). For example, no experimental data for plastic modulus was found and ProCAST recommendations were followed to set its values. In order to find the reason for over-prediction, more experimental properties data are needed and a sensitivity study on plasticity properties needs to be performed.
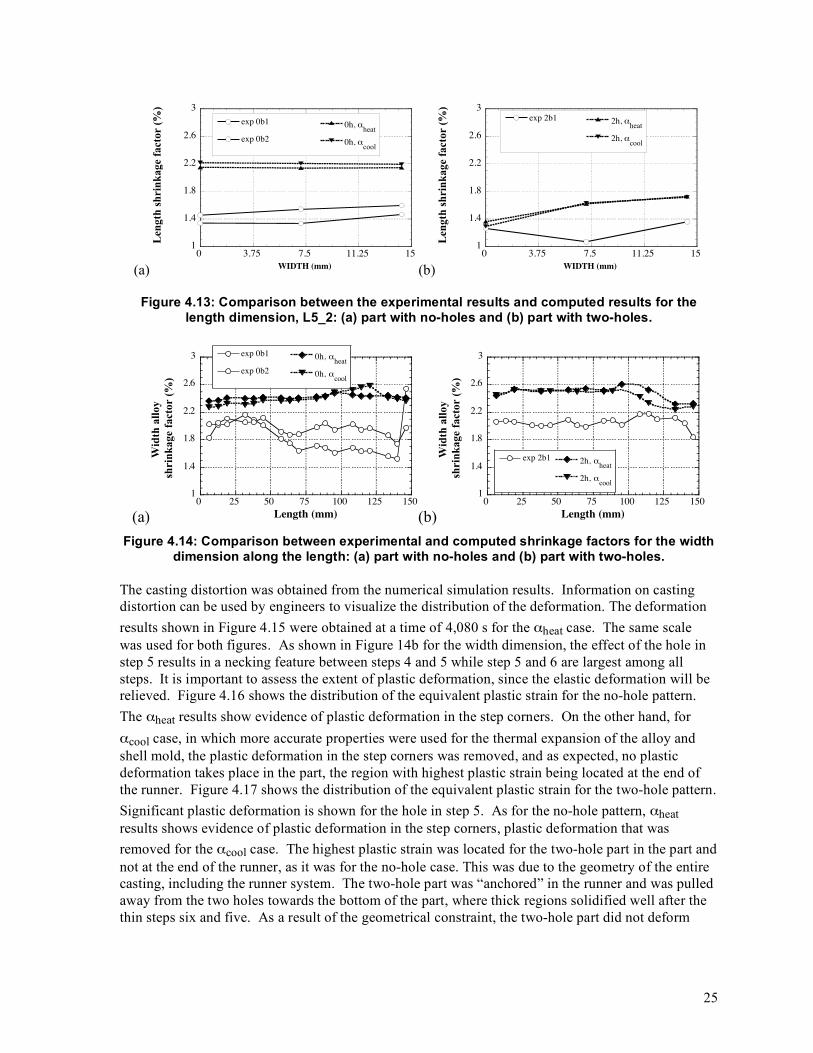
25
(a)
1
1.4
1.8
2.2
2.6
3
0 3.75 7.5 11.25 15
exp 0b1
exp 0b2
0h, !heat
0h, !cool
Len
gth
sh
rin
ka
ge
fact
or
(%)
WIDTH (mm) (b)
1
1.4
1.8
2.2
2.6
3
0 3.75 7.5 11.25 15
exp 2b1 2h, !heat
2h, !cool
Len
gth
sh
rin
ka
ge
fact
or
(%)
WIDTH (mm)
Figure 4.13: Comparison between the experimental results and computed results for the length dimension, L5_2: (a) part with no-holes and (b) part with two-holes.
(a)1
1.4
1.8
2.2
2.6
3
0 25 50 75 100 125 150
exp 0b1
exp 0b2
0h, !heat
0h, !cool
Wid
th a
llo
y
shri
nk
ag
e fa
cto
r (%
)
Length (mm) (b)1
1.4
1.8
2.2
2.6
3
0 25 50 75 100 125 150
exp 2b1
StW2b2
2h, !heat
2h, !cool
Wid
th a
llo
y
shri
nk
ag
e fa
cto
r (%
)
Length (mm) Figure 4.14: Comparison between experimental and computed shrinkage factors for the width
dimension along the length: (a) part with no-holes and (b) part with two-holes. The casting distortion was obtained from the numerical simulation results. Information on casting distortion can be used by engineers to visualize the distribution of the deformation. The deformation results shown in Figure 4.15 were obtained at a time of 4,080 s for the αheat case. The same scale was used for both figures. As shown in Figure 14b for the width dimension, the effect of the hole in step 5 results in a necking feature between steps 4 and 5 while step 5 and 6 are largest among all steps. It is important to assess the extent of plastic deformation, since the elastic deformation will be relieved. Figure 4.16 shows the distribution of the equivalent plastic strain for the no-hole pattern. The αheat results show evidence of plastic deformation in the step corners. On the other hand, for αcool case, in which more accurate properties were used for the thermal expansion of the alloy and shell mold, the plastic deformation in the step corners was removed, and as expected, no plastic deformation takes place in the part, the region with highest plastic strain being located at the end of the runner. Figure 4.17 shows the distribution of the equivalent plastic strain for the two-hole pattern. Significant plastic deformation is shown for the hole in step 5. As for the no-hole pattern, αheat results shows evidence of plastic deformation in the step corners, plastic deformation that was removed for the αcool case. The highest plastic strain was located for the two-hole part in the part and not at the end of the runner, as it was for the no-hole case. This was due to the geometry of the entire casting, including the runner system. The two-hole part was “anchored” in the runner and was pulled away from the two holes towards the bottom of the part, where thick regions solidified well after the thin steps six and five. As a result of the geometrical constraint, the two-hole part did not deform
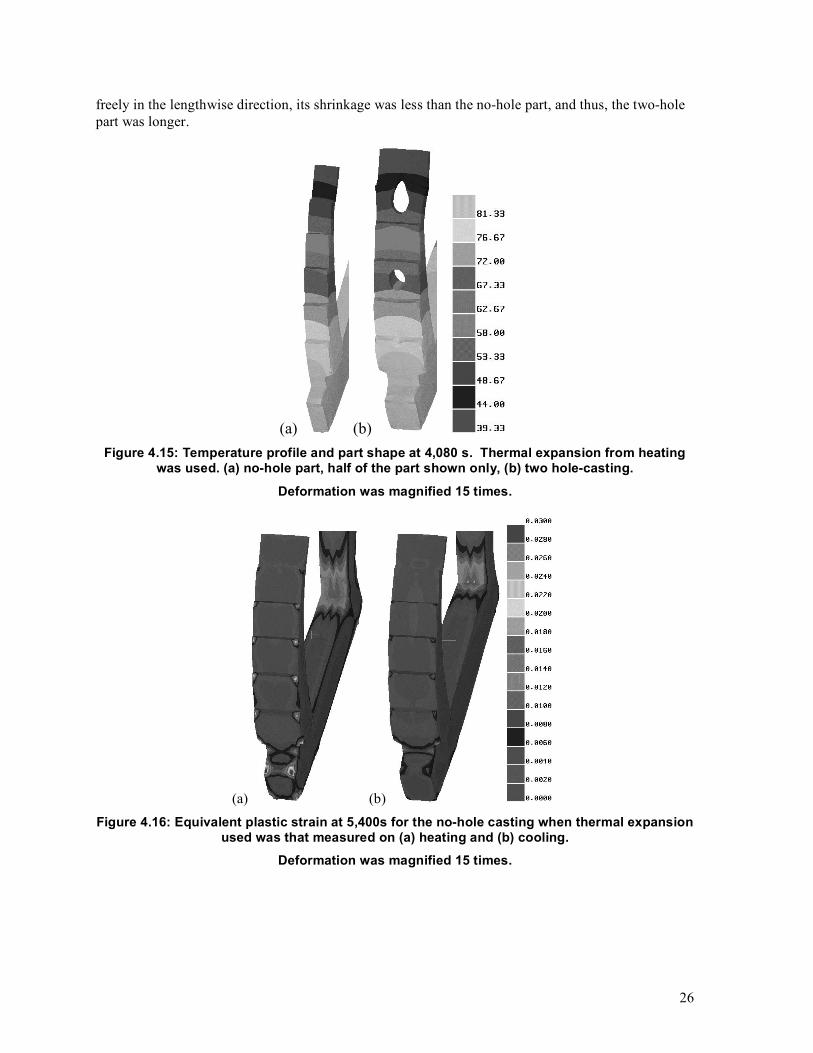
26
freely in the lengthwise direction, its shrinkage was less than the no-hole part, and thus, the two-hole part was longer.
(a) (b) Figure 4.15: Temperature profile and part shape at 4,080 s. Thermal expansion from heating
was used. (a) no-hole part, half of the part shown only, (b) two hole-casting.
Deformation was magnified 15 times.
(a) (b) Figure 4.16: Equivalent plastic strain at 5,400s for the no-hole casting when thermal expansion
used was that measured on (a) heating and (b) cooling.
Deformation was magnified 15 times.
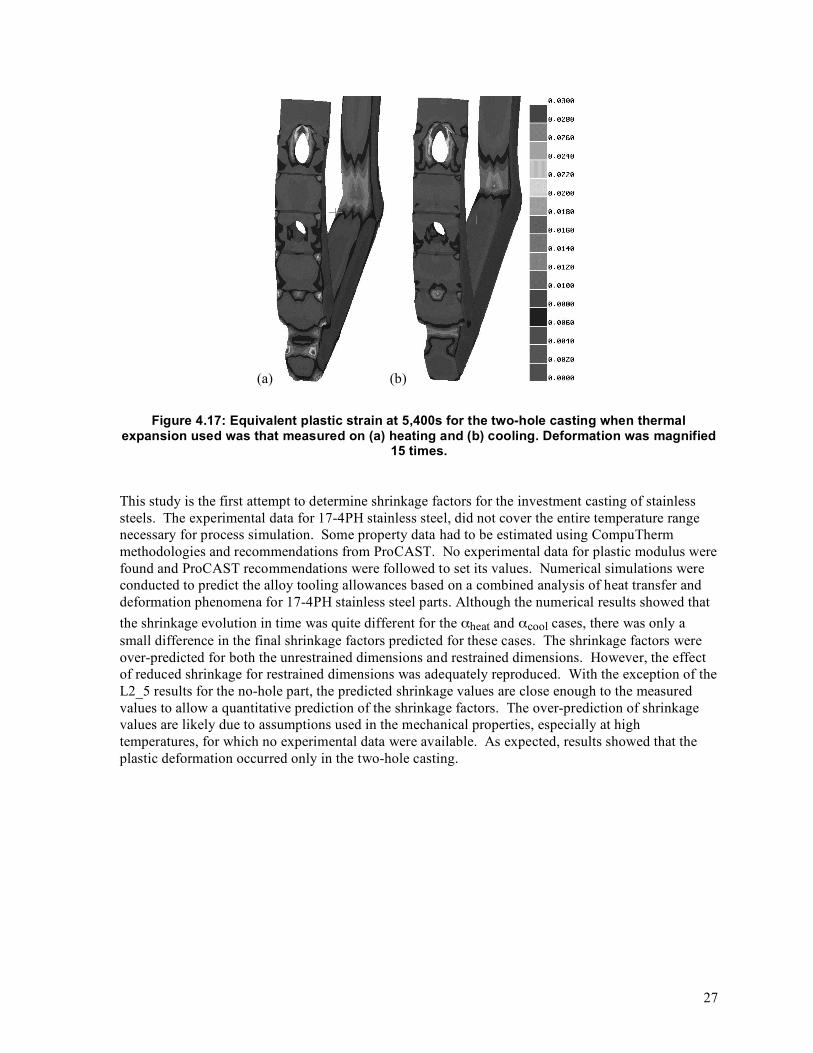
27
(a) (b)
Figure 4.17: Equivalent plastic strain at 5,400s for the two-hole casting when thermal expansion used was that measured on (a) heating and (b) cooling. Deformation was magnified
15 times. This study is the first attempt to determine shrinkage factors for the investment casting of stainless steels. The experimental data for 17-4PH stainless steel, did not cover the entire temperature range necessary for process simulation. Some property data had to be estimated using CompuTherm methodologies and recommendations from ProCAST. No experimental data for plastic modulus were found and ProCAST recommendations were followed to set its values. Numerical simulations were conducted to predict the alloy tooling allowances based on a combined analysis of heat transfer and deformation phenomena for 17-4PH stainless steel parts. Although the numerical results showed that the shrinkage evolution in time was quite different for the αheat and αcool cases, there was only a small difference in the final shrinkage factors predicted for these cases. The shrinkage factors were over-predicted for both the unrestrained dimensions and restrained dimensions. However, the effect of reduced shrinkage for restrained dimensions was adequately reproduced. With the exception of the L2_5 results for the no-hole part, the predicted shrinkage values are close enough to the measured values to allow a quantitative prediction of the shrinkage factors. The over-prediction of shrinkage values are likely due to assumptions used in the mechanical properties, especially at high temperatures, for which no experimental data were available. As expected, results showed that the plastic deformation occurred only in the two-hole casting.
28
4.3 Measurements of Material Properties for Filled Waxes Additional R&D focus was placed on obtaining material property data for filled waxes, waxes that are common in the industry. The wax pattern dimensions are determined by the wax’s thermophysical and thermomechanical properties, restraint of geometrical features by the metal die, and process parameters such as die temperature, platen temperature, injection pressure, injection temperature, and dwell time. In this report, material property data that is needed to determine dimensional changes associated with the wax system are provided. The following waxes were chosen by participating companies for testing: Cerita F20-6, Cerita F20-844B, and Remet PR-15. For Cerita F20-6 wax, the filler was terepthalic acid, filler weight 42%, and filler volume of 31.6 %. The test bar mold was fabricated by Independent Tool, Inc. Test bars specimens of three waxes were injected at Schrey & Sons, Inc and McCaughin, Inc., commercial foundries. Rheometry measurement of filled waxes was conducted at ORNL. Material property measurements were conducted in this study for three filled waxes with the aim of obtaining a complete set of data that can be used as input in computer simulation software for predicting wax pattern dimensions. The measurement of viscoelastic properties of waxes is not a trivial task since the investment casting waxes are complex blend of polymers that exhibit a wide range of behaviors. The analysis of the rheometry data to obtain viscoelastic properties was not completed due to the reduction in the budget of the project (approximately 50% funds were received).
4.3.1 Thermophysical Properties of Waxes In order to predict wax tooling allowances, all the properties that determine dimensional changes associated with wax processing must be evaluated. The Investment Casting Institute developed standard tests for the investment casting industry. For waxes, most of these tests are concerned with engineering properties, such as flow, softening point, strength, and sink. The available tests provide the information only for handling and processing wax patterns but are not useful for die design. Data provided by the suppliers contains information on wax properties (Table 4.12), dimensional characteristics (Table 4.13), and operating conditions (Table 4.14). Aside from specific heat, which is necessary for thermal analysis, and thermal expansion property, none of the other data can be used to predict the shrinkage of complex investment casting patterns. Specific heat and thermal conductivity was measured for all the waxes considered (Figure 4.18). The results for the unfilled wax, CeritaTM 29-51, were also reported in Figure 4.18 for comparison with the other filled waxes.
Table 4.12. Properties for the F20-6 wax provided by the wax supplier. Property Value ring & ball softening point 159.5 oF / 70.8 oC drop melt point 178.2 oF / 81.2 oC hardness 450 grm. load 14.5 DMM specific gravity 1.129 ash content (1800 oF/982c, 30 min) 0.0015% filler content 42.0% Viscosity table data Specific heat (and DSC data) table data Thermal expansion table data
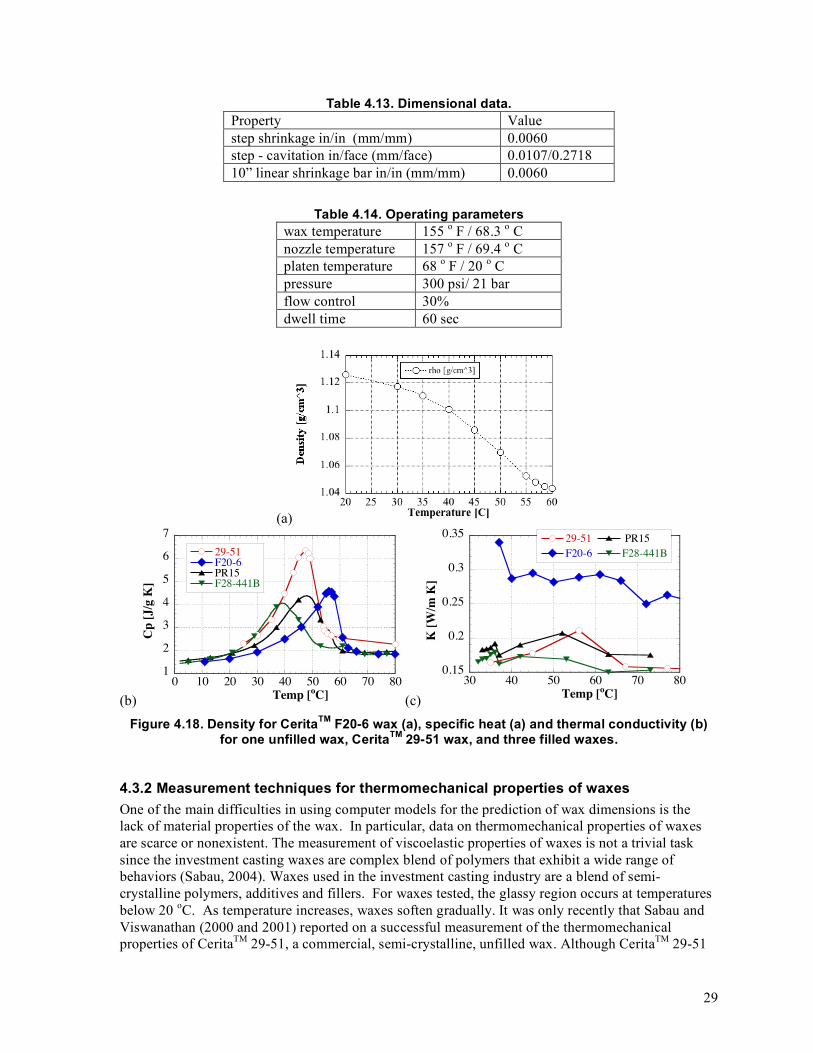
29
Table 4.13. Dimensional data. Property Value step shrinkage in/in (mm/mm) 0.0060 step - cavitation in/face (mm/face) 0.0107/0.2718 10” linear shrinkage bar in/in (mm/mm) 0.0060
Table 4.14. Operating parameters wax temperature 155 o F / 68.3 o C nozzle temperature 157 o F / 69.4 o C platen temperature 68 o F / 20 o C pressure 300 psi/ 21 bar flow control 30% dwell time 60 sec
(a)
(b)
1
2
3
4
5
6
7
0 10 20 30 40 50 60 70 80
29-51
F20-6
PR15
F28-441B
Cp
[J/g
K]
Temp [oC] (c)
0.15
0.2
0.25
0.3
0.35
30 40 50 60 70 80
29-51
F20-6
PR15
F28-441B
K [
W/m
K]
Temp [oC] Figure 4.18. Density for CeritaTM F20-6 wax (a), specific heat (a) and thermal conductivity (b)
for one unfilled wax, CeritaTM 29-51 wax, and three filled waxes.
4.3.2 Measurement techniques for thermomechanical properties of waxes One of the main difficulties in using computer models for the prediction of wax dimensions is the lack of material properties of the wax. In particular, data on thermomechanical properties of waxes are scarce or nonexistent. The measurement of viscoelastic properties of waxes is not a trivial task since the investment casting waxes are complex blend of polymers that exhibit a wide range of behaviors (Sabau, 2004). Waxes used in the investment casting industry are a blend of semi-crystalline polymers, additives and fillers. For waxes tested, the glassy region occurs at temperatures below 20 oC. As temperature increases, waxes soften gradually. It was only recently that Sabau and Viswanathan (2000 and 2001) reported on a successful measurement of the thermomechanical properties of CeritaTM 29-51, a commercial, semi-crystalline, unfilled wax. Although CeritaTM 29-51
30
wax is a semicrystalline material, Sabau and Viswanathan (2000 and 2001) showed that in a paste state, the wax is a thermo-rheologically simple material that obeys the time-temperature superposition principle. As waxes are viscoelastic materials, their thermomechanical properties can be determined using measurements techniques that were developed for polymers, such as dynamical mechanical analysis (DMA) measurements (Menard, 1999). In (DMA) tests, an oscillatory strain is applied to the material and the resulting stress is separated into elastic and viscous components. There are several ASTM standards for conducting DMA measurements and other industries have their own standards (Table 4.15).
Table 4.15 ASTM Standard for the DMA. ASTM Standard Test description D4440 Measurement of Polymer Melts D5023 DMA in Three Point Bending D5024 DMA in Compression D5026 DMA in Tension D5279 DMA of Plastics in Tension D5418 DMA in Dual Cantilever D6648-01 BBR*: Flexural Creep Stiffness of Asphalt Binder
(Standard) D4 P 245 BBR: Flexural Creep Stiffness of Asphalt Binder (Test)
*BBR Flexural Creep Stiffness of Asphalt Binder The wax material was tested using various fixtures and different instruments with higher sensitivity until appropriate test instruments, procedures, and fixtures were identified (Table 4.16). In Table 4.16, few other measurement techniques used in the investment casting community were also included. Based on our experience in measuring the viscoelastic properties of waxes and review of polymer testing, tests and fixtures, which we recommend for wax testing, are highlighted in Table 4.17. The tests and fixtures depend on material consistency. It was observed that waxes exhibit a transition from a soft paste to that of a viscous liquid with less elasticity at a certain temperature, which is less than the melting point. For the sake of simplicity we refer to that temperature as the softening point temperature, TSP. TSP is given by the temperature at which the thermal expansion curve and DSC curve attain their peaks. TSP can be associated with either an α transition for the crystalline component of the wax or a transition in the amorphous component of the wax. The former is due to the slippage of the crystallites past each other while the latter is related to the movement of coordinated segments reducing the viscosity (Menard, 1999).
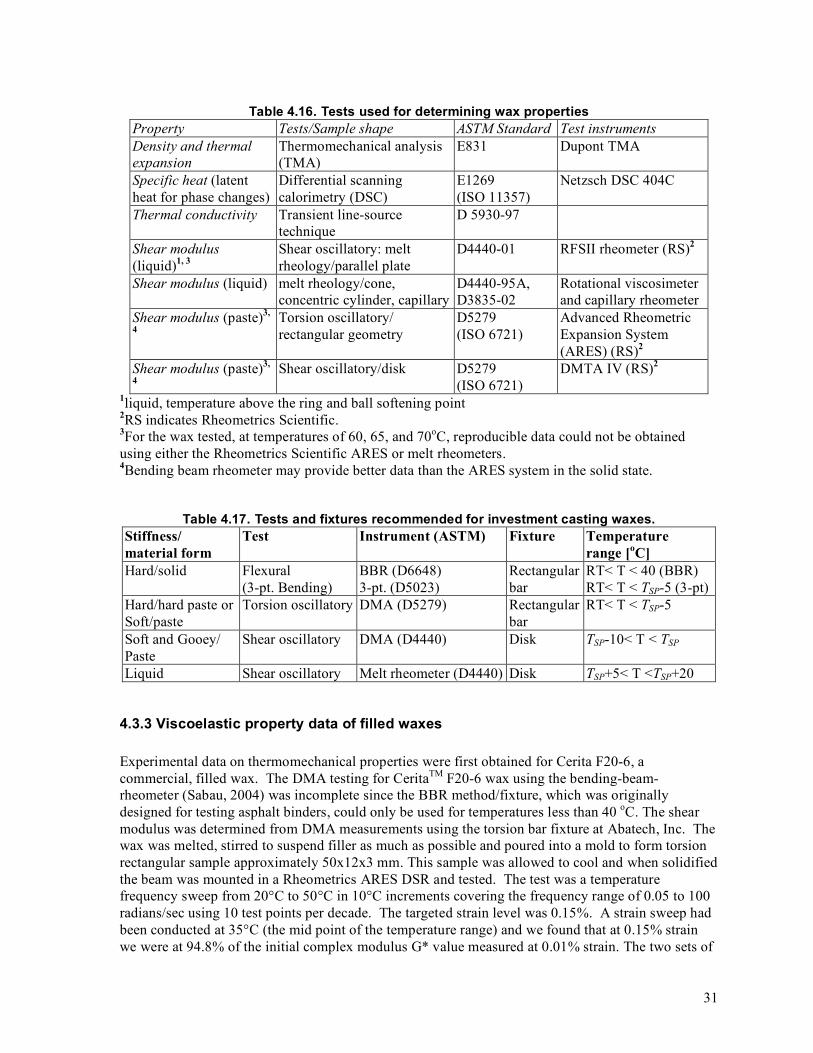
31
Table 4.16. Tests used for determining wax properties Property Tests/Sample shape ASTM Standard Test instruments Density and thermal expansion
Thermomechanical analysis (TMA)
E831 Dupont TMA
Specific heat (latent heat for phase changes)
Differential scanning calorimetry (DSC)
E1269 (ISO 11357)
Netzsch DSC 404C
Thermal conductivity Transient line-source technique
D 5930-97
Shear modulus (liquid)1, 3
Shear oscillatory: melt rheology/parallel plate
D4440-01 RFSII rheometer (RS)2
Shear modulus (liquid) melt rheology/cone, concentric cylinder, capillary
D4440-95A, D3835-02
Rotational viscosimeter and capillary rheometer
Shear modulus (paste)3,
4 Torsion oscillatory/ rectangular geometry
D5279 (ISO 6721)
Advanced Rheometric Expansion System (ARES) (RS)2
Shear modulus (paste)3,
4 Shear oscillatory/disk D5279
(ISO 6721) DMTA IV (RS)2
1liquid, temperature above the ring and ball softening point 2RS indicates Rheometrics Scientific. 3For the wax tested, at temperatures of 60, 65, and 70oC, reproducible data could not be obtained using either the Rheometrics Scientific ARES or melt rheometers. 4Bending beam rheometer may provide better data than the ARES system in the solid state.
Table 4.17. Tests and fixtures recommended for investment casting waxes. Stiffness/ material form
Test Instrument (ASTM) Fixture Temperature range [oC]
Hard/solid Flexural (3-pt. Bending)
BBR (D6648) 3-pt. (D5023)
Rectangular bar
RT< T < 40 (BBR) RT< T < TSP-5 (3-pt)
Hard/hard paste or Soft/paste
Torsion oscillatory DMA (D5279) Rectangular bar
RT< T < TSP-5
Soft and Gooey/ Paste
Shear oscillatory DMA (D4440) Disk TSP-10< T < TSP
Liquid Shear oscillatory Melt rheometer (D4440) Disk TSP+5< T <TSP+20
4.3.3 Viscoelastic property data of filled waxes Experimental data on thermomechanical properties were first obtained for Cerita F20-6, a commercial, filled wax. The DMA testing for CeritaTM F20-6 wax using the bending-beam-rheometer (Sabau, 2004) was incomplete since the BBR method/fixture, which was originally designed for testing asphalt binders, could only be used for temperatures less than 40 oC. The shear modulus was determined from DMA measurements using the torsion bar fixture at Abatech, Inc. The wax was melted, stirred to suspend filler as much as possible and poured into a mold to form torsion rectangular sample approximately 50x12x3 mm. This sample was allowed to cool and when solidified the beam was mounted in a Rheometrics ARES DSR and tested. The test was a temperature frequency sweep from 20°C to 50°C in 10°C increments covering the frequency range of 0.05 to 100 radians/sec using 10 test points per decade. The targeted strain level was 0.15%. A strain sweep had been conducted at 35°C (the mid point of the temperature range) and we found that at 0.15% strain we were at 94.8% of the initial complex modulus G* value measured at 0.01% strain. The two sets of
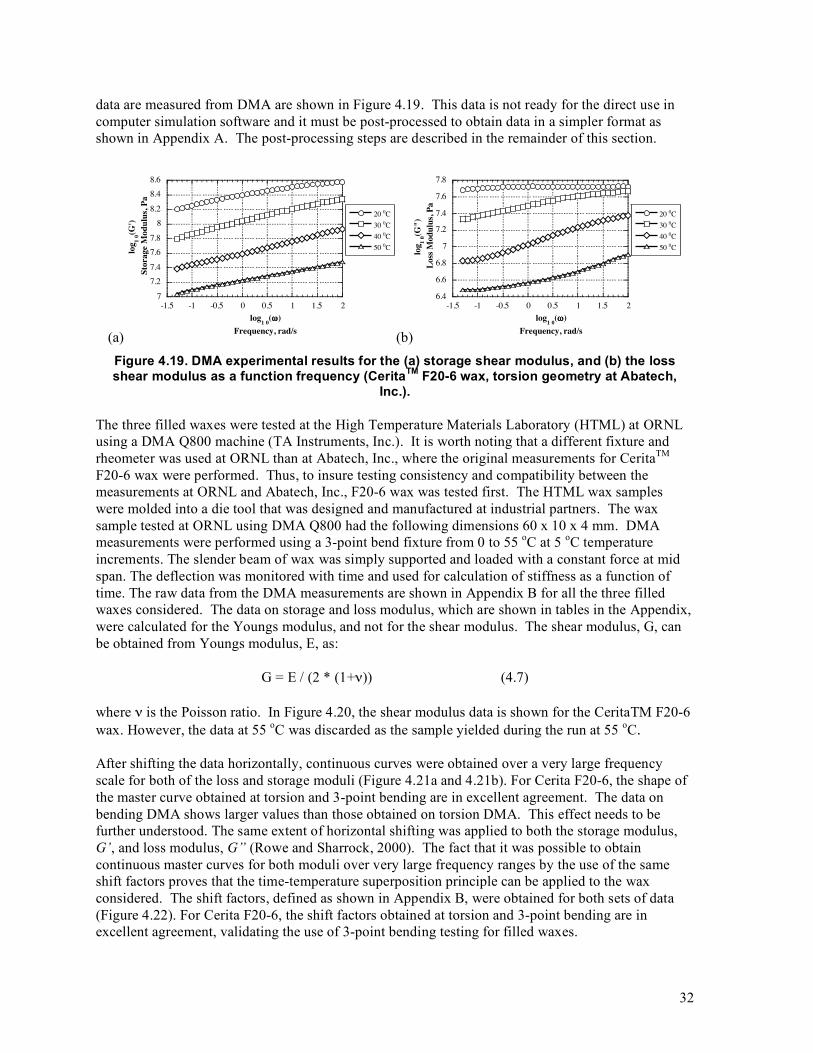
32
data are measured from DMA are shown in Figure 4.19. This data is not ready for the direct use in computer simulation software and it must be post-processed to obtain data in a simpler format as shown in Appendix A. The post-processing steps are described in the remainder of this section.
(a)
7
7.2
7.4
7.6
7.8
8
8.2
8.4
8.6
-1.5 -1 -0.5 0 0.5 1 1.5 2
20 0C
30 0C
40 0C
50 0Clo
g1
0(G
')
Sto
rag
e M
od
ulu
s, P
a
log1 0
(!)
Frequency, rad/s (b)
6.4
6.6
6.8
7
7.2
7.4
7.6
7.8
-1.5 -1 -0.5 0 0.5 1 1.5 2
20 0C
30 0C
40 0C
50 0C
log
10(G
")
Loss
Mod
ulu
s, P
a
log1 0
(!)
Frequency, rad/s Figure 4.19. DMA experimental results for the (a) storage shear modulus, and (b) the loss shear modulus as a function frequency (CeritaTM F20-6 wax, torsion geometry at Abatech,
Inc.).
The three filled waxes were tested at the High Temperature Materials Laboratory (HTML) at ORNL using a DMA Q800 machine (TA Instruments, Inc.). It is worth noting that a different fixture and rheometer was used at ORNL than at Abatech, Inc., where the original measurements for CeritaTM F20-6 wax were performed. Thus, to insure testing consistency and compatibility between the measurements at ORNL and Abatech, Inc., F20-6 wax was tested first. The HTML wax samples were molded into a die tool that was designed and manufactured at industrial partners. The wax sample tested at ORNL using DMA Q800 had the following dimensions 60 x 10 x 4 mm. DMA measurements were performed using a 3-point bend fixture from 0 to 55 oC at 5 oC temperature increments. The slender beam of wax was simply supported and loaded with a constant force at mid span. The deflection was monitored with time and used for calculation of stiffness as a function of time. The raw data from the DMA measurements are shown in Appendix B for all the three filled waxes considered. The data on storage and loss modulus, which are shown in tables in the Appendix, were calculated for the Youngs modulus, and not for the shear modulus. The shear modulus, G, can be obtained from Youngs modulus, E, as:
G = E / (2 * (1+ν)) (4.7) where ν is the Poisson ratio. In Figure 4.20, the shear modulus data is shown for the CeritaTM F20-6 wax. However, the data at 55 oC was discarded as the sample yielded during the run at 55 oC. After shifting the data horizontally, continuous curves were obtained over a very large frequency scale for both of the loss and storage moduli (Figure 4.21a and 4.21b). For Cerita F20-6, the shape of the master curve obtained at torsion and 3-point bending are in excellent agreement. The data on bending DMA shows larger values than those obtained on torsion DMA. This effect needs to be further understood. The same extent of horizontal shifting was applied to both the storage modulus, G’, and loss modulus, G” (Rowe and Sharrock, 2000). The fact that it was possible to obtain continuous master curves for both moduli over very large frequency ranges by the use of the same shift factors proves that the time-temperature superposition principle can be applied to the wax considered. The shift factors, defined as shown in Appendix B, were obtained for both sets of data (Figure 4.22). For Cerita F20-6, the shift factors obtained at torsion and 3-point bending are in excellent agreement, validating the use of 3-point bending testing for filled waxes.
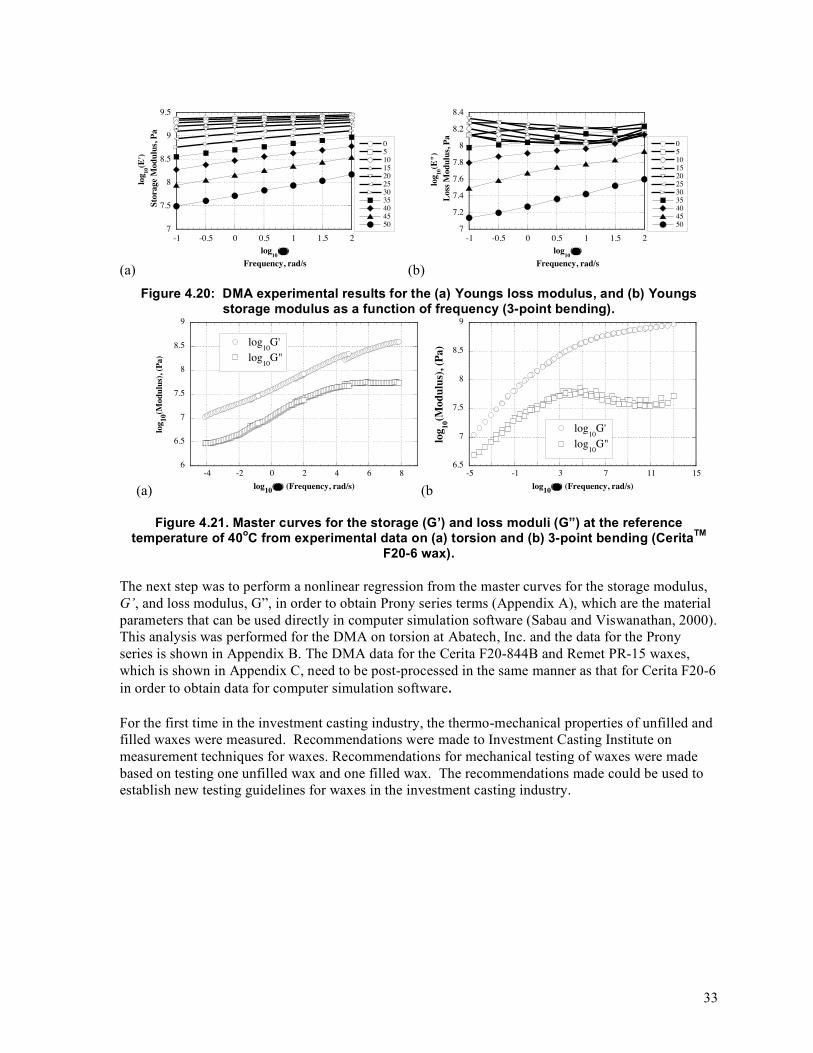
33
(a)
7
7.5
8
8.5
9
9.5
-1 -0.5 0 0.5 1 1.5 2
0
5
10
15
20
25
30
35
40
45
50
log
10(E
')
Sto
rage
Mod
ulu
s, P
a
log10
(!)
Frequency, rad/s (b)
7
7.2
7.4
7.6
7.8
8
8.2
8.4
-1 -0.5 0 0.5 1 1.5 2
0
5
10
15
20
25
30
35
40
45
50
log
10(E
")
Loss
Mod
ulu
s, P
a
log10
(!)
Frequency, rad/s Figure 4.20: DMA experimental results for the (a) Youngs loss modulus, and (b) Youngs
storage modulus as a function of frequency (3-point bending).
(a)
6
6.5
7
7.5
8
8.5
9
-4 -2 0 2 4 6 8
log10G'
log10G"
log
10(M
od
ulu
s), (P
a)
log10
(!) (Frequency, rad/s) (b
6.5
7
7.5
8
8.5
9
-5 -1 3 7 11 15
log10G'
log10G"lo
g1
0(M
od
ulu
s),
(Pa)
log10
(!) (Frequency, rad/s)
Figure 4.21. Master curves for the storage (G’) and loss moduli (G”) at the reference temperature of 40oC from experimental data on (a) torsion and (b) 3-point bending (CeritaTM
F20-6 wax). The next step was to perform a nonlinear regression from the master curves for the storage modulus, G’, and loss modulus, G”, in order to obtain Prony series terms (Appendix A), which are the material parameters that can be used directly in computer simulation software (Sabau and Viswanathan, 2000). This analysis was performed for the DMA on torsion at Abatech, Inc. and the data for the Prony series is shown in Appendix B. The DMA data for the Cerita F20-844B and Remet PR-15 waxes, which is shown in Appendix C, need to be post-processed in the same manner as that for Cerita F20-6 in order to obtain data for computer simulation software. For the first time in the investment casting industry, the thermo-mechanical properties of unfilled and filled waxes were measured. Recommendations were made to Investment Casting Institute on measurement techniques for waxes. Recommendations for mechanical testing of waxes were made based on testing one unfilled wax and one filled wax. The recommendations made could be used to establish new testing guidelines for waxes in the investment casting industry.
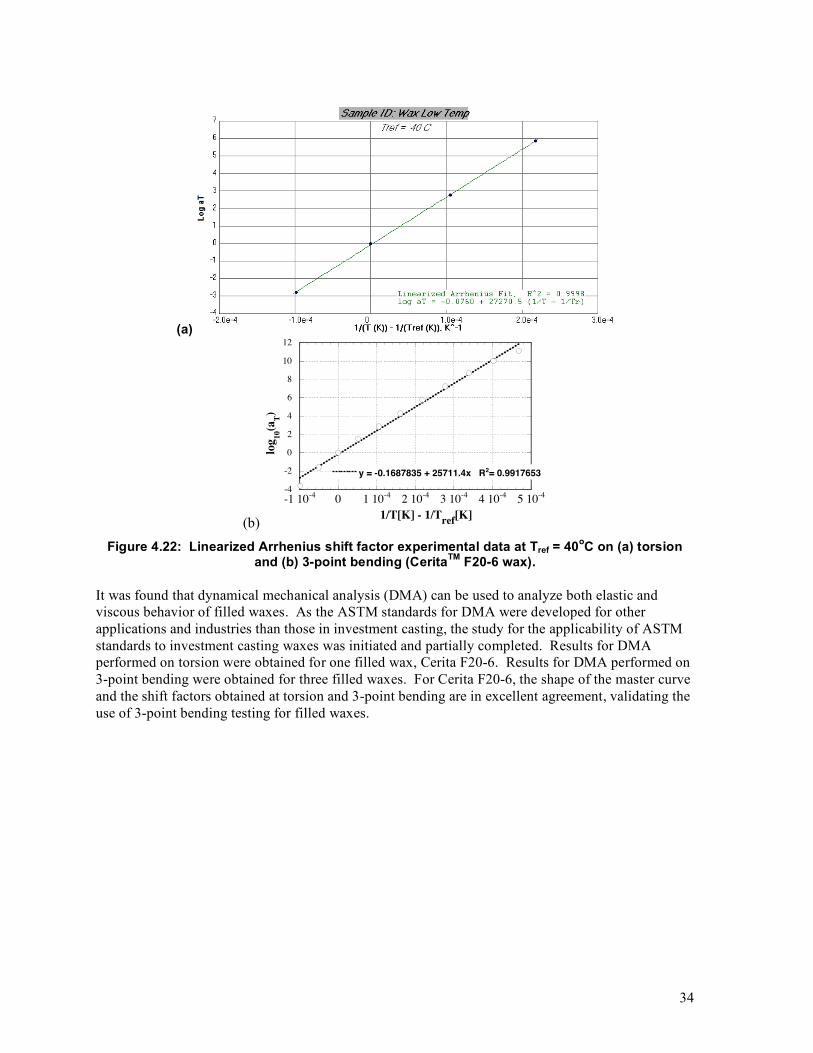
34
(a)
(b)
-4
-2
0
2
4
6
8
10
12
-1 10-4
0 1 10-4
2 10-4
3 10-4
4 10-4
5 10-4
y = -0.1687835 + 25711.4x R2= 0.9917653
log
10(a
T)
1/T[K] - 1/Tref
[K]
Figure 4.22: Linearized Arrhenius shift factor experimental data at Tref = 40oC on (a) torsion and (b) 3-point bending (CeritaTM F20-6 wax).
It was found that dynamical mechanical analysis (DMA) can be used to analyze both elastic and viscous behavior of filled waxes. As the ASTM standards for DMA were developed for other applications and industries than those in investment casting, the study for the applicability of ASTM standards to investment casting waxes was initiated and partially completed. Results for DMA performed on torsion were obtained for one filled wax, Cerita F20-6. Results for DMA performed on 3-point bending were obtained for three filled waxes. For Cerita F20-6, the shape of the master curve and the shift factors obtained at torsion and 3-point bending are in excellent agreement, validating the use of 3-point bending testing for filled waxes.
35
5. Accomplishments For convenience, a web site containing pertinent papers, reports and other information on this project has been established at http://www.ms.ornl.gov/mpg/sabau.htm.
5.1 Shell Mold The data on properties of alumino-silicates materials used for shell molds are reviewed and material property data, which were not available from material suppliers, was obtained.
5.2 Alloy Shrinkage Factors This study is the first attempt to predict shrinkage factors for the investment casting of stainless steels. The experimental data for 17-4PH stainless steel, did not cover the entire temperature range necessary for process simulation. Some property data had to be estimated using CompuTherm methodologies and recommendations from ProCAST. A comparison between the predicted material property data and measured property data was made. It was found that most material properties were accurately predicted only over several temperature ranges. No experimental data for plastic modulus were found. Thus, several assumptions were made and ProCAST recommendations were followed in order to obtain a complete set of mechanical property data at high temperatures. Thermal expansion measurements for the 17-4PH alloy were conducted during heating and cooling. As a function of temperature, the thermal expansion for both the alloy and shell mold materials showed different evolution on heating and cooling. Numerical simulations were conducted to predict the alloy tooling allowances based on a combined analysis of heat transfer and deformation phenomena for 17-4PH stainless steel parts. Although the numerical results showed that the shrinkage evolution in time was quite different for the αheat and αcool cases, there was only a small difference in the final shrinkage factors predicted for these cases. The shrinkage factors were over-predicted for both the unrestrained dimensions and restrained dimensions. However, the effect of reduced shrinkage for restrained dimensions was adequately reproduced. With the exception of the L2_5 results for the no-hole part, the predicted shrinkage values are close enough to the measured values to allow a quantitative prediction of the shrinkage factors. The over-prediction of shrinkage values are likely due to assumptions used in the mechanical properties, especially at high temperatures, for which no experimental data were available. In this section, the first attempt to determine shrinkage factors for the investment casting of stainless steels is presented. For all the properties of 17-4PH stainless steel, the experimental data available in the literature did not cover the entire temperature range necessary for process simulation. Thus, some material properties were evaluated using ProCAST, based on CompuTherm database.
5.3 Wax Properties For the first time in the investment casting industry, the thermo-mechanical properties of unfilled and filled waxes were measured. Recommendations were made to Investment Casting Institute on measurement techniques for waxes. Recommendations for mechanical testing of waxes were made based on testing one unfilled wax and one filled wax. The recommendations made could be used to establish new testing guidelines for waxes in the investment casting industry.
36
In this report, material property data that is needed to determine dimensional changes associated with the wax system are provided. The following waxes were chosen by participating companies for testing: Cerita F20-6, Cerita F20-844B, and Remet PR-15. It was found that dynamical mechanical analysis (DMA) can be used to analyze both elastic and viscous behavior of filled waxes. As the ASTM standards for DMA were developed for other applications and industries than those in investment casting, the study for the applicability of ASTM standards to investment casting waxes was initiated and partially completed. Results for DMA performed on torsion were obtained for one filled wax, Cerita F20-6. Results for DMA performed on 3-point bending were obtained for three filled waxes. For Cerita F20-6, the shape of the master curve and the shift factors obtained at torsion and 3-point bending are in excellent agreement, validating the use of 3-point bending testing for filled waxes.
5.4 Technology Transfer The techniques developed and material property data obtain in this project were documented in several publications and conference presentations. Detailed reports on alloy and shell mold materials were also issued to the participating companies. Through the ORNL work conducted in this project, the areas of material property measurement and modeling of material behavior has matured, allowing the software vendors to develop appropriate modules in their codes, the next steps in technology transfer. Over the course of the project, ORNL assisted ProCAST with advice, information, material property data, mesh files, ProCAST setup files, allowing immediate dissemination of the information to industry. Recommendations were made to Investment Casting Institute on measurement techniques for waxes. Recommendations for mechanical testing of waxes were made based on testing one unfilled wax and one filled wax, both used by the industry. The recommendations made could be used to establish new testing guidelines for waxes in the investment casting industry.
5.5 Publications and Patents Resulting from Project This project resulted in the following conference papers and archival journal articles reflecting results throughout the project: Sabau, A.S., 2004, “Tests For Determining Viscoelastic Properties Of Investment Casting Waxes,”
Paper No. 1, 48th Annual Technical Meeting, Investment Casting Institute. Sabau, A.S., 2005, "Numerical simulation of the investment casting process," Transactions of
American Foundry Society, 2005, paper 05-160, pp. 407-417. Sabau, A.S. 2006, "Alloy Shrinkage Factors For The Investment Casting Process,” Metallurgical and
Materials Transactions B, Vol. 37B, pp. 131-140. Sabau, A.S. 2006, Prediction of Alloy Shrinkage Factors for the Investment Casting Process, 110th
Metalcasting Congress, April 18-21 2006, Columbus, OH, paper 06-004. Sabau, A.S. 2007, Shrinkage Prediction for the Investment Casting of Stainless Steels, 111th
Metalcasting Congress, May 15-18 2007, Houston, TX, paper 07-042. Sabau, A.S. and Porter, W.D., 2007, Alloy Shrinkage Factors for the Investment Casting of 17-4PH
stainless Steel Parts, In print “Metallurgical and Materials Transactions B.” 2008.
37
6. Conclusions In this study, the alloy shrinkage factors were obtained using numerical simulations for the first time for the investment casting of 17-4PH stainless steel parts, a high melting point alloy. There is a high probability that the experimental data available in the literature for material properties did not cover the entire temperature range necessary for process simulation. Thus, assumptions must be made in order to obtain material property data, especial mechanical properties at high temperature. The alloy dimensions were obtained from numerical simulation results of solidification, heat transfer, and deformation phenomena. As compared with experimental results, the numerical simulation results for the shrinkage factors were over-predicted. For the first time in the investment casting industry, the thermo-mechanical properties of unfilled and filled waxes were measured. Recommendations were made to Investment Casting Institute on measurement techniques for waxes. Recommendations for mechanical testing of waxes were made based on testing one unfilled wax and one filled wax. The recommendations made could be used to establish new testing guidelines for waxes in the investment casting industry. It was found that dynamical mechanical analysis (DMA) can be used with confidence to analyze both elastic and viscous behavior of filled waxes. As the ASTM standards for DMA were developed for other applications and industries than those in investment casting, the study for the applicability of ASTM standards to investment casting waxes was initiated and partially completed. For Cerita F20-6, the shape of the master curve and the shift factors obtained at torsion and 3-point bending are in excellent agreement, validating the use of 3-point bending testing for filled waxes. The data on bending DMA shows larger values than those obtained on torsion DMA. This effect needs to be further understood. These findings are very important for future investigations and for the enhancement of commercial investing casting software. Pending availability of material property data, the computer simulation software is mature enough to quantitatively predict shrinkage factors for high melting point alloys with an accuracy less than that for light cast alloys.

39
7. Recommendations Prediction of shrinkage factors with high accuracy is possible in the investment casting industry, pending that material properties are measured and appropriate material models are available in commercial casting software. In order to obtain data for a specific foundry, combined experimental and computational programs must be conducted. The experimental program should concentrate on measuring material properties. The experimental program could be relatively small, since it could be carried only once for each material. Based on the results presented in previous sections, the following recommendations were made for the use of numerical simulation in the investment casting process.
7.1 Shell Additional work must be performed to account for creep properties during investment casting of heavy sections. Recommendations for the shell mold presented in the progress report for phase II need to be followed (Sabau, 2005).
7.2 Alloy Several assumptions need to be made in order to obtain a complete set of mechanical property data at high temperatures. The quality of the estimated data based on assumptions need to be assessed by comparison with experimental data. Due to phase transformations, the thermal expansion of the alloy is different on cooling than on heating. Thermal expansion data for the alloy must be obtained on cooling, not on heating, as is usually reported in the literature.
7.3 Wax The users need help in dealing with the post-processing of the DMA data. Commercial software vendors, such as ProCAST to bridge the gap between the raw data provided by measurements and the data needed in viscoelastic models in a simpler format, such as the shift factor and Prony series. The computer implementation of this post-processing would have the benefit of reducing the cost for testing the wax material and enabling more resources towards the simulations. Another possibility would be to take as input the creep test data for a viscoelastic material, without asking the user for Prony series.
7.4 Technology Transfer Additional work is needed to enhance the wax model. The viscoelastic module implemented in ProCAST needs to be validated. Mechanical properties for the alloy, especially at high temperature need to be measured. Echoing the foundry industry needs, the project steering committee members informed the wax suppliers of the increasing demand for wax properties. Foundries can now effectively use the wax property data as the new wax module was recently added to the software suite for the investment casting by ProCAST. The commercialization of wax module will provide an incentive for the wax suppliers to provide the data on mechanical properties of waxes, whose use in foundries will lead to significant advances in the investment casting industry.
40
8. References Abdella, K., International Journal of Non-Linear Mechanics, Vol. 41, 2006, pp. 456-463 Achari, S. and L.N. Satapathy, Mullite-Based Refractories for Molten-Metal Applications, American
Ceramic Society Bulletin, Vol. 82, pp. 2, 2003. AK Steel, Product Data Bulletin,
http://www.aksteel.com/markets_products/stainless_precipitation.asp ASM alloy Center: Materials Property Data, http://products.asminternational.org/matdb/index.jsp Atlas of Formability, Concurrent Technologies Corporation, 1996,
http://www.nmc.ctc.com/ekb/ekb_atlas.cfm Bellet, M.; Decultieux, F.; Menai, M.; Bay, F.; Levaillant, C.; Chenot, J. L.; Schmidt, P.; and
Svensson, I. L. 1996, “Thermomechanics of the Cooling Stage in Casting Processes: Three-Dimensional Finite Element Analysis and Experimental Validation,” Metallurgical and Materials Transactions, Vol. 29B, pp. 81–99.
Browne, D.J., and Sayers, K., 1995, “Experimental Measurement of Investment Shell Properties and Use of the Data in Casting Simulation Software,” Proc. 7-th Conference Model. Casting Welding Adv. Solid. Process.
Chen, S. L.; F. Zhang, S. Daniel, F. Y. Xie, X. Y. Yan, Y. A. Chang, R. Schmid-Fetzer, W. A. Oates, “Calculating phase diagrams using PANDAT and PanEngine, ” JOM, 2003, vol. 55, pp. 48-51.
Chen, J. and Young, B., 2006, Vol. 28, pp. 229-239. Drezet, J.-M., and Rappaz, M. 1996. “Modeling of Ingot Distortion during Direct Chill Casting of
Aluminum Alloys,” Metallurgical and Materials Transactions, Vol. 27A, pp. 3214–3225. Fachinotti, V. D. & Cardona A., J. of Materials Processing Technology, Vol. 135, pp. 30-43, 2003 Fieldhouse, I. B. and Lang J. I., Measurement of Thermal Properties, Wright Air Development
Division, Report 1-119, 1961. Frankel, J.I. Porter, W.D., and Sabau, A., Journal of Thermal Analysis and Calorimetry, 2005, Vol.
82, pp. 171-177. Fukuhara, M. and A. Sanpei, Japanese Journal of Applied Physics, Vol. 33, pp. 2890-2893
(1994). Goodson, C.C., Simulation of Microwave Heating of Mullite Rods, Master's Thesis, Virginia
Polytechnic Institute and State University, 1997 Guo J, Samonds MT, Journal of phase equilibria and diffusion, Vol. 28, pp. 58-63, 2007. Hammond VH, Elzey DM, Elevated temperature mechanical properties of partially sintered alumina,
Composites Science and Technology, vol. 64, pp. 1551-1563, 2004. Irvine, K.J. et al, Controlled-transformation stainless steels, in The Metallurgical Evolution of
Stainless Steels, ed. F.B Pikering, American Society for Metals, Metals Park, Ohio, 1979, pp. 121-141.
Jones S.; Jolly M.R.; Lewis K. Development of techniques for predicting ceramic shell properties for investment casting, British Ceramic Transactions, Volume 101, pp. 106-113.
Kajitani, T., Drezet, J.-M. and M. Rappaz, Met. Mater. Trans., Nr. 32A, pp. 1479-88, 2001. Kozlowski, P. F., J. A. Azzi, B. G. Thomas and H. Wang, Metallurgical Transactions A, Vol. 23A,
1992, pp. 903-918. Menard, K.P., 1999, “Dynamic Mechanical Analysis: A Practical Introduction to Techniques and
Applications,” CRC Press, Boca Raton, Florida.
Metallic Materials Properties Development and Standardization (MMPDS). U.S. Department of Transportation, 2003.
41
Munro RG, Analytical representations of elastic moduli data with simultaneous dependence on temperature and porosity, Journal of Research of the National Institute of Standards and Technology, Vol. 109, pp. 497-503, 2004.
Munro RG, Effective medium theory of the porosity dependence of bulk moduli, Journal of the American Ceramic Society, vol. 84, pp. 1190-1192, 2001.
Munro RG, Evaluated Material Properties for a Sintered alpha-Al2O3, Journal of the American Ceramic Society, Vol. 80, pp. 1919-1928,1997.
Perzyna, P.: Quarterly Applied Math., 1963, vol. 20, pp. 321-332. Porter, W.D. and Maziasz, P.J., Scripta Metallurgica et Materialia, 1993, Vol. 29, pp. 1043-1048. Pierer, R., Bernhard, C. and C. Chimani, Transactions on Modelling and Simulation, Vol 41, 20-22,
Malta (2005), pp. 757-768. O'Mahoney D., Browne D.J., "Use of Experiment and an Inverse Method to Study Interface Heat
Transfer During Solidification in the Investment Casting Process", Exper. Ther. Fluid Sci., 22(3-4), 2000, pp. 1-12.
Rack, H.J., 1981, “Physical and Mechanical Properties of Cast 17-4 PH Stainless Steel,” 1981, Sandia Report, SAND-80-2302, TTC-0161, Issued Febr. 1981.
Rowe, G. M., and Sharrock, M. J. 2000. “Development of Standard Techniques for the Calculation of Master Curves for Linear-Visco Elastic Materials,” First International Symposium on Binder Rheology and Pavement Performance, University of Calgary, Alberta, Canada, August 14–15.
Russell, L. M., L. F. Johnson, D.P.H. Hasselman, and R. Ruth, 'Thermal Conductivity/Diffusivity of Silicon Carbide Whisker Reinforced Mullite', J. Am. Soc. Vol. 70:C-226-229, 1987.
Sabau, A.S., Metallurgical and Materials Transactions, 2006, Vol. 37B, pp. 131-140. Sabau, A.S. and Viswanathan, S., Thermophysical Properties of Zircon and Fused Silica-based Shells
used in the Investment Casting Process, Transactions of American Foundry Society, 2004, Vol. 112, paper 04-081
Sahai V. and R.A. Overfelt: AFS Trans., 1995, vol. 103, pp. 627–32. Sabau, A. S. 2005. “Numerical Simulation of the Investment Casting Process,” Transactions of
American Foundry Society, paper 05-160. Sabau, A. S., and Viswanathan, S. 2000. “Material Properties for Predicting Wax Pattern Dimensions
in Investment Casting,” Paper No. 4, 48th Annual Technical Meeting, Investment Casting Institute, Dallas, TX, Oct. 15–18.
Sabau, A. S., and Viswanathan, S. 2001. “Determining Wax Pattern Dimensions in Investment Casting Using Viscoelastic Models,” Paper No. 3, 49th Annual Technical Meeting, Investment Casting Institute, Orlando, FL, Oct. 7–10.
Sabau, A. S., and Viswanathan, S. 2003. “Material Properties for Predicting Wax Pattern Dimensions in Investment Casting,” Materials Science & Engineering A, Vol. 362A, pp. 125–134.
Sabau, A. S., and Viswanathan, S. 2001. “Critical Material Properties for Predicting Pattern Tooling Dimensions in Investment Casting,” Transactions of American Foundry Society, Paper No. 01-017, pp. 1–18.
Sabau, A. S., and Viswanathan, S. 2001. “Numerical Simulation of Wax Pattern Dimensions in Investment Casting,” Proceedings of Computational Modeling of Materials, Minerals, and Metals Processing, 2001 Annual Fall TMS Meeting, San Diego, CA, Sept. 23–26, pp. 431–440.
Sabau, A. S., and Viswanathan, S. 2001. “Determining Wax Pattern Dimensions in Investment Casting Using Viscoelastic Models,” Investment Casting Institute 49th Annual Meeting, Orlando, FL, October 7–10, 2001, paper no. 3.
Sandmeyer Steel Company, 2005, Property data sheet, http://www.stainlessplate.com/images/17-4PH-Spec-Sheet.pdf
42
Schwerdtfeger, K.; M. Sato, and K-H. Tacke: Metallurgical and Materials Transactions, 1998, vol. 29B, pp. 1057-1068.
Snow, J. D., in Proceedings of 43rd Annual Meeting of the Investment Casting Institute, Dallas, TX, 1995, Oct. 29-Nov. 1, Paper no. 18.
Snow, J. D., 2004, personal communication. Straton, R. R., et al. Ceramics Testing Guidebook, Investment Casting Institute. Touloukian, Y.S., Thermal Radiative Properties, Vol. 8, New York-Washington, p.142, 1972. Touloukian Y. S. et al., 1979, Thermophysical Properties of Matter, (now Thermophysical Properties
of Matter Database, https://cindasdata.com) Wereszczak, A. A., K. Breder, M.K. Ferber, T.P. Kirkland, A. Payzant, C. Rawn, E. Krug, C. L.
LaRocco, R.A. Pietras, and M. Karakus, "Dimensional Changes and Creep of Silica Core Ceramics Used in Investment Casting of Superalloys," Journal of Mat. Science, 37 4235-45 (2002).
Waite, D. M., and Samonds, M. T. 1990. “Finite Element Solidification Analysis of Investment Castings,” 38th Annual Technical Meeting, Investment Casting Institute.
Weddington, V. L.; Reddy, G. P.; and Mobley, C. E. 1990. Dimensional Control in the Investment Casting Process, Report EMTEC/CT/TR-90-14, Edison Materials Technology Center, Dayton, OH.
Wu JH, Lin CK, Journal of materials science, 2003, vol. 38, pp. 965-971.
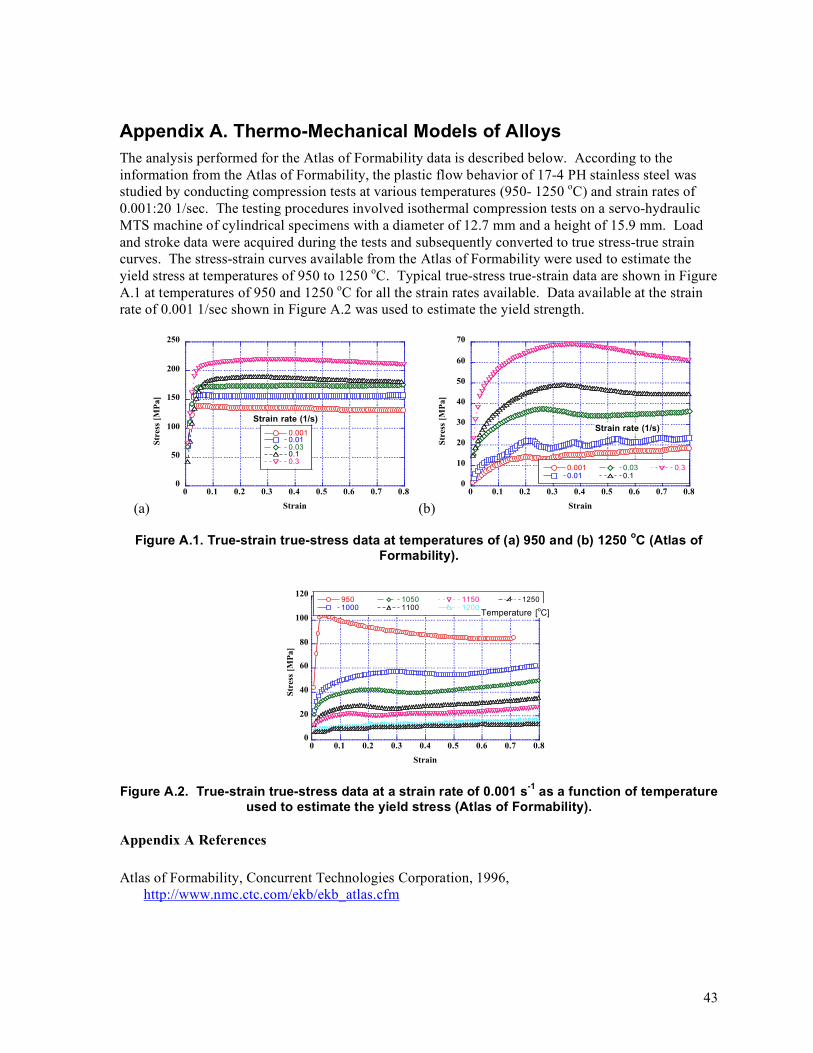
43
Appendix A. Thermo-Mechanical Models of Alloys The analysis performed for the Atlas of Formability data is described below. According to the information from the Atlas of Formability, the plastic flow behavior of 17-4 PH stainless steel was studied by conducting compression tests at various temperatures (950- 1250 oC) and strain rates of 0.001:20 1/sec. The testing procedures involved isothermal compression tests on a servo-hydraulic MTS machine of cylindrical specimens with a diameter of 12.7 mm and a height of 15.9 mm. Load and stroke data were acquired during the tests and subsequently converted to true stress-true strain curves. The stress-strain curves available from the Atlas of Formability were used to estimate the yield stress at temperatures of 950 to 1250 oC. Typical true-stress true-strain data are shown in Figure A.1 at temperatures of 950 and 1250 oC for all the strain rates available. Data available at the strain rate of 0.001 1/sec shown in Figure A.2 was used to estimate the yield strength.
(a)
0
50
100
150
200
250
0 0.1 0.2 0.3 0.4 0.5 0.6 0.7 0.8
0.001
0.01
0.03
0.1
0.3
Str
ess
[M
Pa
]
Strain
Strain rate (1/s)
(b)
0
10
20
30
40
50
60
70
0 0.1 0.2 0.3 0.4 0.5 0.6 0.7 0.8
0.001
0.01
0.03
0.1
0.3
Str
ess
[M
Pa
]
Strain
Strain rate (1/s)
Figure A.1. True-strain true-stress data at temperatures of (a) 950 and (b) 1250 oC (Atlas of Formability).
0
20
40
60
80
100
120
0 0.1 0.2 0.3 0.4 0.5 0.6 0.7 0.8
9501000
10501100
11501200
1250
Str
ess
[M
Pa
]
Strain
Temperature [oC]
Figure A.2. True-strain true-stress data at a strain rate of 0.001 s-1 as a function of temperature used to estimate the yield stress (Atlas of Formability).
Appendix A References Atlas of Formability, Concurrent Technologies Corporation, 1996,
http://www.nmc.ctc.com/ekb/ekb_atlas.cfm
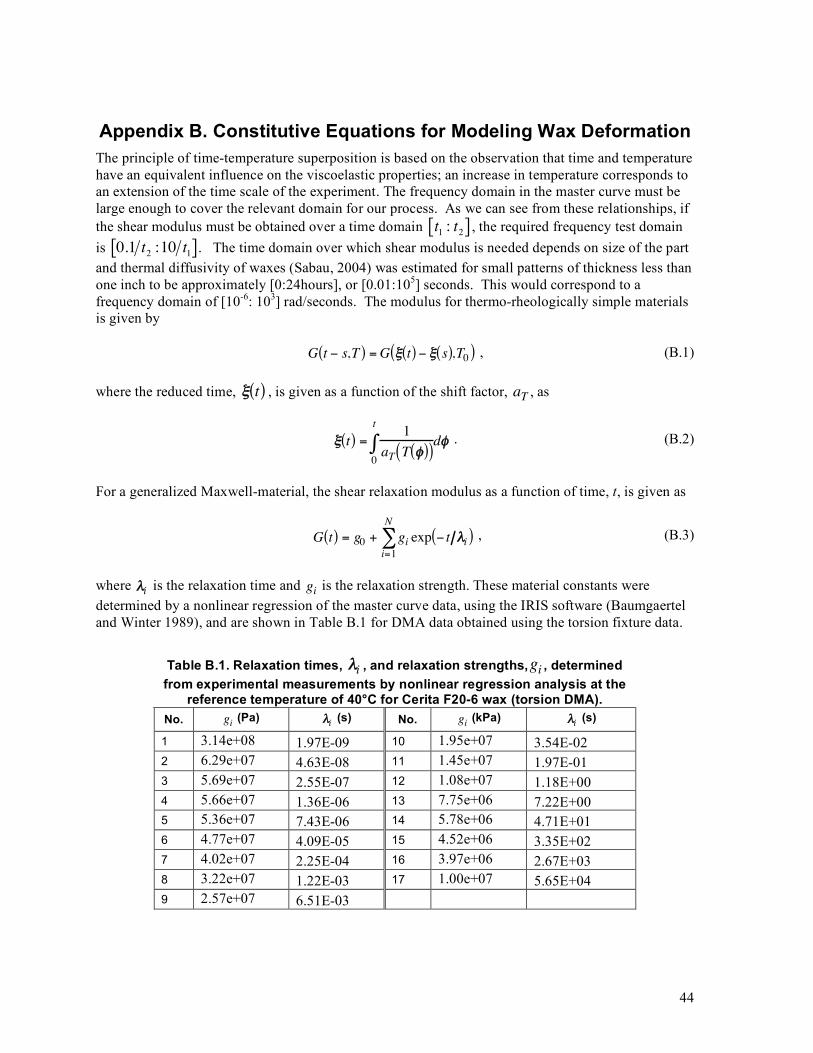
44
Appendix B. Constitutive Equations for Modeling Wax Deformation The principle of time-temperature superposition is based on the observation that time and temperature have an equivalent influence on the viscoelastic properties; an increase in temperature corresponds to an extension of the time scale of the experiment. The frequency domain in the master curve must be large enough to cover the relevant domain for our process. As we can see from these relationships, if the shear modulus must be obtained over a time domain
!
t1: t2[ ] , the required frequency test domain
is
!
0.1 t2:10 t
1[ ] . The time domain over which shear modulus is needed depends on size of the part and thermal diffusivity of waxes (Sabau, 2004) was estimated for small patterns of thickness less than one inch to be approximately [0:24hours], or [0.01:105] seconds. This would correspond to a frequency domain of [10-6: 103] rad/seconds. The modulus for thermo-rheologically simple materials is given by G t ! s,T( ) =G " t( ) ! " s( ),T0( ) , (B.1) where the reduced time, ! t( ) , is given as a function of the shift factor, a
T, as
! t( ) =1
aT T "( )( )0
t
# d" . (B.2)
For a generalized Maxwell-material, the shear relaxation modulus as a function of time, t, is given as
G t( ) = g0 + gii=1
N
! exp " t #i( ) , (B.3)
where !i is the relaxation time and gi is the relaxation strength. These material constants were determined by a nonlinear regression of the master curve data, using the IRIS software (Baumgaertel and Winter 1989), and are shown in Table B.1 for DMA data obtained using the torsion fixture data.
Table B.1. Relaxation times, !i , and relaxation strengths,gi , determined from experimental measurements by nonlinear regression analysis at the
reference temperature of 40°C for Cerita F20-6 wax (torsion DMA). No. gi (Pa) !i (s) No. gi (kPa) !i (s)
1 3.14e+08 1.97E-09 10 1.95e+07 3.54E-02 2 6.29e+07 4.63E-08 11 1.45e+07 1.97E-01 3 5.69e+07 2.55E-07 12 1.08e+07 1.18E+00 4 5.66e+07 1.36E-06 13 7.75e+06 7.22E+00 5 5.36e+07 7.43E-06 14 5.78e+06 4.71E+01 6 4.77e+07 4.09E-05 15 4.52e+06 3.35E+02 7 4.02e+07 2.25E-04 16 3.97e+06 2.67E+03 8 3.22e+07 1.22E-03 17 1.00e+07 5.65E+04 9 2.57e+07 6.51E-03

45
Appendix B References Baumgaertel, M., and Winter, H. H. 1989. “Determination of Discrete Relaxation and Retardation
Time Spectra from Dynamic Mechanical Data,” Rheol. Acta, Vol. 28, p. 511. Sabau, A.S., 2004, “Tests For Determining Viscoelastic Properties Of Investment Casting Waxes,”
Paper No. 1, 48th Annual Technical Meeting, Investment Casting Institute.
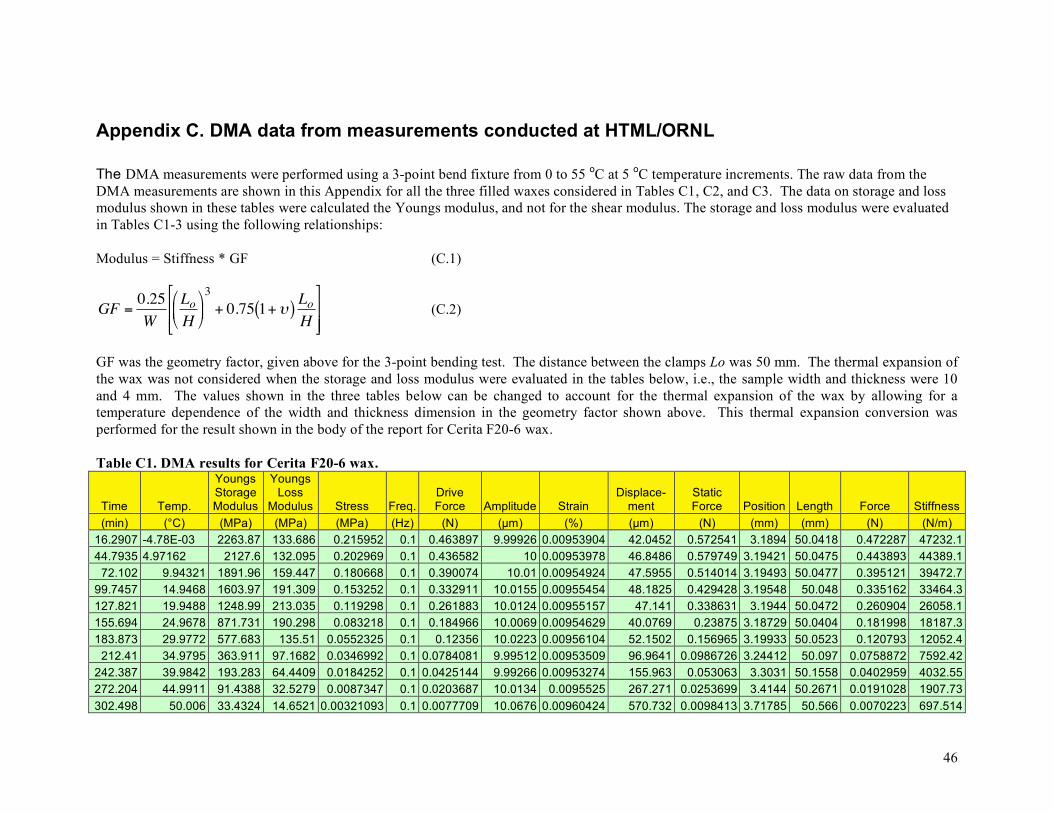
46
Appendix C. DMA data from measurements conducted at HTML/ORNL The DMA measurements were performed using a 3-point bend fixture from 0 to 55 oC at 5 oC temperature increments. The raw data from the DMA measurements are shown in this Appendix for all the three filled waxes considered in Tables C1, C2, and C3. The data on storage and loss modulus shown in these tables were calculated the Youngs modulus, and not for the shear modulus. The storage and loss modulus were evaluated in Tables C1-3 using the following relationships: Modulus = Stiffness * GF (C.1)
!
GF =0.25
W
Lo
H
"
# $
%
& ' 3
+ 0.75 1+(( )Lo
H
)
* + +
,
- . .
(C.2)
GF was the geometry factor, given above for the 3-point bending test. The distance between the clamps Lo was 50 mm. The thermal expansion of the wax was not considered when the storage and loss modulus were evaluated in the tables below, i.e., the sample width and thickness were 10 and 4 mm. The values shown in the three tables below can be changed to account for the thermal expansion of the wax by allowing for a temperature dependence of the width and thickness dimension in the geometry factor shown above. This thermal expansion conversion was performed for the result shown in the body of the report for Cerita F20-6 wax. Table C1. DMA results for Cerita F20-6 wax.
Time Temp.
Youngs Storage Modulus
Youngs Loss
Modulus Stress Freq. Drive Force Amplitude Strain
Displace-ment
Static Force Position Length Force Stiffness
(min) (°C) (MPa) (MPa) (MPa) (Hz) (N) (µm) (%) (µm) (N) (mm) (mm) (N) (N/m) 16.2907 -4.78E-03 2263.87 133.686 0.215952 0.1 0.463897 9.99926 0.00953904 42.0452 0.572541 3.1894 50.0418 0.472287 47232.1 44.7935 4.97162 2127.6 132.095 0.202969 0.1 0.436582 10 0.00953978 46.8486 0.579749 3.19421 50.0475 0.443893 44389.1
72.102 9.94321 1891.96 159.447 0.180668 0.1 0.390074 10.01 0.00954924 47.5955 0.514014 3.19493 50.0477 0.395121 39472.7 99.7457 14.9468 1603.97 191.309 0.153252 0.1 0.332911 10.0155 0.00955454 48.1825 0.429428 3.19548 50.048 0.335162 33464.3 127.821 19.9488 1248.99 213.035 0.119298 0.1 0.261883 10.0124 0.00955157 47.141 0.338631 3.1944 50.0472 0.260904 26058.1 155.694 24.9678 871.731 190.298 0.083218 0.1 0.184966 10.0069 0.00954629 40.0769 0.23875 3.18729 50.0404 0.181998 18187.3 183.873 29.9772 577.683 135.51 0.0552325 0.1 0.12356 10.0223 0.00956104 52.1502 0.156965 3.19933 50.0523 0.120793 12052.4
212.41 34.9795 363.911 97.1682 0.0346992 0.1 0.0784081 9.99512 0.00953509 96.9641 0.0986726 3.24412 50.097 0.0758872 7592.42 242.387 39.9842 193.283 64.4409 0.0184252 0.1 0.0425144 9.99266 0.00953274 155.963 0.053063 3.3031 50.1558 0.0402959 4032.55 272.204 44.9911 91.4388 32.5279 0.0087347 0.1 0.0203687 10.0134 0.0095525 267.271 0.0253699 3.4144 50.2671 0.0191028 1907.73 302.498 50.006 33.4324 14.6521 0.00321093 0.1 0.0077709 10.0676 0.00960424 570.732 0.0098413 3.71785 50.566 0.0070223 697.514
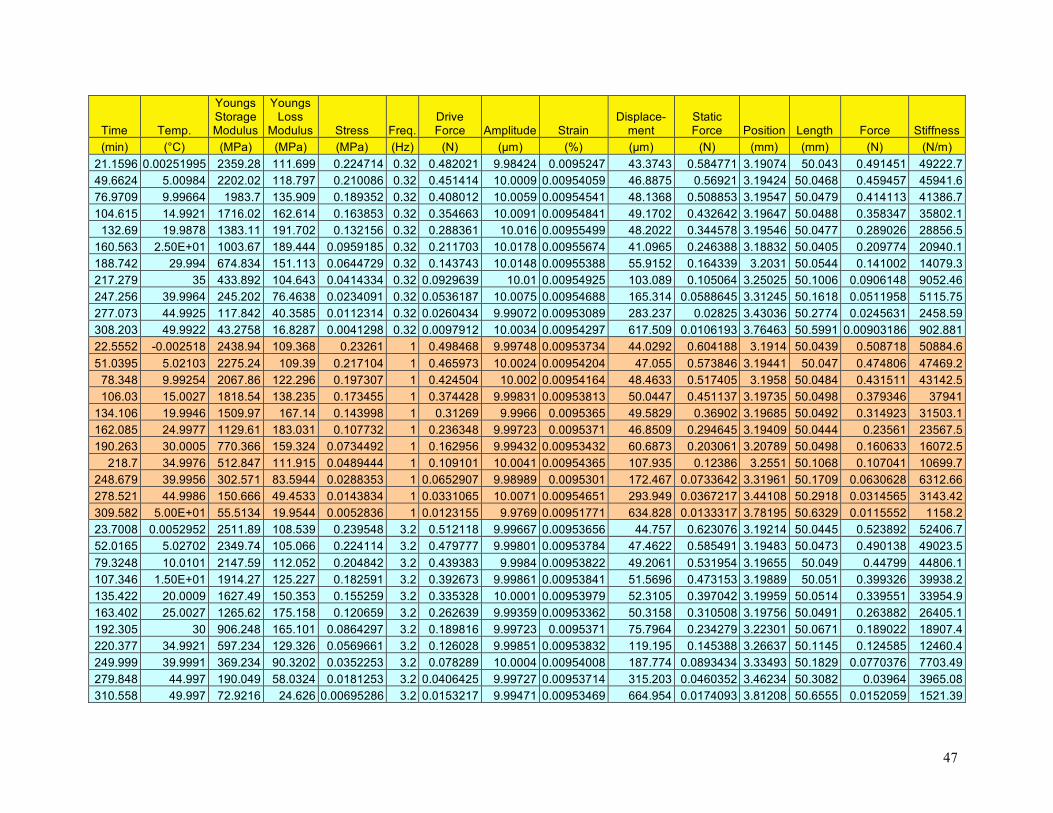
47
Time Temp.
Youngs Storage Modulus
Youngs Loss
Modulus Stress Freq. Drive Force Amplitude Strain
Displace-ment
Static Force Position Length Force Stiffness
(min) (°C) (MPa) (MPa) (MPa) (Hz) (N) (µm) (%) (µm) (N) (mm) (mm) (N) (N/m) 21.1596 0.00251995 2359.28 111.699 0.224714 0.32 0.482021 9.98424 0.0095247 43.3743 0.584771 3.19074 50.043 0.491451 49222.7 49.6624 5.00984 2202.02 118.797 0.210086 0.32 0.451414 10.0009 0.00954059 46.8875 0.56921 3.19424 50.0468 0.459457 45941.6 76.9709 9.99664 1983.7 135.909 0.189352 0.32 0.408012 10.0059 0.00954541 48.1368 0.508853 3.19547 50.0479 0.414113 41386.7 104.615 14.9921 1716.02 162.614 0.163853 0.32 0.354663 10.0091 0.00954841 49.1702 0.432642 3.19647 50.0488 0.358347 35802.1
132.69 19.9878 1383.11 191.702 0.132156 0.32 0.288361 10.016 0.00955499 48.2022 0.344578 3.19546 50.0477 0.289026 28856.5 160.563 2.50E+01 1003.67 189.444 0.0959185 0.32 0.211703 10.0178 0.00955674 41.0965 0.246388 3.18832 50.0405 0.209774 20940.1 188.742 29.994 674.834 151.113 0.0644729 0.32 0.143743 10.0148 0.00955388 55.9152 0.164339 3.2031 50.0544 0.141002 14079.3 217.279 35 433.892 104.643 0.0414334 0.32 0.0929639 10.01 0.00954925 103.089 0.105064 3.25025 50.1006 0.0906148 9052.46 247.256 39.9964 245.202 76.4638 0.0234091 0.32 0.0536187 10.0075 0.00954688 165.314 0.0588645 3.31245 50.1618 0.0511958 5115.75 277.073 44.9925 117.842 40.3585 0.0112314 0.32 0.0260434 9.99072 0.00953089 283.237 0.02825 3.43036 50.2774 0.0245631 2458.59 308.203 49.9922 43.2758 16.8287 0.0041298 0.32 0.0097912 10.0034 0.00954297 617.509 0.0106193 3.76463 50.5991 0.00903186 902.881 22.5552 -0.002518 2438.94 109.368 0.23261 1 0.498468 9.99748 0.00953734 44.0292 0.604188 3.1914 50.0439 0.508718 50884.6 51.0395 5.02103 2275.24 109.39 0.217104 1 0.465973 10.0024 0.00954204 47.055 0.573846 3.19441 50.047 0.474806 47469.2
78.348 9.99254 2067.86 122.296 0.197307 1 0.424504 10.002 0.00954164 48.4633 0.517405 3.1958 50.0484 0.431511 43142.5 106.03 15.0027 1818.54 138.235 0.173455 1 0.374428 9.99831 0.00953813 50.0447 0.451137 3.19735 50.0498 0.379346 37941
134.106 19.9946 1509.97 167.14 0.143998 1 0.31269 9.9966 0.0095365 49.5829 0.36902 3.19685 50.0492 0.314923 31503.1 162.085 24.9977 1129.61 183.031 0.107732 1 0.236348 9.99723 0.0095371 46.8509 0.294645 3.19409 50.0444 0.23561 23567.5 190.263 30.0005 770.366 159.324 0.0734492 1 0.162956 9.99432 0.00953432 60.6873 0.203061 3.20789 50.0498 0.160633 16072.5
218.7 34.9976 512.847 111.915 0.0489444 1 0.109101 10.0041 0.00954365 107.935 0.12386 3.2551 50.1068 0.107041 10699.7 248.679 39.9956 302.571 83.5944 0.0288353 1 0.0652907 9.98989 0.0095301 172.467 0.0733642 3.31961 50.1709 0.0630628 6312.66 278.521 44.9986 150.666 49.4533 0.0143834 1 0.0331065 10.0071 0.00954651 293.949 0.0367217 3.44108 50.2918 0.0314565 3143.42 309.582 5.00E+01 55.5134 19.9544 0.0052836 1 0.0123155 9.9769 0.00951771 634.828 0.0133317 3.78195 50.6329 0.0115552 1158.2 23.7008 0.0052952 2511.89 108.539 0.239548 3.2 0.512118 9.99667 0.00953656 44.757 0.623076 3.19214 50.0445 0.523892 52406.7 52.0165 5.02702 2349.74 105.066 0.224114 3.2 0.479777 9.99801 0.00953784 47.4622 0.585491 3.19483 50.0473 0.490138 49023.5 79.3248 10.0101 2147.59 112.052 0.204842 3.2 0.439383 9.9984 0.00953822 49.2061 0.531954 3.19655 50.049 0.44799 44806.1 107.346 1.50E+01 1914.27 125.227 0.182591 3.2 0.392673 9.99861 0.00953841 51.5696 0.473153 3.19889 50.051 0.399326 39938.2 135.422 20.0009 1627.49 150.353 0.155259 3.2 0.335328 10.0001 0.00953979 52.3105 0.397042 3.19959 50.0514 0.339551 33954.9 163.402 25.0027 1265.62 175.158 0.120659 3.2 0.262639 9.99359 0.00953362 50.3158 0.310508 3.19756 50.0491 0.263882 26405.1 192.305 30 906.248 165.101 0.0864297 3.2 0.189816 9.99723 0.0095371 75.7964 0.234279 3.22301 50.0671 0.189022 18907.4 220.377 34.9921 597.234 129.326 0.0569661 3.2 0.126028 9.99851 0.00953832 119.195 0.145388 3.26637 50.1145 0.124585 12460.4 249.999 39.9991 369.234 90.3202 0.0352253 3.2 0.078289 10.0004 0.00954008 187.774 0.0893434 3.33493 50.1829 0.0770376 7703.49 279.848 44.997 190.049 58.0324 0.0181253 3.2 0.0406425 9.99727 0.00953714 315.203 0.0460352 3.46234 50.3082 0.03964 3965.08 310.558 49.997 72.9216 24.626 0.00695286 3.2 0.0153217 9.99471 0.00953469 664.954 0.0174093 3.81208 50.6555 0.0152059 1521.39
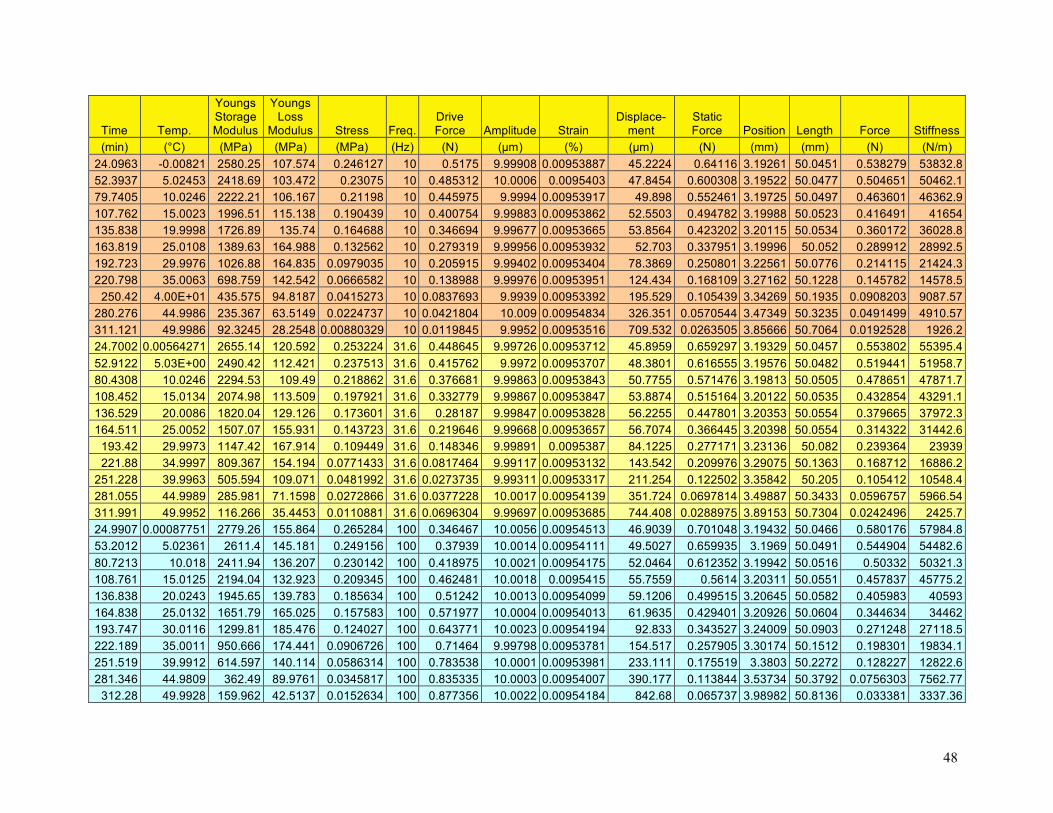
48
Time Temp.
Youngs Storage Modulus
Youngs Loss
Modulus Stress Freq. Drive Force Amplitude Strain
Displace-ment
Static Force Position Length Force Stiffness
(min) (°C) (MPa) (MPa) (MPa) (Hz) (N) (µm) (%) (µm) (N) (mm) (mm) (N) (N/m) 24.0963 -0.00821 2580.25 107.574 0.246127 10 0.5175 9.99908 0.00953887 45.2224 0.64116 3.19261 50.0451 0.538279 53832.8 52.3937 5.02453 2418.69 103.472 0.23075 10 0.485312 10.0006 0.0095403 47.8454 0.600308 3.19522 50.0477 0.504651 50462.1 79.7405 10.0246 2222.21 106.167 0.21198 10 0.445975 9.9994 0.00953917 49.898 0.552461 3.19725 50.0497 0.463601 46362.9 107.762 15.0023 1996.51 115.138 0.190439 10 0.400754 9.99883 0.00953862 52.5503 0.494782 3.19988 50.0523 0.416491 41654 135.838 19.9998 1726.89 135.74 0.164688 10 0.346694 9.99677 0.00953665 53.8564 0.423202 3.20115 50.0534 0.360172 36028.8 163.819 25.0108 1389.63 164.988 0.132562 10 0.279319 9.99956 0.00953932 52.703 0.337951 3.19996 50.052 0.289912 28992.5 192.723 29.9976 1026.88 164.835 0.0979035 10 0.205915 9.99402 0.00953404 78.3869 0.250801 3.22561 50.0776 0.214115 21424.3 220.798 35.0063 698.759 142.542 0.0666582 10 0.138988 9.99976 0.00953951 124.434 0.168109 3.27162 50.1228 0.145782 14578.5
250.42 4.00E+01 435.575 94.8187 0.0415273 10 0.0837693 9.9939 0.00953392 195.529 0.105439 3.34269 50.1935 0.0908203 9087.57 280.276 44.9986 235.367 63.5149 0.0224737 10 0.0421804 10.009 0.00954834 326.351 0.0570544 3.47349 50.3235 0.0491499 4910.57 311.121 49.9986 92.3245 28.2548 0.00880329 10 0.0119845 9.9952 0.00953516 709.532 0.0263505 3.85666 50.7064 0.0192528 1926.2 24.7002 0.00564271 2655.14 120.592 0.253224 31.6 0.448645 9.99726 0.00953712 45.8959 0.659297 3.19329 50.0457 0.553802 55395.4 52.9122 5.03E+00 2490.42 112.421 0.237513 31.6 0.415762 9.9972 0.00953707 48.3801 0.616555 3.19576 50.0482 0.519441 51958.7 80.4308 10.0246 2294.53 109.49 0.218862 31.6 0.376681 9.99863 0.00953843 50.7755 0.571476 3.19813 50.0505 0.478651 47871.7 108.452 15.0134 2074.98 113.509 0.197921 31.6 0.332779 9.99867 0.00953847 53.8874 0.515164 3.20122 50.0535 0.432854 43291.1 136.529 20.0086 1820.04 129.126 0.173601 31.6 0.28187 9.99847 0.00953828 56.2255 0.447801 3.20353 50.0554 0.379665 37972.3 164.511 25.0052 1507.07 155.931 0.143723 31.6 0.219646 9.99668 0.00953657 56.7074 0.366445 3.20398 50.0554 0.314322 31442.6
193.42 29.9973 1147.42 167.914 0.109449 31.6 0.148346 9.99891 0.0095387 84.1225 0.277171 3.23136 50.082 0.239364 23939 221.88 34.9997 809.367 154.194 0.0771433 31.6 0.0817464 9.99117 0.00953132 143.542 0.209976 3.29075 50.1363 0.168712 16886.2
251.228 39.9963 505.594 109.071 0.0481992 31.6 0.0273735 9.99311 0.00953317 211.254 0.122502 3.35842 50.205 0.105412 10548.4 281.055 44.9989 285.981 71.1598 0.0272866 31.6 0.0377228 10.0017 0.00954139 351.724 0.0697814 3.49887 50.3433 0.0596757 5966.54 311.991 49.9952 116.266 35.4453 0.0110881 31.6 0.0696304 9.99697 0.00953685 744.408 0.0288975 3.89153 50.7304 0.0242496 2425.7 24.9907 0.00087751 2779.26 155.864 0.265284 100 0.346467 10.0056 0.00954513 46.9039 0.701048 3.19432 50.0466 0.580176 57984.8 53.2012 5.02361 2611.4 145.181 0.249156 100 0.37939 10.0014 0.00954111 49.5027 0.659935 3.1969 50.0491 0.544904 54482.6 80.7213 10.018 2411.94 136.207 0.230142 100 0.418975 10.0021 0.00954175 52.0464 0.612352 3.19942 50.0516 0.50332 50321.3 108.761 15.0125 2194.04 132.923 0.209345 100 0.462481 10.0018 0.0095415 55.7559 0.5614 3.20311 50.0551 0.457837 45775.2 136.838 20.0243 1945.65 139.783 0.185634 100 0.51242 10.0013 0.00954099 59.1206 0.499515 3.20645 50.0582 0.405983 40593 164.838 25.0132 1651.79 165.025 0.157583 100 0.571977 10.0004 0.00954013 61.9635 0.429401 3.20926 50.0604 0.344634 34462 193.747 30.0116 1299.81 185.476 0.124027 100 0.643771 10.0023 0.00954194 92.833 0.343527 3.24009 50.0903 0.271248 27118.5 222.189 35.0011 950.666 174.441 0.0906726 100 0.71464 9.99798 0.00953781 154.517 0.257905 3.30174 50.1512 0.198301 19834.1 251.519 39.9912 614.597 140.114 0.0586314 100 0.783538 10.0001 0.00953981 233.111 0.175519 3.3803 50.2272 0.128227 12822.6 281.346 44.9809 362.49 89.9761 0.0345817 100 0.835335 10.0003 0.00954007 390.177 0.113844 3.53734 50.3792 0.0756303 7562.77
312.28 49.9928 159.962 42.5137 0.0152634 100 0.877356 10.0022 0.00954184 842.68 0.065737 3.98982 50.8136 0.033381 3337.36
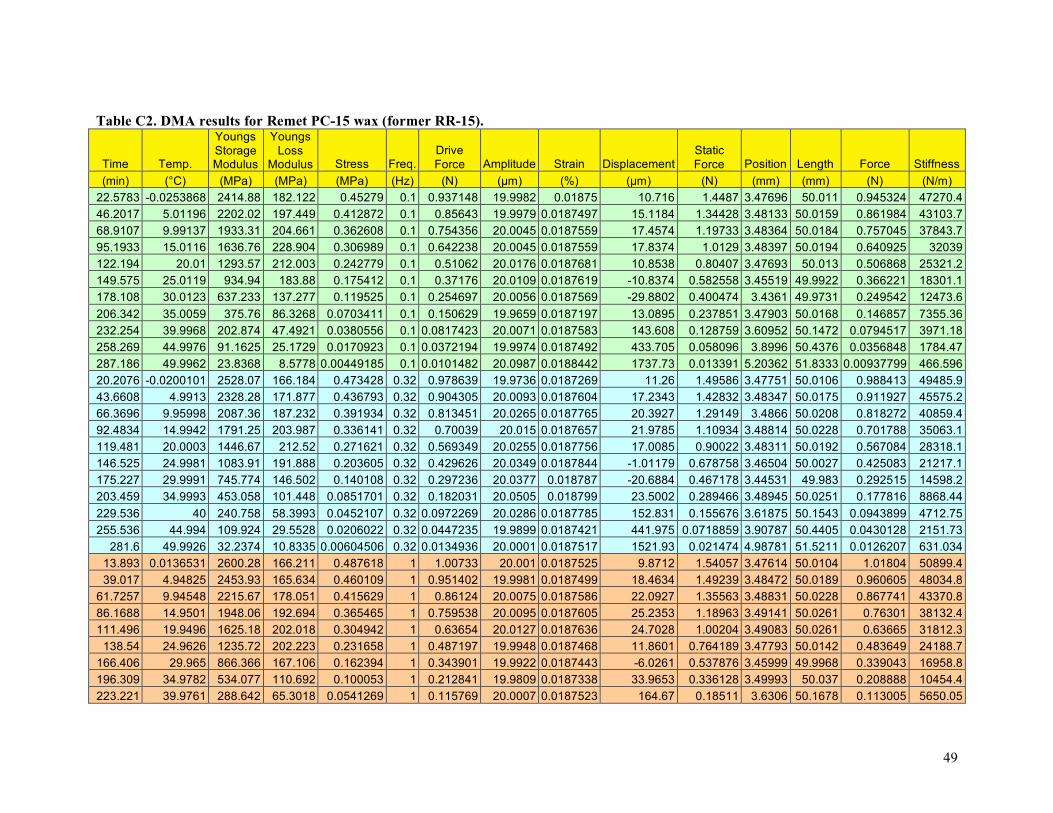
49
Table C2. DMA results for Remet PC-15 wax (former RR-15).
Time Temp.
Youngs Storage Modulus
Youngs Loss
Modulus Stress Freq. Drive Force Amplitude Strain Displacement
Static Force Position Length Force Stiffness
(min) (°C) (MPa) (MPa) (MPa) (Hz) (N) (µm) (%) (µm) (N) (mm) (mm) (N) (N/m) 22.5783 -0.0253868 2414.88 182.122 0.45279 0.1 0.937148 19.9982 0.01875 10.716 1.4487 3.47696 50.011 0.945324 47270.4 46.2017 5.01196 2202.02 197.449 0.412872 0.1 0.85643 19.9979 0.0187497 15.1184 1.34428 3.48133 50.0159 0.861984 43103.7 68.9107 9.99137 1933.31 204.661 0.362608 0.1 0.754356 20.0045 0.0187559 17.4574 1.19733 3.48364 50.0184 0.757045 37843.7 95.1933 15.0116 1636.76 228.904 0.306989 0.1 0.642238 20.0045 0.0187559 17.8374 1.0129 3.48397 50.0194 0.640925 32039 122.194 20.01 1293.57 212.003 0.242779 0.1 0.51062 20.0176 0.0187681 10.8538 0.80407 3.47693 50.013 0.506868 25321.2 149.575 25.0119 934.94 183.88 0.175412 0.1 0.37176 20.0109 0.0187619 -10.8374 0.582558 3.45519 49.9922 0.366221 18301.1 178.108 30.0123 637.233 137.277 0.119525 0.1 0.254697 20.0056 0.0187569 -29.8802 0.400474 3.4361 49.9731 0.249542 12473.6 206.342 35.0059 375.76 86.3268 0.0703411 0.1 0.150629 19.9659 0.0187197 13.0895 0.237851 3.47903 50.0168 0.146857 7355.36 232.254 39.9968 202.874 47.4921 0.0380556 0.1 0.0817423 20.0071 0.0187583 143.608 0.128759 3.60952 50.1472 0.0794517 3971.18 258.269 44.9976 91.1625 25.1729 0.0170923 0.1 0.0372194 19.9974 0.0187492 433.705 0.058096 3.8996 50.4376 0.0356848 1784.47 287.186 49.9962 23.8368 8.5778 0.00449185 0.1 0.0101482 20.0987 0.0188442 1737.73 0.013391 5.20362 51.8333 0.00937799 466.596 20.2076 -0.0200101 2528.07 166.184 0.473428 0.32 0.978639 19.9736 0.0187269 11.26 1.49586 3.47751 50.0106 0.988413 49485.9 43.6608 4.9913 2328.28 171.877 0.436793 0.32 0.904305 20.0093 0.0187604 17.2343 1.42832 3.48347 50.0175 0.911927 45575.2 66.3696 9.95998 2087.36 187.232 0.391934 0.32 0.813451 20.0265 0.0187765 20.3927 1.29149 3.4866 50.0208 0.818272 40859.4 92.4834 14.9942 1791.25 203.987 0.336141 0.32 0.70039 20.015 0.0187657 21.9785 1.10934 3.48814 50.0228 0.701788 35063.1 119.481 20.0003 1446.67 212.52 0.271621 0.32 0.569349 20.0255 0.0187756 17.0085 0.90022 3.48311 50.0192 0.567084 28318.1 146.525 24.9981 1083.91 191.888 0.203605 0.32 0.429626 20.0349 0.0187844 -1.01179 0.678758 3.46504 50.0027 0.425083 21217.1 175.227 29.9991 745.774 146.502 0.140108 0.32 0.297236 20.0377 0.018787 -20.6884 0.467178 3.44531 49.983 0.292515 14598.2 203.459 34.9993 453.058 101.448 0.0851701 0.32 0.182031 20.0505 0.018799 23.5002 0.289466 3.48945 50.0251 0.177816 8868.44 229.536 40 240.758 58.3993 0.0452107 0.32 0.0972269 20.0286 0.0187785 152.831 0.155676 3.61875 50.1543 0.0943899 4712.75 255.536 44.994 109.924 29.5528 0.0206022 0.32 0.0447235 19.9899 0.0187421 441.975 0.0718859 3.90787 50.4405 0.0430128 2151.73
281.6 49.9926 32.2374 10.8335 0.00604506 0.32 0.0134936 20.0001 0.0187517 1521.93 0.021474 4.98781 51.5211 0.0126207 631.034 13.893 0.0136531 2600.28 166.211 0.487618 1 1.00733 20.001 0.0187525 9.8712 1.54057 3.47614 50.0104 1.01804 50899.4 39.017 4.94825 2453.93 165.634 0.460109 1 0.951402 19.9981 0.0187499 18.4634 1.49239 3.48472 50.0189 0.960605 48034.8
61.7257 9.94548 2215.67 178.051 0.415629 1 0.86124 20.0075 0.0187586 22.0927 1.35563 3.48831 50.0228 0.867741 43370.8 86.1688 14.9501 1948.06 192.694 0.365465 1 0.759538 20.0095 0.0187605 25.2353 1.18963 3.49141 50.0261 0.76301 38132.4 111.496 19.9496 1625.18 202.018 0.304942 1 0.63654 20.0127 0.0187636 24.7028 1.00204 3.49083 50.0261 0.63665 31812.3
138.54 24.9626 1235.72 202.223 0.231658 1 0.487197 19.9948 0.0187468 11.8601 0.764189 3.47793 50.0142 0.483649 24188.7 166.406 29.965 866.366 167.106 0.162394 1 0.343901 19.9922 0.0187443 -6.0261 0.537876 3.45999 49.9968 0.339043 16958.8 196.309 34.9782 534.077 110.692 0.100053 1 0.212841 19.9809 0.0187338 33.9653 0.336128 3.49993 50.037 0.208888 10454.4 223.221 39.9761 288.642 65.3018 0.0541269 1 0.115769 20.0007 0.0187523 164.67 0.18511 3.6306 50.1678 0.113005 5650.05
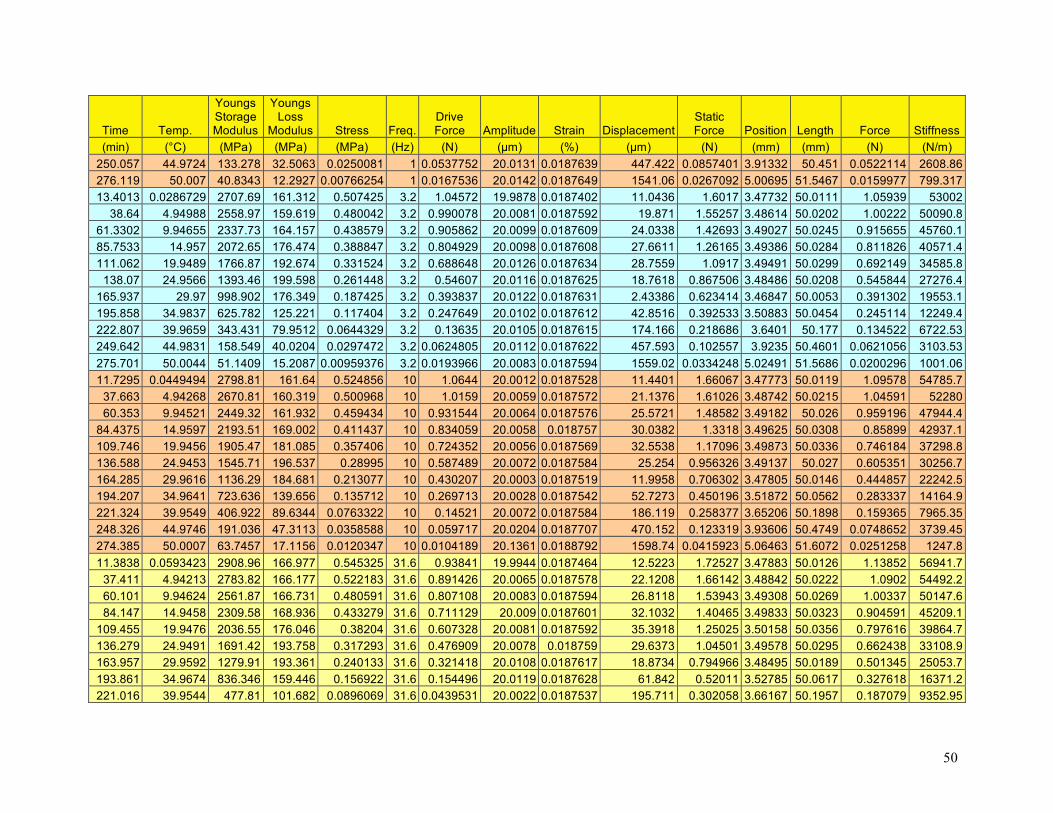
50
Time Temp.
Youngs Storage Modulus
Youngs Loss
Modulus Stress Freq. Drive Force Amplitude Strain Displacement
Static Force Position Length Force Stiffness
(min) (°C) (MPa) (MPa) (MPa) (Hz) (N) (µm) (%) (µm) (N) (mm) (mm) (N) (N/m) 250.057 44.9724 133.278 32.5063 0.0250081 1 0.0537752 20.0131 0.0187639 447.422 0.0857401 3.91332 50.451 0.0522114 2608.86 276.119 50.007 40.8343 12.2927 0.00766254 1 0.0167536 20.0142 0.0187649 1541.06 0.0267092 5.00695 51.5467 0.0159977 799.317 13.4013 0.0286729 2707.69 161.312 0.507425 3.2 1.04572 19.9878 0.0187402 11.0436 1.6017 3.47732 50.0111 1.05939 53002
38.64 4.94988 2558.97 159.619 0.480042 3.2 0.990078 20.0081 0.0187592 19.871 1.55257 3.48614 50.0202 1.00222 50090.8 61.3302 9.94655 2337.73 164.157 0.438579 3.2 0.905862 20.0099 0.0187609 24.0338 1.42693 3.49027 50.0245 0.915655 45760.1 85.7533 14.957 2072.65 176.474 0.388847 3.2 0.804929 20.0098 0.0187608 27.6611 1.26165 3.49386 50.0284 0.811826 40571.4 111.062 19.9489 1766.87 192.674 0.331524 3.2 0.688648 20.0126 0.0187634 28.7559 1.0917 3.49491 50.0299 0.692149 34585.8
138.07 24.9566 1393.46 199.598 0.261448 3.2 0.54607 20.0116 0.0187625 18.7618 0.867506 3.48486 50.0208 0.545844 27276.4 165.937 29.97 998.902 176.349 0.187425 3.2 0.393837 20.0122 0.0187631 2.43386 0.623414 3.46847 50.0053 0.391302 19553.1 195.858 34.9837 625.782 125.221 0.117404 3.2 0.247649 20.0102 0.0187612 42.8516 0.392533 3.50883 50.0454 0.245114 12249.4 222.807 39.9659 343.431 79.9512 0.0644329 3.2 0.13635 20.0105 0.0187615 174.166 0.218686 3.6401 50.177 0.134522 6722.53 249.642 44.9831 158.549 40.0204 0.0297472 3.2 0.0624805 20.0112 0.0187622 457.593 0.102557 3.9235 50.4601 0.0621056 3103.53 275.701 50.0044 51.1409 15.2087 0.00959376 3.2 0.0193966 20.0083 0.0187594 1559.02 0.0334248 5.02491 51.5686 0.0200296 1001.06 11.7295 0.0449494 2798.81 161.64 0.524856 10 1.0644 20.0012 0.0187528 11.4401 1.66067 3.47773 50.0119 1.09578 54785.7
37.663 4.94268 2670.81 160.319 0.500968 10 1.0159 20.0059 0.0187572 21.1376 1.61026 3.48742 50.0215 1.04591 52280 60.353 9.94521 2449.32 161.932 0.459434 10 0.931544 20.0064 0.0187576 25.5721 1.48582 3.49182 50.026 0.959196 47944.4
84.4375 14.9597 2193.51 169.002 0.411437 10 0.834059 20.0058 0.018757 30.0382 1.3318 3.49625 50.0308 0.85899 42937.1 109.746 19.9456 1905.47 181.085 0.357406 10 0.724352 20.0056 0.0187569 32.5538 1.17096 3.49873 50.0336 0.746184 37298.8 136.588 24.9453 1545.71 196.537 0.28995 10 0.587489 20.0072 0.0187584 25.254 0.956326 3.49137 50.027 0.605351 30256.7 164.285 29.9616 1136.29 184.681 0.213077 10 0.430207 20.0003 0.0187519 11.9958 0.706302 3.47805 50.0146 0.444857 22242.5 194.207 34.9641 723.636 139.656 0.135712 10 0.269713 20.0028 0.0187542 52.7273 0.450196 3.51872 50.0562 0.283337 14164.9 221.324 39.9549 406.922 89.6344 0.0763322 10 0.14521 20.0072 0.0187584 186.119 0.258377 3.65206 50.1898 0.159365 7965.35 248.326 44.9746 191.036 47.3113 0.0358588 10 0.059717 20.0204 0.0187707 470.152 0.123319 3.93606 50.4749 0.0748652 3739.45 274.385 50.0007 63.7457 17.1156 0.0120347 10 0.0104189 20.1361 0.0188792 1598.74 0.0415923 5.06463 51.6072 0.0251258 1247.8 11.3838 0.0593423 2908.96 166.977 0.545325 31.6 0.93841 19.9944 0.0187464 12.5223 1.72527 3.47883 50.0126 1.13852 56941.7
37.411 4.94213 2783.82 166.177 0.522183 31.6 0.891426 20.0065 0.0187578 22.1208 1.66142 3.48842 50.0222 1.0902 54492.2 60.101 9.94624 2561.87 166.731 0.480591 31.6 0.807108 20.0083 0.0187594 26.8118 1.53943 3.49308 50.0269 1.00337 50147.6 84.147 14.9458 2309.58 168.936 0.433279 31.6 0.711129 20.009 0.0187601 32.1032 1.40465 3.49833 50.0323 0.904591 45209.1
109.455 19.9476 2036.55 176.046 0.38204 31.6 0.607328 20.0081 0.0187592 35.3918 1.25025 3.50158 50.0356 0.797616 39864.7 136.279 24.9491 1691.42 193.758 0.317293 31.6 0.476909 20.0078 0.018759 29.6373 1.04501 3.49578 50.0295 0.662438 33108.9 163.957 29.9592 1279.91 193.361 0.240133 31.6 0.321418 20.0108 0.0187617 18.8734 0.794966 3.48495 50.0189 0.501345 25053.7 193.861 34.9674 836.346 159.446 0.156922 31.6 0.154496 20.0119 0.0187628 61.842 0.52011 3.52785 50.0617 0.327618 16371.2 221.016 39.9544 477.81 101.682 0.0896069 31.6 0.0439531 20.0022 0.0187537 195.711 0.302058 3.66167 50.1957 0.187079 9352.95
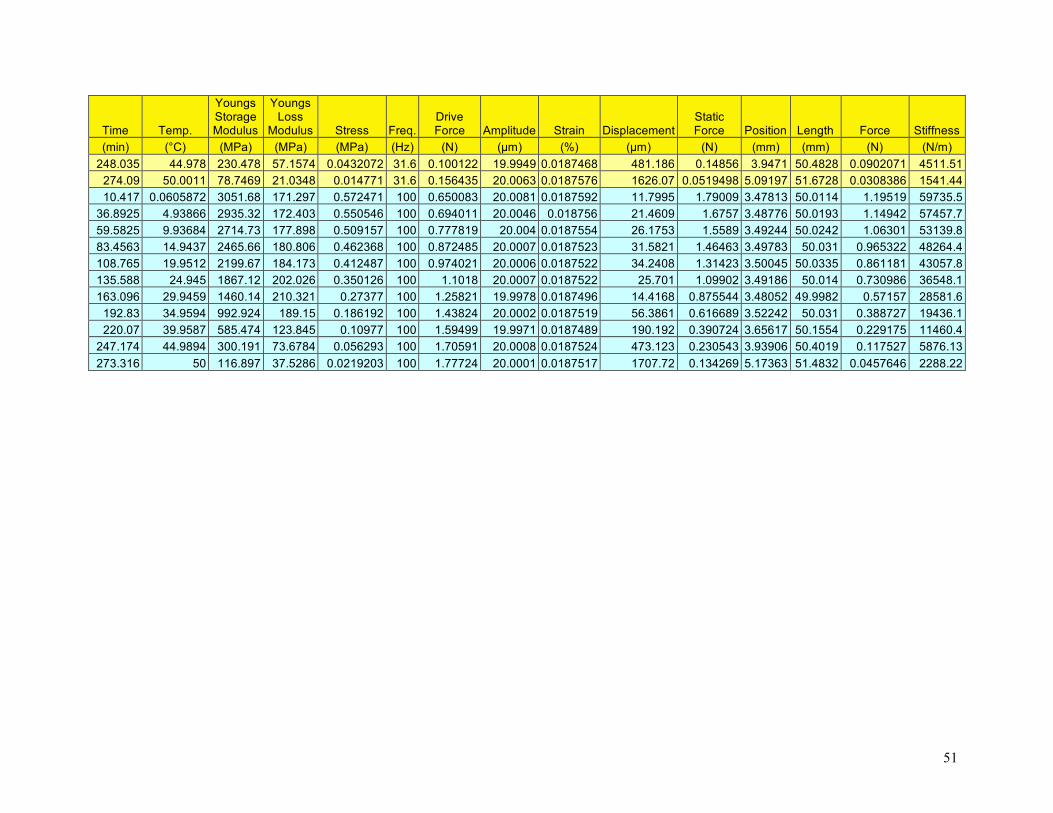
51
Time Temp.
Youngs Storage Modulus
Youngs Loss
Modulus Stress Freq. Drive Force Amplitude Strain Displacement
Static Force Position Length Force Stiffness
(min) (°C) (MPa) (MPa) (MPa) (Hz) (N) (µm) (%) (µm) (N) (mm) (mm) (N) (N/m) 248.035 44.978 230.478 57.1574 0.0432072 31.6 0.100122 19.9949 0.0187468 481.186 0.14856 3.9471 50.4828 0.0902071 4511.51
274.09 50.0011 78.7469 21.0348 0.014771 31.6 0.156435 20.0063 0.0187576 1626.07 0.0519498 5.09197 51.6728 0.0308386 1541.44 10.417 0.0605872 3051.68 171.297 0.572471 100 0.650083 20.0081 0.0187592 11.7995 1.79009 3.47813 50.0114 1.19519 59735.5
36.8925 4.93866 2935.32 172.403 0.550546 100 0.694011 20.0046 0.018756 21.4609 1.6757 3.48776 50.0193 1.14942 57457.7 59.5825 9.93684 2714.73 177.898 0.509157 100 0.777819 20.004 0.0187554 26.1753 1.5589 3.49244 50.0242 1.06301 53139.8 83.4563 14.9437 2465.66 180.806 0.462368 100 0.872485 20.0007 0.0187523 31.5821 1.46463 3.49783 50.031 0.965322 48264.4 108.765 19.9512 2199.67 184.173 0.412487 100 0.974021 20.0006 0.0187522 34.2408 1.31423 3.50045 50.0335 0.861181 43057.8 135.588 24.945 1867.12 202.026 0.350126 100 1.1018 20.0007 0.0187522 25.701 1.09902 3.49186 50.014 0.730986 36548.1 163.096 29.9459 1460.14 210.321 0.27377 100 1.25821 19.9978 0.0187496 14.4168 0.875544 3.48052 49.9982 0.57157 28581.6
192.83 34.9594 992.924 189.15 0.186192 100 1.43824 20.0002 0.0187519 56.3861 0.616689 3.52242 50.031 0.388727 19436.1 220.07 39.9587 585.474 123.845 0.10977 100 1.59499 19.9971 0.0187489 190.192 0.390724 3.65617 50.1554 0.229175 11460.4
247.174 44.9894 300.191 73.6784 0.056293 100 1.70591 20.0008 0.0187524 473.123 0.230543 3.93906 50.4019 0.117527 5876.13 273.316 50 116.897 37.5286 0.0219203 100 1.77724 20.0001 0.0187517 1707.72 0.134269 5.17363 51.4832 0.0457646 2288.22
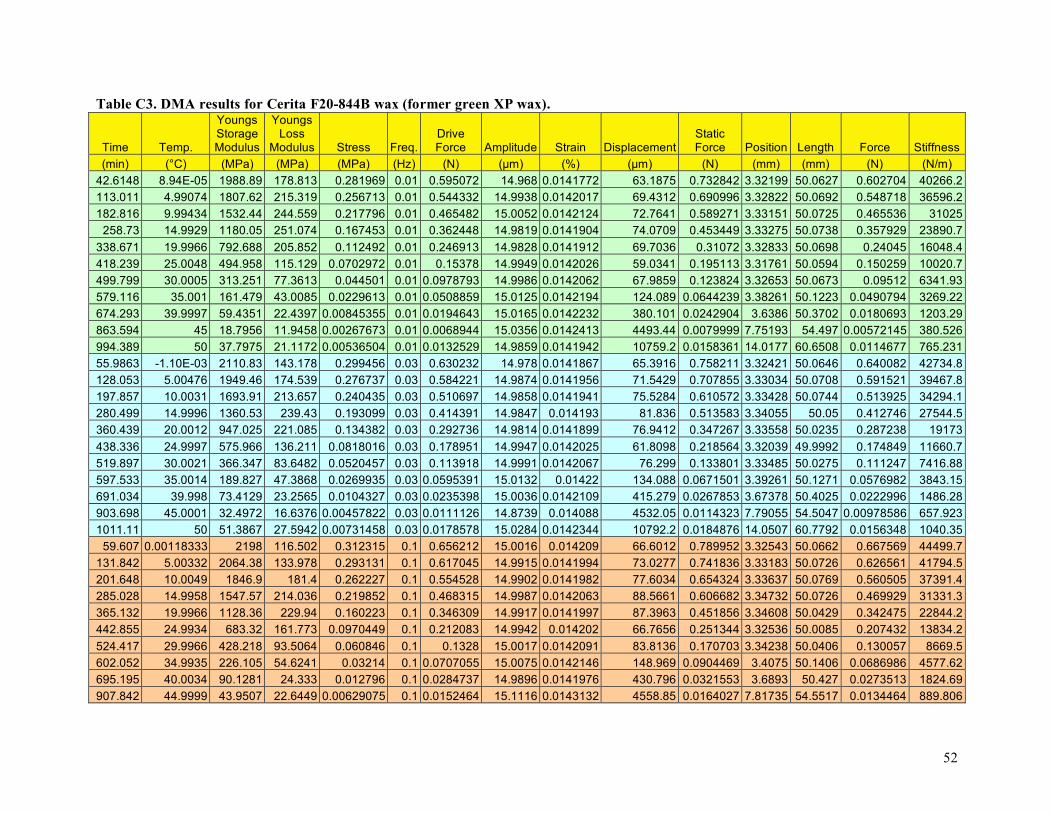
52
Table C3. DMA results for Cerita F20-844B wax (former green XP wax).
Time Temp.
Youngs Storage Modulus
Youngs Loss
Modulus Stress Freq. Drive Force Amplitude Strain Displacement
Static Force Position Length Force Stiffness
(min) (°C) (MPa) (MPa) (MPa) (Hz) (N) (µm) (%) (µm) (N) (mm) (mm) (N) (N/m) 42.6148 8.94E-05 1988.89 178.813 0.281969 0.01 0.595072 14.968 0.0141772 63.1875 0.732842 3.32199 50.0627 0.602704 40266.2 113.011 4.99074 1807.62 215.319 0.256713 0.01 0.544332 14.9938 0.0142017 69.4312 0.690996 3.32822 50.0692 0.548718 36596.2 182.816 9.99434 1532.44 244.559 0.217796 0.01 0.465482 15.0052 0.0142124 72.7641 0.589271 3.33151 50.0725 0.465536 31025
258.73 14.9929 1180.05 251.074 0.167453 0.01 0.362448 14.9819 0.0141904 74.0709 0.453449 3.33275 50.0738 0.357929 23890.7 338.671 19.9966 792.688 205.852 0.112492 0.01 0.246913 14.9828 0.0141912 69.7036 0.31072 3.32833 50.0698 0.24045 16048.4 418.239 25.0048 494.958 115.129 0.0702972 0.01 0.15378 14.9949 0.0142026 59.0341 0.195113 3.31761 50.0594 0.150259 10020.7 499.799 30.0005 313.251 77.3613 0.044501 0.01 0.0978793 14.9986 0.0142062 67.9859 0.123824 3.32653 50.0673 0.09512 6341.93 579.116 35.001 161.479 43.0085 0.0229613 0.01 0.0508859 15.0125 0.0142194 124.089 0.0644239 3.38261 50.1223 0.0490794 3269.22 674.293 39.9997 59.4351 22.4397 0.00845355 0.01 0.0194643 15.0165 0.0142232 380.101 0.0242904 3.6386 50.3702 0.0180693 1203.29 863.594 45 18.7956 11.9458 0.00267673 0.01 0.0068944 15.0356 0.0142413 4493.44 0.0079999 7.75193 54.497 0.00572145 380.526 994.389 50 37.7975 21.1172 0.00536504 0.01 0.0132529 14.9859 0.0141942 10759.2 0.0158361 14.0177 60.6508 0.0114677 765.231 55.9863 -1.10E-03 2110.83 143.178 0.299456 0.03 0.630232 14.978 0.0141867 65.3916 0.758211 3.32421 50.0646 0.640082 42734.8 128.053 5.00476 1949.46 174.539 0.276737 0.03 0.584221 14.9874 0.0141956 71.5429 0.707855 3.33034 50.0708 0.591521 39467.8 197.857 10.0031 1693.91 213.657 0.240435 0.03 0.510697 14.9858 0.0141941 75.5284 0.610572 3.33428 50.0744 0.513925 34294.1 280.499 14.9996 1360.53 239.43 0.193099 0.03 0.414391 14.9847 0.014193 81.836 0.513583 3.34055 50.05 0.412746 27544.5 360.439 20.0012 947.025 221.085 0.134382 0.03 0.292736 14.9814 0.0141899 76.9412 0.347267 3.33558 50.0235 0.287238 19173 438.336 24.9997 575.966 136.211 0.0818016 0.03 0.178951 14.9947 0.0142025 61.8098 0.218564 3.32039 49.9992 0.174849 11660.7 519.897 30.0021 366.347 83.6482 0.0520457 0.03 0.113918 14.9991 0.0142067 76.299 0.133801 3.33485 50.0275 0.111247 7416.88 597.533 35.0014 189.827 47.3868 0.0269935 0.03 0.0595391 15.0132 0.01422 134.088 0.0671501 3.39261 50.1271 0.0576982 3843.15 691.034 39.998 73.4129 23.2565 0.0104327 0.03 0.0235398 15.0036 0.0142109 415.279 0.0267853 3.67378 50.4025 0.0222996 1486.28 903.698 45.0001 32.4972 16.6376 0.00457822 0.03 0.0111126 14.8739 0.014088 4532.05 0.0114323 7.79055 54.5047 0.00978586 657.923 1011.11 50 51.3867 27.5942 0.00731458 0.03 0.0178578 15.0284 0.0142344 10792.2 0.0184876 14.0507 60.7792 0.0156348 1040.35
59.607 0.00118333 2198 116.502 0.312315 0.1 0.656212 15.0016 0.014209 66.6012 0.789952 3.32543 50.0662 0.667569 44499.7 131.842 5.00332 2064.38 133.978 0.293131 0.1 0.617045 14.9915 0.0141994 73.0277 0.741836 3.33183 50.0726 0.626561 41794.5 201.648 10.0049 1846.9 181.4 0.262227 0.1 0.554528 14.9902 0.0141982 77.6034 0.654324 3.33637 50.0769 0.560505 37391.4 285.028 14.9958 1547.57 214.036 0.219852 0.1 0.468315 14.9987 0.0142063 88.5661 0.606682 3.34732 50.0726 0.469929 31331.3 365.132 19.9966 1128.36 229.94 0.160223 0.1 0.346309 14.9917 0.0141997 87.3963 0.451856 3.34608 50.0429 0.342475 22844.2 442.855 24.9934 683.32 161.773 0.0970449 0.1 0.212083 14.9942 0.014202 66.7656 0.251344 3.32536 50.0085 0.207432 13834.2 524.417 29.9966 428.218 93.5064 0.060846 0.1 0.1328 15.0017 0.0142091 83.8136 0.170703 3.34238 50.0406 0.130057 8669.5 602.052 34.9935 226.105 54.6241 0.03214 0.1 0.0707055 15.0075 0.0142146 148.969 0.0904469 3.4075 50.1406 0.0686986 4577.62 695.195 40.0034 90.1281 24.333 0.012796 0.1 0.0284737 14.9896 0.0141976 430.796 0.0321553 3.6893 50.427 0.0273513 1824.69 907.842 44.9999 43.9507 22.6449 0.00629075 0.1 0.0152464 15.1116 0.0143132 4558.85 0.0164027 7.81735 54.5517 0.0134464 889.806
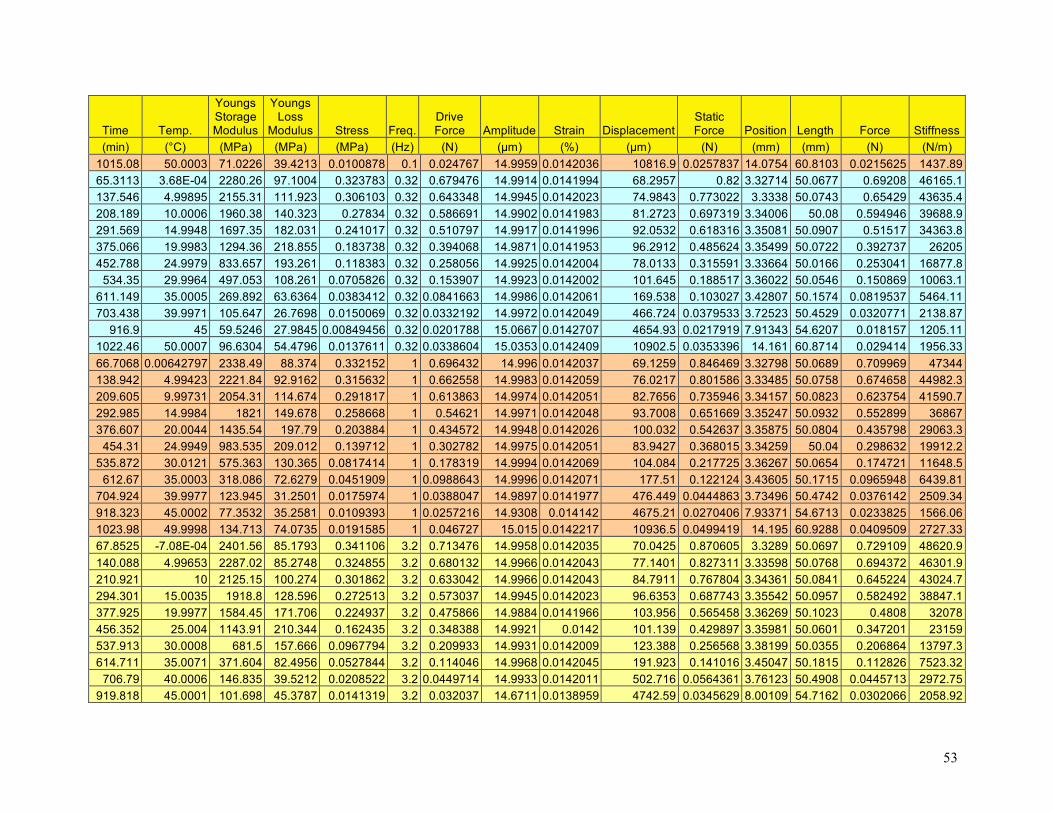
53
Time Temp.
Youngs Storage Modulus
Youngs Loss
Modulus Stress Freq. Drive Force Amplitude Strain Displacement
Static Force Position Length Force Stiffness
(min) (°C) (MPa) (MPa) (MPa) (Hz) (N) (µm) (%) (µm) (N) (mm) (mm) (N) (N/m) 1015.08 50.0003 71.0226 39.4213 0.0100878 0.1 0.024767 14.9959 0.0142036 10816.9 0.0257837 14.0754 60.8103 0.0215625 1437.89 65.3113 3.68E-04 2280.26 97.1004 0.323783 0.32 0.679476 14.9914 0.0141994 68.2957 0.82 3.32714 50.0677 0.69208 46165.1 137.546 4.99895 2155.31 111.923 0.306103 0.32 0.643348 14.9945 0.0142023 74.9843 0.773022 3.3338 50.0743 0.65429 43635.4 208.189 10.0006 1960.38 140.323 0.27834 0.32 0.586691 14.9902 0.0141983 81.2723 0.697319 3.34006 50.08 0.594946 39688.9 291.569 14.9948 1697.35 182.031 0.241017 0.32 0.510797 14.9917 0.0141996 92.0532 0.618316 3.35081 50.0907 0.51517 34363.8 375.066 19.9983 1294.36 218.855 0.183738 0.32 0.394068 14.9871 0.0141953 96.2912 0.485624 3.35499 50.0722 0.392737 26205 452.788 24.9979 833.657 193.261 0.118383 0.32 0.258056 14.9925 0.0142004 78.0133 0.315591 3.33664 50.0166 0.253041 16877.8
534.35 29.9964 497.053 108.261 0.0705826 0.32 0.153907 14.9923 0.0142002 101.645 0.188517 3.36022 50.0546 0.150869 10063.1 611.149 35.0005 269.892 63.6364 0.0383412 0.32 0.0841663 14.9986 0.0142061 169.538 0.103027 3.42807 50.1574 0.0819537 5464.11 703.438 39.9971 105.647 26.7698 0.0150069 0.32 0.0332192 14.9972 0.0142049 466.724 0.0379533 3.72523 50.4529 0.0320771 2138.87
916.9 45 59.5246 27.9845 0.00849456 0.32 0.0201788 15.0667 0.0142707 4654.93 0.0217919 7.91343 54.6207 0.018157 1205.11 1022.46 50.0007 96.6304 54.4796 0.0137611 0.32 0.0338604 15.0353 0.0142409 10902.5 0.0353396 14.161 60.8714 0.029414 1956.33 66.7068 0.00642797 2338.49 88.374 0.332152 1 0.696432 14.996 0.0142037 69.1259 0.846469 3.32798 50.0689 0.709969 47344 138.942 4.99423 2221.84 92.9162 0.315632 1 0.662558 14.9983 0.0142059 76.0217 0.801586 3.33485 50.0758 0.674658 44982.3 209.605 9.99731 2054.31 114.674 0.291817 1 0.613863 14.9974 0.0142051 82.7656 0.735946 3.34157 50.0823 0.623754 41590.7 292.985 14.9984 1821 149.678 0.258668 1 0.54621 14.9971 0.0142048 93.7008 0.651669 3.35247 50.0932 0.552899 36867 376.607 20.0044 1435.54 197.79 0.203884 1 0.434572 14.9948 0.0142026 100.032 0.542637 3.35875 50.0804 0.435798 29063.3
454.31 24.9949 983.535 209.012 0.139712 1 0.302782 14.9975 0.0142051 83.9427 0.368015 3.34259 50.04 0.298632 19912.2 535.872 30.0121 575.363 130.365 0.0817414 1 0.178319 14.9994 0.0142069 104.084 0.217725 3.36267 50.0654 0.174721 11648.5
612.67 35.0003 318.086 72.6279 0.0451909 1 0.0988643 14.9996 0.0142071 177.51 0.122124 3.43605 50.1715 0.0965948 6439.81 704.924 39.9977 123.945 31.2501 0.0175974 1 0.0388047 14.9897 0.0141977 476.449 0.0444863 3.73496 50.4742 0.0376142 2509.34 918.323 45.0002 77.3532 35.2581 0.0109393 1 0.0257216 14.9308 0.014142 4675.21 0.0270406 7.93371 54.6713 0.0233825 1566.06 1023.98 49.9998 134.713 74.0735 0.0191585 1 0.046727 15.015 0.0142217 10936.5 0.0499419 14.195 60.9288 0.0409509 2727.33 67.8525 -7.08E-04 2401.56 85.1793 0.341106 3.2 0.713476 14.9958 0.0142035 70.0425 0.870605 3.3289 50.0697 0.729109 48620.9 140.088 4.99653 2287.02 85.2748 0.324855 3.2 0.680132 14.9966 0.0142043 77.1401 0.827311 3.33598 50.0768 0.694372 46301.9 210.921 10 2125.15 100.274 0.301862 3.2 0.633042 14.9966 0.0142043 84.7911 0.767804 3.34361 50.0841 0.645224 43024.7 294.301 15.0035 1918.8 128.596 0.272513 3.2 0.573037 14.9945 0.0142023 96.6353 0.687743 3.35542 50.0957 0.582492 38847.1 377.925 19.9977 1584.45 171.706 0.224937 3.2 0.475866 14.9884 0.0141966 103.956 0.565458 3.36269 50.1023 0.4808 32078 456.352 25.004 1143.91 210.344 0.162435 3.2 0.348388 14.9921 0.0142 101.139 0.429897 3.35981 50.0601 0.347201 23159 537.913 30.0008 681.5 157.666 0.0967794 3.2 0.209933 14.9931 0.0142009 123.388 0.256568 3.38199 50.0355 0.206864 13797.3 614.711 35.0071 371.604 82.4956 0.0527844 3.2 0.114046 14.9968 0.0142045 191.923 0.141016 3.45047 50.1815 0.112826 7523.32
706.79 40.0006 146.835 39.5212 0.0208522 3.2 0.0449714 14.9933 0.0142011 502.716 0.0564361 3.76123 50.4908 0.0445713 2972.75 919.818 45.0001 101.698 45.3787 0.0141319 3.2 0.032037 14.6711 0.0138959 4742.59 0.0345629 8.00109 54.7162 0.0302066 2058.92
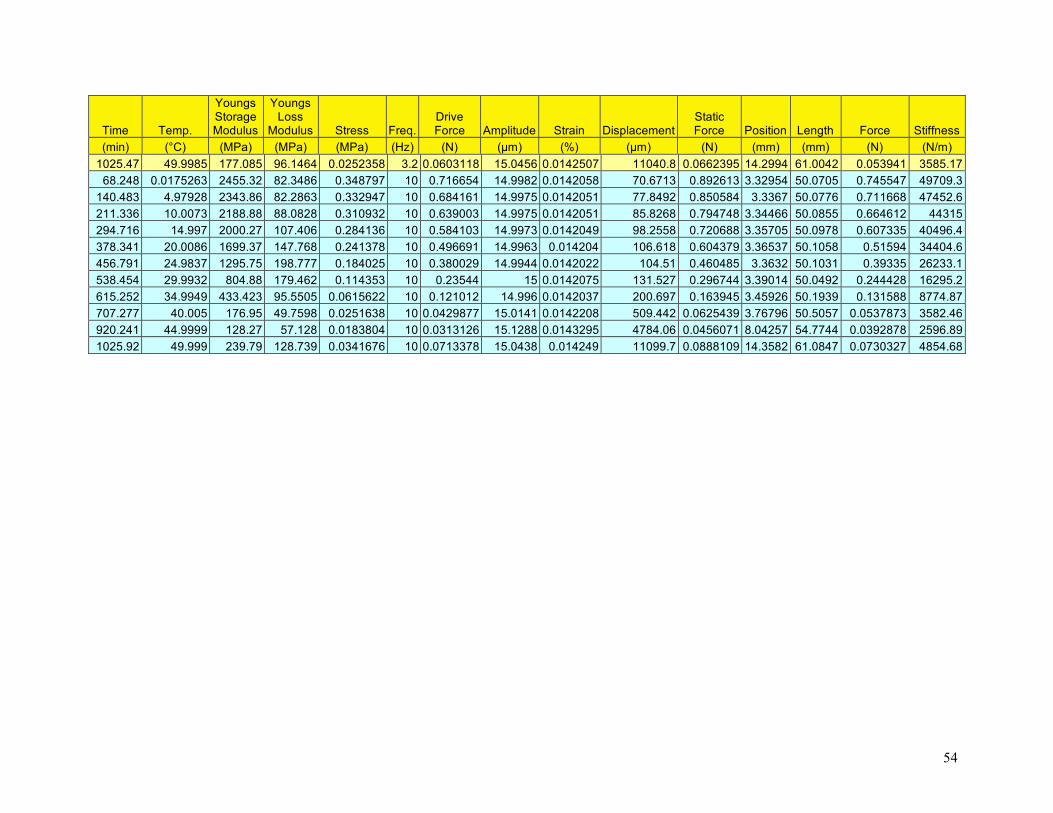
54
Time Temp.
Youngs Storage Modulus
Youngs Loss
Modulus Stress Freq. Drive Force Amplitude Strain Displacement
Static Force Position Length Force Stiffness
(min) (°C) (MPa) (MPa) (MPa) (Hz) (N) (µm) (%) (µm) (N) (mm) (mm) (N) (N/m) 1025.47 49.9985 177.085 96.1464 0.0252358 3.2 0.0603118 15.0456 0.0142507 11040.8 0.0662395 14.2994 61.0042 0.053941 3585.17
68.248 0.0175263 2455.32 82.3486 0.348797 10 0.716654 14.9982 0.0142058 70.6713 0.892613 3.32954 50.0705 0.745547 49709.3 140.483 4.97928 2343.86 82.2863 0.332947 10 0.684161 14.9975 0.0142051 77.8492 0.850584 3.3367 50.0776 0.711668 47452.6 211.336 10.0073 2188.88 88.0828 0.310932 10 0.639003 14.9975 0.0142051 85.8268 0.794748 3.34466 50.0855 0.664612 44315 294.716 14.997 2000.27 107.406 0.284136 10 0.584103 14.9973 0.0142049 98.2558 0.720688 3.35705 50.0978 0.607335 40496.4 378.341 20.0086 1699.37 147.768 0.241378 10 0.496691 14.9963 0.014204 106.618 0.604379 3.36537 50.1058 0.51594 34404.6 456.791 24.9837 1295.75 198.777 0.184025 10 0.380029 14.9944 0.0142022 104.51 0.460485 3.3632 50.1031 0.39335 26233.1 538.454 29.9932 804.88 179.462 0.114353 10 0.23544 15 0.0142075 131.527 0.296744 3.39014 50.0492 0.244428 16295.2 615.252 34.9949 433.423 95.5505 0.0615622 10 0.121012 14.996 0.0142037 200.697 0.163945 3.45926 50.1939 0.131588 8774.87 707.277 40.005 176.95 49.7598 0.0251638 10 0.0429877 15.0141 0.0142208 509.442 0.0625439 3.76796 50.5057 0.0537873 3582.46 920.241 44.9999 128.27 57.128 0.0183804 10 0.0313126 15.1288 0.0143295 4784.06 0.0456071 8.04257 54.7744 0.0392878 2596.89 1025.92 49.999 239.79 128.739 0.0341676 10 0.0713378 15.0438 0.014249 11099.7 0.0888109 14.3582 61.0847 0.0730327 4854.68
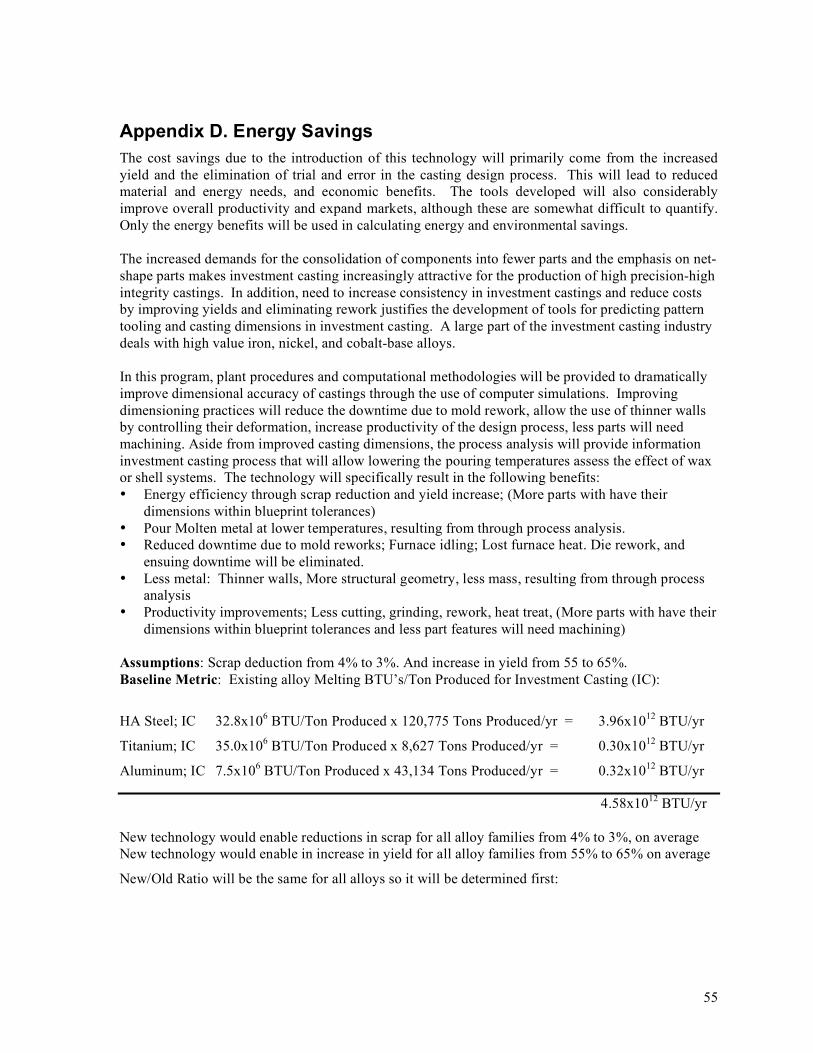
55
Appendix D. Energy Savings The cost savings due to the introduction of this technology will primarily come from the increased yield and the elimination of trial and error in the casting design process. This will lead to reduced material and energy needs, and economic benefits. The tools developed will also considerably improve overall productivity and expand markets, although these are somewhat difficult to quantify. Only the energy benefits will be used in calculating energy and environmental savings.
The increased demands for the consolidation of components into fewer parts and the emphasis on net-shape parts makes investment casting increasingly attractive for the production of high precision-high integrity castings. In addition, need to increase consistency in investment castings and reduce costs by improving yields and eliminating rework justifies the development of tools for predicting pattern tooling and casting dimensions in investment casting. A large part of the investment casting industry deals with high value iron, nickel, and cobalt-base alloys. In this program, plant procedures and computational methodologies will be provided to dramatically improve dimensional accuracy of castings through the use of computer simulations. Improving dimensioning practices will reduce the downtime due to mold rework, allow the use of thinner walls by controlling their deformation, increase productivity of the design process, less parts will need machining. Aside from improved casting dimensions, the process analysis will provide information investment casting process that will allow lowering the pouring temperatures assess the effect of wax or shell systems. The technology will specifically result in the following benefits: • Energy efficiency through scrap reduction and yield increase; (More parts with have their
dimensions within blueprint tolerances) • Pour Molten metal at lower temperatures, resulting from through process analysis. • Reduced downtime due to mold reworks; Furnace idling; Lost furnace heat. Die rework, and
ensuing downtime will be eliminated. • Less metal: Thinner walls, More structural geometry, less mass, resulting from through process
analysis • Productivity improvements; Less cutting, grinding, rework, heat treat, (More parts with have their
dimensions within blueprint tolerances and less part features will need machining)
Assumptions: Scrap deduction from 4% to 3%. And increase in yield from 55 to 65%. Baseline Metric: Existing alloy Melting BTU’s/Ton Produced for Investment Casting (IC):
HA Steel; IC 32.8x10⁶ BTU/Ton Produced x 120,775 Tons Produced/yr = 3.96x10¹² BTU/yr
Titanium; IC 35.0x10⁶ BTU/Ton Produced x 8,627 Tons Produced/yr = 0.30x10¹² BTU/yr
Aluminum; IC 7.5x10⁶ BTU/Ton Produced x 43,134 Tons Produced/yr = 0.32x10¹² BTU/yr
4.58x10¹² BTU/yr New technology would enable reductions in scrap for all alloy families from 4% to 3%, on average New technology would enable in increase in yield for all alloy families from 55% to 65% on average
New/Old Ratio will be the same for all alloys so it will be determined first:
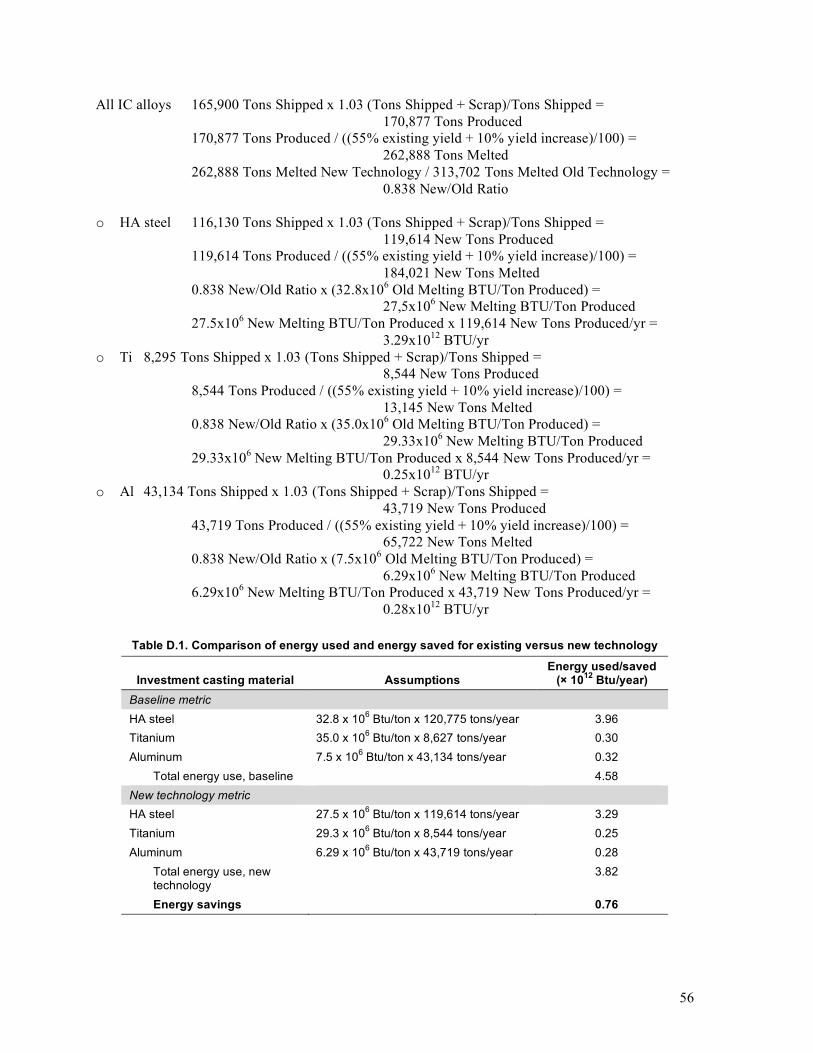
56
All IC alloys 165,900 Tons Shipped x 1.03 (Tons Shipped + Scrap)/Tons Shipped = 170,877 Tons Produced
170,877 Tons Produced / ((55% existing yield + 10% yield increase)/100) = 262,888 Tons Melted
262,888 Tons Melted New Technology / 313,702 Tons Melted Old Technology = 0.838 New/Old Ratio
o HA steel 116,130 Tons Shipped x 1.03 (Tons Shipped + Scrap)/Tons Shipped =
119,614 New Tons Produced 119,614 Tons Produced / ((55% existing yield + 10% yield increase)/100) =
184,021 New Tons Melted 0.838 New/Old Ratio x (32.8x10⁶ Old Melting BTU/Ton Produced) =
27,5x10⁶ New Melting BTU/Ton Produced 27.5x10⁶ New Melting BTU/Ton Produced x 119,614 New Tons Produced/yr =
3.29x10¹² BTU/yr o Ti 8,295 Tons Shipped x 1.03 (Tons Shipped + Scrap)/Tons Shipped =
8,544 New Tons Produced 8,544 Tons Produced / ((55% existing yield + 10% yield increase)/100) =
13,145 New Tons Melted 0.838 New/Old Ratio x (35.0x10⁶ Old Melting BTU/Ton Produced) =
29.33x10⁶ New Melting BTU/Ton Produced 29.33x10⁶ New Melting BTU/Ton Produced x 8,544 New Tons Produced/yr =
0.25x10¹² BTU/yr o Al 43,134 Tons Shipped x 1.03 (Tons Shipped + Scrap)/Tons Shipped =
43,719 New Tons Produced 43,719 Tons Produced / ((55% existing yield + 10% yield increase)/100) =
65,722 New Tons Melted 0.838 New/Old Ratio x (7.5x10⁶ Old Melting BTU/Ton Produced) =
6.29x10⁶ New Melting BTU/Ton Produced 6.29x10⁶ New Melting BTU/Ton Produced x 43,719 New Tons Produced/yr =
0.28x10¹² BTU/yr
Table D.1. Comparison of energy used and energy saved for existing versus new technology
Investment casting material Assumptions Energy used/saved
(× 1012 Btu/year) Baseline metric HA steel 32.8 x 10⁶ Btu/ton x 120,775 tons/year 3.96 Titanium 35.0 x 10⁶ Btu/ton x 8,627 tons/year 0.30 Aluminum 7.5 x 10⁶ Btu/ton x 43,134 tons/year 0.32 Total energy use, baseline 4.58 New technology metric HA steel 27.5 x 10⁶ Btu/ton x 119,614 tons/year 3.29 Titanium 29.3 x 10⁶ Btu/ton x 8,544 tons/year 0.25 Aluminum 6.29 x 10⁶ Btu/ton x 43,719 tons/year 0.28 Total energy use, new
technology 3.82
Energy savings 0.76