Rapid Tooling for Die, Squeeze and Permanent Mold Casting
31
Fall 2013 Revenue Forecast January 28, 2014 Department of Revenue Angela M. Rodell Commissioner Alaska Department of Revenue
Transcript of Rapid Tooling for Die, Squeeze and Permanent Mold Casting

Fall 2013 Revenue Forecast
January 28, 2014
Department of Revenue
Angela M. Rodell Commissioner
Alaska Department of Revenue

2
FALL 2013
Revenue Forecast

3
UNRESTRICTED REVENUE FORECAST 2012-2022
Source: Department of Revenue - Revenue Sources Book Fall 2013

4
CONTRIBUTORS OF CHANGES IN FY2013 REVENUE - ACTUAL
Source: Department of Revenue - Revenue Sources Book Fall 2013 / 2012
• Average Production Tax Value per barrel fell from about $79 to
about $68.
• General Fund Unrestricted Revenue fell $2.5 billion

5
FALL 2013 HIGHLIGHTS
• Oil price and production levels have been reduced relative to the 2013 Spring Forecast.
• Correspondingly, unrestricted revenues have been revised down from the Spring 2013 Forecast.
• Revenue impacts largely due to changes in oil price, production, lease expenditures, and tariffs.
• Substantial (~$10 billion) increase in spending on the North Slope over the next 10 years.
• Oil companies project increased North Slope production following the increased activity.
• DOR continues to prudently assess future production and the forecast is not intended as a comprehensive assessment of all the potential activity or projects under evaluation.
• State investment earnings are strong.

6
GENERAL FUND UNRESTRICTED OIL REVENUES ( MILLIONS$ )
Source: Department of Revenue - Revenue Sources Book Fall 2013 page 7

7
Source: Department of Revenue - Revenue Sources Book Fall 2013 pages 8-9
GENERAL FUND UNRESTRICTED OTHER REVENUES
( MILLIONS$ )
8
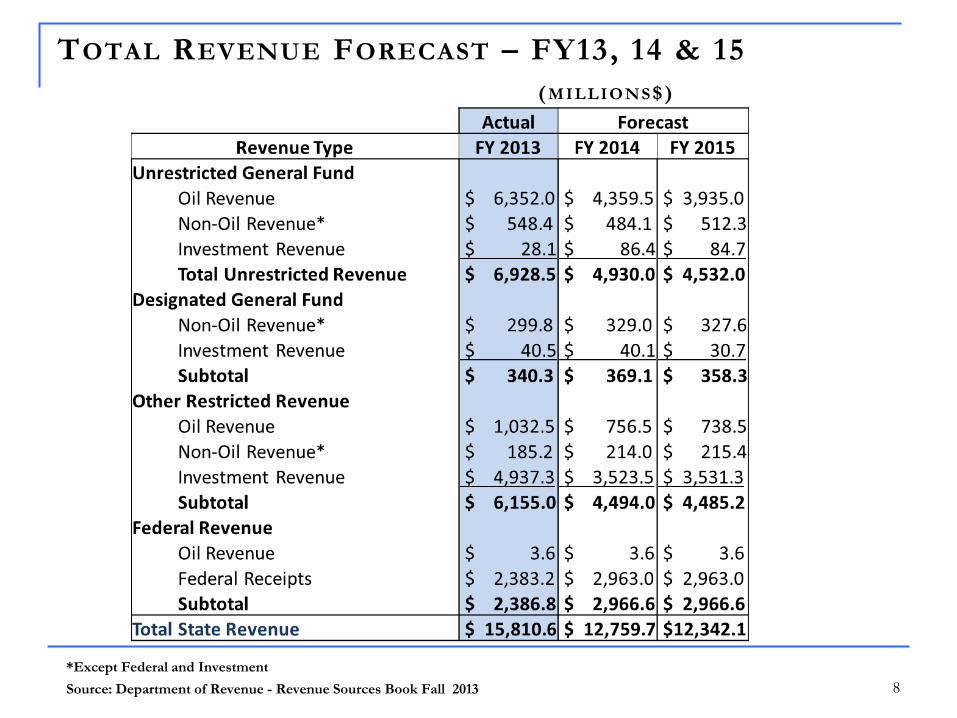
TOTAL REVENUE FORECAST – FY13, 14 & 15
( MILLIONS$ )
Source: Department of Revenue - Revenue Sources Book Fall 2013
*Except Federal and Investment

9
GENERAL FUND UNRESTRICTED REVENUE
PRICE SENSITIVITY FY2014-2016
Source: Department of Revenue - Revenue Sources Book Fall 2013 page 88

10
FALL 2013 TOTAL REVENUE FORECAST
Source: Department of Revenue - Revenue Sources Book Fall 2013
2004 2005 2006 2007 2008 2009 2010 2011 2012 2013 2014 2015 2016 2017 2018 2019 2020 2021 2022 2023
Production 973.8 911.3 839.7 734.2 715.4 692.8 642.6 599.9 579.4 531.6 508.2 498.4 487.6 482.7 459.5 429.1 399.6 368.8 340.1 312.9
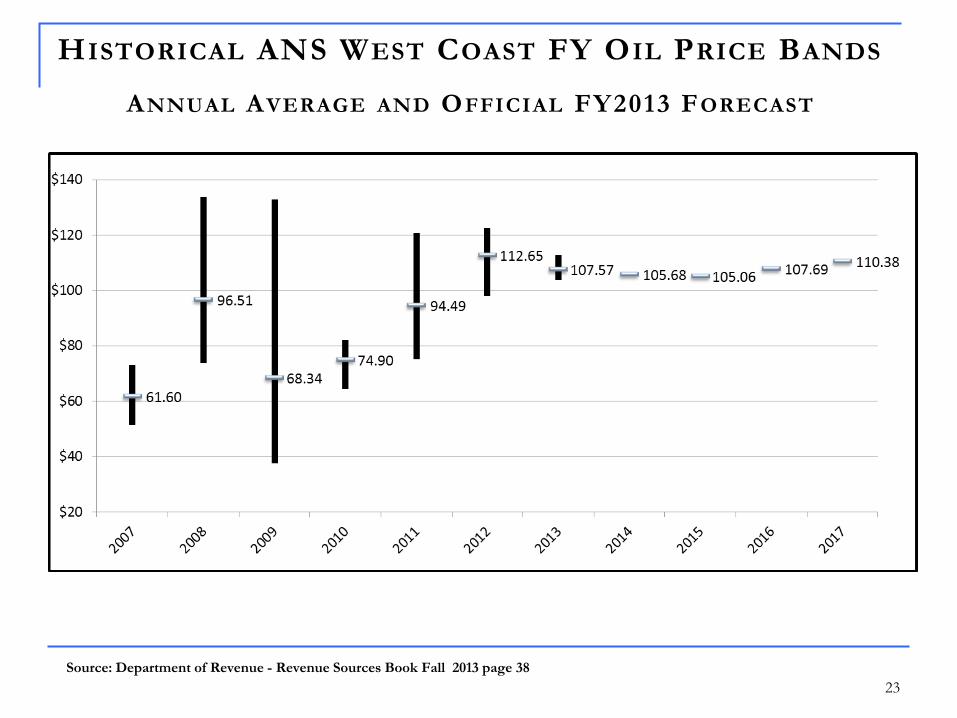
Price $ 32.36 $ 44.85 $ 62.12 $ 61.60 $ 96.51 $ 68.34 $ 74.90 $ 94.49 $ 112.65 $ 107.57 $ 105.68 $ 105.06 $ 107.69 $ 110.38 $ 115.40 $ 121.19 $ 122.43 $ 123.67 $ 133.00 $ 131.85

11
FALL 2013
Production Forecast
and Methodology

12
PRODUCTION HISTORY AND FORECAST
Source: Department of Revenue - Revenue Sources Book Fall 2013 page 43

13
ANS OIL PRODUCTION FORECAST
Source: Department of Revenue - Revenue Sources Books Fall 2005-2013

14
ANS OIL PRODUCTION FORECAST
Source: Department of Revenue - Revenue Sources Book Fall 2013
• Currently Producing:
• Oil from wells that are in production and following typical reservoir engineering optimization
without major investment.
• Under Development (UD):
• Oil from projects that will add incremental oil to existing fields or will bring new fields into
production.
• Project must have senior management approval and be allocated funds in the company’s
budget.
• Under Evaluation (UE):
• Oil from projects that are likely to occur in the future, but have not met the requirements of
the previous category.
• Requires that oil reserves are known and recovery is technically possible with current
technology.
• Under Development + Under Evaluation = “New Oil”

15
ANS OIL PRODUCTION FORECAST
Source: Department of Revenue - Revenue Sources Book Fall 2013
• “Currently Producing” oil was not risked
• Engineering assessment based on actual production data
• The “New Oil” portion of the Forecast was adjusted for risks
• Accounts for uncertainty in subsurface conditions and risk of delay
• The “Under Evaluation” portion of the Forecast was risked at a greater rate
than “Under Development”
• Accounts for greater uncertainty in subsurface conditions and higher risk of delay

16
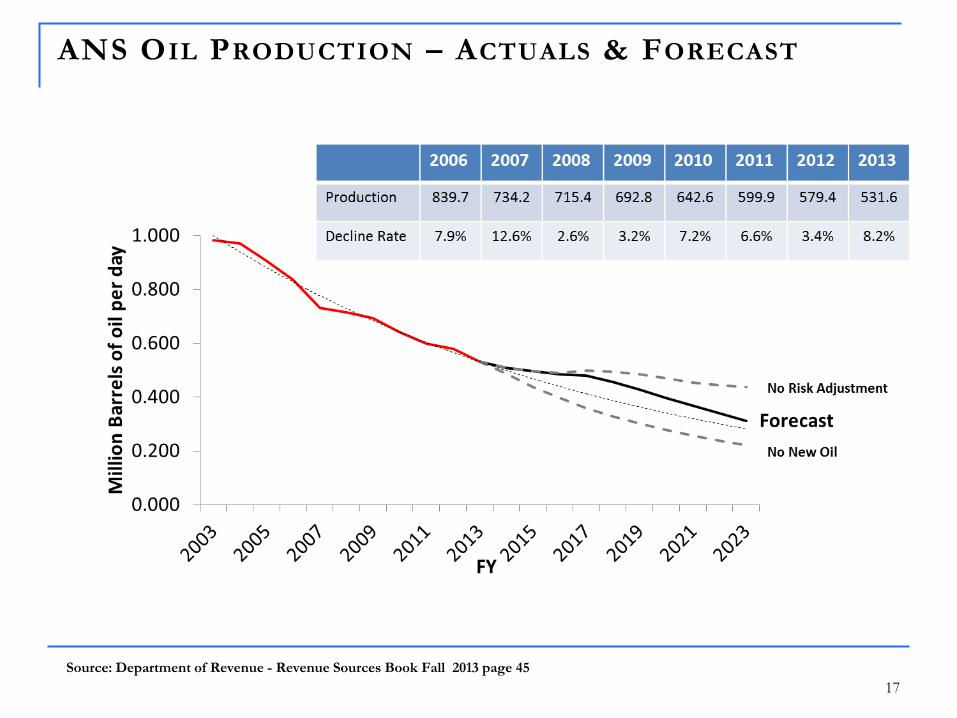
ANS OIL PRODUCTION – ACTUALS & FORECAST
Source: Department of Revenue - Revenue Sources Book Fall 2013 page 45
17
ANS OIL PRODUCTION – ACTUALS & FORECAST
Source: Department of Revenue - Revenue Sources Book Fall 2013 page 45

18
NORTH SLOPE PRODUCTION FORECAST
Source: Department of Revenue - Revenue Sources Book Fall 2013

19
FALL 2013
Price Forecast

20
ALASKA NORTH SLOPE CRUDE WEST COAST PRICE
Source: Department of Revenue - Revenue Sources Book Fall 2013 page 37
21
KEY OIL PRICE DRIVERS
Source: Department of Revenue - Revenue Sources Book Fall 2013
• Supply & Demand
• There are two main factors to monitor.
• Global spare capacity, since it is both a reflection of supply and demand.
In other words, the Organization of Petroleum Exporting Countries
(OPEC) spare capacity (flipping a switch) is key.
• Cost of developing new oil supply.
• Department is developing a probability and statistical model
incorporating spare capacity and cost of developing new supply to
help forecast ANS prices in the future.
22
PRICE FORECAST METHODOLOGY
Source: Department of Revenue - Revenue Sources Book Fall 2013
• Price Forecasting Session
• Held a day long oil price forecasting session on October 1, 2013.
• Speakers provided insight into oil markets, probability and analysis, modeling, and financial aspects of commodity markets.
• 39 participants from state government, academia and the private sector.
• DOR, DNR, DOL, OMB, University, Legislative Finance and outside participants.
• Participants were asked to forecast real ANS prices for the West Coast.
• Real prices were converted to nominal using a 2.5% inflation assumption.
• Median price path was chosen for each time period.
23
HISTORICAL ANS WEST COAST FY OIL PRICE BANDS
ANNUAL AVERAGE AND OFFICIAL FY2013 FORECAST
Source: Department of Revenue - Revenue Sources Book Fall 2013 page 38

24
Changes from Spring
2013 Forecast

25
COMPARISON – FALL VS. SPRING 2013 FORECASTS
Source: Department of Revenue - Revenue Sources Fall / Spring 2013 Forecasts

26
CONTRIBUTORS OF CHANGES IN FY2014 REVENUE FORECAST
Source: Department of Revenue - Revenue Sources Book Fall 2013
• Average Production Tax Value per barrel is reduced by $9.23.
Simplified calculation, does not represent any actual company
value. Assumes 12.5% royalty.

27
CONTRIBUTORS OF CHANGES IN FY2015 REVENUE FORECAST
Source: Department of Revenue - Revenue Sources Book Fall 2013
• Average Production Tax Value per barrel is reduced by $14.90.
Simplified calculation, does not represent any actual company
value. Assumes 12.5% royalty.

1/27/2014 3:19 PM
AKSTATECS\2009.03.06 Rating
Presentation\AK Financial Update March 6
2009_v2.ppt
28
$(900) $(800) $(700) $(600) $(500) $(400) $(300) $(200) $(100) $- $100
Tax System Change
Non-Oil Changes
Property Tax and Corp Income Changes
ACES North Slope Credit Close Out
Increased Transportation Charges
Reduced Production
Increased Lease Expenditures
Reduced Price Expectation
FY 14 FY 15
MAJOR CONTRIBUTORS OF CHANGES IN REVENUE FORECAST (FY14-15)
Source: DOR December 2013 estimates

2014 2015 2016 2017 2018 2019 2020 2021 2022 2023
Fall 2013 $3,929 $4,894 $4,617 $3,747 $3,294 $3,666 $3,664 $3,521 $3,370 $3,019
Spring 2013 $3,862 $4,069 $3,632 $2,870 $2,841 $2,416 $2,281 $2,184 $2,083 $1,992
0
1,000
2,000
3,000
4,000
5,000
6,000
Mill
ion
s o
f D
olla
rs
Total North Slope CAPEX
29
NORTH SLOPE LEASE EXPENDITURE FORECAST CHANGE
Source: Department of Revenue - Revenue Sources Book Fall 2013 / 2012
Total Increase: $9,492
Change $67 $826 $985 $877 $453 $1,250 $1,383 $1,337 $1,287 $1,027
Note: These estimates include lease expenditures by companies that are not expected to have a tax liability.

30
NORTH SLOPE LEASE EXPENDITURE FORECAST CHANGE
Source: Department of Revenue - Revenue Sources Book Fall 2013 and Spring 2013 forecast
Total Increase: $1,069
Change $319 $119 $146 $132 $336 $48 -$59 -$31 $15 $44
2014 2015 2016 2017 2018 2019 2020 2021 2022 2023
Fall 2013 $3,083 $2,893 $2,927 $2,931 $3,085 $2,867 $2,788 $2,682 $2,616 $2,572
Spring 2013 $2,764 $2,774 $2,781 $2,799 $2,749 $2,819 $2,847 $2,713 $2,601 $2,528
0
1,000
2,000
3,000
4,000
5,000
6,000
Mill
ion
s o
f D
olla
rs
Total North Slope OPEX
Note: These estimates include lease expenditures by companies that are not expected to have a tax liability.

THANK YOU
Please find our contact information below: Angela M. Rodell Commissioner Department of Revenue [email protected] (907) 465-2300 Michael Pawlowski Deputy Commissioner Department of Revenue [email protected] (907) 465-3669 Bruce Tangeman Deputy Commissioner Department of Revenue [email protected] (907) 269-0721
tax.alaska.gov