Precipitation products from the hydrology SAF · 1Istituto di Scienze dell’Atmosfera e del Clima...
23
Nat. Hazards Earth Syst. Sci., 13, 1959–1981, 2013 www.nat-hazards-earth-syst-sci.net/13/1959/2013/ doi:10.5194/nhess-13-1959-2013 © Author(s) 2013. CC Attribution 3.0 License. Natural Hazards and Earth System Sciences Open Access Precipitation products from the hydrology SAF A. Mugnai 1 , D. Casella 1 , E. Cattani 1 , S. Dietrich 1 , S. Laviola 1 , V. Levizzani 1 , G. Panegrossi 1 , M. Petracca 1 , P. San` o 1 , F. Di Paola 2 , D. Biron 3 , L. De Leonibus 3 , D. Melfi 3 , P. Rosci 3 , A. Vocino 3 , F. Zauli 3 , P. Pagliara 4 , S. Puca 4 , A. Rinollo 4 , L. Milani 5 , F. Porc` u 5 , and F. Gattari 6 1 Istituto di Scienze dell’Atmosfera e del Clima (ISAC), Consiglio Nazionale delle Ricerche (CNR), Bologna-Roma, Italy 2 Istituto di Metodologie ed Analisi Ambientali (IMAA), Consiglio Nazionale delle Ricerche (CNR), Tito Scalo, Italy 3 Centro Nazionale di Meteorologia e Climatologia Aeronautica (CNMCA), Ufficio Generale Spazio Aereo e Meteorologia (USAM), Aeronautica Militare Italiana (ITAF), Pratica di Mare, Italy 4 Dipartimento della Protezione Civile (DPC), Presidenza del Consiglio dei Ministri, Roma, Italy 5 Dipartimento di Fisica, Universit` a di Ferrara, Ferrara, Italy 6 Telespazio, Roma, Italy Correspondence to: A. Mugnai ([email protected]) Received: 11 November 2012 – Published in Nat. Hazards Earth Syst. Sci. Discuss.: – Revised: 26 April 2013 – Accepted: 14 May 2013 – Published: 6 August 2013 Abstract. The EUMETSAT Satellite Application Facility on Support to Operational Hydrology and Water Management (H-SAF) was established by the EUMETSAT Council on 3 July 2005, starting activity on 1 September 2005. The Ital- ian Meteorological Service serves as Leading Entity on be- half of twelve European member countries. H-SAF prod- ucts include precipitation, soil moisture and snow parame- ters. Some products are based only on satellite observations, while other products are based on the assimilation of satel- lite measurements/products into numerical models. In addi- tion to product development and generation, H-SAF includes a product validation program and a hydrological validation program that are coordinated, respectively, by the Italian De- partment of Civil Protection and by the Polish Institute of Meteorology and Water Management. The National Center of Aeronautical Meteorology and Climatology (CNMCA) of the Italian Air Force is responsible for operational product generation and dissemination. In this paper we describe the H-SAF precipitation algo- rithms and products, which have been developed by the Ital- ian Institute of Atmospheric Sciences and Climate (in collab- oration with the international community) and by CNMCA during the Development Phase (DP, 2005–2010) and the first Continuous Development and Operations Phase (CDOP- 1, 2010–2012). The precipitation products are based on passive microwave measurements obtained from radiome- ters onboard different sun-synchronous low-Earth-orbiting satellites (especially, the SSM/I and SSMIS radiometers onboard DMSP satellites and the AMSU-A + AMSU- B/MHS radiometer suites onboard EPS-MetOp and NOAA- POES satellites), as well as on combined infrared/passive microwave measurements in which the passive microwave precipitation estimates are used in conjunction with SEVIRI images from the geostationary MSG satellite. Moreover, the H-SAF product generation and dissemination chain and in- dependent product validation activities are described. Also, the H-SAF program and its associated activities that cur- rently are being carried out or are planned to be performed within the second CDOP phase (CDOP-2, 2012–2017) are presented in some detail. Insofar as CDOP-2 is concerned, it is emphasized that all algorithms and processing schemes will be improved and enhanced so as to extend them to satel- lites that will be operational within this decade – particularly the geostationary Meteosat Third Generation satellites and the low-Earth-orbiting Core Observatory of the international Global Precipitation Measurement mission. Finally, the role of H-SAF within the international science and operations community is explained. 1 Introduction In 1992 the European Organisation for the Exploitation of Meteorological Satellites (EUMETSAT) adopted the concept of a Distributed Application Ground Segment, which would include the Central Facility, located at the EUMETSAT Published by Copernicus Publications on behalf of the European Geosciences Union.
-
Upload
duongquynh -
Category
Documents
-
view
213 -
download
0
Transcript of Precipitation products from the hydrology SAF · 1Istituto di Scienze dell’Atmosfera e del Clima...

Nat. Hazards Earth Syst. Sci., 13, 1959–1981, 2013www.nat-hazards-earth-syst-sci.net/13/1959/2013/doi:10.5194/nhess-13-1959-2013© Author(s) 2013. CC Attribution 3.0 License.
EGU Journal Logos (RGB)
Advances in Geosciences
Open A
ccess
Natural Hazards and Earth System
SciencesO
pen Access
Annales Geophysicae
Open A
ccess
Nonlinear Processes in Geophysics
Open A
ccess
Atmospheric Chemistry
and Physics
Open A
ccess
Atmospheric Chemistry
and Physics
Open A
ccess
Discussions
Atmospheric Measurement
Techniques
Open A
ccess
Atmospheric Measurement
Techniques
Open A
ccess
Discussions
Biogeosciences
Open A
ccess
Open A
ccess
BiogeosciencesDiscussions
Climate of the Past
Open A
ccess
Open A
ccess
Climate of the Past
Discussions
Earth System Dynamics
Open A
ccess
Open A
ccess
Earth System Dynamics
Discussions
GeoscientificInstrumentation
Methods andData Systems
Open A
ccess
GeoscientificInstrumentation
Methods andData Systems
Open A
ccess
Discussions
GeoscientificModel Development
Open A
ccess
Open A
ccess
GeoscientificModel Development
Discussions
Hydrology and Earth System
Sciences
Open A
ccess
Hydrology and Earth System
Sciences
Open A
ccess
Discussions
Ocean Science
Open A
ccess
Open A
ccess
Ocean ScienceDiscussions
Solid Earth
Open A
ccess
Open A
ccess
Solid EarthDiscussions
The Cryosphere
Open A
ccess
Open A
ccess
The CryosphereDiscussions
Natural Hazards and Earth System
Sciences
Open A
ccess
Discussions
Precipitation products from the hydrology SAF
A. Mugnai1, D. Casella1, E. Cattani1, S. Dietrich1, S. Laviola1, V. Levizzani1, G. Panegrossi1, M. Petracca1, P. Sano1,F. Di Paola2, D. Biron3, L. De Leonibus3, D. Melfi3, P. Rosci3, A. Vocino3, F. Zauli3, P. Pagliara4, S. Puca4, A. Rinollo4,L. Milani 5, F. Porcu5, and F. Gattari6
1Istituto di Scienze dell’Atmosfera e del Clima (ISAC), Consiglio Nazionale delle Ricerche (CNR), Bologna-Roma, Italy2Istituto di Metodologie ed Analisi Ambientali (IMAA), Consiglio Nazionale delle Ricerche (CNR), Tito Scalo, Italy3Centro Nazionale di Meteorologia e Climatologia Aeronautica (CNMCA), Ufficio Generale Spazio Aereo e Meteorologia(USAM), Aeronautica Militare Italiana (ITAF), Pratica di Mare, Italy4Dipartimento della Protezione Civile (DPC), Presidenza del Consiglio dei Ministri, Roma, Italy5Dipartimento di Fisica, Universita di Ferrara, Ferrara, Italy6Telespazio, Roma, Italy
Correspondence to:A. Mugnai ([email protected])
Received: 11 November 2012 – Published in Nat. Hazards Earth Syst. Sci. Discuss.: –Revised: 26 April 2013 – Accepted: 14 May 2013 – Published: 6 August 2013
Abstract. The EUMETSAT Satellite Application Facility onSupport to Operational Hydrology and Water Management(H-SAF) was established by the EUMETSAT Council on3 July 2005, starting activity on 1 September 2005. The Ital-ian Meteorological Service serves as Leading Entity on be-half of twelve European member countries. H-SAF prod-ucts include precipitation, soil moisture and snow parame-ters. Some products are based only on satellite observations,while other products are based on the assimilation of satel-lite measurements/products into numerical models. In addi-tion to product development and generation, H-SAF includesa product validation program and a hydrological validationprogram that are coordinated, respectively, by the Italian De-partment of Civil Protection and by the Polish Institute ofMeteorology and Water Management. The National Centerof Aeronautical Meteorology and Climatology (CNMCA) ofthe Italian Air Force is responsible for operational productgeneration and dissemination.
In this paper we describe the H-SAF precipitation algo-rithms and products, which have been developed by the Ital-ian Institute of Atmospheric Sciences and Climate (in collab-oration with the international community) and by CNMCAduring the Development Phase (DP, 2005–2010) and thefirst Continuous Development and Operations Phase (CDOP-1, 2010–2012). The precipitation products are based onpassive microwave measurements obtained from radiome-ters onboard different sun-synchronous low-Earth-orbitingsatellites (especially, the SSM/I and SSMIS radiometers
onboard DMSP satellites and the AMSU-A+ AMSU-B/MHS radiometer suites onboard EPS-MetOp and NOAA-POES satellites), as well as on combined infrared/passivemicrowave measurements in which the passive microwaveprecipitation estimates are used in conjunction with SEVIRIimages from the geostationary MSG satellite. Moreover, theH-SAF product generation and dissemination chain and in-dependent product validation activities are described. Also,the H-SAF program and its associated activities that cur-rently are being carried out or are planned to be performedwithin the second CDOP phase (CDOP-2, 2012–2017) arepresented in some detail. Insofar as CDOP-2 is concerned,it is emphasized that all algorithms and processing schemeswill be improved and enhanced so as to extend them to satel-lites that will be operational within this decade – particularlythe geostationary Meteosat Third Generation satellites andthe low-Earth-orbiting Core Observatory of the internationalGlobal Precipitation Measurement mission. Finally, the roleof H-SAF within the international science and operationscommunity is explained.
1 Introduction
In 1992 the European Organisation for the Exploitation ofMeteorological Satellites (EUMETSAT) adopted the conceptof a Distributed Application Ground Segment, which wouldinclude the Central Facility, located at the EUMETSAT
Published by Copernicus Publications on behalf of the European Geosciences Union.

1960 A. Mugnai et al.: Precipitation products from the hydrology SAF
Fig. 1. EUMETSAT’s network of the current eight Satellite Application Facilities (SAFs). The colored circles identifying the various SAFshave been placed in correspondence to the locations of their leading entities, whereas the white circle identifying the Central Facility hasbeen placed in correspondence to EUMETSAT’s headquarters in Darmstadt, Germany. (Adapted from EUMETSAT:http://www.eumetsat.int/website/home/AboutUs/WhoWeAre/MemberStates/index.html.)
Headquarters in Darmstadt, Germany, and a network of ele-ments known as Satellite Application Facilities (SAFs). TheSAFs are specialized development and processing centerswhich utilize specific expertise available in EUMETSAT’sMember and Cooperating States to develop and deliver satel-lite products to international research and operations users.On this basis, a SAF Network has been set up, developedby consortia of organizations from within the EUMETSATMember and Cooperating States and located at the nationalmeteorological services in Member States, which comple-ments the production of standard meteorological productsderived from satellite data at the central facilities in Darm-stadt. The SAF Network also distributes user software pack-ages.
The main objectives of the SAF Network can be summa-rized as follows: (1) improve capabilities of EUMETSAT’sMember States to exploit satellite data; (2) encourage uti-lization of existing skills and infrastructure in Member andCooperating States; and (3) facilitate cost-effective exploita-tion by ensuring that services are optimally distributed.
Currently there are eight SAFs, all of which provide prod-ucts and services on an operational basis, each one dedicatedto a specific discipline within operational meteorology, cli-matology and earth observation (see Fig. 1). Each SAF isled by the national meteorological service of a EUMETSAT
Member State, and is executed in association with a consor-tium of EUMETSAT Member States and Cooperating States,government bodies and research institutes. The various SAFswere established at different times between 1997 and 2005and started their activities with a Development Phase (DP),which usually lasted five years. In some cases, the DP phasewas followed by an Initial Operations Phase (IOP), whichlasted two to five years. The activities are now continu-ing with Continuous Development and Operations Phases(CDOPs), which are structured in five-yearly segments. Formost SAFs the first CDOP phase (CDOP-1) started in early2007. All SAFs entered the second CDOP phase (CDOP-2) contemporarily in March 2012. For more information onthe SAF Network, see the websitehttp://www.eumetsat.int/website/home/Satellites/GroundSegment/Safs/index.html.
The Satellite Application Facility on Support to Opera-tional Hydrology and Water Management (H-SAF, or Hy-drology SAF) is one of the current eight SAFs. It was es-tablished by the EUMETSAT Council on 3 July 2005, theninitiated its DP activities on 1 September 2005 as a responseto (1) a growing interest within the European Union (EU)in the steadily improving quality of operational and researchsatellite data; (2) the improving capabilities in hydrologi-cal remote sensing science; (3) the improving performancesof hydrological models and the hydrological components
Nat. Hazards Earth Syst. Sci., 13, 1959–1981, 2013 www.nat-hazards-earth-syst-sci.net/13/1959/2013/

A. Mugnai et al.: Precipitation products from the hydrology SAF 1961
of weather and climate prediction models; (4) the increas-ing need for global and reliable information on availablewater resources, recognized by international bodies and or-ganizations; and finally (5) the improving techniques forassimilating hydrological observations into prediction mod-els, particularly satellite retrieval observations.
In this paper, which is an extension and update of a Confer-ence Proceedings paper prepared by Panegrossi et al. (2012),we first describe the H-SAF project (Sect. 2) with specialemphasis on the activities that are being carried out within orare planned for the second CDOP phase that will cover the2012–2017 five-year span, as well as on the present and ex-pected role of H-SAF within the broader international com-munity. Then we describe in some detail the six precipitationalgorithms/products (Sect. 3) which have been developed bythe Institute of Atmospheric Sciences and Climate (ISAC) ofthe Italian National Research Council (CNR) in collaborationwith the international community and by the National Centerof Aeronautical Meteorology and Climatology (CNMCA) ofthe Italian Air Force (ITAF) during the DP (2005–2010) andCDOP-1 (2010–2012) phases. Finally, we describe the prod-uct generation and dissemination chain that has been devel-oped by and implemented at CNMCA (Sect. 4), and providebasic information concerning the H-SAF precipitation prod-uct validation (PPV) and hydrological validation (HV) activ-ities (Sect. 5) that are coordinated, respectively, by the ItalianDepartment of Civil Protection (DPC) and by the Polish In-stitute of Meteorology and Water Management (IMGW).
2 H-SAF project
In 2000 EUMETSAT began various steps towards the estab-lishment of a SAF on support to hydrology. First, a specific“Working Group on a Potential SAF” was established, whichafter two years (2001–2002) consolidated the necessary hy-drological end user requirements and decided a list of objec-tives that would be achievable within a five-year term. Then,a “SAF Hydrology Framework Working Group” was estab-lished, which operated for two additional years (2003–2004)and defined a scientific strategy and a long-term vision ap-propriate for a SAF on support to hydrology. In 2005, theItalian Air Force Meteorological Service set up a consortiumfor the H-SAF project, gathering institutions of ten coun-tries (Austria, Belgium, Finland, France, Germany, Hungary,Italy, Poland, Slovakia, and Turkey) and one internationalagency, the European Centre for Medium-Range WeatherForecasts (ECMWF). The H-SAF Consortium submitted aproposal to EUMETSAT for the 2005–2010 DP phase, whichwas approved by the EUMETSAT Council on 3 July 2005.The DP activities started on 1 September 2005, ending suc-cessfully after five years, at which time H-SAF joined theother seven SAFs in the CDOP-1 phase.
Since the beginning, the overall H-SAF objectives havebeen to
1. provide new satellite-derived products from existingand future satellites with sufficient time and space reso-lution to satisfy the needs of operational hydrology, bymeans of the following identified products:
– precipitation (surface rate and accumulated, liquid-solid discrimination);
– soil moisture (at large scale, at local scale, at sur-face, in root zone);
– snow parameters (detection, cover, melting condi-tions, water equivalent).
2. perform independent validation of the usefulness of newproducts for mitigating against hazards due to floods,landslides and avalanches, as well as for evaluating wa-ter resources. Corresponding activities include
– downscaling/upscaling modeling from ob-served/predicted fields to basin level;
– fusion of satellite-derived measurements with datafrom radar and rain gauge networks;
– assimilation of satellite-derived products into hy-drological models.
3. perform impact assessments of new satellite-derivedproducts on hydrological applications.
During the DP phase, which covered 5 yr until 31 Au-gust 2010, H-SAF followed a stepwise developmental ap-proach, according to which products started to be developedon the basis of available algorithms, databases and instru-ments, while a first release of several products were ready forevaluation at the mid-term of the DP phase. Thereafter, theseproducts continued to be improved, with other ones added, onthe basis of improved algorithms, databases and instruments,as well as of the results of calibration/validation activities.The distribution of several initial versions of products wasachieved to allow end users, specifically hydrologists, to startevaluation and build-up impact study projects.
As soon as the DP phase ended, the CDOP-1 phase started,during which another member (Bulgaria) joined the H-SAFConsortium. CDOP-1 lasted only eighteen months so as tosynchronize H-SAF with the other seven SAFs that hadstarted their five-year CDOP-1 phase in early 2007. Dur-ing CDOP-1, H-SAF operations with and dissemination ofseveral products began in conjunction with the developmentand improvement of the entire suite of DP products. InMarch 2012, H-SAF entered, together with the other SAFs,the CDOP-2 phase, which will continue until February 2017– see Sect. 2.2 for a detailed presentation of CDOP-2 activi-ties.
2.1 H-SAF Consortium structure
The H-SAF is structured through a consortium of twentycooperating and/or participating entities representing eleven
www.nat-hazards-earth-syst-sci.net/13/1959/2013/ Nat. Hazards Earth Syst. Sci., 13, 1959–1981, 2013

1962 A. Mugnai et al.: Precipitation products from the hydrology SAF
Table 1.Composition of H-SAF Consortium (organized in alphabetical order of participating countries).
Country Institution Acronym Role in project
Austria Central Institution for Meteorology andGeodynamics
ZAMG Leader for soil moisture
Austria Vienna University of Technology, De-partment for Geodesy and Geoinforma-tion
TU-Wien Contributor to soil moisture
Belgium Royal Meteorological Institute IRM Contributor to validation and hydrovalidationservices
Bulgaria National Institute of Meteorology andHydrology
NIMH Contributor to validation and hydrovalidationservices
Finland Finnish Meteorological Institute FMI Leader for snowFrance Meteo-France Meteo-France Contributor to validation and hydrovalidation
servicesGermany Federal Institute of Hydrology BfG Contributor to validation and hydrovalidation
servicesHungary Hungarian Meteorological Service OMSZ Contributor to validation servicesInternational European Centre for Medium-Range
Weather ForecastsECMWF Contributor to “core” soil moisture
Italy Meteorological Service of the ItalianAir Force
ITAF SMA-USAM/ITAF CNMCA
Leading Institute+ leader for precipitation
Italy Department of Civil Protection DPC Leader of product validation programmeItaly Telespazio TPZ Industrial Firm, contributor to engineering
and project controlItaly Italian National Research Council, In-
stitute of Atmospheric Sciences andClimate
CNR-ISAC Contributor to precipitation
Italy Ferrara University, Department ofPhysics
UNIFe Contributor to precipitation
Poland Institute of Meteorology and WaterManagement
IMGW Leader of hydrology programme
Slovakia Slovak Hydrometeorological Institute SHMU Contributor to validation and hydrovalidationservices
Turkey Turkish State Meteorological Service TSMS Contributor to “core” snowTurkey Anadolu University AU Contributor to snowTurkey Istanbul Technical University, Meteoro-
logical DepartmentITU Contributor to snow
Turkey Middle East Technical University, CivilEngineering Department
METU Contributor to snow
Turkey Ondokuz Mayis University OMU Contributor to validation
European countries (Austria, Belgium, Bulgaria, Finland,France, Germany, Hungary, Italy, Poland, Slovakia, andTurkey) as well as ECMWF, led by the Italian Meteoro-logical Service which provides theCoordination and Cen-tral Functionsfrom Rome and Pratica di Mare – i.e., fromITAF’s headquarters of the Aeronautical Meteorological Ser-vice (SMA) of the General Office for Air Space and Mete-orology (USAM) and from ITAF’s CNMCA (i.e., the Ital-ian National Meteorological Center), respectively. The list ofparticipating Institutes is given in Table 1 together with theirroles in the H-SAF project.
Notably, the role of the participating institutions reflectsthe overall technical and organizational architecture of theproject, which is based on
– the Product Development and Generation Area,dis-tributed among five operational centers – the ItalianCNMCA for precipitation, the Austrian Central Insti-tution for Meteorology and Geodynamics (ZAMG) andECMWF for soil moisture, and the Finnish Meteorolog-ical Institute (FMI) and the Turkish State Meteorologi-cal Service (TSMS) for snow;
– the User Area,composed of two clusters, one for theproduct validation (PV) program, coordinated by ItalianDPC, and the other for the hydrological validation (HV)program, coordinated by Polish IMGW.
We note that whereas the product generation activity is beingperformed by meteorological services supported by scientific
Nat. Hazards Earth Syst. Sci., 13, 1959–1981, 2013 www.nat-hazards-earth-syst-sci.net/13/1959/2013/

A. Mugnai et al.: Precipitation products from the hydrology SAF 1963
institutes specializing in remote sensing, the product vali-dation and hydrological validation programs are being per-formed by hydrometeorological services, hydrological sci-entific institutes, and operational units responsible for civilprotection.
2.2 H-SAF CDOP-2 phase
On March 2012 H-SAF entered the five-year CDOP-2 phase,guided by the commitment to provide products and servicesin support of operational meteorology, hydrology, oceanog-raphy, climate and risk management, and to accomplish thefollowing requirements:
1. Extend the limit of the long-term vision from 2015 up tothe time of the new generation of EUMETSAT satellites– particularly, the geostationary (GEO) imaging andsounding Meteosat Third Generation (MTG) satellitesand the low-Earth-orbiting (LEO) Post EUMETSATPolar System (Post-EPS) satellites, platforms that willreplace within a decade, respectively, the current GEOMeteosat Second Generation (MSG) satellites and theLEO Meteorological Operational (MetOp) satellites ofthe EUMETSAT Polar System (EPS) program – so as toconcur in establishing their user requirements and po-tential operational products.
2. Support the future role of the combined numerical mod-els (hydrological, meteorological and oceanographic)on estimation and forecast of precipitation, inland wa-ters, sea circulation, climate monitoring, considering theadded value of satellite-derived products in producinghomogeneous maps of precipitation estimates over landand sea, ground soil moisture and snow water equiva-lent.
3. Exploit a wide range of current and future space mis-sions for meteorology and altimetry (for ocean andinland water), such as the MTG and Post-EPS satel-lites, or the Sentinel satellites of the Global Monitor-ing for Environment and Security (GMES) program,which is a joint initiative of the European Commission(EC) and European Space Agency (ESA), and finallysatellites and space missions being developed by extra-European agencies – especially, the Core Observatoryof the Global Precipitation Measurement (GPM) mis-sion (planned for launch in 2014), which is under jointdevelopment by the US National Aeronautics and SpaceAdministration (NASA) and the Japan Aerospace Ex-ploration Agency (JAXA).
4. Improve the provided service of online product vali-dation, which would provide a level of confidence inthe products in such a manner to allow their use bydecision-making end users in risk management activi-ties.
These activities are being carried out according to the follow-ing strategies and objectives:
– Concerningproducts:
– to continue providing operational high-qualityproducts and services, enabling qualitative andquantitative exploitation by end users of the variousprecipitation, soil moisture, and snow products;
– to continuously improve product performance;
– to stepwise extend the coverage area, starting fromspecific areas of Africa up to delivering products forthe full disk observed by MSG and, in the future, byMTG;
– to develop new products related to the enhancedtechnologies of upcoming space missions andsatellite-borne sensors;
– to perform independent product validation;
– to assess the usefulness of products for water cycleissues – such as real-time flood risk management,landslides, avalanches and evaluation of water re-sources.
– Concerningservices:
– to improve the HV program, which, although in-volving participation by eight countries for a totalof twenty one test sites, leaves many uncovered ar-eas in Europe; an extension is thus foreseen intothe Iberian Peninsula, Great Britain, Scandinavia,the Balkans and, due to the envisaged coverage ex-tension, also into Africa, along with the differenti-ation of hydrological models in order to improvethe coverage of hydrological basin dimensions,geomorphological situations, and types of hydro-logical regimes;
– to consolidate specific PV services, comprised ofonline and off-line services: (1) online service isbased on near real-time characterization of eachproduct through the production of a quality index(derived from the completeness and quality of theinput data used for each product generation) and aconfidence index (derived from the combination oftwo statistical error parameters, the first of whichis calculated off-line to establish a long product se-ries, while the second is calculated online for thecurrent product); and (2) off-line service is based onthe evaluation of the product accuracy using multi-categorical and continuous statistics;
– to consolidate and improve service activities, suchas monitoring of service performances minimiz-ing delays and preserving data integrity and har-monization of the H-SAF data service within theoverall CDOP concept, also taking into account theEUMETSAT policy towards GMES;
www.nat-hazards-earth-syst-sci.net/13/1959/2013/ Nat. Hazards Earth Syst. Sci., 13, 1959–1981, 2013

1964 A. Mugnai et al.: Precipitation products from the hydrology SAF
– to progressively extend user support services;
– to provide efficient user support and training, aswell as effective communications with user com-munities via an ever improving website coupledwith help-desk service.
– Concerningarchitecture:
– to upgrade the system architecture: the distributedarchitecture among product-generating participantswill be consolidated, while CNMCA infrastructureswill be upgraded both for product generation andcentral services, in order to be able to sustain dis-aster recovery procedures of distributed generationchains.
– Concerningcooperation:
– to progressively extend the user community: Ta-ble 2 shows a list of user communities that likelywould be interested in H-SAF products;
– to provide support to other SAFs, especially thoseconcerned with nowcasting, land processes, and cli-mate monitoring;
– to achieve complete and concrete synergies with theother SAFs, as well as with the Central Facility, byimplementing a combined production strategy forsoftware development, maintenance, validation andoperations;
– to intensify, in accordance with standingEUMETSAT policy, relationships with otherSAFs, either through the mutual use of productsor through the definition of specific federatedactivities;
– to establish and carry on operational cooperationwith other space agencies involved in space mis-sions of interest for H-SAF – particularly, withNASA and JAXA in conjunction with the GPMmission.
2.3 H-SAF and international precipitation community
Concerning the issue of international cooperation involv-ing precipitation products, it is worth noting that H-SAF isan active member of the International Precipitation Work-ing Group (IPWG) (http://www.isac.cnr.it/∼ipwg/), whoseresponsibilities include making available algorithms anddatasets for operational and scientific use. The IPWG is amember of the Coordination Group for Meteorological Satel-lites (CGMS), an activity sponsored by the World Meteoro-logical Organization (WMO). As a EUMETSAT contribu-tion, the H-SAF algorithms are part of the IPWG inventory ofsatellite precipitation tools generating operational products.H-SAF also participates in IPWG training activities that are
aimed at enhancing the use of satellite precipitation products– especially in developing countries.
In addition, the international activity of H-SAF is con-ducted via the newly established EUMETSAT PrecipitationScience Advisory Group (P-SAG). This group provides ad-vice and support to EUMETSAT on satellite-based precipita-tion estimation in order to better coordinate all precipitation-related activities carried out within the various SAFs. P-SAGis the first organization of its kind. Its creation testifies to theimportance of precipitation in the context of EUMETSAT’sservice policy for the coming years. P-SAG membership con-sists of renowned scientists from throughout the world whocover all aspects of remote sensing, meteorology and hydrol-ogy, as well as representatives of EUMETSAT Headquarters.H-SAF, the SAF on Climate Monitoring (CM-SAF) and theSAF on Support to Nowcasting and Very Short Range Fore-casting (NWC-SAF) are, in turn, being organized to form theEUMETSAT Joint Precipitation Working Group, which pro-vides a link between the precipitation activities of the SAFsby exchanging algorithms and products, and establishing acommon interface towards the P-SAG.
Finally, the utmost important project to which H-SAF hasbeen called upon to participate in and contribute towardsis the NASA-JAXA GPM mission (http://pmm.nasa.gov/GPM). The GPM Core Observatory is planned for launch in2014, hosting a new generation passive microwave radiome-ter, the GPM Microwave Imager (GMI), along with a Dual-frequency Precipitation Radar (DPR). The strategy is to cal-ibrate the precipitation estimates of the entire constellationof operational passive microwave radiometers with GMI+
DPR retrievals. H-SAF will provide its own algorithms andwill be part of the international effort to ensure, to the degreepossible, 3-hourly coverage of precipitation over the entireglobe.
3 H-SAF precipitation products
Table 3 shows the complete list of precipitation prod-ucts/algorithms for CDOP-2 and requires a somewhat de-tailed explanation. The first three columns identify each ofthe algorithms and associated products in three differentways, these being a unique identification (ID) code (col-umn 1), a brief algorithm/product description with a ver-sion number (optional) included (column 2), and an under-lying base name acronym (column 3). The ID code consistsof the letter “H” (signifying H-SAF) followed by a numberidentifying a specific algorithm/product accounting for ver-sion number and/or significant upgrades – i.e., the ID codechanges whenever there is an important change in the algo-rithm that is used to calculate its associated product. Thebase name acronym consists of the sequence PR-OBS-n,where “PR” indicates precipitation, “OBS” indicates obser-vation (thus signifying that the associated precipitation prod-ucts are based on satellite observations), while “n” is a num-
Nat. Hazards Earth Syst. Sci., 13, 1959–1981, 2013 www.nat-hazards-earth-syst-sci.net/13/1959/2013/

A. Mugnai et al.: Precipitation products from the hydrology SAF 1965
Table 2.User communities potentially addressed by H-SAF.
Entity Application Precipitation Soil moisture Snow parameters
Operationalhydrological units
Fluvial basinmanagement
Early warning of potentialfloods
Landslides and runoff (forecast-ing)
Evaluation of flood damping orenhancing factors
Territorymanagement
Extreme events statistics andhydrological risk mapping.
Soil characterizationand hydrologicalresponse units
Monitoring and exploitationof snow and glaciers for riverregime regularization
Public works planning.
Water reservoirevaluation
Inventory of potential storedwater resources
Monitoring of available water tosustain vegetation
Monitoring and exploitation ofsnow and glaciers for drinkablewater and irrigation
Nationalmeteorologicalservices
Numerical weatherprediction
Assimilation to represent latentheat release inside the atmo-sphere
Input of latent heat byevapotranspirationthrough the planetaryboundary layer
Input of radiative heatfrom surface toatmosphere
Evaluation of NWP model skill.
NowcastingPublic information on actualweather
Warning on the statusof the territory fortransport inemergencies
Warning of avalanches
Warning for fishery and coastalzone activities
Tourism information
Warning for agricultural worksand crop protection
Assistance to aviation duringtakeoff and landing
Climate monitoringRepresentation of theglobal water cycle ingeneral circulation models
Monitoring ofdesertificationprocesses
Monitoring glacier extension
Monitoring changes of plane-tary albedo
Operationaloceanography
Numerical oceancirculation mod-els
Assimilation of fresh water in-put to represent density, salin-ity and heat release inside theocean
Operationalclimatology
Numericalatmosphere–ocean coupledmodels
Assimilation of fresh water in-put to represent density, salin-ity and heat release inside theocean
Civil protectionPreparation foremergencies
Progressive level of attentionfunction of rainfall monitoring
Monitoring soil moisturegrowth
Monitoring snow accumulation
Preparation of facilities andstaff for a possible emergency
Planning of in-field activitiesfor event mitigation
Planning of in-field activitiesfor event mitigation
Emergency man-agement
Alert to population Operational conditions fortransport and use of staff andmitigation facilities
Operational conditions fortransport and use of staff andmitigation facilities
Post-emergencyphase
Deranking of alert leveland monitoring ofevent cessation .
Withdrawing of staff and miti-gation facilities
Withdrawing of staff and miti-gation facilities
Assessment of vulnerability topossible event iteration
Assessment of vulnerability topossible event iteration
Research &developmentactivities
MeteorologyImproved knowledge of the pre-cipitation process
Assessment of the role ofobserved soil moisture inNWP, either for verificationor initialization
Assessment of the role ofobserved snow parametersin NWP, either forverification or initialization
Assimilation of precipitationobservation in NWP models
HydrologyDownscaling/upscaling of satel-lite precipitation observations
Downscaling/upscaling of satel-lite soil moisture observations
Downscaling/upscaling of satel-lite snow observations
Fusion with ground-based ob-servations
GIS-based fusion with ground-based observations
GIS-based fusion with ground-based observations
Assimilation and impact studies Assimilation and impact studies Assimilation and impact studies
Civil protection Decisional models for the alertsystem
Organizational models for oper-ating over moist soil
Organizational models for oper-ating over snow
Oceanographicunits
Evaluation as part of the globalwater cycle
www.nat-hazards-earth-syst-sci.net/13/1959/2013/ Nat. Hazards Earth Syst. Sci., 13, 1959–1981, 2013

1966 A. Mugnai et al.: Precipitation products from the hydrology SAF
Table 3. H-SAF precipitation algorithms/products developed for or under development for CDOP-1 and CDOP-2 (see text for details).(Products developed during DP and CDOP-1 phases for H-SAF area are indicated with *.)
ID Code Algorithm/product description Base name acronym Timeliness Spatial coverage
H01* Precipitation rate at ground from microwave(MW) conically scanning radiometers (SSMIS)using a Bayesian (CDRD) algorithm (withphase flag) – Version 1
PR-OBS-1 2.5 h H-SAF area/MSG full disk
H02* Precipitation rate at ground from MW cross-track scanning radiometers (AMSU-A+ MHS)using a neural network (PNPR) algorithm (withphase flag) – Versions 1/2
PR-OBS-2 30 min/2.5 h H-SAF area/MSG full disk
H03* Precipitation rate at ground from the blendedGEO/IR-LEO/MW rapid-update technique(NRLT)
PR-OBS-3 15 min/25 min H-SAF area/MSG full disk
H04* Precipitation rate at ground by LEO/MW sup-ported by GEO/IR (with phase flag): advectionof MW rain fields is merged with a morphingtechnique based on a forward-backward com-putational scheme
PR-OBS-4 4 h/5 h H-SAF area/MSG full disk
H05* Accumulated precipitation at ground fromblended LEO/MW+ GEO/IR supported byprecipitation analysis (NWP first guess+ raingauges) and adaptive statistical correction
PR-OBS-5 15 min/25 min H-SAF area/MSG full disk
H15* Convective precipitation rate at ground fromblending of LEO/MW precipitation rates andGEO/IR brightness temperatures after a pre-screening using NEFODINA convective mask
PR-OBS-6 15 min/25 min H-SAF area/MSG full disk
H17 Precipitation rate at ground from MW coni-cally scanning radiometers (SSMIS) using aBayesian (CDRD) algorithm (with phase flag)– Version 2
PR-OBS-1 2.5 h MSG full disk
H18 Precipitation rate at ground from MW cross-track scanning radiometers (AMSU-A+ MHS)using a neural network (PNPR) algorithm (withphase flag) – Version 3
PR-OBS-2 2.5 h MSG full disk
H19 Precipitation rate at ground from GPM CoreSatellite GMI measurements (with DPR sup-port) using a Bayesian (CDRD) algorithm (withphase flag)
PR-OBS-7 NA MSG full disk (except for polar zones)
H20 Precipitation rate at ground from GPM CoreSatellite GMI measurements (with DPR sup-port) using a neural network (PNPR) algorithm(with phase flag)
PR-OBS-8 NA MSG full disk (except for polar zones)
H21 High frequency MW delineation of cloud areashaving a possible new development of hydrom-eteors: detection is carried out by combiningdifferent MHS channels
PR-OBS-9 2.5 h MSG full disk
H22 Snowfall intensity calculated by a dedicatedmodule of the 183-WSL method using a com-bination of MHS channels
PR-OBS-10 2.5 h MSG full disk
H40 Precipitation rate at ground from the blendedGEO/IR-LEO/MW rapid-update technique(NRLT)
PR-OBS-3-FCI 15 min/25 min H-SAF area/MTG full disk
H41 Precipitation rate at ground by LEO/MW sup-ported by GEO/IR (with phase flag): advectionof MW rain fields is merged with a morphingtechnique based on a forward-backward com-putational scheme
PR-OBS-4-FCI 4 h/5 h H-SAF area/MTG full disk
H42 Accumulated precipitation at ground fromblended LEO/MW+ GEO/IR supported byprecipitation analysis (NWP first guess+ raingauges) and adaptive statistical correction
PR-OBS-5-FCI 15 min/25 min H-SAF area/MTG full disk
H50 Convective precipitation rate at ground by usinglightning rate occurrences from LI supported byGEO/IR and rainfall patterns
PR-OBS-11-LI 15 min Europe
Nat. Hazards Earth Syst. Sci., 13, 1959–1981, 2013 www.nat-hazards-earth-syst-sci.net/13/1959/2013/

A. Mugnai et al.: Precipitation products from the hydrology SAF 1967
ber designating a particular algorithm methodology, regard-less of its associated algorithm/product version. In addition, abase name acronym may terminate with the letter sequences“FCI” or “LI”, indicating that a future product will be mak-ing use of measurements from the Flexible Combined Im-ager (FCI) or Lightning Imager (LI) instruments scheduledfor flight on future MTG satellites. Note that the table is or-ganized according to increasing ID code.
The next two columns in Table 3 provide the so-calledtimeliness (column 4), a vital user parameter which is de-fined as the time interval between a level 1 observation andits associated product availability at the user site (assum-ing a means of data dissemination has been defined), andthe spatial coverage domain for each product (column 5).Note that there are two main options for the spatial cov-erage, these being the nominal H-SAF area (25◦ N–75◦ Nlatitude, 25◦ W–45◦ E longitude) and a wider area coveringthe full disk observed by the Spinning Enhanced Visible andInfraRed Imager (SEVIRI) instrument onboard GEO MSGsatellites. (Note, however, that products making use of MSGdata extend to 65◦ latitude/longitude only because of parallaxissues.) Also note that several products show both options.This is because these products are first generated for the H-SAF area and then extended to the MSG full disk area fol-lowing an evolution of the corresponding algorithms, and/orbecause there are important differences in the timeliness as-sociated with each area – as indicated in corresponding rowsof column 4.
Six different precipitation products have been developedduring the DP and CDOP-1 phases; these are marked with anasterisk in column 1 of Table 3 and refer to the H-SAF areaonly. Two of these products are based on passive microwave(PMW) measurements taken from radiometers onboard dif-ferent sun-synchronous near-polar-orbiting LEO satellites1:PR-OBS-1, which is developed by CNR-ISAC, utilizes theSpecial Sensor Microwave Imager/Sounder (SSMIS) coni-cally scanning radiometers flown onboard satellites of theUS Defense Meteorological Satellite Program (DMSP) (notethat PR-OBS-1 was originally conceived to utilize theSpecial Sensor Microwave Imager (SSM/I) on an earliergeneration of DMSP satellites, now no longer available),while PR-OBS-2, which is also developed by CNR-ISAC,utilizes the coupled Advanced Microwave Sounding UnitA (AMSU-A) and Microwave Humidity Sounder (MHS)cross-track scanning radiometers that are flown onboardthe US National Oceanic and Atmospheric Administration(NOAA) Polar-orbiting Operational Environmental Satel-lites (POES), referred to as NOAA-18 and NOAA-19, aswell as on EUMETSAT’s two Meteorological Operationalsatellites MetOp-A/B. Then, there are the three combined
1 For exhaustive and detailed information on all past, presentand planned Earth observation satellites and instruments, see theObserving Systems Capability Analysis and Review Tool (OSCAR)web page developed by WMO –http://www.wmo-sat.info/oscar/.
infrared/microwave (IR-MW) precipitation products, PR-OBS-3 and PR-OBS-4 (both developed by CNR-ISAC) andPR-OBS-6 (developed by CNMCA), which utilize infrared(IR) measurements taken by the MSG SEVIRI in combi-nation with previous PMW-only precipitation estimates. Fi-nally, there is an accumulation-based product, PR-OBS-5(also developed by CNMCA), which accumulates precipita-tion on the SEVIRI grid presently obtained from PR-OBS-3(but in the future this will also be done in conjunction withPR-OBS-4).
During CDOP-2 all six algorithms and products will beupgraded and extended to cover the MSG full disk area.Moreover, several important changes are foreseen for somealgorithms. Thus, H17 and H18 will replace H01 and H02 forPR-OBS-1 and PR-OBS-2, respectively. In addition, othernew products will be generated during CDOP-2 – especially,products for the future MTG satellites and the Core Obser-vatory of the GPM mission. For example, H40, H41 andH42, which will be based on the FCI instrument onboardMTG (replacing and extending the SEVIRI radiometer on-board MSG), will replace H03, H04 and H05 for PR-OBS-3,PR-OBS-4 and PR-OBS-5, respectively, while PR-OBS-11will be developed by CNMCA for the LI instrument onboardMTG, and PR-OBS-7 and PR-OBS-8 will be developed byCNR-ISAC for GPM’s GMI radiometer with the GPM DPRradar providing supporting information. Finally, two newproducts (PR-OBS-21 and PR-OBS-22), which make use ofhigh frequency MW channels on the MHS radiometers, arepresently under development by CNR-ISAC.
Finally, each product will be supplied with a pixel-basedquality flag, which will offer to the end users an effectivecriterion for evaluating the products and assist in their appo-site selection and application for a given analyzed situationor scenario. Specifically, for each precipitation product, thequality flag is evaluated so as to take into account particularaspects of the associated algorithm, as well as characteristicsof the input data (satellite data or other precipitation prod-ucts), and of the observed event – all of which influence theoverall reliability of the precipitation product itself.
3.1 PR-OBS-1
PR-OBS-1 is based on a physically based Bayesian PMWprecipitation retrieval algorithm that has been developed ac-cording to a new methodology called Cloud Dynamics andRadiation Database (CDRD), an evolution of the more tra-ditional Cloud Radiation Database (CRD) methodology –see Sano et al. (2013), Casella et al. (2013) and Smithet al. (2013) for a thorough presentation of the CDRDmethodology and algorithm, and also Mugnai et al. (2013)for a historical overview of the CRD and CDRD method-ologies and applications. The main objective in transform-ing from CRD to CDRD has been to reduce non-uniquenessproblems affecting retrieval solutions (Panegrossi et al.,1998) by selecting, for any given observational situation,
www.nat-hazards-earth-syst-sci.net/13/1959/2013/ Nat. Hazards Earth Syst. Sci., 13, 1959–1981, 2013

1968 A. Mugnai et al.: Precipitation products from the hydrology SAF
microphysical profiles from the database, which constitutesthe a priori knowledge for the Bayesian solver, that are op-timally consistent with environmental conditions. This isachieved by using dynamical-thermodynamical-hydrological(DTH) parameter constraints in addition to multispectralPMW brightness temperatures (TBs) measured by availablesatellite-borne radiometers – see Sano et al. (2013) for a de-scription of the CDRD algorithm and Smith et al. (2013) fora detailed analysis of the selection of an optimal set of DTHparameters.
The CDRD algorithm developed for PR-OBS-1 makesuse of a large database of simulated precipitating cloudstructures, associated DTH variables and associated top-of-atmosphere satellite-view TBs that have been generated byfirst simulating 60 different precipitating events over the Eu-ropean/Mediterranean Basin region by means of the cloudresolving model (CRM) Non-hydrostatic Modeling System(NMS) of Tripoli (1992) and Tripoli and Smith (2013a,b).The simulation outputs (that is the vertical profiles ofmeteorological-microphysical variables) have been then pro-cessed by an advanced radiative transfer model (RTM) toproduce associated modeled TBs as counterparts to observedTBs (see Casella et al., 2013). The CDRD algorithm has beentested and verified, with improved results as compared to acorresponding CRD algorithm. This was accomplished byfocusing in a very detailed fashion on several precipitationcase studies involving a mix of highly variable convectiveand stratiform rain situations over Italy’s Lazio region thatwere observed both by SSM/I and SSMIS radiometers andby the polarimetric Polar 55C Doppler C-band radar sys-tem operated at CNR-ISAC in Rome, a precision radar sys-tem which was used as the verification standard (see Sanoet al., 2013). The verification results were excellent. In ad-dition, retrievals from the CDRD algorithm for one-year ofTRMM Microwave Imager (TMI) observations taken overthe southern Mediterranean region (TRMM refers to theNASA-JAXA Tropical Rainfall Measuring Mission and theassociated satellite observatory) have been compared againstcorresponding retrievals from TRMM’s official TMI algo-rithm using the TRMM Precipitation Radar (PR) as the com-parison reference standard. Whereas the over ocean retrievalswere nearly equivalent (with the CDRD algorithm indicatingslightly better comparison statistics), the over land CDRDresults indicate significant improvement with respect to theofficial TMI algorithm (see Mugnai et al., 2013).
The CDRD algorithm has been designed for applicationswith a variety of conically scanning MW radiometers fly-ing on current and future satellites. However, in its presentversion for PR-OBS-1, it is applied to SSMIS radiometerobservations only (with the necessary accompanying DTHobservations obtained from analysis and forecast data pro-duced by ECMWF’s operational forecast model). The al-gorithm is operational and provides instantaneous surfaceprecipitation rate (as well as an indication of precipitationphase) at 13.2× 15.5 km2 horizontal resolution, consistent
with the SSMIS high-frequency window channel resolution.The observing cycle of the PR-OBS-1 product depends onthe SSMIS swath width (∼ 1700 km), and on the number andequatorial crossing times (ECTs) of available DMSP satel-lites. In general, each point on the earth’s surface is observedtwice per day by each satellite (i.e., once in descending modeand once, about half a day later, in ascending mode). How-ever, coverage density increases with latitude, and whereasat low latitudes there are gaps between the swaths of suc-cessive orbits, at high latitudes there are more than two ob-servations per day because of partial overlap of successiveswaths. At present, there are three DMSP satellites flyingSSMIS radiometers: DMSP F16, DMSP F17 and DMSP F18having descending ECTs at approximately 05:30, 05:50 and08:10 mean local solar time (LST), respectively. (Note thatwhereas the ECTs remain nearly constant throughout a givenyear, orbit drift will cause slow changes over time – see, e.g.,http://www.ssmi.com/support/crossingtimes.html.) Thus, itcan be assumed that on a given day the entire H-SAF area iscurrently observed by available SSMIS radiometers at leastthree times in the early morning and three more times inthe late afternoon. By the same token, since the radiometerscan swaths extend over more and more time zones as lati-tude increases in either hemisphere, the actual local times atwhich a given location on the earth’s surface is observed by agiven radiometer may change considerably (even hours). Asa consequence, the actual interval between successive obser-vations may also change considerably (say, from about 1/2 hto a few hours) for both the morning and afternoon observa-tions, depending on latitude and the concomitant swath over-lap factor. An example of a PR-OBS-1 product, as a portionof Fig. 2, is shown and discussed within the next subsection.
Within the DP and CDOP-1 phases, the PR-OBS-01 prod-uct corresponding to the CDRD methodology is referred toas H01. This product is now operational over the H-SAF areaand will be soon extended to the MSG full disk. In addition,during CDOP-2 the CDRD methodology will continuouslyevolve with a new product (H17) foreseen for early 2014with extensions to the MSG full disk. Finally, a new prod-uct (H19) will be developed, within the GPM/H-SAF part-nership, for the GPM Core Observatory’s GMI radiometerusing the same CDRD methodology, but also taking advan-tage of distinct and correlated Ka/Ku-band radar informationprovided by the new GPM DPR radar.
3.2 PR-OBS-2
The algorithm used for the current operational versionof PR-OBS-2 was originally inspired by the artificialneural network (ANN) approach of Surussavadee andStaelin (2008a,b), who developed an ANN-based precip-itation retrieval algorithm for applications with measure-ments from AMSU-A+ MHS (or + AMSU-B, i.e., MHS’sancestor instrument on an earlier generation of NOAA-POES satellites), trained through a database generated from
Nat. Hazards Earth Syst. Sci., 13, 1959–1981, 2013 www.nat-hazards-earth-syst-sci.net/13/1959/2013/

A. Mugnai et al.: Precipitation products from the hydrology SAF 1969
CRM simulations of several precipitation events aroundthe globe carried out by means of the PennsylvaniaState University/National Center for Atmospheric Research(PSU/NCAR) Mesoscale Model 5 (MM5) described by Dud-hia (1993) and Grell et al. (1994).
Within H-SAF, this new ANN algorithm has been mod-ified and optimized for the European/Mediterranean Basinarea. It is referred to as the Passive-microwave Neural-network Precipitation Retrieval (PNPR) algorithm (see Mug-nai et al., 2013), being based on a newly developed optimalthree-layer ANN trained using the same 60 NMS simulationsand the same RTM code used for the CDRD algorithm ofPR-OBS-1. This choice has been motivated by the H-SAFrequirement for seeking consistency between the PR-OBS-1and PR-OBS-2 products when the algorithms are applied toclose-in-time measurements acquired by conically and cross-track scanning radiometers for the same rainfall event. Thatis the reason why the training database for the PNPR algo-rithm is based on the same physical foundation used for theCDRD algorithm. Moreover, the two algorithms use the sameprocedures to determine the phase of the retrieved precipita-tion (following the studies of Grody et al., 2000; Rosenkranz,2003; and Surussavadee and Staelin, 2009), as well as thesame precipitation screening methodology following an al-gorithm developed by Chen and Staelin (2003), and finallythe same specially tailored surface identification procedures(see Mugnai et al., 2013).
The simulated satellite TB vectors are consistent withthe AMSU-A and MHS channel frequencies and have in-stantaneous fields of view (IFOVs) at the ground that de-pend on the view angle along the scan. In order to produceunique relationships between the TB vectors for the individ-ual viewing angles and the associated surface precipitationrates, a variable sensor resolution, defined according to thenominal MHS resolution (varying from 16× 16 km2circularat nadir to 26× 52 km2/oval at scan edge), has been cho-sen as the PR-OBS-2 product spatial resolution. As in-put data, the algorithm incorporates TBs measured by theAMSU-A and MHS radiometers: three AMSU-A channels(50.3± 0.50, 52.8± 0.105, 53.596± 0.115 GHz), all fiveMHS channels (89± 0.9, 150± 0.9, 183.31± 1, 183.31± 3,183.31± 7 GHz) and various additional channel-derivedvariables. In addition, several geophysical/geographical pa-rameters (i.e., latitude, terrain height, surface type, season)are used as input data to guide the PNPR algorithm towardsselecting values of the ANN coefficients that are most repre-sentative of an observed scene. The pixel number along thescan is an additional input parameter used by the ANN forreducing, according to Goldberg et al. (2001), limb smear-ing produced by the changing atmospheric path length alongthe scan. The algorithm uses a unique ANN that retrieves thesurface precipitation rate for all types of surface backgroundsrepresented in its database, i.e., land, ocean, ice, snow orcoast.
Analogous to PR-OBS-1, the observing cycle of the PR-OBS-2 product depends on the swath widths of AMSU-Aand MHS (∼ 2050 km and∼ 2150 km, respectively), as wellas on the number and ECTs of the satellites containing thisinstrumental suite. Currently, there are four such satellites –NOAA-18 and NOAA-19, both having descending ECTs atabout 01:30 LST, and MetOp-A and MetOp-B, both havingdescending ECTs at about 09:30 LST. (As for DMSP satel-lites, orbit drift can cause slow changes in the ECTs overtime.) Thus, on a given day, the entire H-SAF area is ob-served by the AMSU-A+ MHS radiometer pairs at a min-imum of eight distinct times (i.e., twice before 01:30 LST,twice before 09:30 LST, twice after 13:30 LST and twice af-ter 21:30 LST), while surrounding each nominal time eventthere may other time events because of overlapping swaths aslatitude increases. And again, as for the SSMIS observations,because of the wide swaths the actual local times at which agiven location on the earth surface is observed by the variousAMSU-A and MHS radiometers may change considerably(even hours).
The PR-OBS-2 product is operational and consists ofthe surface precipitation rate with an indication of phase.Whereas the original PR-OBS-2 product (H02) used the Su-russavadee and Staelin (2008a,b) methodology and was ap-plied to the H-SAF area only, the new PNPR algorithm beingused for PR-OBS-2 uses the independently developed ANNfor CDOP-2 and will be soon extended to the MSG full disk.This algorithm will eventually evolve into H18 by 2014. Inaddition, a new product (H20) will be developed for GPM’sGMI, perhaps adopting an even more refined ANN proce-dure, but one maintaining consistency with the correspond-ing GPM Bayesian CDRD product (H19).
Figure 2 shows a comparison between the PR-OBS-1 andPR-OBS-2 maps of surface precipitation rate for two close-in-time SSMIS and AMSU-A+ MHS observations of anintense precipitation event that caused extensive floodingand damage along the northern Tyrrhenian coasts of Italyon 25 October 2011. Similar to the findings of Mugnai etal. (2013) for a different case study, there is close correspon-dence in rain rates for the heavy precipitation areas (in spiteof a 21 min difference between the two observations), notingthat differences are more evident for the light precipitationareas over the North Sea.
3.3 PR-OBS-3
PR-OBS-3 provides an instantaneous rain intensity product(H03) at the temporal (15 min) and spatial (∼ 8 km overthe H-SAF area) resolution of the MSG SEVIRI, usingthe blended-satellite rapid-update technique originally de-veloped at the US Naval Research Laboratory (NRL) – andtherefore referred to as NRL Technique (NRLT) – which isbased on a real-time, underlying collection of time and spacematching of IR TBs at 10.8 µm from GEO satellites and rainintensity estimations from PMW satellite sensors (Turk et
www.nat-hazards-earth-syst-sci.net/13/1959/2013/ Nat. Hazards Earth Syst. Sci., 13, 1959–1981, 2013

1970 A. Mugnai et al.: Precipitation products from the hydrology SAF
Fig. 2. Example of PR-OBS-1 and PR-OBS-2 precipitation rate retrievals on 25 October 2011. The left panel shows H01 product relativeto a SSMIS (DMSP F18) overpass at 18:39 UTC, while the right panel shows near-correlated H02 product relative to an AMSU-A+ MHS(MetOp-A) overpass at 18:18 UTC.
al., 2000; Turk and Miller, 2005; Torricella et al., 2007).The NRLT processing is triggered as soon as a new slot ofSEVIRI data at 10.8 µm is available. As a second step, theidentification of the PMW measurements coincident in timeand space with the TBs at 10.8 µm of the currently processedSEVIRI image is performed. The coincident data are subse-quently located in a geographical latitude/longitude grid, andfor each grid box the histogram of the IR TBs and that ofthe corresponding PMW rain rates are built and then com-bined by means of a probabilistic histogram matching tech-nique (Calheiros and Zawadzki, 1987) to produce geolocatedTB vs. PMW rain-rate relationships. These relationships arethen used to assign a rainfall intensity value to each SEVIRIpixel.
As soon as a grid box is refreshed with new data, thecorresponding relationship is renewed using updated IR TBand PMW rain-rate histograms. Relationships older than 24 hwith respect to the acquisition time of the IR TB are consid-ered unreliable and consequently no rainfall intensity valuesare assigned until a refresh of the relationship is done. Thekey point of this technique is thus to provide instantaneousrainfall estimations at the GEO spatial and temporal scales,which are consistent with the nature and development of theprecipitating cloud systems, by overcoming the scarcity ofPMW overpasses with the more frequent GEO slots and the
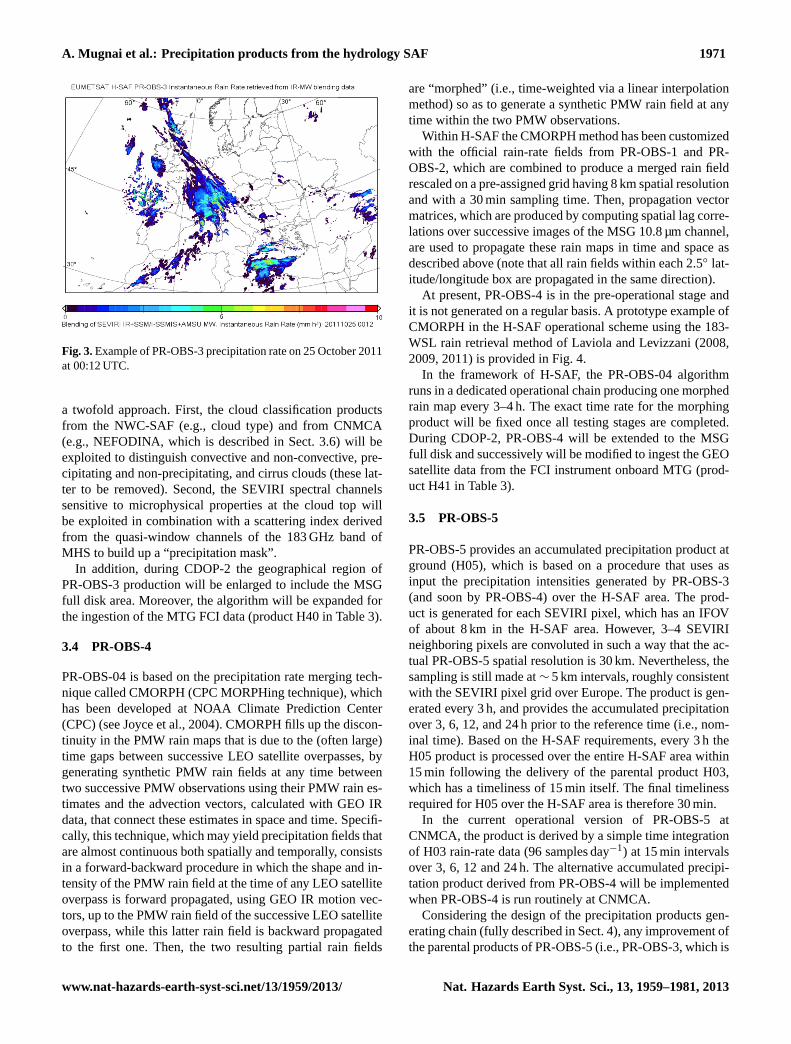
weak connection between the rain intensity and IR TBs withthe calibration of the IR TBs by the PMW rain rates. Figure 3shows an example of PR-OBS-03 relative to 25 October 2011at 00:12 UTC – i.e., for the same event shown in Fig. 2. No-tably, the precipitation rate map is given at a time when noMW radiometer overpasses were available.
Recently, the H03 product entered the CDOP-2 phase inthe pre-operational stage with the NRLT fed by the H02product. In the near future, the processing chain of PR-OBS-3 will be improved by activating new software modulesfor merging the H01 and H02 input data and implementinga preventive classification of cloudy pixels into precipitat-ing and non-precipitating. These lines of development tacklethe two main drawbacks of PMW-IR blended techniques:(1) the lack of a regular and possibly uninterrupted flux ofPMW precipitation products, which has implications on thecontinuous updating of the IR TB vs. PMW rain-rate rela-tionships; and (2) the erroneous precipitation assignments tocold thin clouds such as cirrus, due to the fact that the blendedtechniques assume the colder the cloud top, the higher theassociated precipitation intensity value. The synergistic useof H01 and H02, taking into account their different resolu-tions, error structures and other characteristics, will assure ahigher number of suitable PMW passages than the presentsituation. The cloud classification issue will be tackled with
Nat. Hazards Earth Syst. Sci., 13, 1959–1981, 2013 www.nat-hazards-earth-syst-sci.net/13/1959/2013/
A. Mugnai et al.: Precipitation products from the hydrology SAF 1971
Fig. 3.Example of PR-OBS-3 precipitation rate on 25 October 2011at 00:12 UTC.
a twofold approach. First, the cloud classification productsfrom the NWC-SAF (e.g., cloud type) and from CNMCA(e.g., NEFODINA, which is described in Sect. 3.6) will beexploited to distinguish convective and non-convective, pre-cipitating and non-precipitating, and cirrus clouds (these lat-ter to be removed). Second, the SEVIRI spectral channelssensitive to microphysical properties at the cloud top willbe exploited in combination with a scattering index derivedfrom the quasi-window channels of the 183 GHz band ofMHS to build up a “precipitation mask”.
In addition, during CDOP-2 the geographical region ofPR-OBS-3 production will be enlarged to include the MSGfull disk area. Moreover, the algorithm will be expanded forthe ingestion of the MTG FCI data (product H40 in Table 3).
3.4 PR-OBS-4
PR-OBS-04 is based on the precipitation rate merging tech-nique called CMORPH (CPC MORPHing technique), whichhas been developed at NOAA Climate Prediction Center(CPC) (see Joyce et al., 2004). CMORPH fills up the discon-tinuity in the PMW rain maps that is due to the (often large)time gaps between successive LEO satellite overpasses, bygenerating synthetic PMW rain fields at any time betweentwo successive PMW observations using their PMW rain es-timates and the advection vectors, calculated with GEO IRdata, that connect these estimates in space and time. Specifi-cally, this technique, which may yield precipitation fields thatare almost continuous both spatially and temporally, consistsin a forward-backward procedure in which the shape and in-tensity of the PMW rain field at the time of any LEO satelliteoverpass is forward propagated, using GEO IR motion vec-tors, up to the PMW rain field of the successive LEO satelliteoverpass, while this latter rain field is backward propagatedto the first one. Then, the two resulting partial rain fields
are “morphed” (i.e., time-weighted via a linear interpolationmethod) so as to generate a synthetic PMW rain field at anytime within the two PMW observations.
Within H-SAF the CMORPH method has been customizedwith the official rain-rate fields from PR-OBS-1 and PR-OBS-2, which are combined to produce a merged rain fieldrescaled on a pre-assigned grid having 8 km spatial resolutionand with a 30 min sampling time. Then, propagation vectormatrices, which are produced by computing spatial lag corre-lations over successive images of the MSG 10.8 µm channel,are used to propagate these rain maps in time and space asdescribed above (note that all rain fields within each 2.5◦ lat-itude/longitude box are propagated in the same direction).
At present, PR-OBS-4 is in the pre-operational stage andit is not generated on a regular basis. A prototype example ofCMORPH in the H-SAF operational scheme using the 183-WSL rain retrieval method of Laviola and Levizzani (2008,2009, 2011) is provided in Fig. 4.
In the framework of H-SAF, the PR-OBS-04 algorithmruns in a dedicated operational chain producing one morphedrain map every 3–4 h. The exact time rate for the morphingproduct will be fixed once all testing stages are completed.During CDOP-2, PR-OBS-4 will be extended to the MSGfull disk and successively will be modified to ingest the GEOsatellite data from the FCI instrument onboard MTG (prod-uct H41 in Table 3).
3.5 PR-OBS-5
PR-OBS-5 provides an accumulated precipitation product atground (H05), which is based on a procedure that uses asinput the precipitation intensities generated by PR-OBS-3(and soon by PR-OBS-4) over the H-SAF area. The prod-uct is generated for each SEVIRI pixel, which has an IFOVof about 8 km in the H-SAF area. However, 3–4 SEVIRIneighboring pixels are convoluted in such a way that the ac-tual PR-OBS-5 spatial resolution is 30 km. Nevertheless, thesampling is still made at∼ 5 km intervals, roughly consistentwith the SEVIRI pixel grid over Europe. The product is gen-erated every 3 h, and provides the accumulated precipitationover 3, 6, 12, and 24 h prior to the reference time (i.e., nom-inal time). Based on the H-SAF requirements, every 3 h theH05 product is processed over the entire H-SAF area within15 min following the delivery of the parental product H03,which has a timeliness of 15 min itself. The final timelinessrequired for H05 over the H-SAF area is therefore 30 min.
In the current operational version of PR-OBS-5 atCNMCA, the product is derived by a simple time integrationof H03 rain-rate data (96 samples day−1) at 15 min intervalsover 3, 6, 12 and 24 h. The alternative accumulated precipi-tation product derived from PR-OBS-4 will be implementedwhen PR-OBS-4 is run routinely at CNMCA.
Considering the design of the precipitation products gen-erating chain (fully described in Sect. 4), any improvement ofthe parental products of PR-OBS-5 (i.e., PR-OBS-3, which is
www.nat-hazards-earth-syst-sci.net/13/1959/2013/ Nat. Hazards Earth Syst. Sci., 13, 1959–1981, 2013

1972 A. Mugnai et al.: Precipitation products from the hydrology SAF
Fig. 4.Example of CMORPH algorithm applied to PMW precipitation intensities retrieved by 183-WSL algorithm of Laviola and Levizzani(2008, 2009, 2011) for a severe storm over southern Italy during October 2009. PMW rain rates at 01:00 UTC are “morphed” to successivePMW rain-rate estimates at 05:00 UTC. Note that the last two panels, representing CMORPH outputs at 05:30 and 06:00 UTC, respectively,are used to describe CMORPH reconstruction of the rain field between PMW rain rates at 05:00 and 06:30 UTC.
affected, for example, by a bias towards the convective con-tribution to the precipitation estimate) will have a positiveimpact on the scores of PR-OBS-5. Moreover, a new ver-sion of the PR-OBS-5 algorithm has been designed, which isbased on a two-step approach:
1. Use of independent sources of information to take intoaccount the real-time observed precipitation data fromrain-gauges and weather radars, to obtain the “combinedobserved precipitation field”; moreover, introducing avery short-term forecast from numerical weather pre-diction (NWP) models, acting as first-guess, a real-timeobjective analysis is performed(analysis step);
2. Real-time correction by means of classical statisticaltechniques, using the accumulated precipitation analy-sis field as a proxy observation(correction step)(note
that in the current configuration, a simple bias removalalgorithm is employed).
Figure 5 shows an example of the difference between thecurrently operational and the new version of PR-OBS-5 for17 April 2012. Evidently, the introduction of ancillary in-formation in the new version leads to a difference of theaccumulated precipitation in some areas (i.e., southern Adri-atic Sea) as large as 3 mm.
3.6 PR-OBS-6
PR-OBS-6 provides an instantaneous convective precipi-tation product (H15) at the temporal (15 min) and spa-tial (∼ 8 km over the H-SAF area) resolution of the MSGSEVIRI, which is based on the combined use of the blended-satellite rapid-update NRLT technique (see Sect. 3.3) and
Nat. Hazards Earth Syst. Sci., 13, 1959–1981, 2013 www.nat-hazards-earth-syst-sci.net/13/1959/2013/

A. Mugnai et al.: Precipitation products from the hydrology SAF 1973
Fig. 5. PR-OBS-5 generated 6-hour accumulated precipitation on 17 April 2012: top left panel shows results from current operationalalgorithm (PR-OBS-5); top right panel shows results from analysis step; bottom left panel shows results from new version of algorithm(PR-OBS-5*); and bottom right panel shows differences between new and original versions of the algorithm (PR-OBS-5*–PR-OBS-5).
of the DYNAmic NEFOanalysis (NEFODINA) technique(Puca et al., 2005; see also Melfi et al., 2012), which isused for generating a convection mask and for redistributingthe initial precipitation estimation, made by PR-OBS-1 andPR-OBS-2, according to the characteristics of the convectivecells.
During the H-SAF DP phase, the performance of theNRLT technique was evaluated by means of a specific valida-tion activity, which demonstrated that a preliminary screen-ing between convective and stratiform clouds has a posi-tive impact in establishing IR-TB–rainfall-rate relationships.Such a screening can be accomplished by means of theNEFODINA technique, which was developed at CNMCAfor the detection and classification of convective cloud sys-tems and the monitoring of their life cycles. Specifically,NEFODINA uses a multichannel approach based on the IRwindow at 10.8 µm and the water vapor (WV) absorptionbands at 6.2 µm and 7.3 µm to provide information on con-vective objects (COs) within cloud systems, from mesoscaleconvective systems down to single cell thunderstorms. In par-ticular, NEFODINA produces images that identify cells, theirdevelopment phase (developing/dissolving), and their move-ment. In addition, these output images are associated withquantitative information on the IR and WV channel TBs,along with the CO shape, slope index (i.e., the spatial TBgradient), CO extension area, and CO mean and minimumTB values, to build a convection mask. An example of theNEFODINA product is presented in Fig. 6, showing that
NEFODINA is an important nowcasting application that canbe used to diagnose cloud convective activity and evaluateboth its severity and potential development.
It is well known that PMW estimates are affected by alow spatial resolution, which causes significant underestima-tion of precipitation associated with small-scale convectivecells. This problem is tackled by the PR-OBS-6 product, inwhich NEFODINA is used to improve the convective precip-itation retrieval, as compared to PR-OBS-3, both by defin-ing the areas of convection and by redistributing the initialrainfall-rate estimation, made by PR-OBS-1 or PR-OBS-2,according to the spatial variability and extension of the con-vective cells characterized by the most intense precipitation(see Antonelli et al., 2011). As an example, Fig. 7 shows thedifference in 3 h accumulated precipitation when PR-OBS-3and PR-OBS-6 are used as input. The intense convective pre-cipitation that produced a highly damaging flash flood overnortheastern Sicily on 1 October 2009 is more evident whenPR-OBS-6 is used; in addition, in this case the accumulatedprecipitation values are much closer to those that had beenmeasured by the rain gauges of the Italian Department ofCivil Protection – up to 190− −200 mm in less than 6 h.
During CDOP-2 the geographical region of PR-OBS-6will be enlarged to include the full disk area. Moreover, thealgorithm will be expanded so as to include the new productH50 for estimating convective precipitation from the MTGLI data.
www.nat-hazards-earth-syst-sci.net/13/1959/2013/ Nat. Hazards Earth Syst. Sci., 13, 1959–1981, 2013

1974 A. Mugnai et al.: Precipitation products from the hydrology SAF
Fig. 6. Example of NEFODINA product from MSG imagery overnorthwestern Algeria and northeastern Morocco on 29 May 2011at 17:00 UTC. Blue shades are used to show the cloud system ofinterest. Dark blue shades are used for low clouds, whereas lightblue/yellow shades are used for high clouds. Red shades indicatecloud tops of convective cells in development phase. Pink shadesindicate cloud tops of convective cells in dissipation phase. Thedarkest red and pink shades indicate the most intense convectiveregions.
4 H-SAF precipitation product generating chain
The architecture of the precipitation product generating chainat CNMCA is dedicated to the acquisition of satellite data,data pre-processing and post-processing, and production ofprecipitation maps. The first configuration of the architecturehas been reported by Zauli et al. (2007, 2009) and consists offour different parts: (1) reception of satellite data dedicatedto precipitation retrievals, (2) map elaboration and dissemi-nation, (3) archiving and monitoring, and (4) web distribu-tion. The architecture has been implemented considering therequirements of products in terms of timeliness, availability,and resolutions. The H-SAF requirements have imposed theuse of native formats, without degradation of the information,and the monitoring of the production chain performance. Dueto the variety of satellite data that needs to be processed, aredundancy strategy has been adopted to receive polar andgeostationary satellite data and to guarantee the success ofthe acquisition capability.
The acquisition of the satellite data is based on three dif-ferent systems: (1) direct readout, with a fixed (Meteosatsatellites) or tracking (NOAA-POES and EPS-MetOp satel-lites) L-band antenna installed at CNMCA; (2) EUMET-Cast, EUMETSAT’s broadcasting system based on commer-cial satellites (http://www.eumetsat.int/website/home/Data/DataDelivery/EUMETCast/index.html); and (3) file trans-fer protocol (FTP) over the Internet for receiving DMSPdata from the UK Met Office, Exeter, UK. A twin track-ing antenna system is installed and functioning at CNMCA,each one with reception capability at L- and X-band. Fu-ture satellite systems (as EUMETSAT’s Post-EPS) will trans-mit data to direct readout users at X frequency, a band al-ready used by the current generation of satellites for com-plete orbit dumps at polar stations. Data from NOAA-POES
Fig. 7.Accumulated precipitation (mm) for previous three hours on1 October 2009 at 21:00 UTC, where PR-OBS-3 (left panel) andPR-OBS-6 (right panel) are used for accumulating.
and EUMETSAT-EPS are received both via direct readout,through tracking antennas dedicated to polar satellite acqui-sition, and EUMETCast. A 2.7 m diameter antenna, withdual feed for L- and X-band reception, has been preparedto receive data from future polar satellites. The EUMETSATAdvanced Retransmission System (EARS), disseminated bydigital video broadcasting via EUMETCast, allows receptionin near real time of the NOAA and MetOp data covering Eu-rope and North America (see Fig. 8), but it does not receivethe SSMIS data. For this reason, DMSP calibrated and geo-referenced data (level L1C) are received via FTP from theUK Met Office, which retransmits global orbit data producedby NOAA. SEVIRI data from MSG are received through EU-METCast. CNMCA generates L1C data from AMSU-A andMHS with the ATOVS and AVHRR Preprocessing Package(AAPP) developed by the SAF for Numerical Weather Pre-diction (NWP-SAF). These data are passed to the PR-OBS-2routines for calculating instantaneous surface precipitationrates over the entire H-SAF domain based on the EARS EU-METCast system.
Figure 9 shows the flow diagram of the precipitation prod-uct generation. The precipitation product data can be re-ceived via EUMETCast but also can be retrieved via FTP.The accessibility of the products via FTP is centralized byCNMCA. The server (ftp.meteoam.it) is accessible to au-thorized users for product download. The availability of theproducts is guaranteed in a 3 month “online” window. The H-SAF website (http://hsaf.meteoam.it) provides quick-looksof all products, as well as the relevant scientific and technicaldocumentation and news about workshops and meetings. The“contact us” section of the H-SAF website describes how toretrieve the dataset of interest from theftp.metoam.itserver.After a free registration, the potential user will be contactedvia e-mail to perform the download. A detailed report aboutthe performance of service in terms of product availability,archiving, and dissemination is published every six months.Operation reports provide the expected performances andmonitor the results of products.
Nat. Hazards Earth Syst. Sci., 13, 1959–1981, 2013 www.nat-hazards-earth-syst-sci.net/13/1959/2013/

A. Mugnai et al.: Precipitation products from the hydrology SAF 1975
Fig. 8. Map of EUMETSAT Advanced Retransmission System (EARS) stations that receive AMSU/MHS data directly from the over-passing NOAA and MetOp satellites, and retransmit the data to EUMETSAT Headquarters. The color coding indicates the percentageof the actual satellite passes over a given geographical region – i.e., swaths that can be received by the proposed station network. Lightgrey corresponds to 0–50 % and blue corresponds to 50–100 % (here, 100 % indicates that every time the region is in the field of viewof the instrument, then the image data will be received by the network, while 50 % indicates that, on average, every second pass cov-ering the region will be received). (Courtesy of EUMETSAT:http://www.eumetsat.int/website/home/Satellites/CurrentSatellites/Metop/RegionalDataService/EARSATOVS/index.html.)
Fig. 9.Flow diagram of the H-SAF precipitation product generating chain.
www.nat-hazards-earth-syst-sci.net/13/1959/2013/ Nat. Hazards Earth Syst. Sci., 13, 1959–1981, 2013

1976 A. Mugnai et al.: Precipitation products from the hydrology SAF
5 H-SAF precipitation product and hydrologicalvalidation programs
Product validation (PV) using independent datasets has beena H-SAF priority since the beginning in order to evaluate theperformance of the products, provide error structure infor-mation to end users (hydrologists, meteorologists, etc.) andsupport the product developers. The following is an overviewof the precipitation product validation (PPV) activity and ofthe underlying methodology, while the reader is referred tothe companion paper by Puca et al. (2013) for a detailed de-scription together with the presentation and discussion of theresults obtained during H-SAF DP and CDOP-1 phases.
For all products generated by the H-SAF project, the PVactivity consists of
– monitoring the progress in product quality by means ofstatistical scores and case study analyses, both based oncomparisons between satellite products and correspond-ing ground data;
– providing validation service to end users by publishingon the H-SAF web page both the statistical scores andthe case study analyses;
– providing online quality control to end users by gener-ating near-real-time quality maps;
– monitoring operational features of the products in termsof actual arrival times, timeliness, intelligibility, etc.;
– providing ground data services within the project for al-gorithm calibration and validation activities;
– investigating H-SAF product impacts on end-user appli-cations such as civil protection activities for emergencymanagement, precipitation event alerts, street monitor-ing, water balance evaluation, etc.
To this end, a Precipitation Product Validation Group(PPVG) has been established within H-SAF composed of ex-perts (hydrologists, meteorologists, and precipitation grounddata experts) from the national meteorological and hydro-logical institutes of eight countries (Belgium, Bulgaria, Ger-many, Hungary, Italy, Poland, Slovakia and Turkey), underthe coordination of the Italian DPC. The PPVG activity ispresently based on a network of 4100 rain gauges and 54 me-teorological radars belonging to eight different countries (seePuca et al., 2013) that provide ground data to be used for ref-erence.
Over the years, each institute of the PPVG has developeda specific validation methodology, based on its own knowl-edge and experience, focused on case study analyses, withthe possibility of using ancillary data such as lightning data,SEVIRI images, output of NWP models, and nowcastingproducts. Nevertheless, the importance of defining a com-mon validation methodology allowing comparison of results
obtained by multiple institutes, leading to a more system-atic understanding, has become clear since the beginning ofthe project. The main steps of this methodology have beenidentified inside the PPVG in collaboration with the prod-uct developers (see Puca et al., 2013). The common valida-tion methodology is based on ground data (radar, rain gaugeand integrated data) comparisons to produce “large statistics”(multicategorical and continuous). However, since the prod-ucts to be validated differ in retrieval technique, as well asin space and time resolution, every product needs a specificvalidation procedure. The main steps of the common valida-tion methodology are (1) ground data (radar and rain gauge)error analysis, (2) point measurement (rain gauge) spatial in-terpolation, (3) upscaling of radar data to satellite native grid,(4) temporal comparison of satellite- and ground-based pre-cipitation products, and (5) production and evaluation of con-tinuous and multicategorical statistical scores.
As for point (1), differences among rain gauge networks(i.e., temporal sampling, density, availability of heated sys-tems for snow measurements), among radar systems (i.e.,time and space resolution, antenna elevation, radar character-istics, retrieval techniques), and of the local geomorphology(i.e., geography, orography, coastlines, etc.) cause the relia-bility of ground data to vary from area to area, and affect thevalidation results to varying degrees. For this reason, qualityindex maps are produced and associated to all ground data.The quality index, which is a function of position and time,is subsumed into a single number ranging between 0 and 1,and uses all essential information available to quantify thereliability of the ground data to which the index must be as-sociated (see Vulpiani et al., 2008, and Rinollo et al., 2013).
As for point (2), in order to obtain a standard map forcomparison with satellite products, the rain gauge measure-ments are interpolated onto a unique European grid, with gridcells using a 5 km mesh size. In so doing, three different in-terpolation techniques have been proposed and tested: (1) aBarnes method (Barnes, 1964), (2) a Kriging method, and(3) a GRISO (Random Generator of Space Interpolationsfrom Uncertain Observations) method (see Pignone et al.,2010), which is an improved Kriging-based method imple-mented by the Italian CIMA (International Centre on Envi-ronmental Monitoring) Research Foundation. Results showthe best performance arises using the GRISO method, whichhas thus been adopted.
As for point (3), the PPVG members decided together withthe product developers to validate each product using its na-tive grid as the reference grid. Thus, the radar data, whichalways have resolutions higher than the product resolution,are always upscaled to the product grid. Alternatively, for theinterpolated rain gauge data, when product resolutions are onthe order of 5 km (i.e., for LEO-GEO combined products) anearest-neighbor matching is performed. For coarser satelliteproduct resolutions (i.e., for LEO-only products), the inter-polated rain gauge data are again upscaled. As an example,
Nat. Hazards Earth Syst. Sci., 13, 1959–1981, 2013 www.nat-hazards-earth-syst-sci.net/13/1959/2013/

A. Mugnai et al.: Precipitation products from the hydrology SAF 1977
Fig. 10. Various sources of surface precipitation-rate products plus a cloud-type product over Hungary on 5 May 2010 at 16:29 UTC: H-SAF’s PR-OBS-1 surface precipitation rate (upper left panel); corresponding Hungarian operational radar network surface precipitation ratein upscaled format (upper right panel); corresponding Hungarian operational weather radar network surface precipitation rate in originalresolution format (lower left panel); and corresponding cloud type from NWC-SAF (lower right panel). Note upper panels use the sameprecipitation rate color bar ranging from 0 to 10 mm h−1, whereas a different precipitation rate color bar is used for lower left panel (notshown). (Cloud type key also not shown.)
Fig. 10 shows a PR-OBS-1 image and the correspondingradar data both at the original and upscaled resolutions.
As for points (4) and (5), at the end of the validation pro-cedure statistical scores are calculated on a monthly basisfor the satellite–radar data pairs for land, sea and coastalpixels separately. Several statistical scores are consideredthat can be identified and grouped as continuous statistics,multicategory statistics (using three and five precipitationclasses for the instantaneous and accumulated products, re-spectively), and probability distribution functions (thirty dis-tribution classes of satellite and radar data). Every institutecalculates the statistics over their pertinent areas followingthe common validation methodology. Then, at the end ofthe line, an overall statistic for the entire H-SAF area iscalculated by DPC, which acts as the coordinating institute(see Puca et al., 2013, for a sample of results).
It is foreseen that during CDOP-2, with the generationof satellite products for the MSG full disk and collab-oration with international groups and programs (such asIPWG, TRMM and GPM), PPV activity will be extendedto available sites in Africa with experts from non-Europeancountries (in particular, from Africa and the Americas)
participating in the PPVG. Collaboration with the IPWG willinvolve comparing different validation methodologies and in-troducing IPWG precipitation products into the H-SAF val-idation procedures. By the same token, during CDOP-2 theH-SAF validation infrastructure will be used for validationand quality assessment of precipitation products developedby or shared with other SAFs, such as NWC-SAF and CM-SAF. The PPVG also plans to use data from satellite-borneradars (from the TRMM PR over the African area and thenfrom the DPR onboard the GPM Core Satellite over both theH-SAF and African areas) as reference for the validation ac-tivity.
Finally, besides the PPV program, H-SAF includes a hy-drological validation (HV) program aiming at independentlyassessing the benefit of using the various H-SAF satellite-derived products in practical hydrological applications. Thefinal goal is to encourage the utilization of H-SAF productsby national hydrological services and improve the use ofsatellite data within hydrological models for near-real-timemonitoring of runoff and the hydrological states of basins,water management, low-flow forecasting, and flood risk fore-casting – taking into account the importance of providing
www.nat-hazards-earth-syst-sci.net/13/1959/2013/ Nat. Hazards Earth Syst. Sci., 13, 1959–1981, 2013

1978 A. Mugnai et al.: Precipitation products from the hydrology SAF
information redundant with respect to ground observations,since these may be unavailable in extreme or catastrophiccases due to damage to the local measuring equipment and/ordata links.
In this regard, satellite products (in particular, precipita-tion products) are being used as input to a number of hydro-logical models (13 of them in all) and impact and validationstudies on several test sites (21 of them in all), each withdifferent characteristics and sizes, in eight European coun-tries (Belgium, Bulgaria, Finland, Germany, Italy, Poland,Slovakia and Turkey). These activities are being performedunder the coordination of the Polish IMGW. The preliminaryHV activity that has been carried out during DP and CDOP-1 has shown that the H-SAF satellite precipitation productsmay still have limited accuracy when incorporated directlyinto the hydrological models. That is why during CDOP-2these products must be used, with their wide and continuousspatial distribution, to improve point ground data from raingauges and/or radar data by means of satellite–rain-gauge–radar blending procedures. In this manner, the blended datacan be used as input data for hydrological models and vali-dated in the same way as the original H-SAF products. It istacitly understood that this will make the precipitation prod-ucts more applicable in operational hydrology.
6 Summary and conclusions
We have presented an overview and explanation of theEUMETSAT Satellite Application Facility on Support to Op-erational Hydrology and Water Management, which is themain European effort concerning use of satellite precipita-tion data operationally. While other SAFs produce precipi-tation products, the H-SAF focus is largely on precipitationproducts from available LEO and GEO satellites using bothpassive-microwave and infrared data. In fact, H-SAF gener-ates operational precipitation products that are useful for notonly hydrological applications, but also for many other sci-entific research applications because they are based on a suiteof advanced and ever-improving algorithms described herein.
H-SAF has adopted, from its inception, a validation strat-egy which is now growing and reaching a critical mass neces-sary to validate operational meteorology, hydrology and cli-mate products. Specifically, H-SAF includes both a productvalidation program and a hydrological validation program,which involve several countries. These programs have beenshown to be instrumental in evaluating and improving H-SAF precipitation products, as well as for assessing prod-uct usefulness in mitigating against hazards due to floods,landslides and avalanches, as well as evaluation of water re-sources. At present, H-SAF is the only collaborative programin the meteorological and hydrological communities that hasmanaged to create an extensive ground-based reference datanetwork by sharing data from eight different countries andtreating them with the same methodology.
Like the other seven SAFs, H-SAF has just entered thesecond part of the Continuous Development and OperationsPhase (2012–2017), and therefore has several years ahead torelease advanced products and work with the next generationof LEO and GEO satellites, particularly with EUMETSAT’sPost-EPS and MTG satellites.
H-SAF is an active member of the International Precipita-tion Working Group, while the H-SAF algorithms are part ofthe IPWG inventory of operational satellite precipitation re-trieval tools as a EUMETSAT contribution. The internationalactivity of H-SAF is conducted via a new coordination bodywithin EUMETSAT, i.e., the Precipitation Science AdvisoryGroup, which has been established for ensuring an adequatelevel of coordination of the activities between SAFs – i.e.,especially between H-SAF, the Nowcasting SAF and the Cli-mate Monitoring SAF. Finally, H-SAF is the only Europe-wide entity that can devise a long-term partnership involv-ing continental precipitation within current international pro-grams, such as the NASA-JAXA Global Precipitation Mea-surement mission (an international effort designed to obtain3 h coverage of precipitation over the globe). In so doing,various H-SAF precipitation algorithms and products will bedeveloped in the near future for exploitation with measure-ments from the GPM Core Observatory planned for launchin 2014.
Table A1. Acronyms.
AAPP: ATOVS and AVHRR Pre-processing PackageAMSU: Advanced Microwave Sounding UnitANN: Artificial Neural NetworkATOVS: Advanced TIROS Operational Vertical SounderAVHRR: Advanced Very High Resolution RadiometerCDOP: Continuous Development and Operations PhaseCDRD: Cloud Dynamics and Radiation DatabaseCGMS: Coordination Group for Meteorological Satel-
litesCIMA: Italian International Centre on Environmental
MonitoringCMORPH: CPC Morphing TechniqueCM-SAF: Satellite Application Facility on Climate Moni-
toringCNMCA: National Center of Aeronautical Meteorology
and ClimatologyCNR: Italian National Research CouncilCO: Convective ObjectCPC: Climate Prediction CenterCRD: Cloud Radiation DatabaseCRM: Cloud Resolving ModelDMSP: Defense Meteorological Satellite ProgramDP: Development PhaseDPC: Italian Department of Civil ProtectionDPR: Dual-frequency Precipitation RadarDTH: Dynamical-Thermodynamical-HydrologicalECMWF: European Centre for Medium-Range Weather
ForecastsEARS: EUMETSAT Advanced Retransmission System
Nat. Hazards Earth Syst. Sci., 13, 1959–1981, 2013 www.nat-hazards-earth-syst-sci.net/13/1959/2013/

A. Mugnai et al.: Precipitation products from the hydrology SAF 1979
EC: European CommissionECT: Equatorial Crossing TimeEPS: EUMETSAT Polar SystemESA: European Space AgencyEU: European UnionEUMETSAT: European Organisation for the Exploitation of
Meteorological SatellitesFCI: Flexible Combined ImagerFMI: Finnish Meteorological InstituteFTP: File Transfer ProtocolGEO: Geostationary Earth OrbitGMES: Global Monitoring for Environment and Secu-
rityGMI: GPM Microwave ImagerGPM: Global Precipitation MeasurementGRISO: Random Generator of Space Interpolations
from Uncertain ObservationsH-SAF: Satellite Application Facility on Support to Op-
erational Hydrology and Water ManagementHV: Hydrological ValidationIFOV: Instantaneous Field-of-ViewIMGW: Polish Institute of Meteorology and Water Man-
agementIOP: Initial Operations PhaseIPWG: International Precipitation Working GroupIR: InfraRedISAC: Institute of Atmospheric Sciences and ClimateITAF: Italian Air ForceJAXA: Japan Aerospace Exploration AgencyLEO: Low-Earth-OrbitingLI: Lightning ImagerLST: Local Solar TimeMetOp: Meteorological OperationalMHS: Microwave Humidity SounderMM5: Mesoscale Model-5MSG: Meteosat Second GenerationMTG: Meteosat Third GenerationMW: MicroWaveNASA: National Aeronautics and Space AdministrationNCAR: National Center for Atmospheric ResearchNEFODINA: DYNAmic NEFOanalysisNMS: Non-hydrostatic Modeling SystemNOAA: National Oceanic and Atmospheric Administra-
tionNRL: Naval Research LaboratoryNRLT: NRL TechniqueNWC-SAF: Satellite Application Facility on Support to
Nowcasting and Very Short Range ForecastingNWP: Numerical Weather PredictionNWP-SAF: Satellite Application Facility for Numerical
Weather PredictionOSCAR: Observing Systems Capability Analysis and
Review ToolPMW: Passive MicrowavePNPR: Passive-microwave Neural-network Precipita-
tion RetrievalPOES: Polar-orbiting Operational Environmental
SatellitesPPV: Precipitation Product ValidationPPVG: Precipitation Product Validation Group
PR: Precipitation RadarP-SAG: Precipitation Science Advisory GroupPSU: Pennsylvania State UniversityPV: Product ValidationRTM: Radiative Transfer ModelSAF: Satellite Application FacilitySEVIRI: Spinning Enhanced Visible and InfraRed Im-
agerSMA: Italian Aeronautical Meteorological ServiceSSM/I: Special Sensor Microwave ImagerSSMIS: Special Sensor Microwave Imager/SounderTB: Brightness TemperatureTIROS: Television InfraRed Observation SatelliteTMI: TRMM Microwave ImagerTRMM: Tropical Rainfall Measuring MissionTSMS: Turkish State Meteorological ServiceUSAM: General Office for Air Space and MeteorologyUTC: Universal Time CoordinatedWMO: World Meteorological OrganizationWV: Water VaporZAMG: Austrian Central Institution for Meteorology
and Geodynamics
Acknowledgements.We wish to thank Roberto Sorani and BizzarroBizzarri who were among the main promoters for a SAF on supportto hydrology, and then coordinated the H-SAF activities duringits Development Phase. A. Mugnai, D. Casella, S. Dietrich,G. Panegrossi and P. Sano would also like to thank Eric A. Smithand Gregory J. Tripoli, with whom the CDRD approach hasbeen conceived and developed. Finally, we wish to thank the twoanonymous reviewers for their helpful comments and suggestions.Over the years, the CNR-ISAC participation in the H-SAF projecthas been supported not only by EUMETSAT, but also by severalItalian and European agencies through a series of national andinternational projects – i.e., (1) by the Italian Department of CivilProtection (DPC) through the Operational Agreement DPC-ISAC;(2) by the European Community Initiative INTERREG III-BARCHIMED through the project “Weather Risk Reduction inthe Central and Eastern Mediterranean” (RISKMED); (3) by theItalian FISR-MIUR Programme “Sustainable Development andClimate Changes” through the project “Aerosol Effects on Cloudsand Climate” (AEROCLOUDS); (4) by the Italian Space Agency(ASI) through the pilot project “Civil Protection from Floods:The Nowcasting”; and (5) by the European Commission throughtwo different projects – the 6th Framework Programme project“Observation, Analysis and Modeling of Lightning Activity inThunderstorms, for use in Short Term Forecasting of Flash Floods”(FLASH) for the Rome group (A. Mugnai, D. Casella, S. Dietrich,F. Di Paola, G. Panegrossi and P. Sano), and the 7th FrameworkProgramme FP7-2010-1.1-04 GMES project “Global WaterScarcity Information Service” (GLOWASIS), GA No. 262255, forthe Bologna group (V. Levizzani, E. Cattani and S. Laviola).
Edited by: G. BoniReviewed by: two anonymous referees
www.nat-hazards-earth-syst-sci.net/13/1959/2013/ Nat. Hazards Earth Syst. Sci., 13, 1959–1981, 2013

1980 A. Mugnai et al.: Precipitation products from the hydrology SAF
References
Antonelli, P., Puca, S., Zauli, F., Bennartz, R., De Leonibus, L.,Feltz, W., and Woolf, H.: Validation of satellite rain rate es-timation with ground-based observing systems, in: IntegratedGround-Based Observing Systems, Application for Climate, Me-teorology and Civil Protection, edited by: Cimini, D., Marzano,F., and Visconti, G., Springer-Verlag, Berlin – Heidelberg, Ger-many, 241–278, 2011.
Barnes, S. L.: A technique for maximizing details in numericalweather map analysis, J. Appl. Meteor., 3, 396–409, 1964.
Calheiros, R. V. and Zawadzki, I. I.: Reflectivity rain-rate relation-ship for radar hydrology in Brazil, J. Clim. Appl. Meterol., 26,118–132, 1987.
Casella, D., Panegrossi, G., Sano, P., Mugnai, A., Smith, E. A.,Tripoli, G. J., Dietrich, S., Formenton, M., Di Paola, F., Le-ung, H. W.-Y., and Mehta, A. V.: Transitioning from CRD toCDRD in Bayesian retrieval of rainfall from satellite passive mi-crowave measurements, Part 2: Overcoming database profile se-lection ambiguity by consideration of meteorological control onmicrophysics, IEEE Trans. Geosci. Remote Sens., in press, 2013.
Chen, F. W. and Staelin, D. H.: AIRS/AMSU/HSB precipitation es-timates, IEEE Trans. Geosci. Remote Sens., 41, 410–417, 2003.
Dudhia, J.: A nonhydrostatic version of the Penn State-NCARMesoscale Model: Validation tests and simulation of an Atlanticcyclone and cold front, Mon. Weather Rev., 121, 1493–1513,1993.
Goldberg, M. D., Crosby, D. S., and Zhou, L.: The limb adjustmentof AMSU-A observations: Methodology and validation, J. Appl.Meteor., 40, 70–83, 2001.
Grell, G., Dudhia, J., and Stauffer, D. R.: A Description of the FifthGeneration Penn State/NCAR Mesoscale Model (MM5), NCARTechnical Note NCAR/TN-398+STR, National Center for At-mospheric Research, Boulder, Colorado, USA, 121 pp., 1994.
Grody N., Weng, F., and Ferraro, R.: Application of AMSU for ob-taining hydrological parameters, in: Microwave Radiometry andRemote Sensing of the Earth’s Surface and Atmosphere, editedby: Pampaloni, P. and Paloscia, S., VSP 2000, 339–352, 2000.
Joyce, R. J., Janowiak, J. E., Arkin, P. A., and Xie, P.: CMORPH: Amethod that produces global precipitation estimates from passivemicrowave and infrared data at high spatial and temporal resolu-tion, J. Hydromet., 5, 487–503, 2004.
Laviola, S. and Levizzani, V.: Rain retrieval using 183 GHz absorp-tion lines, in: Proceedings of the 10th IEEE Specialist Meet-ing on Microwave Radiometry and Remote Sensing of the En-vironment (MicroRad 2008), Firenze, Italy, 11–14 March 2008,doi:10.1109/MICRAD.2008.4579505, 2008.
Laviola, S. and Levizzani, V.: Observing precipitation by means ofwater vapor absorption lines: A first check of the retrieval capa-bilities of the 183-WSL rain retrieval method, Italian J. RemoteSens., 41, 39–49, 2009.
Laviola, S. and Levizzani, V.: The 183-WSL fast rain rate retrievalalgorithm, Part I: Retrieval design, Atmos. Res., 99, 443–461,2011.
Melfi, D., Zauli, F., Biron, D., Vocino, A., and Sist, M.: The impactof NEFODINA convective clouds identification in the rain rateretrieval of H-SAF, Proceedings of the 2012 EUMETSAT Me-teorological Satellite Conference, Sopot, Poland, 3–7 September2012, EUMETSAT P.61, 7 pp., 2012.
Mugnai, A., Smith, E. A., Tripoli, G. J., Bizzarri, B., Casella,D., Dietrich, S., Di Paola, F., Panegrossi, G., and Sano, P.:CDRD and PNPR satellite passive microwave precipitation re-trieval algorithms: EuroTRMM/EURAINSAT origins and H-SAF operations, Nat. Hazards Earth Syst. Sci., 13, 887–912,doi:10.5194/nhess-13-887-2013, 2013.
Panegrossi, G., Dietrich, S., Marzano, F. S., Mugnai, A., Smith,E. A., Xiang, X., Tripoli, G. J., Wang, P. K., and Poiares Bap-tista, J. P. V.: Use of cloud model microphysics for passivemicrowave-based precipitation retrieval: Significance of consis-tency between model and measurement manifolds, J. Atmos.Sci., 55, 1644–1673, 1998.
Panegrossi, G., Casella, D., Cattani, E., Dietrich, S., Laviola, S.,Levizzani, V., Mugnai, A., Sano, P., Biron, D., De Leonibus, L.,Melfi, D., Rosci, P., Vocino, A., Zauli, F., Milani, L., Porcu, F.,Puca, S., Rinollo, A., and Gattari, F.: Precipitation products fromthe Hydrology SAF, Proceedings of the 2012 EUMETSAT Me-teorological Satellite Conference, Sopot, Poland, 3–7 September2012, EUMETSAT P.61, 8 pp., 2012.
Pignone, F., Rebora, N., Silvestro, F., and Castelli, F.: GRISO– Rain, CIMA Research Foundation, Savona, Italy, Opera-tional Agreement 778/2009 DPC-CIMA, Year-1 Activity Report272/2010, 353 pp., 2010 (in Italian).
Puca, S., De Leonibus, L., Zauli, F., Rosci, P., and Biron, D.: Im-provements on numerical “object” detection and nowcasting ofconvective cell with the use of SEVIRI data (IR and WV chan-nels) and neural techniques, The World Weather Research Pro-gramme’s Symposium on Nowcasting and Very Short RangeForecasting, Tolouse, France, 5–9 September 2005.
Puca, S., Baguis, P., Campione, E., Erturk, A., Gabellani, S.,Iwanski, R., Jurasek, M., Kanak, J., Kerenyi, J., Koshinchanov,G., Kozinarova, G., Krahe, P., Łapeta, B., Labo, E., Milani, L.,Okon, L.,Oztopal, A., Pagliara, P., Pignone, F., Porcu, F., Rachi-mow, C., Rebora, N., Rinollo, A., Roulin, E., Sonmez,I., Toni-azzo, A., Vulpiani, G., Biron, D., Casella, D., Cattani, E., Diet-rich, S., Laviola, S., Levizzani, V., Melfi, D., Mugnai, A., Pane-grossi, G., Petracca, M., Sano, P., Zauli, F., Rosci, P., and DeLeonibus, L.: The validation service of the Hydrological SAFgeostationary and polar satellite precipitation products, Nat. Haz-ards Earth Syst. Sci., in press, 2013.
Rinollo, A., Vulpiani, G., Puca, S., Pagliara, P., Kanak, J., Labo,E., Okon, L., Roulin, E., Baguis, P., Cattani, E., Laviola, S., andLevizzani, V.: Definition and impact of a quality index for radar-based reference measurements in the H-SAF precipitation prod-uct validation, Nat. Hazards Earth Syst. Sci., in press, 2013.
Rosenkranz, P.: Rapid radiative transfer model for AMSU/HSBchannels, IEEE Trans. Geosci. Rem. Sens., 41, 362–368, 2003.
Sano, P., Casella, D., Mugnai, A., Schiavon, G., Smith, E. A., andTripoli, G. J.: Transitioning from CRD to CDRD in Bayesianretrieval of rainfall from satellite passive microwave measure-ments, Part 1: Algorithm description and testing, IEEE Trans.Geosci. Remote Sens., in press, 2013.
Smith, E. A., Leung, H. W.-Y., Elsner, J. B., Mehta, A. V., Tripoli,G. J., Casella, D., Dietrich, S., Mugnai, A., Panegrossi, G., andSano, P.: Transitioning from CRD to CDRD in Bayesian retrievalof rainfall from satellite passive microwave measurements: Part3 – Identification of optimal meteorological tags, Nat. HazardsEarth Syst. Sci., 13, 1185–1208, doi:10.5194/nhess-13-1185-2013, 2013.
Nat. Hazards Earth Syst. Sci., 13, 1959–1981, 2013 www.nat-hazards-earth-syst-sci.net/13/1959/2013/

A. Mugnai et al.: Precipitation products from the hydrology SAF 1981
Surussavadee, C. and Staelin, D. H.: Global millimeter-wave pre-cipitation retrievals trained with a cloud-resolving numericalweather prediction model, Part I: Retrieval design. IEEE Trans.Geosci. Remote Sens., 46, 99–108, 2008a.
Surussavadee, C. and Staelin, D. H.: Global millimeter-wave pre-cipitation retrievals trained with a cloud-resolving numericalweather prediction model, Part I: Performance evaluation, IEEETrans. Geosci. Remote Sens., 46, 109–118, 2008b.
Surussavadee, C. and Staelin, D. H.: Satellite retrievals of Arcticand Equatorial rain and snowfall rates using millimeters wave-lengths, IEEE Trans. Geosci. Remote Sens., 47, 3697–3707,2009.
Torricella, F., Levizzani, V., and Turk, F. J.: Application of a blendedMW-IR rainfall algorithm to the Mediterranean, in: MeasuringPrecipitation from Space: EURAINSAT and the Future, editedby: Levizzani, V., Bauer, P., and Turk, F. J., Advances in GlobalChange Research, Volume 28, Springer, Dordrecht, The Nether-lands, 497–508, 2007.
Tripoli, G. J.: A nonhydrostatic model designed to simulate scaleinteraction, Mon. Weather Rev., 120, 1342–1359, 1992.
Tripoli, G. J. and Smith, E. A.: Introducing variable-step topog-raphy (VST) coordinates within dynamically constrained Non-hydrostatic Modeling System (NMS), Part 1: VST formulationwithin NMS host model framework, Dyn. Atmos. Oceans, sub-mitted, 2013a.
Tripoli, G. J. and Smith, E. A.: Introducing variable-step topogra-phy (VST) coordinates within dynamically constrained Nonhy-drostatic Modeling System (NMS), Part 2: VST performance onorthodox obstacle flows, Dyn. Atmos. Oceans, submitted, 2013b.
Turk, F. J. and Miller, S. D.: Toward improving estimates ofremotely-sensed precipitation with MODIS/AMSR-E blendeddata techniques, IEEE Trans. Geosci. Remote Sens., 43, 1059–1069, 2005.
Turk, F. J., Hawkins, J., Smith, E. A., Marzano, F. S., Mugnai,A., and Levizzani, V.: Combining SSM/I, TRMM and infraredgeostationary satellite data in a near-realtime fashion for rapidprecipitation updates: advantages and limitations, Proceedings ofthe 2000 EUMETSAT Meteorological Satellite Data Users’ Con-ference, 452–459, 2000.
Vulpiani, G., Tabary, P., Chatelet, J. P. D., and Marzano, F. S.: Com-parison of advanced radar polarimetric techniques for operationalattenuation correction at C band, J. Atmos. Oceanic Technol., 25,1118–1135, 2008.
Zauli, F., Biron, D., and Melfi, D.: The precipitation products gen-eration chain for the EUMETSAT Hydrological Satellite Appli-cation Facility at C.N.M.C.A., Proceedings of the Joint 2007EUMETSAT Meteorological Satellite Conference and the 15thSatellite Meteorology & Oceanography Conference of the Amer-ican Meteorological Society, Amsterdam, The Netherlands, 24–28 September 2007, EUMETSAT P.50, 2007.
Zauli, F., Biron, D., and Melfi, D.: The precipitation productsgeneration chain for the EUMETSAT Hydrological SatelliteApplication Facility at C.N.M.C.A., Proceedings of the 2009EUMETSAT Meteorological Satellite Conference, Bath, UnitedKingdom, 21–25 September 2009, EUMETSAT P.55, 2009.
www.nat-hazards-earth-syst-sci.net/13/1959/2013/ Nat. Hazards Earth Syst. Sci., 13, 1959–1981, 2013