
Precipitation isotope characteristics and climatic ... · tude regions, where water cycle processes...
16
CLIMATE RESEARCH Clim Res Vol. 49: 29–44, 2011 doi: 10.3354/cr01013 Published online September 22 1. INTRODUCTION The systematic analysis of isotopes in precipitation provides basic data for the use of isotope-specific tools in hydrological and meteorological investiga- tions. The Global Network of Isotopes in Precipita- tion (GNIP) observation project, initiated by the Inter- national Atomic Energy Agency (IAEA) and the World Meteorological Organization (WMO), is the largest endeavor of its type (Rozanski et al. 1993). The climatological isotope patterns obtained from these measurements, recorded on an almost monthly basis, have typically been interpreted in terms of dif- ferent isotope effects (Dansgaard 1964). Instead of being related to isolated physical processes, these effects have generally been found to reflect a com- plex sequence of fractionation during the phase tran- sitions of water from evaporation to precipitation © Inter-Research 2011 · www.int-res.com *Corresponding author. Email: [email protected] Precipitation isotope characteristics and climatic controls at a continental and an island site in Northeast Asia Jianrong Liu 1,2 , Xianfang Song 1, *, Guobin Fu 3 , Xin Liu 1,2 , Yinghua Zhang 1 , Dongmei Han 1 1 Key Laboratory of Water Cycle & Related Land Surface Processes, Institute of Geographic Sciences and Natural Resources Research, Chinese Academy of Sciences, 11A Datun Road, Chaoyang District, Beijing, 100101, PR China 2 Graduate University of Chinese Academy of Sciences, 19A Yu Quan Road, Beijing, 100049, PR China 3 CSIRO Land and Water, Private Bag 5, Wembley, Western Australia 6913, Australia ABSTRACT: In mid-latitude continental and island regions, the isotope composition of air mas- ses often varies according to both their origin and their interaction with topography along their path of travel. Comparison of stable isotopes in continental and island precipitation events can reveal climatic controls upon isotopic content and yield information about patterns of atmo- spheric circulation. The overall deuterium (D) and oxygen-18 ( 18 O) characteristics of 64 precipi- tation events observed in continental Beijing, China, and 109 precipitation events observed at Seongsan (Jeju Island, Republic of Korea) were investigated. The established local meteoric water lines, δD = 7.49δ 18 O + 1.53 (R 2 = 0.96, n = 64) and δD = 8.36δ 18 O + 19.05 (R 2 = 0.86, n = 109), indicated periodic drought in Beijing and a kinetic effect in the condensation process in Seongsan. To trace moisture origins and transport paths for all precipitation events, the 96 h backward trajectories of air masses arriving at 3000 m above ground level were calculated and categorized using the Hybrid Single Particle Lagrangian Integrated Trajectory (HYSPLIT) model. The results indicate that during the Asian monsoon period, the air mass categories repre- sented at Seongsan were principally from the southeast, southwest, and continental vicinity (CV). Those observed for Beijing were more varied (northwest, west, north, marine vicinity, south, and CV). Additionally, the meteorological controlling factors of each air mass category were identified using non-linear stepwise regression. The precipitation amount was the main predictor for 18 O in precipitation in Seongsan, while the controlling factors involved in Beijing were more complicated. KEY WORDS: δ 18 O · δD · Event precipitation · Meteorological conditions · Backward trajectory · HYSPLIT Resale or republication not permitted without written consent of the publisher
Transcript of Precipitation isotope characteristics and climatic ... · tude regions, where water cycle processes...

CLIMATE RESEARCHClim Res
Vol. 49: 29–44, 2011doi: 10.3354/cr01013
Published online September 22
1. INTRODUCTION
The systematic analysis of isotopes in precipitationprovides basic data for the use of isotope-specifictools in hydrological and meteorological investiga-tions. The Global Network of Isotopes in Precipita-tion (GNIP) observation project, initiated by the Inter-national Atomic Energy Agency (IAEA) and theWorld Meteorological Organization (WMO), is the
largest endeavor of its type (Rozanski et al. 1993).The climatological isotope patterns obtained fromthese measurements, recorded on an almost monthlybasis, have typically been interpreted in terms of dif-ferent isotope effects (Dansgaard 1964). Instead ofbeing related to isolated physical processes, theseeffects have generally been found to reflect a com-plex sequence of fractionation during the phase tran-sitions of water from evaporation to precipitation
© Inter-Research 2011 · www.int-res.com*Corresponding author. Email: [email protected]
Precipitation isotope characteristics and climaticcontrols at a continental and an island site in
Northeast Asia
Jianrong Liu1,2, Xianfang Song1,*, Guobin Fu3, Xin Liu1,2, Yinghua Zhang1, Dongmei Han1
1Key Laboratory of Water Cycle & Related Land Surface Processes, Institute of Geographic Sciences and Natural Resources Research, Chinese Academy of Sciences, 11A Datun Road, Chaoyang District, Beijing, 100101, PR China
2Graduate University of Chinese Academy of Sciences, 19A Yu Quan Road, Beijing, 100049, PR China3CSIRO Land and Water, Private Bag 5, Wembley, Western Australia 6913, Australia
ABSTRACT: In mid-latitude continental and island regions, the isotope composition of air mas-ses often varies according to both their origin and their interaction with topography along theirpath of travel. Comparison of stable isotopes in continental and island precipitation events canreveal climatic controls upon isotopic content and yield information about patterns of atmo -spheric circulation. The overall deuterium (D) and oxygen-18 (18O) characteristics of 64 precipi-tation events observed in continental Beijing, China, and 109 precipitation events observed atSeongsan (Jeju Island, Republic of Korea) were investigated. The established local meteoricwater lines, δD = 7.49δ18O + 1.53 (R2 = 0.96, n = 64) and δD = 8.36δ18O + 19.05 (R2 = 0.86, n = 109),indicated periodic drought in Beijing and a kinetic effect in the condensation process inSeongsan. To trace moisture origins and transport paths for all precipitation events, the 96 hbackward trajectories of air masses arriving at 3000 m above ground level were calculated andcategorized using the Hybrid Single Particle Lagrangian Integrated Trajectory (HYSPLIT)model. The results indicate that during the Asian monsoon period, the air mass categories repre-sented at Seongsan were principally from the southeast, southwest, and continental vicinity(CV). Those observed for Beijing were more varied (northwest, west, north, marine vicinity,south, and CV). Additionally, the meteorological controlling factors of each air mass categorywere identified using non-linear stepwise regression. The precipitation amount was the mainpredictor for 18O in precipitation in Seongsan, while the controlling factors involved in Beijingwere more complicated.
KEY WORDS: δ18O · δD · Event precipitation · Meteorological conditions · Backward trajectory ·HYSPLIT
Resale or republication not permitted without written consent of the publisher
Clim Res 49: 29–44, 2011
(Pfahl & Wernli 2008). However, variations in the sta-ble isotopes of event-based precipitation generallyoffer more information concerning potential synopticcontrols upon isotopic content, and thus yield infor-mation about the circulation and structure of theatmosphere (Barras & Simmonds 2008). These dataare particularly significant for the study of mid-lati-tude regions, where water cycle processes are morecomplex (Gedzelman & Lawrence 1982, Lawrence etal. 1982). Furthermore, better explanations of fluctua-tions in isotope ratios could result from an analysisthat includes both the isotopic variations associatedwith changes in water vapor origins and the meteoro-logical conditions attendant to particular transportpaths (e.g. temperature, precipitation amount, andprocesses involving evaporation of rain drops fallinginto the dry atmosphere beneath the cloud base).
The Hybrid Single Particle Lagrangian IntegratedTrajectory (HYSPLIT) model developed by theNational Oceanic and Atmospheric Administration(NOAA) Air Resources Laboratory (Draxler & Rolph2003, Rolph 2010) is designed for regional scale tra-jectory analysis, such as that pertaining to theregional transport of aerosols (e.g. Lee et al. 2004)and water vapor. Strong et al. (2007) analyzed themoisture transport paths in the southwestern USA byusing a high temporal resolution of deuterium (D)records and the HYSPLIT model. Trajectory analysesprovided consistent evidence that the large temporaland vertical variations in D concentrations were dueprimarily to advection of water from different sourceregions. Pfahl & Wernli (2008) correlated data con-cerning stable isotope composition in eastern Medi -terranean precipitation with the pertinent 10 d back-ward trajectories to establish the meteorologicalconditions in the evaporation regions. Barras & Sim-monds (2008) investigated an event-based record ofoxygen-18 (18O) in precipitation at Margate in Tasma-nia, Australia, by using 3D Lagrangian trajectoriesand composites of ERA40 850 hPa geopotentialheight for the years 1994–2002. They found thatmoisture entrainment occurred during the 48 h pe -riod prior to arrival for all precipitating air masses.
The comparison of stable isotope characteristicscontained in precipitation events at continental (Bei-jing, China) and island (Seongsan, Republic ofKorea) sites is interesting, as both of these 2 siteshave mid-latitude environments, and their air mas -ses interact with complicated topography through-out their path from source region to site of precipita-tion. Such a comparison provides information aboutclimatic controls under the influence of the Asianmonsoon. The present study thus identified moisture
origins and transport paths for precipitation eventsby using the HYSPLIT model. Dominant meteoro-logical controls for different air mass categorieswere also investigated, using the stepwise regres-sion method.
2. OBSERVATION SITES
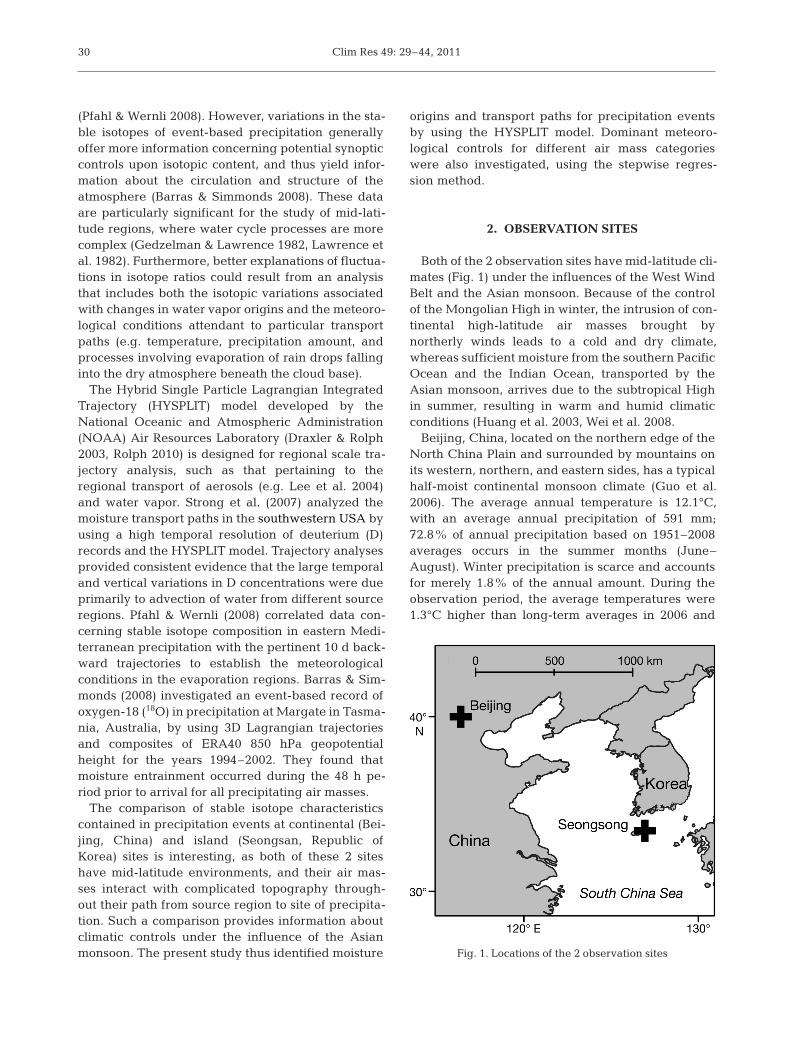
Both of the 2 observation sites have mid-latitude cli-mates (Fig. 1) under the influences of the West WindBelt and the Asian monsoon. Because of the controlof the Mongolian High in winter, the intrusion of con-tinental high-latitude air masses brought bynortherly winds leads to a cold and dry climate,whereas sufficient moisture from the southern PacificOcean and the Indian Ocean, transported by theAsian monsoon, arrives due to the subtropical Highin summer, resulting in warm and humid climaticconditions (Huang et al. 2003, Wei et al. 2008.
Beijing, China, located on the northern edge of theNorth China Plain and surrounded by mountains onits western, northern, and eastern sides, has a typicalhalf-moist continental monsoon climate (Guo et al.2006). The average annual temperature is 12.1°C,with an average annual precipitation of 591 mm;72.8% of annual precipitation based on 1951–2008averages occurs in the summer months (June–August). Winter precipitation is scarce and accountsfor merely 1.8% of the annual amount. During theobservation period, the average temperatures were1.3°C higher than long-term averages in 2006 and
30
Fig. 1. Locations of the 2 observation sites

Liu et al.: Precipitation isotope characteristics 31
2008, and 1.9°C higher than in 2007 (Fig. 2a). Precip-itation levels were 46.2% and 18.1% below normalfor 2006 and 2007 and 6% above normal for 2008(Fig. 2b).
Seongsan (Jeju Island, Republic of Korea) islocated about 100 km SW of the Korean Peninsula,between 33° 12’ and 33° 34’ N, and is bordered by theYellow Sea on the west, the Korean Strait on thenortheast, and the East China Sea on the south. Itexperiences large swings in mean monthly tempera-ture (>20°C) and precipitation (>150 mm; Kwon1985). The monthly temperature averages were nearthe 70 yr average during the observation period. Theprecipitation in the first summer of the observationperiod was 61% heavier than normal and 12% lowerthan normal in the second summer. Precipitation inthe first winter was 32% below normal and near nor-mal in the second winter (Lee et al. 2003).
3. DATA AND METHODS
3.1. Stable isotope data
We used 2 datasets of D and 18O:(1) Precipitation samples collected at the Institute
of Geographic Sciences and Natural ResourcesResearch (IGSNRR) of the Chinese Academy of Sci-
ences (CAS), Beijing, China. From 12 January 2006to 10 September 2008, 64 precipi tation events weresampled using a collector on the roof of theIGSNRR’s main building (116.3853° E, 40.0031° N,45 m asl, ~10 m above ground level, agl). The rain-fall collector consisted of a polyethylene bottle witha funnel. A ping pong ball covered in the mouth ofthe funnel to prevent evaporation. Snow sampleswere collected using a pail installed on the roof.After each snowfall event, snow samples weremelted at room temperature (Liu et al. 2010a). Thestart and end times of each event were calculatedautomatically by a nearby rain gauge. Most of theprecipitation events during the observation periodlasted for a few hours, and those spanning multipledays were not considered in the present study. Sam-ples were transferred into 50 ml polyethylene bot-tles and analyzed with respect to D and 18O usingthe Finnigan MAT253 mass spectrometer and theTemperature Conversion Elemental Analyzer (TC/EA)method at the Environmental Isotope Laboratory ofIGSNRR. Measurement accuracies were consistently±1‰ for D and ±0.3‰ for 18O. Most of the sampleswere collected during the summer months (June– August).
(2) Precipitation samples ob tained from Seong san(Je ju Island, Republic of Korea, 126.933° E, 33.4656° N,25 m asl), which is a GNIP station where event precipi-
Fig. 2. (a) Monthly average temperatures, and (b) total monthly precipitation amount for the observation period 2006–2008, compared to the long-term average (1951–2008) at Beijing
Clim Res 49: 29–44, 2011
tation samples have been collected from 25 May 1995to 2 May 1997 (data were taken from http:// isohis.iaea. org).
D and 18O are expressed as
δ(‰) = (Rsample – Rstandard)/ Rstandard × 1000
where R refers to the D/H or 18O/16O ratio, and thestandard refers to the Vienna Standard Mean OceanWater. The weighted δ values (δ18Op) were calculatedby averages of event precipitation amount.
3.2. Meteorological data
Data concerning daily meteorological variables,including surface air temperature (minimum temper-ature, Tmin; maximum temperature, Tmax; and meantemperature, T), precipitation amount (P), relativehumidity (RH), wind speed (WS), sunshine duration(SD), and vapor pressure (Vp), for the Beijing sitewere provided by the China Meteorological DataSharing Service System. Similar meteorological vari-ables for Seongsan were obtained through theNOAA Satellite and Information Service, including T,P, WS, Vp, and dew point temperature (DT).
3.3. HYSPLIT model
Backward trajectories were calculated by using theHYSPLIT model (Rolph 2010) for 96 h duration with3000 m agl ending level to illustrate the moisture his-tory of the air masses associated with each event.Meteorological input for the trajectory model was theREANALYSIS dataset (global, 1948–present), re -processed from NOAA’s NCEP Final Analysis databy the Air Resources Laboratory (Kalnay et al. 1996).The data pertained to the 2.5° × 2.5° latitude– longitude global grid, 144 × 73 points from 90° N to90° S, 0 to 357.5° E and involved an output every 6 h(00:00, 06:00, 12:00, 18:00 UTC).
For each precipitation event, trajectories werecalculated at 3 levels, 1500 m (~850 hPa), 3000 m(~750 hPa), and 5500 m (~500 hPa), to determinethe most representative origin height. The resultsshowed that most of the trajectories were similarwith respect to the origin and transport path ateach of the 3 levels (figures not shown). As precipi-tation usually occurred at a height of no more than3000 m, the 3000 m level was selected here. Fur-thermore, air mass trajectories at multiple timeintervals (24, 48, 72, 96, and 120 h) were also calcu-lated for each event. The results indicate that all
trajectories were similar in origin and transportdirection, varying only with respect to the length ofthe paths involved.
4. RESULTS AND DISCUSSION
4.1. Characteristics of δ18O in precipitation events
4.1.1. Temporal variations in δ18O
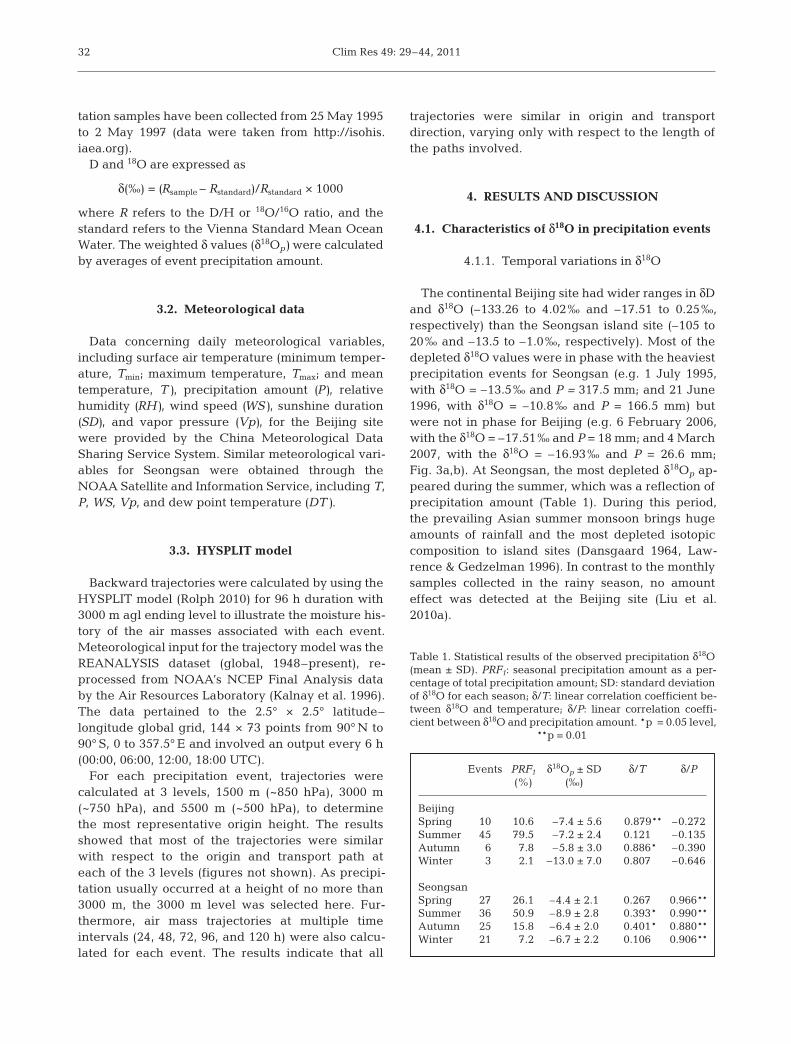
The continental Beijing site had wider ranges in δDand δ18O (–133.26 to 4.02‰ and –17.51 to 0.25‰,respectively) than the Seongsan island site (–105 to20‰ and –13.5 to –1.0‰, respectively). Most of thedepleted δ18O values were in phase with the heaviestprecipitation events for Seongsan (e.g. 1 July 1995,with δ18O = –13.5‰ and P = 317.5 mm; and 21 June1996, with δ18O = –10.8‰ and P = 166.5 mm) butwere not in phase for Beijing (e.g. 6 February 2006,with the δ18O = –17.51‰ and P = 18 mm; and 4 March2007, with the δ18O = –16.93‰ and P = 26.6 mm;Fig. 3a,b). At Seongsan, the most depleted δ18Op ap -peared during the summer, which was a reflection ofprecipitation amount (Table 1). During this period,the prevailing Asian summer monsoon brings hugeamounts of rainfall and the most depleted isotopiccomposition to island sites (Dansgaard 1964, Law -rence & Gedzelman 1996). In contrast to the monthlysamples collected in the rainy season, no amounteffect was detected at the Beijing site (Liu et al.2010a).
32
Events PRF1 δ18Op ± SD δ/T δ/P (%) (‰)
BeijingSpring 10 10.6 –7.4 ± 5.6 0.879** –0.272Summer 45 79.5 –7.2 ± 2.4 0.121 –0.135Autumn 6 7.8 –5.8 ± 3.0 0.886* –0.390Winter 3 2.1 –13.0 ± 7.0 0.807 –0.646
SeongsanSpring 27 26.1 –4.4 ± 2.1 0.267 0.966**Summer 36 50.9 –8.9 ± 2.8 0.393* 0.990**Autumn 25 15.8 –6.4 ± 2.0 0.401* 0.880**Winter 21 7.2 –6.7 ± 2.2 0.106 0.906**
Table 1. Statistical results of the observed precipitation δ18O(mean ± SD). PRF1: seasonal precipitation amount as a per-centage of total precipitation amount; SD: standard deviationof δ18O for each season; δ/T: linear correlation coefficient be-tween δ18O and temperature; δ/P: linear correla tion coeffi-cient between δ18O and precipitation amount. *p = 0.05 level,
**p = 0.01

Liu et al.: Precipitation isotope characteristics 33
Fig. 3. Temporal variations of precipitation δ18O for (a) Beijing and (b) Seongsan; and deuterium excess (d) in 4 seasons for (c)Beijing and (d) Seongsan. The horizontal line in (c) and (d) marks a value of 10‰, the global average value of d in precipitation

Clim Res 49: 29–44, 2011
4.1.2. Local meteoric water lines
Based on 400 water samples collected globallyfrom rivers, lakes, and precipitation, the nature of theisotopic relationship in meteoric waters (global mete-oric water line, GMWL) was established as δD =8 δ18O + 10 (Craig 1961). Significant deviations fromthis line are observed in cases where the atmo sphericcirculation regime of a given area varies seasonally(e.g. Harvey & Welker 2000, Vre<a et al. 2006, Grassaet al. 2006, Liu et al. 2009, 2010b). In light of the sta-ble isotopic composition in all of the precipitationevents, the local meteoric water lines (LMWLs) forBeijing and Seongsan were established as δD =7.49δ18O + 1.53 (R2 = 0.96, n = 64) and δD = 8.36δ18O+ 19.05 (R2 = 0.86, n = 109), respectively. The δD–δ18Ovalues for Beijing were generally located below the
GMWL (Fig. 4a), which indicates that the vapor com-position deviated from the equilibrium composition(Dansgaard 1964), while a slope >8 for Seongsan sug-gests a kinetic effect in the condensation (Fig. 4b).
For Beijing, the summer δ values varied little, whileδ values for other seasons scattered to the upper orlower ranges of the LMWL. The 2 most depleted δvalues occurred during the winter and early springand reflected the high-latitude air mass (discussedbelow). Most of the enriched δ values representedspring precipitation. The winter months were ratherdry for Beijing, with only around 10 mm of precipita-tion during the whole season. Although with thearrival of spring came an increase in precipitation,the atmosphere beneath the cloud base remained dryand far from saturated. Consequently, the evapora-tion of rain droplets during their fall resulted in the
34
Fig. 4. Local meteoric water lines (solid lines) for (a, c) Beijing and (b, d) Seongsan. The global meteoric water line (dashedline) is given for reference. In (a) and (b), different symbols denote δ18O values for different seasons, while in (c) and (d),
different symbols denote δ18O values for different air mass categories. Air mass categories as in Table 2

Liu et al.: Precipitation isotope characteristics 35
enrichment of the δ values in the residual rainwater.This evaporation effect gradually weakened as therainy season progressed, with the δ values growingmore depleted as rainfall increased (Liu et al. 2010b).
For Seongsan, points representing the winter andsummer precipitation generally fell above and belowthe relevant LMWL, respectively (Fig. 4b). Datapoints for the transitional periods of spring andautumn distributed closely along the LMWL (Lee etal. 2003). In the winter, the cold air over the continentand the warm air over the South China Sea cause apressure gradient, producing dry northeasterlywinds that flow over southern Asia. This pressuregradient is reversed during the summer (Johnson &Ingram 2004). Therefore, the distribution patterns forδ values corresponding to different seasons indicatedopposite water vapor origins and circulation condi-tions.
4.1.3. Deuterium excess
The deuterium excess (d, in ‰), derived from d =δD – 8 δ18O (Dansgaard 1964), is a measure of the de -viation of a given data point from the GMWL. Glob-ally, the average value of d in precipitation is 10‰(Craig 1961). Most of the data points for Beijing andSeongsan fell below or above the GMWL (Fig. 4a,b).For Seong san, variations in d according to the differ-ent seasons generally followed a ‘V’ pattern, withhigher values for d during cold periods and lower val-ues during hot periods (Fig. 3d). In temperate cli-mates, seasonal fluctuations of d are often observed,which is attributed to varying conditions in thesource areas of the vapor (Araguás-Araguás et al.2000). Higher d values for both Beijing and Seongsan
winter precipitation reflected kinetic fractionationunder conditions involving low relative humidity. AtBeijing, the relatively lower d values for spring pre-cipitation are attributed mainly to evaporation occur-ring during the fall of rain droplets (Barras & Sim-monds 2009). The d values for Seongsan springprecipitation were much higher than those for Bei-jing. Although there were some reduced d values forevents involving small amounts of precipitation, theeffect of the evaporation of rain droplets was notstrong. This finding is likely because the atmospherebeneath the cloud base is more humid, as the amountof spring precipitation is 4 times larger at Seongsan(P = 281.6 mm) than at Beijing (P = 66.6 mm). Duringthe summer, a d value around 10‰ for Seongsan indi-cated its hot and humid intertropical oceanic mois-ture origin, with temperatures around 25°C, moder-ate wind velocities, and relative humidity near 80%(Merlivat & Jouzel 1979). The d values for Beijingduring the summer were generally below 10‰ andexhibited a larger range (Fig. 3c). Rain droplet evap-oration was also notable in the light rainfall eventsthat occurring during the summer (e.g. 24 June 2006with d = –4.36‰, δ18O = –3.78‰, and P = 6.2 mm; and5 July 2008 with d = 1.16‰, δ18O = –5.12‰, and P =1.4 mm).
4.2. Backward trajectory estimates
The physical interpretation of the isotopic varia-tions is complicated, as a single δ value reflects theintegrated phase transition history of the respectivewater (Jacob & Sonntag 1991). The determination oftransport histories from meteorological conditions orthrough the calculation of trajectories improves inter-
Air mass Events δ18Op (‰) PRF2 (%) T (°C) RH (%) WS (m s–1) SD (h) DT (°C) Beijing NW Northwest 6 –9.20 ± 4.7 5.9 21.9 69 2.4 5.4 – W West 15 –5.99 ± 4.8 15.9 18.8 73 2.2 3.4 – NNW North-northwest 9 –8.18 ± 3.1 14.6 25.3 74 2.0 3.9 – S South 6 –7.23 ± 3.0 12.8 23.1 82 2.1 0.5 – MV Marine vicinity 5 –6.94 ± 2.2 17.6 18.0 82 2.1 0.8 – CV Continental vicinity 23 –7.28 ± 2.4 33.2 22.8 76 2.2 2.2 –
Seongsan NW Northwest 21 –6.7 ± 2.6 12.2 – 5.4 11.5 – 10.4 W West 29 –5.4 ± 2.2 26.3 – 12.4 6.4 – 15.9 N North-northwest 11 –10.3 ± 3.1 15.5 – 8.9 7.6 – 13.7 CV Continental vicinity 12 –7.3 ± 2.1 10.6 – 17.3 6.6 – 20.7 SW Southwest 22 –6.9 ± 2.9 15.8 – 16.3 5.2 – 20.2 SE Southeast 14 –7.4 ± 2.6 19.6 – 19.3 5.6 – 22.9
Table 2. Meteorological conditions and δ18O (mean ± SD) for different air mass categories. T: temperature, RH: relative humidity,WS: wind speed, SD: sunshine duration), DT: dew point temperature. PRF2: air mass precipitation as a percentage of total
precipitation amount
Clim Res 49: 29–44, 2011
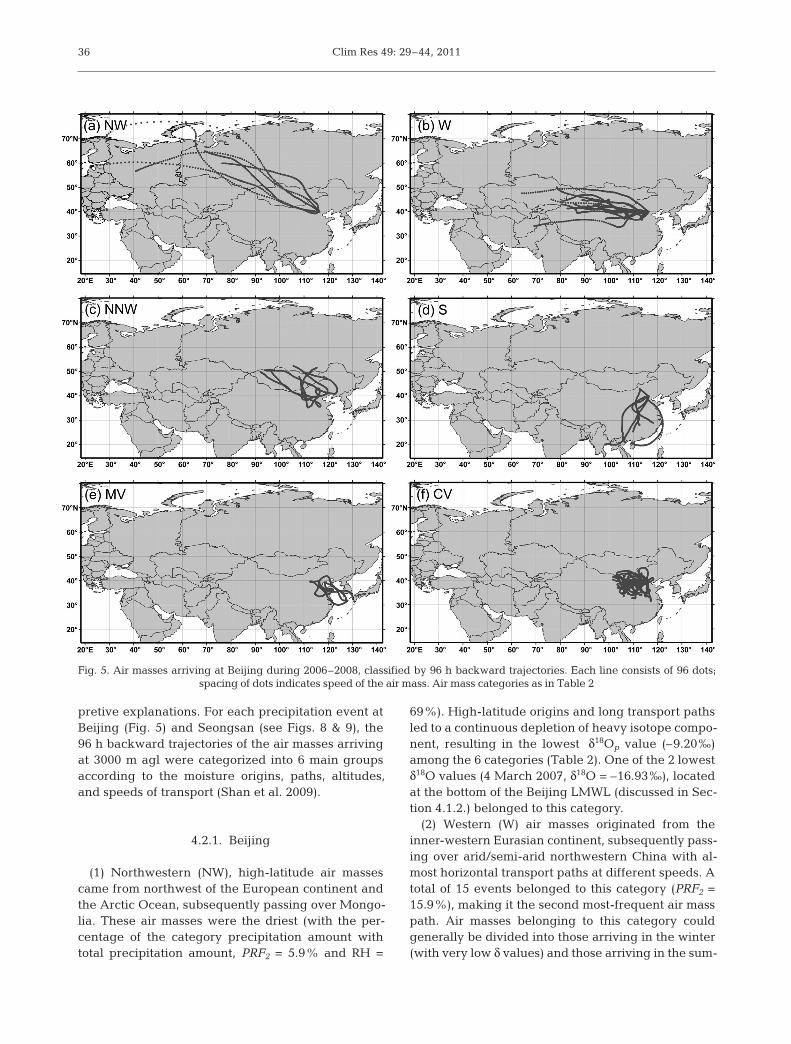
pretive explanations. For each precipitation event atBeijing (Fig. 5) and Seongsan (see Figs. 8 & 9), the96 h backward trajectories of the air masses arrivingat 3000 m agl were categorized into 6 main groupsaccording to the moisture origins, paths, altitudes,and speeds of transport (Shan et al. 2009).
4.2.1. Beijing
(1) Northwestern (NW), high-latitude air massescame from northwest of the European continent andthe Arctic Ocean, subsequently passing over Mongo-lia. These air masses were the driest (with the per-centage of the category precipitation amount withtotal precipitation amount, PRF2 = 5.9% and RH =
69%). High-latitude origins and long transport pathsled to a continuous depletion of heavy isotope compo-nent, resulting in the lowest δ18Op value (–9.20‰)among the 6 categories (Table 2). One of the 2 lowestδ18O values (4 March 2007, δ18O = –16.93‰), locatedat the bottom of the Beijing LMWL (discussed in Sec-tion 4.1.2.) belonged to this category.
(2) Western (W) air masses originated from the inner-western Eurasian continent, subsequently pass-ing over arid/semi-arid northwestern China with al-most horizontal transport paths at different speeds. Atotal of 15 events belonged to this category (PRF2 =15.9%), making it the second most-frequent air masspath. Air masses belonging to this category couldgenerally be divided into those arriving in the winter(with very low δ values) and those arriving in the sum-
36
Fig. 5. Air masses arriving at Beijing during 2006–2008, classified by 96 h backward trajectories. Each line consists of 96 dots; spacing of dots indicates speed of the air mass. Air mass categories as in Table 2

Liu et al.: Precipitation isotope characteristics
mer (with high δ values). Each of the 3 snow eventsduring the observation period belonged to this cate-gory (see the top trajectory for 6 February 2006, thebottom trajectory for 12 January 2006, and an upperone for 31 December 2006; Fig. 5b). Under the controlof the Mongolia High in the winter (Fig. 6b), thenorth-westerly winds brought dry, high-latitude con-tinental air masses. The low air temperature (~250 to –260K, or –23.2 to ~ –13.2°C, Fig. 6c) and thick snowcover (~20 mm, Fig. 6d) meant that there was little en-ergy available for evaporation or sublimation of snow(Lee et al. 2003). As such, few air masses were picked
up along the transport path and the specific humidityremained stable (1 to 2 g kg–1, Fig. 6f). After a longtransport, the δ values tended to be rather depletedupon arrival at the precipitation area (e.g. δ18O =–17.51‰ for the snow event of 6 February 2006; lo-cated at the bottom of the LMWL). Except for the 3snow events, all precipitation events associated withthis category appeared from May to August and fea-tured relatively high δ18O concentrations. Eva po ra -tion and isotopic exchange of the air masses with therelatively hot and dry ambient atmosphere may occuralong the trajectory, which leads to the enrichment of
37
Fig. 6. Meteorological conditions for 6 February 2006: (a) air mass backward trajectory for 96 h, (b) sea level pressure (Pa),(c) surface temperature (K), (d) water equivalent of accumulated snow depth (kg m–2), (e) relative humidity (%), and (f) specific
humidity (kg kg–1)

Clim Res 49: 29–44, 201138
δ values of the residual water and the final rainfall. Arather enriched δ18O is particularly characteristic ofthe summer precipitation in arid/ semi-arid northwest-ern China (Liu et al. 2009).
(3) North-northwestern (NNW) continental airmasses originated from the north, the northwest, orfrom central Mongolia. The temperatures for this cat-egory were the highest, given that all of the 7 precip-itation events belonging to this category occurredfrom June to September. Typical meteorological con-ditions for this type involved low wind speeds and
extended periods of sunshine. All of the NW, W, andNNW categories had high- or mid-latitude continen-tal origins. They shared some similar meteorologicalcharacteristics, such as low amounts of precipitation,low relative humidity, and long periods of sunshine.
(4) Southern (S) air masses came from the south,mainly passing over the inland area of southernChina. Rainfall events for this category occurredmostly in July. When the summer came, the Mongo-lia High, centered over the Asian continent, gaveway to an area of low pressure (Fig. 7b). The high
Fig. 7. Backward trajectory of air mass and the meteorological conditions for 31 July 2008: (a) air mass backward trajectory for96 h, (b) sea level pressure (Pa), (c) surface temperature (K), (d) precipitable water content (kg m–2), (e) relative humidity (%),
and (f) specific humidity (kg kg–1)

Liu et al.: Precipitation isotope characteristics
pressures located over the ocean forced warm andhumid moisture to the continent (Fig. 7d). For therainfall event on 31 July 2008 (Fig. 7a), a continuousrainout process and some evaporated water likelypicked up along the trajectory (the specific humiditydecreased from ~9 to 7 g kg–1, Fig. 7f) resulted in thedepletion of heavy isotope (δ18O = –7.99‰).
(5) Marine vicinity (MV) air masses had no definedpaths, being located at mid-latitudes and movingslowly in short paths or looping trajectories over themarine vicinity. Only 5 events were attributed to thisgroup, and the PRF2 was 17.6%. While the MV and Scategories shared nearly identical meteorological con-ditions, such as little sunshine, moderate wind speeds,and comparatively high relative humidity (Table 2),there was still a slightly lower value in δ18Op for S(–7.23‰) than for MV (–6.94‰), a fact that may be attributed to the longer transport paths taken by theS-type masses along the continental regions.
(6) Continental vicinity (CV) air masses were simi-lar to MV but had trajectories that looped over thecontinental vicinity. It was the most frequent type ofpath, i.e. it was the type most frequently associatedwith the summer rainfall in Beijing. Of the 23 eventsbelonging to this category, the majority occurred dur-ing July and August, with June, September, and Mayfeaturing many of the others. Meteorological condi-tions for this category typically involved moderatetemperature, relative humidity, wind speed, and sun-shine duration (Table 2). The δ18Op was –7.28‰,which falls be ween the values for air masses withcontinental and marine origins. Air masses couldoriginate either from marine locations 96 h before orfrom high-latitudinal, inner-continental regions. Thetrajectory for 18 September 2007 represented mois-ture originating in the Pacific Ocean, which wastransported by the No. 0712 severe typhoon and No.0713 super typhoon, which occurred from 11 to 18September 2007 and 15 to 20 September 2007,respectively.
4.2.2. Seongsan
Typical meteorological conditions for precipitationevents with air masses originating from the NW, N,and SW have been detailed by Lee et al. (2003).Below, the primary focus will be on categorizing theair masses for precipitation events at Seongsan.
(1) NW high-latitude moisture came from north-west of the European continent and from the Mediter-ranean. The 21 events accounted for 12.2% of thetotal precipitation, as most of this precipitation oc -
curred during the late autumn, winter, and earlyspring, when the conditions were relatively dry.Though featuring the longest paths and the lowesttemperature, the δ18Op (–6.7‰) associated with thistype was not low, probably because only 2 precipita-tion events belonging to this category fell in the sum-mer months, when the Asian monsoon was responsi-ble for the heaviest rainfall and the most depletedδ18O values (Bhattacharya et al. 2003, Aggarwal et al.2004, Vuille et al. 2005, Liu et al. 2010a). Typically,the relatively high d values for NW air masses indi-cated relatively low humidity during the moisture for-mation (Lee et al. 2003).
(2) W air masses bore similarities to those associ-ated with Beijing but featured even longer paths.This type was most frequently responsible for precip-itation, with 29 events altogether. Most of the precip-itation events happened in the spring, followed bythe autumn, summer, and winter. The spring W-typeevents accounted for 57.9% of the total category rain-fall (PRF2 = 26.3%). The value of δ18Op (–5.4‰) washighest in relation to this type, possibly due to theevaporation of the raindrops during their fall to theground or the fact that no precipitation events asso -ciated with this category occurred in July, which usually featured the lowest δ values.
(3) N continental air masses originated mainly inSiberia. Although there were only 11 events associ-ated with this category, it was responsible for precip-itation in all 4 seasons. Typical meteorological condi-tions for this category included moderate windvelocity and relatively low temperature. Taking allevents into account, this type seemed to feature themost depleted δ18Op (–10.3‰). In reality, however, 2of the heaviest rainfall events, occurring on 21 June1996 (δ18O = –10.8‰, P = 166.5 mm) and 1 July 1995(δ18O = –11.2‰, P = 317.5 mm) represented thelargest contributions. If the impact of these eventswere ignored, the value for δ18Op would be –6.5‰,which is close to the values associated with the NWand W categories.
(4) CV air masses featured the shortest paths andthe lowest PRF2 (10.6%). The precipitation linked tothis category occurred mostly in the summer. Nospring precipitation was associated with this cate-gory. In a situation similar to that noted above for theNNW type, 1 event in this category, occurring on 22July 1995 (δ18O = –8.4‰, P = 151.5 mm), was respon-sible for a reduced δ18Op. If this event were ignored,the δ18Op for the category would be –6.6‰.
(5) SW air masses originated from low-latituderegions of southwest China and the adjacent SouthChina Sea. The δ18Op (–6.9‰) value for this type is
39
Clim Res 49: 29–44, 2011
low because most of the events occurred in July andAugust, when the Asian monsoon was responsiblefor rainfall characterized by depleted δ18O.
(6) SE air masses had southeast marine origins. Themean temperature of this category was the highest ofany category, but δ18Op was the most depleted(–7.4‰). About 81% of all precipitation events asso-ciated with this category occurred in the summer,and none in winter. The low d values for this categoryreflected the characteristics of the hot and humidNorth Pacific (Lee et al. 2003).
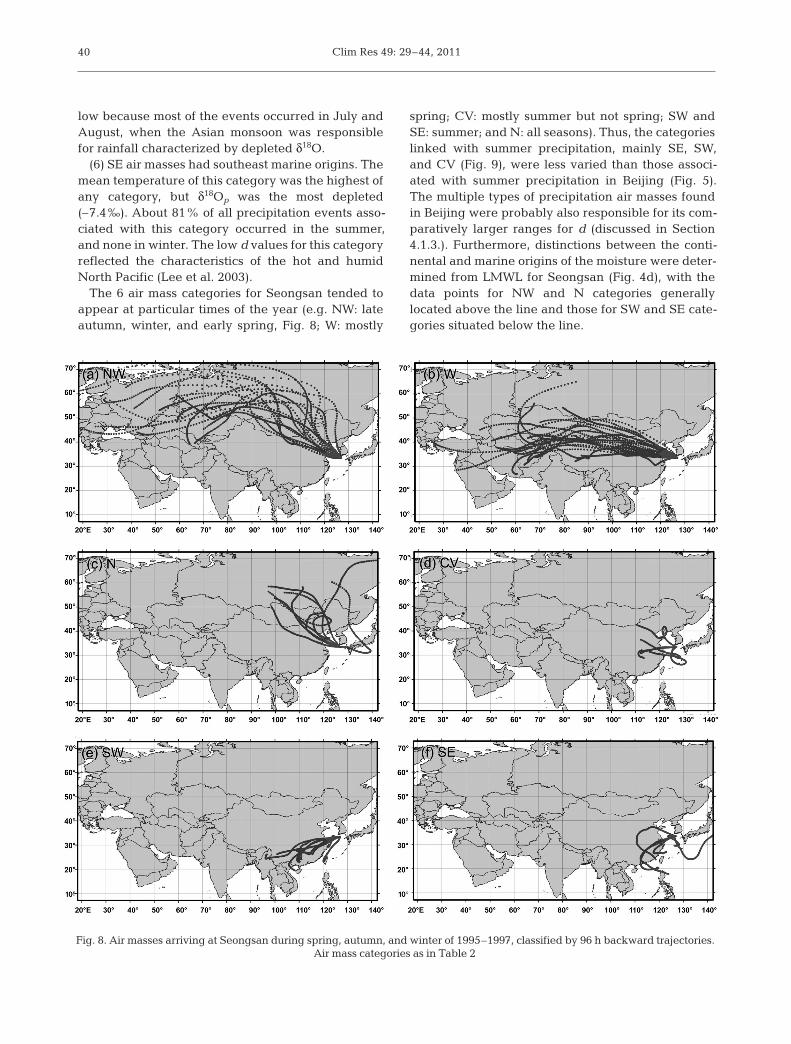
The 6 air mass categories for Seong san tended toappear at particular times of the year (e.g. NW: lateautumn, winter, and early spring, Fig. 8; W: mostly
spring; CV: mostly summer but not spring; SW andSE: summer; and N: all seasons). Thus, the categorieslinked with summer precipitation, mainly SE, SW,and CV (Fig. 9), were less varied than those associ-ated with summer precipitation in Beijing (Fig. 5).The multiple types of precipitation air masses foundin Beijing were probably also responsible for its com-paratively larger ranges for d (discussed in Section4.1.3.). Furthermore, distinctions between the conti-nental and marine origins of the moisture were deter-mined from LMWL for Seongsan (Fig. 4d), with thedata points for NW and N categories generallylocated above the line and those for SW and SE cate-gories situated below the line.
40
Fig. 8. Air masses arriving at Seongsan during spring, autumn, and winter of 1995–1997, classified by 96 h backward trajectories. Air mass categories as in Table 2

Liu et al.: Precipitation isotope characteristics
4.3. Climatic controls on δ18O
The investigation of isotopic information containedin archives such as ice cores (Bradley et al. 2003),lake sediments (Junge & Böttger 1994), tree rings(Managave et al. 2010), and speleothems (McDer-mott 2004), is one method for the quantitative recon-struction of paleoclimate. It is first necessary to deter-mine how the isotopes associated with modernprecipitation relate to the current climate conditions(Jacob & Sonntag 1991) because the isotopic compo-sition contained in precipitation generally reflectssynthetic synoptic conditions before being recorded.Regression equations based on the presently ob -
served spatial relation between the mean annualtemperature and the isotope ratio in precipitation inhigh latitudes have been used to derive a history ofthe temperature changes experienced at the site of agiven ice core (Dansgaard et al. 1982, Jouzel et al.1987). Such applications, however, usually encounterproblems at middle and low latitudes, especially inthe Asian monsoon regions, because both the temper-ature and precipitation are highest in the summer,and the temperature effect and the amount effect par-tially cancel each other out (Johnson & Ingram 2004).In the present study, simple linear correlations be -tween δ/T and δ/P were not high at either site duringany point of the observation period (Table 1). In addi-
41
Fig. 9. Air masses arriving at Seongsan in summer of 1995–1997, classified by 96 h backward trajectories. Air mass categories as in Table 2

Clim Res 49: 29–44, 2011
tion to the reason noted above, the meteorologicalconditions associated with different air mass trajecto-ries may also be responsible.
To detect the main meteorological controls pertain-ing to different air masses, regularly observed sur-face meteorological variables associated with precip-itation sampling sites were analyzed with themultiple stepwise regression method. Multiple re -gressions allow for the simultaneous calculation ofseveral physical parameters (Liu et al. 2010b). Poten-tial partial correlations showed that sometimes a qua-dratic or logarithmic solution was in closer agree-ment with the δ18O. Therefore, non-linear stepwiseregression was adopted. For Beijing, the daily mini-mum temperature and precipitation amount morefrequently factored into the equation (Table 3). Thisfinding was likely because most of the precipitationsamples had been collected in the summer, when thetemperature and precipitation amounts could beequally important for the δ18O variations at this site(Liu et al. 2010a). Furthermore, the surface air tem-perature tended to reach a minimum when the pre-cipitation event happened. Therefore, instead ofdaily mean air temperature, daily minimum tempera-ture played a more dominant role. Most of the regres-sion models could predict the δ18O well. The estab-lished regressions for the S, MV, and NW categorieswere able to explain more than 90% of the observa-tion δ18O variations. Equations for the W and NNWcategories captured over 80% of the observed δ18Ovariations; however, with only the variable of precip-itation amount selected, the equation for the CV cate-gory captured less than 40% of the δ18O variation.
In contrast to Beijing, where regression models usu-ally selected 2 to 5 controlling parameters, the precip-itation amount seemed to be the predominant factorfor most air masses arriving at Seongsan. With the ex -ception of the CV type, the equations for all cate-gories selected this factor. It was particularly impor-tant for the NW, N, SW, and SE categories, in whichthe precipitation amount was the main impact factor.In comparison, regression models established foreach category in Seongsan captured fewer δ18O vari-ations (about 50%) than those for Beijing. The loga-rithmic δ/P relationships describe the control of theprecipitation amount on the isotope content betterthan the pure linear relationships suggested by Leeet al. (2003).
5. SUMMARY AND CONCLUSIONS
The continental Beijing site had larger ranges in δDand δ18O than the island Seongsan site. In Seongsan,most of the depleted δ18O values were in phase withthe heaviest precipitation events; in Beijing, how-ever, this was not the case. The established LMWLs,δD = 7.49δ18O + 1.53 and δD = 8.36δ18O + 19.05, re -flected periodically dry conditions in Beijing, and thekinetic effect in the condensation process in Se ong -san. The lower d values for spring and summer pre-cipitation could be mainly attributed to the evapora-tion occurring during the fall of rain droplets into therelatively dry atmosphere beneath the cloud base.The ‘V’ type of the d pattern for Seongsan revealedvariations in vapor origins. Based on the HYSPLIT
42
Air mass Regression equations R
Beijing All δ18O = 0.223Tmin – 0.279SD – 14.797logRH + 17.495 0.49NW δ18O = 7.417logTmin + 0.206Vp – 222.503 0.98W δ18O = –0.023T 2 + 0.86T – 0.592SD – 8.792 0.79NNW δ18O = 0.02T 2
min – 0.184P – 11.244 0.84CV δ18O = -0.049P – 5.482 0.38MV δ18O = 0.05P – 0.364SD + 0.031Tmin – 0.004WS2 – 10.869 0.98S δ18O = 7.172logP – 79.568logRH – 0.185Tmax – 0.588WS + 0.048T + 139.431 0.98
Seongsan All δ18O = –1.723logP + 0.055Vp – 59.479 0.48NW δ18O = –1.818logP – 4.047 0.40W δ18O = –1.521logP + 0.018WS2 – 3.622 0.53N δ18O = –3.389logP – 2.789 0.75CV δ18O = 0.176Vp – 183.82 0.67SW δ18O = –2.68logP – 2.853 0.51SE δ18O = –0.018P – 4.763 0.51
Table 3. Non-linear stepwise regressions of δ18O for each air mass category in Beijing and Seongsan. Variables for equations, P:precipitation amount (mm), T: surface air temperature (°C), Tmax: maximum surface air temperature (°C), Tmin: minimum surfaceair temperature (°C), RH: relative humidity (%), Vp: vapor pressure (hPa), WS: wind speed (m s–1), SD: sunshine duration (h).
Air mass categories as in Table 2

Liu et al.: Precipitation isotope characteristics
model, 96 h backward trajectories of air masses arriv-ing at 3000 m agl for each precipitation event at the 2sites were calculated. Six categories were obtainedfor each site, based on the moisture origins, paths, latitudes, and speeds of transport. All categories (NW,W, NNW, S, MV, and CV) were represented in thesummer precipitation in Beijing, while only the SW,SE, and CV categories were represented in the sum-mer precipitation in Seongsan. Dominant meteoro-logical controlling factors for the various categorieswere also identified through a non-linear stepwiseregression method. Regressions for Beijing selected 2to 5 factors, while the precipitation amount emergedas the predominant controlling factor for Seongsan.
Acknowledgements. This work was supported by the KeyProgram of the National Natural Science Foundation ofChina (No. 40830636) and the State Basic Research Develop-ment Program (973 Program) of China (No. 2010CB428805).We thank the China Meteorological Data Sharing ServiceSystem and the NOAA Satellite and Information Service forproviding the meteorological data. We gratefully acknowl-edge the NOAA Air Resources Laboratory for providing theHYSPLIT model. We also thank L. Ai of the Institute of Atmo -spheric Physics at the Chinese Academy of Sciences for valu-able advice on the HYSPLIT model analysis.
LITERATURE CITED
Aggarwal PK, Fröhlich K, Kulkarni KM, Gourcy LL (2004)Stable isotope evidence for moisture sources in the Asiansummer monsoon under present and past climateregimes. Geophys Res Lett 31: L08203 doi: 10.1029/ 2004GL 019911
Araguás-Araguás L, Froehlich K, Rozanski K (2000) Deu-terium and oxygen-18 isotope composition of precipita-tion and atmospheric moisture. Hydrol Process 14: 1341–1355
Barras VJI, Simmonds I (2008) Synoptic controls upon δ18Oin southern Tasmanian precipitation. Geophys Res Lett35: L02707 doi: 10.1029/2007GL031835
Barras V, Simmonds I (2009) Observation and modelling ofstable water isotopes as diagnostics of rainfall dynamicsover southeastern Australia. J Geophys Res 114: D23308doi: 10.1029/2009JD012132
Bhattacharya SK, Froehlich K, Aggarwal PK, Kulkarni KM(2003) Isotopic variation in Indian Monsoon precipitation: records from Bombay and New Delhi. Geophys Res Lett30: 2285 doi: 10.1029/2003GL018453
Bradley RS, Vuille M, Hardy D, Thompson LG (2003) Lowlatitude ice cores record Pacific sea surface temperature.Geophys Res Lett 30: 1174 doi: 10.1029/2002GL016546
Craig H (1961) Isotopic variations in meteoric waters. Sci-ence 133: 1702–1703
Dansgaard W (1964) Stable isotopes in precipitation. Tellus16: 436–468
Dansgaard W, Clausen HB, Gundestrup N, Hammer CU,Johnsen SJ, Kristinsdottir PM, Reeh N (1982) A newGreenland ice core. Science 218: 1273–1277
Draxler RR, Rolph GD (2003) HYSPLIT (HYbird Single-Parti-
cle Lagrangian Integrated Trajectory) Model. NOAA AirResources Laboratory, Silver Spring, MD. Available atwww.arl.noaa.gov/ready/hysplit4.html
Gedzelman SD, Lawrence JR (1982) The isotopic composi-tion of cyclonic precipitation. J Appl Meteorol 21: 1385–1404
Grassa F, Favara R, Valenza M (2006) Moisture source in theHyblean Mountains region (south-eastern Sicily, Italy): evidence from stable isotopes signature. Appl Geochem21: 2082–2095
Guo X, Fu D, Wang J (2006) Mesoscale convective precipi -tation system modified by urbanization in Beijing City.Atmos Res 82: 112–126
Harvey FE, Welker JM (2000) Stable isotopic composition ofprecipitation in the semi-arid north-central portion of theUS Great Plains. J Hydrol (Amst) 238: 90–109
Huang R, Zhou L, Chen W (2003) The progresses of recentstudies on the variabilities of the East Asian monsoonand their causes. Adv Atmos Sci 20: 55–69
Jacob H, Sonntag C (1991) An 8-year record of the seasonalvariation of 2H and 18O in atmospheric water vapor andprecipitation at Heidelberg, Germany. Tellus Ser BChem Phys Meteorol 43: 291–300
Johnson KR, Ingram BL (2004) Spatial and temporal variabil-ity in the stable isotope systematics of modern precipita-tion in China: implications for paleoclimate reconstruc-tions. Earth Planet Sci Lett 220: 365–377
Jouzel J, Lorius C, Petit JR, Genthon C, Barkov NI,Kotlyakov VM, Petrov VM (1987) Vostok ice core: a con-tinuous isotopic temperature record over the last climaticcycle (160,000 years). Nature 329: 403–408
Junge FW, Böttger T (1994) Isotope geochemical studies oncarbonates of quaternary glacio-lacustrine lake sedi-ments as indicators of paleoenvironment. Isotopes Envi-ron Health Stud 30: 9–21
Kalnay E, Kanamitsu M, Kistler R, Collins W and others(1996) The NCEP/NCAR 40-year reanalysis project. BullAm Meteorol Soc 77: 437–470
Kwon HJ (1985) Natural geography. Bummoonsa, Seoul (inKorean)
Lawrence JR, Gedzelman SD (1996) Lower stable isotoperatios of tropical cyclone rains. Geophys Res Lett 23: 527–530
Lawrence JR, Gedzelman SD, White JWC, Smiley D, LazovP (1982) Storm trajectories in eastern US D/H isotopiccomposition of precipitation. Nature 296: 638–640
Lee KS, Grundstein AJ, Wenner DB, Choi MS, Woo NC, LeeDH (2003) Climatic controls on the stable isotopic compo-sition of precipitation in Northeast Asia. Clim Res 23: 137–148
Lee LYL, Kwok RCW, Cheung YP, Yu KN (2004) Analyses ofairborne 7Be concentrations in Hong Kong using backtrajectories. Atmos Environ 38: 7033–7040
Liu J, Song X, Sun X, Yuan G, Liu X, Wang S (2009) Isotopiccomposition of precipitation over arid NorthwesternChina and its implications for the water vapor origin.J Geogr Sci 19: 164–174
Liu J, Song X, Yuan G, Sun X, Liu X, Wang S (2010a) Char-acteristics of δ18O in precipitation over Eastern MonsoonChina and the water vapor sources. Chin Sci Bull 55: 200–211
Liu J, Fu G, Song X, Charles SP, Zhang Y, Han D, Wang S(2010b) Stable isotopic compositions in Australian precip-itation. J Geophys Res 115: D23307 doi: 10.1029/ 2010 JD014403
43

Clim Res 49: 29–44, 201144
Managave SR, Sheshshayee MS, Borgaonkar HP, RameshR (2010) Past break-monsoon conditions detectable byhigh resolution intra-annual δ18O analysis of teak rings.Geophys Res Lett 37: L05702 doi: 10.1029/ 2009 GL041172
McDermott F (2004) Palaeo-climate reconstruction from sta-ble isotope variations in speleothems: a review. Quat SciRev 23: 901–918
Merlivat L, Jouzel J (1979) Global climatic interpretation ofthe deuterium–oxygen 18 relationship for precipitation.J Geophys Res 84: 5029–5033
Pfahl S, Wernli H (2008) Air parcel trajectory analysis of stableisotopes in water vapor in the eastern Medi ter ranean.J Geophys Res 113: D20104 doi: 10.1029/2008 JD009839
Rolph GD (2010) Real-time Environmental Applications andDisplay sYstem (READY). NOAA Air Resources Labora-tory, Silver Spring, MD. Available at http: // ready. arl.noaa. gov
Rozanski K, Araguás-Araguás L, Gonfiantini R (1993) Iso-tope patterns in modern global precipitation. In: SwartPK, Lohmann KC, McKenzie J, Savin S (eds) Climate
change in continental isotopic records. GeophysicalMonograph Series, Vol. 78. American GeophysicalUnion, Washington, DC, p 1−36
Shan W, Yin Y, Lu H, Liang S (2009) A meteorological analy-sis of ozone episodes using HYSPLIT model and surfacedata. Atmos Res 93: 767–776
Strong M, Sharp ZD, Gutzler DZ (2007) Diagnosing moisturetransport using D/H ratios of water vapor. Geophys ResLett 34: L03404 doi: 10.1029/2006GL028307
Vre<a P, Bronic IK, Horvatin<ic N, Barešic J (2006) Isotopiccharacteristics of precipitation in Slovenia and Croatia: comparison of continental and maritime stations.J Hydrol (Amst) 330: 457–469
Vuille M, Werner M, Bradley RS, Keimig F (2005) Stable iso-topes in precipitation in the Asian monsoon region.J Geophys Res 110: D23108 doi: 10.1029/2005JD006022
Wei F, Xie Y, Mann ME (2008) Probabilistic trend of anom-alous summer rainfall in Beijing: role of interdecadal vari-ability. J Geophys Res 113: D20106 doi: 10.1029/ 2008 JD010111
Editorial responsibility: Balaji Rajagopalan, Boulder, Colorado, USA
Submitted: August 16, 2010; Accepted: May 9, 2011Proofs received from author(s): September 15, 2011