PRE-EUROPEAN SETTLEMENT VEGETATION OF COOK …plantconservation.us/BowlesMcBrideCook.pdf ·...
36
PRE-EUROPEAN SETTLEMENT VEGETATION OF COOK COUNTY, ILLINOIS MARLIN BOWLES & JENNY MCBRIDE, THE MORTON ARBORETUM, LISLE, IL 2002 Summary We mapped and analyzed the landscape pattern and composition of vegetation described by the U. S. Public Land Survey (PLS) of Cook County, Illinois, which was conducted between 1821 and 1840. Vegetation was patterned by fire and landscape fire breaks, as well as by topography and soils. Cook County was 73 % prairie, wet prairie and marsh, with fragments of timber essentially restricted to the eastern sides of watercourses or steep topography, which offered protection from eastward-moving prairie fires driven by prevailing winds. The largest blocks of timber occurred along Spring and Poplar Creeks, the Des Plaines River and its confluence with the Calumet Sag Valley, and east of the North Branch of the Chicago River. Most areas of timber averaged < 50 trees/ha, indicating widespread savanna conditions; however, forest tree densities of > 100 trees/ha predominated in timber along Salt Creek, the North Branch and north of the Cal-Sag Valley. Woodland, represented by > 50-100 trees/ha, was less common than savanna or forest. Oaks dominated almost all tracts of timber, with white oak the most important species in forest and woodland, and bur oak more abundant in savanna. Hickory usually co-occurred with oaks, but with lower importance, and reached its greatest importance in woodland. Elm-ash-soft maple-basswood vegetation was most abundant in wet forest conditions on the Chicago Lake Plain, while black oak and bur oak were dominant in savanna on lake plain sand ridges. Willow, cottonwood and aspen were less abundant but occurred across a range of habitat conditions. Woody understory vegetation was not systematically sampled by the PLS, but the small sample indicates that hazel and oak brush dominated this type of vegetation and that it had greater linear cover at higher tree densities. These findings indicate that restoring fire processes in relation to landscape features, as well as ecologically appropriate species, should be important objectives in developing restoration management for oak forest and savanna in this region. Acknowledgments We thank the Forest Preserve District of Cook County, CorLands and The Nature Conservancy for funding this project, and Joe Roth and David Wachtel for coordinating funding. We also thank Deborah Antlitz, Christopher Dunn, George Ware and Michael Jones for their valuable comments and discussion.
-
Upload
dangkhuong -
Category
Documents
-
view
214 -
download
0
Transcript of PRE-EUROPEAN SETTLEMENT VEGETATION OF COOK …plantconservation.us/BowlesMcBrideCook.pdf ·...

PRE-EUROPEAN SETTLEMENT VEGETATION OF COOK COUNTY, ILLINOIS
MARLIN BOWLES & JENNY MCBRIDE, THE MORTON ARBORETUM, LISLE, IL
2002
Summary
We mapped and analyzed the landscape pattern and composition of vegetation described by the U. S. Public Land Survey
(PLS) of Cook County, Illinois, which was conducted between 1821 and 1840. Vegetation was patterned by fire and
landscape fire breaks, as well as by topography and soils. Cook County was 73 % prairie, wet prairie and marsh, with
fragments of timber essentially restricted to the eastern sides of watercourses or steep topography, which offered protection
from eastward-moving prairie fires driven by prevailing winds. The largest blocks of timber occurred along Spring and
Poplar Creeks, the Des Plaines River and its confluence with the Calumet Sag Valley, and east of the North Branch of the
Chicago River. Most areas of timber averaged < 50 trees/ha, indicating widespread savanna conditions; however, forest tree
densities of > 100 trees/ha predominated in timber along Salt Creek, the North Branch and north of the Cal-Sag Valley.
Woodland, represented by > 50-100 trees/ha, was less common than savanna or forest. Oaks dominated almost all tracts of
timber, with white oak the most important species in forest and woodland, and bur oak more abundant in savanna. Hickory
usually co-occurred with oaks, but with lower importance, and reached its greatest importance in woodland. Elm-ash-soft
maple-basswood vegetation was most abundant in wet forest conditions on the Chicago Lake Plain, while black oak and bur
oak were dominant in savanna on lake plain sand ridges. Willow, cottonwood and aspen were less abundant but occurred
across a range of habitat conditions. Woody understory vegetation was not systematically sampled by the PLS, but the small
sample indicates that hazel and oak brush dominated this type of vegetation and that it had greater linear cover at higher
tree densities. These findings indicate that restoring fire processes in relation to landscape features, as well as ecologically
appropriate species, should be important objectives in developing restoration management for oak forest and savanna in this
region.
Acknowledgments
We thank the Forest Preserve District of Cook County, CorLands and The Nature Conservancy for funding this project,
and Joe Roth and David Wachtel for coordinating funding. We also thank Deborah Antlitz, Christopher Dunn, George
Ware and Michael Jones for their valuable comments and discussion.


TABLE OF CONTENTS INTRODUCTION . . . . . . . . . . 1 The Public Land Survey . . . . . . . . . 1 Study objectives . . . . . . . . . 1 STUDY AREA . . . . . . . . . . 2 HISTORIC METHODS . . . . . . . . . 2 MODERN METHODS . . . . . . . . . 3 Mapping & interpretation . . . . . . . . 3 Data analysis . . . . . . . . . 4 RESULTS . . . . . . . . . . 5 Vegetation pattern and structure . . . . . . . 5 Woody vegetation composition . . . . . . . 6 DISCUSSION . . . . . . . . . . 7 Vegetation pattern and structure . . . . . . . 7
Woody vegetation types . . . . . . . . 8 MANAGEMENT AND RESTORATION . . . . . . . 10 Scale and accuracy . . . . . . . . 10 Fire processes and oak dominance . . . . . . . 10 Community Composition and structure . . . . . . 10 LITERATURE CITED . . . . . . . . . 11 TABLES 1) Year of survey and species translations . . . . . . 16 2) Coverage of presettlement landscape features . . . . . 17 3) Landscape effect on vegetation composition and diversity . . . . 18 FIGURES 1) Major glacial features of the Chicago area . . . . . 19 2) Public Land Survey Map of Cook Co., Ill. . . . . . . 20 3) Landscape pattern of timber and scattering timber . . . . . 21 4) Percentage of corners in tree density vegetation types . . . . 22 5) Percentage of corners in PLS vegetation types . . . . . 22 6) Average tree in density in PLS vegetation types . . . . . 23 7) Structure of PLS vegetation types . . . . . . 23 8) Landscape effect on vegetation structure . . . . . . 24 9) Ordination and cluster analysis . . . . . . . 25 10) Dominance of oak-hickory and elm-ash-maple-basswood vegetation . . 26 APPENDICES I. Scientific names assigned to common names used by the PLS II. Stand table for PLS vegetation types on till plain habitat. III. Stand table for tree density class vegetation types on till plain habitat. IV. Stand table for PLS vegetation types on lake plain habitat V. Stand table for tree density class vegetation types on lake plain habitat VI. Woody undergrowth abundance VII. Stand tables of Caldwell subdivision

1
INTRODUCTION At the time of European settlement (ca. 1820), northeastern Illinois was a mosaic of prairie and oak (Quercus)-dominated savanna, woodland and forest (Curtis 1959, Davis 1977, Anderson 1983, Anderson & Bowles 1999). This pattern was climatically induced and controlled by fires set by lightning and by indigenous people, with timber persisting on the lee sides of fire barriers such as topographic relief and water courses (Gleason 1913, Moran 1978, 1980, Grimm 1983, 1984, Anderson 1991, Leitner et al. 1991, Bowles et al. 1994). Most of the original vegetation has been lost because of wide-scale fragmentation by agriculture and urbanization,while remnants have deteriorated from fire suppression and overgrazing, (Cottam 1949, McCune & Cottam 1985, Anderson 1991, Stearns 1991, Robertson & Schwartz 1994, Schwartz 1997, Bowles & McBride 1998). Consequently, management and restoration of this vegetation represents an important challenge (Apfelbaum & Haney 1991, Leach & Ross 1995). Conserva-tionists need an understanding of the composition, structure, processes, and dynamics of pre-European settlement (traditionally termed “presettlement”) vegetation so as to better manage and restore its original biodiversity. Ecological models that apply presettlement processes to vegetation pattern, composition, and structure will best meet these needs (Leach & Ross 1995). In this report on the presettlement vegetation of Cook County, we interpret landscape vegetation pattern, structure and composition in relation to landscape features and fire processes and make management and restoration recommendatinos. The Public Land Survey A powerful approach to understanding the landscape pattern and structure of woody vegetation prior to European settlement is analysis of the Government Land Office Public Land Survey (PLS) vegetation notes, maps, and bearing tree data, which were recorded in the early 1800s in Illinois (Hutchison 1988, Ebinger 1997). This survey comprised a square-mile landscape grid upon which the identity, diameter, distance, and direction for two to four bearing trees were recorded at half mile intervals. These data were accompanied by measures of trees intercepted on section lines, section line vegetation summaries, other notes, and township plats distinguishing timber, prairie, and other important landscape features. Despite evidence for biased or non-random selection of bearing trees (Bourdo 1956), the PLS data represent a large-scale vegetation survey that can be used to reconstruct landscape-scale pre-European vegetation (Brugam & Patterson 1996). These data allow estimates of forest composition and ranking of species dominance, but the large sampling scale usually prevents accurate and detailed mapping of vegetation types (Manies & Mladenoff 2000). However, site-specific comparisons and precise mapping of vegetation boundaries may be possible (e.g. Bowles & McBride 1998). These data also can provide ecological information when landscape features, such as soils, topography, or fire barriers, are used to interpret the distribution pattern of different vegetation types based on their composition and structure (Leitner et al. 1991, Anderson & Anderson 1975, Moran 1978, 1980, Rogers & Anderson 1979, Bowles et al. 1994, 1999, and Edgin & Ebinger 1997). For example, in DuPage and Will counties, Illinois, greater landscape cover of prairie and savanna occurred in areas with little landscape fire protection, while higher tree densities and greater abundance of fire-intolerant trees, as well as presence of woody undergrowth, occurred in more fire-protected landscape positions (McBride & Bowles 2001). Study objectives We examined the presettlement woody vegetation pattern and structure in Cook County based on analysis of PLS maps

2
and data. Our objectives were to: 1) assess how the PLS described and sampled vegetation and relate the results to modern concepts of savanna, woodland, and forest, 2) correlate vegetation pattern and structure with landscape features and fire processes, 3) describe presettlement vegetation based on the PLS data, and 4) apply these results toward management and restoration guidelines for native woody-dominated ecosystems. Based on studies of DuPage and Will counties, we expected vegetation in Cook County to be patterned by an interaction between eastward moving prairie fires (driven by westerly winds) and landscape firebreaks such as water courses or steep topography (McBride & Bowles 2001). This process would result in persistence of timber on the leeward sides of waterways, ravines or bluffs, or in areas of rugged topography (Anderson 1991, Ebinger 1997). We also expected fire to affect forest structure and composition (McBride & Bowles 2001). For example, low tree density (savanna) and dominance by oaks (Quercus spp.) would be expected in areas receiving only moderate fire protection. Greater tree density and presence of fire sensitive species, such as maple (Acer), ash (Fraxinus), basswood (Tilia) and elm (Ulmus) species would be expected in more fire-protected areas. We also expected that tree species distribution would correspond to different habitat conditions. For example, the drought tolerant black oak (Quercus velutina) would be most abundant on well-drained sand ridges of the Chicago Lake Plain, while moisture tolerant species such as ash and elm would be more abundant in poorly drained lake plain soils (Hanson (1981). STUDY AREA Cook County is the largest of the Illinois Chicago region counties, comprising almost 246,400 hectares (608,600 acres) and covering 23 full and 9 partial townships. The glacial stratigraphy of Cook County comprises primarily Woodfordian-aged glacial drift and the lake plain of glacial Lake Chicago (Figure 1). The northern, western and southern portions of the county lie on a glacial till plain deposited at the close of Wisconsinan glaciation, while the central and eastern part of the county occupy the former bed of glacial Lake Chicago, which was formed about 14,000 years ago, after the retreat of glaciation (Willman & Frye 1970). This lake bed is underlain by either glacial till leveled by wave action or fine-textured lake sediments, while sand and gravel beaches, bars or spits also occur near the modern shore line. The western area of glacial drift drains into the Fox, DuPage and DesPlaines rivers, while the North Branch of the Chicago River drains into Lake Michigan. The South Branch of the Chicago River formerly drained into Lake Michigan, but was reversed into the Des Plaines River by construction of the Chicago Sanitary District Canal in 1900 (Bretz 1939). In southern Cook County, drainage from the till plain is into the Calumet River, which formerly drained into Lake Michigan. This drainage was reversed into the Des Plaines River by completion of the Calumet Sag Canal in 1922 (Bretz 1939). HISTORIC METHODS The Cook County Public Land Survey was conducted by 11 deputy surveyors between 1821 and 1840 (Table 1). The central portion of the county, lying between the Indian Boundaries, was surveyed by Walls in 1821 (Figure 2). In 1834, the southern Indian boundary was surveyed by Spaulding, and the area to the south was surveyed by Clark and Williams in the same year. The northern Indian boundary was surveyed by Prescott in 1837, with Harrison, Hill, Ewing, Thompson, Galloway and Berry completing the survey by 1840. In some cases, Indian reservations were platted but were not surveyed internally at the time of the PLS. Subdivisions completed later, such as the Caldwell subdivision, may provide data on tree composition of these areas (Mendelson 2002). Each township was mapped after completion of its survey, showing the distribution of timber, watercourses, and settlement

3
features. The Cook Co. PLS also described different vegetation types, primarily prairie, wet prairie, barrens, scattering timber and timber, as well as wetlands such as marsh, slough, swamp, and grass swamp. Smaller areas of thickets, willow thickets, swampy timber thickets were described in the Lake Plain, and sand banks occurred along the Lake Michigan shoreline. The PLS indicated distances along section lines for transitions between these vegetation types, which facilitated their mapping. The primary data collected by the PLS were the identity, diameter, distance, and direction for one to four bearing trees, each located in one of the four quadrants at each section corner, as well as for two bearing trees located in different quadrants at section quarter-corners. Surveyors also recorded the identity and diameter of line trees intercepted by section lines and summarized tree species present along section lines. Some surveyors also recorded the species present in undergrowth along each section line. However, these data are incomplete as they do not appear to have been recorded for all townships nor by all surveyors. The surveyors identified about 30 bearing tree species by common name or by abbreviation, including most of the dominant native tree species. We assume that most witness tree species were correctly identified, and placed them in modern species analogs following Swink and Wilhelm (1984, Appendix I). However, identification of oaks, especially members of the black oak group, appears to have been inconsistent among surveyors (Collins 1997, Clark 2000, Table 1). Hill’s oak or jack oak (Q. ellipsoidalis), was not identified by the PLS, although it was apparently frequent in Cook Co. (Trelease 1919, Waterman 1920). The PLS reported this species for adjacent Will Co. (Bowles & McBride 2001) and it may have been confused with either red oak (Q. rubra) or black oak (Q. velutina) in Cook Co. During the 1834 survey, references to yellow oak on the lake plain apparently represent black oak because of its yellow inner bark and great abundance on lake plain sand ridges (Hanson 1981). The abbreviation “B oak” used by Walls during the 1821 survey is problematic. Apparently it was applied to bur oak and black oak, as neither species was identified during this period. For example, at one Will Co. section corner, trees identified as “B oak” in 1821 county were called “Black oak” when their locations were re-surveyed in 1833 (Bowles & McBride 2001). In DuPage County, Pierre (1962) relocated several bur oak witness trees originally recorded as “B Oak.” Misidentifications also occurred. In Cook Co, trees originally identified as white oak were confirmed later as bur oak (Bowles & McBride 1998). In 2000, we relocated one section corner in Will County at which “B oak” witness trees were apparently Hill’s oak. Swamp white oak (Q. bicolor) was rarely identified in Cook Co., but was frequent in lake plain flatwoods (Waterman 1920) The name “maple” apparently was applied to soft maple (Acer saccharinum), a floodplain species, while “sugar tree” or “sugar maple” was applied to A. saccharum, a species of mesic forest habitat (Hanson 1981, Swink and Wilhelm 1994). Ash species (Fraxinius sp.) identified as white ash, ash and swamp ash are also problematic. White ash was probably Fraxinus americana, especially if found in upland forest. However, ash may have represented either white ash, red ash (F. pennsylvanica), green ash (F. pennsylvanica var. sub-integerrima), blue ash (F. quadrangulata) or black ash (F. nigra). Swamp ash could have represented red, green, or black ash, as all occur in wetland habitats. The surveyors also identified fourteen additional species present as woody undergrowth. Although some of these, such as the shrub American hazelnut (Corylus americana), could be assigned to species, other names such as “vines” or “briars” are vague. Many shrub species may have been unknown to the surveyors (Clark 2000). MODERN METHODS Mapping and interpretation We transcribed and analyzed the PLS data from microfilm copies of the original notes. These data were overlain with the corresponding PLS vegetation plat maps that were digitized using ARC/INFO software (http://esri.com). Features of European settlement, such as fields and roads, were not included in the GIS maps or landscape analysis. GIS was used to map the primary

4
vegetation types, with layers for section lines, bearing trees, section and quarter-corner mean tree densities, line trees, tree species summaries and woody undergrowth summaries. We used two primary methods to understand the spatial pattern of woody vegetation. We first compared differences in woody vegetation composition and structure among common vegetation types (i.e. barrens, scattering timber and timber) described by the PLS, and their relationship to prairie. We then made similar comparisons among savanna, woodland, and forest vegetation types by using arbitrary tree density classes (see following section) to define these vegetation types. Data from the lake plain and from the till plain were also analyzed separately to compare effects of these different habitats on woody vegetation. To understand landscape effects on composition and structure of areas of timber, we compared woody vegetation among six landscape units mapped as timber by the PLS. These included areas on the drainages of Spring and Poplar Creeks in northwestern Cook Co., two areas at Palos located north and south of the Cal-Sag Channel at its intersection with the Des Plaines River, timber bordering the east flank of the upper Des Plaines River, and a large block of timber situated between the North Branch of the Chicago River and Lake Michigan. We expected lower tree densities and greater reresentation of fire-tolerant oaks in the Spring Creek, Poplar Creek and Palos South units because they occur in landscape positions that appear to have a comparatively low degree of fire protection; conversely, we expected higher tree densities and greater species richness in the other tracts because of their positions on the fire-protected lee sides of rivers. Data analysis We used all recorded bearing tree distances to calculate tree density for each section and quarter-corner, as well as for data collected during the Caldwell subdivision. This procedure followed the modified point-center-quarter sampling method, where
trees/hectare = 10,000 m2 ) (0 d)2, and 0 d = the mean distance of up to four bearing trees at each corner adjusted for the number of trees sampled (Cottam & Curtis 1956). Tree densities were limited to a ceiling of 400 trees/ha to avoid artificially high values that can result from the point-center-quarter method. We then used these densities to calculate average densities for the PLS vegetation types of timber, scattering timber, prairie and wet prairie, and wetlands. For vegetation that usually did not support bearing trees, such as prairie, these densities represent only corners with trees, and thus local tree densities. According to Clark (2000) selection of the Q1 (nearest) bearing tree was least likely to be biased, and calculation of density using additional bearing trees from the same corner will result in low estimates of stand density. To reduce effects of this bias on vegetation classification, we placed density calculations into broad classes of open savanna (> 0-10 trees/ha), savanna (> 10-50 trees/ha), woodland (> 50-100 trees/ha) and forest (> 100 trees/ha) categories following Bowles et al. (1994, 1999). The total and relative (R) density (D) and basal area (BA) and importance value [IV = (RD + RBA))2] were calculated for each bearing tree species in all vegetation types and categories. Basal area was calculated in square meters by converting from the original measure of diameter in inches. These data are based on total occurrences within each vegetation type, thus represent an unbalanced sample. As a result, only relative data and importance values can be compared among vegetation types. Simpson’s index of diversity (the probability that two randomly chosen individuals are different species) was calculated for the Spring Creek, Poplar Creek, Palos North and south, Des Plaines and North Branch landscape units, where D’ = 1-3pi, and pi = the relative density of each tree species (Brower & Zar 1984). We determined the abundance of each species of woody undergrowth in each vegetation type from which these data were recorded. To determine abundance, the total length of all section lines from which a species was recorded was expressed as a % of the total length of all sections lines from which woody undergrowth was recorded as present or absent. Because woody undergrowth vegetation was not recorded by all surveyors, the total abundance of this vegetation could not be calculated nor

5
compared among all vegetation types. Presence or absence of woody undergrowth appears to have been most thoroughly recorded for timber tracts along Spring, Poplar, Flint and Salt Creeks in northwestern Cook Co., and for Butterfield, Thorn, Deer, Plum and North Creeks in southern Cook Co. For these landscape units, we determined whether there was a relationship between woody undergrowth and tree density by correlating the % of section lines with woody undergrowth with mean tree density of timber within each landscape unit. This analysis required data from Will Co. for three landscape units that extended south across the southern Cook Co. line. Areas of scattering timber were excluded from this analysis. We used ordination and cluster analysis to assess whether we could identify assemblages of species sharing similar habitat requirements, which could be used to characterize presettlement vegetation types. Using basal area as a metric, we ordinated tree density classes and corresponding species groups with Detrended Correspondence Analysis (DECORANA) on PCORD software (McCune & Mefford 1995). Ward’s Cluster Analysis was then used to identify vegetation types using a Relative Sorenson distance metric on PCORD. Tree species that occurred in only a single community type, and which also had a total BA of < 1, were excluded from the ordination and cluster analysis. We used known ecological information about species habitat requirements (e.g. Swink & Wilhelm 1994) to make inferences about the habitat conditions of these cluster groups. RESULTS Vegetation pattern and structure The presettlement vegetation of Cook County was predominantly grassland, which covered about 73 % of the landscape (Table 2, Figure 3). Woody vegetation covered almost 20 % of the landscape, with about 19 % timber, 1 % scattering timber, and minor representation of barrens and thickets. Wetland vegetation, primarily swamp and marsh, covered about 6 % , while lakes and rivers covered over 1 %. Areas of timber were concentrated along stream valleys and the east sides of watercourses, as well as in lake plain wetlands. In northern Cook County, isolated blocks of timber occurred along the Spring Creek, Flint Creek, Poplar Creek and Salt Creek drainages, and a linear band of timber bordered most of the length of the east side of the Des Plaines River. A large block of timber with prairie inclusions extended east from the Chicago River to Lake Michigan, and was known to early residents as The Big Woods (Greenberg 2002). In southern Cook County, the largest area of timber occurred at the confluence of the Des Plaines River and the Calumet Channel, with the area north of the Channel known as Mt. Forest Island (Greenberg 2002). Smaller blocks of timber were associated with valleys of Tinley, Midlothian, Butterfield, Thorn, Deer, and Plum Creeks, as well as on the lake plain. Only a few small hazel thickets were recorded, while several large willow thickets occurred on the east sides of streams in the lake plain, and a large thicket occurred at the confluence of the North and South Branches of the Chicago River. Sand banks were described along the Lake Michigan shoreline. Landscape vegetation structure based on arbitrary tree density classes was about 65% open savanna and savanna, slightly over 10 % woodland, and almost 25 % forest, with similar representation on glacial till and lake plain habitat (Figure 4). Most of the bearing tree corners were described as occurring in timber by the PLS, with over 60 % in timber on the lake plain and over 70 % in timber on till plain (Figure 5). Prairie and wetland habitats in which bearing trees were present accounted for slightly over 30 % of the lake plain corners and < 25 % of the till plain. Timber averaged about 100 trees/ha and scattering timber about 40 trees/ha (Figure 6). Prairie and wetland habitats with bearing trees averaged about 10-20 trees/ha. On both lake plain and till plain habitats, prairie and wetland habitats with trees, as well as scattering timber, was predominantly open savanna and savanna (Figure 7). In contrast, areas described as timber had greater representation of forest tree densities. Only two small tracts were mapped as barrens, and both were in the northwestern part of the county on land described as broken with thin soil and in areas of scattering timber. In

6
these areas, the tree species were described by the PLS as bur and black oak barrens along Spring Creek and as bur oak barrens along Buffalo Creek. Only three tree corners occurred in these barrens, with densities of < 10 trees/ha. Structure of timber also varied with landscape position (Figure 8), with no significant relationship between sample size and tree density (R2 = 0.47, P = 0.131). Timber along Spring and Poplar Creeks averaged about 40-50 trees/ha, and was predominantly savanna and open savanna. Timber at Palos South and east of the Des Plaines River had more equal representation of savanna and forest, averaging 67 trees/ha at Palos and 84 trees/ha along the Des Plaines. Tree densities exceeded 100 trees/ha with proportionally greater representation of forest at Palos North of the Calumet Valley and east of the North Branch of the Chicago River. The % occurrence of woody undergrowth in landscape units ranged from 36 % to 100 % and was significantly positively correlated (R2 = 0.80, P = .001) with tree density. The regression equation (% occurrence = 0.61 * trees/ha + 24.6 ) predicts that occurrence of woody undergrowth has a positive linear relationship with tree density, reaching 100 % at about 125 trees/ha. Woody vegetation composition With few exceptions, white oak was the dominant tree species across all vegetation types on both till plain and lake plain habitats, with bur oak, black oak, and “B oak” (probably bur, black oak and Hill’s oak) as important secondary species. Among these species, average diameter was 15.3 (".16 se) inches (38.9 cm dbh), and there was no difference between tree diameters on till plain or lake plain habitats (F = 0.23, P = .633). However, line trees were significantly larger (F = 8.63, P = .003), averaging 16.4 (".35 se) inches (41.7 cm dbh). This difference could indicate that surveyors were selecting smaller trees. However, such small difference may not be ecologically important given the large sample size (N = 1184 bearing trees and N = 242 line trees), and the greater chances of larger line trees being intercepted by the line intercept method (Brower & Zar 1984). Stand tables for all vegetation types are compiled in Appendices II-VI, and the Caldwell subdivision in Appendix VII. Among PLS vegetation types, bur oak was more important than white oak in lake plain scattering timber, while black oak and bur oak were more important on sand ridges in lake plain wetlands (Appendix IX). Among tree density classes, black oak exceeded bur oak in dominance only on sand ridges in the lake plain. The three most important species exceeded 50% dominance for all habitats except lake plain forest, in which their total dominance was < 15 %. Species richness was higher in lake plain than in till plain habitats, ranging from 10 species in till plain woodland to 19 species in lake plain open savanna, and was not correlated with
number of trees sampled (r2 = 0.345, P = 0.127). Landscape position also affected composition of timber (Table 3). Species
richness and diversity, as measured by Simpsons’s index, were low at Spring Creek, Poplar Creek and Palos South, which had #5
species including only oaks, hickory, and walnut. In contrast, species richness and Simpson’s index were higher ($16 species) at Des Plaines and North Branch. Species richness was not correlated with sample size (R2 = 0.446, P = 0.147). Bur oak was the dominant species at Spring Creek and Poplar Creek, while white oak was dominant elsewhere. Analysis of the Caldwell subdivision produced an estimate of 148 trees/ha, with nine species recorded among 24 samples. White oak was the dominant species at Caldwell, although sugar maple was the fourth highest ranked species. In timber where woody undergrowth was recorded, hazel had the highest occurrence, reaching 36 % (Appendix VI lists all woody understory species). A total of 25 other woody species were recorded in timber understories with red oak, black oak, oak, and hickory having >10% cover. Ten species occurred in scattering timber, with hazel reaching 48 % occurrence and red oak, oak, willow, black oak and hickory having >10 % occurrence. Only bur oak and black oak were recorded in barrens understory vegetation, with 82 % and 60 % occurrence, respectively. Six species of woody understory vegetation were recorded from thickets, with 33 % occurrence of paw paw (Asimina triloba), 15% occurrence of willow, and about 5% occurrence of hazel, hickory, vines

7
and briars. Ordination and cluster analysis separated vegetation based on tree density vegetation types, as well as till plain and lake plain habitats (Figure 9). The first ordination axis corresponded to an increasing tree density gradient, while the second axis corresponded to a shift from lake plain to till plain habitat - suggesting a response to edaphic factors such as soil texture and drainage. The cluster analysis also separated glacial till and the lake plain habitats, and separated forest and woodland from savanna on till, and forest from savanna and woodland on the Lake Plain. Species clustered into four distinct groups corresponding to differences in dominance, habitat and tree density classes. The most important of these were an oak-hickory group and an elm-ash-soft maple-basswood group (Figure 10). The oak-hickory group dominated most vegetation types, apparently on dry and dry-mesic habitats where these trees predominate (Swink & Wilhelm 1994). On till, white oak dominated all tree density classes, while bur oak had its greatest importance in savanna and red oak was most important in woodland and forest. A hickory-red oak subgroup was less important and was poorly represented in wetlands, scattering timber and barrens. On the lake plain, either white oak, bur oak or black oak were dominant species, while hickory was less important and absent from wetlands and scattering timber. Elm-ash-soft maple-basswood species were much less important than oaks, but were consistently present and represented by elm-ash and soft maple-basswood subgroups. These species apparently predominated on mesic to wet-mesic habitats (Swink & Wilhelm 1994). On till plain soils this group tended to be most important in timber, where elm exceeded hickory in importance. On lake plain habitat, species in this group had their lowest relative abundance in open savanna. In lake plain forest, elm and ash exceeded several oaks and hickory in importance. Several other cluster groups may be less meaningful as they represent species with low importance values from comparatively small sample sizes. These included a walnut-maple group that was absent from woodland and lake plain savanna, a white ash-aspen-cottonwood-willow group that occurred primarily in lake plain habitats, and a pine-ironwood-pin oak group. Among these species, pine was restricted to the Lake Michigan shoreline. DISCUSSION Landscape vegetation pattern and structure As in DuPage and Will counties, the presettlement landscape vegetation pattern in Cook County fits a landscape fire model in which prairie fires driven by prevailing south-westerly winds eliminated timber in fire-prone areas of the landscape (Gleason 1913, Moran 1978, Anderson 1991, Leitner et al. 1991, McBride & Bowles 2001). This vegetation pattern is apparently based on a fire-caused process of forest deterioration, with barrens and scattering timber representing transitional stages between timber and prairie, and prairie representing the most advanced stage (Gleason 1922, Transeau 1935, Curtis 1959). The matrix of vegetation observed by the PLS may have developed between 6,000-8,000 years BP during the hottest and driest part of the Holocene in Illinois, and it could have been stabilized by fire and the climatic conditions of that time period (Anderson & Bowles 1999). However, this vegetation shifted spatially over time in response to changing climatic conditions, favoring either forest during periods of greater rainfall and less frequent fire, or prairie and savanna during periods of less rainfall and more frequent fire (Grimm 1984). The landscape tree density gradient apparently represents a landscape fire gradient, in which areas with greater tree density correspond to habitats with greater fire protection. The structure of different landscape units of timber in Cook Co. support this model, with tree density exceeding 100 trees/ha only in the Palos North and North Branch areas, which would have had greater landscape protection from eastward moving fires than the Spring Creek, Poplar Creek and Palos South units. Although incomplete woody undergrowth data prevents a full comparison among different vegetation types, the presence of undergrowth in multiple

8
landscape units indicates that it was probably present throughout most of the timber in Cook Co. The positive relationship between woody undergrowth and tree density suggests that the fire-caused transition from forest to open savanna also results in a corresponding loss of woody understory vegetation. The landscape gradient of species composition adds support to a landscape fire-model. The dominance of oak species across all vegetation types suggests that fire affected the entire landscape continuum because these species are considered fire dependent and shade intolerant (Lorimer 1985, Abrams 1992). The greater abundance of fire-tolerant bur oak in savanna, as well as the increasing abundance of fire-intolerant maple, ash, elm and basswood in association with increasing forest tree densities suggests a fire-caused species gradient. Increasing landscape fire protection likely resulted in decreasing fire intensity and frequency that allowed persistence of fire-intolerant species. Other factors would affect this model in a feed-back process. Many fire-intolerant species are also shade-tolerant, which would allow them to persist at the higher tree densities created by greater fire protection. Increasing shade, especially in lake plain habitat or in river floodplains or terraces would reduce soil moisture loss and favor species adapted to such conditions. This combination of reduced fire intensity, increased shade, and higher soil moisture retention would further select against oak species and favor maple, ash, basswood and elm species. Hydrological factors also may have had direct effects on vegetation. Prolonged flooding in poorly drained lake plain soils would have reduced fire and promoted forest in areas that received some degree of fire protection, such as the big woods. In contrast, river flooding and ice scour may have reduced tree densities and promoted savanna conditions in larger river flood-plains, such as along the Des Plaines River. Woody vegetation typesBarrens In the glaciated region of Illinois, barrens vegetation usually developed at the western edge of tracts of timber, often as part of a zone of scattering timber intermediate between prairie and timber (e.g. Bowles et al. 2000). This vegetation resulted from fire-caused conversion of timber to a mosaic of fire-sprouting oaks and shrubs such as hazel (Gleason 1913, 1922, Bowles & McBride 1994, Anderson & Bowles 1999). Early residents also observed conversion of prairie to barrens and then to timber with fire protection, a process that would have been accelerated by the presence in these prairies of post fire-sprouting trees and shrubs (Bowles & McBride 1994). Although the small sample size of barrens from Cook Co. prevents a detailed description of this vegetation, it indicates a structure in which tree density is low and cover of woody undergrowth is high, in this case with dominance by bur and black oak. Savanna Open savanna (> 0-10 trees/ha) tended to be most frequently associated with isolated corners in prairie or graminoid wetlands, or with small fragments of scattering timber and timber that did not have a high degree of fire protection. The PLS concept of scattering timber may have relied not only on tree density but also on the amount of dispersion or “scattering” of timber fragments left by the process of fire-caused deterioration of timber. Therefore, this vegetation may have been detected most easily at a large landscape scale. Savanna (> 10-50 trees/ha) appears to have been associated with moderate- or larger-sized tracts of timber without extreme fire protection. On till plain habitat, dry-mesic and mesic savanna were dominated by white or bur oak, with black oak and possibly Hill’s oak as secondary species in drier habitats. Bur oak was apparently more important than white oak in smaller tracts on the western part of the till plain. Although woody undergrowth data are sparse, % occurrence along section lines corresponded to canopy tree

9
density in savanna, with less than 25 % occurrence in open savanna, and up to 50 % in savanna. Hazel and oak were the leading woody species in mesic and dry-mesic savanna understories. Mesic and wet mesic savanna with elm-ash-maple-basswood vegetation also formed a small component of open savanna in the flood-plain of the Des Plaines River on till plain. On the lake plain, beach ridges supported dry to dry-mesic savanna dominated by black oak, with bur oak and white oak as secondary species (Hanson 1981). Sand dunes or sand banks along Lake Michigan also had oak and pine savanna, probably with Jack pine (Pinus banksiana) and white pine (P. strobus) (Pratt 1935). Mesic and wet mesic savanna with elm-ash-soft maple-basswood vegetation also formed a small component of open savanna in the big woods, with maple and basswood more important along the North Branch of the Chicago River. Swamp white oak was also common in the Big Woods (Waterman 1920), where it probably occurred in poorly drained savannas that became flatwoods with fire exclusion. Aspen, cottonwood, and willow occurred infrequently along the Des Plaines River and also throughout the lake plain in savanna habitat on sand ridges and in the Big Woods. Because these species usually occupy successional vegetation, it is possible that they occurred in areas that had been disturbed. Hazel, oak, ash and pawpaw were frequent woody undergrowth species on lake plain habitats. Woodland Oak woodland (> 50-100 trees/ha) is often thought of as typifying the Chicago region’s presettlement oak timber (with 50-80 % canopy cover intermediate between savanna and forest), and is therefore an important restoration goal (Chicago Wilderness Biodiversity Council 1999). Paradoxically, woodland was the least abundant of any tree density class, occurring at < 15 % of all corners with bearing trees, and also did not occur as a well-defined landscape unit. For example, although the Poplar Creek, Palos South, and Des Plaines River timber blocks averaged > 50-100 trees/ha, they had more corners representing savanna or forest, resulting in an intermediate but non-representative average tree density. As with savanna vegetation, most woodland vegetation appears to have been mesic to dry-mesic and dominated by white oak and bur oak. However, red oak and hickory reached their greatest dominance in woodland. Mesic to wet mesic woodland, indicated by presence of elm-ash-maple-basswood, appears to have been rare on till plain habitat. Forest Although corners representing forest tree densities occurred throughout Cook Co., only two large landscape units of forest were present, representing dry-mesic forest on glacial till at Palos North and mesic to wet-mesic forest on lake plain along the North Branch. A small area of mesic forest also occurred along Salt Creek, while wet-mesic and wet forest occurred locally along the Des Plaines River. Dry-mesic forest on glacial till had low species richness, with only four species sampled and dominance by white oak. Secondary importance was apparently shared by bur and black oak, as the survey of this area used “B oak” for these species, while hickory had minor importance. Red oak also may have been present but identified as “B oak.” Woody undergrowth was apparently not sampled at Palos, although a few lines indicated that undergrowth was not present. Information on mesic forest composition on glacial till is limited by small sample size. Bearing trees sampled along the Salt Fork indicate that dominance by white oak, basswood and red oak, with slightly less importance of hickory. Elm, poplar, walnut, bur oak and ash apparently had minor representation in mesic forest. Line summaries indicate that woody undergrowth had 100 % occurrence, with dominance by hazel and oak. Along the upper Des Plaines River, local occurrences of wet-mesic forest species included a maple-basswood component, as well as elm, ash and soft maple in wet forest. Woody understory data from a few section lines indicate that paw paw, dogwood,

10
willow, hickory, sugar maple, and oak woody undergrowth occurred in this vegetation. Wet floodplain forest along the Des Plaines was apparently co-dominated by elm, soft maple, ash, and willow. Mesic and wet- mesic forest in The Big Woods along the North Branch reached the highest richness and diversity of any forest type, probably due to a comparatively high degree of fire protection, as well as a diverse habitat gradient ranging from well drained beach ridges to poorly drained lake plain soils. Mesic forests were dominated by white oak and bur oak with subdominance by red oak and hickory. A wet-mesic maple-basswood component occurred locally along the North Branch, while wet elm-ash-soft maple-basswood forest occurred throughout much of the area. Woody undergrowth was apparently not sampled regularly in the Big Woods, but was recorded from about 50 % of the exterior lines of Township 41North Range 13 East, as well as part of the Indian Boundary. Hazel, oak, ash, willow and paw paw were frequent species. These forests also had high richness of herbaceous vegetation (Higley and Raddin 1891, Greenberg 2002). MANAGEMENT AND RESTORATION Issues of scale and accuracy Although the PLS sampling data provide meaningful information, applying structural models based on these data to small-scale restoration and management can be problematic without an appropriate transfer of scale. For example, the landscape-scale PLS sample coverage would provide few sample points that might directly apply at a small scale to existing sites (Bowles & McBride 1998). Further, the point-center-quarter sampling method is vulnerable to non-random vegetation patterns and to sampling error, and may provide erroneous information with small sample sizes. The linear measure of woody undergrowth also represents a large-scale sample that does not directly translate to more precise small-scale measures of woody undergrowth. However, the landscape scale abundance of woody undergrowth is meaningful in a restoration context Restoring fire processes and oak dominance Management to restore presettlement or “natural” vegetation conditions must take into account the dynamic nature of vegetation. However, if presettlement vegetation pattern and structure changed very little during periods of stable climatic conditions, then conditions present in the early 1800's probably would have persisted after the 19th century. Therefore, the structure and composition of this vegetation would represent a framework for setting restoration management goals and objectives, and for understanding the landscape processes needed to reach these goals. Landscape fire processes played a significant role in shaping the presettlement vegetation pattern of Cook Co. Fire processes are therefore critical for restoring and managing woody vegetation to represent presettlement conditions, as well as for maintaining the floristic diversity present at the time of settlement. A primary concern is maintenance of oak-dominated woody vegetation, which is thought to be fire-dependent. If oak regeneration requires fire disturbance, then the dominance of oaks throughout all woody vegetation types, including wet-mesic forests, indicates that fire affected the entire continuum of woody vegetation. However, other distur-bance processes, as well as replacement in tree fall gaps, probably also occurred at higher tree densities. Restoring community composition and structure Our results provide information for making choices of which vegetation types to restore based on their landscape position, as well as their former abundance. Clearly, restoration of savanna vegetation should be a primary concern, and developing appropriate savanna structure is a critical issue. Although data from Cook Co. were limited, they suggest that savanna vegetation

11
was often three-layered, with presence of woody understory vegetation dominated by American hazelnut, Corylus americana. Therefore, propagation and reintroduction of this species should be an important management objective (Bowles & Spravka 1994). As shown by data from Cook Co. and other studies, a useful model for restoring woody understory vegetation is based on fire frequency and intensity, with greater abundance of woody undergrowth in more fire-protected habitat (Bowles et al. 1999). The results of this study indicate that assumptions about former levels of abundance of woodland and forest need to be re-evaluated. Woodland is often considered to have been the predominant woody vegetation type of the Chicago region and is an important focus of restoration activities (Chicago Biodiversity Council 1999). However, woodland occupied less than 20% of the landscape, and that forest vegetation was more abundant. Many existing woody vegetation remnants that are considered representative of woodland (e.g. Bowles & McBride 1996) may have been formerly more open savanna communities (Bowles et al. 1998). As a result, management to restore woodland structure may not replicate the conditions present prior to settlement. In turn, some modern forest remnants may have been originally more open and similar to woodland. Restructuring these remnants to a former more open woodland structure will require the use of fire as well as supplemental mechanical canopy thinning. However, based on tree density classes, forest vegetation was also present in fire-protected habitat, and little information is available about the fine-scale structure and composition of these forests. Because of the limited information about presettlement woodland and forest, applied research will be required to learn how to maintain biological diversity when these habitats are managed to replicate presettlement conditions (Bowles et al. 1998).
LITERATURE CITED
Abrams, M.D. 1992. Fire and the development of oak forests. BioScience 42:346-353.
Anderson. R.C. 1991. Presettlement forests of Illinois. Pages 9-19 in: Proceedings of the Oak Woods Management
Workshop. G.V. Burger, J.E. Ebinger, & G.S. Wilhelm, eds. Eastern Illinois University, Charleston.
Anderson, R.C. 1983. The eastern prairie-forest transition - an overview. Pages 86-92 in: Proceedings of the Eighth North
American Prairie Conference. R. Brewer, ed. Western Michigan University, Kalamazoo.
Anderson, R.C., & M.R. Anderson. 1975. The presettlement vegetation of Williamson County, Illinois. Castanea 40:345-363.
Anderson, R.C, & M.L. Bowles. 1999. Deep soil savannas and barrens of the midwestern United States. Pages 55-70 in: The
savanna, barren, and rock outcrop communities of North America. R.C. Anderson, J.S. Fralish, & J. Baskin, eds., Cambride
University Press.
Apfelbaum, S.I. & A. W. Haney. 1991. Management of degraded oak savanna remnants in the upper Midwest: preliminary
results from three years of study. Pages 81-90 in: Proceedings of the Oak Woods Management Workshop. G.V. Burger, J.E.
Ebinger, & G.S. Wilhelm, eds. Eastern Illinois University, Charleston.
12
Bourdo, E.A., 1956. A review of the General Land Office Survey and of its use in quantitative studies of former forests.
Ecology 37:754-768.
Bowles, M.L., & J.L. McBride. 1994. Presettlement barrens in the glaciated prairie region of Illinois. Pages 75-85 in:
Proceedings of the North American Conference on Savannas and Barrens. J.S. Fralish, R.C. Anderson, J.E. Ebinger, & R.
Szafoni, eds. Environmental Protection Agency, Great Lakes National Program Office, Chicago.
Bowles, M.L. & J. McBride. 1996. Evaluation and classification of savanna, woodland , and barrens natural areas in northern
Illinois. Report to the Illinois Department of Natural Resources. The Morton Arboretum, Lisle, Ill.
Bowles, M.L. & J.L. McBride. 1998. Vegetation composition, structure, and chronological change in a decadent midwestern
North American savanna remnant. Natural Areas Journal 18:14-27.
Bowles, M.L., M.D. Hutchison, & J.L. McBride. 1994. Landscape pattern and structure of oak savanna, woodland, and
barrens in northeastern Illinois at the time of European settlement. Pages 65-73 in: Proceedings of the North American
Conference on Savannas and Barrens. J.S. Fralish, R.C. Anderson, J.E. Ebinger, & R. Szafoni, eds. Environmental Protection
Agency, Great Lakes National Program Office, Chicago.
Bowles, M & M. Spravka. 1994. American hazelnut, an overlooked native shrub in northeastern Illinois. the Morton
Arboretum Quarterly 30:42-48.
Bretz, J.H. 1939. Geology of the Chicago Region. Illinois State Geological Survey Bulletin 65 Part I. Urbana, Illinois.
Brower, J.E., & J.H. Zar. 1984. Field & laboratory methods for general ecology, second edition. W.C. Brown Publishers,
DuBuque, Iowa.
Brugman, R.B. & M.J. Patterson. 1996. Application of a geographic information system to mapping presettlement vegetation
in southwestern Illinois. Transactions Illinois Academy of Science 89:125-141.
Chicago Wilderness Biodiversity Council. 1999. Biodiversity Recovery Plan. Chicago Wilderness Biodiversity Council,
Chicago, Ill..
Clark, D. C. 2000. The surveyors surveyed: investigations of bias in General Land Office surveyor data for northeastern
Illinois,1837-1840. M. A. thesis, Northeastern Illinois University.
Collins, E. R. 1997. The pre-Euroamerican natural communities of the Nippersink Creek watershed in McHenry County. M.

13
A. thesis, Northeastern Illinois University.
Cottam, G. 1949. The phytosociology of an oak woods in southwestern Wisconsin. Ecology 30:271-287.
Cottam, G. & J.T. Curtis. 1956. The use of distance measures in phytosociological sampling. Ecology 37:451-460.
Curtis, J.T. 1959. The vegetation of Wisconsin - an ordination of plant communities. The University of Wisconsin Press,
Madison.
Davis, A.M. 1977. The prairie-deciduous forest ecotone in the upper middle west. Annals of the Association of American
Geographers 67:204-213.
Ebinger, J.W. 1997. Forest communities of the Midwestern United States. Pages 3-23 in: Conservation in highly fragmented
landscapes, M.W. Schwartz, ed. Chapman & Hall, New York.
Edgin, B.R. & J.E. Ebinger. 1997. Barrens and the forest-prairie interface in presettlement Crawford County, Illinois.
Castanea 62:260-267.
Gleason, H.A. 1913. The relation of forest distribution and prairie fires in the middle west. Torreya 13:173-181.
Gleason. H.A. 1922. Vegetational history of the Middle West. Association of American Geographers Annals 12:39-85.
Grimm, E. C. 1983. Chronology and dynamics of vegetation change in the prairie-woodland region of southern Minnesota,
U.S.A. New Phytologist 93:311-350.
Grimm, E.C. 1984. Fire and other factors controlling the Big Woods vegetation of Minnesota in the mid-nineteenth century.
Ecological Monographs 54:291-311.
Greenberg, J. 2002. A Natural History of the Chicago Region. The University of Chicago Press, Chicago.
Hanson, P.C. 1981. The presettlement vegetation of the plain of glacial lake Chicago in Cook County, Illinois. Pages 159-164
in Proceedings of the 6th North American Prairie Conference (R.L.Stuckey & K.J. Reese, eds), Ohio Biological Survey Notes
No. 15.
Higley, W.K. & C.S. Raddin.1891.The flora of Cook Co., Illinois and a part of Lake Co., Indiana. Chicago Academy of
Sciences Bulletin 2(No.11). Chicago, Illinois.

14
Hutchison, M.D. 1988. A guide to using the Public Land Survey Notes in Illinois. Natural Areas Journal 8:245-255.
Leach, M.K, & L. Ross (eds). 1995. Midwest oak ecosystems recovery plan: a call to action. U.S. Environmental Protection
Agency, Chicago, Ill.
Leitner, L.A., C.P. Dunn, G.R. Guntenspergen, F. Stearns, & D.M. Sharpe. 1991. Effects of site, landscape features, and fire
regime on vegetation patterns in presettlement southern Wisconsin. Landscape Ecology 5:203-217.
Lorimer, C.G. 1985. The role of fire in the perpetuation of oak forests. Pages 8-25 in Challenges in Oak Management and
Utilization. J.E. Johnson, ed. Cooperative Extension Service, University of Wisconsin, Madison.
Manies, K.L. & D.J. Mladenoff. 2000. Testing methods to produce landscape-scale pre-settlement vegetation maps from the
U.S. public land survey records. Landscape Ecology 15:742-754.
McBride, J.L. & M.L. Bowles. 2001. Vegetation pattern of DuPage and Will counties at the time of European settlement. In:
Proceedings of the Northern Illinois Prairie Conference. C. Peterson, ed. College of DuPage, Glen Ellyn, IL.
McCune, B. & G. Cottam. 1985. The successional status of a southern Wisconsin oak woods. Ecology 66:1270-1278.
McCune, B. & M.J. Mefford. 1995. PC-ORD. Multivariate analysis of ecological data, Version 2.0. MjM Software Design,
Gleneden Beach, Oregon, USA.
Mendelson. J. 2002. An additional source of data on northeastern Illinois woodland around the time of settlement. American
Midland Naturalist 147:279-286
Moran, R.C. 1978. Presettlement vegetation of Lake County, Illinois. Pages 12-18 in: Proceedings of the fifth Midwest
Prairie Conference. Glenn-Lewin, D.C. and R.Q. Landers, eds. Iowa State University, Ames.
Moran, R.C. 1980. Presettlement (1830) vegetation of DeKalb, Kane and DuPage counties, Illinois. M.S. Thesis, Southern
Illinois University, Carbondale.
Pierre, D.J. 1962. A preliminary study of growth rates in some witness trees of Will County. M.S. Thesis, Illinois State
University, Normal.
Pratt, H.E. 1935. John Dean Caton’s reminiscences of Chicago in 1833 and 1834. Journal of the Illinois State Historical

15
Society 28(1)5-25.
Robertson, K.W. & M.W. Schwartz. 1994. Prairies. In Illinois Department of Energy and Natural Resources. The Changing
Illinois Environment: Critical Trends. Technical Report of the Critical Trends Assessment Project. Vo. 3: Ecological
Resources. Illinois Department of Energy and Natural Resources, Springfield.
Rogers, C.S. & R.C. Anderson. 1979. Presettlement vegetation of two prairie peninsula counties. Botanical Gazette 140
(2):232-240.
Schwartz, M.W. (ed.) 1997. Conservation in highly fragmented landscapes. Chapman & Hall, New York.
Stearns, F.W. 1991. Oaks woods: an overview Pages 1-7 in: Proceedings of the Oak Woods Management Workshop. G.V.
Burger, J.E. Ebinger, & G.S. Wilhelm, eds. Eastern Illinois University, Charleston.
Swink, F. & G. Wilhelm. 1994. Plants of the Chicago Region. Indiana Academy of Science, Indianapolis.
Transeau, E.N. 1935. The prairie peninsula. Ecology 16:423-437.
Trelease, 1919. The jack oak (Quercus ellipsoidalis) Transactions Illinois Academy Science 12:108-125.
Waterman, W.G. 1920. Distribution of oaks on the Lake Chicago bars in Evanston and New Trier. Townships. Transactions
Illinois Academy Science 13:239-242.
Willman, H.B. 1971. Summary of the geology of the Chicago area. Circular 460, Illinois State Geological Survey, Urbana.
Willman, H.B. & J.C. Frye. 1970. Pleistocence stratigraphy of Illinois. Illinois State Geological Survey Bulletin 94, Urbana.

16
Table 1. Year(s) of survey and translations of maple (Acer), ash (Fraxinus), and oak (Quercus) identifications and abbreviations used by Deputy Surveyors.
Year and surveyor
Common Scientific 1821 1834 1834 1834 1837 1837 1837 1838 1839 1839-40 1840
name name Walls Clark Spaulding Williams Galloway Prescott Thompson Berry Hill Harrison Ewing
Soft maple Acer saccharinum maple maple
Sugar maple Acer saccharum sugar tree sugar tree
White ash Fraxinus americana White ash White ash
Black ash Fraxinus nigra
Ash Fraxinus sp Ash Swamp ash
White oak Quercus alba W oak White oak White oak White oak White oak White oak White oak White oak White oak White oak White oak
Swamp oak Quercus bicolor swamp oak
Bur oak Quercus macrocarpa Bur oak Burr oak Bur oak Bur oak Burr oak Bur oak Burr oak Bur oak
Pin oak Quercus palustris Pin oak
Red oak Quercus rubra R oak Red oak Red oak Red oak Red oak Red oak Red oak
B oak Quercus sp. B oak
Black oak Quercus velutina Yellow oak Black oak Yellow oak Black oak Black oak Black oak Black oak Black oak Black oak
Black oak Quercus velutina Black oak

17
Table 2. Coverage of presettlement landscape features of Cook Co., Illinois.
Vegetation type Community Hectares Percent
Prairie 180560.40 73.28
Prairie 162754.90 66.06 Wet Prairie 17805.50 7.23
Wetland 13667.30 5.55 Marsh 5995.60 2.43 Slough 246.00 0.10 Swamp 7204.60 2.92 Grass swamp 221.10 0.09
Woody 49198.40 19.97 Willow thicket 165.60 0.07 Thicket 466.20 0.19 Barrens/S.Timber 158.90 0.06 Scattering Timber 1881.70 0.76 Timber 46353.20 18.81 Sand Banks 172.80 0.07
Aquatic 2965.30 1.20 Lakes 1808.10 0.73 Rivers 1157.20 0.47
Total 246391.40 100.00

18
Table 3. Landscape effect on woody vegetation composition and diversity of different areas of timber surveyed by the Public Land Survery in Cook Co., Illinois. Data represent Importance Values
Spring Poplar Palos Des Palos North
Species Creek Creek South Plaines North BranchWhite oak 18.48 30.15 74.31 36.37 71.71 31.65Bur oak 41.79 48.42 22.40 25.83Black oak 33.73 2.17 9.29 5.17B oak 19.54 3.06 15.43Red oak 2.38 16.18 3.69 8.18Hickory 3.61 3.08 4.14 3.58 2.68 7.04Elm 6.99 1.71 4.46Ash 2.55 9.59Soft maple 1.77 6.05 2.30Basswood 3.00 1.23B ash 2.22 0.97Blk walnut 2.01 1.16Sugar maple 2.08 0.52Aspen 2.12White ash 1.18 0.33Butternut 1.05Ash 0.84Walnut 0.64 0.18Cottonwd 0.72Willow 0.61Swamp ash 0.20Cherry 0.16Thorn 0.16Ironwood 0.15
No. of corners 38 41 70 51 44 169Species richness 5 5 4 16 8 18Trees/ha 39.53 55.78 66.77 84.15 115.13 131.82Simpsons's Index 0.65 0.64 0.39 0.82 0.46 0.83
.

19
Figure 1. Major glacial features of the Chicago area (Wilman 1971).

20
R9E R10E R11E
T42N
T41N
T40N
T39N
T38N
T37N
R12E
R14E R15E
T35N
T36N
T37N
T38N
Indian Boundary
1837
Indian Boundary 1834
N
Figure 2. Public Land Survey Map of Cook Co., Illinois. Dates indicate years during which the Indian Boundaries were surveyed.

21
T3 6N
T3 5N
T3 7N
T3 8N
T3 8N
T3 9N
T4 0N
T4 1N
T4 2N
R9E
R11 E
R15 E
R10 E R11 E
R14 E
T4 1N
R12 E
R13 ER12 E
T4 2N
R11 ER10 ER9E
N
R9E R10E R11E R12E R13E
T42N
T41N
T40N
T39N
T38N
T37N
R13E R14E R15E
Figure 3. Landscape pattern of prairie (unshaded) and timber and scattering timber (shaded) based on the Cook Co., Illinois Public Land Survey.

22
0
5
10
15
20
25
30
35
40
O. savanna Savanna Woodland Forest
% o
f cor
ners
Lake PlainTill Plain
Figure 4. Percentage of section and quarter corners in tree density vegetation types. Trees/ha: O. savanna = >0-10, Savanna = >10-50, Woodland = >50-100, Forest = >100. Chi-Square: Subsrate P = .984,
0
10
20
30
40
50
60
70
80
Prairie Wetland S. timber Timber
% o
f cor
ners
Lake PlainTill Plain
Figure 5. Percentage of section and quarter corners in PLS vegetation . Chi-Square: Substrate P <.001, Vegetation P <.001.

23
0
20
40
60
80
100
120
140
Prairie Wetland S. timber Timber
Mea
n (+
se) t
ree
dens
ityLake PlainTill Plain
Figure 6. Average tree densities across PLS vegetation types. ANOVA: Vegetation P <.0001, Substrate P <.01, Vegetation X Substrate P = .2654. Error bars represent standard errors.
0
10
20
30
40
50
60
70
80
90
prairie wetland S.timber Timber prairie wetland S.timber Timber
LakePlain
LakePlain
LakePlain
LakePlain
Till P lain Till P lain Till P lain Till P lain
% c
ompo
sitio
n
O. savannaSavannaWoodlandForest
Figure 7. Structure of PLS vegetation types on lake plain and till plain habitats based on % of corners represented by different tree density classes. Chi-Square: Lake Plain P <.001, Till Plain P <.001.

24
Landscape Effects on Vegetation Structure
0
10
20
30
40
50
Spring Crk Poplar Crk Palos S. DesPlaines Palos N. N. Branch
Rel
ativ
e ab
unda
nce
O.Savanna Savanna Woodland Forest
Figure 8. Landscape effect on presettlement vegetation structure of timber in Cook Co., Illinois. Upper: Polygon locations. Lower: proportion of tree density classes within polygons.

25
Till Plain - Open S
Till Plain - S
Till Plain - Woodland
Till Plain - Forest
Lake Plain - Open S
Lake Plain - S
Lake Plain - Woodland
Lake PLain - F t
-60 -60
-20 20 60
-20
20
60
Community
Axis 1
Axi
s 2
White oak
Black oak
Bur oak
Red oak
Hickory
Elm
AshSoft maple
White ash
Cottonwod
Basswood Aspen
Walnut
Willow
Sugar maple
B ash
Pine
Pin oak
Ironwood
0
-20
20 40 60 80
20
60
Species
Axis 1
Axis
2
Community
Distance (Objective Function)
Information Remaining (%)
6E-03
100
7.2E-02
75
1.4E-01
50
2E-01
25
2.7E-01
0
T-OST-ST-WT-FLP-OSLP-SLP-WLP-F
Species
Distance (Objective Function)
Information Remaining (%)
1.1E-02
100
8.5E-01
75
1.7E+00
50
2.5E+00
25
3.4E+00
0
White oaBur oakBlack oaRed oakHickoryWalnutSugar maElmAshSoft mapBassw oodB ashw hite asAspenCottonw oWillowpineIronw oodpin oak
Figure 9. Ordination (upper) and cluster analysis of presettlement vegetation sampled by the Public Land Survey on till plain and lake plain habitats in Cook, Co., Illinois.

26
Till Plain
0
10
20
30
40
50
60
O.savanna Savanna Woodland Forest
Dom
inan
ce
White oak Bur oak Black oak Red oak Hickory
Lake Plain
0
5
10
15
20
25
30
35
40
O.savanna Woodland
Dom
inan
ceWhite oak Bur oak Black oak Red oak Hickory
Lake Plain
0
0.5
1
1.5
2
2.5
3
3.5
4
O.savanna Savanna Woodland Forest
Dom
inan
ce
Elm Ash Soft maple Basswood
Till Plain
0
1
2
3
4
5
6
O.savanna Savanna Woodland Forest
Dom
inan
ce
Elm Ash Soft maple Basswood
Figure 10. Dominance of oak-hickory and elm-ash-soft maple-basswood presettlement vegetation groups across tree density classes on lake plain and till plain habitats.

27
Appendix I. Scientific names assigned to common tree names and abbreviations used by the Cook County Public Land Survey. Nomenclature follows Swink & Wilhelm (1994).
Common name Scientific nameAsh Fraxinus sp Aspen Populus tremuloides B ash Fraxinus nigra B oak Quercus sp. Basswood Tilia americana Birch Betula sp. Black oak Quercus velutina Bur oak Quercus macrocarpa Cedar Juniperus sp. / Thuja sp. Cherry Prunus sp. Cottonwood Populus deltoides Elm Ulmus sp. Hackberry Celtis occidentalis Hickory Cary sp. Ironwood Ostrya virginiana Pin oak Quercus palustris Pine Pinus sp. Poplar Populus sp. Red elm Ulmus rubra Red oak Quercus rubra Soft maple Acer saccharinum Sugar maple Acer saccharum swamp ash Fraxinus sp. swamp oak Quercus bicolor Walnut Juglans nigra White ash Fraxinus americana White oak Quercus alba White walnut Juglans cinerea Willow Salix sp.

28
Appendix II. Abundance, basal area, and importance values of tree species by PLS vegetation types on till plain habitat.
TILL PLAIN - PRAIRIE
Species Density Basal Area Rel Dens Rel BA IVWhite oak 36.00 3.75 42.86 36.44 39.65Bur oak 25.00 3.52 29.76 34.26 32.01B oak 9.00 0.98 10.71 9.57 10.14Black oak 5.00 1.09 5.95 10.63 8.29Hickory 4.00 0.33 4.76 3.23 4.00Ash 3.00 0.37 3.57 3.55 3.56Soft maple 2.00 0.24 2.38 2.31 2.34Total 84.00 10.28 100.00 100.00 100.00
TILL PLAIN - WETLANDS
Species Density Basal Area Rel Dens Rel BA IVWhite oak 3.00 0.38 42.86 32.14 37.50Black oak 1.00 0.29 14.29 24.85 19.57Bur oak 1.00 0.29 14.29 24.85 19.57B oak 1.00 0.11 14.29 9.71 12.00Poplar 1.00 0.10 14.29 8.46 11.37Total 7.00 1.17 100.00 100.00 100.00 TILL PLAIN - S. TIMBER & BARRENS
Species Density Basal Area Rel Dens Rel BA IVWhite oak 19.00 1.87 41.30 39.42 40.36Bur oak 18.00 1.89 39.13 39.85 39.49Red oak 4.00 0.45 8.70 9.40 9.05Black oak 3.00 0.29 6.52 6.20 6.36B oak 2.00 0.24 4.35 5.13 4.74Total 46.00 4.75 100.00 100.00 100.00
TILL PLAIN - TIMBER
Species Density Basal Area Rel Dens Rel BA IVWhite oak 371.00 45.99 47.87 47.36 47.61Bur oak 156.00 19.93 20.13 20.53 20.33Black oak 50.00 8.67 6.45 8.93 7.69B oak 47.00 6.52 6.06 6.71 6.39Hickory 53.00 4.28 6.84 4.41 5.63Red oak 35.00 5.26 4.52 5.41 4.96Soft maple 11.00 1.79 1.42 1.84 1.63Ash 13.00 1.06 1.68 1.09 1.39Elm 10.00 0.66 1.29 0.68 0.98Basswood 7.00 0.87 0.90 0.90 0.90Walnut 6.00 0.56 0.77 0.57 0.67B ash 3.00 0.44 0.39 0.45 0.42Aspen 3.00 0.25 0.39 0.25 0.32Sugar maple
3.00 0.20 0.39 0.20 0.29
White ash 1.00 0.20 0.13 0.21 0.17Butternut 1.00 0.16 0.13 0.17 0.15Pin oak 1.00 0.09 0.13 0.09 0.11Red elm 1.00 0.07 0.13 0.08 0.10Swmp ash 1.00 0.07 0.13 0.08 0.10Thorn 1.00 0.03 0.13 0.03 0.08Willow 1.00 0.01 0.13 0.01 0.07Total 775.00 97.11 100.00 100.00 100.00
29
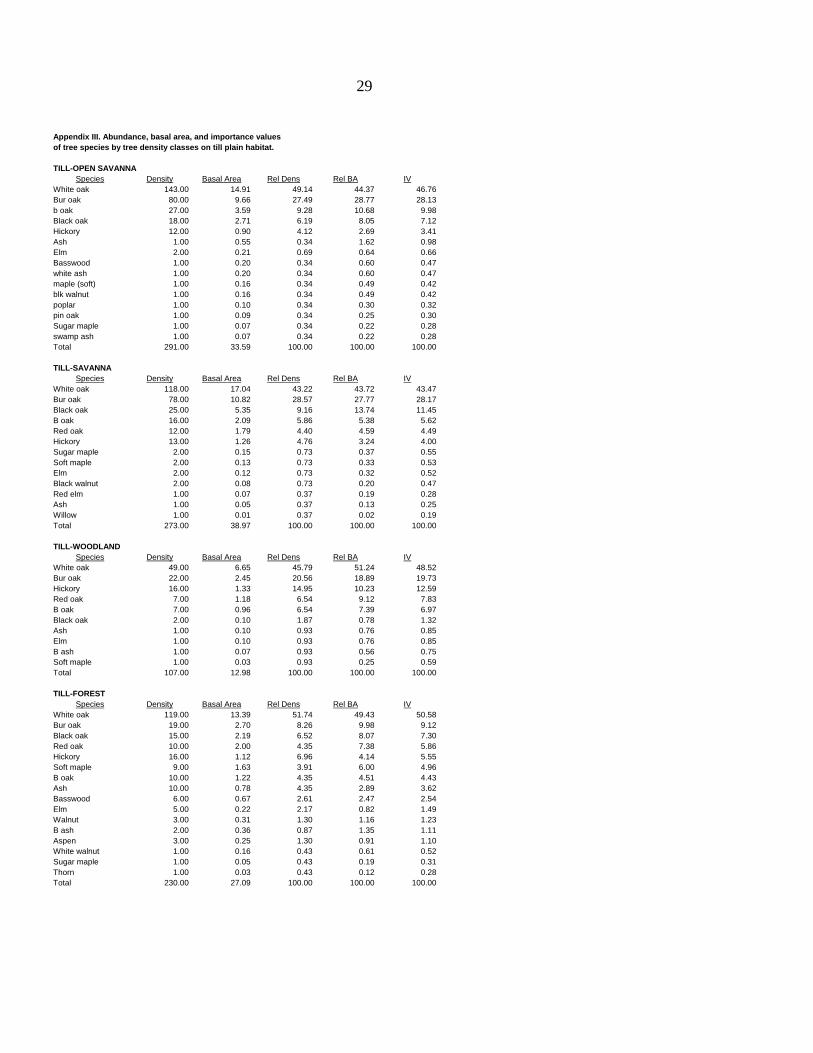
Appendix III. Abundance, basal area, and importance values of tree species by tree density classes on till plain habitat.
TILL-OPEN SAVANNA
Species Density Basal Area Rel Dens Rel BA IVWhite oak 143.00 14.91 49.14 44.37 46.76Bur oak 80.00 9.66 27.49 28.77 28.13b oak 27.00 3.59 9.28 10.68 9.98Black oak 18.00 2.71 6.19 8.05 7.12Hickory 12.00 0.90 4.12 2.69 3.41Ash 1.00 0.55 0.34 1.62 0.98Elm 2.00 0.21 0.69 0.64 0.66Basswood 1.00 0.20 0.34 0.60 0.47white ash 1.00 0.20 0.34 0.60 0.47maple (soft) 1.00 0.16 0.34 0.49 0.42blk walnut 1.00 0.16 0.34 0.49 0.42poplar 1.00 0.10 0.34 0.30 0.32pin oak 1.00 0.09 0.34 0.25 0.30Sugar maple 1.00 0.07 0.34 0.22 0.28swamp ash 1.00 0.07 0.34 0.22 0.28Total 291.00 33.59 100.00 100.00 100.00
TILL-SAVANNA
Species Density Basal Area Rel Dens Rel BA IVWhite oak 118.00 17.04 43.22 43.72 43.47Bur oak 78.00 10.82 28.57 27.77 28.17Black oak 25.00 5.35 9.16 13.74 11.45B oak 16.00 2.09 5.86 5.38 5.62Red oak 12.00 1.79 4.40 4.59 4.49Hickory 13.00 1.26 4.76 3.24 4.00Sugar maple 2.00 0.15 0.73 0.37 0.55Soft maple 2.00 0.13 0.73 0.33 0.53Elm 2.00 0.12 0.73 0.32 0.52Black walnut 2.00 0.08 0.73 0.20 0.47Red elm 1.00 0.07 0.37 0.19 0.28Ash 1.00 0.05 0.37 0.13 0.25Willow 1.00 0.01 0.37 0.02 0.19Total 273.00 38.97 100.00 100.00 100.00
TILL-WOODLAND
Species Density Basal Area Rel Dens Rel BA IVWhite oak 49.00 6.65 45.79 51.24 48.52Bur oak 22.00 2.45 20.56 18.89 19.73Hickory 16.00 1.33 14.95 10.23 12.59Red oak 7.00 1.18 6.54 9.12 7.83B oak 7.00 0.96 6.54 7.39 6.97Black oak 2.00 0.10 1.87 0.78 1.32Ash 1.00 0.10 0.93 0.76 0.85Elm 1.00 0.10 0.93 0.76 0.85B ash 1.00 0.07 0.93 0.56 0.75Soft maple 1.00 0.03 0.93 0.25 0.59Total 107.00 12.98 100.00 100.00 100.00
TILL-FOREST
Species Density Basal Area Rel Dens Rel BA IVWhite oak 119.00 13.39 51.74 49.43 50.58Bur oak 19.00 2.70 8.26 9.98 9.12Black oak 15.00 2.19 6.52 8.07 7.30Red oak 10.00 2.00 4.35 7.38 5.86Hickory 16.00 1.12 6.96 4.14 5.55Soft maple 9.00 1.63 3.91 6.00 4.96B oak 10.00 1.22 4.35 4.51 4.43Ash 10.00 0.78 4.35 2.89 3.62Basswood 6.00 0.67 2.61 2.47 2.54Elm 5.00 0.22 2.17 0.82 1.49Walnut 3.00 0.31 1.30 1.16 1.23B ash 2.00 0.36 0.87 1.35 1.11Aspen 3.00 0.25 1.30 0.91 1.10White walnut 1.00 0.16 0.43 0.61 0.52Sugar maple 1.00 0.05 0.43 0.19 0.31Thorn 1.00 0.03 0.43 0.12 0.28Total 230.00 27.09 100.00 100.00 100.00

30
Appendix IV. Abundance, basal area, and importance values of tree species by PLS vegetation types on lake plain habitat.
LAKE PLAIN - PRAIRIE
Species Density Basal Area Rel Dens Rel BA IVWhite oak 47.00 6.54 44.76 42.54 43.65Bur oak 19.00 3.99 18.10 25.97 22.03B oak 16.00 2.10 15.24 13.63 14.44Black oak 7.00 1.25 6.67 8.11 7.39Hickory 6.00 0.57 5.71 3.70 4.71Cottonwood 4.00 0.42 3.81 2.70 3.26White ash 2.00 0.33 1.90 2.14 2.02B ash 2.00 0.13 1.90 0.87 1.39Ironwood 1.00 0.03 0.95 0.21 0.58Pine 1.00 0.02 0.95 0.12 0.54Total 105.00 15.38 100.00 100.00 100.00
LAKE PLAIN - WETLAND
Species Density Basal Area Rel Dens Rel BA IVBlack oak 20.00 2.82 36.36 44.37 40.37White oak 9.00 1.17 16.36 18.33 17.35Willow 12.00 0.37 21.82 5.81 13.81Bur oak 4.00 0.75 7.27 11.86 9.57Red oak 2.00 0.69 3.64 10.76 7.20White ash 4.00 0.39 7.27 6.19 6.73Aspen 3.00 0.12 5.45 1.88 3.67Pine 1.00 0.05 1.82 0.80 1.31Total 55.00 6.36 100.00 100.00 100.00LAKE PLAIN - SCATTERING TIMBER
Species Density Basal Area Rel Dens Rel BA IVBur oak 17.00 2.40 36.17 40.06 38.11White oak 13.00 1.63 27.66 27.30 27.48Black oak 7.00 0.94 14.89 15.73 15.31White ash 6.00 0.71 12.77 11.85 12.31Elm 2.00 0.19 4.26 3.19 3.72Red oak 1.00 0.06 2.13 1.02 1.58Ash 1.00 0.05 2.13 0.85 1.49Total 47.00 5.99 100.00 100.00 100.00
LAKE PLAIN - TIMBER
Species Density Basal Area Rel Dens Rel BA IVWhite oak 164.00 22.55 21.66 29.30 25.48B oak 176.00 6.72 23.25 8.74 15.99Bur oak 99.00 13.02 13.08 16.92 15.00Black oak 94.00 13.03 12.42 16.93 14.67Red oak 35.00 4.69 4.62 6.09 5.36Elm 37.00 4.14 4.89 5.38 5.13Hickory 42.00 2.65 5.55 3.45 4.50Ash 40.00 2.82 5.28 3.66 4.47White ash 13.00 1.69 1.72 2.19 1.95Soft maple 12.00 1.77 1.59 2.30 1.94Basswood 14.00 1.18 1.85 1.53 1.69Aspen 9.00 0.82 1.19 1.07 1.13Cottonwood 7.00 0.57 0.92 0.74 0.83Walnut 4.00 0.25 0.53 0.32 0.42Swamp oak 1.00 0.46 0.13 0.59 0.36Sugar maple 3.00 0.25 0.40 0.32 0.36Hackberry 1.00 0.15 0.13 0.19 0.16Cedar 1.00 0.05 0.13 0.07 0.10Pine 1.00 0.04 0.13 0.05 0.09Cherry 1.00 0.03 0.13 0.04 0.09Pin oak 1.00 0.03 0.13 0.04 0.09Willow 1.00 0.03 0.13 0.04 0.09Ironwood 1.00 0.02 0.13 0.02 0.08Total 757.00 76.95 100.00 100.00 100.00

31
Appendix V. Abundance, basal area, and importance values of tree species by tree density classes on lake plain habitat.
LAKE PLAIN-OPEN SAVANNA LAKE PLAIN-WOODLAND
Species Density Basal Area Rel Dens Rel BA IV Species Density Basal Area Rel Dens Rel BA IVWhite oak 108 14.75 33.33 32.82 33.08 White oak 29 3.91 21.17 28.51 24.84Bur oak 55 9.01 16.98 20.05 18.51 Bur oak 28 2.49 20.44 18.14 19.29Black oak 57 8.60 17.59 19.13 18.36 Black oak 18 2.26 13.14 16.48 14.81B oak 42 5.11 12.96 11.37 12.16 Red oak 12 1.59 8.76 11.58 10.17Cottonwood 8 2.04 2.47 4.55 3.51 B oak 12 1.03 8.76 7.50 8.13White ash 9 1.18 2.78 2.62 2.70 Hickory 12 0.69 8.76 5.03 6.90Red oak 6 1.02 1.85 2.28 2.06 White ash 5 0.49 3.65 3.57 3.61Willow 9 0.36 2.78 0.80 1.79 Ash 5 0.24 3.65 1.75 2.70Aspen 8 0.46 2.47 1.03 1.75 Basswood 4 0.34 2.92 2.46 2.69Hickory 7 0.59 2.16 1.32 1.74 Elm 4 0.32 2.92 2.33 2.63Elm 2 0.47 0.62 1.05 0.83 Pine 2 0.09 1.46 0.67 1.06Basswood 3 0.20 0.93 0.45 0.69 Soft maple 1 0.16 0.73 1.20 0.96Ash 3 0.18 0.93 0.41 0.67 Cottonwood 2 0.04 1.46 0.27 0.86swamp oak 1 0.46 0.31 1.01 0.66 Cherry 1 0.03 0.73 0.24 0.48Soft maple 2 0.16 0.62 0.35 0.49 Ironwood 1 0.02 0.73 0.13 0.43Hackberry 1 0.15 0.31 0.33 0.32 Aspen 1 0.02 0.73 0.13 0.43birch 1 0.13 0.31 0.29 0.30 Total 137 13.70 100.00 100.00 100.00cedar 1 0.05 0.31 0.11 0.21 pine 1 0.02 0.31 0.04 0.17 LAKE PLAIN-FOREST Total 324 44.93 100.00 100.00 100.00 Species Density Basal Area Rel Dens Rel BA IV
White oak 48 5.93 19.92 20.24 20.08LAKE PLAIN-SAVANNA Bur oak 48 5.54 19.92 18.90 19.41
Species Density Basal Area Rel Dens Rel BA IV Elm 32 2.82 13.28 9.63 11.45White oak 71 10.10 29.46 34.50 31.98 Black oak 21 2.76 8.71 9.43 9.07Black oak 40 5.29 16.60 18.08 17.34 Ash 24 1.56 9.96 5.32 7.64Bur oak 28 4.21 11.62 14.37 13.00 B oak 23 1.16 9.54 3.95 6.75B oak 25 2.75 10.37 9.40 9.89 Hickory 19 1.31 7.45 4.92 6.18Red oak 15 2.13 6.22 7.26 6.74 Red oak 12 1.87 4.98 6.39 5.68Ash 11 1.02 4.56 3.48 4.02 Soft maple 7 1.21 2.90 4.13 3.52Hickory 11 0.76 4.56 2.60 3.58 Basswood 9 0.74 3.73 2.53 3.13White ash 8 0.84 3.32 2.87 3.10 White ash 4 0.70 1.66 2.38 2.02Elm 6 0.80 2.49 2.73 2.61 Cottonwood 3 0.46 1.24 1.59 1.41Willow 8 0.17 3.32 0.57 1.94 Aspen 1 0.29 0.41 1.00 0.71Aspen 5 0.31 2.07 1.04 1.56 sugar maple 1 0.11 0.41 0.39 0.40Soft maple 3 0.33 1.24 1.12 1.18 Walnut 1 0.07 0.41 0.25 0.33Cottonwood 2 0.18 0.83 0.62 0.72 Walnut 1 0.05 0.41 0.17 0.29Sugar maple 2 0.13 0.83 0.46 0.64 Willow 1 0.03 0.41 0.11 0.26Pine 2 0.08 0.83 0.26 0.54 Total 255 26.61 105.38 91.33 98.36walnut 1 0.07 0.41 0.25 0.33 blk walnut 1 0.05 0.41 0.17 0.29 Ironwood 1 0.03 0.41 0.11 0.26 pin oak 1 0.03 0.41 0.11 0.26 Total 241 29.28 100.00 100.00 100.00

32
Appendix VI. Percent presence and relative abundance of Linear cover of woody undergrowth in section line summaries of the Cook Co. Public Land Survey
Line Total % occur- Relative Line Total % occur- Relative TIMBER segments length rence abundance BARRENS segments length rence abundanceHazel 61 34943.13 36.17 20.78 bur oak 5 2874.01 81.67 57.64red oak 51 23623.92 24.45 14.05 blackoak 3 2111.81 60.01 42.36black oak 36 18494.64 19.14 11.00 Total 6 3519.02 141.68 100.00Oak 21 12264.07 12.69 7.29 None 17 12208.99 12.64 7.26 Hickory 17 10509.65 10.88 6.25 SCATTERING Line Total % occur- Relative Vines 20 8288.39 8.58 4.93 TIMBER segments length rence abundancewhite oak 10 7531.27 7.80 4.48 hazel 14 3643.01 48.30 28.14Willow 25 7023.28 7.27 4.18 red oak 7 2513.04 33.32 19.41Briers 21 6991.74 7.24 4.16 oak 6 1501.25 19.90 11.59Ash 3 2628.50 2.72 1.56 willow 2 1377.08 18.26 10.64Dogwood 4 2560.66 2.65 1.52 black oak 4 1318.51 17.48 10.18Prickleash 5 2450.52 2.54 1.46 hickory 3 920.28 12.20 7.11Basswood 2 2361.35 2.44 1.40 none 2 573.44 7.60 4.43Sugarmaple 3 2324.40 2.41 1.38 sumac 1 442.00 5.86 3.41all kinds 4 2066.80 2.14 1.23 aspen 1 338.55 4.49 2.61Pawpaw 4 1682.74 1.74 1.00 bur oak 1 131.69 1.75 1.02Elm 2 1649.22 1.71 0.98 pricklash 1 94.50 1.25 0.73black ash 1 1557.72 1.61 0.93 thorn 1 94.50 1.25 0.73b walnut 1 1557.72 1.61 0.93 Total 26 7542.94 171.66 100.00Thorn 7 1219.29 1.26 0.73 bur oak 6 1195.50 1.24 0.71 Line Total % occur- Relative Walnut 1 845.59 0.88 0.50 THICKETS segments length rence abundanceSwampdogwood 1 706.64 0.73 0.42 willow 1 315.23 15.38 13.99Grapevine 1 557.94 0.58 0.33 hazel 1 88.50 4.32 3.93Whortlebry 3 531.00 0.55 0.32 hickory 1 88.50 4.32 3.93Rose 2 238.00 0.25 0.14 vines 1 114.51 5.59 5.08pin oak 1 152.09 0.16 0.09 briers 1 114.51 5.59 5.08Total 187 96611.16 174.06 100.00 pawpaw 1 670.19 32.69 29.75 all kinds 1 861.62 42.03 38.24
Total 5 2050.05 109.90 100.00

33
Appendix VII. Upper: bearing and line tree species importance values in the Caldwell subdivision Lower: bearing tree species dbh (in cm) and corner distances (in meters) in the Caldwell subdivision. Tree density = 148.855 trees/ha for all species using an upper density limit of 400 trees/ha.
Species Density BA RD RBA IV Quercus alba 11.00 1.73 45.83 38.99 42.41 Quercus velutina 4.00 1.03 16.67 23.15 19.91 Juglans nigra 1.00 0.89 4.17 20.09 12.13 Acer saccharum 2.00 0.28 8.33 6.19 7.26 Populus deltoides 1.00 0.29 4.17 6.56 5.36 Carya 2.00 0.06 8.33 1.46 4.90 Ulmus sp 1.00 0.07 4.17 1.64 2.90 Tilia americana 1.00 0.07 4.17 1.64 2.90 Juglans cinera 1.00 0.01 4.17 0.28 2.23
24.00 4.45 100.00 100.00 100.00
Q1 Q2 Q3 Species DBH distance distance distance
Quercus velutina 8.00 340.00 Quercus alba 6.00 524.00
?? 10.00 34.00 Quercus alba 10.00 102.00
Ulmus sp 12.00 65.00 Carya 8.00 22.00
Quercus alba 5.00 50.00 Quercus alba 13.00 70.00 Quercus velutina 36.00 76.00
Juglans cinera 15.00 52.00 Tilia americana 12.00 50.00 Quercus velutina 9.00 7.00
Acer saccharum 12.00 13.50 Quercus velutina 20.00 48.00
Quercus alba 12.00 40.00 Quercus alba 12.00 34.00 Quercus alba 9.00 6.00 Quercus alba 15.00 121.00 Quercus alba 12.00 127.00 Quercus alba 18.00 162.00