ppt on svm
29
Damage identification based on vibration characteristics of a structures using Support Vector Machines • Introduction • Damage identification is a part of Structural health Monitoring (SHM) • Damage --- a change in structures' material/geometry/boundary conditions/members connectivity results in deviation of normal intended function of structure. • Most currently used damage identification methods comes under following categories: • Visual or localized experimental methods such as ACOUSTIC or ULTRASONIC METHODS,MAGNETIC FIELD METHODS,RADIOGRAPHY,EDDY-CURRENT METHODS (Doherty,1997). • Vibration-based methods and Acoustic emission methods. • Vibration-based damage identification is used in current project.
-
Upload
prashanth-shyamala -
Category
Documents
-
view
42 -
download
3
description
svm semester pppt
Transcript of ppt on svm

Damage identification based on vibration characteristics of a structures using Support Vector Machines
• Introduction• Damage identification is a part of Structural health Monitoring (SHM)
• Damage --- a change in structures' material/geometry/boundary conditions/members connectivity results in deviation of normal intended function of structure.
• Most currently used damage identification methods comes under following categories:• Visual or localized experimental methods such as ACOUSTIC or ULTRASONIC METHODS,MAGNETIC
FIELD METHODS,RADIOGRAPHY,EDDY-CURRENT METHODS (Doherty,1997).
• Vibration-based methods and Acoustic emission methods.
• Vibration-based damage identification is used in current project.

Contd..• Damage identification Methods are also classified on various criteria such as level of detection
provided, model based, non-model based, and linear or non-linear.
• Another classification system for damage-identification methods defines four levels ,as follows ( Rytter,1993)
• Level 1: Determining the presence of damage
• Level 2: level 1 plus location of damage in structure
• Level 3: level 2 plus quantifying severity of damage
• Level 4: level 3 plus assessing service life of structure
• MODAL PROPERTIES are function of physical properties of the structure (mass, stiffness, and damping).
• Primary modal properties used as indicators of damage : natural frequencies, mode shapes, damping factors.
• Other than these three, shifts in FRF’s peaks, curvature of mode shapes, transmissibility functions, mobility functions etc. are used based on their efficiency as an indicator of severity of damage.

Contd..
• When damage detection can be done till level 1, comes under forward problem which is typically modelling damage mathematically from a FEM model of structure, then measured frequencies are compared to the predicted frequencies to determine the damage.
• Level 2 and level 3 comes under inverse problem where location and assessment of the degree of damage using damage parameters such as frequency shifts, sensitivity, MAC, COMAC, curvature mode shapes, mode shape changes etc.,
• The damage detection reduces to some form of statistical pattern recognition problem(Doebling,1998)
• Whatever the method used to identify damage, utilizes the modal properties or their derivatives in some function form such as Frequency response function which is defined as the ratio of response of the structure(typically acceleration) to the excitation force applied on structure; transmissibility functions – ratio of two FRF’s corresponding to two different locations.
• Some methods use matrix updating techniques where structural model matrices are modified to reproduce the measured response from the data, thereby assessing damage and methods identifying nonlinear response due to cracks(fatigue) are also used.
• Some methods use just the measured data from physical model to assess damage and others use FEM model in addition to physical model
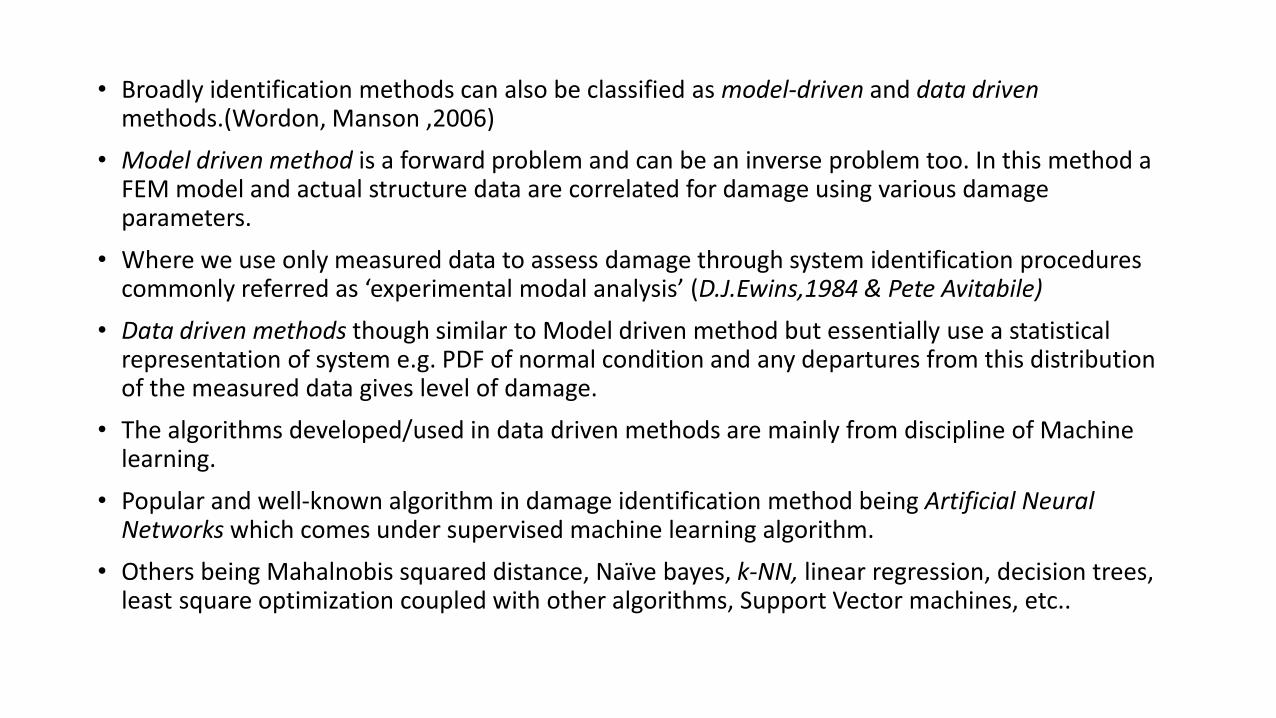
• Broadly identification methods can also be classified as model-driven and data driven methods.(Wordon, Manson ,2006)
• Model driven method is a forward problem and can be an inverse problem too. In this method a FEM model and actual structure data are correlated for damage using various damage parameters.
• Where we use only measured data to assess damage through system identification procedures commonly referred as ‘experimental modal analysis’ (D.J.Ewins,1984 & Pete Avitabile)
• Data driven methods though similar to Model driven method but essentially use a statistical representation of system e.g. PDF of normal condition and any departures from this distribution of the measured data gives level of damage.
• The algorithms developed/used in data driven methods are mainly from discipline of Machine learning.
• Popular and well-known algorithm in damage identification method being Artificial Neural Networks which comes under supervised machine learning algorithm.
• Others being Mahalnobis squared distance, Naïve bayes, k-NN, linear regression, decision trees, least square optimization coupled with other algorithms, Support Vector machines, etc..
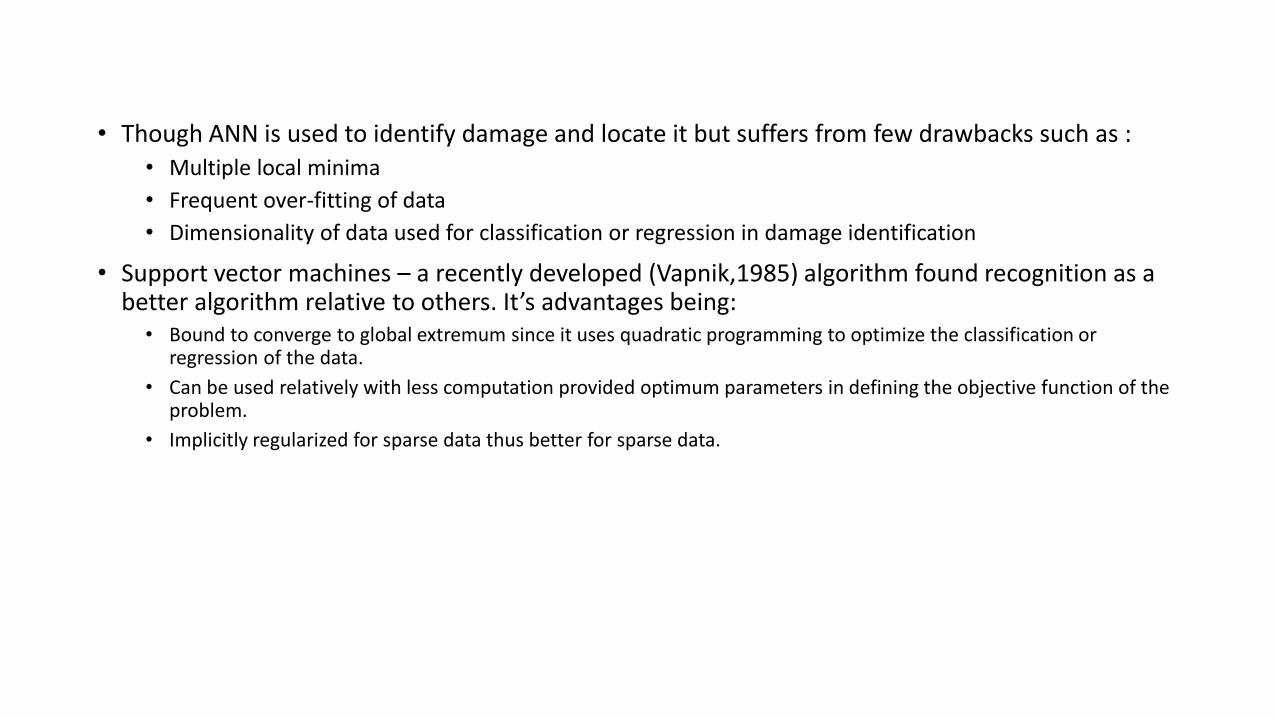
• Though ANN is used to identify damage and locate it but suffers from few drawbacks such as :• Multiple local minima
• Frequent over-fitting of data
• Dimensionality of data used for classification or regression in damage identification
• Support vector machines – a recently developed (Vapnik,1985) algorithm found recognition as a better algorithm relative to others. It’s advantages being:
• Bound to converge to global extremum since it uses quadratic programming to optimize the classification or regression of the data.
• Can be used relatively with less computation provided optimum parameters in defining the objective function of the problem.
• Implicitly regularized for sparse data thus better for sparse data.
Problem statement
• Identifying the damage till level 3 in a beam and plate.
• Here , Support Vector Machine algorithm is used for classification or regression of the data for identification and location and if possible to assess severity degree.
• Matlab is used for coding and externally available coding package for the algorithm is used–LIBSVM.

Literature Survey..1. A SUMMARY REVIEW OF VIBRATION-BASED DAMAGE IDENTIFICATION METHODS
By Scott W.Doebling, Charles R.Farar , and Michael B. Prime (1998) Shock and Vibration Digest,30(2):91-105.
This paper describes methods that use change in modal properties(i.e. modal frequencies, modal damping ratios, and mode shapes) to infer change in mechanical properties and application of these methods to various problems in engineering structures.
Briefly, the review considers two kinds of methods used by researchers till that time. First method only considers change in modal properties and the other considers both Modal properties and FEM model in formulation. No Light on Statistical procedure/non-parametric based methods(like neural networks ,.) and nonlinear response based methods.
it reviews on methods that utilize mode shapes,modeshape curvature, dynamically measured flexibility in a structure and updating structural model parameters.
The paper states that many methods perform poorly when number of measurement locations is limited.

2. DAMAGE LOCATION USING VIBRATION MODE SHAPES.
by Salawu OS and Williams C (1994) . In: Proceedings of the SPIE, vol.2251, Proceedings of the 12th International Modal analysis Conference, 933–941.
The paper uses the mode shapes as damage indicator and used to identify location of damage as these mode shapes are sensitive to local damage.
The greatest change in mode shapes occur around defect as opposed to natural frequencies where similar defects at various positions induce the same amount of frequency change.
The sensitivity based approaches require significant amount of computation for large structures which is disadvantage.
The author verifies the applied methods of using mode shape curvature and mode shape relative difference method using MAC and COMAC against the measured data from a cantilever steel beam and

3. A NUMERICAL STUDY OF THE EIGEN PARAMETERS OF A DAMAGED CANTILEVER
by M.M.F. Yuen ,Journal of Sound and Vibration (1985) 103(3),301-310
the author utilizes the shift in Eigen values and Eigen vectors as a means of determining the damage location. The change in eigen values and eigen vectors follows a definite trend in relation to the location and the extent of damage. A numerical FEM model of cantilever beam where damage is simulated by reductions of elasticity modulus.
4. DAMAGE DETECTION FROM CHANGES IN CURVATURE MODE SHAPES
by A.K.Pandey,M.Biswas and M.M.Samman , Journal of Sound and Vibration (1991) 145(2),321-332.
Similar to the above paper, the author uses curvature modes shapes as a damage indicating parameter and location identifier . Finite Element Analysis was used to obtain the displacement mode shapes of considered simply-supported beam and a cantilever beam.
5. DAMAGE DETECTION USING THE FREQUENCY-RESPONSE-FUNCTION CURVATURE METHOD
by R.P.C Sampaio and N.M.M. Maia and J.M.M. Silva , Journal of Sound and Vibration(1999) 226(5),1029-1042.
FRF’s are used for first 3 levels of the process of damage detection without need of FEM model. The main theme being no usage of modal analysis in identifying mode shapes/frequencies.

6. Damage identification using support vector machines.
by Worden K & Lane AJ (2001) ,SMART MATERIALS & STRUCTURES, 10(3), 540-547.
Support vector machines have recently been established as a powerful tool for classification and regression problems. Their use in the field of damage identification is illustrated here with reference to two problems which can be naturally cast in terms of classification. The first is a fault classification problem for ball bearings and the second looks at locating damage within a framework structure. The performance is compared to more established means of engineering pattern recognition.
The overall conclusion here is that the SVM may be of considerable value in engineering classification problems.
7. DAMAGE IDENETIFICATION IN ALUMINIUM BEAMS USING SUPPORT VECTOR MACHINE: NUMERICAL AND EXPERIMENTAL STUDIES.
by Satish B.Satpal,Anirban Guha and Sauvik Banerjee, Structural control and health monitoring (2015) DOI:10.1002/stc.1773
Cantilever beam used to verify the application of SVM to problem of damage detection with noisy and noise-free data. Numerical and experimental studies have been performed. It is shown that SVM is capable of predicting damage locations with a good accuracy.

8. The application of machine learning to structural health monitoring
by Keith Worden and Graeme Manson, Philosophical transactions of Royal Society (2007) 365,515 537 DOI:10.1098/rsta.2006.1938
Objective of paper is to illustrate the usage of data-driven approaches using machine learning algorithm to damage identification by a case studies. If there is significant availability of data to train the model using svm then these machine learning algorithms can be applied with great effect on damage identification problems.
9. The application of machine learning to structural health monitoring
by Keith Worden and A J Lane ,Smart Materials and Structures.(2001) Vol 10.540-547.Institute of Physics Publishing
Introduction to svm and case studies conducted to compare svm against other machine learning techniques such as MLP neuralnetworks, radial basis function neural networks.
9. Tutorial Notes on Structural Dynamics and Experiment Modal Analysis
by Pete Avitabile, Modal analysis and control labs, University of Massachusetts Lowell.
10. Experimental Modal Analysis, by D.J.Ewins.

11. Damage Detection and identification in smart structures using SVM and ANN
by Farooq M,Zheng H,Nagabhushana A,Roy S,Burkett S,Barkey M,Kotru S,Sazonov E. Society of Photo-Optical Instrumentation Engineers (SPIE) Conference Series 2012;8346
• ` In this paper a technique for the detection of transverse embedded cracks in composite materials is presented. Static strain measurements made at predefined sensor locations under varying loading conditions are shown to provide a good feature vector. A comparison between SVM an d ANN as classifier is given in this paper. Our results suggest that for this particular application SVM models may have better prediction performance than ANN.

Data acquisition system(Pulse Lab
Shop)
Data processing system
FFT algorithm
Frequency Response Functions
Further Processing of FRF data using
Me’Scope Software
Curvefitting options to get modal parameters
Now the obtained modal parameters are used as feature vectors for SVM
training /testing
Experimental Modal analysis flow-chart

Basic theory behind Support vector machine algorithm
• This is a statistical technique that seeks to separate two classes of data using a hyperplane (i.e. a straight line in two dimensions ).
• The points are called feature vectors
• Suppose that the two classes of data are linearly separable as shown infigure below:
• Fig a) Arbitrary separating hyperplane
• Fig b) Optimal separating hyperplane

Suppose the hyperplane equation is 𝐷( 𝑥 ) = 𝑤 , 𝑥 = 0 , where 𝑥 represents each feature vector
Where < ~, ~ > is a Euclidean scalar product then the separation condition is given by
𝑥𝑘 ∈ 𝐶1→ 𝐷(𝑥𝑘) = 𝑤 , 𝑥 ≥ 1, (constraints)
𝑥𝑘 ∈ 𝐶2 → 𝐷(𝑥𝑘) = 𝑤 , 𝑥 ≥ 1, where C1 and C2 are two classes ,
More concisely,
𝐷 𝑥𝑘 = 𝑦𝑘 𝑤 , 𝑥 ≥ 1,
It is easy to show that the distance of each point 𝑥𝑘 in the training set from the separating hyperplane is 𝐷 𝑥𝑘 | 𝑤 | . Now tau(𝜏) is the margin/ interval containing the region of hyperplane but excluding
the training points. If𝑦𝑘 𝐷(𝑥𝑘)
| 𝑤 |> 𝜏 ∀ 𝑘

• Note that the parameterization of the hyperplane is currently arbitrary. This can be fixed by specifying
||w|| 𝜏 = 1
It is now clear that maximizing the margin will place the hyperplane at the furthest point from the data and this can be accomplished by minimizing ||w|| subject to constraints as described previously.
An appropriate objective function is
𝑄(𝑤 ) = 1
2|| w ||^2 -- 𝑖=1
𝑁 𝛼𝑖𝑦𝑖( < 𝑤 , 𝑥𝑖 > -- 1)
• 𝛼𝑖 are lagrange multipliers
• The resulting optimization problem is solved by quadratic programming which is a convex problem. The parameter 𝑤 are expressed in terms of 𝛼𝑖 using the Kuhn-tucker conditions, which leads to dual formulation,
𝜕𝑄
𝜕𝑤= 0 → 𝑤= 𝑖=1
𝑁 𝛼𝑖𝑦𝑖
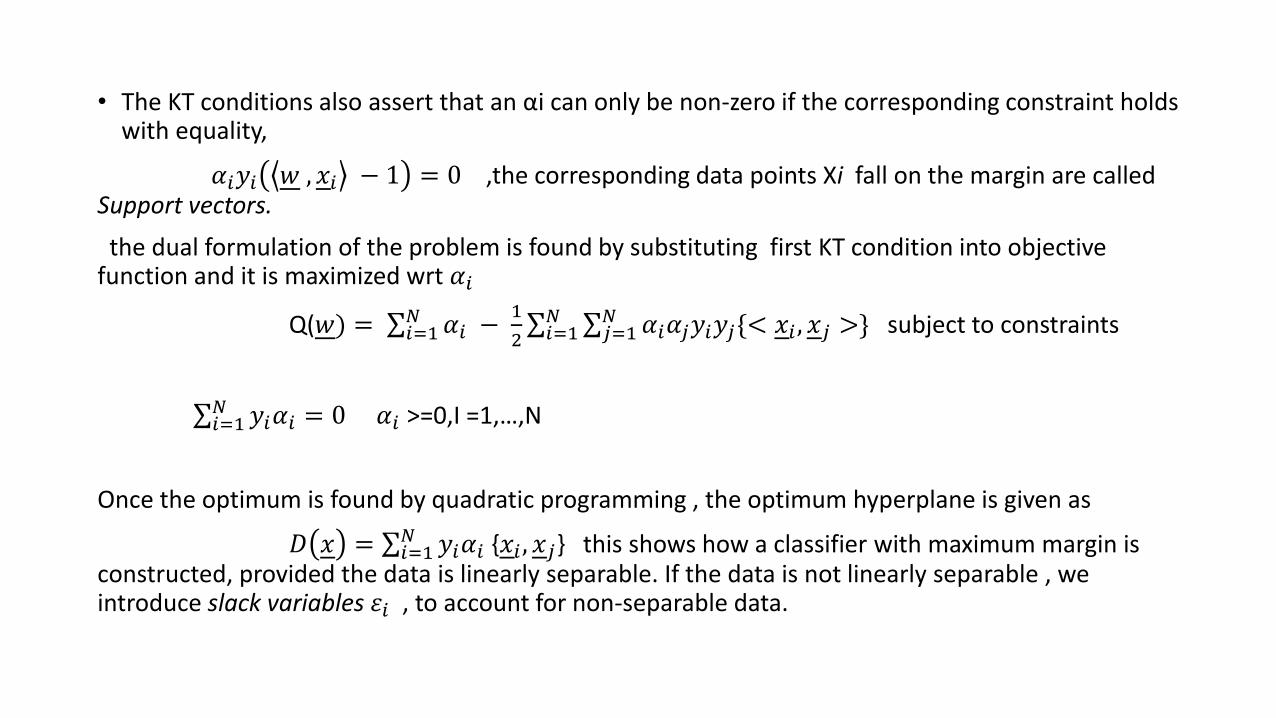
• The KT conditions also assert that an αi can only be non-zero if the corresponding constraint holds with equality,
𝛼𝑖𝑦𝑖 𝑤 , 𝑥𝑖 − 1 = 0 ,the corresponding data points Xi fall on the margin are called Support vectors.
the dual formulation of the problem is found by substituting first KT condition into objective function and it is maximized wrt 𝛼𝑖
Q(𝑤) = 𝑖=1𝑁 𝛼𝑖 −
1
2 𝑖=1
𝑁 𝑗=1𝑁 𝛼𝑖𝛼𝑗𝑦𝑖𝑦𝑗{< 𝑥𝑖 , 𝑥𝑗 >} subject to constraints
𝑖=1𝑁 𝑦𝑖𝛼𝑖 = 0 𝛼𝑖 >=0,I =1,…,N
Once the optimum is found by quadratic programming , the optimum hyperplane is given as
𝐷 𝑥 = 𝑖=1𝑁 𝑦𝑖𝛼𝑖 {𝑥𝑖 , 𝑥𝑗} this shows how a classifier with maximum margin is
constructed, provided the data is linearly separable. If the data is not linearly separable , we introduce slack variables 𝜀𝑖 , to account for non-separable data.

• A set data can be classified into two classes by a line for 2D cases and by a hyperplane (in higher dimensions) for multi classification.
• This hyperplane being an objective function which is at the maximum distance in space from the nearest points to it throughout the sample data is solved by quadratic programming or SMO (sequential minimal optimization) is used to classify data.
• In our context, the data being classified whether from damaged or undamaged cases or location of damage if there is damage in structure using regression.
• A Popular Matlab code– LIBSVM for this Support vector machine algorithm which is made available online by researchers Chih-Chung Chang and Chih-Jeh-Lin is used throughout the analysis.

WORK DONE TILL NOW..
1. A cantilever beam idealized as Mass-Spring-Damper system of 5-DOF is used for analytical study.
• A code has been written to evaluate its frequencies and eigen vectors in Matlab.
• The five natural frequencies form a set {w1,w2,w3,w4,w5} which is called feature vector
• The damage is simulated by reducing the stiffness in steps of 9% for training data and 12% for testing data.
• The data is obtained in five sets where each set contains another 5 sets of natural frequencies for reduction in stiffness of 5 levels i.e. 9%,18%,27%,36%,45% which totals to 25 data training points.
• Similarly for testing data the reduction in stiffness is multiples of 12% is used to test svm model accuracy.
• Labels were given to the training data (1,2,3,4,5) to map the corresponding natural frequencies to the stiffness reduction in the story. A plot showing the variation in natural frequencies over the reduction in stiffness for each story.

Training data – natural frequencies variation
M5
M4
M3
M2
M1
C5
C4
C3
C2
C1
K5
K4
K3
K2
K1
5 DOF MASS-SPRING DAMPER SYSTEM used for deriving frequency
Mass being sameFor all storiesM= 1 x 10^6 kg
Stiffness being same for all storiesK=2.8147*10^7 N/m

• The SVM model parameters are used for Radial basis function are C=8.0 and gamma=0.5
• The below figure shows the output prediction of the trained model against test data.
• The probability output is satisfactory and model predicted accurately.

0.345154
0.438215
0.515090.570783
0.610564
0
0.1
0.2
0.3
0.4
0.5
0.6
0.7
Pro
bab
ility
est
imat
es
of
MO
DEL
% Stiffness reduced in Storey 5
Model prediction probability estimates as the reduction in stiffness increases in fifth storey
12 24 36 48 60
Fig 1.This is typical prediction values from the trained SVM model.

• NUMERICAL STUDY – FEM MODEL OF CANTILEVER BEAM
• The Numerical FEM model of the cantilever beam is replicated for damaged condition by introducing a groove to simulate damage in the beam and observed the variation natural frequency shifts wrt to the degree of severity of the damage.
• The depth of groove was increased for each simulation.
• The dimensions of the cantilever beam are (steel material properties)
• L=100 cm B=5 cm D=2 cm dimensions of groove ( 2mm x 2mm)
• The beam is modelled using shell elements S4R
• Beam is divided into 4 zones for convenience

Variation in natural frequencies due to damage in zone1( groove depth 1,2,4,8,6,12,16 mm)

Variation in natural frequencies due to damage in zone2( groove depth 1,2,4,8,6,12,16 mm)

• Experimental Modal analysis done on cantilever beam in structural lab in order to learn modal testing and how to extract modal parameters using PulseLabShop and Me’Scope software's from the Frequency Response Functions obtained through Data Acquisition system.
• L=100cm
• B=5cm
• D=0.6cm

• The modal properties obtained through the experiment are :
• Natural frequencies:
Natural Frequencies (Hz)
Damping Factors(%)
6.74 10
48.77 8
134.93 3
186 2.2
256 5
260 2
318 4

• The mode shapes obtained from Me’Sope software are:
Future work
• This SVM methodology will be extended for the damage detection for composite beams and plate type structure.(GFRP sheets)
• Performance comparison of Artificial neural Networks and Support Vector Machines for the composites.