PP ODA Phil Paper
23
SOME IMMEDIATE ISSUES IN OFFICIAL DEVELOPMENT ASSISTANCE TO THE PHILIPPINES * 1. Helping in countries and sectors unattractive to private investment and that cannot borrow commercially, EDUARDO C. TADEM Developing countries like the Philippines have long relied on Official Development Assistance (ODA), or “foreign aid” to finance economic development. In the fifties and early sixties, ODA was used primarily for rehabilitation and institutional development, was provided by the United States, and consisted mainly in grant assistance (ILO 1976). ODA provided 10 percent of foreign exchange and one percent of GNP during these two decades. The organization of the Consultative Group on the Philippines in 1971 dramatically increased the role of foreign aid and commitments during 1971-74 were "larger than the total committed during the preceding 20 years." It now accounted for 14 percent of the country's foreign exchange requirements. The composition and source of aid also changed from grants to loans and from bilateral to multilateral. Later, Japan took over from the US as the country's primary source of bilateral ODA. ODA is an attractive source of development funds in that interest rates for loans are lower than commercial rates, have longer terms and longer grace periods, and usually are geared for projects that would otherwise not attract private capital. The availability of grant assistance (which need not be repaid) also adds to ODA's attraction. The Zedillo Commission (2001) notes that despite the large sums of private capital available in the international market to fuel a country's investment needs, ODA will continue to play an important role in four areas: 2. Humanitarian interventions, 3. Providing and maintaining supply of global public goods such as peace, health and environmental concerns, and 4. Responding to financial crises. In this regard, the Commission urged industrial countries to implement "the target of providing ODA equal to 0.7% of their GNP." Two criteria must guide ODA allotments: (2) a country's depth of poverty and (2) sound government policies that address poverty. * Revised version of a paper presented at the National Consultation on Financing for Development: Civil Society Agenda Building, sponsored by Social Watch Philippines, 13-15 August 2001, SEAMEO-Innotech Bldg., Quezon City. The author is Associate Professor of Asian Studies, University of the Philippines.
-
Upload
socialwatchphilippines -
Category
Documents
-
view
214 -
download
0
description
Â
Transcript of PP ODA Phil Paper

SOME IMMEDIATE ISSUES IN OFFICIAL DEVELOPMENT ASSISTANCE
TO THE PHILIPPINES*
1. Helping in countries and sectors unattractive to private investment and that cannot borrow commercially,
EDUARDO C. TADEM
Developing countries like the Philippines have long relied on Official Development Assistance (ODA), or “foreign aid” to finance economic development. In the fifties and early sixties, ODA was used primarily for rehabilitation and institutional development, was provided by the United States, and consisted mainly in grant assistance (ILO 1976). ODA provided 10 percent of foreign exchange and one percent of GNP during these two decades. The organization of the Consultative Group on the Philippines in 1971 dramatically increased the role of foreign aid and commitments during 1971-74 were "larger than the total committed during the preceding 20 years." It now accounted for 14 percent of the country's foreign exchange requirements. The composition and source of aid also changed from grants to loans and from bilateral to multilateral. Later, Japan took over from the US as the country's primary source of bilateral ODA. ODA is an attractive source of development funds in that interest rates for loans are lower than commercial rates, have longer terms and longer grace periods, and usually are geared for projects that would otherwise not attract private capital. The availability of grant assistance (which need not be repaid) also adds to ODA's attraction. The Zedillo Commission (2001) notes that despite the large sums of private capital available in the international market to fuel a country's investment needs, ODA will continue to play an important role in four areas:
2. Humanitarian interventions, 3. Providing and maintaining supply of global public goods such as peace, health and
environmental concerns, and 4. Responding to financial crises.
In this regard, the Commission urged industrial countries to implement "the target of providing ODA equal to 0.7% of their GNP." Two criteria must guide ODA allotments: (2) a country's depth of poverty and (2) sound government policies that address poverty.
* Revised version of a paper presented at the National Consultation on Financing for Development: Civil Society Agenda Building, sponsored by Social Watch Philippines, 13-15 August 2001, SEAMEO-Innotech Bldg., Quezon City. The author is Associate Professor of Asian Studies, University of the Philippines.

Tadem / 2
A. DEFINITIONS AND POLICIES ODA refers to the flows to the country bestowed in the form of loans (bilateral or multilateral), grants and technical assistance or cooperation with the aim of facilitating economic development in the recipient-country. Provisions found in the Official Development Assistance Act of 1996 define the Philippine government's official position on crucial ODA issues and concerns. Some of the more pertinent ones are:
Section 2a. (… ODA is a loan or loan and grant which) … "must be administered with the objective of promoting sustainable social and economic development and welfare of the Philippines." Section 4. "The proceeds of ODA shall be used to achieve equitable growth and development in all provinces through priority projects for the improvement of economic and social service facilities taking into account such factors as land area, population, scarcity of resources, low literacy rate, infant mortality and poverty incidence in the area: Provided that rural infrastructure, countryside development and economic zones established under the PEZA law shall be given preference in the utilization of ODA funds." Section 4a and 4b. "ODA shall not be availed of or utilized directly or indirectly for "projects mandated primarily by law to be served by the private sector" and "financing for private corporations with access to commercial credit. … The NEDA shall ensure that the ODA obtained shall be for previously identified national projects which are urgent and necessary." Section 11c "In the hiring of consultants, contractors, architects, engineers, and other professionals necessary for a project's implementation, Filipinos shall be given preference." Section 11d. "In the purchase of supplies and materials, preference shall be given to Filipino suppliers and manufacturers, so long as the same shall not adversely alter or affect the project, and such supplies and materials are to the standards specified by the consultants, contractors, … connected with the projects."
ODA has a very extensive impact for the Philippines where the government faces an endemic serious budget deficit. Its impact is not only limited to the projects per se but has a wider effect on the strategic national economic policies of the recipient-country. With regard to Japanese ODA, the following trends have been reported as early as 1994 (Hirono 1994):
1) Quantitative increases: a long-term of volume increases in US dollar terms may not continue into the 21st
2) Terms and conditions: continuing efforts for increasing the volume of grant assistance as percentage of total ODA.
century, with ups and downs in Japan's ODA as percentage of GNP.
3) Regional allocation: continued predominance of bilateral ODA, with a steady decline in bilateral ODA going to developing Asian and Pacific countries
Tadem / 3
4) Sectoral allocation: gradual decline of bilateral ODA going to economic infrastructures, with a reverse trend for that going to social sectors and program assistance
5) Technical cooperation: growing importance of technical cooperation 6) Aid through NGOs: steady increase in assistance through NGOs.
The Japanese government had starting in 1994 adopted an ODA policy based on the "three types of balance:" (1) balance between physical infrastructure and economic infrastructure, (2) balance "between material aid and human or institutional aid or the development of human resources," and (3) balance between "large-scale projects and small-scale (grassroots) projects" involving NGOs and other voluntary groups (Tsuda and Elbo 2001). Side by side with these considerations is a strong bias for recipient countries that promote market-oriented economic changes and reforms. Japanese ODA is of course a foreign policy tool of the Tokyo government and is used in place of a buildup of military capability. The understanding is that "Japan's national interests will be served in the long-term and in a comprehensive sense to cover a variety of perspectives including political, economic, social and cultural considerations" (Tsuda and Elbo, 2001). This exploratory paper attempts to examine immediate issues in official development assistance to the Philippines in the light of the above state policy pronouncements and announced shifts in donor policies. For the latter, while the observed donor shifts refer specifically to Japanese ODA, given the dominant role played by Japan in both bilateral and multilateral assistance and the positive impact that such shifts could generally result, they will be used as a yardstick to evaluate other donor countries as well. This study will not deal with the more substantial and long-range issues that have been exhaustively and adequately discussed in the critical literature on ODA in general and on ODA in the Philippines in particular. These refer to among others
1. the development paradigm espoused by ODA donors and its favored recipients, 2. the role of ODA with respect to investments, trade, and strategic issues, 3. the role of ODA and foreign donors in the direction and thrust of national policies, and, 4. whether a country should even utilize external assistance in funding development projects.
B. THE DISTRIBUTION OF ODA IN THE PHILIPPINES Total ODA committed from 1987 to 2000 amounted to US$26.8 billion. Of this, 41% was contributed by multilateral institutions while bilateral contributions shared 59%. Loans constituted 94.57 percent of multilateral ODA and only 5.43 percent were in the form of grants. On the other hand, 78.43 percent of bilateral assistance was in the form of loans, with only 21.57% in grants.

Tadem / 4
TABLE 1. TOTAL ODA COMMITTED TO THE PHILIPPINES, 1986-2000 (in US$Million, By Source)
SOURCE TOTAL LOANS GRANTS Multilateral 1. ADB 5,167.13 5,092.65 74.48 2. IBRD/WB 6,162.70 6,131.60 31.10 3. EU 310.20 ------ 310.20 4. UN System 230.04 ------ 230.04 5. Others 24.60 24.60 ------- Subtotal 11,894.47 11,248.85 645.82 Bilateral 1. Japan 12,649.36 11,206.24 1,443.32 2. US 1,255.94 173.30 1,082.64 3. Germany 605.74 392.24 168.71 4. France 499.35 489.73 9.62 5. Australia 457.34 171.43 285.91 6. Canada 297.20 15.40 281.86 7. Spain 237.96 219.43 18.53 8. UK/GB 168.81 194.21 29.40 9. Italy 117.10 75.00 42.15 10. Brunei 100.00 100.00 -------- 11. Others 348.30 89.23 167.90 Subtotal 16,737.10 13,126.21 3,530.04 TOTAL 28,631.57 24,375.06 4,175.86
Source for basic data: NEDA Public Investment Staff Of total ODA from 1987-2000, 85.42% was in the form of loans and only 14.58 percent was in grant form. Among the multilaterals, the World Bank is the largest provider with 52 percent. ADB is next with 43 percent. Total WB and ADB exposure is 95 percent. Among bilateral donors, Japan leads with 75.6% of total ODA. The US is a far second with only 7.5%. An even more distant third is Germany with a mere 3.6%. Japan's share of total bilateral loans of 85.4% is greater than its share of total bilateral ODA. Its share of grant assistance on the other hand is only 41%. Of total Japanese assistance, 89 percent is in the form of loans and only 11 percent are in the form of grants and technical assistance. The reverse is true with the US on the other hand, with American assistance consisting of 86% grants and only 14 percent in loans.

Tadem / 5
Japan has been the world's top ODA donor since 1991. This includes both bilateral aid and contributions to multilateral institutions such as the Asian Development Bank (ADB). The Philippines has been the third largest recipient country of Japanese ODA (after Indonesia and China) for the past ten years Time Trends in ODA to the Philippines In absolute terms, ODA commitments to the Philippines dropped from US$14.4 billion in the seven year period from 1987-1993 to only US$13.3 billion in the 1994-2000 period, a decline of 8.3 percent. In 1987 to 1993, of total ODA, the share of loans was 82.47 percent while the share of grants was 17.53%. In the next seven-year period from 1994 to 2000 however, the share of loans rose to 88.58 % while grants fell to 11.42 percent. Among the multilaterals, loans accounted for 96 percent of ODA from 1987 to 1993 but decreased somewhat to 91.5 percent in the period 1994-2000. ADB assistance consisted of 98.5 percent loans in both the two periods (1987-1993 and 1994-2000). As for the World Bank, it registered loan shares of 99.3 percent for 1987-1993 and 100 percent for 1994-2000. What accounts for the slightly decreased share of multilateral loans vis a vis grants was the 48 percent increase in grant contributions from the UN System and the European Union from US$214 million to US$317 million. ODA from the two are exclusively in the form of grants. Unfortunately, they account for only 3 percent of multilateral assistance. For both the ADB and WB, total assistance decreased by 80% between the two periods from US$6.75 billion (1987-1993) to US$3.75 billion (1994-2000). The WB decreased its assistance by 175 percent while ADB cut its aid by 26 percent. For bilateral ODA, loans accounted for 68.36 percent in 1987-1993 but ballooned to 87.29 percent in the 1994-2000 period. Grant assistance fell from 31.64 percent to 12.7 percent between the two periods. For the biggest donor, Japan, while it increased its total ODA by 55.5 percent, this took place entirely in the arena of loans where the increase was 73 percent. Grants on the other hand decreased by 48 percent. The share of Japanese loans to total ODA thus increased from 82 percent in the 1987-1993 period to 93 percent in the 1994-2000 period.
TABLE 2. TIME TRENDS IN ODA COMMITMENTS TO THE PHILIPPINES, 1987-2000 (In US$ million)
1987-1993 1994-2000 Source Total Loans Grants Total Loans Grants Multilateral 1. ADB 2,704.28 2,664.50 39.8 2,143.53 2,111.35 32.80 2. WB 4,407.70 4,376.20 31.3 1,604.40 1,604.40 ------- 3. UN 81.50 ------- 81.5 140.82 ------- 140.82 4. EU 133.30 ------- 133.30 176.93 ------- 176.93
Tadem / 6
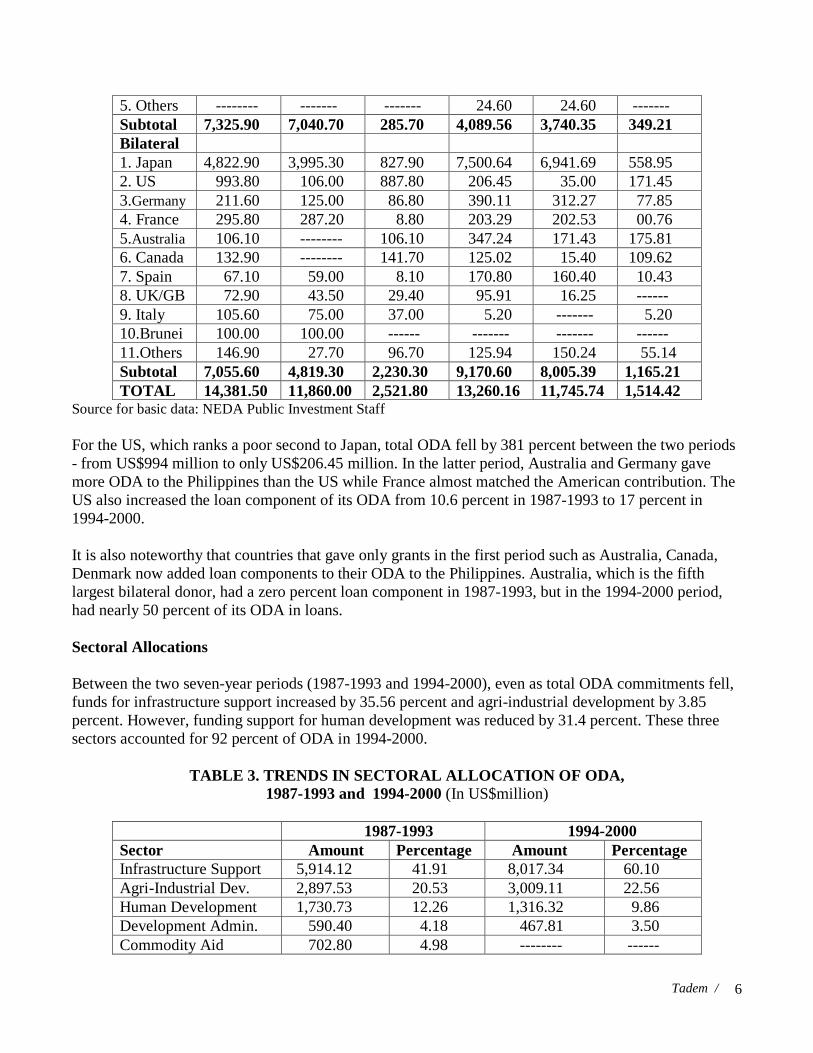
5. Others -------- ------- ------- 24.60 24.60 ------- Subtotal 7,325.90 7,040.70 285.70 4,089.56 3,740.35 349.21 Bilateral 1. Japan 4,822.90 3,995.30 827.90 7,500.64 6,941.69 558.95 2. US 993.80 106.00 887.80 206.45 35.00 171.45 3.Germany 211.60 125.00 86.80 390.11 312.27 77.85 4. France 295.80 287.20 8.80 203.29 202.53 00.76 5.Australia 106.10 -------- 106.10 347.24 171.43 175.81 6. Canada 132.90 -------- 141.70 125.02 15.40 109.62 7. Spain 67.10 59.00 8.10 170.80 160.40 10.43 8. UK/GB 72.90 43.50 29.40 95.91 16.25 ------ 9. Italy 105.60 75.00 37.00 5.20 ------- 5.20 10.Brunei 100.00 100.00 ------ ------- ------- ------ 11.Others 146.90 27.70 96.70 125.94 150.24 55.14 Subtotal 7,055.60 4,819.30 2,230.30 9,170.60 8,005.39 1,165.21 TOTAL 14,381.50 11,860.00 2,521.80 13,260.16 11,745.74 1,514.42
Source for basic data: NEDA Public Investment Staff For the US, which ranks a poor second to Japan, total ODA fell by 381 percent between the two periods - from US$994 million to only US$206.45 million. In the latter period, Australia and Germany gave more ODA to the Philippines than the US while France almost matched the American contribution. The US also increased the loan component of its ODA from 10.6 percent in 1987-1993 to 17 percent in 1994-2000. It is also noteworthy that countries that gave only grants in the first period such as Australia, Canada, Denmark now added loan components to their ODA to the Philippines. Australia, which is the fifth largest bilateral donor, had a zero percent loan component in 1987-1993, but in the 1994-2000 period, had nearly 50 percent of its ODA in loans. Sectoral Allocations Between the two seven-year periods (1987-1993 and 1994-2000), even as total ODA commitments fell, funds for infrastructure support increased by 35.56 percent and agri-industrial development by 3.85 percent. However, funding support for human development was reduced by 31.4 percent. These three sectors accounted for 92 percent of ODA in 1994-2000.
TABLE 3. TRENDS IN SECTORAL ALLOCATION OF ODA, 1987-1993 and 1994-2000 (In US$million)
1987-1993 1994-2000 Sector Amount Percentage Amount Percentage Infrastructure Support 5,914.12 41.91 8,017.34 60.10 Agri-Industrial Dev. 2,897.53 20.53 3,009.11 22.56 Human Development 1,730.73 12.26 1,316.32 9.86 Development Admin. 590.40 4.18 467.81 3.50 Commodity Aid 702.80 4.98 -------- ------

Tadem / 7
Integrated Area Dev. 327.00 2.31 272.10 2.03 Disaster Mitigation ------- ------ 256.79 1.92 Others 1,949.60 13.81 0.80 0.00 TOTAL 14,111.86 100.00 13,341.04 100.00
Source for basic data: NEDA Public Investment Staff Note: For 1994-2000, commodity aid has probably been reclassified under agri-industrial development. Infrastructure support includes transportation, water resources, energy, power and electrification, communications, and social infrastructure. Agriculture and industrial development includes agriculture, agrarian reform, cooperatives, environment, and natural resources, industry, trade and tourism, science and technology. Human development includes education and manpower development, housing, health and nutrition, social welfare and community development. Development administration funds go for policy and institutional reforms and development, public and urban city administration, policy sector studies and formulation, national development plan formulation, sound governance. The share of infrastructure support funds increased from 41.91 percent to 60.10 percent between the two periods. Agricultural and industrial development also increased their share from 20.53 percent to 22.56 percent. Human development however saw its share fall from 12.26 percent to 9.86 percent. In terms of subsectors, transportation has the biggest allocation with 26.46 percent, followed by agriculture with 20.20 percent. Third is energy, power, and electrification with 14.39 percent, fourth is water resources with 12.25 percent. Environment and natural resources is fifth with a 5.82 percent share. Notable laggards are agrarian reform (1.8%), science and technology (0.16%), cooperatives (0.0004%), housing (?), social welfare and community development (0.15%), and social infrastructure (0.0004%). The absence for allocations for housing in the official NEDA reports is surprising as it is well-known that the World Bank has been providing support for the government's housing programs.
TABLE 4. DISAGGREGATED SECTORAL ODA ALLOCATIONS, 1994-2000 (In US$ million)
Sector Amount % Share 1. Infrastructure Support 8,017.34 a. Transportation 3,530.70 26.46% b. Water Resources 1,634.49 12.25% c. Energy, Power, Electrification 1,919.81 14.39% d. Communications 135.48 1.01% e. Social Infrastructure 0.60 0.00% 2. Agri-Industry 3,009.11 a. Agrarian Reform 240.80 1.80% b. Agriculture 2,694.25 20.20% c. Cooperatives 0.56 0.00% d. Environment & Natural Resources 776.66 5.82% e. Industry, Trade and Tourism 591.75 4.43% f. Science and Technology 20.90 0.16% 3. Human Development 1,316.32

Tadem / 8
a. Education and Manpower Development 551.27 4.13% b. Housing -------- ------ c. Health, Nutrition and Family Planning 283.75 2.12% d. Social Welfare and Com. Development 20.53 0.15% e. Others (not disaggregated for 1994-96) 460.77 3.45% 4. Others 996.70 a. Development Administration 467.81 3.50% b. Disaster Mitigation 256.79 1.92% c. Integrated Area Development 272.10 2.03% TOTAL 13,341.04 100.00%
Source for basic data: NEDA Public Investment Staff Note: disaggregated subsectoral figures for 1987-1991 were not available. The figure for agrarian reform appears understated as the Department of Agrarian Reform (DAR) reports total ODA of US$365.46 million as of December 31, 2000. In any case, ODA for agrarian reform consist entirely in support services (for physical infrastructure and human development). Under the tenure of then DAR Secretary Horacio R. Morales (1998-2001) government policy advisers lobbied informally with foreign donors such as the World Bank to support the land acquisition component of the program in order to speed up the land redistribution but the response has not been encouraging. The reason given is that this would not fall under the category of "public investment" and would furthermore distort land markets. There seems to be a misplacement of the category of "social infrastructure" which (insignificant though it may be) should probably be classified under "human development." C. PROBLEM ISSUES ODA as External Debt ODA's share of the country's external debt stands at 47.7 percent as of CY 2000. Though this represents a decline from the 1999 share of 51.1 percent, the average share of ODA over the thirteen-year period from 1988 to 2000 is a high 51 percent. The highest level was in 1994 at 60 percent and the lowest was in 1988 with 41.5 percent. The continued weakening of the Philippine peso is cause for worry as far as debt payments are concerned. It has been revealed that a depreciation by one peso of the Philippine currency against the US dollar results in an increase in interest payments on the foreign debt by PhP1.15 billion annually (Phil Daily Inquirer, 16 July 2001). Last year's government projections on interest payments of PhP48.92 billion were based on an exchange rate of PhP42 to the dollar. For 2001, assuming a 52:1 rate, the actual interest rate payments would reach PhP59.7 billion. Even at 50:1, interest payments would still cost PhP57.4 billion.

Tadem / 9
TABLE 5. ODA AS SHARE OF EXTERNAL DEBT, 1988-2000 (in US$billion)
Year Amount % Share
1988 11.6 41.5 1989 12.3 44.5 1990 16.0 55.9 1991 16.1 53.6 1992 18.4 57.4 1993 16.6 46.6 1994 23.2 60.0 1995 20.4 51.8 1996 22.1 52.7 1997 21.9 48.3 1998 25.0 52.2 1999 26.7 51.1 2000 25.0 47.7
Source: Department of Finance World Bank loans command an interest rate that hovers around 6.94%, a "pool-based variable rate" that is determined every six months. The maturity period is 20 years with a grace period of five years. Additional charges include a 0.75% commitment fee that is charged on the undrawn balance. The larger the undrawn balance the larger the commitment fee. There is also a one-percent "front-end fee." Thus for the US$217 million in total World Bank loans to the country in 1999 alone, the Philippine government was saddled with annual interest payments of US$15.1 million and a front-end fee of $2.17 million. For the year 2000, commitment charges for undisbursed WB loans of US$1.2 billion total US$9 million alone. ADB loans accessed from the bank's Ordinary Capital Resources (OCR) are pegged at 6.7% for dollar loans, 5.5% for multi-currency loans (pool-based as in WB loans). Maturity and grace periods are the same as WB's. The 0.75% commitment fee is paid annually on the undisbursed portion of the loan based on a disbursement schedule (15% of TPC for 1st year, 45% for 2nd year, 85% for 3rd year, 100% for 4th year). For the year 2000, commitment fees for undisbursed ADB loans of US$544million amount to US$4 million alone. Japanese bilateral loans coursed through the Japan Bank for International Cooperation (JBIC), formerly the Overseas Economic Cooperation Fund (OECF), have interest rates of 2.3 percent, maturity period of 30 years and a grace period of 10 years. The Obuchi/Special Yen Loan has a one percent interest rate and the same maturity and grace periods. German loans are pegged at only 0.75% interest, Italy charges one percent, France, one percent for soft loans, Austria 4-5%, and there is a so-called OECD consensus rate that is followed in the case of loans from the UK, Spain, Canada, and Korea. On the other hand, Belgium, Finland and Norway do not charge interest.
Tadem / 10
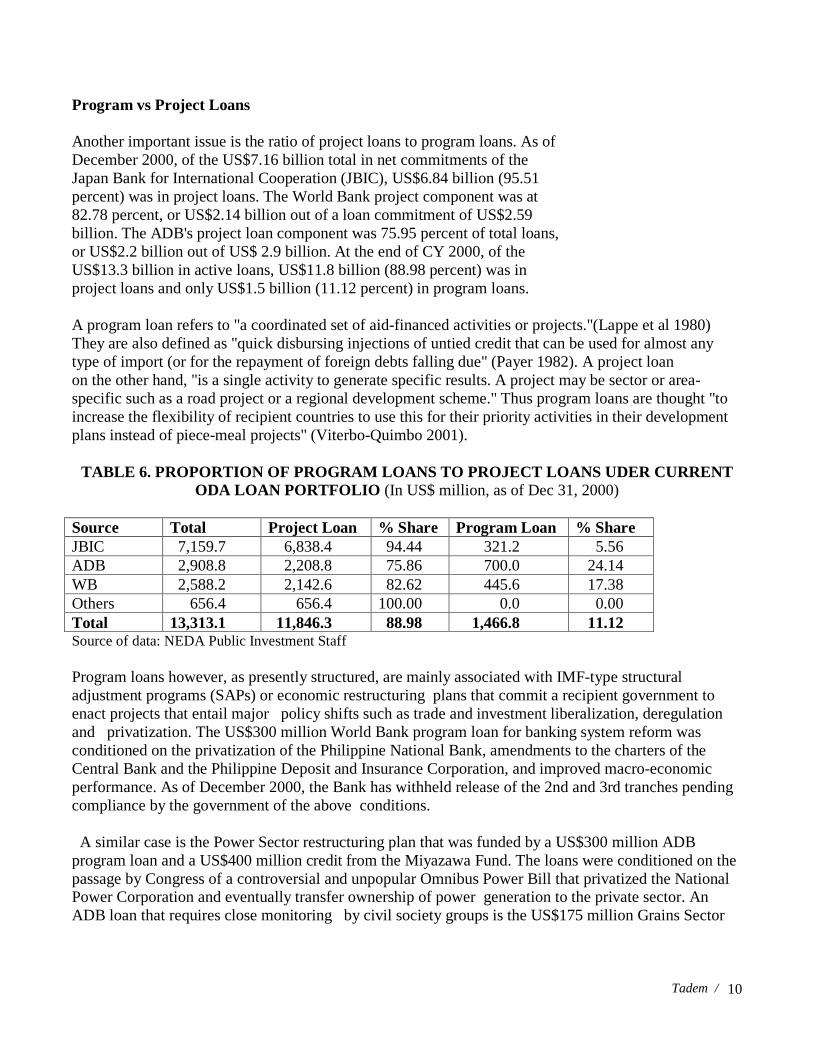
Program vs Project Loans Another important issue is the ratio of project loans to program loans. As of December 2000, of the US$7.16 billion total in net commitments of the Japan Bank for International Cooperation (JBIC), US$6.84 billion (95.51 percent) was in project loans. The World Bank project component was at 82.78 percent, or US$2.14 billion out of a loan commitment of US$2.59 billion. The ADB's project loan component was 75.95 percent of total loans, or US$2.2 billion out of US$ 2.9 billion. At the end of CY 2000, of the US$13.3 billion in active loans, US$11.8 billion (88.98 percent) was in project loans and only US$1.5 billion (11.12 percent) in program loans. A program loan refers to "a coordinated set of aid-financed activities or projects."(Lappe et al 1980) They are also defined as "quick disbursing injections of untied credit that can be used for almost any type of import (or for the repayment of foreign debts falling due" (Payer 1982). A project loan on the other hand, "is a single activity to generate specific results. A project may be sector or area-specific such as a road project or a regional development scheme." Thus program loans are thought "to increase the flexibility of recipient countries to use this for their priority activities in their development plans instead of piece-meal projects" (Viterbo-Quimbo 2001).
TABLE 6. PROPORTION OF PROGRAM LOANS TO PROJECT LOANS UDER CURRENT ODA LOAN PORTFOLIO (In US$ million, as of Dec 31, 2000)
Source Total Project Loan % Share Program Loan % Share JBIC 7,159.7 6,838.4 94.44 321.2 5.56 ADB 2,908.8 2,208.8 75.86 700.0 24.14 WB 2,588.2 2,142.6 82.62 445.6 17.38 Others 656.4 656.4 100.00 0.0 0.00 Total 13,313.1 11,846.3 88.98 1,466.8 11.12 Source of data: NEDA Public Investment Staff Program loans however, as presently structured, are mainly associated with IMF-type structural adjustment programs (SAPs) or economic restructuring plans that commit a recipient government to enact projects that entail major policy shifts such as trade and investment liberalization, deregulation and privatization. The US$300 million World Bank program loan for banking system reform was conditioned on the privatization of the Philippine National Bank, amendments to the charters of the Central Bank and the Philippine Deposit and Insurance Corporation, and improved macro-economic performance. As of December 2000, the Bank has withheld release of the 2nd and 3rd tranches pending compliance by the government of the above conditions. A similar case is the Power Sector restructuring plan that was funded by a US$300 million ADB program loan and a US$400 million credit from the Miyazawa Fund. The loans were conditioned on the passage by Congress of a controversial and unpopular Omnibus Power Bill that privatized the National Power Corporation and eventually transfer ownership of power generation to the private sector. An ADB loan that requires close monitoring by civil society groups is the US$175 million Grains Sector

Tadem / 11
Development Program (approved in April 2000) that is meant to restructure the grains sector and make it more "market-based, productive and internationally competitive." Not all program loans are of the above types however. The World Bank program loan for "Environment and Natural Resources Sectoral Adjustment" resulted in the passage of the National Integrated Protected Areas (NIPAS) Act of 1992 which mandated the decentralization of the monitoring and enforcement of biodiversity conservation in designated protected areas throughout the country. This is done through an area-based and multi-stakeholder-constituted Protected Area Management Board (PAMB). Implementing mechanisms however leave much to be desired as the DENR continues to dominate the process. The NIPAS law also needs to be harmonized with other existing laws such as the Indigenous People's Rights Act (IPRA). Low Loan Availment Availment rates characterize the absorptive capacity of the government with regard to contracted ODA funds. Technically, it is defined as the cumulative actual disbursements as a percentage of scheduled disbursements. For CY 2000, NEDA reports an undrawn amount of US$8.4 billion, or 63% of the total ODA commitments of US$13.3 billion. This was an increase over the 1999 total undrawn amount of US$7.7 billion and is accounted for by the signing of 15 new loans in 2000.
TABLE 7. PHILIPPINE ODA LOAN DISBURSEMENTS AND AVAILMENTS (1988-2000)
Year Disbursements (In US$Million)
Availment Rates (Percentage)
1988 852 79 % 1989 978 82 % 1990 1,386 84 % 1991 1,033 77 % 1992 1,660 79 % 1993 1,747 81 % 1994 1,195 78 % 1995 1,299 76 % 1996 1,368 79 % 1997 1,300 74 % 1998 1,136 66 % 1999 840 62 % 2000 995 63 %
Source: NEDA By sector, the integrated area development component had the lowest availment rate of 15% followed by human development component with 54%. Next is infrastructure support with 57 percent availment rate followed by industry and services with 67 percent. The highest availment rate was credited to development administration with 100 percent followed by the agriculture, natural resources and agrarian reform component with 85 percent.

Tadem / 12
Of the US$8.4 billion in undrawn funds, US$7.9 billion (or 95%) of these were accounted for by the World Bank, ADB, and JBIC alone. Undrawn JBIC funds totaled US$4.92 billion (58.6%), World Bank - US$1.19 billion (14.2%), and ADB - US$1.1 billion (13.3%). The Department of Education, Culture, and Sports (DECS) nearly lost a PhP12 billion loan for public high schools from the World Bank and the JBIC for hardly using the funds available to it. Under former Secretaries Ricardo Gloria and Andrew Gonzalez, the DECS only used US$318,908 of the total over three years while the government had to pay PhP70 million in commitment fees. (Philippine Daily Inquirer, 13 July 2001). Among the ODA sectors, education had an availment rate of only 43%. The Department of Health's (DOH) World Bank-funded Urban Health and Nutrition Project had disbursed only US$28.8 million of the US$47.2 million ODA funds for a utilization rate of only 61 percent. Its original completion schedule of December 1999 has been revised to December 2000 but was reported to be still uncompleted as of the new deadline. The above are by no means the worst cases. Several projects have availment rates ranging from 0.0 percent to only 11 percent. In Table 8 below are some samples of such projects with extremely low utilization rates.
TABLE 8: ODA PROJECTS WITH LOWEST AVAILMENT RATES As of Dec. 31, 2000
Source/Project
Net Commit-ment, US$m
Disburse-ment, US$m
Undrawn balance US$m
Utiliza-tion Rate, %
World Bank 1. DPWH National Roads Proj 150.0 6.50 143.5 4.3 2. MWSS 2nd 48.0 Manila Sewerage Proj 2.10 45.9 4.4 3. DECS 3rd 93.3 Elem Sch Proj 10.20 83.1 10.9 4. SBMA Freeport Proj 60.0 5.10 54.9 8.5 5. DA Mindanao Rural Dev Proj 27.0 1.90 25.6 7.0 6. DOF Com-based Resource Man. 50.0 3.20 46.8 6.4 Japan Bank for Int'l Coop (JBIC) 1. NPC Luzon Grid 132.5 5.46 127.04 4.0 2. DPWH / MM Flood Control 83.3 5.86 77.42 7.0 3. DECS 3rd 98.4 Elem Sch Proj 10.61 87.81 11.0 4. PNOC Negros Geothermal 128.0 0.00 128.00 0.0 ADB 1. DILG/ Clark Area Mun. Project 24.3 0.10 24.10 0.4 2. NPC Power Trans Reinforcement 191.4 1.90 189.50 1.0 3. SBMA/ Municipal Dev. Proj 19.4 0.20 19.20 1.0 Source of basic data: NEDA Cost and Time Overruns
Tadem / 13
The government has spent about PhP8 billion more than the estimated cost of projects implemented with funding from concessional loans or ODA money from multilateral institutions in 2000. In that year, ODA disbursements reached US$995 million (about PhP49.75 billion). A total of 14 projects accounted for the overrun (Business World, 6-7 July 2001) A total 54 ODA loans for 51 projects (27% of the portfolio) are on an extended implementation period as of Dec. 2000 with an average delay of 2 years based on the original dates of closure. Most projects are designed for a ten-year implementation tenure but some projects extend to over 10 years. These twin problems seem to be recurring over the years. During the 1st ODA Portfolio Review in 1993, implementation delays were reported for 8 major infrastructure projects with a net commitment of P8.1 billion. Some of these projects have been delayed for as long as four years due to unresolved right-of-way problems. Start-up problems ranging from 3 months to 3 years were also noted for 30 projects due to delays in the awarding of bids and contracts. Cost overruns were also reported for 14 projects with increased costs ranging from 12% to 202% of the original estimates. According to the 1994 Review, the inability of government to fully support ODA projects in its regular budget caused a shortfall of P57 billion or 44% of the required amount. These shortfalls caused delays in project implementation. In the 1995 Review, 49 projects were projected to suffer cost increases totaling P37 billion. These increases are usually funded by additional external funding from the same donors. In 1996, the cost overruns for 37 projects amounted to P36.2 billion. In 1997, cost overruns fell drastically to only P2.3 billion but affected 27 projects. However, 42 projects exceeded their implementation deadlines. In 1998, cost overruns for 22 projects totaled P16.82 billion while 20 loans suffers delays of from 3 months to 3 years. Lack of Counterpart Funding Some ODA projects have difficulty getting off the ground due to the delays in the release of counterpart funds on the part of the Philippine government. Some donors require more counterpart funding that is greater than the ODA component. The DECS 3rd Elementary School Project has been delayed due to the difficulty experienced by local government units (LGUs) in raising the 10% counterpart fund for the school building component despite the reduction in the counterpart requirement from the previous 25%. With half of the project time already passed, 90% of the funds remains to be utilized. LGUs however are not the only culprits when it comes to inability to raise counterpart fund. In the 1999 General Appropriations Act, only P34 billion was allotted for ongoing foreign assisted projects, short of the P38 billion required. The Philippine government expects to limit its approval next year of foreign-assisted projects (FAPs) from the Asian Development Bank following the regional bank's plan to require bigger counterpart funding from the Philippines. The ADB plans to make the government shoulder 60% of ADB-funded projects effective in 2002 with the bank financing only 40% of projects through loans. The present sharing arrangement is 50-50.
Tadem / 14
ADB Philippine Country Director Gunter Henker said increasing the government's counterpart aims to (1) improve FAP implementation, and (2) provide more ODA to "poorer" countries like Vietnam, Laos, and Cambodia. Economists however criticized the move calling it "poor timing" that "will hurt government projects which are already suffering implementation delays due to existing budgetary constraints." Less and less projects will be created in the pipeline. It was surmised that Mr. Hecker may be unhappy with the poor loan disbursements which tie up large funds. (Business World, 3 July 2001). The ADB had US$1.1 billion in unutilized ODA funds for the Philippines as of December 31, 2000 (see above). Debt Passing by Private Sector Partners In an issue of NEDA's DevMagazine (Jul-Aug 1998), a partnership between the government and the private sector was envisioned as a viable alternative for financing infrastructure projects financed by ODA. This partnership is to be based on a market-based "user-pays" principle. The Build-Operate-Transfer (BOT) scheme is one of the forms that this public sector-private sector partnership is to take. The partnership is really three-way if one counts the ODA donors themselves. The aim is to redistribute the risks, costs, and revenues in relation to development projects. Financially viable components of a project can be funded by private or commercial funds while the non-financially viable components will make use of ODA funds. The NEDA magazine cites the following examples of ODA-assisted projects supporting BOT-financed projects: 1. Casecnan Multipurpose Project, US$128million, OECF 2. San Roque Multipurpose Project, US$400 million, Japan ExIm Bank 3. San Pascual Multipurpose Project, US$45 million, ADB 4. Power Transmission Lines, Ilijan Natural Gas Proj., US$129 million, OECF The biggest project under the scheme however is the Metro Rail Transit which began implementation under the Ramos administration by a consortium led by Fil-Estate Corp. under Presidential buddy (Ramos' and later, Estrada's) Robert Sobrepena. The partnership behind these projects however requires what is known as "sovereign guarantees," that is, the government promises to assume liabilities incurred by the private sector partners that the latter (for whatever reason) is unable to pay. These debts (whether settled or passed on to the state) thus become "contingent liabilities" of government and become part of the consolidated public sector deficit (Phil Daily Inquirer, 16 Jul 2001). Total contingent liabilities of government stand at PhP62.58 billion in 60 power projects, 24 transport projects, 3 water projects, 11 other minor projects. Of the PhP217 billion in contingent liabilities for 2001, PhP12.03 billion (5.5%) have become actual debts which the government has to pay. The biggest of these debt burdens passed on by the private sector to the government are the Metro Rail Transit (P3.4 billion, P1.08 billion in interest payments alone), the San Roque Multipurpose Project (P2.95 billion in assumed debts), and the Casecnan Multipurpose Project (P1.69 billion in loans). As far as the Metro Rail project was concerned, "government was forced to pay these debts because the returns
Tadem / 15
the Metro Rail Transit was counting on to pay them did not materialize because of risks that the Ramos administration said would not happen." The legal basis for the sovereign guaranty clause could possibly be traced to the Foreign Borrowings Act of 1966 (Republic Act 4860) which was signed into law by then President Ferdinand Marcos on September 8, 1966. Section 3 of the Act states that
The President of the Philippines is … authorized in behalf of the Republic of the Philippines, to guarantee … foreign loans extended directly to … corporations owned or controlled by the Government of the Philippines for industrial, agricultural and other development purposes or projects authorized by law (including) those incurred … for the purpose of relending to the private sector (emphasis supplied).
The Act however stipulates that only Filipino-owned or controlled corporations and partnerships may avail of such foreign loans and the sovereign guaranty privelege attached to them. Section 5 requires the President to report to Congress "the amount of loans, credits, and indebtedness contracted, as well as the guarantees extended and the purposes and projects for which the loans, credits, and indebtedness were incurred and the guarantees extended as well as such loans which may be reloaned to Filipino-owned or controlled corporations …" Tied and Untied ODA This issue has been raised often by critics of ODA. Many of the benefits accruing to the lenders are derived from the conditions attached to or arising from the use of ODA funds. Tied loans require the receiving country to acquire most, if not all, the technical assistance, equipment or supplies from the donor country. Many years ago, a NEDA Deputy Director General revealed that Japan for example earned from 75 cents to 95 cents for every dollar of aid it gives in the form of goods and services purchased by the recipient country in relation to aid projects. This is particularly true for grant assistance that sees Japanese firms actively lobbying for and being favored for conduct of feasibility studies, consultancies and engineering projects. A 1986 study by two Japanese professors showed that 90 percent of Japanese commodity loans was used to purchase Japanese goods (Tsuda and Yokoyama 1986). Thus private business interests in the donor-country especially large transnational corporations (TNCs) accrue much profit in their involvement in ODA-financed projects in underdeveloped countries. Big business is closely linked to ODA projects. From 1966 to 1999, ADB awarded US$20.1 billion in contracts to companies from donor countries for projects in various ADB-member countries. US and Japanese private companies "have between them won ADB contracts worth more than all ADB lending to the 13 least developed countries in the region" (Violeta Corral, 2001). Tying loans and grants has dire consequences to the sustainability of projects. Equipment maintenance is especially difficult and human resource training is sometimes lacking.

Tadem / 16
In the case of untied ODA, biases for donor-countries still remain in areas such as hiring of consultants from the donor-country or the use of donor-country standards in the acquisition of equipment and other project requirements. This takes place for instance when Japanese consultants are hired by Japanese donor agencies, e.g., JICA, and they in turn "specify the use of Japanese goods and equipment or recommend Japanese industrial standards." Untying aid is supposedly a global trend but this is not the case with Japan whose long-running economic downturn forces government to exert extra efforts in assisting its suffering business community. There is also an admission that "ODA cannot be implemented without the active participation of the Japanese business sector" as a 1999 government medium-term policy on ODA declared "the intention to consider increased opportunities for Japanese business to participate in ODA" (Tsuda and Elbo 2001). Geographical Distribution Temario Rivera (2000) observes that "the regional distribution of OECF yen loans shows a highly disproportionate allocation on the basis of major island groupings and regions on the basis of poverty incidence. Data up to 1995 show that the poorest island groupings and regions also received the least loan assistance from the OECF." Half of all loans went to the Luzon island-group with the Visayas getting 20 percent and Mindanao "where three of the poorest regions are situated and a population almost equal to the Visayas, a measly 5 percent." In terms of administrative regions, the area with the lowest poverty incidence, Metro Manila, got the highest share with 15 percent of all Japanese loans. In second place was Central Visayas (11 percent) which hosts the nation's second largest metropolitan area, Cebu. Rivera (2000) further notes that "the region with the highest poverty incidence, Bicol, received only 5 percent of total yen allocations" while "another 5 percent of total yen loans went to the next three poorest regions, Central Mindanao, the Cordillera Autonomous region, and Northern Mindanao." The above situation violates the provisions of the ODA Act of 1996 which, as cited earlier, mandates the use of ODA for the equal development and growth of all provinces and with attention to areas that are resource poor and are characterized by low levels of human development and high poverty incidence. Exceptions were noted however during the Marcos regime when Imelda Marcos' home province, Leyte in the Visayas, "received a disproportionately large share, 16 percent of the total (excluding commodity loans). This was more than the project loans that went to the Metro Manila region proper which received only 9 percent of the total." Two other favored provinces during the Marcos administration were Cagayan (home province then Defense Minister Juan Ponce Enrile and Ilocos Norte (Marcos' own home province). "These three areas alone accounted for close to one-third (27 percent) of the total OECF-funded projects during the Marcos period." Foreign Consultants Back in 1989, the Senate Blue Ribbon Committee complained of "superfluous and unnecessary fees" to foreign consultants of foreign-funded projects. The Committee decried that the charging of foreign

Tadem / 17
consultancy fees for services well within the expertise of Filipinos is being imposed on all foreign assistance contracts, grants, aids, and loans. It was discovered then that of the 59 consultants in five government agencies looked into, only five were Filipinos. While the highest paid Filipino consultant received $780 a month, the lowest paid consultant, a Japanese "motor vehicle inspector," got $3,000 a month. Several foreign consultants received monthly fees ranging from $5,000 to $16,700. And this was in 1989! Several years later in the mid-1990s, the situation seemed to have worsened. In 11 government agencies, there were 68 Japanese consultants hired under grant projects funded by the Japan International Cooperation Agency (JICA). In the OECF-funded Calaca Phase II coal-fired power plant, $5.5 million of the project's $6.7 million environmental management went to Japanese consultancy fees. How far things have changed since then in the consultancy game remains to be seen but provisions in recent legislation are important to note. Aside from Section 11c of the ODA Act of 1996 (mentioned a the beginning of the paper), the Implementing Rules and Regulations of the same law states in Section 6.2:
Filipino Preference/Association by Foreign Firms with Local Firms/Practitioners. In order to develop/upgrade a pool of Filipino experts and managers, the role of technology transfer in the implementation of development projects shall be ensured. To effect technology transfer to local firms/individuals, foreign consulting and/or construction firms wishing to participate in development projects in the Philippines shall be required to associate themselves with local firms and/or shall be required to engage Filipinos in carrying out the projects which they have selected to undertake. Such preference shall not adversely the project and shall meet the minimum standards/specifications required thereof.
The above is echoed by the "Implementing Rules and Regulations on the Procurement of Consulting Services for Government Projects," as approved by the NEDA Board, Sept. 1998 as follows:
"2.5.2 In order to manifest trust and confidence in and promote the development of Filipino consultancy, Filipino Consultants shall be hired whenever the services required for the project are within the expertise and capability of Filipino Consultants. However, in the event that the Filipino Consultants do not have the sufficient expertise and capability to render the services required under the project, Foreign Consultants may be hired, provided that in the interest of effecting technology transfer, Foreign Consultants shall be required to associate themselves with Filipino Consultants."
Other Issues Corruption. Shortly after the downfall of Marcos, two Japanese scholars Gus Yokoyoma and Mamoru Tsuda, sifted through thousands of pages of PCGG documents that had been confiscated by US Customs authorities from the dictator as he arrived in Hawaii in Feb. 1986. The two uncovered an intricate web of corruption involving the payment of huge sums to Marcos and his cronies in the form of rebates, or commissions, for the facilitation of the implementation of yen loan projects.

Tadem / 18
These funds were "embezzled" from loan proceeds and may have constituted as much as 25 percent to 30 percent of loan contract amounts. The payments were made by Japanese companies who had won contracts to implement the ODA projects. Since Japanese companies regard the payment of commissions, or rebates, as "normal procedure in ordinary commercial transactions" and are known worldwide for such practices, it stands to reason that such activities continue unabated till today. Environmental and Social Issues. Some ODA-funded activities, particularly large infrastructure and energy projects, constitute hazards to the ecological balance of the area. Displacement of communities from their homes and sources of livelihoods has also taken place. Productive agricultural lands are also jeopardized in the process. Social unrest sometimes accompanies ODA projects particularly if the local communities in affected areas resist their implementation. Some of these environmentally controversial projects are:
(1) the OECF-funded 400-hectare Leyte Industrial Development Estate which housed a copper smelter plant, a fertilizer plant, and a mining firm;
(2) the Calabarzon Industrial Zone whose master plan was funded by a JICA grant; (3) the MWSS Umiray River Diversion Project funded by ADB; (4) the Pampanga Delta Development Project, again funded by the OECF; and (5) various infrastructure projects in Manila financed by OECF.
Impact on Macro Economic and Social Indicators. Citing an econometric study by Mapalad, Tecson (2001) avers that Japanese ODA had exerted a positive impact on the Philippine economy. She cites the following percentages of actual values: real income: 0.83%, employment: 0.36%, exports: 0.49%, and imports: 0.41% for the 1973-1995 period. To the layman however, considering the tens of billions of dollars funneled into the economy in the period covered by the above study, such figures are hardly impressive. It might also be worthwhile to look into the net impact of ODA given the social and environmental costs as well as the drain on the Philippine treasury caused by interest payments, cost overruns, sovereign guarantees, and commitment fees. Tecson herself admits that when compared with other Southeast Asian countries, Mapalad's positive figures "paled in comparison" as the table reproduced from the latter's study shows. TABLE 9: COMPARISON OF THE IMPACT OF JAPAN'S ODA IN SELECTED SOUTHEAST
ASIAN COUNTRIES (as percentage of actual values)
Country Real Income Employment Exports Imports Indonesia* 3.3 1.6 2.9 5.0 Malaysia* 1.4 0.9 2.1 2.6 Thailand* 5.3 2.3 9.5 7.3 Philippines** 0.83 0.36 0.49 0.41 *1971-1991; **1973-1995 Source: Mapalad as reproduced in Tecson (2001) Of the four Southeast Asian countries compared, Thailand seems to have benefited the most from ODA followed by Indonesia. But even third placer Malaysia is way ahead of the Philippines. A question may be raised with respect to the ODA impact on imports. It would seem that the higher figures in this
Tadem / 19
category attributed to ODA could simply be the result of tied aid (both loans and grants) which Japan is notorious for. Other Implementation Problems. Based on the 9th
1. procurement issues,
Annual ODA Portfolio Review (2000) conducted by NEDA almost all of the 45 priority projects listed suffered from one or the other of the following other implementation problems:
2. right of way acquisition, 3. resettlement and relocation problems, 4. land acquisition issues, 5. project design and preparedness, 6. financial and project management problems, 7. peace and order, 8. force majeur, 9. change in project design, 10. delayed release of tranches, 11. slow disbursement of funds, 12. problems with the contractor, 13. lack of qualified beneficiaries, 14. delays or failures in bidding and awarding of contracts, 15. large unliquidated advances, 16. competition with other ODA projects, and, 17. non-passage of legislation.
D. RECOMMENDATIONS The current state of ODA to the Philippines point to disturbing characteristics that deserve serious attention. In general, ODA has not changed significantly from the pattern established in earlier decades. This despite policy pronouncements (from both donors and recipient countries) on shifting towards more social and human development-oriented activities, on increasing overall ODA, on providing more grants and more program loans, and improving implementation. In fact there has been a marked reversal as far as these commitments are concerned. To summarize the major findings from the data gathered: 1. Total ODA commitments have declined within the last seven years. 2. Loans continue to dominate ODA with their share increasing over the years. 3. Grant assistance, on the other hand, has been declining. 4. Bilateral assistance has overtaken multilateral assistance. 5. Infrastructure support has increased its share of ODA. 6. The share of human development funds has decreased. 7. Geographically, ODA is bias towards the more affluent region. 8. Project loans continue to be emphasized compared to program loans. 9. Many ODA projects continue to be tied to donor countries. 10. The government pays more for ODA costs and debt servicing due to:

Tadem / 20
a. time and cost overruns, b. the "sovereign guaranty" for private loans, c. lack of counterpart funding, and d. low loan availment rates.
11. There are long-standing issues that have yet to be fully addressed such as foreign consultants, corruption and environmental and social issues.
The above concerns are by no means all inclusive. Due to time and resource constraints, this present study has not been able to look into other immediate issues that also deserve attention but for which information has not been readily available. These are: (1) small-scale and medium-scale projects vs. mega projects, and, (2) ODA support channeled to or directly granted to NGOs. Given the problem areas examined in this study, the following recommendations are being offered: 1. In order to fulfill announced policy shifts that are generally positive, the grants and technical cooperation component of ODA should increase vis a vis the loan component. The trend towards increasing the loan component should be swiftly reversed. 2. More program loans should be given but without IMF-type conditionalities that only provide quick fix solutions. Recipient countries should be given more leeway in allocating program loans in the context of long-term and sustainable development goals. 3. The human development sectoral component, while having shown some improvement relative to the 1970s and 1980s, still has a long way to go. Worse, some backsliding has taken place. This is unfortunate given the commitments stated in the ODA Act of 1996 and those made by the Philippine government along with other governments in the 1995 Copenhagen WSSD conference and the 2000 Geneva WSSD+5 conference. 4. The geographical distribution of ODA should be redirected away from the more affluent areas towards the poorer regions of the Philippines. This is in line with the announced anti-poverty thrusts of both the Philippine government and its major donors. 5. The issue of untying grants and loans has to be addressed decisively as it is a long-standing major irritant in donor-recipient relations. As one writer emphasized, "no aid should be extended for projects which will require continued and repeated servicing, or spare parts which can be obtained only from abroad." 6. Given the huge cost overruns and overextended time overruns of many projects, it is obvious that many of them are poorly conceived and carelessly planned. A reexamination is in order here with regard to viability and sustainability. 7. In relation to no. 6, there should be more transparency and accountability in the whole ODA process from the initial conceptualization stage all the way to the implementation stage. Civil society groups and affected communities must be represented in the study groups, feasibility studies, committees, working groups, and decision-making bodies at all stages of the ODA process.

Tadem / 21
Periodic and token consultations are not sufficient to fulfill the requirements of transparent governance and democratic participation. Serious, meaningful, and substantive mechanisms and structures for more participative and transparent ODA processes should be put in place by the Philippine government as well as the donor community. 8. In connection with cases involving corruption in ODA use, a special investigation committee must be constituted at the highest levels of government. A starting point here would be the practice by Japanese companies of paying "commissions" or "rebates." 9. The "sovereign guaranty' for private sector-led projects must be terminated particularly since the ODA Act of 1996 provides in Section 4 that "ODA shall not be availed of or utilized directly or indirectly for … financing for private corporations with access to commercial credit." The ordinary Filipino taxpayer should not be made to pay for the inefficiencies and mismanagement by private corporations. 10.Environmentally harmful and socially disruptive effects often accompany large-scale and expensive projects. A shift must be made towards smaller scale and community-based projects that are more ecologically-friendly and participative. 11.The requirement on the preference for Filipino consultants in implementing ODA projects must be strictly enforced. 12.The above recommendations call for a virtual reformatting of ODA that requires immediate measures from both donors and recipient. If they can be carried out properly, the final step would be to reverse the trend of decreasing ODA commitments to the Philippines. E. CONCLUSIONS In 1977, a US Senate staff report on the Philippines concluded harshly that "after 30 years and US$1.7 billion in U.S. economic assistance, concrete development advances are hard to identify" (Morrel 1987). An agency-by-agency review of USAID programs conducted in 1979 "suggests that only about 22 percent has gone into projects directly benefiting the poor." In 1986, a group of faculty members from the UP School of Economics concluded that "most of the projects that were financed by foreign loans were unproductive" and that many of them "were not well chosen or were probably chosen to finance capital flight through the overpricing of projects." The economics professors also lamented that "many private sector projects relied on government financial institutions for foreign loans and guarantees." The group further pointed out that "… many of the projects were overpriced, mismanaged, not viable to begin with, or made unviable by changes in the exchange rate and the international environment…" Twelve years later a 1998 study lamented that "foreign assistance imposes a resource bias against redistributive policies" since the "criteria for providing foreign assistance are based mainly on projected project contributions to capital formation and foreign exchange" (Malaluan 1998). Furthermore "foreign assistance focuses on the economic sectors in fast-growing areas" thus exacerbating regional,
Tadem / 22
geographical and sectoral imbalances. Given this, the impact of ODA on poverty alleviation and social and asset reforms will surely be negligible. As the country enters a new millennium, the above refrains from assessments and evaluations of the record of foreign assistance to the Philippines ring a familiar tune. Real, meaningful and long-lasting changes in the planning and implementation of official development assistance projects to the Philippines are long overdue. Failing the realization of these changes, a serious reconsideration of the necessity and relevance of ODA to overall Philippine economic and human development will certainly be in order.
- 31 August 2001 REFERENCES: Florian Alburo, Romeo Bautista, Dante Canlas, Benjamin Diokno, Emmanuel de Dios et al, "Economic Recovery and Long Run Growth: Agenda for Reforms," May 1, 1986. National Economic Development Authority, Annual ODA Portfolio Reviews, 1993 to 2000. Ryokichi Hirono, "Major Issues in Japan's ODA in the 21st Century," JIIA/UNAUSA Meeting, 7-9 October 1994. Violeta Perez-Corral, "ADB's private sector development strategy: private sector as the engine of growth," April 2001 (manuscript). Frances Moore Lappe, Joseph Collins, and David Kinley, Aid As Obstacle. twenty questions about our foreign aid and the hungry (Institute for Food and Development Policy: San Francisco) 1980. Nepomuceno A. Malaluan, "Public Investments in the Quest for Poverty's End." In Filomeno Sta Ana III (editor), The State and the Market: Essays on a Socially Oriented Philippine Economy (Quezon City: Action for Economic Reforms) 1998. Jim Morrel, "Aid to the Philippines: who benefits?" in Daniel B. Schirmer and Stephen Rosskamm Shalom, The Philippines Reader: a history of colonialism, neocolonialism, dictatorship, and resistance (Boston: Southend Press) 1987. Cheryl Payer, The World Bank: a critical analysis (Monthly Review Press: New York and London) 1982. Philippines, Republic of the. Republic Act 4860, "Foreign Borrowings Act of 1966," September 8, 1966. Philippines, Republic of the. Republic Act 8182, "Official Development Assistance Act of 1996", June 11, 1996. Philippines, Republic of the. "Implementing Rules and Regulations for Republic Act 8182," 23 July 1996. International Labour Office. Sharing in Development: a programme of employment, equity, and growth for the Philippines (Manila: NEDA and ILO) 1974

Tadem / 23
Eduardo C. Tadem, "Japan, the US, and Official Development Assistance to the Philippines," Kasarinlan (Philippine Quarterly of Third World Studies), Vol. 5, No. 4, 1990 and in Japan Asia Quarterly Review (Vol 21 Nos 2-3) 1989 as "Philippine Assistance Plan: A Mockery of Aid." Gwendolyn R. Tecson, "Japanese ODA for Human Development: Views from the Philippines," Panorama (Vol 3 No. 2) 2001. Mamoru Tsuda and Reylito Elbo, "Japan's Official Development Assistance: Issues and Challenges in Asia." The World Bank. The Philippines: priorities and prospects for development (Washington DC. World Bank) 1976. "Recommendations of the High-level Panel on Financing for Development" (The Zedillo Commission), June 22, 2001. Masaki Yokoyama, "Marcos Yen for Corruption," Kasarinlan (Philippine Quarterly of Third World Studies), Vol. 5, No. 4, 1990. "Japanese ODA to the Philippines: Maleficent Aid ," Ibon Facts and Figures, Vol. 19, No. 3, 15 February 1996. "ODA in the 21st Century: A Three-Way Partnership," Devmagazine, Vol. 25, No. 4, July-August 1998. "ODA-funded projects' cost overruns hit P8B," Business World, 6-7 July 2001. "For not using up loans, DECS nearly loses P21B," Philippine Daily Inquirer, 13 July 2001. "ADB funding limits forcing government to scrap some projects," Business World, 3 July 2001. "Debt squeeze a Ramos legacy," Philippine Daily Inquirer, 16 July 2001. "Weak peso sends interest payments soaring by P11.5B," Philippines Daily Inquirer, 16 July 2001. Temario C. Rivera, "The Political Economy of Aid: Japanese ODA in the Philippines, 1971-1999," paper presented at a symposium on "Japan-Philippines Relations" hosted by the Japan-Philippines Research Forum, 13-14 May 2000, Tokyo, Japan.
********