PowerSchool 6.0 Student Information Systemhelpdesk.lewiscentral.k12.ia.us/help documents/PS 6.0 User...
158
Reports User Guide PowerSchool 6.0 Student Information System
Transcript of PowerSchool 6.0 Student Information Systemhelpdesk.lewiscentral.k12.ia.us/help documents/PS 6.0 User...

Reports User Guide
PowerSchool 6.0 Student Information System

Released June 2009
Document Owner: Document Services
This edition applies to Release 6.0 of the PowerSchool Premier software and to all subsequent releases and modifications until otherwise indicated in new editions or updates.
The data and names used to illustrate the reports and screen images may include names of individuals, companies, brands, and products. All of the data and names are fictitious; any similarities to actual names are entirely coincidental.
PowerSchool is a trademark, in the U.S. and/or other countries, of Pearson Education, Inc. or its affiliate(s).
Copyright © 2009 Pearson Education, Inc. or its affiliates. All rights reserved. All trademarks are either owned or licensed by Pearson Education, Inc. or its affiliates. Other brands and names are the property of their respective owners.
Reports User Guide
Contents Introduction........................................................................................................... 1 Reports .................................................................................................................. 2
Group Reports ............................................................................................... 2 System Report Queue..................................................................................... 2 ReportWorks Queue ....................................................................................... 9 Report Structure .......................................................................................... 11
Report Formatting................................................................................................ 13 Report Styles............................................................................................... 14 Run, Print, and Save Reports ......................................................................... 15 Alternate Ways to Create Reports ................................................................... 19
Preconfigured Reports ......................................................................................... 20 Attendance Reports ...................................................................................... 20 Attendance Count and Audit Reports............................................................... 23 Discipline Reports ........................................................................................ 52 Grade and Gradebook Reports ....................................................................... 55 Single Student Standards Report.................................................................... 60 Standards Reports........................................................................................ 61 Membership Reports..................................................................................... 65 Aggregate Membership Reports...................................................................... 78 Enrollment Reports....................................................................................... 80 Scheduling Reports ...................................................................................... 88 Statistics .................................................................................................... 89 Student Listings........................................................................................... 91 PowerLunch Reports ....................................................................................100
ReportWorks ...................................................................................................... 104 Custom Reports.................................................................................................. 106
Report Cards ..............................................................................................106 Mailing Labels.............................................................................................113 Print Mailing Labels .....................................................................................115 Form Letters ..............................................................................................116
Object Reports ................................................................................................... 121 Objects on an Object Report ..............................................................................126
Text Objects...............................................................................................127 Line Objects ...............................................................................................130
Contents iii
Reports User Guide
Contents iv
Box Objects................................................................................................131 Circle Objects .............................................................................................133 Transcript Objects .......................................................................................134 Fee List Objects ..........................................................................................138 Fees List Objects.........................................................................................144 Picture Objects ...........................................................................................146 Sequence Objects .......................................................................................147 Report Pictures ...........................................................................................149
Object Reports With Standards Grades................................................................149 Object Reports With Test Tags ...........................................................................151
Reports User Guide
Introduction 1
Introduction Use this guide to assist you while navigating PowerSchool. This guide is based on the PowerSchool Help system, which you can also use to learn the PowerSchool Student Information System (SIS) and to serve as a reference for your daily work.
PowerSchool Help is updated as PowerSchool is updated. Not all versions of PowerSchool Help are available in a printable guide. For the most up-to-date information, click the Help icon on any page in PowerSchool.
Procedures in this guide describe how to view, add, edit, and delete information in PowerSchool. Depending on your needs and your security permissions, only certain options may be applicable and available to you.
This guide uses the > symbol to move down a menu path. Thus, if instructed to "Click File > New > Window," begin by clicking the File menu. Then, click New and Window. The option noted after the > symbol will be on the menu that results from your previous selection.
This guide is based on the PowerSchool Help system, and may include references to sections that are not contained within the guide. See the PowerSchool online help for the referenced section.
Reports User Guide
Reports 2
Reports PowerSchool includes two types of reports: custom and preconfigured. Custom reports include form letters, mailing labels, report cards, and object reports. Preconfigured reports include reports related to attendance, grades, membership and enrollment, statistics, and student listings. Use the reports menu to run any custom or traditional report. Limit the group of students to report on by selecting a group of students before accessing the reports menu.
Group Reports Select a group of students before running either preconfigured or custom reports.
How to Display the Reports Page
Display the reports page by selecting a group of students for whom you want to run a report. Alternately, you can choose Reports from the main menu.
1. On the start page, search for and select a group of students. The Student Selection page appears. For more information, see Select a Group of Students.
2. Choose Reports Menu from the Select a function for this group of students pop-up menu. The Reports page appears.
Note: Alternatively, if you have a current selection of students, you can access this page by choosing Special Functions > Groups Functions.
3. Do one of the following:
• Click the System tab to view Preconfigured Reports. • Click the ReportWorks tab to view ReportWorks Reports. • Click the State tab to view State Reports. • Click the Engine tab to work with the reporting engine. • Click the Setup tab to view Custom Reports.
System Report Queue Use the System Report Queue to view, delete, cancel, and re-execute preconfigured reports that you submit to the queue. When you submit a report request to the system, the system captures the report request and transmits the job to the Report Queue. The Report Queue page displays the status of the report as it is processed by the system. The Report Queue also includes debugging tools and logs to troubleshoot problems with reports.
Reports are organized by tabs. The System tab displays all preconfigured reports, while the ReportWorks tab displays all submitted reports that were created in ReportWorks. For more information about viewing ReportWorks, see ReportWorks Report Queue.
To view all jobs in the report queue regardless of the user, view the report queue from the System Administrator menu. Administrators can also set preferences for the Report Queue. For more information, see Report Queue Preferences.
Reports User Guide
Reports 3
How to View System Reports in the Report Queue
You must run a report before performing this procedure. For more information, see Custom Reports or Preconfigured Reports.
1. On the start page, click the Report Queue icon in the navigation bar. 2. Click the System tab. The Report Queue (System) - My Jobs page displays all your
reports. 3. Do one of the following:
• Click Refresh to update the page. • Click the cancel icon to stop running the report. • Click View to view the report once the Status column displays the status
"Completed." • Click the Job Name of the report. The Report Queue Job Detail page displays
details of the report job, and you can select either the Cancel Job or Run job again checkbox, depending on whether the job has completed or not. For more information, see How to View System Completed Report Details.
• Click the trash icon to delete the completed report.
How to View Completed System Report Details
When a report runs completely, view the job details. For details on reports that are running or pending, see How to View System Reports in the Report Queue.
1. On the start page, click the Report Queue icon in the navigation bar. 2. Click the System tab. The Report Queue (System) - My Jobs page displays all your
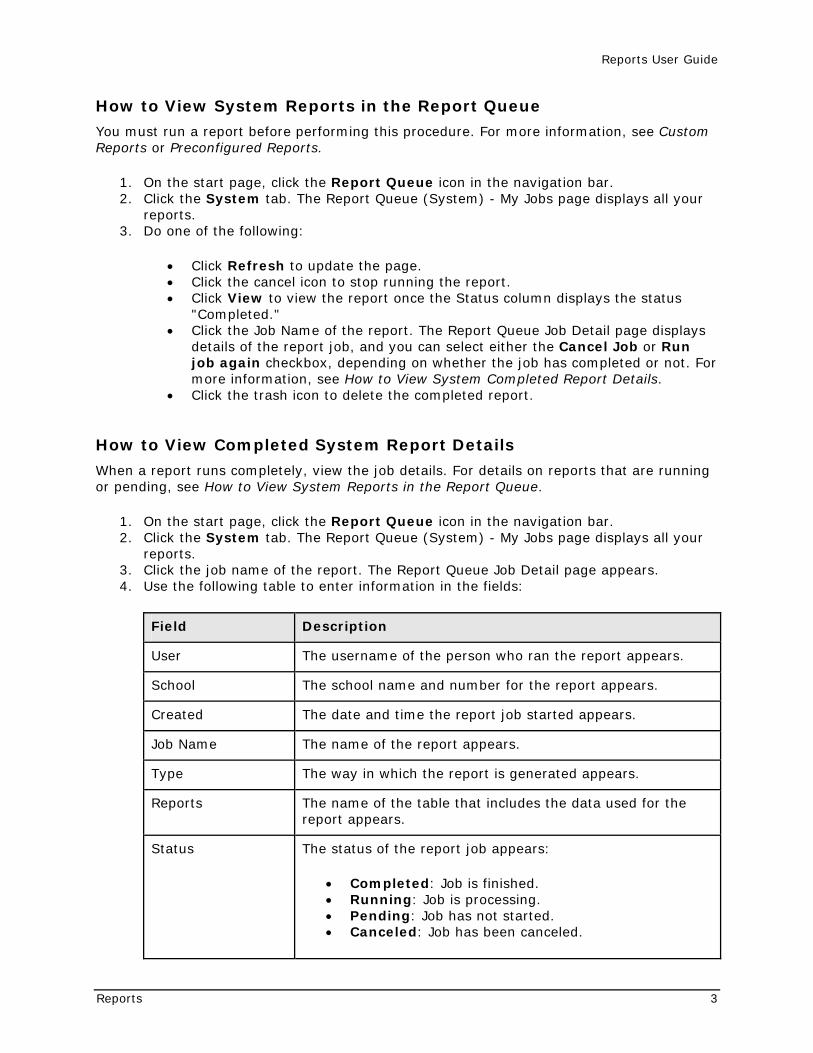
reports. 3. Click the job name of the report. The Report Queue Job Detail page appears. 4. Use the following table to enter information in the fields:
Field Description
User The username of the person who ran the report appears.
School The school name and number for the report appears.
Created The date and time the report job started appears.
Job Name The name of the report appears.
Type The way in which the report is generated appears.
Reports The name of the table that includes the data used for the report appears.
Status The status of the report job appears:
• Completed: Job is finished. • Running: Job is processing. • Pending: Job has not started. • Canceled: Job has been canceled.
Reports User Guide
Reports 4
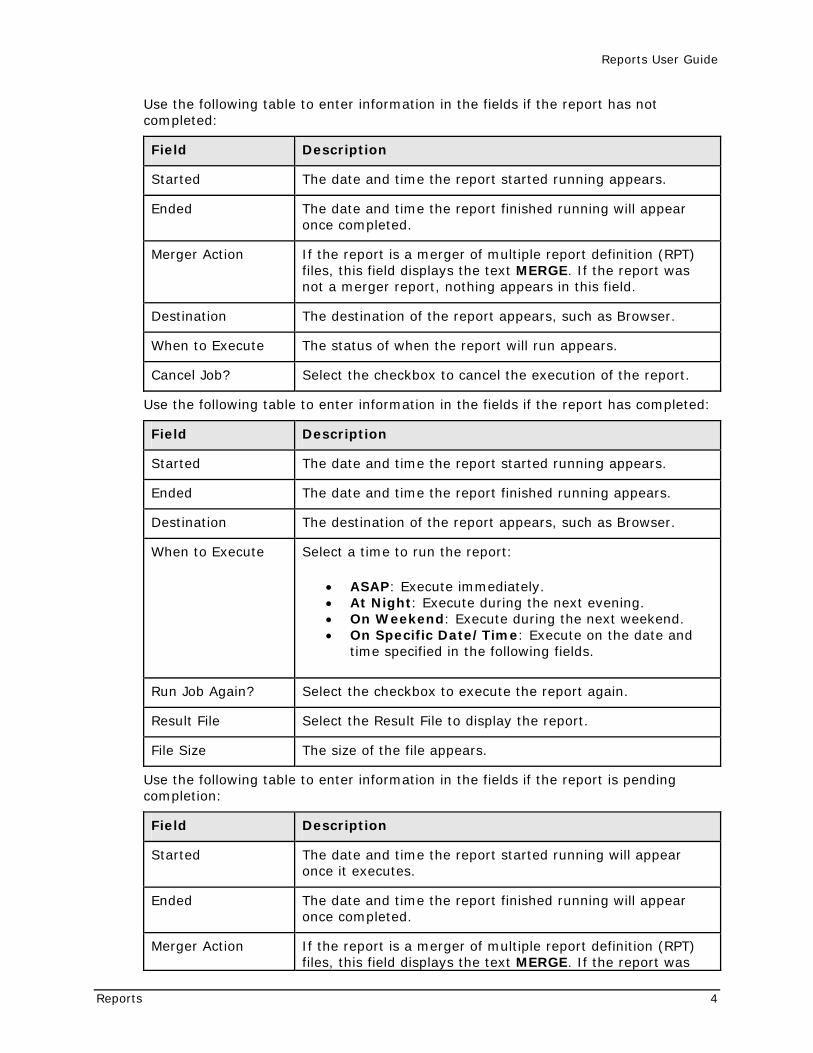
Use the following table to enter information in the fields if the report has not completed:
Field Description
Started The date and time the report started running appears.
Ended The date and time the report finished running will appear once completed.
Merger Action If the report is a merger of multiple report definition (RPT) files, this field displays the text MERGE. If the report was not a merger report, nothing appears in this field.
Destination The destination of the report appears, such as Browser.
When to Execute The status of when the report will run appears.
Cancel Job? Select the checkbox to cancel the execution of the report.
Use the following table to enter information in the fields if the report has completed:
Field Description
Started The date and time the report started running appears.
Ended The date and time the report finished running appears.
Destination The destination of the report appears, such as Browser.
When to Execute Select a time to run the report:
• ASAP: Execute immediately. • At Night: Execute during the next evening. • On Weekend: Execute during the next weekend. • On Specific Date/Time: Execute on the date and
time specified in the following fields.
Run Job Again? Select the checkbox to execute the report again.
Result File Select the Result File to display the report.
File Size The size of the file appears.
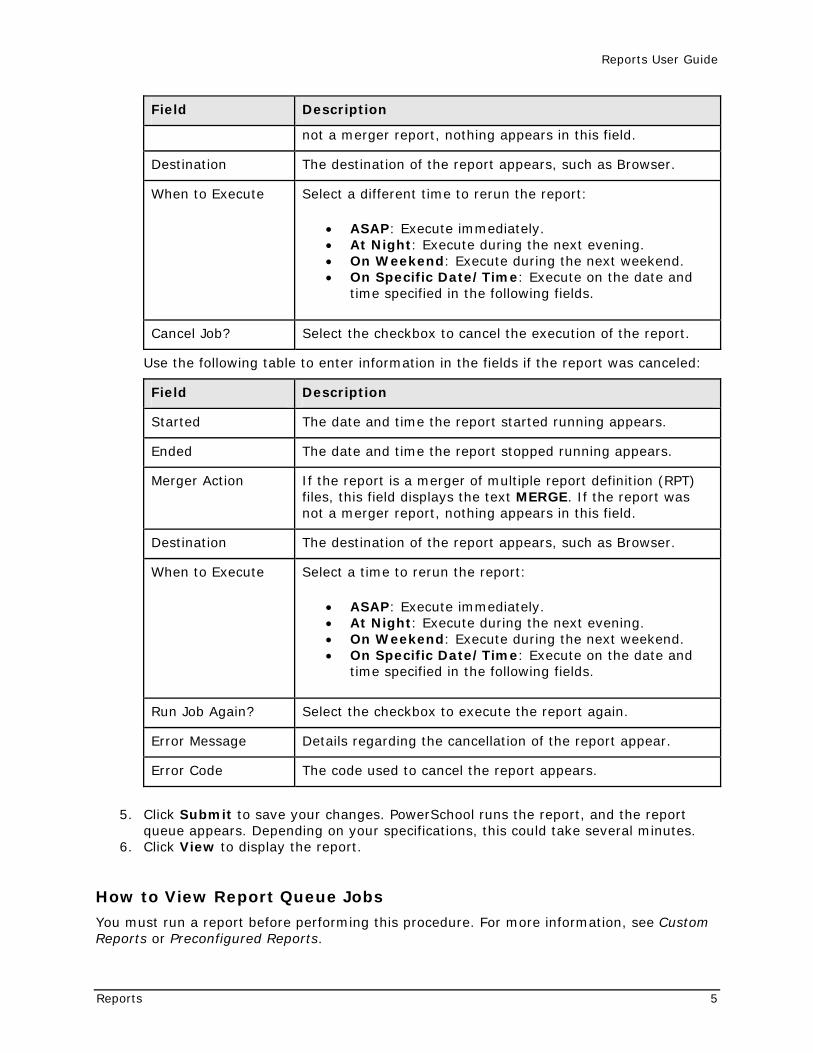
Use the following table to enter information in the fields if the report is pending completion:
Field Description
Started The date and time the report started running will appear once it executes.
Ended The date and time the report finished running will appear once completed.
Merger Action If the report is a merger of multiple report definition (RPT) files, this field displays the text MERGE. If the report was
Reports User Guide
Reports 5
Field Description
not a merger report, nothing appears in this field.
Destination The destination of the report appears, such as Browser.
When to Execute Select a different time to rerun the report:
• ASAP: Execute immediately. • At Night: Execute during the next evening. • On Weekend: Execute during the next weekend. • On Specific Date/Time: Execute on the date and
time specified in the following fields.
Cancel Job? Select the checkbox to cancel the execution of the report.
Use the following table to enter information in the fields if the report was canceled:
Field Description
Started The date and time the report started running appears.
Ended The date and time the report stopped running appears.
Merger Action If the report is a merger of multiple report definition (RPT) files, this field displays the text MERGE. If the report was not a merger report, nothing appears in this field.
Destination The destination of the report appears, such as Browser.
When to Execute Select a time to rerun the report:
• ASAP: Execute immediately. • At Night: Execute during the next evening. • On Weekend: Execute during the next weekend. • On Specific Date/Time: Execute on the date and
time specified in the following fields.
Run Job Again? Select the checkbox to execute the report again.
Error Message Details regarding the cancellation of the report appear.
Error Code The code used to cancel the report appears.
5. Click Submit to save your changes. PowerSchool runs the report, and the report queue appears. Depending on your specifications, this could take several minutes.
6. Click View to display the report.
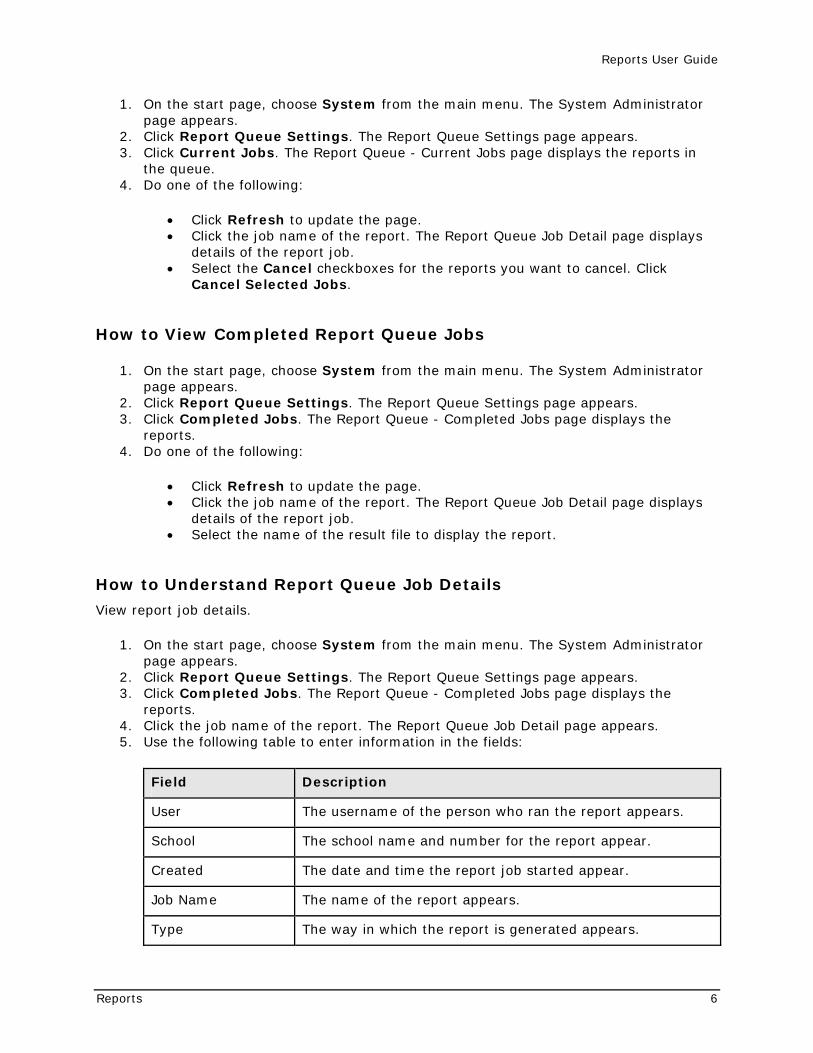
How to View Report Queue Jobs
You must run a report before performing this procedure. For more information, see Custom Reports or Preconfigured Reports.
Reports User Guide
Reports 6
1. On the start page, choose System from the main menu. The System Administrator page appears.
2. Click Report Queue Settings. The Report Queue Settings page appears. 3. Click Current Jobs. The Report Queue - Current Jobs page displays the reports in
the queue. 4. Do one of the following:
• Click Refresh to update the page. • Click the job name of the report. The Report Queue Job Detail page displays
details of the report job. • Select the Cancel checkboxes for the reports you want to cancel. Click
Cancel Selected Jobs.
How to View Completed Report Queue Jobs
1. On the start page, choose System from the main menu. The System Administrator page appears.
2. Click Report Queue Settings. The Report Queue Settings page appears. 3. Click Completed Jobs. The Report Queue - Completed Jobs page displays the
reports. 4. Do one of the following:
• Click Refresh to update the page. • Click the job name of the report. The Report Queue Job Detail page displays
details of the report job. • Select the name of the result file to display the report.
How to Understand Report Queue Job Details
View report job details.
1. On the start page, choose System from the main menu. The System Administrator page appears.
2. Click Report Queue Settings. The Report Queue Settings page appears. 3. Click Completed Jobs. The Report Queue - Completed Jobs page displays the
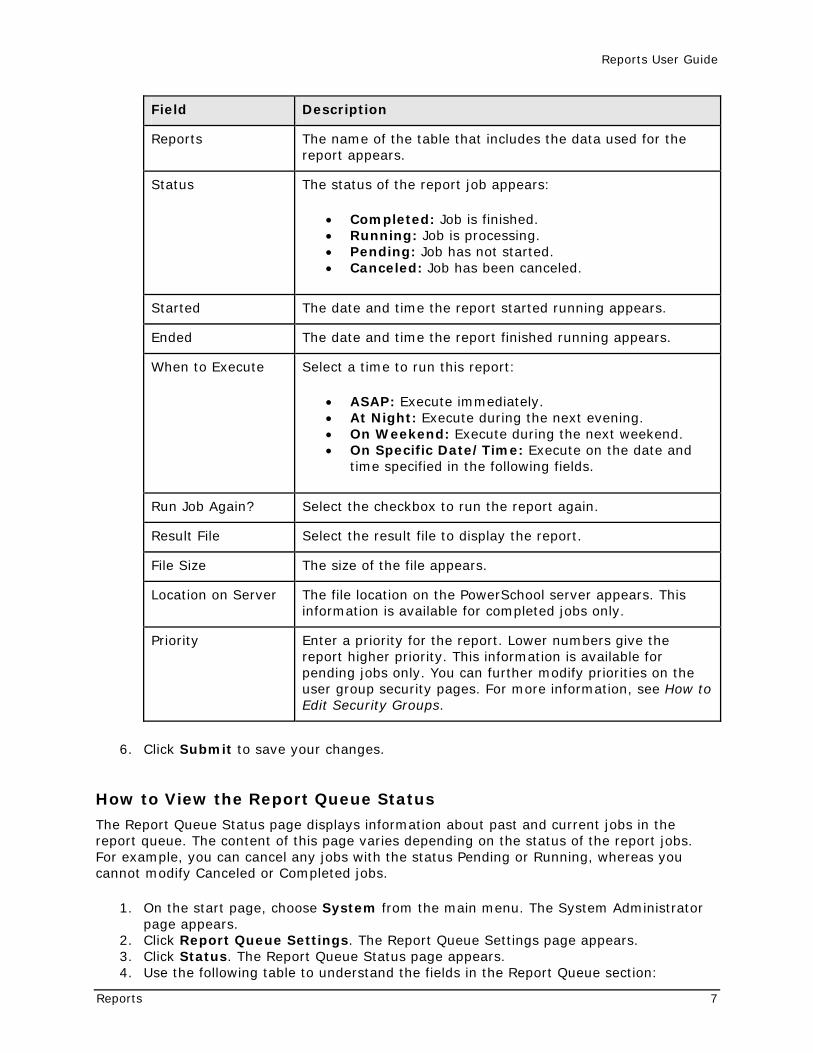
reports. 4. Click the job name of the report. The Report Queue Job Detail page appears. 5. Use the following table to enter information in the fields:
Field Description
User The username of the person who ran the report appears.
School The school name and number for the report appear.
Created The date and time the report job started appear.
Job Name The name of the report appears.
Type The way in which the report is generated appears.
Reports User Guide
Reports 7
Field Description
Reports The name of the table that includes the data used for the report appears.
Status The status of the report job appears:
• Completed: Job is finished. • Running: Job is processing. • Pending: Job has not started. • Canceled: Job has been canceled.
Started The date and time the report started running appears.
Ended The date and time the report finished running appears.
When to Execute Select a time to run this report:
• ASAP: Execute immediately. • At Night: Execute during the next evening. • On Weekend: Execute during the next weekend. • On Specific Date/Time: Execute on the date and
time specified in the following fields.
Run Job Again? Select the checkbox to run the report again.
Result File Select the result file to display the report.
File Size The size of the file appears.
Location on Server The file location on the PowerSchool server appears. This information is available for completed jobs only.
Priority Enter a priority for the report. Lower numbers give the report higher priority. This information is available for pending jobs only. You can further modify priorities on the user group security pages. For more information, see How to Edit Security Groups.
6. Click Submit to save your changes.
How to View the Report Queue Status
The Report Queue Status page displays information about past and current jobs in the report queue. The content of this page varies depending on the status of the report jobs. For example, you can cancel any jobs with the status Pending or Running, whereas you cannot modify Canceled or Completed jobs.
1. On the start page, choose System from the main menu. The System Administrator page appears.
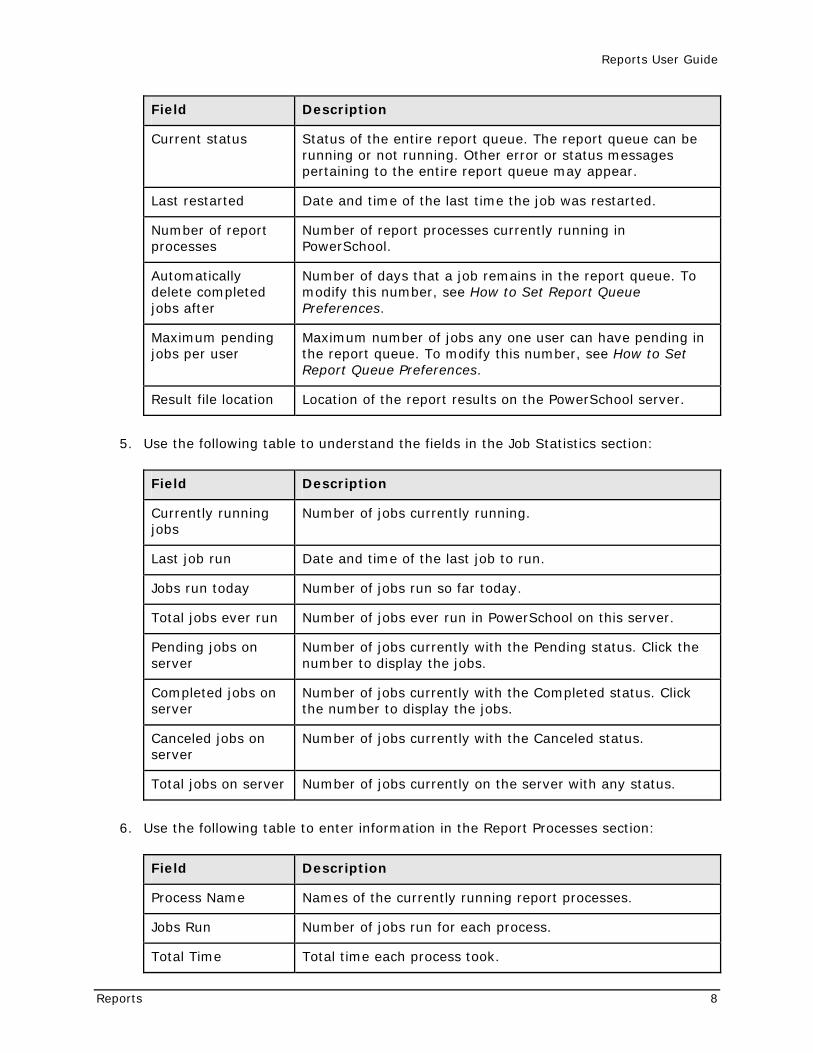
2. Click Report Queue Settings. The Report Queue Settings page appears. 3. Click Status. The Report Queue Status page appears. 4. Use the following table to understand the fields in the Report Queue section:
Reports User Guide
Reports 8
Field Description
Current status Status of the entire report queue. The report queue can be running or not running. Other error or status messages pertaining to the entire report queue may appear.
Last restarted Date and time of the last time the job was restarted.
Number of report processes
Number of report processes currently running in PowerSchool.
Automatically delete completed jobs after
Number of days that a job remains in the report queue. To modify this number, see How to Set Report Queue Preferences.
Maximum pending jobs per user
Maximum number of jobs any one user can have pending in the report queue. To modify this number, see How to Set Report Queue Preferences.
Result file location Location of the report results on the PowerSchool server.
5. Use the following table to understand the fields in the Job Statistics section:
Field Description
Currently running jobs
Number of jobs currently running.
Last job run Date and time of the last job to run.
Jobs run today Number of jobs run so far today.
Total jobs ever run Number of jobs ever run in PowerSchool on this server.
Pending jobs on server
Number of jobs currently with the Pending status. Click the number to display the jobs.
Completed jobs on server
Number of jobs currently with the Completed status. Click the number to display the jobs.
Canceled jobs on server
Number of jobs currently with the Canceled status.
Total jobs on server Number of jobs currently on the server with any status.
6. Use the following table to enter information in the Report Processes section:
Field Description
Process Name Names of the currently running report processes.
Jobs Run Number of jobs run for each process.
Total Time Total time each process took.
Reports User Guide
Reports 9
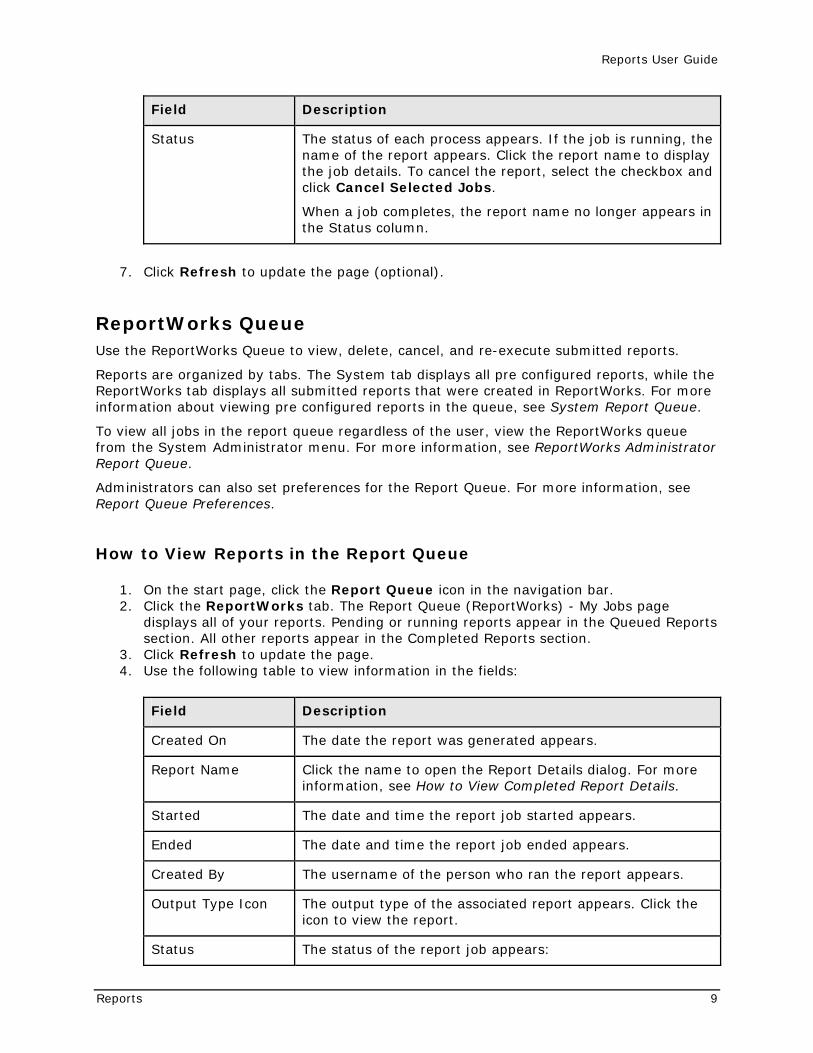
Field Description
Status The status of each process appears. If the job is running, the name of the report appears. Click the report name to display the job details. To cancel the report, select the checkbox and click Cancel Selected Jobs.
When a job completes, the report name no longer appears in the Status column.
7. Click Refresh to update the page (optional).
ReportWorks Queue Use the ReportWorks Queue to view, delete, cancel, and re-execute submitted reports.
Reports are organized by tabs. The System tab displays all pre configured reports, while the ReportWorks tab displays all submitted reports that were created in ReportWorks. For more information about viewing pre configured reports in the queue, see System Report Queue.
To view all jobs in the report queue regardless of the user, view the ReportWorks queue from the System Administrator menu. For more information, see ReportWorks Administrator Report Queue.
Administrators can also set preferences for the Report Queue. For more information, see Report Queue Preferences.
How to View Reports in the Report Queue
1. On the start page, click the Report Queue icon in the navigation bar. 2. Click the ReportWorks tab. The Report Queue (ReportWorks) - My Jobs page
displays all of your reports. Pending or running reports appear in the Queued Reports section. All other reports appear in the Completed Reports section.
3. Click Refresh to update the page. 4. Use the following table to view information in the fields:
Field Description
Created On The date the report was generated appears.
Report Name Click the name to open the Report Details dialog. For more information, see How to View Completed Report Details.
Started The date and time the report job started appears.
Ended The date and time the report job ended appears.
Created By The username of the person who ran the report appears.
Output Type Icon The output type of the associated report appears. Click the icon to view the report.
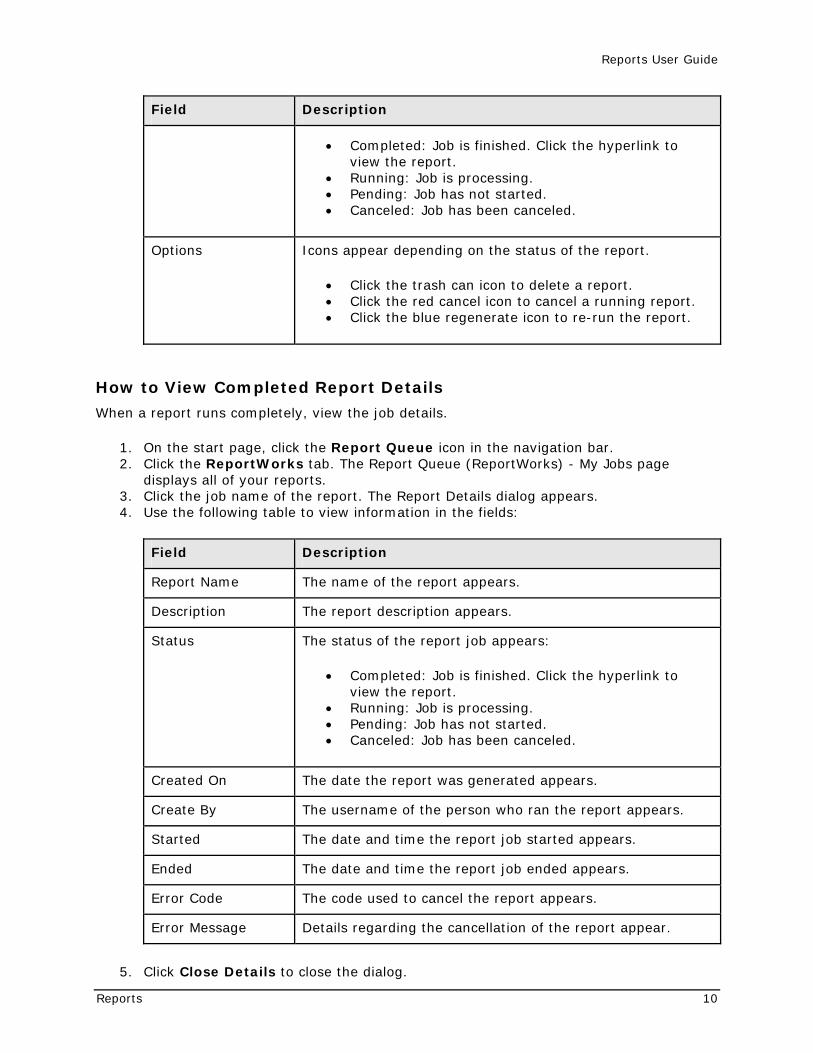
Status The status of the report job appears:
Reports User Guide
Reports 10
Field Description
• Completed: Job is finished. Click the hyperlink to view the report.
• Running: Job is processing. • Pending: Job has not started. • Canceled: Job has been canceled.
Options Icons appear depending on the status of the report.
• Click the trash can icon to delete a report. • Click the red cancel icon to cancel a running report. • Click the blue regenerate icon to re-run the report.
How to View Completed Report Details
When a report runs completely, view the job details.
1. On the start page, click the Report Queue icon in the navigation bar. 2. Click the ReportWorks tab. The Report Queue (ReportWorks) - My Jobs page
displays all of your reports. 3. Click the job name of the report. The Report Details dialog appears. 4. Use the following table to view information in the fields:
Field Description
Report Name The name of the report appears.
Description The report description appears.
Status The status of the report job appears:
• Completed: Job is finished. Click the hyperlink to view the report.
• Running: Job is processing. • Pending: Job has not started. • Canceled: Job has been canceled.
Created On The date the report was generated appears.
Create By The username of the person who ran the report appears.
Started The date and time the report job started appears.
Ended The date and time the report job ended appears.
Error Code The code used to cancel the report appears.
Error Message Details regarding the cancellation of the report appear.
5. Click Close Details to close the dialog.
Reports User Guide
Reports 11
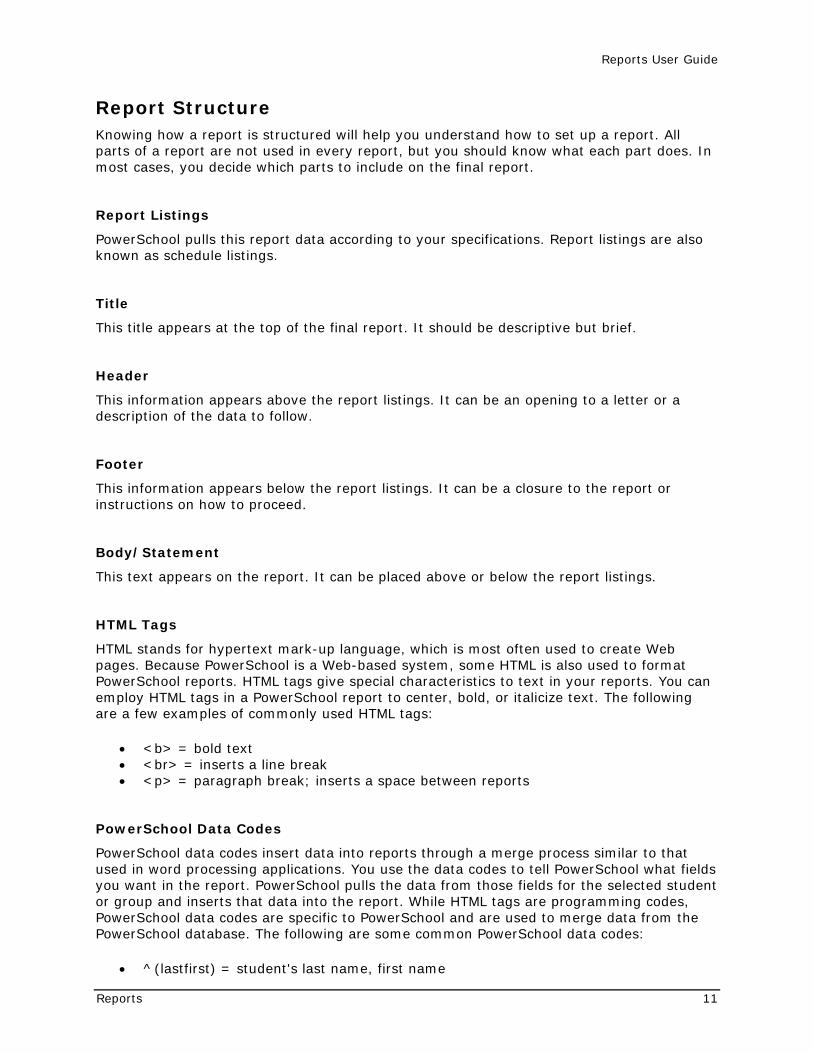
Report Structure Knowing how a report is structured will help you understand how to set up a report. All parts of a report are not used in every report, but you should know what each part does. In most cases, you decide which parts to include on the final report.
Report Listings
PowerSchool pulls this report data according to your specifications. Report listings are also known as schedule listings.
Title
This title appears at the top of the final report. It should be descriptive but brief.
Header
This information appears above the report listings. It can be an opening to a letter or a description of the data to follow.
Footer
This information appears below the report listings. It can be a closure to the report or instructions on how to proceed.
Body/Statement
This text appears on the report. It can be placed above or below the report listings.
HTML Tags
HTML stands for hypertext mark-up language, which is most often used to create Web pages. Because PowerSchool is a Web-based system, some HTML is also used to format PowerSchool reports. HTML tags give special characteristics to text in your reports. You can employ HTML tags in a PowerSchool report to center, bold, or italicize text. The following are a few examples of commonly used HTML tags:
• <b> = bold text • <br> = inserts a line break • <p> = paragraph break; inserts a space between reports
PowerSchool Data Codes
PowerSchool data codes insert data into reports through a merge process similar to that used in word processing applications. You use the data codes to tell PowerSchool what fields you want in the report. PowerSchool pulls the data from those fields for the selected student or group and inserts that data into the report. While HTML tags are programming codes, PowerSchool data codes are specific to PowerSchool and are used to merge data from the PowerSchool database. The following are some common PowerSchool data codes:
• ^(lastfirst) = student's last name, first name
Reports User Guide
Reports 12
• ^(grade_level) = student's grade level • ^(*gpa;Q3) = student's GPA for third quarter
Note: The asterisk (*) is used to indicate that data must be calculated.
For more information about data codes, visit PowerSource.
Reports User Guide
Report Formatting 13
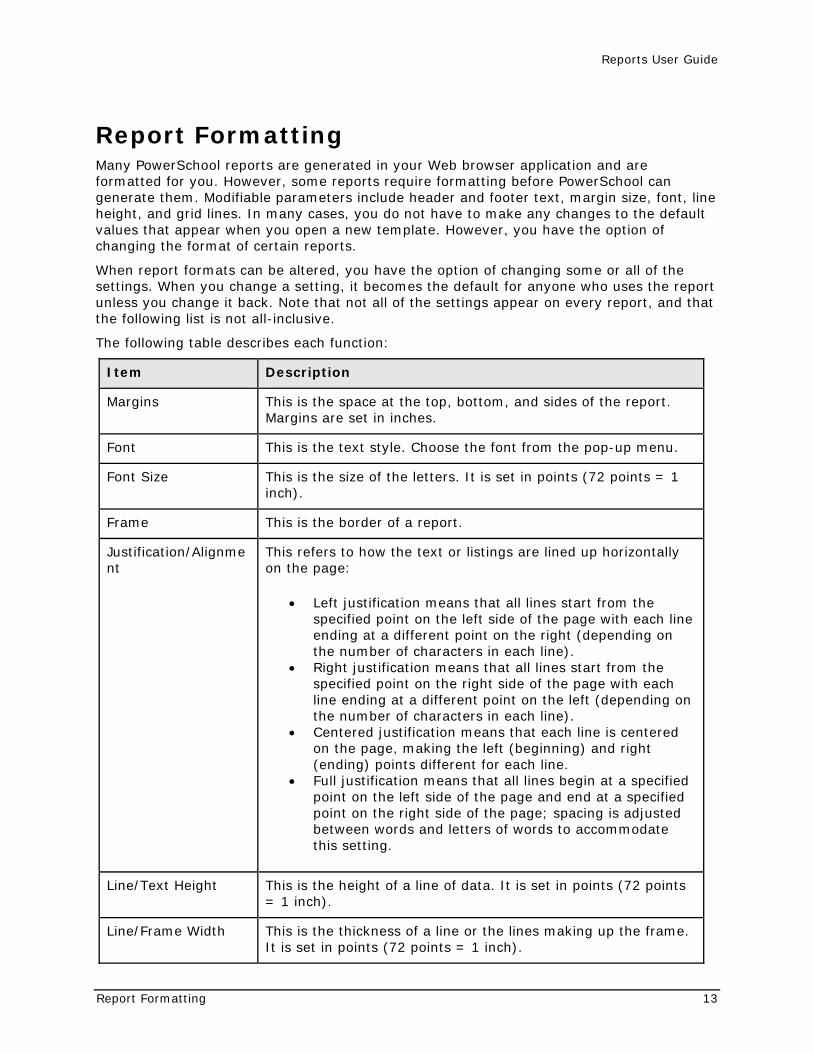
Report Formatting Many PowerSchool reports are generated in your Web browser application and are formatted for you. However, some reports require formatting before PowerSchool can generate them. Modifiable parameters include header and footer text, margin size, font, line height, and grid lines. In many cases, you do not have to make any changes to the default values that appear when you open a new template. However, you have the option of changing the format of certain reports.
When report formats can be altered, you have the option of changing some or all of the settings. When you change a setting, it becomes the default for anyone who uses the report unless you change it back. Note that not all of the settings appear on every report, and that the following list is not all-inclusive.
The following table describes each function:
Item Description
Margins This is the space at the top, bottom, and sides of the report. Margins are set in inches.
Font This is the text style. Choose the font from the pop-up menu.
Font Size This is the size of the letters. It is set in points (72 points = 1 inch).
Frame This is the border of a report.
Justification/Alignment
This refers to how the text or listings are lined up horizontally on the page:
• Left justification means that all lines start from the specified point on the left side of the page with each line ending at a different point on the right (depending on the number of characters in each line).
• Right justification means that all lines start from the specified point on the right side of the page with each line ending at a different point on the left (depending on the number of characters in each line).
• Centered justification means that each line is centered on the page, making the left (beginning) and right (ending) points different for each line.
• Full justification means that all lines begin at a specified point on the left side of the page and end at a specified point on the right side of the page; spacing is adjusted between words and letters of words to accommodate this setting.
Line/Text Height This is the height of a line of data. It is set in points (72 points = 1 inch).
Line/Frame Width This is the thickness of a line or the lines making up the frame. It is set in points (72 points = 1 inch).
Reports User Guide
Report Formatting 14
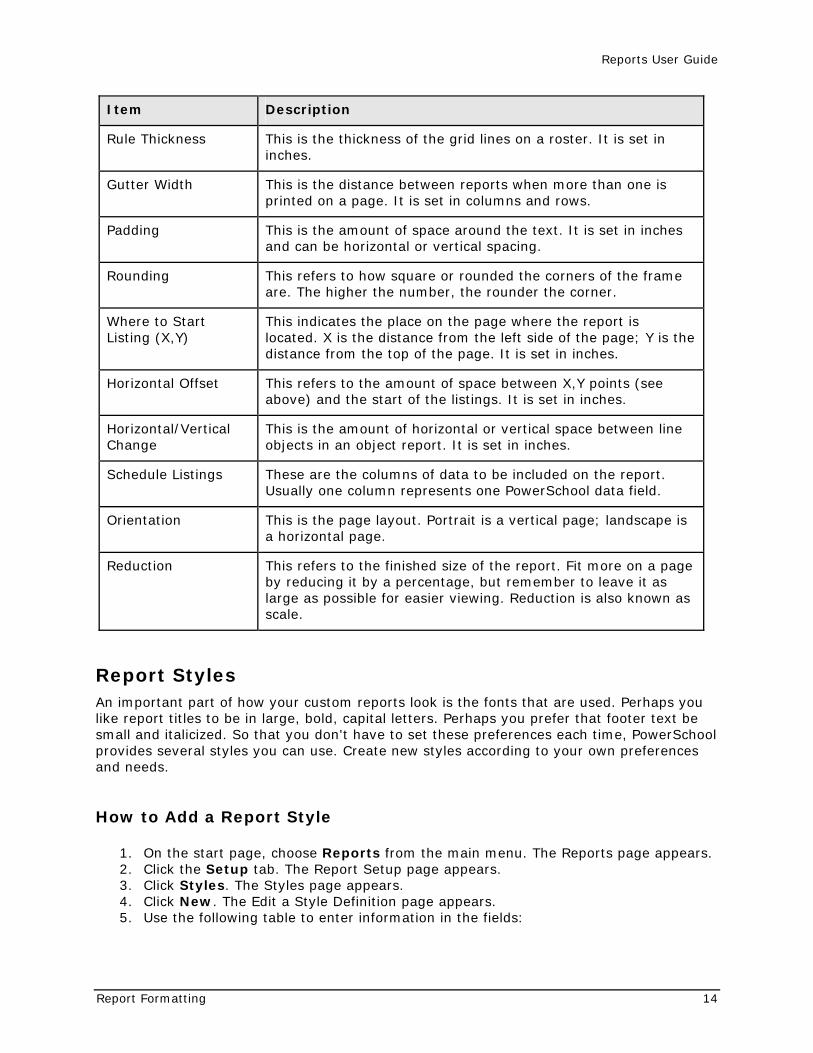
Item Description
Rule Thickness This is the thickness of the grid lines on a roster. It is set in inches.
Gutter Width This is the distance between reports when more than one is printed on a page. It is set in columns and rows.
Padding This is the amount of space around the text. It is set in inches and can be horizontal or vertical spacing.
Rounding This refers to how square or rounded the corners of the frame are. The higher the number, the rounder the corner.
Where to Start Listing (X,Y)
This indicates the place on the page where the report is located. X is the distance from the left side of the page; Y is the distance from the top of the page. It is set in inches.
Horizontal Offset This refers to the amount of space between X,Y points (see above) and the start of the listings. It is set in inches.
Horizontal/Vertical Change
This is the amount of horizontal or vertical space between line objects in an object report. It is set in inches.
Schedule Listings These are the columns of data to be included on the report. Usually one column represents one PowerSchool data field.
Orientation This is the page layout. Portrait is a vertical page; landscape is a horizontal page.
Reduction This refers to the finished size of the report. Fit more on a page by reducing it by a percentage, but remember to leave it as large as possible for easier viewing. Reduction is also known as scale.
Report Styles An important part of how your custom reports look is the fonts that are used. Perhaps you like report titles to be in large, bold, capital letters. Perhaps you prefer that footer text be small and italicized. So that you don't have to set these preferences each time, PowerSchool provides several styles you can use. Create new styles according to your own preferences and needs.
How to Add a Report Style
1. On the start page, choose Reports from the main menu. The Reports page appears. 2. Click the Setup tab. The Report Setup page appears. 3. Click Styles. The Styles page appears. 4. Click New. The Edit a Style Definition page appears. 5. Use the following table to enter information in the fields:
Reports User Guide
Report Formatting 15
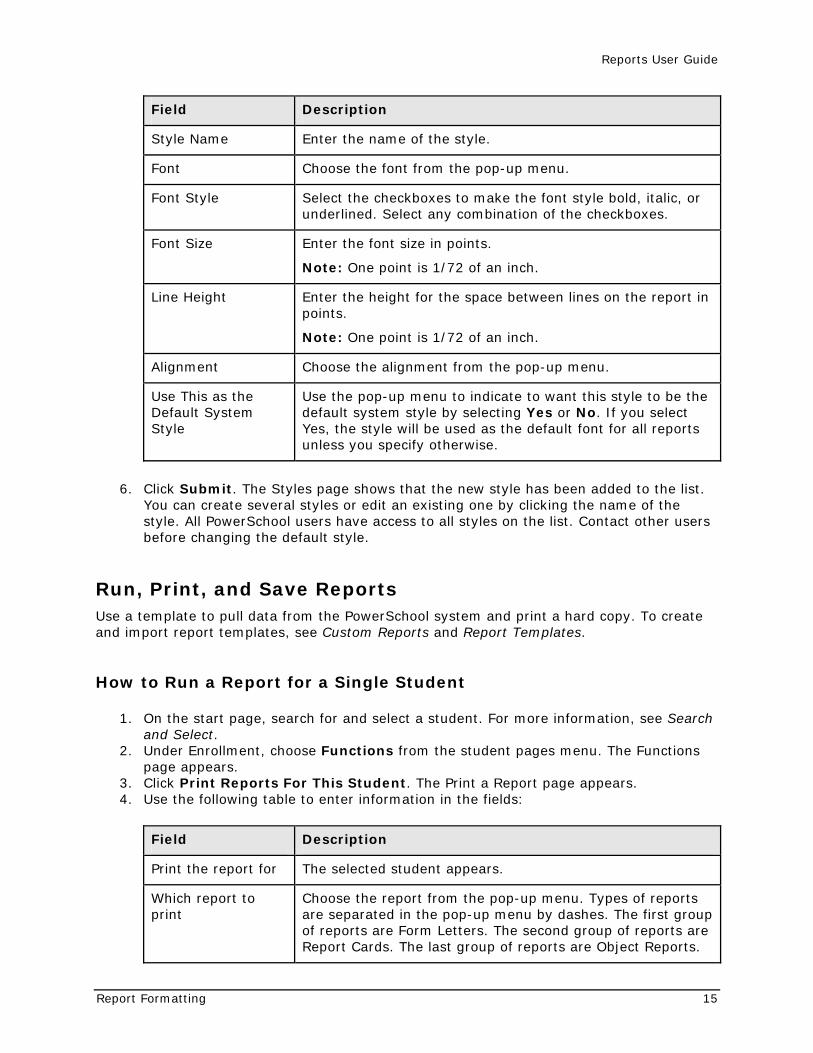
Field Description
Style Name Enter the name of the style.
Font Choose the font from the pop-up menu.
Font Style Select the checkboxes to make the font style bold, italic, or underlined. Select any combination of the checkboxes.
Font Size Enter the font size in points.
Note: One point is 1/72 of an inch.
Line Height Enter the height for the space between lines on the report in points.
Note: One point is 1/72 of an inch.
Alignment Choose the alignment from the pop-up menu.
Use This as the Default System Style
Use the pop-up menu to indicate to want this style to be the default system style by selecting Yes or No. If you select Yes, the style will be used as the default font for all reports unless you specify otherwise.
6. Click Submit. The Styles page shows that the new style has been added to the list. You can create several styles or edit an existing one by clicking the name of the style. All PowerSchool users have access to all styles on the list. Contact other users before changing the default style.
Run, Print, and Save Reports Use a template to pull data from the PowerSchool system and print a hard copy. To create and import report templates, see Custom Reports and Report Templates.
How to Run a Report for a Single Student
1. On the start page, search for and select a student. For more information, see Search and Select.
2. Under Enrollment, choose Functions from the student pages menu. The Functions page appears.
3. Click Print Reports For This Student. The Print a Report page appears. 4. Use the following table to enter information in the fields:
Field Description
Print the report for The selected student appears.
Which report to print
Choose the report from the pop-up menu. Types of reports are separated in the pop-up menu by dashes. The first group of reports are Form Letters. The second group of reports are Report Cards. The last group of reports are Object Reports.
Reports User Guide
Report Formatting 16
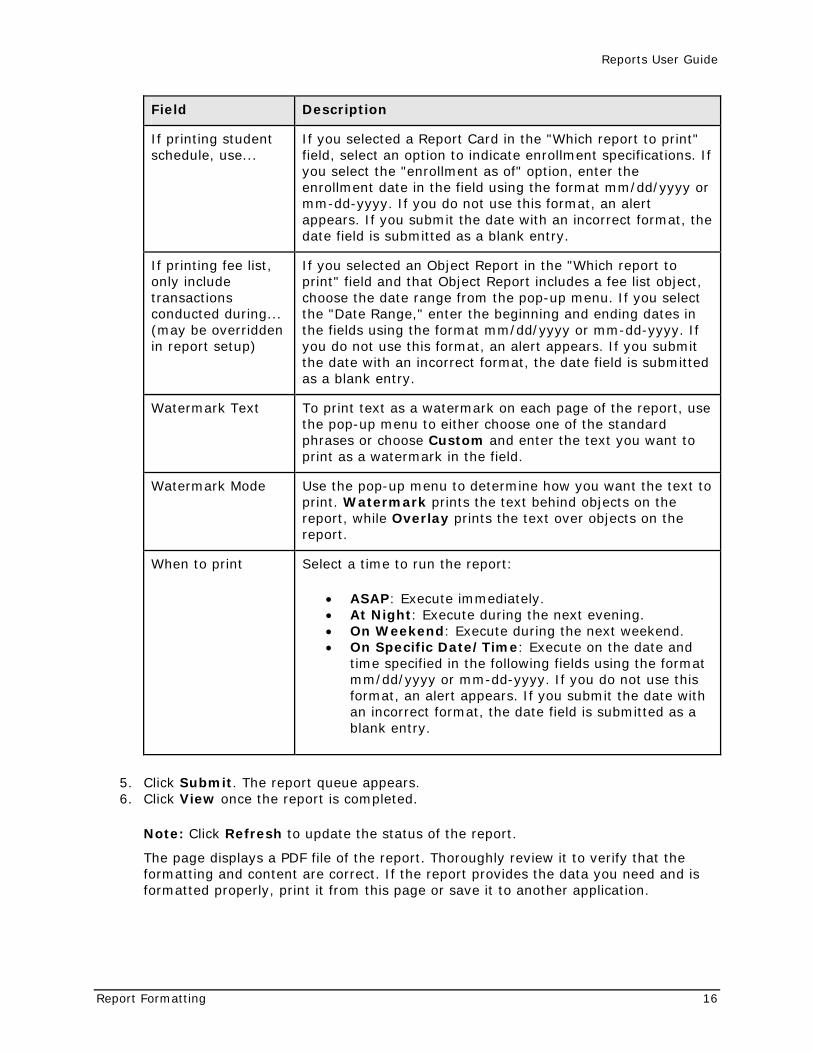
Field Description
If printing student schedule, use...
If you selected a Report Card in the "Which report to print" field, select an option to indicate enrollment specifications. If you select the "enrollment as of" option, enter the enrollment date in the field using the format mm/dd/yyyy or mm-dd-yyyy. If you do not use this format, an alert appears. If you submit the date with an incorrect format, the date field is submitted as a blank entry.
If printing fee list, only include transactions conducted during... (may be overridden in report setup)
If you selected an Object Report in the "Which report to print" field and that Object Report includes a fee list object, choose the date range from the pop-up menu. If you select the "Date Range," enter the beginning and ending dates in the fields using the format mm/dd/yyyy or mm-dd-yyyy. If you do not use this format, an alert appears. If you submit the date with an incorrect format, the date field is submitted as a blank entry.
Watermark Text To print text as a watermark on each page of the report, use the pop-up menu to either choose one of the standard phrases or choose Custom and enter the text you want to print as a watermark in the field.
Watermark Mode Use the pop-up menu to determine how you want the text to print. Watermark prints the text behind objects on the report, while Overlay prints the text over objects on the report.
When to print Select a time to run the report:
• ASAP: Execute immediately. • At Night: Execute during the next evening. • On Weekend: Execute during the next weekend. • On Specific Date/Time: Execute on the date and
time specified in the following fields using the format mm/dd/yyyy or mm-dd-yyyy. If you do not use this format, an alert appears. If you submit the date with an incorrect format, the date field is submitted as a blank entry.
5. Click Submit. The report queue appears. 6. Click View once the report is completed.
Note: Click Refresh to update the status of the report.
The page displays a PDF file of the report. Thoroughly review it to verify that the formatting and content are correct. If the report provides the data you need and is formatted properly, print it from this page or save it to another application.
Reports User Guide
Report Formatting 17
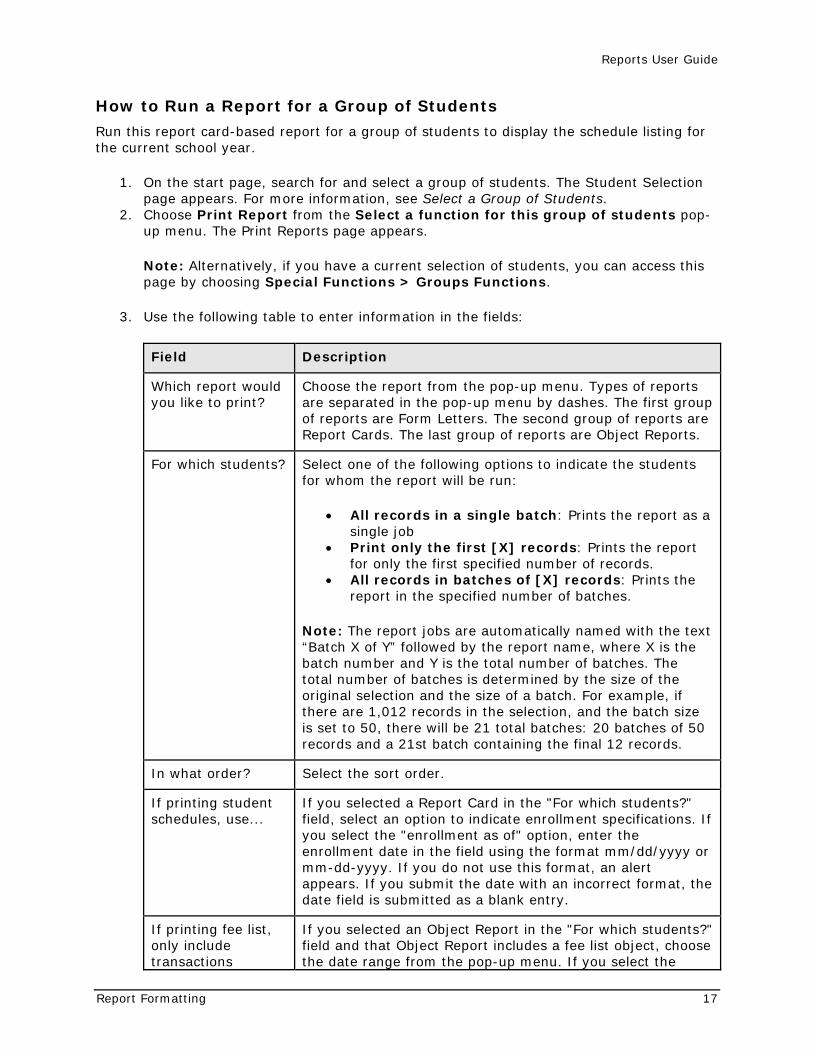
How to Run a Report for a Group of Students
Run this report card-based report for a group of students to display the schedule listing for the current school year.
1. On the start page, search for and select a group of students. The Student Selection page appears. For more information, see Select a Group of Students.
2. Choose Print Report from the Select a function for this group of students pop-up menu. The Print Reports page appears.
Note: Alternatively, if you have a current selection of students, you can access this page by choosing Special Functions > Groups Functions.
3. Use the following table to enter information in the fields:
Field Description
Which report would you like to print?
Choose the report from the pop-up menu. Types of reports are separated in the pop-up menu by dashes. The first group of reports are Form Letters. The second group of reports are Report Cards. The last group of reports are Object Reports.
For which students? Select one of the following options to indicate the students for whom the report will be run:
• All records in a single batch: Prints the report as a single job
• Print only the first [X] records: Prints the report for only the first specified number of records.
• All records in batches of [X] records: Prints the report in the specified number of batches.
Note: The report jobs are automatically named with the text “Batch X of Y” followed by the report name, where X is the batch number and Y is the total number of batches. The total number of batches is determined by the size of the original selection and the size of a batch. For example, if there are 1,012 records in the selection, and the batch size is set to 50, there will be 21 total batches: 20 batches of 50 records and a 21st batch containing the final 12 records.
In what order? Select the sort order.
If printing student schedules, use...
If you selected a Report Card in the "For which students?" field, select an option to indicate enrollment specifications. If you select the "enrollment as of" option, enter the enrollment date in the field using the format mm/dd/yyyy or mm-dd-yyyy. If you do not use this format, an alert appears. If you submit the date with an incorrect format, the date field is submitted as a blank entry.
If printing fee list, only include transactions
If you selected an Object Report in the "For which students?" field and that Object Report includes a fee list object, choose the date range from the pop-up menu. If you select the
Reports User Guide
Report Formatting 18
Field Description
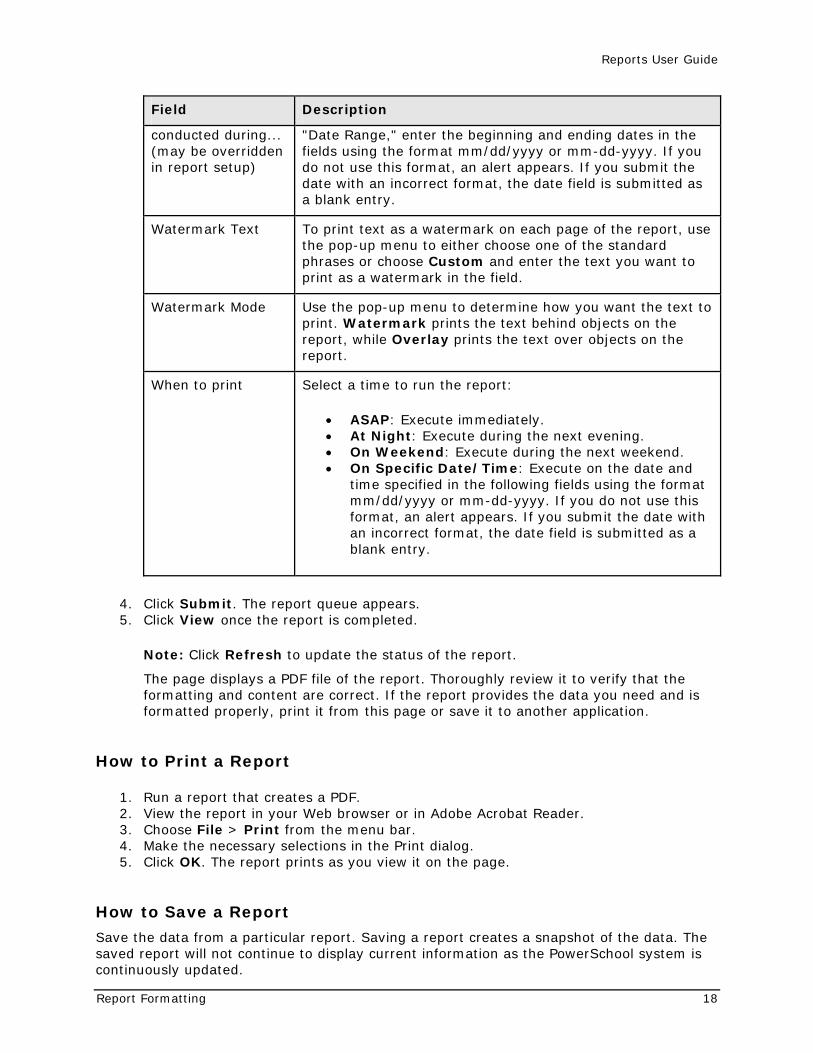
conducted during... (may be overridden in report setup)
"Date Range," enter the beginning and ending dates in the fields using the format mm/dd/yyyy or mm-dd-yyyy. If you do not use this format, an alert appears. If you submit the date with an incorrect format, the date field is submitted as a blank entry.
Watermark Text To print text as a watermark on each page of the report, use the pop-up menu to either choose one of the standard phrases or choose Custom and enter the text you want to print as a watermark in the field.
Watermark Mode Use the pop-up menu to determine how you want the text to print. Watermark prints the text behind objects on the report, while Overlay prints the text over objects on the report.
When to print Select a time to run the report:
• ASAP: Execute immediately. • At Night: Execute during the next evening. • On Weekend: Execute during the next weekend. • On Specific Date/Time: Execute on the date and
time specified in the following fields using the format mm/dd/yyyy or mm-dd-yyyy. If you do not use this format, an alert appears. If you submit the date with an incorrect format, the date field is submitted as a blank entry.
4. Click Submit. The report queue appears. 5. Click View once the report is completed.
Note: Click Refresh to update the status of the report.
The page displays a PDF file of the report. Thoroughly review it to verify that the formatting and content are correct. If the report provides the data you need and is formatted properly, print it from this page or save it to another application.
How to Print a Report
1. Run a report that creates a PDF. 2. View the report in your Web browser or in Adobe Acrobat Reader. 3. Choose File > Print from the menu bar. 4. Make the necessary selections in the Print dialog. 5. Click OK. The report prints as you view it on the page.
How to Save a Report
Save the data from a particular report. Saving a report creates a snapshot of the data. The saved report will not continue to display current information as the PowerSchool system is continuously updated.
Reports User Guide
Report Formatting 19
Note: Not all reports can be saved.
1. Run a report that creates a PDF. 2. View the report in your Web browser or in Adobe Acrobat Reader. 3. Choose File > Save As from the menu. 4. Enter a file name for the report. If you think you will forget it, write it down. 5. Click Save. The report is saved. Open it using a procedure similar to opening a
document in a word processing or spreadsheet application.
Alternate Ways to Create Reports There are some shortcuts to creating a report from scratch. One way is to use a report template that someone else has already created. The second way is to copy a template that is already on your PowerSchool system. The third way is to create a template in a word processing application and paste it into a PowerSchool template.
How to Use a Template From Another PowerSchool System
There are two parts to using an existing template. First, download (or export) it from a PowerSchool system. Then, import it to a second PowerSchool system for the person who wants to use it. This process is just like copying a document from one hard drive to your own. The only difference is that you are copying a report template from one PowerSchool system to another. For more information, see Report Templates.
How to Copy a Template From Your PowerSchool System
Use the procedures discussed in the section Report Templates to copy a template on your own PowerSchool system and import it back to the same PowerSchool system. This is helpful when you need a report similar to an existing one with only minor changes. Be sure to give the template a different name so that you do not end up with two templates of the same name. Once the template is in PowerSchool, edit the parameters to create a new one. This is similar to using the Save As option in many applications. Open an existing document and save it under a different name to save it as two documents. Keep the one in its original format and edit the other.
How to Create a Template in Another Application
This method can be helpful if you do not feel comfortable working outside of a word processing application. You can create the template in an application you know with minimal time spent entering HTML tags and PowerSchool data codes. The idea is to create the template using a word processing application and then paste it into a PowerSchool template, while replacing the appropriate sections with some HTML tags and data codes. To create PowerSchool templates, create and save Report Cards, Mailing Labels, Form Letters, and Object Reports to reuse as templates.
Reports User Guide
Preconfigured Reports 20
Preconfigured Reports Preconfigured reports are those that come with the PowerSchool system and include preset parameters. Created because they contain information that PowerSchool administrators need most often, they are generally easier to run than custom reports. However, a preconfigured report is limited to the information included in the report template. The only parameter you can select is which students to include on the report.
For details on all preconfigured reports, see Attendance Reports, Attendance Count and Audit Reports, Discipline Reports, Grade and Gradebook Reports, Membership Reports, Enrollment Reports, Scheduling, Statistics, Student Listings, Standards Reports, and Single Student Standards Report. You are also encouraged to see the section Custom Reports before creating a report to give you an understanding of the process of creating reports, which will make running reports much easier.
While you can run all reports on individual students, you can also run many for a selected group of students. If a report allows group reporting, first select the group of students. For more information, see Select a Group of Students. Click the PowerSchool logo to return to the start page and begin work on a report. PowerSchool remembers the group and prompts you to select it when you enter the report parameters.
Attendance Reports Before producing attendance reports, you are encouraged to ask your PowerSchool administrator how your school calculates attendance. For example, does your school report how many days students are present or how many days they are absent?
To search for students with perfect attendance, see Advanced Search and Select. For more information about attendance count and audit reports, see Attendance Count Report, the Class Attendance Audit Report, and the Student Attendance Audit Report.
To indicate a selection of students when running a report, select that group of students before running the reports. If you select a group of students from the start page, the Group Functions page appears either immediately or after selecting students from the Student Selection page.
For more information about attendance, see Attendance Overview.
How to Run the Absentee Report
Use the Absentee report to generate single-day period-by-period attendance code information. For example, you can use this report to search for students who received an unexcused absence code for the previous day. You can then contact the students' guardian to verify whether or not the student actually has an excused absence.
Note: You can search on any absent or present attendance code that is stored in the database. However, instances where the absence of an attendance code indicates a presence is not searchable as an attendance code value is not stored in the database.
Note: You can also access this report by clicking Attendance > Absentee Report.
1. On the start page, choose Reports from the main menu. The Reports page appears.
Reports User Guide
Preconfigured Reports 21
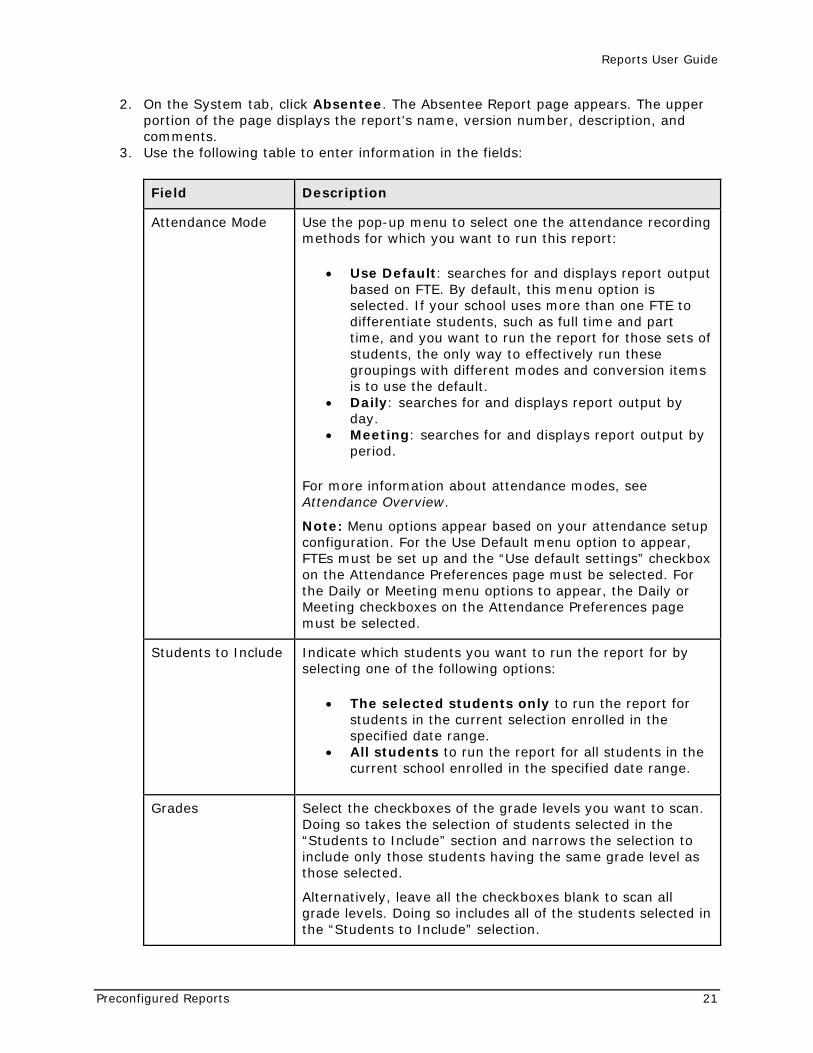
2. On the System tab, click Absentee. The Absentee Report page appears. The upper portion of the page displays the report's name, version number, description, and comments.
3. Use the following table to enter information in the fields:
Field Description
Attendance Mode Use the pop-up menu to select one the attendance recording methods for which you want to run this report:
• Use Default: searches for and displays report output based on FTE. By default, this menu option is selected. If your school uses more than one FTE to differentiate students, such as full time and part time, and you want to run the report for those sets of students, the only way to effectively run these groupings with different modes and conversion items is to use the default.
• Daily: searches for and displays report output by day.
• Meeting: searches for and displays report output by period.
For more information about attendance modes, see Attendance Overview.
Note: Menu options appear based on your attendance setup configuration. For the Use Default menu option to appear, FTEs must be set up and the “Use default settings” checkbox on the Attendance Preferences page must be selected. For the Daily or Meeting menu options to appear, the Daily or Meeting checkboxes on the Attendance Preferences page must be selected.
Students to Include Indicate which students you want to run the report for by selecting one of the following options:
• The selected students only to run the report for students in the current selection enrolled in the specified date range.
• All students to run the report for all students in the current school enrolled in the specified date range.
Grades Select the checkboxes of the grade levels you want to scan. Doing so takes the selection of students selected in the “Students to Include” section and narrows the selection to include only those students having the same grade level as those selected.
Alternatively, leave all the checkboxes blank to scan all grade levels. Doing so includes all of the students selected in the “Students to Include” selection.
Reports User Guide
Preconfigured Reports 22
Field Description
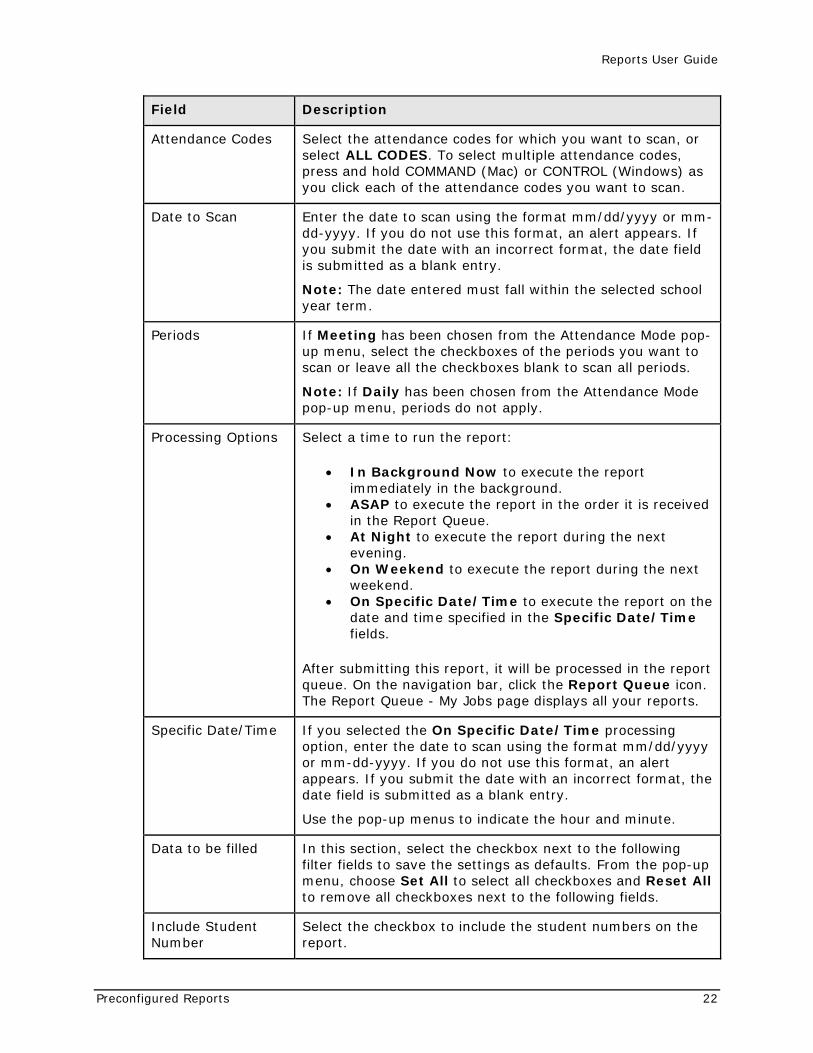
Attendance Codes Select the attendance codes for which you want to scan, or select ALL CODES. To select multiple attendance codes, press and hold COMMAND (Mac) or CONTROL (Windows) as you click each of the attendance codes you want to scan.
Date to Scan Enter the date to scan using the format mm/dd/yyyy or mm-dd-yyyy. If you do not use this format, an alert appears. If you submit the date with an incorrect format, the date field is submitted as a blank entry.
Note: The date entered must fall within the selected school year term.
Periods If Meeting has been chosen from the Attendance Mode pop-up menu, select the checkboxes of the periods you want to scan or leave all the checkboxes blank to scan all periods.
Note: If Daily has been chosen from the Attendance Mode pop-up menu, periods do not apply.
Processing Options Select a time to run the report:
• In Background Now to execute the report immediately in the background.
• ASAP to execute the report in the order it is received in the Report Queue.
• At Night to execute the report during the next evening.
• On Weekend to execute the report during the next weekend.
• On Specific Date/Time to execute the report on the date and time specified in the Specific Date/Time fields.
After submitting this report, it will be processed in the report queue. On the navigation bar, click the Report Queue icon. The Report Queue - My Jobs page displays all your reports.
Specific Date/Time If you selected the On Specific Date/Time processing option, enter the date to scan using the format mm/dd/yyyy or mm-dd-yyyy. If you do not use this format, an alert appears. If you submit the date with an incorrect format, the date field is submitted as a blank entry.
Use the pop-up menus to indicate the hour and minute.
Data to be filled In this section, select the checkbox next to the following filter fields to save the settings as defaults. From the pop-up menu, choose Set All to select all checkboxes and Reset All to remove all checkboxes next to the following fields.
Include Student Number
Select the checkbox to include the student numbers on the report.
Reports User Guide
Preconfigured Reports 23
Field Description
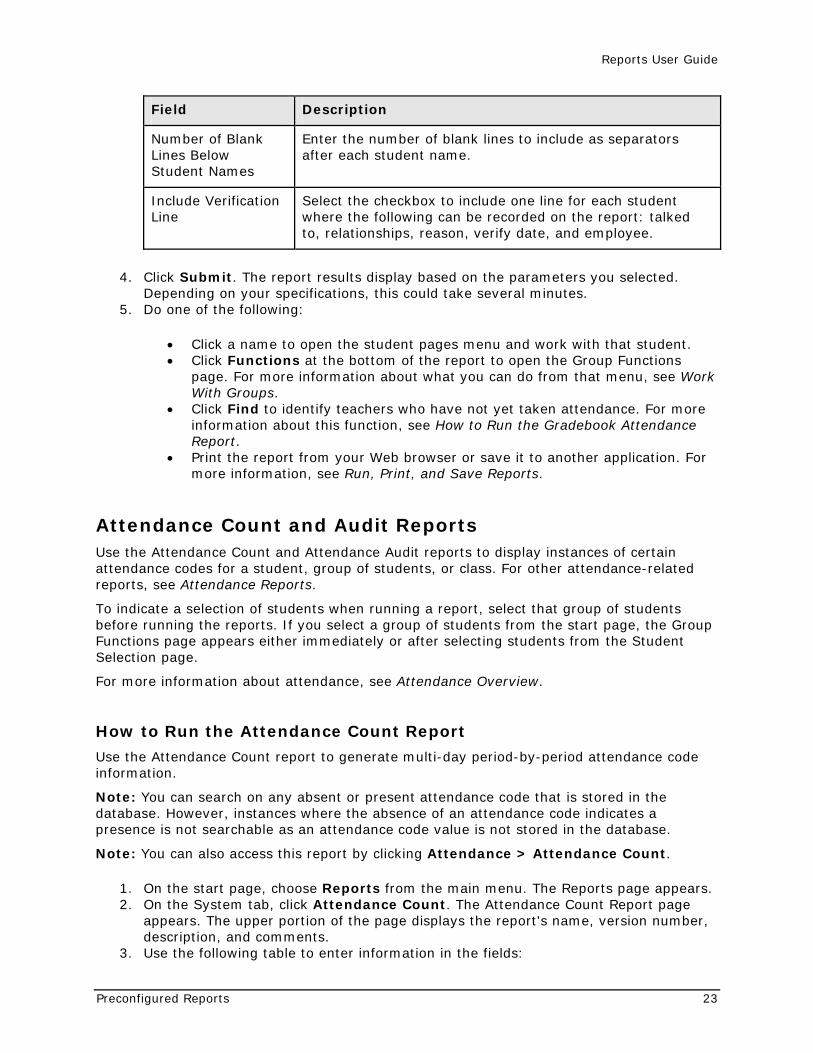
Number of Blank Lines Below Student Names
Enter the number of blank lines to include as separators after each student name.
Include Verification Line
Select the checkbox to include one line for each student where the following can be recorded on the report: talked to, relationships, reason, verify date, and employee.
4. Click Submit. The report results display based on the parameters you selected. Depending on your specifications, this could take several minutes.
5. Do one of the following:
• Click a name to open the student pages menu and work with that student. • Click Functions at the bottom of the report to open the Group Functions
page. For more information about what you can do from that menu, see Work With Groups.
• Click Find to identify teachers who have not yet taken attendance. For more information about this function, see How to Run the Gradebook Attendance Report.
• Print the report from your Web browser or save it to another application. For more information, see Run, Print, and Save Reports.
Attendance Count and Audit Reports Use the Attendance Count and Attendance Audit reports to display instances of certain attendance codes for a student, group of students, or class. For other attendance-related reports, see Attendance Reports.
To indicate a selection of students when running a report, select that group of students before running the reports. If you select a group of students from the start page, the Group Functions page appears either immediately or after selecting students from the Student Selection page.
For more information about attendance, see Attendance Overview.
How to Run the Attendance Count Report
Use the Attendance Count report to generate multi-day period-by-period attendance code information.
Note: You can search on any absent or present attendance code that is stored in the database. However, instances where the absence of an attendance code indicates a presence is not searchable as an attendance code value is not stored in the database.
Note: You can also access this report by clicking Attendance > Attendance Count.
1. On the start page, choose Reports from the main menu. The Reports page appears. 2. On the System tab, click Attendance Count. The Attendance Count Report page
appears. The upper portion of the page displays the report's name, version number, description, and comments.
3. Use the following table to enter information in the fields:
Reports User Guide
Preconfigured Reports 24
Field Description
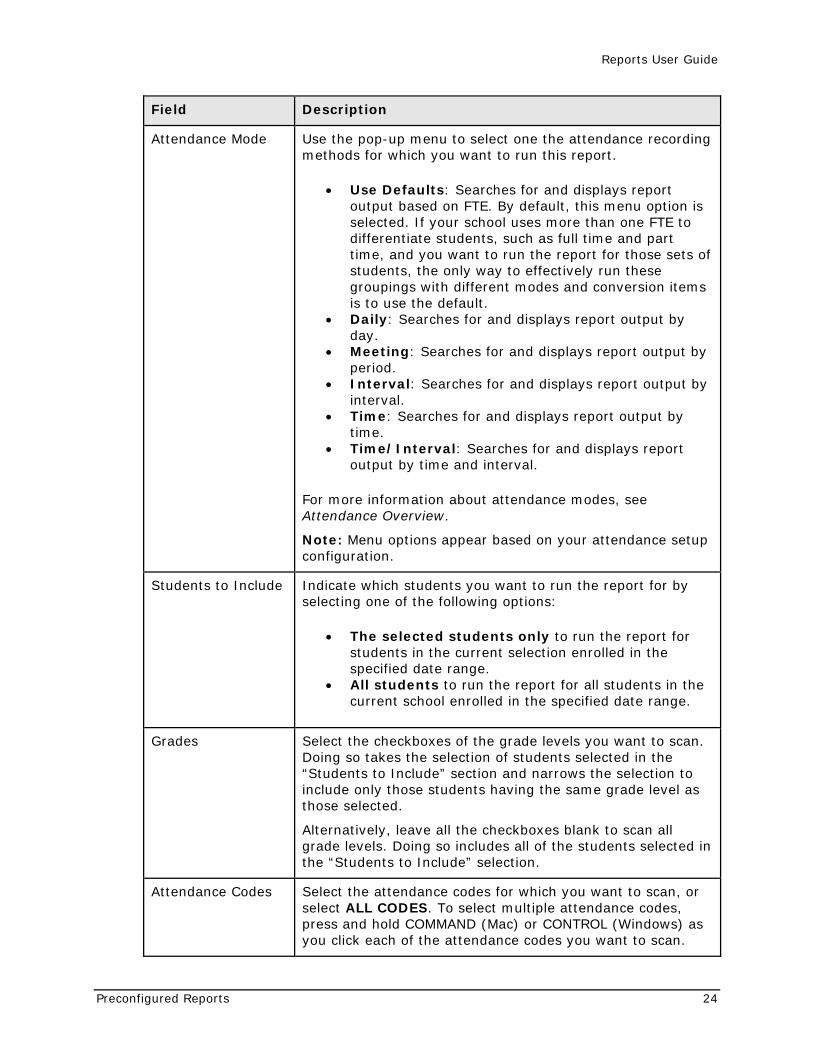
Attendance Mode Use the pop-up menu to select one the attendance recording methods for which you want to run this report.
• Use Defaults: Searches for and displays report output based on FTE. By default, this menu option is selected. If your school uses more than one FTE to differentiate students, such as full time and part time, and you want to run the report for those sets of students, the only way to effectively run these groupings with different modes and conversion items is to use the default.
• Daily: Searches for and displays report output by day.
• Meeting: Searches for and displays report output by period.
• Interval: Searches for and displays report output by interval.
• Time: Searches for and displays report output by time.
• Time/Interval: Searches for and displays report output by time and interval.
For more information about attendance modes, see Attendance Overview.
Note: Menu options appear based on your attendance setup configuration.
Students to Include Indicate which students you want to run the report for by selecting one of the following options:
• The selected students only to run the report for students in the current selection enrolled in the specified date range.
• All students to run the report for all students in the current school enrolled in the specified date range.
Grades Select the checkboxes of the grade levels you want to scan. Doing so takes the selection of students selected in the “Students to Include” section and narrows the selection to include only those students having the same grade level as those selected.
Alternatively, leave all the checkboxes blank to scan all grade levels. Doing so includes all of the students selected in the “Students to Include” selection.
Attendance Codes Select the attendance codes for which you want to scan, or select ALL CODES. To select multiple attendance codes, press and hold COMMAND (Mac) or CONTROL (Windows) as you click each of the attendance codes you want to scan.
Reports User Guide
Preconfigured Reports 25
Field Description
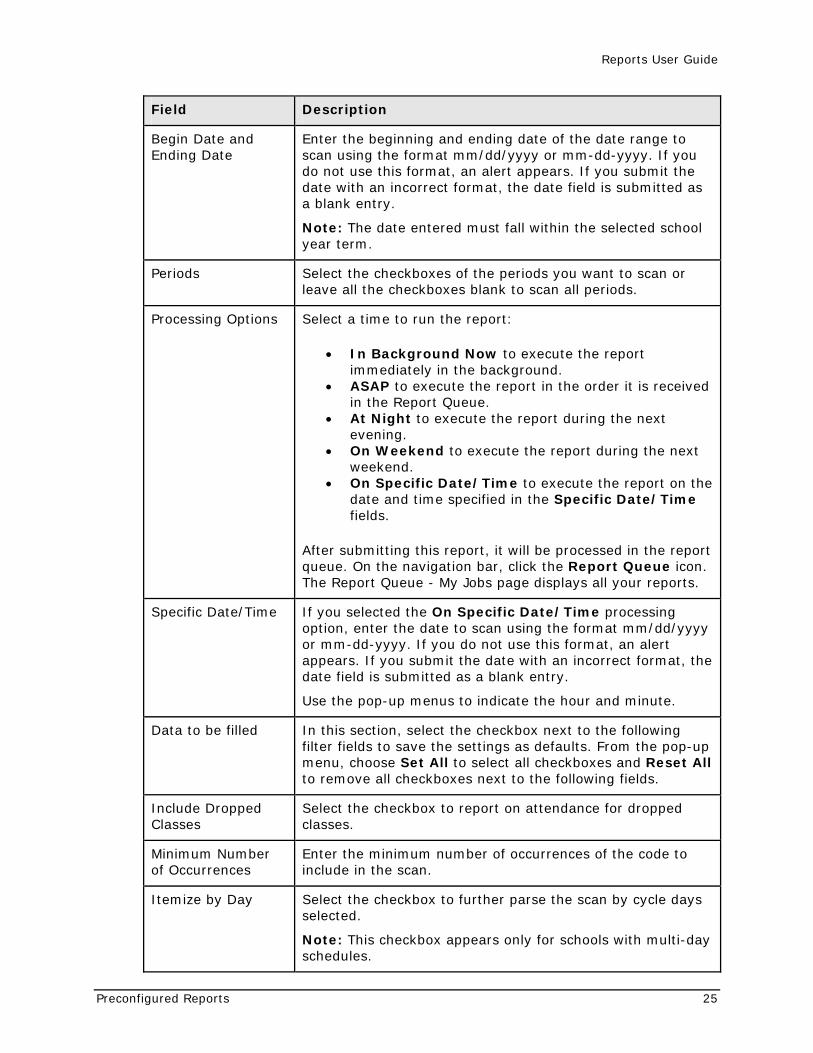
Begin Date and Ending Date
Enter the beginning and ending date of the date range to scan using the format mm/dd/yyyy or mm-dd-yyyy. If you do not use this format, an alert appears. If you submit the date with an incorrect format, the date field is submitted as a blank entry.
Note: The date entered must fall within the selected school year term.
Periods Select the checkboxes of the periods you want to scan or leave all the checkboxes blank to scan all periods.
Processing Options Select a time to run the report:
• In Background Now to execute the report immediately in the background.
• ASAP to execute the report in the order it is received in the Report Queue.
• At Night to execute the report during the next evening.
• On Weekend to execute the report during the next weekend.
• On Specific Date/Time to execute the report on the date and time specified in the Specific Date/Time fields.
After submitting this report, it will be processed in the report queue. On the navigation bar, click the Report Queue icon. The Report Queue - My Jobs page displays all your reports.
Specific Date/Time If you selected the On Specific Date/Time processing option, enter the date to scan using the format mm/dd/yyyy or mm-dd-yyyy. If you do not use this format, an alert appears. If you submit the date with an incorrect format, the date field is submitted as a blank entry.
Use the pop-up menus to indicate the hour and minute.
Data to be filled In this section, select the checkbox next to the following filter fields to save the settings as defaults. From the pop-up menu, choose Set All to select all checkboxes and Reset All to remove all checkboxes next to the following fields.
Include Dropped Classes
Select the checkbox to report on attendance for dropped classes.
Minimum Number of Occurrences
Enter the minimum number of occurrences of the code to include in the scan.
Itemize by Day Select the checkbox to further parse the scan by cycle days selected.
Note: This checkbox appears only for schools with multi-day schedules.
Reports User Guide
Preconfigured Reports 26
Field Description
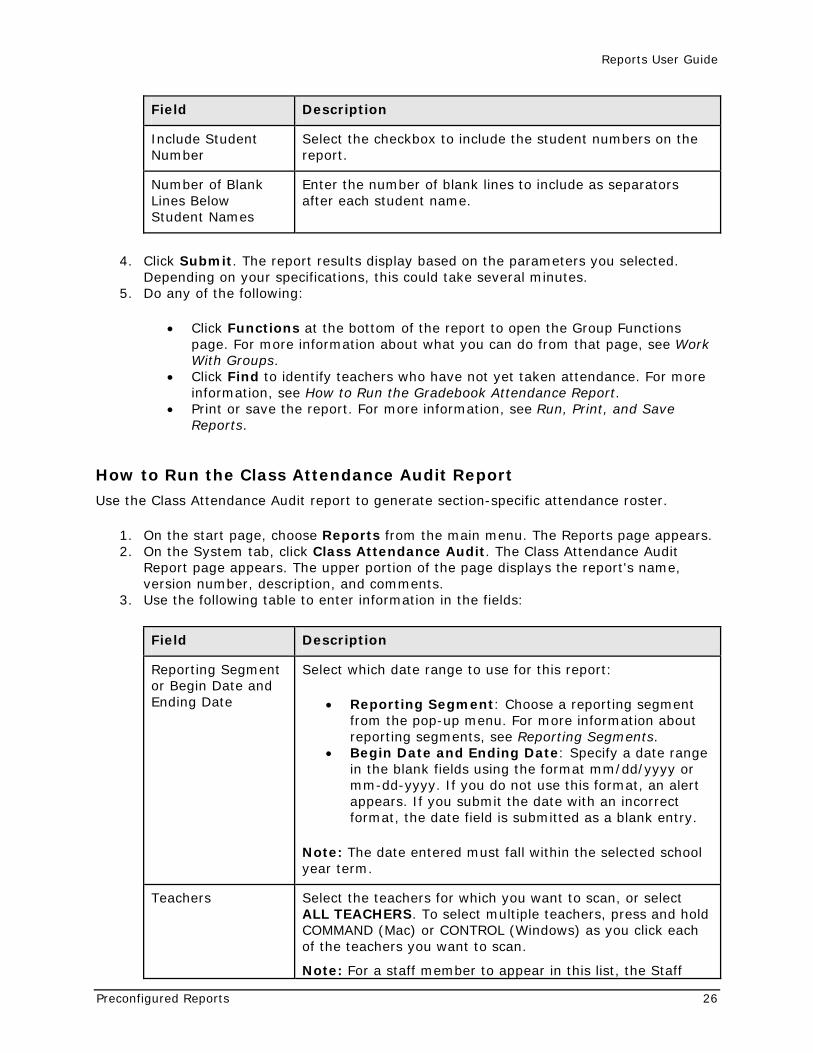
Include Student Number
Select the checkbox to include the student numbers on the report.
Number of Blank Lines Below Student Names
Enter the number of blank lines to include as separators after each student name.
4. Click Submit. The report results display based on the parameters you selected. Depending on your specifications, this could take several minutes.
5. Do any of the following:
• Click Functions at the bottom of the report to open the Group Functions page. For more information about what you can do from that page, see Work With Groups.
• Click Find to identify teachers who have not yet taken attendance. For more information, see How to Run the Gradebook Attendance Report.
• Print or save the report. For more information, see Run, Print, and Save Reports.
How to Run the Class Attendance Audit Report
Use the Class Attendance Audit report to generate section-specific attendance roster.
1. On the start page, choose Reports from the main menu. The Reports page appears. 2. On the System tab, click Class Attendance Audit. The Class Attendance Audit
Report page appears. The upper portion of the page displays the report's name, version number, description, and comments.
3. Use the following table to enter information in the fields:
Field Description
Reporting Segment or Begin Date and Ending Date
Select which date range to use for this report:
• Reporting Segment: Choose a reporting segment from the pop-up menu. For more information about reporting segments, see Reporting Segments.
• Begin Date and Ending Date: Specify a date range in the blank fields using the format mm/dd/yyyy or mm-dd-yyyy. If you do not use this format, an alert appears. If you submit the date with an incorrect format, the date field is submitted as a blank entry.
Note: The date entered must fall within the selected school year term.
Teachers Select the teachers for which you want to scan, or select ALL TEACHERS. To select multiple teachers, press and hold COMMAND (Mac) or CONTROL (Windows) as you click each of the teachers you want to scan.
Note: For a staff member to appear in this list, the Staff
Reports User Guide
Preconfigured Reports 27
Field Description
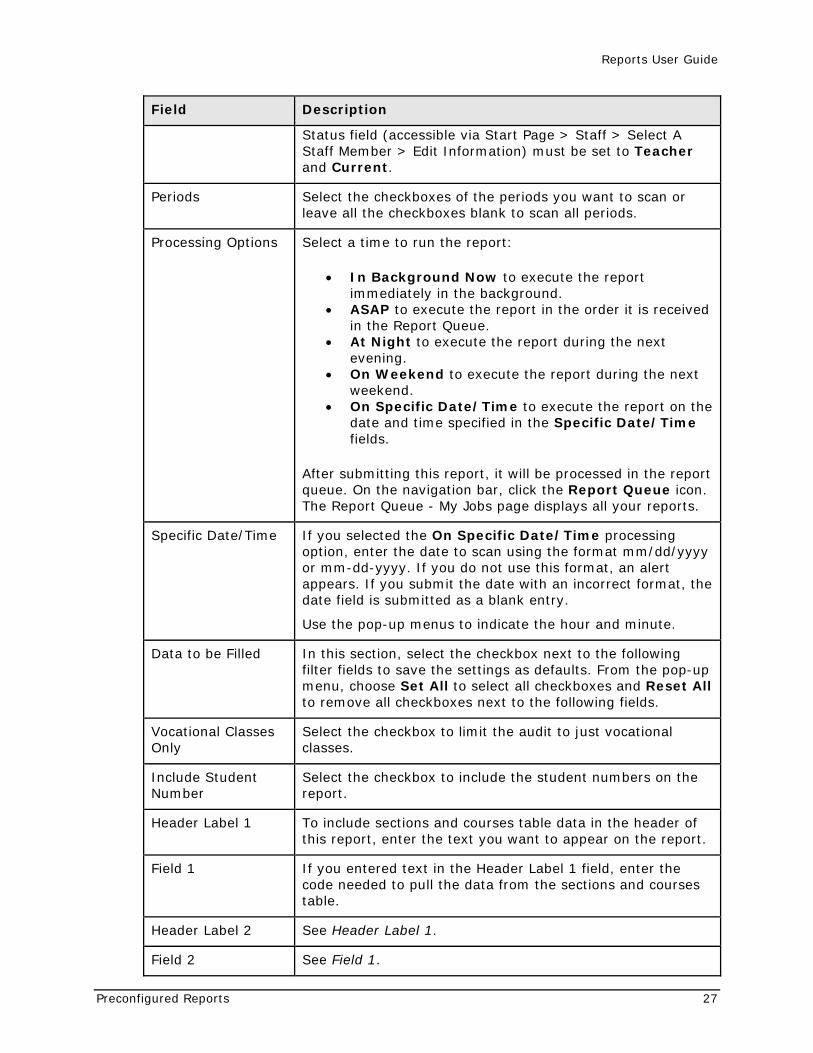
Status field (accessible via Start Page > Staff > Select A Staff Member > Edit Information) must be set to Teacher and Current.
Periods Select the checkboxes of the periods you want to scan or leave all the checkboxes blank to scan all periods.
Processing Options Select a time to run the report:
• In Background Now to execute the report immediately in the background.
• ASAP to execute the report in the order it is received in the Report Queue.
• At Night to execute the report during the next evening.
• On Weekend to execute the report during the next weekend.
• On Specific Date/Time to execute the report on the date and time specified in the Specific Date/Time fields.
After submitting this report, it will be processed in the report queue. On the navigation bar, click the Report Queue icon. The Report Queue - My Jobs page displays all your reports.
Specific Date/Time If you selected the On Specific Date/Time processing option, enter the date to scan using the format mm/dd/yyyy or mm-dd-yyyy. If you do not use this format, an alert appears. If you submit the date with an incorrect format, the date field is submitted as a blank entry.
Use the pop-up menus to indicate the hour and minute.
Data to be Filled In this section, select the checkbox next to the following filter fields to save the settings as defaults. From the pop-up menu, choose Set All to select all checkboxes and Reset All to remove all checkboxes next to the following fields.
Vocational Classes Only
Select the checkbox to limit the audit to just vocational classes.
Include Student Number
Select the checkbox to include the student numbers on the report.
Header Label 1 To include sections and courses table data in the header of this report, enter the text you want to appear on the report.
Field 1 If you entered text in the Header Label 1 field, enter the code needed to pull the data from the sections and courses table.
Header Label 2 See Header Label 1.
Field 2 See Field 1.
Reports User Guide
Preconfigured Reports 28
Field Description
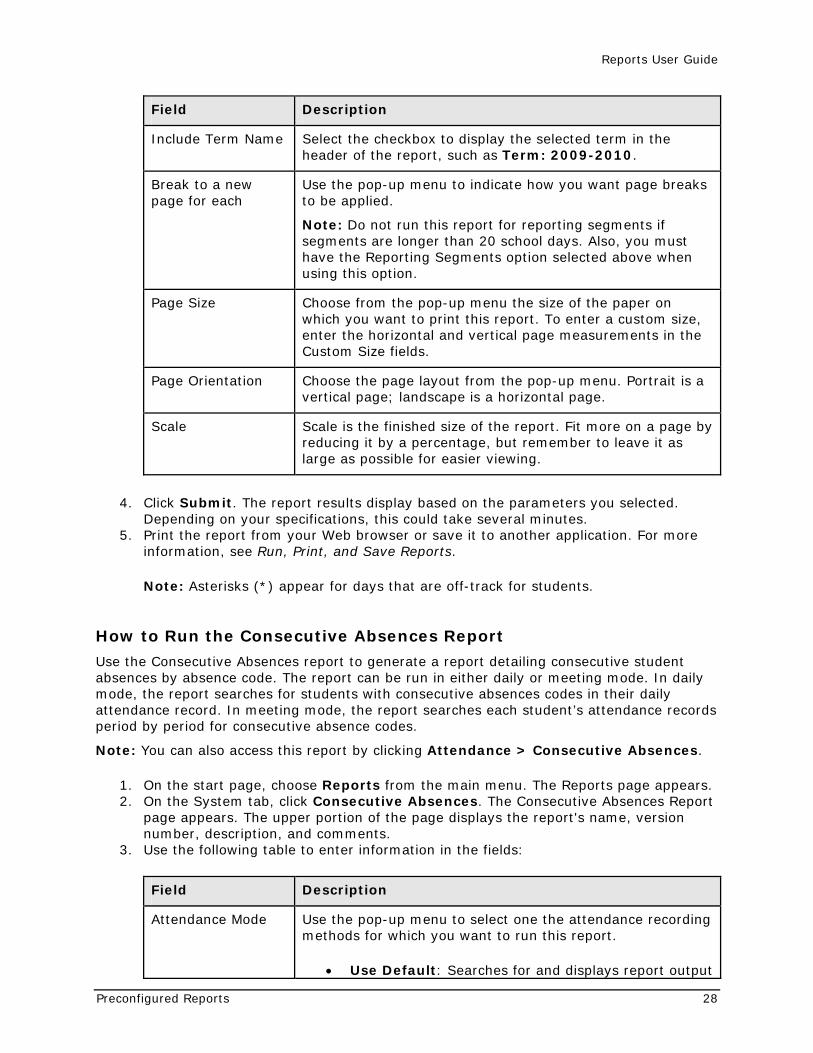
Include Term Name Select the checkbox to display the selected term in the header of the report, such as Term: 2009-2010.
Break to a new page for each
Use the pop-up menu to indicate how you want page breaks to be applied.
Note: Do not run this report for reporting segments if segments are longer than 20 school days. Also, you must have the Reporting Segments option selected above when using this option.
Page Size Choose from the pop-up menu the size of the paper on which you want to print this report. To enter a custom size, enter the horizontal and vertical page measurements in the Custom Size fields.
Page Orientation Choose the page layout from the pop-up menu. Portrait is a vertical page; landscape is a horizontal page.
Scale Scale is the finished size of the report. Fit more on a page by reducing it by a percentage, but remember to leave it as large as possible for easier viewing.
4. Click Submit. The report results display based on the parameters you selected. Depending on your specifications, this could take several minutes.
5. Print the report from your Web browser or save it to another application. For more information, see Run, Print, and Save Reports.
Note: Asterisks (*) appear for days that are off-track for students.
How to Run the Consecutive Absences Report
Use the Consecutive Absences report to generate a report detailing consecutive student absences by absence code. The report can be run in either daily or meeting mode. In daily mode, the report searches for students with consecutive absences codes in their daily attendance record. In meeting mode, the report searches each student’s attendance records period by period for consecutive absence codes.
Note: You can also access this report by clicking Attendance > Consecutive Absences.
1. On the start page, choose Reports from the main menu. The Reports page appears. 2. On the System tab, click Consecutive Absences. The Consecutive Absences Report
page appears. The upper portion of the page displays the report's name, version number, description, and comments.
3. Use the following table to enter information in the fields:
Field Description
Attendance Mode Use the pop-up menu to select one the attendance recording methods for which you want to run this report.
• Use Default: Searches for and displays report output
Reports User Guide
Preconfigured Reports 29
Field Description
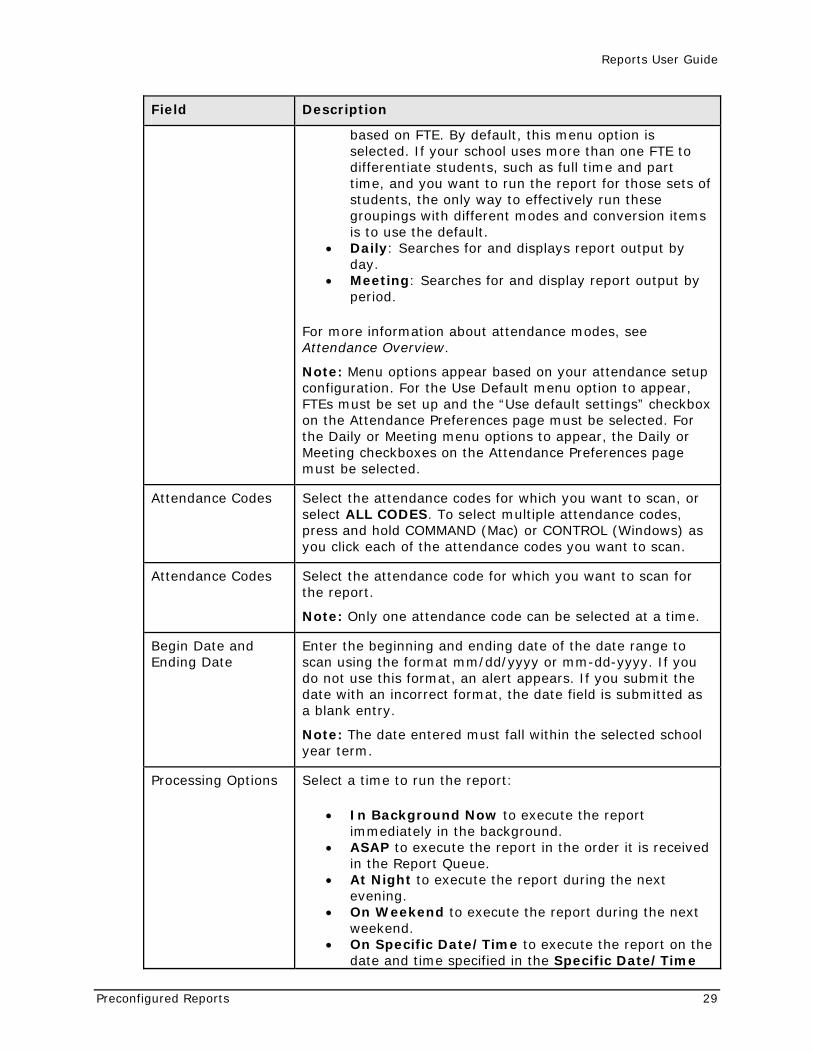
based on FTE. By default, this menu option is selected. If your school uses more than one FTE to differentiate students, such as full time and part time, and you want to run the report for those sets of students, the only way to effectively run these groupings with different modes and conversion items is to use the default.
• Daily: Searches for and displays report output by day.
• Meeting: Searches for and display report output by period.
For more information about attendance modes, see Attendance Overview.
Note: Menu options appear based on your attendance setup configuration. For the Use Default menu option to appear, FTEs must be set up and the “Use default settings” checkbox on the Attendance Preferences page must be selected. For the Daily or Meeting menu options to appear, the Daily or Meeting checkboxes on the Attendance Preferences page must be selected.
Attendance Codes Select the attendance codes for which you want to scan, or select ALL CODES. To select multiple attendance codes, press and hold COMMAND (Mac) or CONTROL (Windows) as you click each of the attendance codes you want to scan.
Attendance Codes Select the attendance code for which you want to scan for the report.
Note: Only one attendance code can be selected at a time.
Begin Date and Ending Date
Enter the beginning and ending date of the date range to scan using the format mm/dd/yyyy or mm-dd-yyyy. If you do not use this format, an alert appears. If you submit the date with an incorrect format, the date field is submitted as a blank entry.
Note: The date entered must fall within the selected school year term.
Processing Options Select a time to run the report:
• In Background Now to execute the report immediately in the background.
• ASAP to execute the report in the order it is received in the Report Queue.
• At Night to execute the report during the next evening.
• On Weekend to execute the report during the next weekend.
• On Specific Date/Time to execute the report on the date and time specified in the Specific Date/Time
Reports User Guide
Preconfigured Reports 30
Field Description
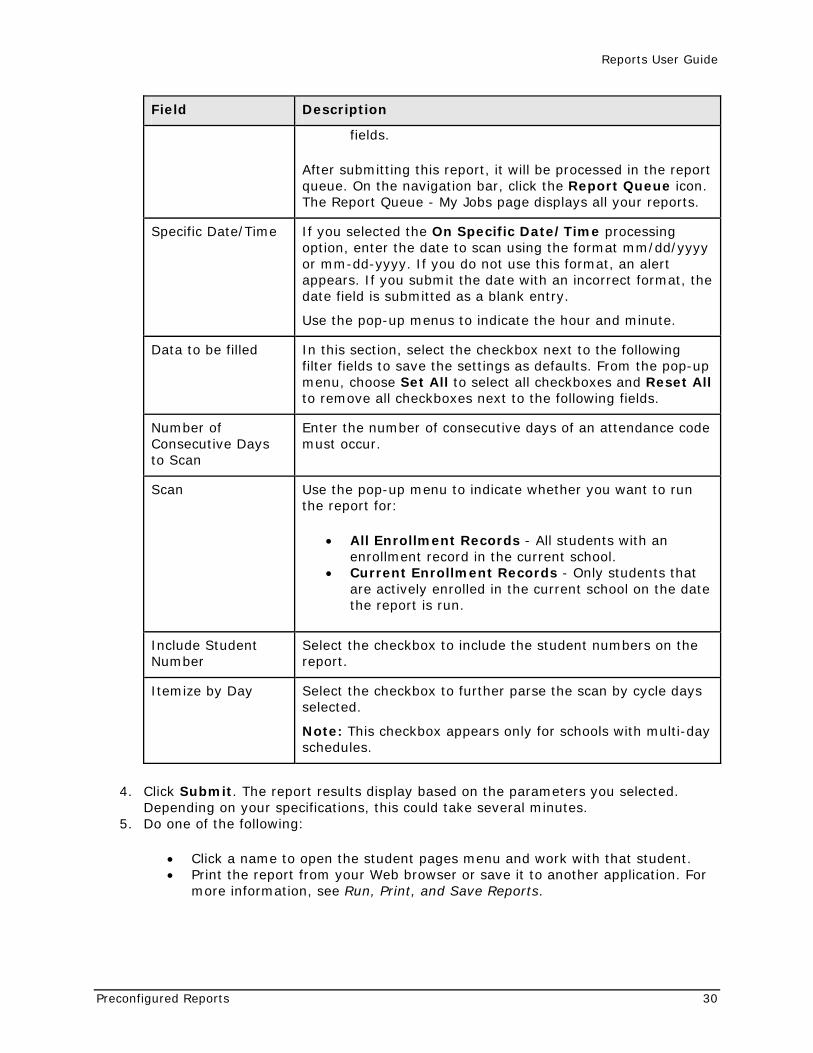
fields.
After submitting this report, it will be processed in the report queue. On the navigation bar, click the Report Queue icon. The Report Queue - My Jobs page displays all your reports.
Specific Date/Time If you selected the On Specific Date/Time processing option, enter the date to scan using the format mm/dd/yyyy or mm-dd-yyyy. If you do not use this format, an alert appears. If you submit the date with an incorrect format, the date field is submitted as a blank entry.
Use the pop-up menus to indicate the hour and minute.
Data to be filled In this section, select the checkbox next to the following filter fields to save the settings as defaults. From the pop-up menu, choose Set All to select all checkboxes and Reset All to remove all checkboxes next to the following fields.
Number of Consecutive Days to Scan
Enter the number of consecutive days of an attendance code must occur.
Scan Use the pop-up menu to indicate whether you want to run the report for:
• All Enrollment Records - All students with an enrollment record in the current school.
• Current Enrollment Records - Only students that are actively enrolled in the current school on the date the report is run.
Include Student Number
Select the checkbox to include the student numbers on the report.
Itemize by Day Select the checkbox to further parse the scan by cycle days selected.
Note: This checkbox appears only for schools with multi-day schedules.
4. Click Submit. The report results display based on the parameters you selected. Depending on your specifications, this could take several minutes.
5. Do one of the following:
• Click a name to open the student pages menu and work with that student. • Print the report from your Web browser or save it to another application. For
more information, see Run, Print, and Save Reports.
Reports User Guide
Preconfigured Reports 31
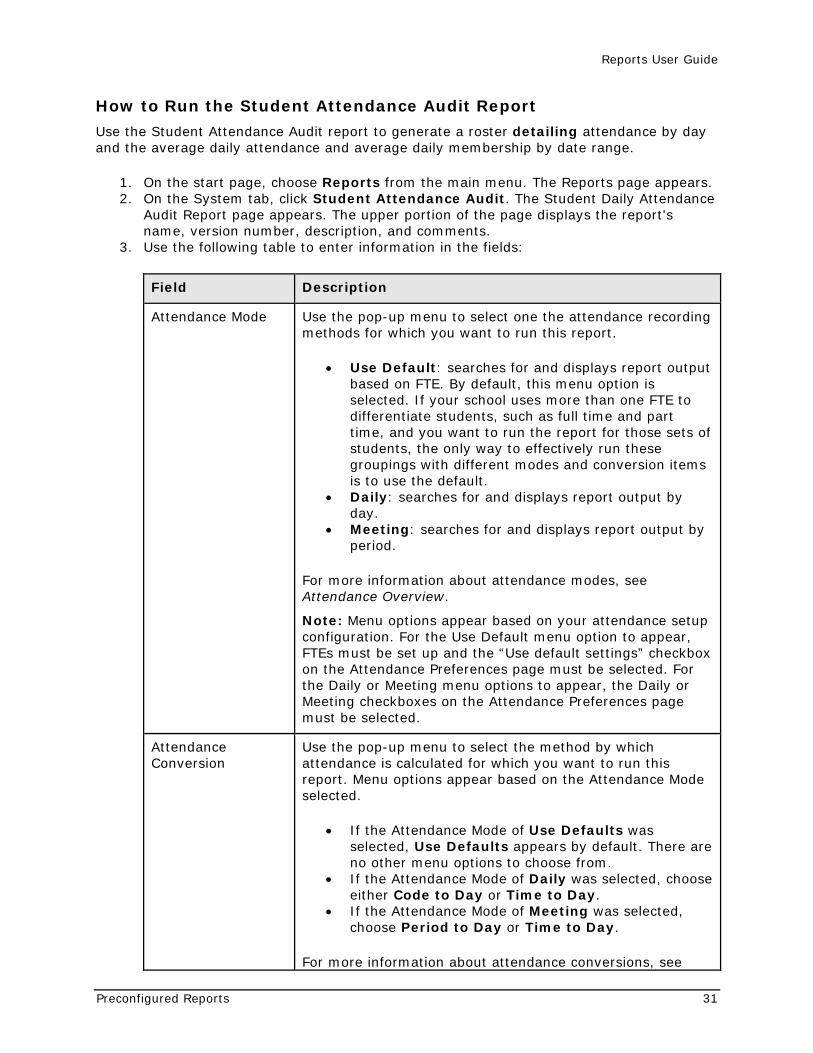
How to Run the Student Attendance Audit Report
Use the Student Attendance Audit report to generate a roster detailing attendance by day and the average daily attendance and average daily membership by date range.
1. On the start page, choose Reports from the main menu. The Reports page appears. 2. On the System tab, click Student Attendance Audit. The Student Daily Attendance
Audit Report page appears. The upper portion of the page displays the report's name, version number, description, and comments.
3. Use the following table to enter information in the fields:
Field Description
Attendance Mode Use the pop-up menu to select one the attendance recording methods for which you want to run this report.
• Use Default: searches for and displays report output based on FTE. By default, this menu option is selected. If your school uses more than one FTE to differentiate students, such as full time and part time, and you want to run the report for those sets of students, the only way to effectively run these groupings with different modes and conversion items is to use the default.
• Daily: searches for and displays report output by day.
• Meeting: searches for and displays report output by period.
For more information about attendance modes, see Attendance Overview.
Note: Menu options appear based on your attendance setup configuration. For the Use Default menu option to appear, FTEs must be set up and the “Use default settings” checkbox on the Attendance Preferences page must be selected. For the Daily or Meeting menu options to appear, the Daily or Meeting checkboxes on the Attendance Preferences page must be selected.
Attendance Conversion
Use the pop-up menu to select the method by which attendance is calculated for which you want to run this report. Menu options appear based on the Attendance Mode selected.
• If the Attendance Mode of Use Defaults was selected, Use Defaults appears by default. There are no other menu options to choose from.
• If the Attendance Mode of Daily was selected, choose either Code to Day or Time to Day.
• If the Attendance Mode of Meeting was selected, choose Period to Day or Time to Day.
For more information about attendance conversions, see
Reports User Guide
Preconfigured Reports 32
Field Description
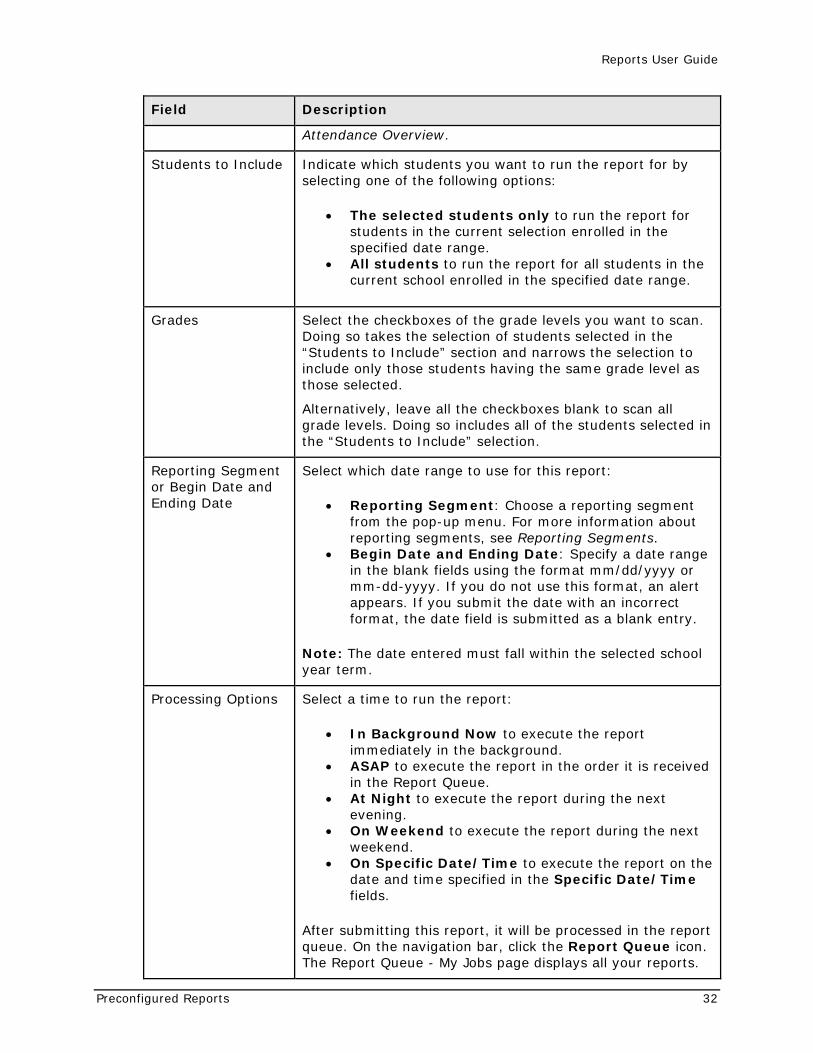
Attendance Overview.
Students to Include Indicate which students you want to run the report for by selecting one of the following options:
• The selected students only to run the report for students in the current selection enrolled in the specified date range.
• All students to run the report for all students in the current school enrolled in the specified date range.
Grades Select the checkboxes of the grade levels you want to scan. Doing so takes the selection of students selected in the “Students to Include” section and narrows the selection to include only those students having the same grade level as those selected.
Alternatively, leave all the checkboxes blank to scan all grade levels. Doing so includes all of the students selected in the “Students to Include” selection.
Reporting Segment or Begin Date and Ending Date
Select which date range to use for this report:
• Reporting Segment: Choose a reporting segment from the pop-up menu. For more information about reporting segments, see Reporting Segments.
• Begin Date and Ending Date: Specify a date range in the blank fields using the format mm/dd/yyyy or mm-dd-yyyy. If you do not use this format, an alert appears. If you submit the date with an incorrect format, the date field is submitted as a blank entry.
Note: The date entered must fall within the selected school year term.
Processing Options Select a time to run the report:
• In Background Now to execute the report immediately in the background.
• ASAP to execute the report in the order it is received in the Report Queue.
• At Night to execute the report during the next evening.
• On Weekend to execute the report during the next weekend.
• On Specific Date/Time to execute the report on the date and time specified in the Specific Date/Time fields.
After submitting this report, it will be processed in the report queue. On the navigation bar, click the Report Queue icon. The Report Queue - My Jobs page displays all your reports.
Reports User Guide
Preconfigured Reports 33
Field Description
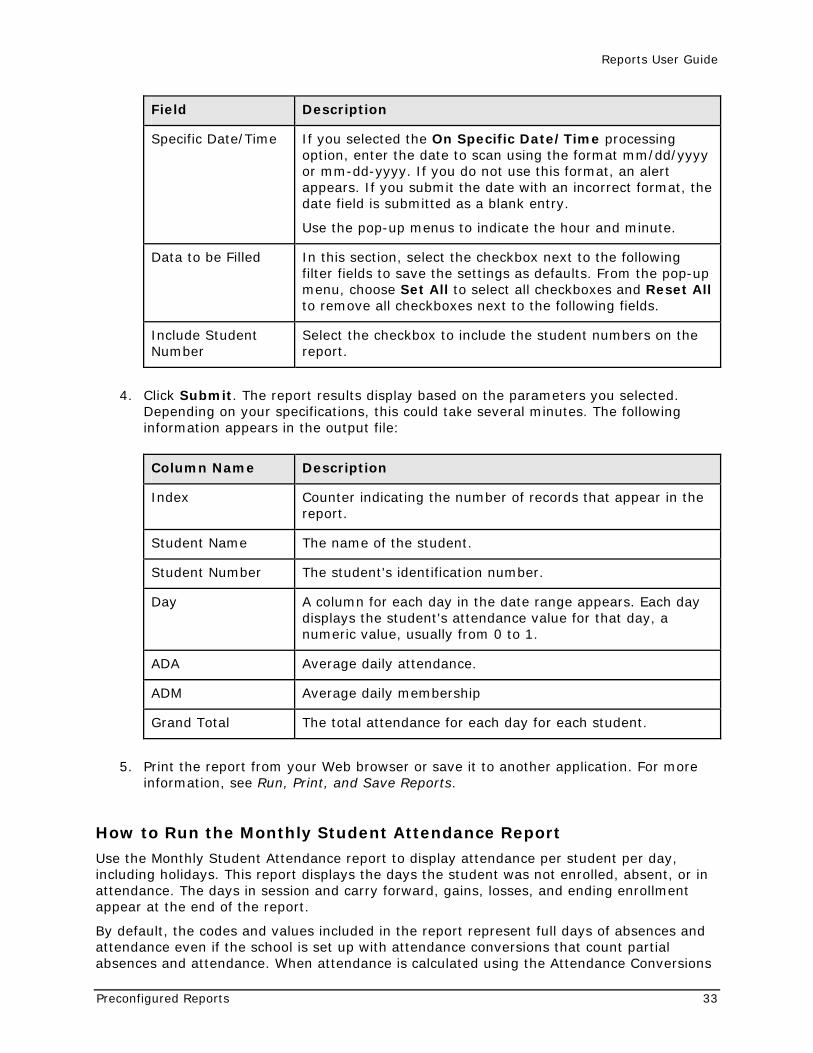
Specific Date/Time If you selected the On Specific Date/Time processing option, enter the date to scan using the format mm/dd/yyyy or mm-dd-yyyy. If you do not use this format, an alert appears. If you submit the date with an incorrect format, the date field is submitted as a blank entry.
Use the pop-up menus to indicate the hour and minute.
Data to be Filled In this section, select the checkbox next to the following filter fields to save the settings as defaults. From the pop-up menu, choose Set All to select all checkboxes and Reset All to remove all checkboxes next to the following fields.
Include Student Number
Select the checkbox to include the student numbers on the report.
4. Click Submit. The report results display based on the parameters you selected. Depending on your specifications, this could take several minutes. The following information appears in the output file:
Column Name Description
Index Counter indicating the number of records that appear in the report.
Student Name The name of the student.
Student Number The student's identification number.
Day A column for each day in the date range appears. Each day displays the student's attendance value for that day, a numeric value, usually from 0 to 1.
ADA Average daily attendance.
ADM Average daily membership
Grand Total The total attendance for each day for each student.
5. Print the report from your Web browser or save it to another application. For more information, see Run, Print, and Save Reports.
How to Run the Monthly Student Attendance Report
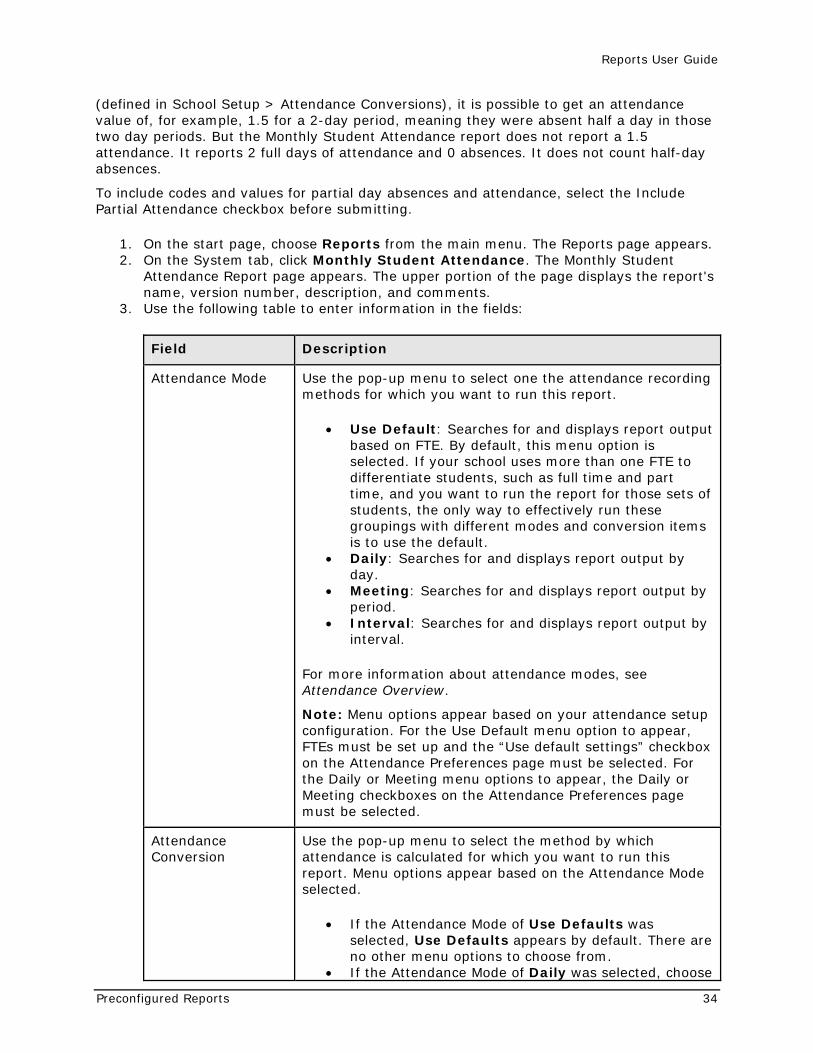
Use the Monthly Student Attendance report to display attendance per student per day, including holidays. This report displays the days the student was not enrolled, absent, or in attendance. The days in session and carry forward, gains, losses, and ending enrollment appear at the end of the report.
By default, the codes and values included in the report represent full days of absences and attendance even if the school is set up with attendance conversions that count partial absences and attendance. When attendance is calculated using the Attendance Conversions
Reports User Guide
Preconfigured Reports 34
(defined in School Setup > Attendance Conversions), it is possible to get an attendance value of, for example, 1.5 for a 2-day period, meaning they were absent half a day in those two day periods. But the Monthly Student Attendance report does not report a 1.5 attendance. It reports 2 full days of attendance and 0 absences. It does not count half-day absences.
To include codes and values for partial day absences and attendance, select the Include Partial Attendance checkbox before submitting.
1. On the start page, choose Reports from the main menu. The Reports page appears. 2. On the System tab, click Monthly Student Attendance. The Monthly Student
Attendance Report page appears. The upper portion of the page displays the report's name, version number, description, and comments.
3. Use the following table to enter information in the fields:
Field Description
Attendance Mode Use the pop-up menu to select one the attendance recording methods for which you want to run this report.
• Use Default: Searches for and displays report output based on FTE. By default, this menu option is selected. If your school uses more than one FTE to differentiate students, such as full time and part time, and you want to run the report for those sets of students, the only way to effectively run these groupings with different modes and conversion items is to use the default.
• Daily: Searches for and displays report output by day.
• Meeting: Searches for and displays report output by period.
• Interval: Searches for and displays report output by interval.
For more information about attendance modes, see Attendance Overview.
Note: Menu options appear based on your attendance setup configuration. For the Use Default menu option to appear, FTEs must be set up and the “Use default settings” checkbox on the Attendance Preferences page must be selected. For the Daily or Meeting menu options to appear, the Daily or Meeting checkboxes on the Attendance Preferences page must be selected.
Attendance Conversion
Use the pop-up menu to select the method by which attendance is calculated for which you want to run this report. Menu options appear based on the Attendance Mode selected.
• If the Attendance Mode of Use Defaults was selected, Use Defaults appears by default. There are no other menu options to choose from.
• If the Attendance Mode of Daily was selected, choose
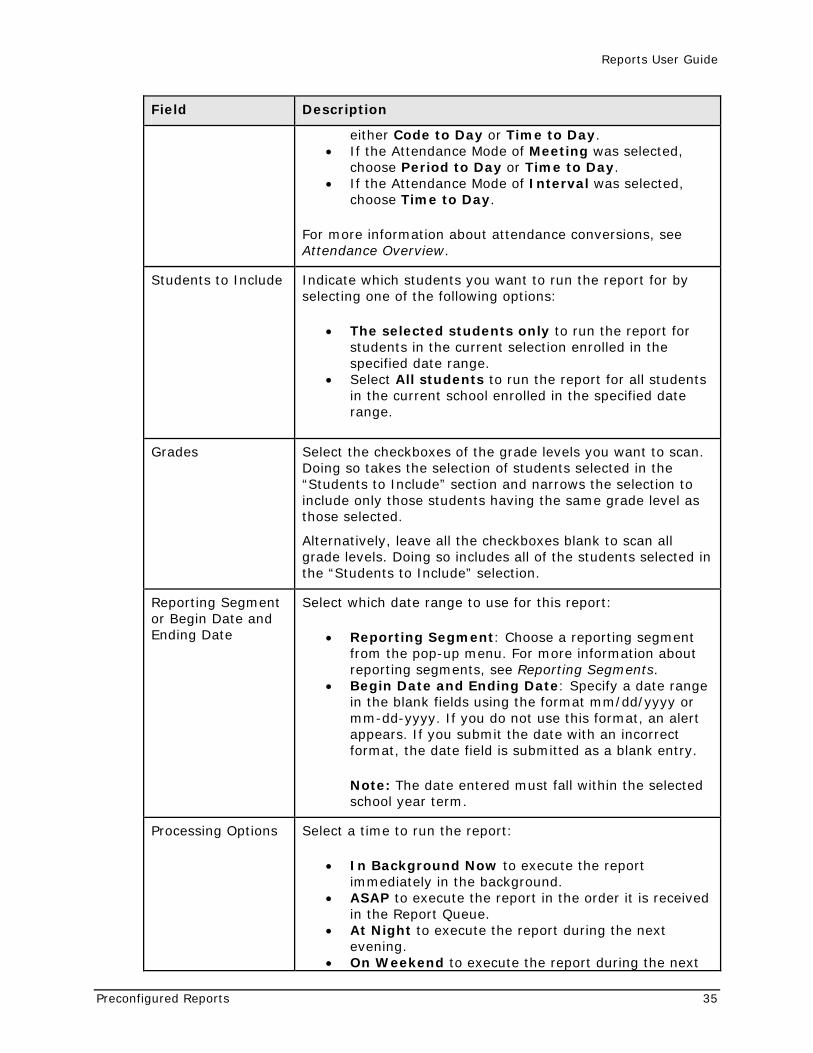
Reports User Guide
Preconfigured Reports 35
Field Description
either Code to Day or Time to Day. • If the Attendance Mode of Meeting was selected,
choose Period to Day or Time to Day. • If the Attendance Mode of Interval was selected,
choose Time to Day.
For more information about attendance conversions, see Attendance Overview.
Students to Include Indicate which students you want to run the report for by selecting one of the following options:
• The selected students only to run the report for students in the current selection enrolled in the specified date range.
• Select All students to run the report for all students in the current school enrolled in the specified date range.
Grades Select the checkboxes of the grade levels you want to scan. Doing so takes the selection of students selected in the “Students to Include” section and narrows the selection to include only those students having the same grade level as those selected.
Alternatively, leave all the checkboxes blank to scan all grade levels. Doing so includes all of the students selected in the “Students to Include” selection.
Reporting Segment or Begin Date and Ending Date
Select which date range to use for this report:
• Reporting Segment: Choose a reporting segment from the pop-up menu. For more information about reporting segments, see Reporting Segments.
• Begin Date and Ending Date: Specify a date range in the blank fields using the format mm/dd/yyyy or mm-dd-yyyy. If you do not use this format, an alert appears. If you submit the date with an incorrect format, the date field is submitted as a blank entry.
Note: The date entered must fall within the selected school year term.
Processing Options Select a time to run the report:
• In Background Now to execute the report immediately in the background.
• ASAP to execute the report in the order it is received in the Report Queue.
• At Night to execute the report during the next evening.
• On Weekend to execute the report during the next
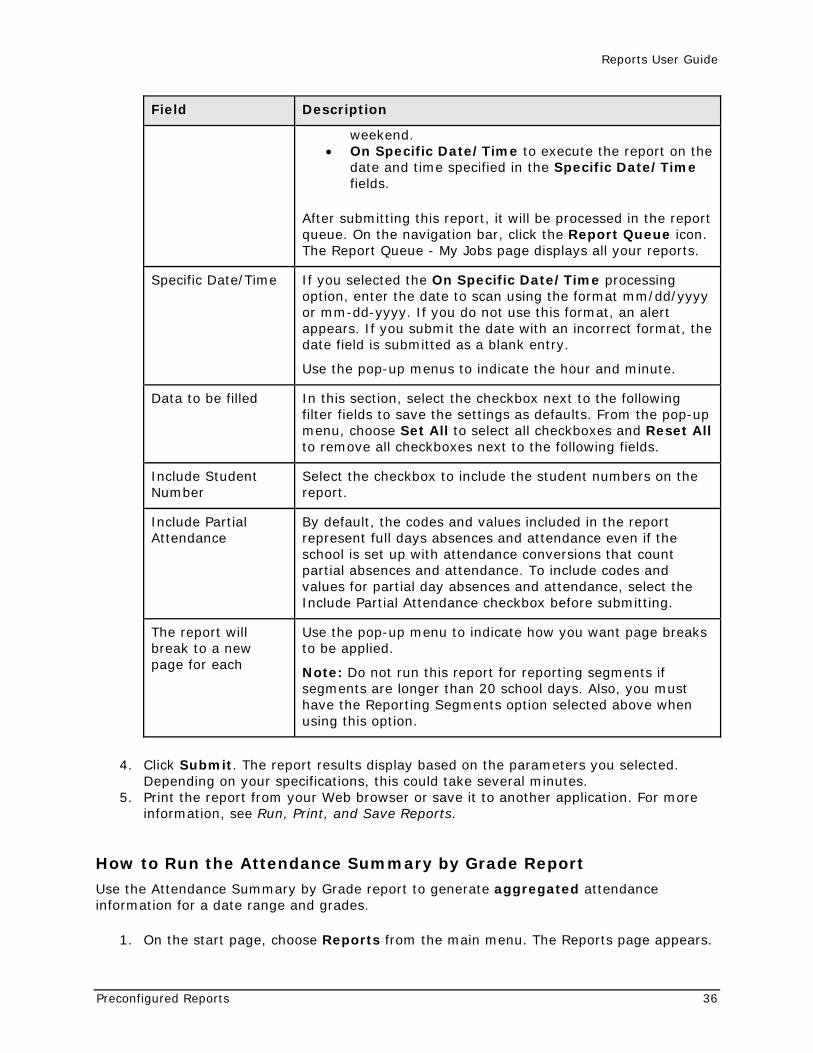
Reports User Guide
Preconfigured Reports 36
Field Description
weekend. • On Specific Date/Time to execute the report on the
date and time specified in the Specific Date/Time fields.
After submitting this report, it will be processed in the report queue. On the navigation bar, click the Report Queue icon. The Report Queue - My Jobs page displays all your reports.
Specific Date/Time If you selected the On Specific Date/Time processing option, enter the date to scan using the format mm/dd/yyyy or mm-dd-yyyy. If you do not use this format, an alert appears. If you submit the date with an incorrect format, the date field is submitted as a blank entry.
Use the pop-up menus to indicate the hour and minute.
Data to be filled In this section, select the checkbox next to the following filter fields to save the settings as defaults. From the pop-up menu, choose Set All to select all checkboxes and Reset All to remove all checkboxes next to the following fields.
Include Student Number
Select the checkbox to include the student numbers on the report.
Include Partial Attendance
By default, the codes and values included in the report represent full days absences and attendance even if the school is set up with attendance conversions that count partial absences and attendance. To include codes and values for partial day absences and attendance, select the Include Partial Attendance checkbox before submitting.
The report will break to a new page for each
Use the pop-up menu to indicate how you want page breaks to be applied.
Note: Do not run this report for reporting segments if segments are longer than 20 school days. Also, you must have the Reporting Segments option selected above when using this option.
4. Click Submit. The report results display based on the parameters you selected. Depending on your specifications, this could take several minutes.
5. Print the report from your Web browser or save it to another application. For more information, see Run, Print, and Save Reports.
How to Run the Attendance Summary by Grade Report
Use the Attendance Summary by Grade report to generate aggregated attendance information for a date range and grades.
1. On the start page, choose Reports from the main menu. The Reports page appears.
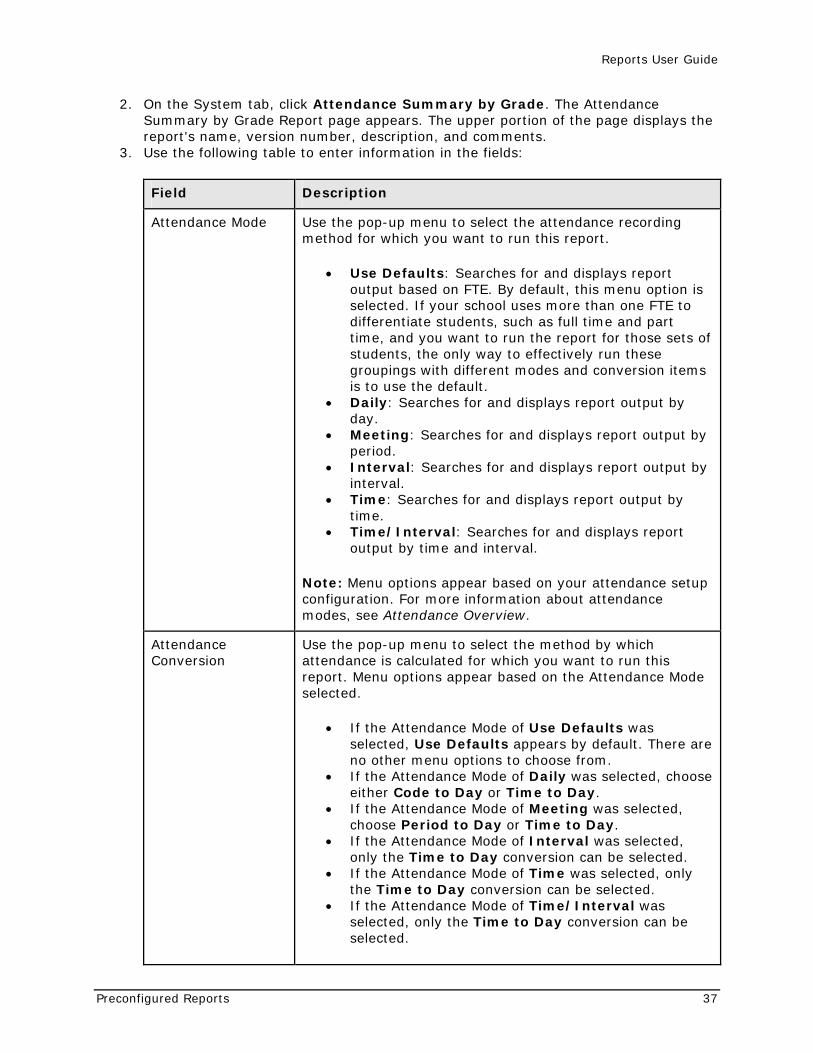
Reports User Guide
Preconfigured Reports 37
2. On the System tab, click Attendance Summary by Grade. The Attendance Summary by Grade Report page appears. The upper portion of the page displays the report's name, version number, description, and comments.
3. Use the following table to enter information in the fields:
Field Description
Attendance Mode Use the pop-up menu to select the attendance recording method for which you want to run this report.
• Use Defaults: Searches for and displays report output based on FTE. By default, this menu option is selected. If your school uses more than one FTE to differentiate students, such as full time and part time, and you want to run the report for those sets of students, the only way to effectively run these groupings with different modes and conversion items is to use the default.
• Daily: Searches for and displays report output by day.
• Meeting: Searches for and displays report output by period.
• Interval: Searches for and displays report output by interval.
• Time: Searches for and displays report output by time.
• Time/Interval: Searches for and displays report output by time and interval.
Note: Menu options appear based on your attendance setup configuration. For more information about attendance modes, see Attendance Overview.
Attendance Conversion
Use the pop-up menu to select the method by which attendance is calculated for which you want to run this report. Menu options appear based on the Attendance Mode selected.
• If the Attendance Mode of Use Defaults was selected, Use Defaults appears by default. There are no other menu options to choose from.
• If the Attendance Mode of Daily was selected, choose either Code to Day or Time to Day.
• If the Attendance Mode of Meeting was selected, choose Period to Day or Time to Day.
• If the Attendance Mode of Interval was selected, only the Time to Day conversion can be selected.
• If the Attendance Mode of Time was selected, only the Time to Day conversion can be selected.
• If the Attendance Mode of Time/Interval was selected, only the Time to Day conversion can be selected.
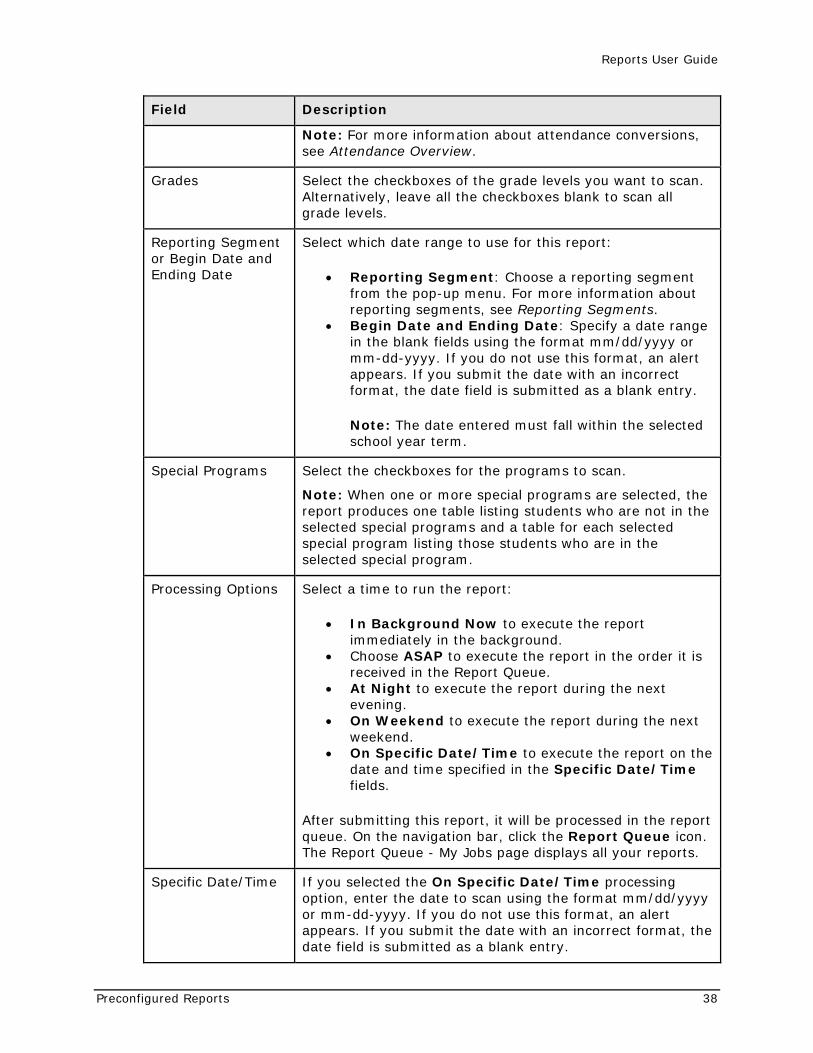
Reports User Guide
Preconfigured Reports 38
Field Description
Note: For more information about attendance conversions, see Attendance Overview.
Grades Select the checkboxes of the grade levels you want to scan. Alternatively, leave all the checkboxes blank to scan all grade levels.
Reporting Segment or Begin Date and Ending Date
Select which date range to use for this report:
• Reporting Segment: Choose a reporting segment from the pop-up menu. For more information about reporting segments, see Reporting Segments.
• Begin Date and Ending Date: Specify a date range in the blank fields using the format mm/dd/yyyy or mm-dd-yyyy. If you do not use this format, an alert appears. If you submit the date with an incorrect format, the date field is submitted as a blank entry.
Note: The date entered must fall within the selected school year term.
Special Programs Select the checkboxes for the programs to scan.
Note: When one or more special programs are selected, the report produces one table listing students who are not in the selected special programs and a table for each selected special program listing those students who are in the selected special program.
Processing Options Select a time to run the report:
• In Background Now to execute the report immediately in the background.
• Choose ASAP to execute the report in the order it is received in the Report Queue.
• At Night to execute the report during the next evening.
• On Weekend to execute the report during the next weekend.
• On Specific Date/Time to execute the report on the date and time specified in the Specific Date/Time fields.
After submitting this report, it will be processed in the report queue. On the navigation bar, click the Report Queue icon. The Report Queue - My Jobs page displays all your reports.
Specific Date/Time If you selected the On Specific Date/Time processing option, enter the date to scan using the format mm/dd/yyyy or mm-dd-yyyy. If you do not use this format, an alert appears. If you submit the date with an incorrect format, the date field is submitted as a blank entry.
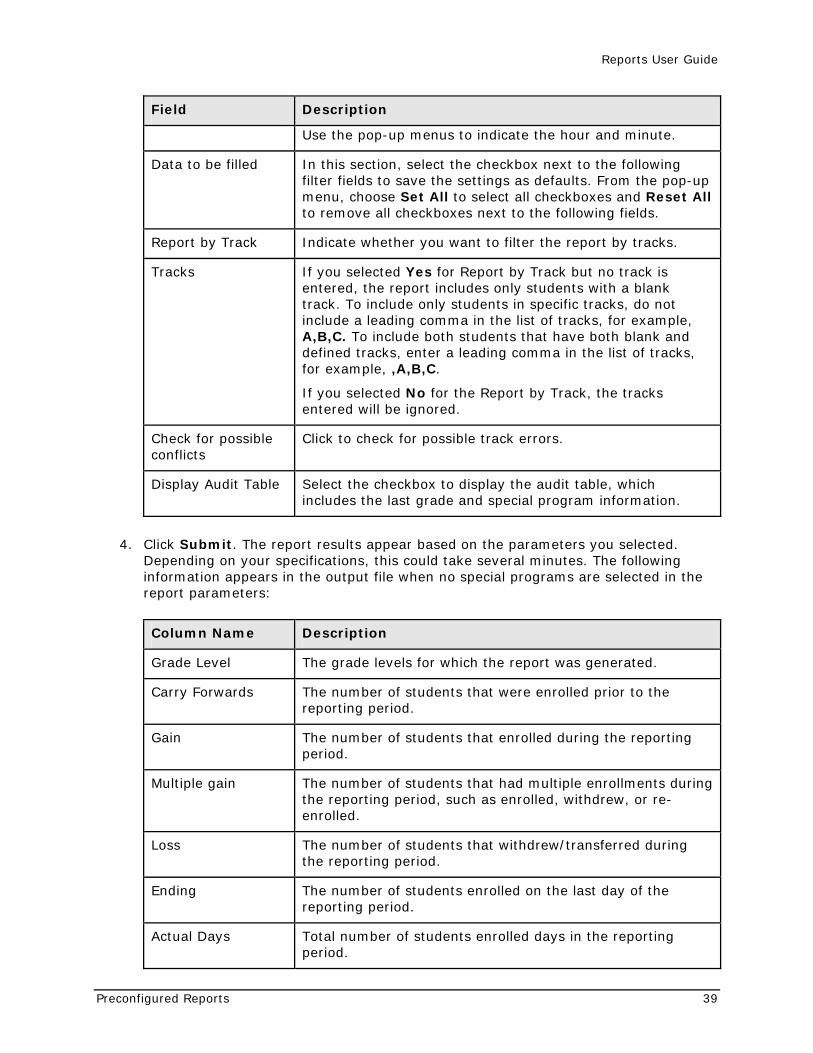
Reports User Guide
Preconfigured Reports 39
Field Description
Use the pop-up menus to indicate the hour and minute.
Data to be filled In this section, select the checkbox next to the following filter fields to save the settings as defaults. From the pop-up menu, choose Set All to select all checkboxes and Reset All to remove all checkboxes next to the following fields.
Report by Track Indicate whether you want to filter the report by tracks.
Tracks If you selected Yes for Report by Track but no track is entered, the report includes only students with a blank track. To include only students in specific tracks, do not include a leading comma in the list of tracks, for example, A,B,C. To include both students that have both blank and defined tracks, enter a leading comma in the list of tracks, for example, ,A,B,C.
If you selected No for the Report by Track, the tracks entered will be ignored.
Check for possible conflicts
Click to check for possible track errors.
Display Audit Table Select the checkbox to display the audit table, which includes the last grade and special program information.
4. Click Submit. The report results appear based on the parameters you selected. Depending on your specifications, this could take several minutes. The following information appears in the output file when no special programs are selected in the report parameters:
Column Name Description
Grade Level The grade levels for which the report was generated.
Carry Forwards The number of students that were enrolled prior to the reporting period.
Gain The number of students that enrolled during the reporting period.
Multiple gain The number of students that had multiple enrollments during the reporting period, such as enrolled, withdrew, or re-enrolled.
Loss The number of students that withdrew/transferred during the reporting period.
Ending The number of students enrolled on the last day of the reporting period.
Actual Days Total number of students enrolled days in the reporting period.
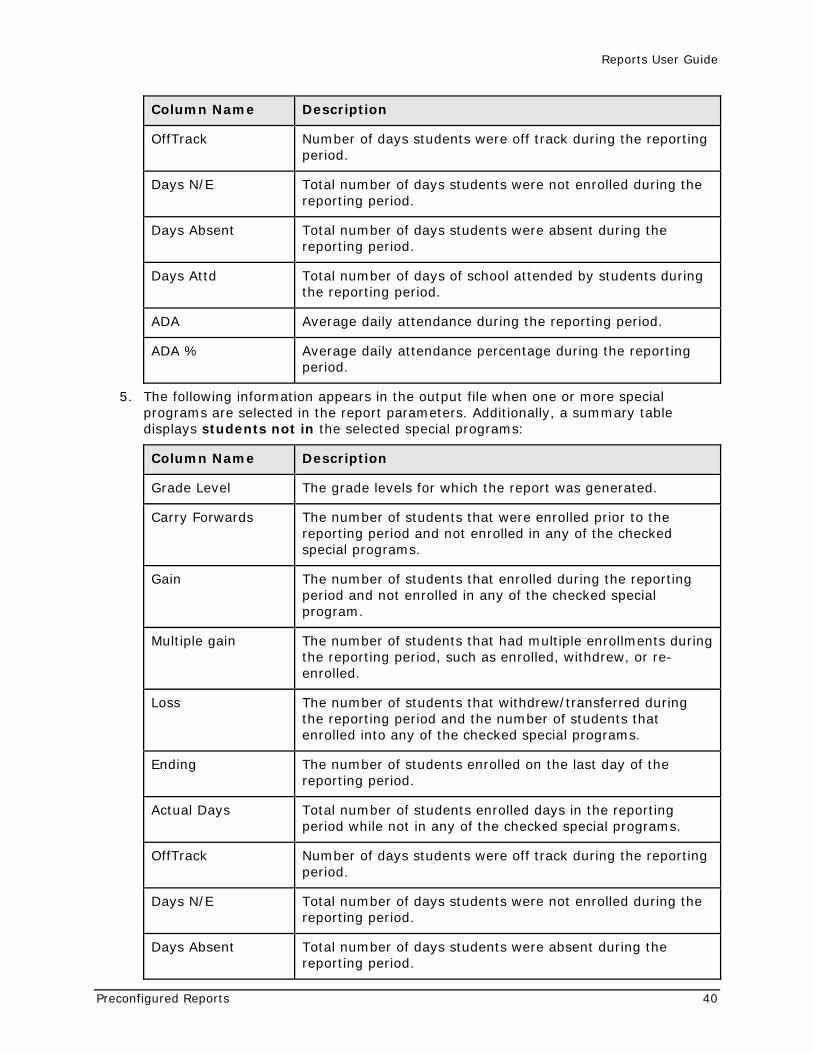
Reports User Guide
Preconfigured Reports 40
Column Name Description
OffTrack Number of days students were off track during the reporting period.
Days N/E Total number of days students were not enrolled during the reporting period.
Days Absent Total number of days students were absent during the reporting period.
Days Attd Total number of days of school attended by students during the reporting period.
ADA Average daily attendance during the reporting period.
ADA % Average daily attendance percentage during the reporting period.
5. The following information appears in the output file when one or more special programs are selected in the report parameters. Additionally, a summary table displays students not in the selected special programs:
Column Name Description
Grade Level The grade levels for which the report was generated.
Carry Forwards The number of students that were enrolled prior to the reporting period and not enrolled in any of the checked special programs.
Gain The number of students that enrolled during the reporting period and not enrolled in any of the checked special program.
Multiple gain The number of students that had multiple enrollments during the reporting period, such as enrolled, withdrew, or re-enrolled.
Loss The number of students that withdrew/transferred during the reporting period and the number of students that enrolled into any of the checked special programs.
Ending The number of students enrolled on the last day of the reporting period.
Actual Days Total number of students enrolled days in the reporting period while not in any of the checked special programs.
OffTrack Number of days students were off track during the reporting period.
Days N/E Total number of days students were not enrolled during the reporting period.
Days Absent Total number of days students were absent during the reporting period.
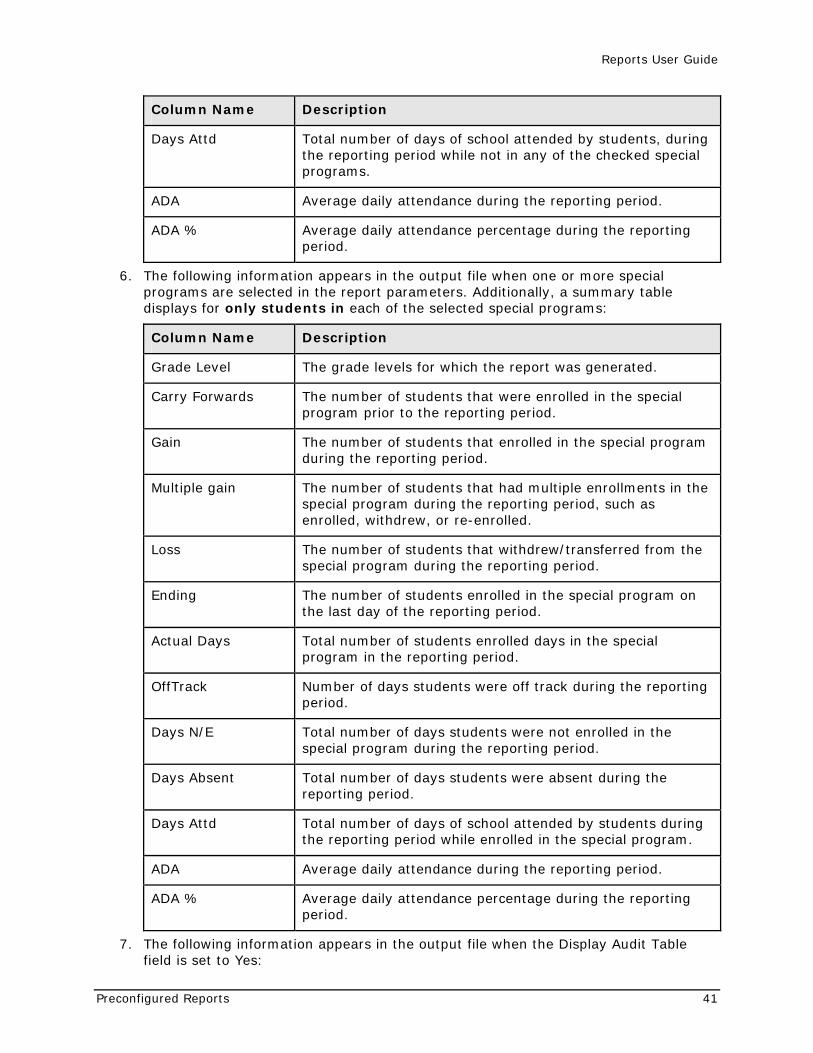
Reports User Guide
Preconfigured Reports 41
Column Name Description
Days Attd Total number of days of school attended by students, during the reporting period while not in any of the checked special programs.
ADA Average daily attendance during the reporting period.
ADA % Average daily attendance percentage during the reporting period.
6. The following information appears in the output file when one or more special programs are selected in the report parameters. Additionally, a summary table displays for only students in each of the selected special programs:
Column Name Description
Grade Level The grade levels for which the report was generated.
Carry Forwards The number of students that were enrolled in the special program prior to the reporting period.
Gain The number of students that enrolled in the special program during the reporting period.
Multiple gain The number of students that had multiple enrollments in the special program during the reporting period, such as enrolled, withdrew, or re-enrolled.
Loss The number of students that withdrew/transferred from the special program during the reporting period.
Ending The number of students enrolled in the special program on the last day of the reporting period.
Actual Days Total number of students enrolled days in the special program in the reporting period.
OffTrack Number of days students were off track during the reporting period.
Days N/E Total number of days students were not enrolled in the special program during the reporting period.
Days Absent Total number of days students were absent during the reporting period.
Days Attd Total number of days of school attended by students during the reporting period while enrolled in the special program.
ADA Average daily attendance during the reporting period.
ADA % Average daily attendance percentage during the reporting period.
7. The following information appears in the output file when the Display Audit Table field is set to Yes:
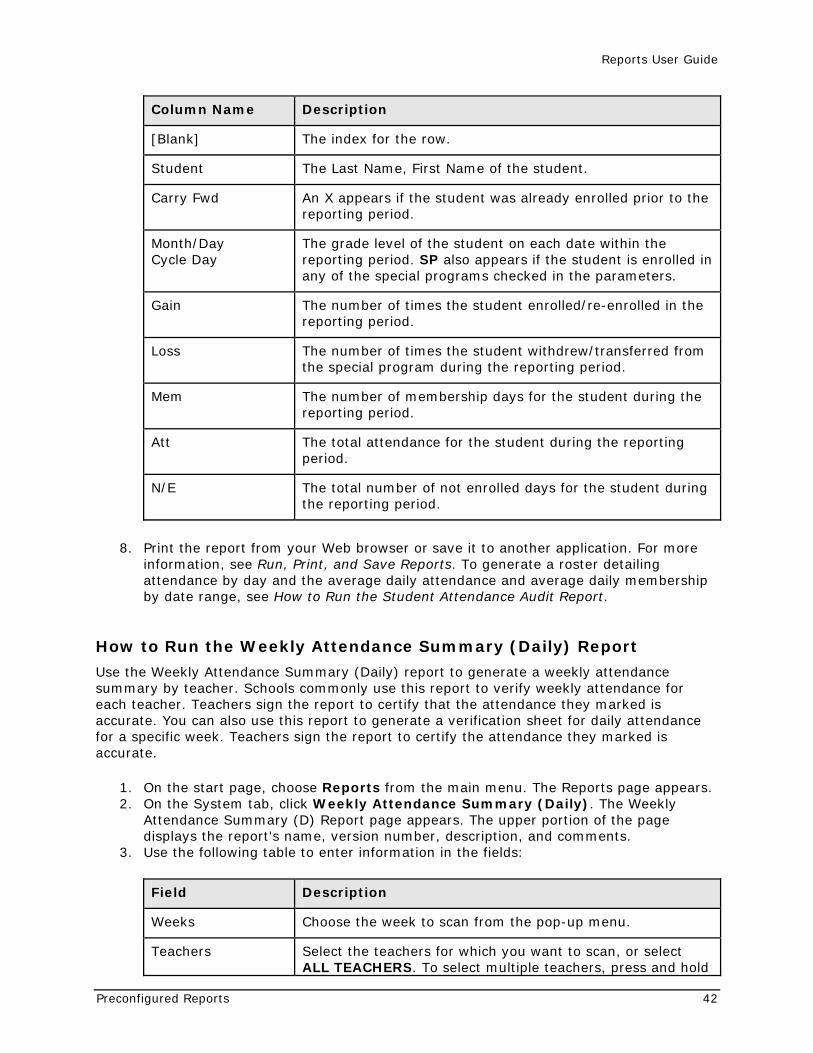
Reports User Guide
Preconfigured Reports 42
Column Name Description
[Blank] The index for the row.
Student The Last Name, First Name of the student.
Carry Fwd An X appears if the student was already enrolled prior to the reporting period.
Month/Day Cycle Day
The grade level of the student on each date within the reporting period. SP also appears if the student is enrolled in any of the special programs checked in the parameters.
Gain The number of times the student enrolled/re-enrolled in the reporting period.
Loss The number of times the student withdrew/transferred from the special program during the reporting period.
Mem The number of membership days for the student during the reporting period.
Att The total attendance for the student during the reporting period.
N/E The total number of not enrolled days for the student during the reporting period.
8. Print the report from your Web browser or save it to another application. For more information, see Run, Print, and Save Reports. To generate a roster detailing attendance by day and the average daily attendance and average daily membership by date range, see How to Run the Student Attendance Audit Report.
How to Run the Weekly Attendance Summary (Daily) Report
Use the Weekly Attendance Summary (Daily) report to generate a weekly attendance summary by teacher. Schools commonly use this report to verify weekly attendance for each teacher. Teachers sign the report to certify that the attendance they marked is accurate. You can also use this report to generate a verification sheet for daily attendance for a specific week. Teachers sign the report to certify the attendance they marked is accurate.
1. On the start page, choose Reports from the main menu. The Reports page appears. 2. On the System tab, click Weekly Attendance Summary (Daily). The Weekly
Attendance Summary (D) Report page appears. The upper portion of the page displays the report's name, version number, description, and comments.
3. Use the following table to enter information in the fields:
Field Description
Weeks Choose the week to scan from the pop-up menu.
Teachers Select the teachers for which you want to scan, or select ALL TEACHERS. To select multiple teachers, press and hold
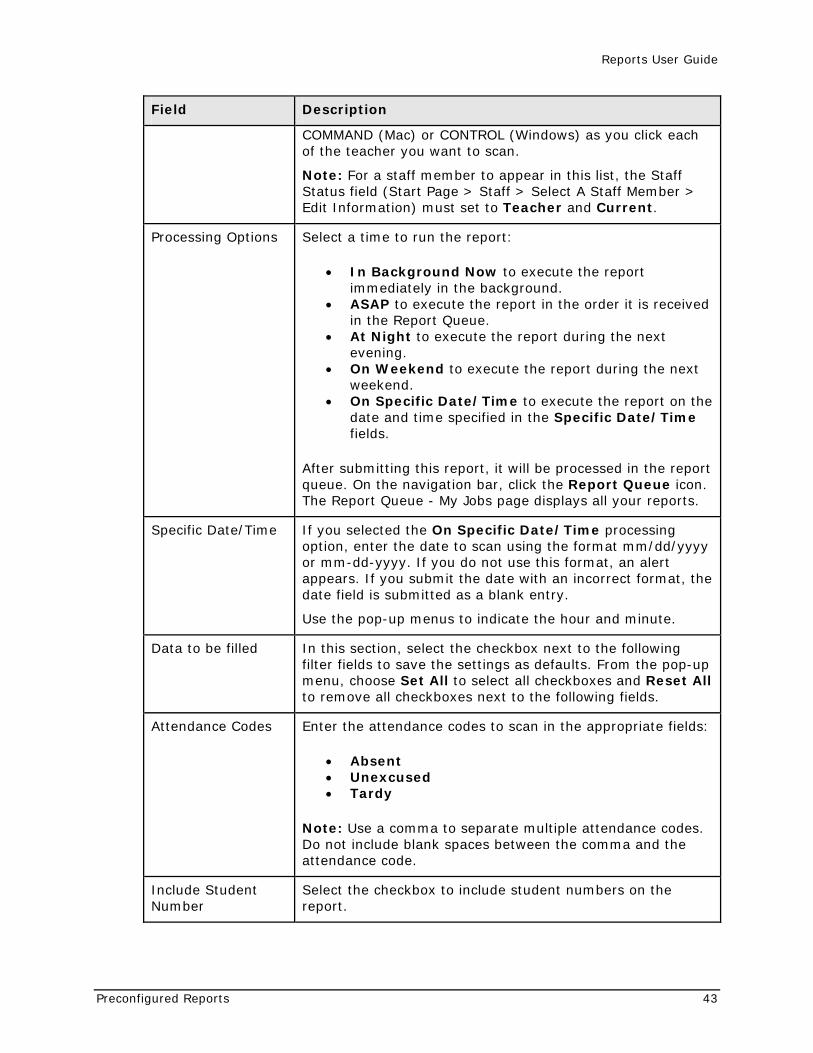
Reports User Guide
Preconfigured Reports 43
Field Description
COMMAND (Mac) or CONTROL (Windows) as you click each of the teacher you want to scan.
Note: For a staff member to appear in this list, the Staff Status field (Start Page > Staff > Select A Staff Member > Edit Information) must set to Teacher and Current.
Processing Options Select a time to run the report:
• In Background Now to execute the report immediately in the background.
• ASAP to execute the report in the order it is received in the Report Queue.
• At Night to execute the report during the next evening.
• On Weekend to execute the report during the next weekend.
• On Specific Date/Time to execute the report on the date and time specified in the Specific Date/Time fields.
After submitting this report, it will be processed in the report queue. On the navigation bar, click the Report Queue icon. The Report Queue - My Jobs page displays all your reports.
Specific Date/Time If you selected the On Specific Date/Time processing option, enter the date to scan using the format mm/dd/yyyy or mm-dd-yyyy. If you do not use this format, an alert appears. If you submit the date with an incorrect format, the date field is submitted as a blank entry.
Use the pop-up menus to indicate the hour and minute.
Data to be filled In this section, select the checkbox next to the following filter fields to save the settings as defaults. From the pop-up menu, choose Set All to select all checkboxes and Reset All to remove all checkboxes next to the following fields.
Attendance Codes Enter the attendance codes to scan in the appropriate fields:
• Absent • Unexcused • Tardy
Note: Use a comma to separate multiple attendance codes. Do not include blank spaces between the comma and the attendance code.
Include Student Number
Select the checkbox to include student numbers on the report.
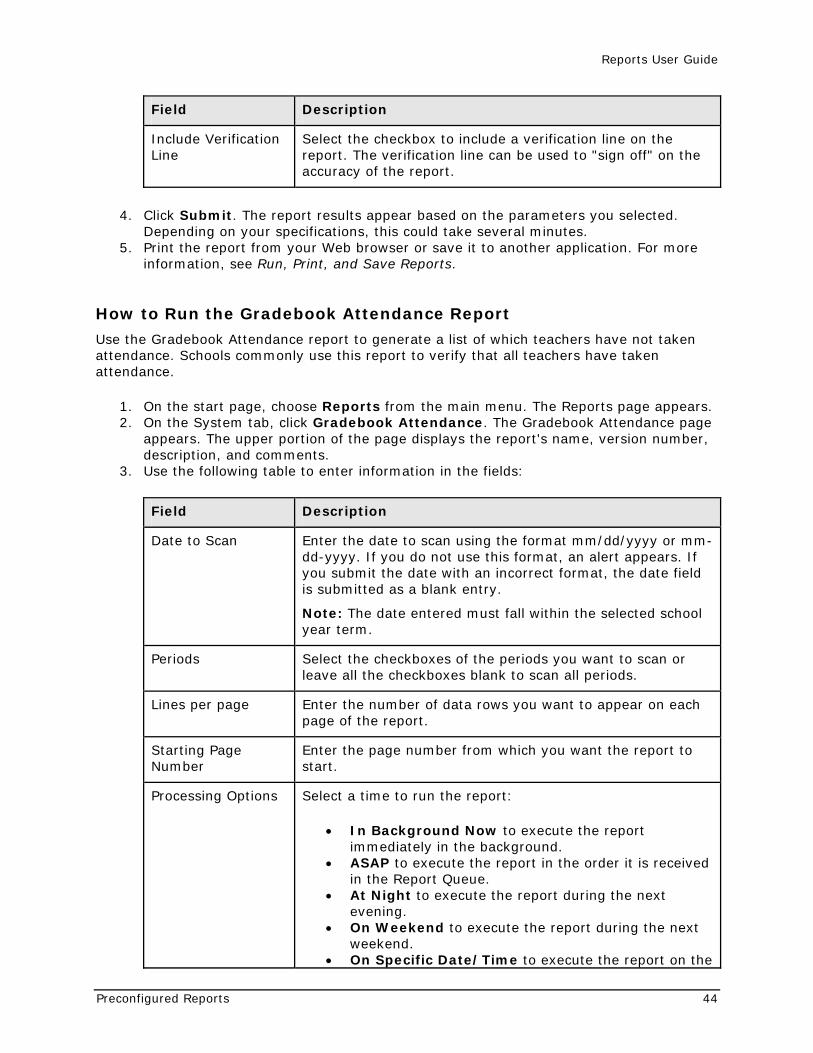
Reports User Guide
Preconfigured Reports 44
Field Description
Include Verification Line
Select the checkbox to include a verification line on the report. The verification line can be used to "sign off" on the accuracy of the report.
4. Click Submit. The report results appear based on the parameters you selected. Depending on your specifications, this could take several minutes.
5. Print the report from your Web browser or save it to another application. For more information, see Run, Print, and Save Reports.
How to Run the Gradebook Attendance Report
Use the Gradebook Attendance report to generate a list of which teachers have not taken attendance. Schools commonly use this report to verify that all teachers have taken attendance.
1. On the start page, choose Reports from the main menu. The Reports page appears. 2. On the System tab, click Gradebook Attendance. The Gradebook Attendance page
appears. The upper portion of the page displays the report's name, version number, description, and comments.
3. Use the following table to enter information in the fields:
Field Description
Date to Scan Enter the date to scan using the format mm/dd/yyyy or mm-dd-yyyy. If you do not use this format, an alert appears. If you submit the date with an incorrect format, the date field is submitted as a blank entry.
Note: The date entered must fall within the selected school year term.
Periods Select the checkboxes of the periods you want to scan or leave all the checkboxes blank to scan all periods.
Lines per page Enter the number of data rows you want to appear on each page of the report.
Starting Page Number
Enter the page number from which you want the report to start.
Processing Options Select a time to run the report:
• In Background Now to execute the report immediately in the background.
• ASAP to execute the report in the order it is received in the Report Queue.
• At Night to execute the report during the next evening.
• On Weekend to execute the report during the next weekend.
• On Specific Date/Time to execute the report on the
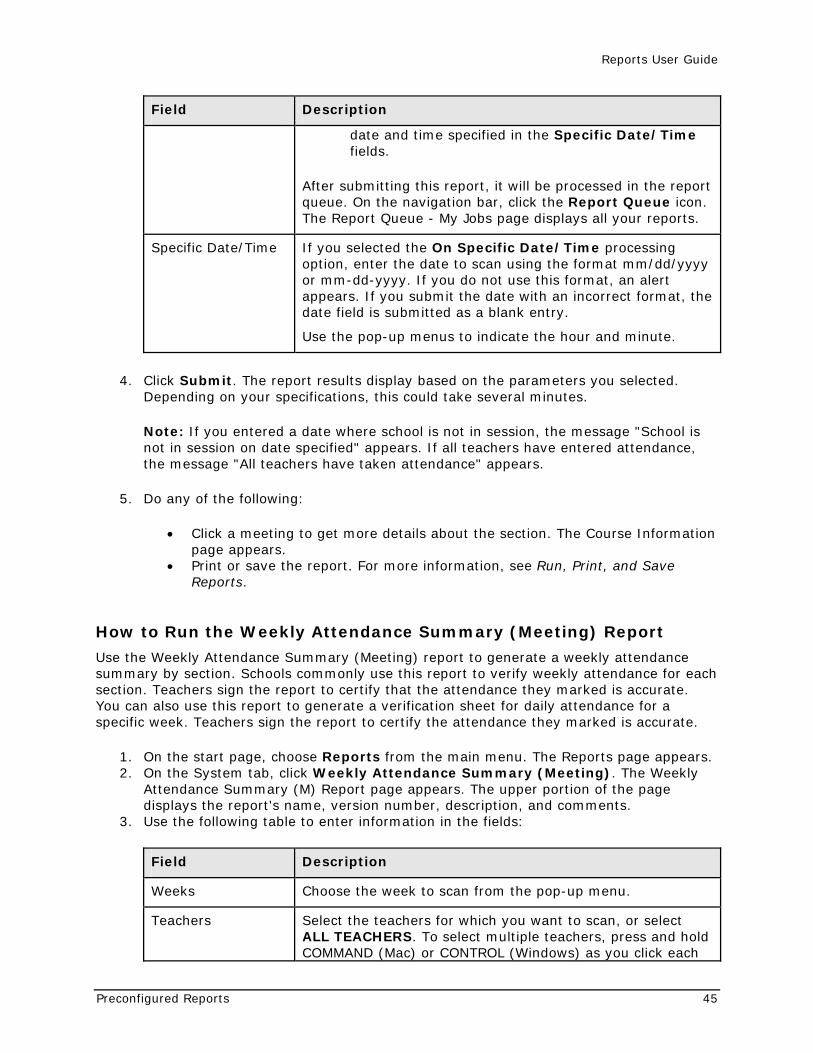
Reports User Guide
Preconfigured Reports 45
Field Description
date and time specified in the Specific Date/Time fields.
After submitting this report, it will be processed in the report queue. On the navigation bar, click the Report Queue icon. The Report Queue - My Jobs page displays all your reports.
Specific Date/Time If you selected the On Specific Date/Time processing option, enter the date to scan using the format mm/dd/yyyy or mm-dd-yyyy. If you do not use this format, an alert appears. If you submit the date with an incorrect format, the date field is submitted as a blank entry.
Use the pop-up menus to indicate the hour and minute.
4. Click Submit. The report results display based on the parameters you selected. Depending on your specifications, this could take several minutes.
Note: If you entered a date where school is not in session, the message "School is not in session on date specified" appears. If all teachers have entered attendance, the message "All teachers have taken attendance" appears.
5. Do any of the following:
• Click a meeting to get more details about the section. The Course Information page appears.
• Print or save the report. For more information, see Run, Print, and Save Reports.
How to Run the Weekly Attendance Summary (Meeting) Report
Use the Weekly Attendance Summary (Meeting) report to generate a weekly attendance summary by section. Schools commonly use this report to verify weekly attendance for each section. Teachers sign the report to certify that the attendance they marked is accurate. You can also use this report to generate a verification sheet for daily attendance for a specific week. Teachers sign the report to certify the attendance they marked is accurate.
1. On the start page, choose Reports from the main menu. The Reports page appears. 2. On the System tab, click Weekly Attendance Summary (Meeting). The Weekly
Attendance Summary (M) Report page appears. The upper portion of the page displays the report's name, version number, description, and comments.
3. Use the following table to enter information in the fields:
Field Description
Weeks Choose the week to scan from the pop-up menu.
Teachers Select the teachers for which you want to scan, or select ALL TEACHERS. To select multiple teachers, press and hold COMMAND (Mac) or CONTROL (Windows) as you click each
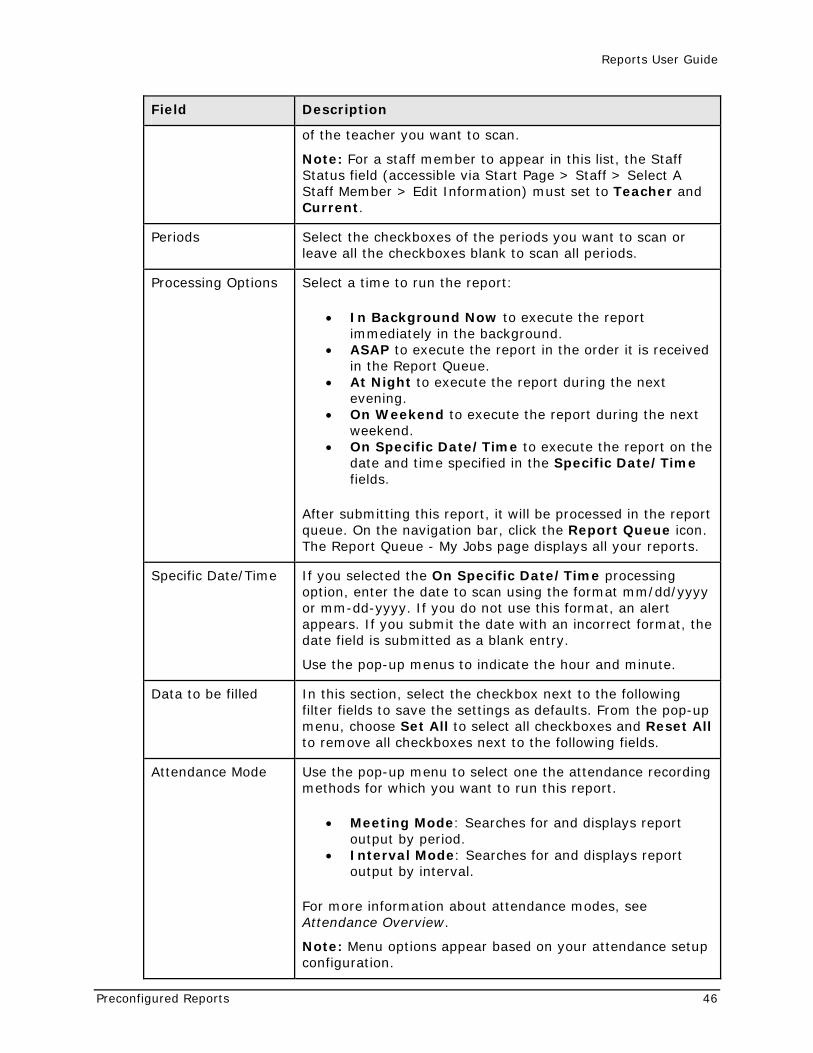
Reports User Guide
Preconfigured Reports 46
Field Description
of the teacher you want to scan.
Note: For a staff member to appear in this list, the Staff Status field (accessible via Start Page > Staff > Select A Staff Member > Edit Information) must set to Teacher and Current.
Periods Select the checkboxes of the periods you want to scan or leave all the checkboxes blank to scan all periods.
Processing Options Select a time to run the report:
• In Background Now to execute the report immediately in the background.
• ASAP to execute the report in the order it is received in the Report Queue.
• At Night to execute the report during the next evening.
• On Weekend to execute the report during the next weekend.
• On Specific Date/Time to execute the report on the date and time specified in the Specific Date/Time fields.
After submitting this report, it will be processed in the report queue. On the navigation bar, click the Report Queue icon. The Report Queue - My Jobs page displays all your reports.
Specific Date/Time If you selected the On Specific Date/Time processing option, enter the date to scan using the format mm/dd/yyyy or mm-dd-yyyy. If you do not use this format, an alert appears. If you submit the date with an incorrect format, the date field is submitted as a blank entry.
Use the pop-up menus to indicate the hour and minute.
Data to be filled In this section, select the checkbox next to the following filter fields to save the settings as defaults. From the pop-up menu, choose Set All to select all checkboxes and Reset All to remove all checkboxes next to the following fields.
Attendance Mode Use the pop-up menu to select one the attendance recording methods for which you want to run this report.
• Meeting Mode: Searches for and displays report output by period.
• Interval Mode: Searches for and displays report output by interval.
For more information about attendance modes, see Attendance Overview.
Note: Menu options appear based on your attendance setup configuration.
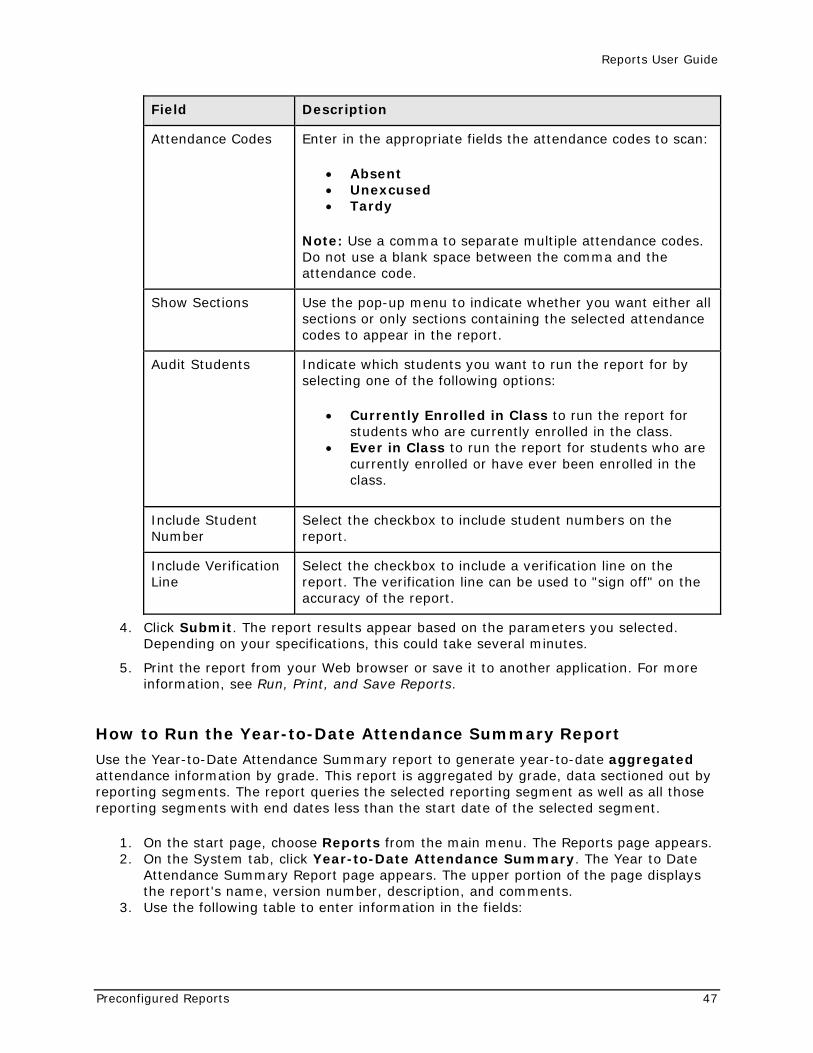
Reports User Guide
Preconfigured Reports 47
Field Description
Attendance Codes Enter in the appropriate fields the attendance codes to scan:
• Absent • Unexcused • Tardy
Note: Use a comma to separate multiple attendance codes. Do not use a blank space between the comma and the attendance code.
Show Sections Use the pop-up menu to indicate whether you want either all sections or only sections containing the selected attendance codes to appear in the report.
Audit Students Indicate which students you want to run the report for by selecting one of the following options:
• Currently Enrolled in Class to run the report for students who are currently enrolled in the class.
• Ever in Class to run the report for students who are currently enrolled or have ever been enrolled in the class.
Include Student Number
Select the checkbox to include student numbers on the report.
Include Verification Line
Select the checkbox to include a verification line on the report. The verification line can be used to "sign off" on the accuracy of the report.
4. Click Submit. The report results appear based on the parameters you selected. Depending on your specifications, this could take several minutes.
5. Print the report from your Web browser or save it to another application. For more information, see Run, Print, and Save Reports.
How to Run the Year-to-Date Attendance Summary Report
Use the Year-to-Date Attendance Summary report to generate year-to-date aggregated attendance information by grade. This report is aggregated by grade, data sectioned out by reporting segments. The report queries the selected reporting segment as well as all those reporting segments with end dates less than the start date of the selected segment.
1. On the start page, choose Reports from the main menu. The Reports page appears. 2. On the System tab, click Year-to-Date Attendance Summary. The Year to Date
Attendance Summary Report page appears. The upper portion of the page displays the report's name, version number, description, and comments.
3. Use the following table to enter information in the fields:
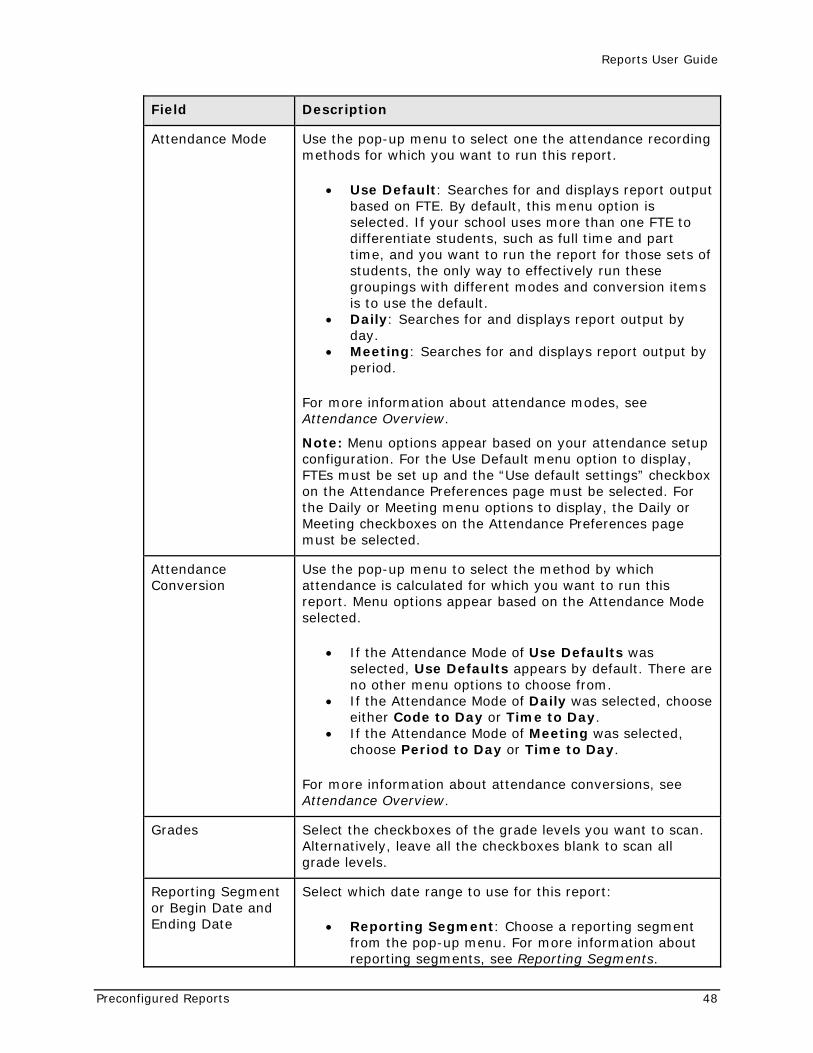
Reports User Guide
Preconfigured Reports 48
Field Description
Attendance Mode Use the pop-up menu to select one the attendance recording methods for which you want to run this report.
• Use Default: Searches for and displays report output based on FTE. By default, this menu option is selected. If your school uses more than one FTE to differentiate students, such as full time and part time, and you want to run the report for those sets of students, the only way to effectively run these groupings with different modes and conversion items is to use the default.
• Daily: Searches for and displays report output by day.
• Meeting: Searches for and displays report output by period.
For more information about attendance modes, see Attendance Overview.
Note: Menu options appear based on your attendance setup configuration. For the Use Default menu option to display, FTEs must be set up and the “Use default settings” checkbox on the Attendance Preferences page must be selected. For the Daily or Meeting menu options to display, the Daily or Meeting checkboxes on the Attendance Preferences page must be selected.
Attendance Conversion
Use the pop-up menu to select the method by which attendance is calculated for which you want to run this report. Menu options appear based on the Attendance Mode selected.
• If the Attendance Mode of Use Defaults was selected, Use Defaults appears by default. There are no other menu options to choose from.
• If the Attendance Mode of Daily was selected, choose either Code to Day or Time to Day.
• If the Attendance Mode of Meeting was selected, choose Period to Day or Time to Day.
For more information about attendance conversions, see Attendance Overview.
Grades Select the checkboxes of the grade levels you want to scan. Alternatively, leave all the checkboxes blank to scan all grade levels.
Reporting Segment or Begin Date and Ending Date
Select which date range to use for this report:
• Reporting Segment: Choose a reporting segment from the pop-up menu. For more information about reporting segments, see Reporting Segments.
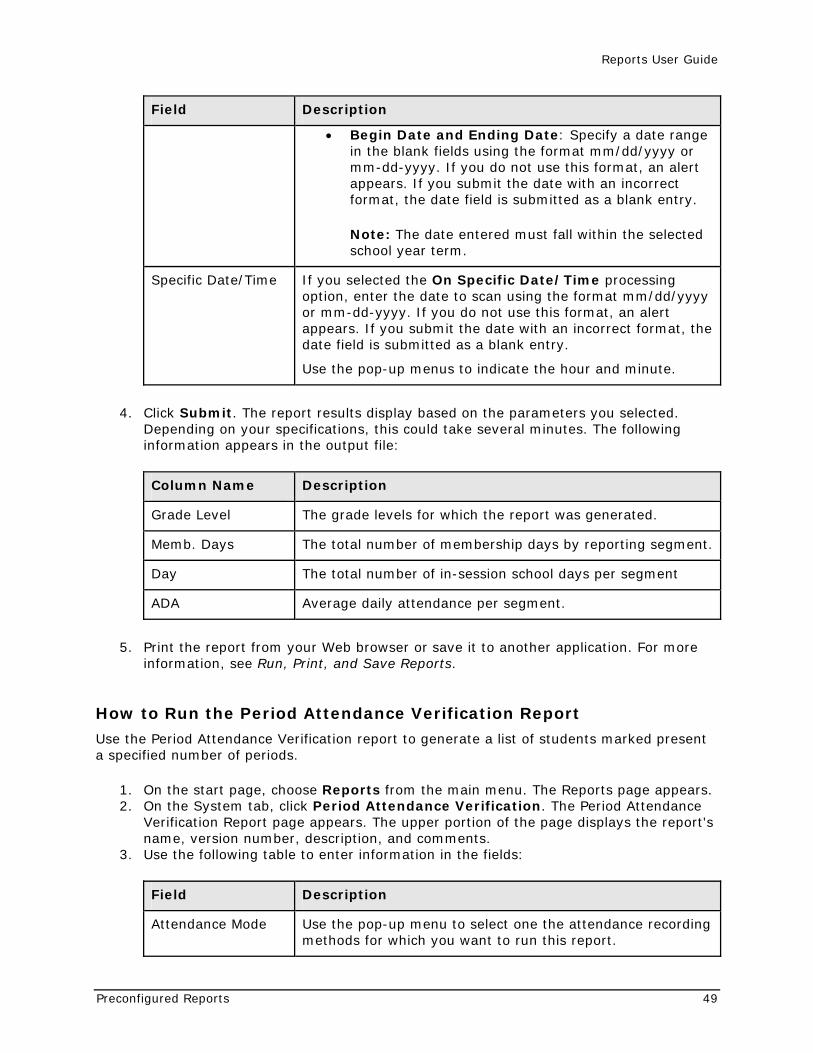
Reports User Guide
Preconfigured Reports 49
Field Description
• Begin Date and Ending Date: Specify a date range in the blank fields using the format mm/dd/yyyy or mm-dd-yyyy. If you do not use this format, an alert appears. If you submit the date with an incorrect format, the date field is submitted as a blank entry.
Note: The date entered must fall within the selected school year term.
Specific Date/Time If you selected the On Specific Date/Time processing option, enter the date to scan using the format mm/dd/yyyy or mm-dd-yyyy. If you do not use this format, an alert appears. If you submit the date with an incorrect format, the date field is submitted as a blank entry.
Use the pop-up menus to indicate the hour and minute.
4. Click Submit. The report results display based on the parameters you selected. Depending on your specifications, this could take several minutes. The following information appears in the output file:
Column Name Description
Grade Level The grade levels for which the report was generated.
Memb. Days The total number of membership days by reporting segment.
Day The total number of in-session school days per segment
ADA Average daily attendance per segment.
5. Print the report from your Web browser or save it to another application. For more information, see Run, Print, and Save Reports.
How to Run the Period Attendance Verification Report
Use the Period Attendance Verification report to generate a list of students marked present a specified number of periods.
1. On the start page, choose Reports from the main menu. The Reports page appears. 2. On the System tab, click Period Attendance Verification. The Period Attendance
Verification Report page appears. The upper portion of the page displays the report's name, version number, description, and comments.
3. Use the following table to enter information in the fields:
Field Description
Attendance Mode Use the pop-up menu to select one the attendance recording methods for which you want to run this report.
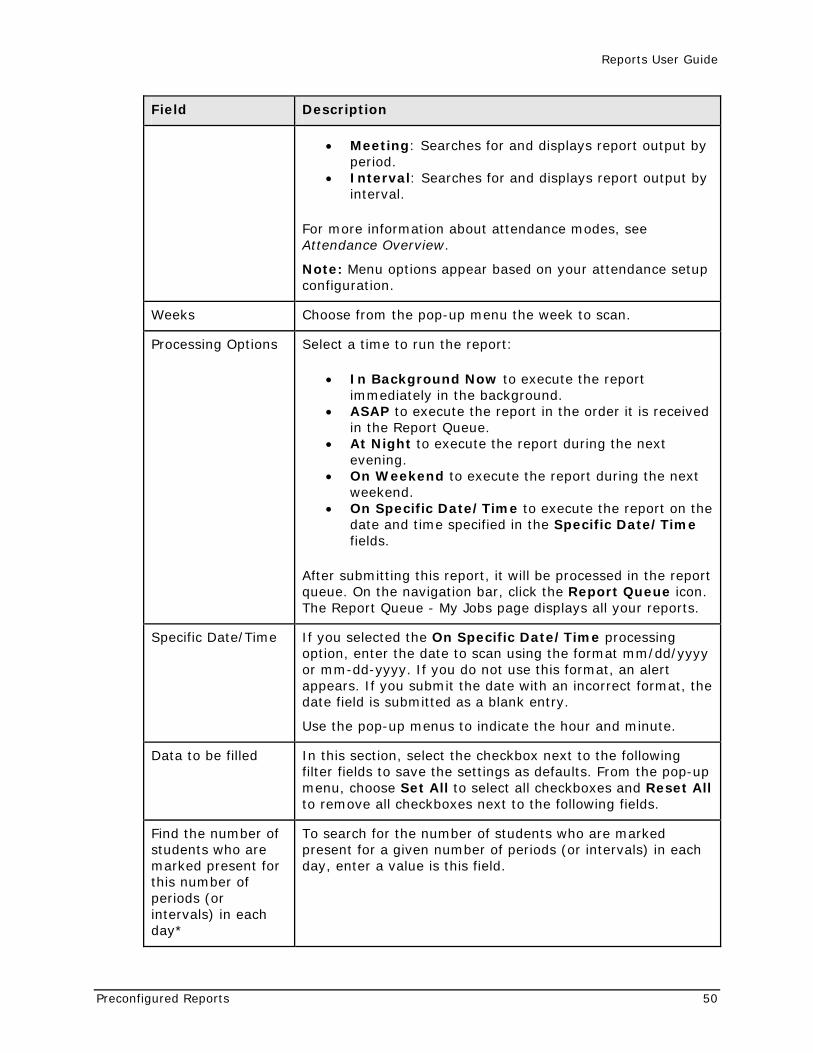
Reports User Guide
Preconfigured Reports 50
Field Description
• Meeting: Searches for and displays report output by period.
• Interval: Searches for and displays report output by interval.
For more information about attendance modes, see Attendance Overview.
Note: Menu options appear based on your attendance setup configuration.
Weeks Choose from the pop-up menu the week to scan.
Processing Options Select a time to run the report:
• In Background Now to execute the report immediately in the background.
• ASAP to execute the report in the order it is received in the Report Queue.
• At Night to execute the report during the next evening.
• On Weekend to execute the report during the next weekend.
• On Specific Date/Time to execute the report on the date and time specified in the Specific Date/Time fields.
After submitting this report, it will be processed in the report queue. On the navigation bar, click the Report Queue icon. The Report Queue - My Jobs page displays all your reports.
Specific Date/Time If you selected the On Specific Date/Time processing option, enter the date to scan using the format mm/dd/yyyy or mm-dd-yyyy. If you do not use this format, an alert appears. If you submit the date with an incorrect format, the date field is submitted as a blank entry.
Use the pop-up menus to indicate the hour and minute.
Data to be filled In this section, select the checkbox next to the following filter fields to save the settings as defaults. From the pop-up menu, choose Set All to select all checkboxes and Reset All to remove all checkboxes next to the following fields.
Find the number of students who are marked present for this number of periods (or intervals) in each day*
To search for the number of students who are marked present for a given number of periods (or intervals) in each day, enter a value is this field.
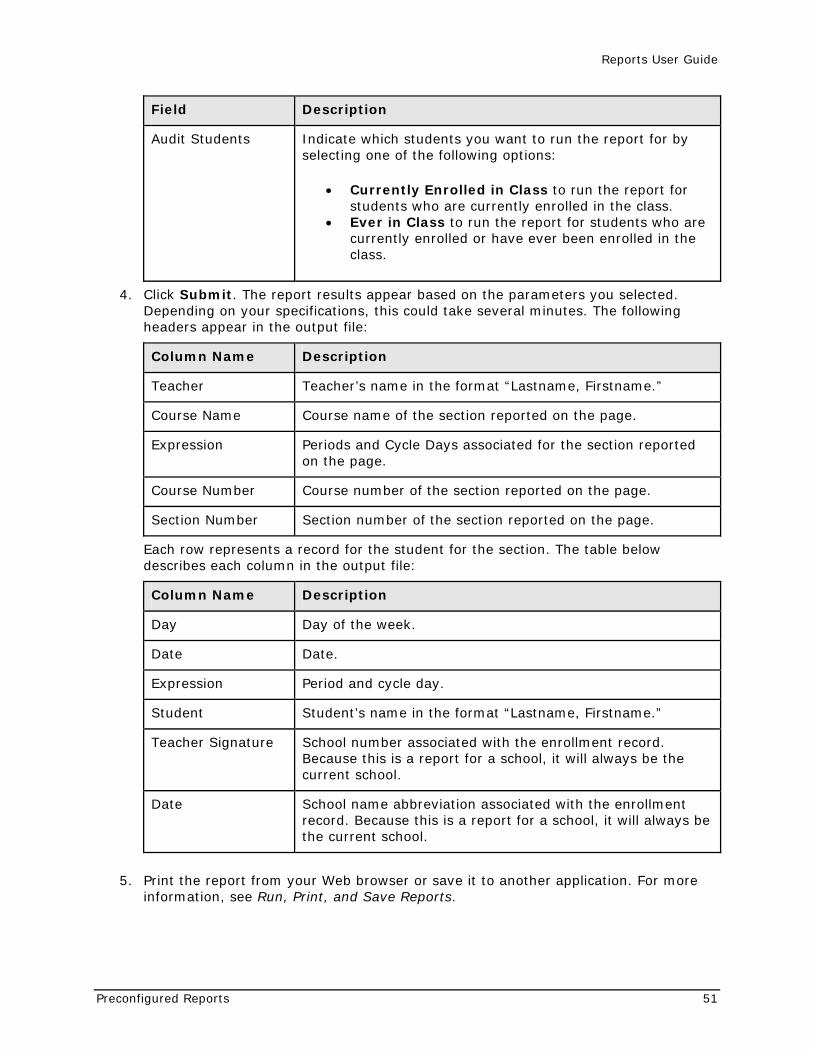
Reports User Guide
Preconfigured Reports 51
Field Description
Audit Students Indicate which students you want to run the report for by selecting one of the following options:
• Currently Enrolled in Class to run the report for students who are currently enrolled in the class.
• Ever in Class to run the report for students who are currently enrolled or have ever been enrolled in the class.
4. Click Submit. The report results appear based on the parameters you selected. Depending on your specifications, this could take several minutes. The following headers appear in the output file:
Column Name Description
Teacher Teacher’s name in the format “Lastname, Firstname.”
Course Name Course name of the section reported on the page.
Expression Periods and Cycle Days associated for the section reported on the page.
Course Number Course number of the section reported on the page.
Section Number Section number of the section reported on the page.
Each row represents a record for the student for the section. The table below describes each column in the output file:
Column Name Description
Day Day of the week.
Date Date.
Expression Period and cycle day.
Student Student’s name in the format “Lastname, Firstname.”
Teacher Signature School number associated with the enrollment record. Because this is a report for a school, it will always be the current school.
Date School name abbreviation associated with the enrollment record. Because this is a report for a school, it will always be the current school.
5. Print the report from your Web browser or save it to another application. For more information, see Run, Print, and Save Reports.
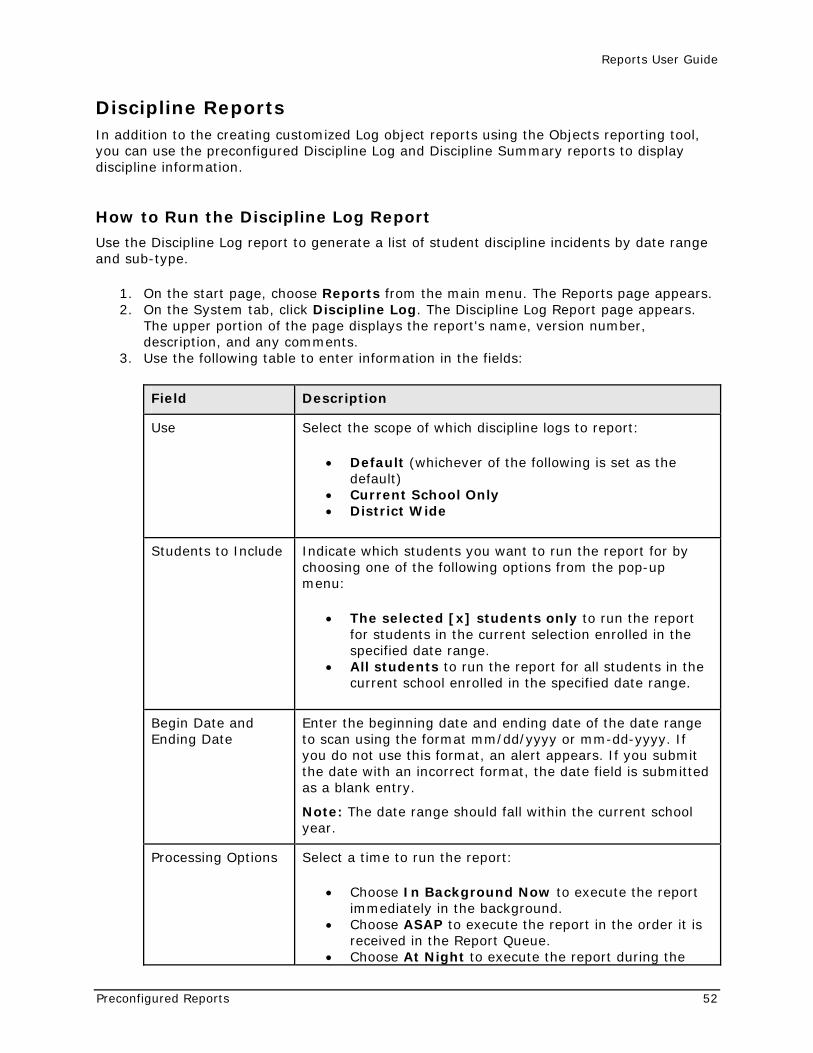
Reports User Guide
Preconfigured Reports 52
Discipline Reports In addition to the creating customized Log object reports using the Objects reporting tool, you can use the preconfigured Discipline Log and Discipline Summary reports to display discipline information.
How to Run the Discipline Log Report
Use the Discipline Log report to generate a list of student discipline incidents by date range and sub-type.
1. On the start page, choose Reports from the main menu. The Reports page appears. 2. On the System tab, click Discipline Log. The Discipline Log Report page appears.
The upper portion of the page displays the report's name, version number, description, and any comments.
3. Use the following table to enter information in the fields:
Field Description
Use Select the scope of which discipline logs to report:
• Default (whichever of the following is set as the default)
• Current School Only • District Wide
Students to Include Indicate which students you want to run the report for by choosing one of the following options from the pop-up menu:
• The selected [x] students only to run the report for students in the current selection enrolled in the specified date range.
• All students to run the report for all students in the current school enrolled in the specified date range.
Begin Date and Ending Date
Enter the beginning date and ending date of the date range to scan using the format mm/dd/yyyy or mm-dd-yyyy. If you do not use this format, an alert appears. If you submit the date with an incorrect format, the date field is submitted as a blank entry.
Note: The date range should fall within the current school year.
Processing Options Select a time to run the report:
• Choose In Background Now to execute the report immediately in the background.
• Choose ASAP to execute the report in the order it is received in the Report Queue.
• Choose At Night to execute the report during the
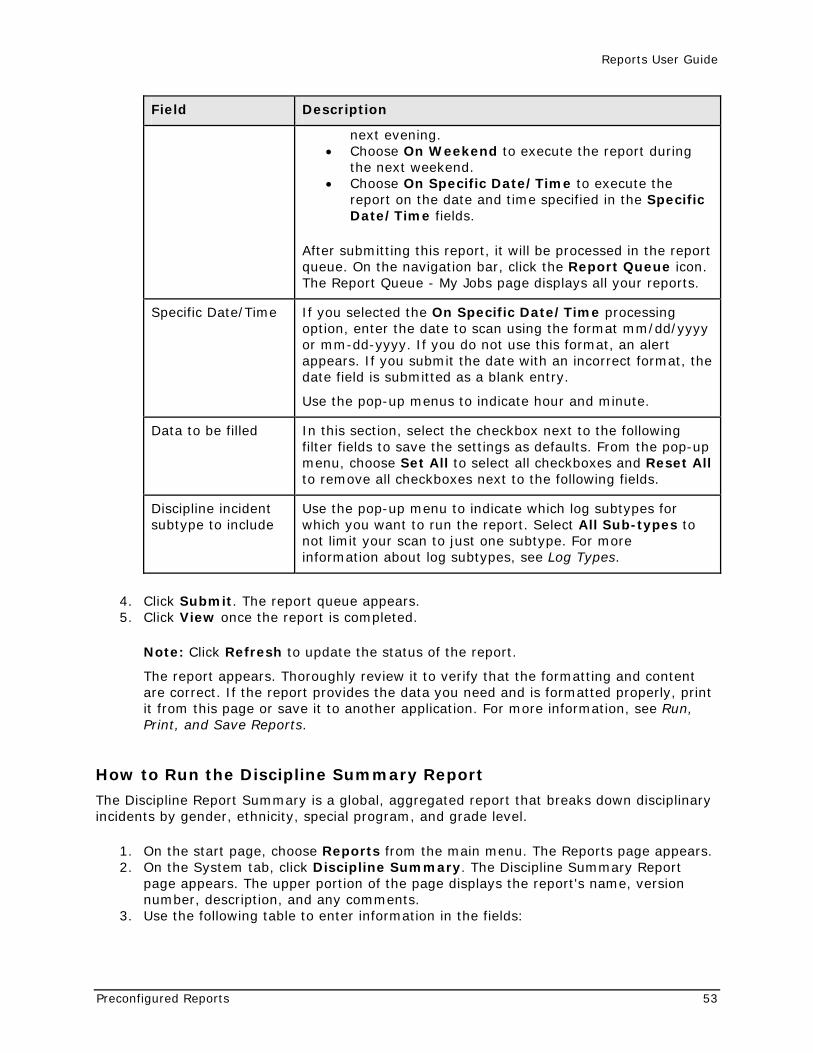
Reports User Guide
Preconfigured Reports 53
Field Description
next evening. • Choose On Weekend to execute the report during
the next weekend. • Choose On Specific Date/Time to execute the
report on the date and time specified in the Specific Date/Time fields.
After submitting this report, it will be processed in the report queue. On the navigation bar, click the Report Queue icon. The Report Queue - My Jobs page displays all your reports.
Specific Date/Time If you selected the On Specific Date/Time processing option, enter the date to scan using the format mm/dd/yyyy or mm-dd-yyyy. If you do not use this format, an alert appears. If you submit the date with an incorrect format, the date field is submitted as a blank entry.
Use the pop-up menus to indicate hour and minute.
Data to be filled In this section, select the checkbox next to the following filter fields to save the settings as defaults. From the pop-up menu, choose Set All to select all checkboxes and Reset All to remove all checkboxes next to the following fields.
Discipline incident subtype to include
Use the pop-up menu to indicate which log subtypes for which you want to run the report. Select All Sub-types to not limit your scan to just one subtype. For more information about log subtypes, see Log Types.
4. Click Submit. The report queue appears. 5. Click View once the report is completed.
Note: Click Refresh to update the status of the report.
The report appears. Thoroughly review it to verify that the formatting and content are correct. If the report provides the data you need and is formatted properly, print it from this page or save it to another application. For more information, see Run, Print, and Save Reports.
How to Run the Discipline Summary Report
The Discipline Report Summary is a global, aggregated report that breaks down disciplinary incidents by gender, ethnicity, special program, and grade level.
1. On the start page, choose Reports from the main menu. The Reports page appears. 2. On the System tab, click Discipline Summary. The Discipline Summary Report
page appears. The upper portion of the page displays the report's name, version number, description, and any comments.
3. Use the following table to enter information in the fields:
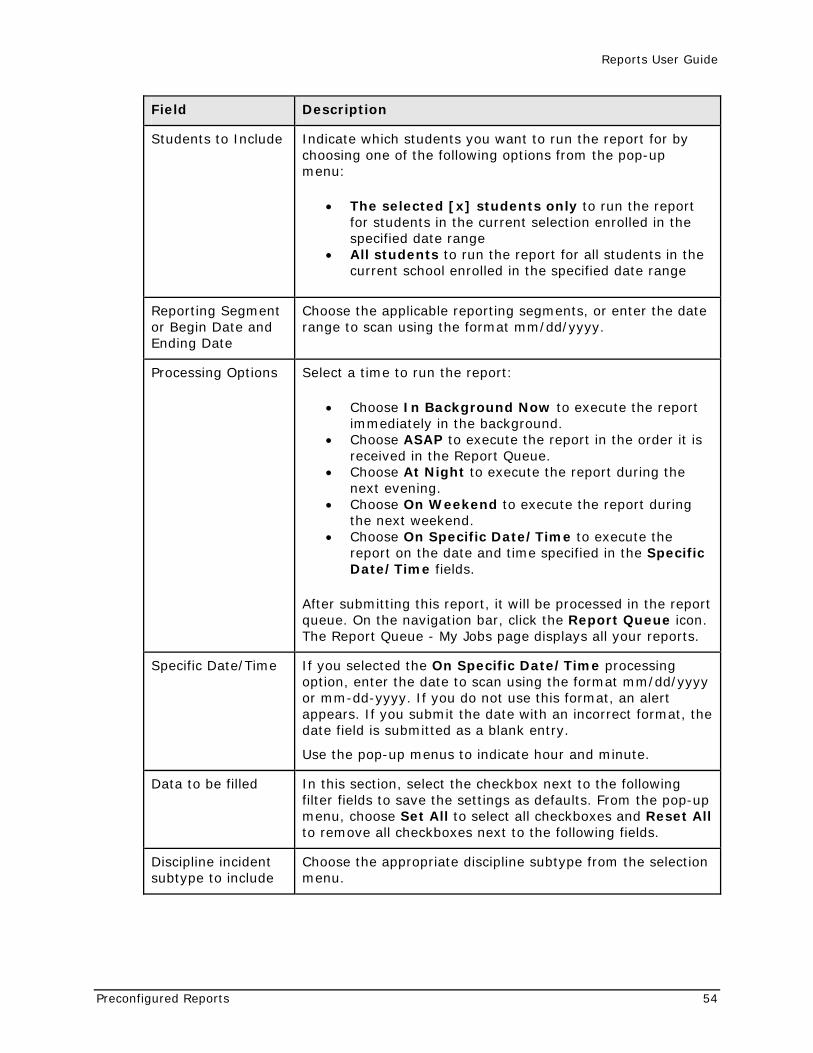
Reports User Guide
Preconfigured Reports 54
Field Description
Students to Include Indicate which students you want to run the report for by choosing one of the following options from the pop-up menu:
• The selected [x] students only to run the report for students in the current selection enrolled in the specified date range
• All students to run the report for all students in the current school enrolled in the specified date range
Reporting Segment or Begin Date and Ending Date
Choose the applicable reporting segments, or enter the date range to scan using the format mm/dd/yyyy.
Processing Options Select a time to run the report:
• Choose In Background Now to execute the report immediately in the background.
• Choose ASAP to execute the report in the order it is received in the Report Queue.
• Choose At Night to execute the report during the next evening.
• Choose On Weekend to execute the report during the next weekend.
• Choose On Specific Date/Time to execute the report on the date and time specified in the Specific Date/Time fields.
After submitting this report, it will be processed in the report queue. On the navigation bar, click the Report Queue icon. The Report Queue - My Jobs page displays all your reports.
Specific Date/Time If you selected the On Specific Date/Time processing option, enter the date to scan using the format mm/dd/yyyy or mm-dd-yyyy. If you do not use this format, an alert appears. If you submit the date with an incorrect format, the date field is submitted as a blank entry.
Use the pop-up menus to indicate hour and minute.
Data to be filled In this section, select the checkbox next to the following filter fields to save the settings as defaults. From the pop-up menu, choose Set All to select all checkboxes and Reset All to remove all checkboxes next to the following fields.
Discipline incident subtype to include
Choose the appropriate discipline subtype from the selection menu.
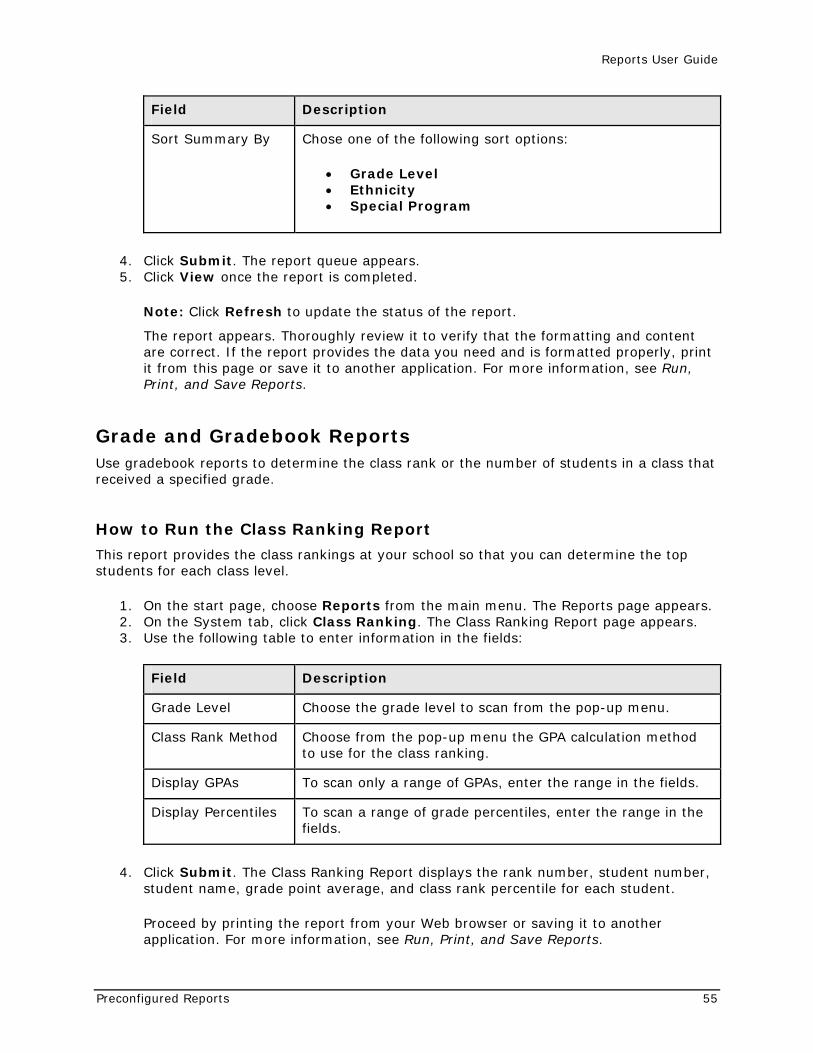
Reports User Guide
Preconfigured Reports 55
Field Description
Sort Summary By Chose one of the following sort options:
• Grade Level • Ethnicity • Special Program
4. Click Submit. The report queue appears. 5. Click View once the report is completed.
Note: Click Refresh to update the status of the report.
The report appears. Thoroughly review it to verify that the formatting and content are correct. If the report provides the data you need and is formatted properly, print it from this page or save it to another application. For more information, see Run, Print, and Save Reports.
Grade and Gradebook Reports Use gradebook reports to determine the class rank or the number of students in a class that received a specified grade.
How to Run the Class Ranking Report
This report provides the class rankings at your school so that you can determine the top students for each class level.
1. On the start page, choose Reports from the main menu. The Reports page appears. 2. On the System tab, click Class Ranking. The Class Ranking Report page appears. 3. Use the following table to enter information in the fields:
Field Description
Grade Level Choose the grade level to scan from the pop-up menu.
Class Rank Method Choose from the pop-up menu the GPA calculation method to use for the class ranking.
Display GPAs To scan only a range of GPAs, enter the range in the fields.
Display Percentiles To scan a range of grade percentiles, enter the range in the fields.
4. Click Submit. The Class Ranking Report displays the rank number, student number, student name, grade point average, and class rank percentile for each student.
Proceed by printing the report from your Web browser or saving it to another application. For more information, see Run, Print, and Save Reports.
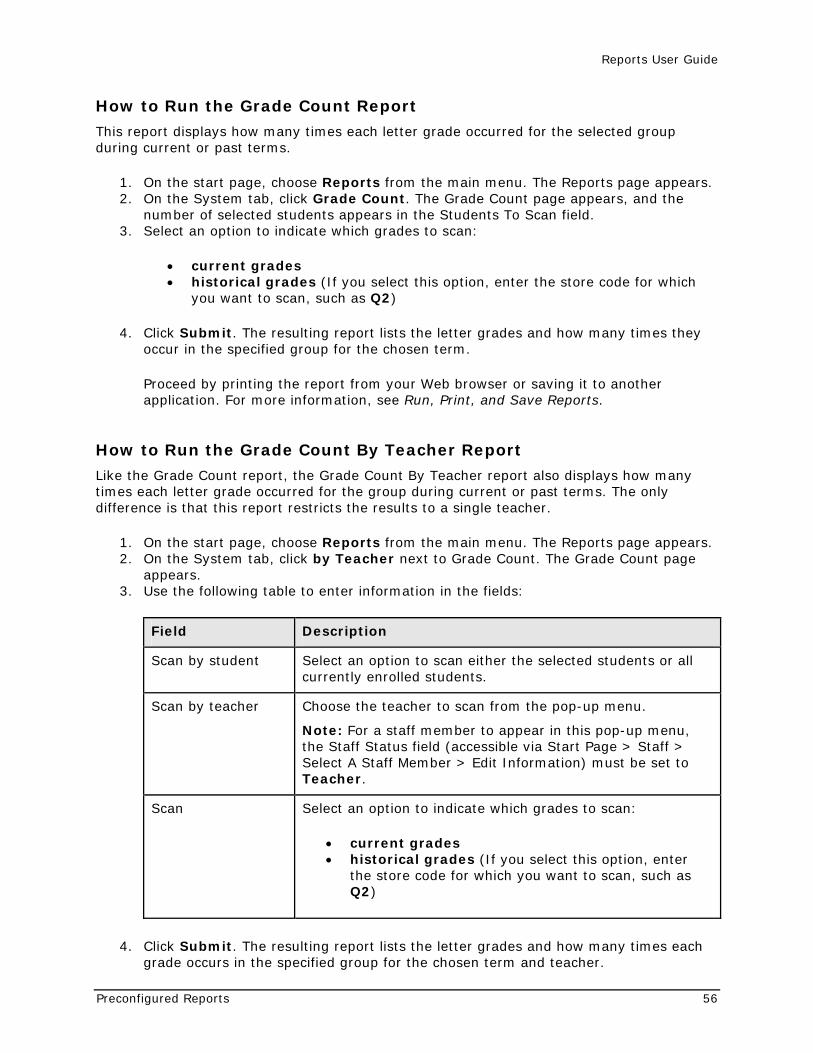
Reports User Guide
Preconfigured Reports 56
How to Run the Grade Count Report
This report displays how many times each letter grade occurred for the selected group during current or past terms.
1. On the start page, choose Reports from the main menu. The Reports page appears. 2. On the System tab, click Grade Count. The Grade Count page appears, and the
number of selected students appears in the Students To Scan field. 3. Select an option to indicate which grades to scan:
• current grades • historical grades (If you select this option, enter the store code for which
you want to scan, such as Q2)
4. Click Submit. The resulting report lists the letter grades and how many times they occur in the specified group for the chosen term.
Proceed by printing the report from your Web browser or saving it to another application. For more information, see Run, Print, and Save Reports.
How to Run the Grade Count By Teacher Report
Like the Grade Count report, the Grade Count By Teacher report also displays how many times each letter grade occurred for the group during current or past terms. The only difference is that this report restricts the results to a single teacher.
1. On the start page, choose Reports from the main menu. The Reports page appears. 2. On the System tab, click by Teacher next to Grade Count. The Grade Count page
appears. 3. Use the following table to enter information in the fields:
Field Description
Scan by student Select an option to scan either the selected students or all currently enrolled students.
Scan by teacher Choose the teacher to scan from the pop-up menu.
Note: For a staff member to appear in this pop-up menu, the Staff Status field (accessible via Start Page > Staff > Select A Staff Member > Edit Information) must be set to Teacher.
Scan Select an option to indicate which grades to scan:
• current grades • historical grades (If you select this option, enter
the store code for which you want to scan, such as Q2)
4. Click Submit. The resulting report lists the letter grades and how many times each grade occurs in the specified group for the chosen term and teacher.
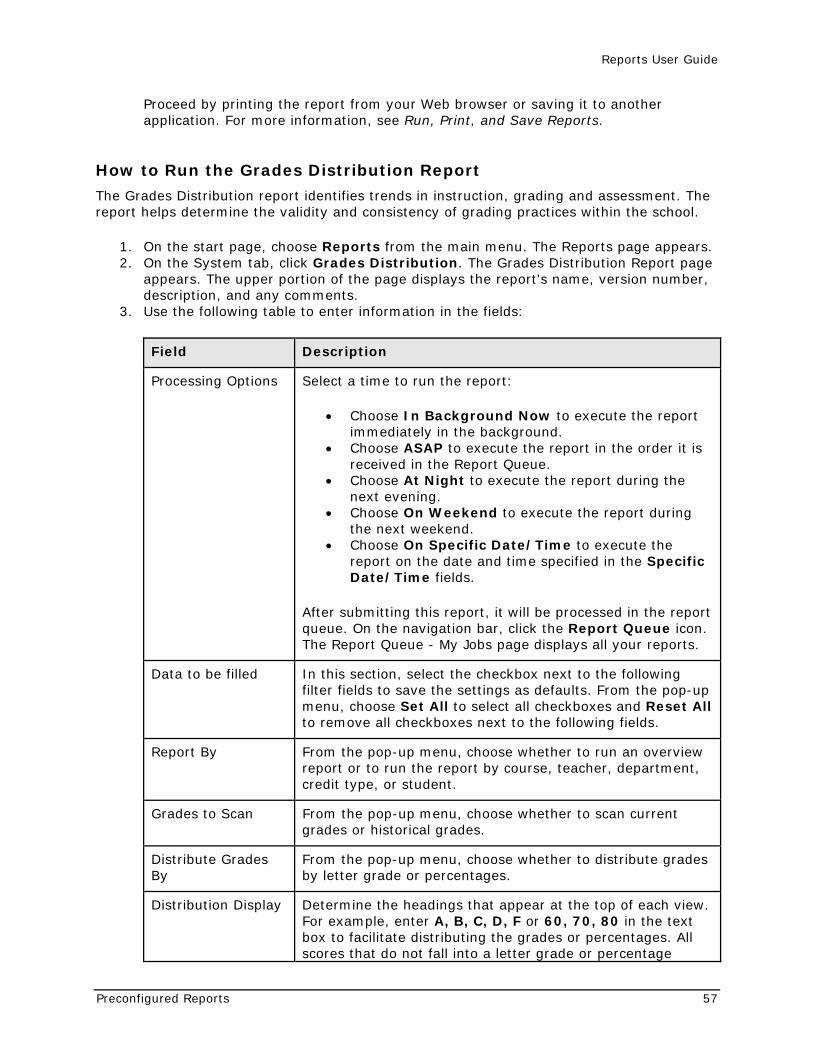
Reports User Guide
Preconfigured Reports 57
Proceed by printing the report from your Web browser or saving it to another application. For more information, see Run, Print, and Save Reports.
How to Run the Grades Distribution Report
The Grades Distribution report identifies trends in instruction, grading and assessment. The report helps determine the validity and consistency of grading practices within the school.
1. On the start page, choose Reports from the main menu. The Reports page appears. 2. On the System tab, click Grades Distribution. The Grades Distribution Report page
appears. The upper portion of the page displays the report's name, version number, description, and any comments.
3. Use the following table to enter information in the fields:
Field Description
Processing Options Select a time to run the report:
• Choose In Background Now to execute the report immediately in the background.
• Choose ASAP to execute the report in the order it is received in the Report Queue.
• Choose At Night to execute the report during the next evening.
• Choose On Weekend to execute the report during the next weekend.
• Choose On Specific Date/Time to execute the report on the date and time specified in the Specific Date/Time fields.
After submitting this report, it will be processed in the report queue. On the navigation bar, click the Report Queue icon. The Report Queue - My Jobs page displays all your reports.
Data to be filled In this section, select the checkbox next to the following filter fields to save the settings as defaults. From the pop-up menu, choose Set All to select all checkboxes and Reset All to remove all checkboxes next to the following fields.
Report By From the pop-up menu, choose whether to run an overview report or to run the report by course, teacher, department, credit type, or student.
Grades to Scan From the pop-up menu, choose whether to scan current grades or historical grades.
Distribute Grades By
From the pop-up menu, choose whether to distribute grades by letter grade or percentages.
Distribution Display Determine the headings that appear at the top of each view. For example, enter A, B, C, D, F or 60, 70, 80 in the text box to facilitate distributing the grades or percentages. All scores that do not fall into a letter grade or percentage
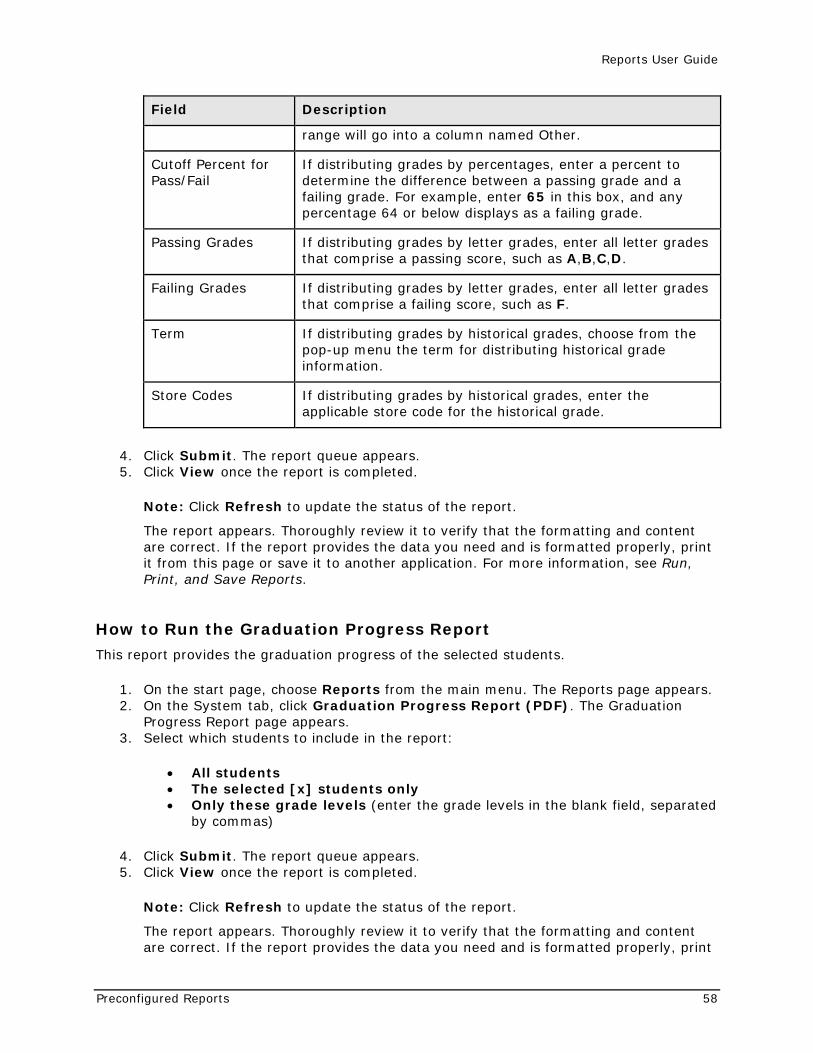
Reports User Guide
Preconfigured Reports 58
Field Description
range will go into a column named Other.
Cutoff Percent for Pass/Fail
If distributing grades by percentages, enter a percent to determine the difference between a passing grade and a failing grade. For example, enter 65 in this box, and any percentage 64 or below displays as a failing grade.
Passing Grades If distributing grades by letter grades, enter all letter grades that comprise a passing score, such as A,B,C,D.
Failing Grades If distributing grades by letter grades, enter all letter grades that comprise a failing score, such as F.
Term If distributing grades by historical grades, choose from the pop-up menu the term for distributing historical grade information.
Store Codes If distributing grades by historical grades, enter the applicable store code for the historical grade.
4. Click Submit. The report queue appears. 5. Click View once the report is completed.
Note: Click Refresh to update the status of the report.
The report appears. Thoroughly review it to verify that the formatting and content are correct. If the report provides the data you need and is formatted properly, print it from this page or save it to another application. For more information, see Run, Print, and Save Reports.
How to Run the Graduation Progress Report
This report provides the graduation progress of the selected students.
1. On the start page, choose Reports from the main menu. The Reports page appears. 2. On the System tab, click Graduation Progress Report (PDF). The Graduation
Progress Report page appears. 3. Select which students to include in the report:
• All students • The selected [x] students only • Only these grade levels (enter the grade levels in the blank field, separated
by commas)
4. Click Submit. The report queue appears. 5. Click View once the report is completed.
Note: Click Refresh to update the status of the report.
The report appears. Thoroughly review it to verify that the formatting and content are correct. If the report provides the data you need and is formatted properly, print
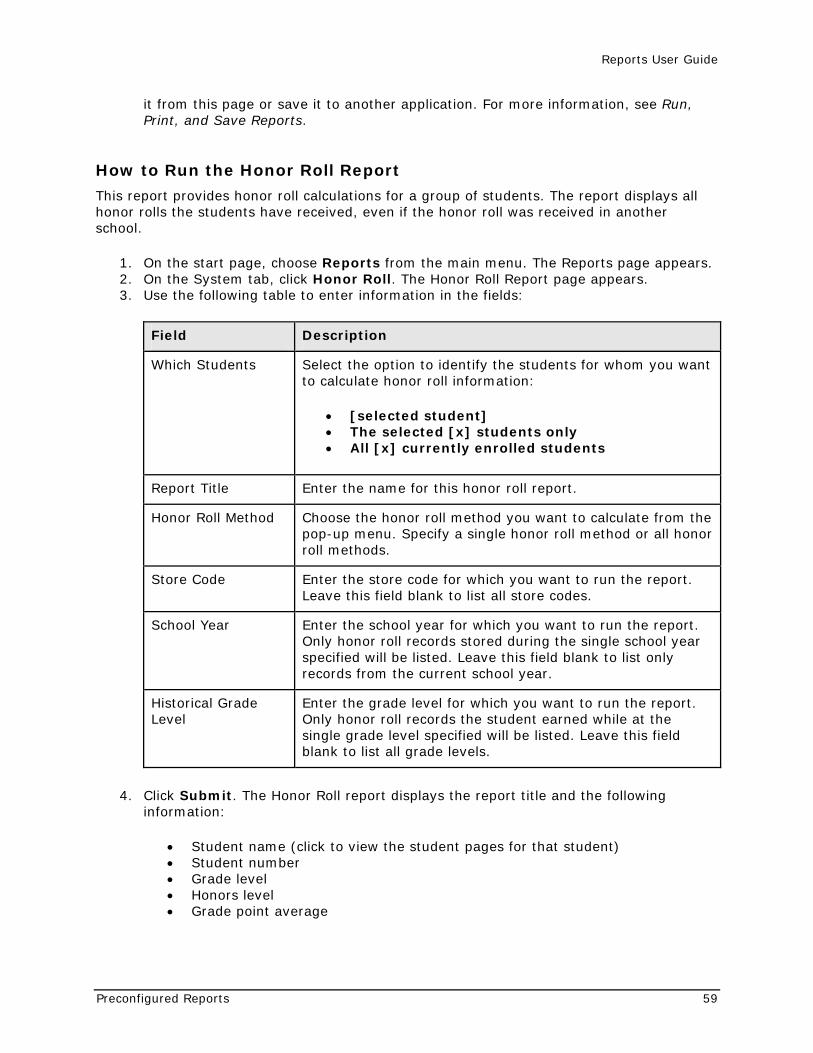
Reports User Guide
Preconfigured Reports 59
it from this page or save it to another application. For more information, see Run, Print, and Save Reports.
How to Run the Honor Roll Report
This report provides honor roll calculations for a group of students. The report displays all honor rolls the students have received, even if the honor roll was received in another school.
1. On the start page, choose Reports from the main menu. The Reports page appears. 2. On the System tab, click Honor Roll. The Honor Roll Report page appears. 3. Use the following table to enter information in the fields:
Field Description
Which Students Select the option to identify the students for whom you want to calculate honor roll information:
• [selected student] • The selected [x] students only • All [x] currently enrolled students
Report Title Enter the name for this honor roll report.
Honor Roll Method Choose the honor roll method you want to calculate from the pop-up menu. Specify a single honor roll method or all honor roll methods.
Store Code Enter the store code for which you want to run the report. Leave this field blank to list all store codes.
School Year Enter the school year for which you want to run the report. Only honor roll records stored during the single school year specified will be listed. Leave this field blank to list only records from the current school year.
Historical Grade Level
Enter the grade level for which you want to run the report. Only honor roll records the student earned while at the single grade level specified will be listed. Leave this field blank to list all grade levels.
4. Click Submit. The Honor Roll report displays the report title and the following information:
• Student name (click to view the student pages for that student) • Student number • Grade level • Honors level • Grade point average
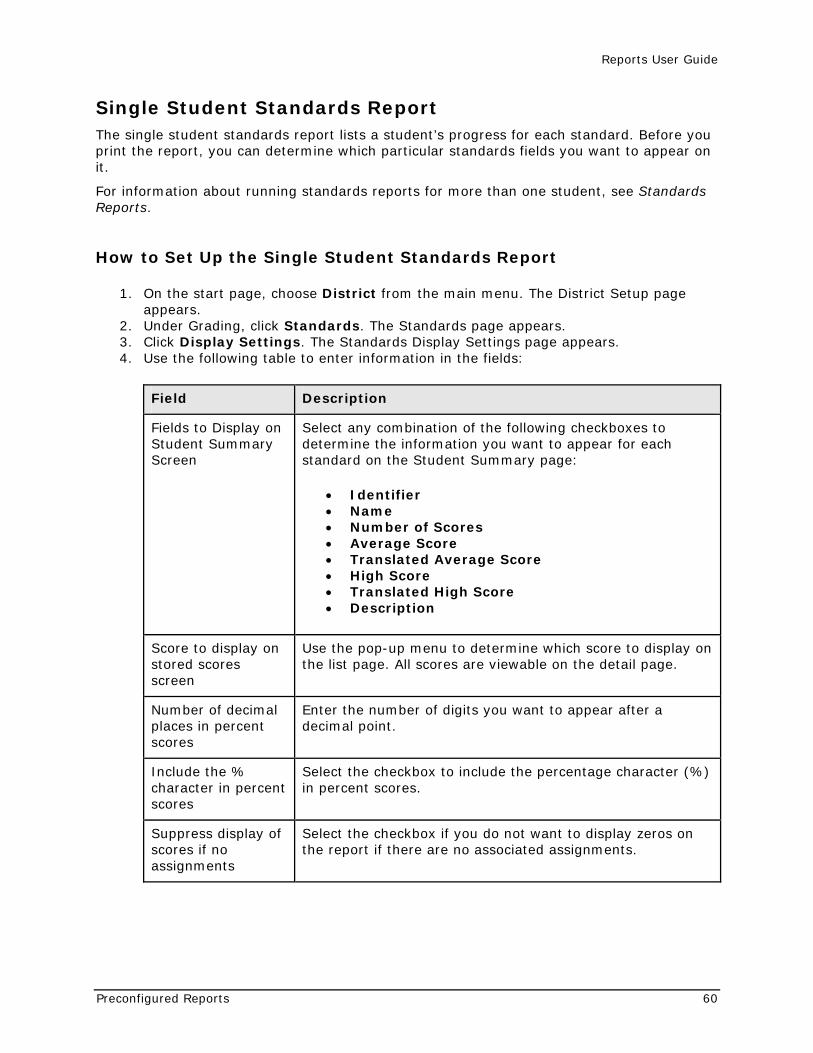
Reports User Guide
Preconfigured Reports 60
Single Student Standards Report The single student standards report lists a student’s progress for each standard. Before you print the report, you can determine which particular standards fields you want to appear on it.
For information about running standards reports for more than one student, see Standards Reports.
How to Set Up the Single Student Standards Report
1. On the start page, choose District from the main menu. The District Setup page appears.
2. Under Grading, click Standards. The Standards page appears. 3. Click Display Settings. The Standards Display Settings page appears. 4. Use the following table to enter information in the fields:
Field Description
Fields to Display on Student Summary Screen
Select any combination of the following checkboxes to determine the information you want to appear for each standard on the Student Summary page:
• Identifier • Name • Number of Scores • Average Score • Translated Average Score • High Score • Translated High Score • Description
Score to display on stored scores screen
Use the pop-up menu to determine which score to display on the list page. All scores are viewable on the detail page.
Number of decimal places in percent scores
Enter the number of digits you want to appear after a decimal point.
Include the % character in percent scores
Select the checkbox to include the percentage character (%) in percent scores.
Suppress display of scores if no assignments
Select the checkbox if you do not want to display zeros on the report if there are no associated assignments.
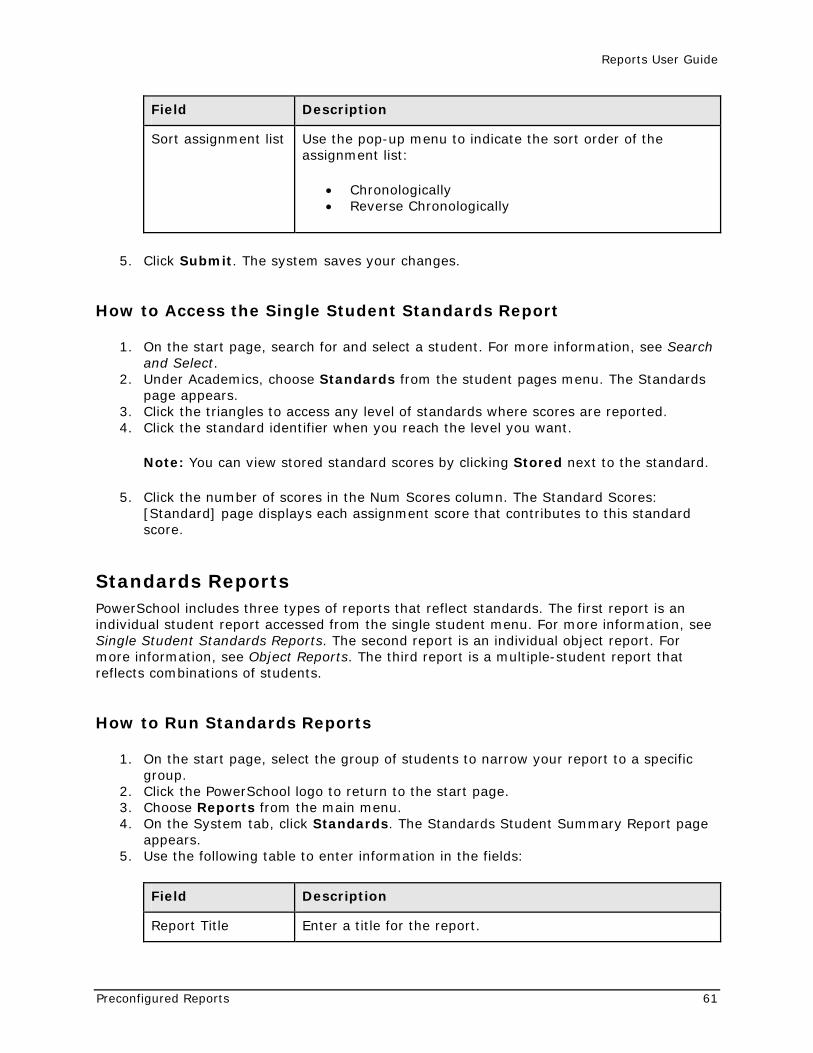
Reports User Guide
Preconfigured Reports 61
Field Description
Sort assignment list Use the pop-up menu to indicate the sort order of the assignment list:
• Chronologically • Reverse Chronologically
5. Click Submit. The system saves your changes.
How to Access the Single Student Standards Report
1. On the start page, search for and select a student. For more information, see Search and Select.
2. Under Academics, choose Standards from the student pages menu. The Standards page appears.
3. Click the triangles to access any level of standards where scores are reported. 4. Click the standard identifier when you reach the level you want.
Note: You can view stored standard scores by clicking Stored next to the standard.
5. Click the number of scores in the Num Scores column. The Standard Scores: [Standard] page displays each assignment score that contributes to this standard score.
Standards Reports PowerSchool includes three types of reports that reflect standards. The first report is an individual student report accessed from the single student menu. For more information, see Single Student Standards Reports. The second report is an individual object report. For more information, see Object Reports. The third report is a multiple-student report that reflects combinations of students.
How to Run Standards Reports
1. On the start page, select the group of students to narrow your report to a specific group.
2. Click the PowerSchool logo to return to the start page. 3. Choose Reports from the main menu. 4. On the System tab, click Standards. The Standards Student Summary Report page
appears. 5. Use the following table to enter information in the fields:
Field Description
Report Title Enter a title for the report.
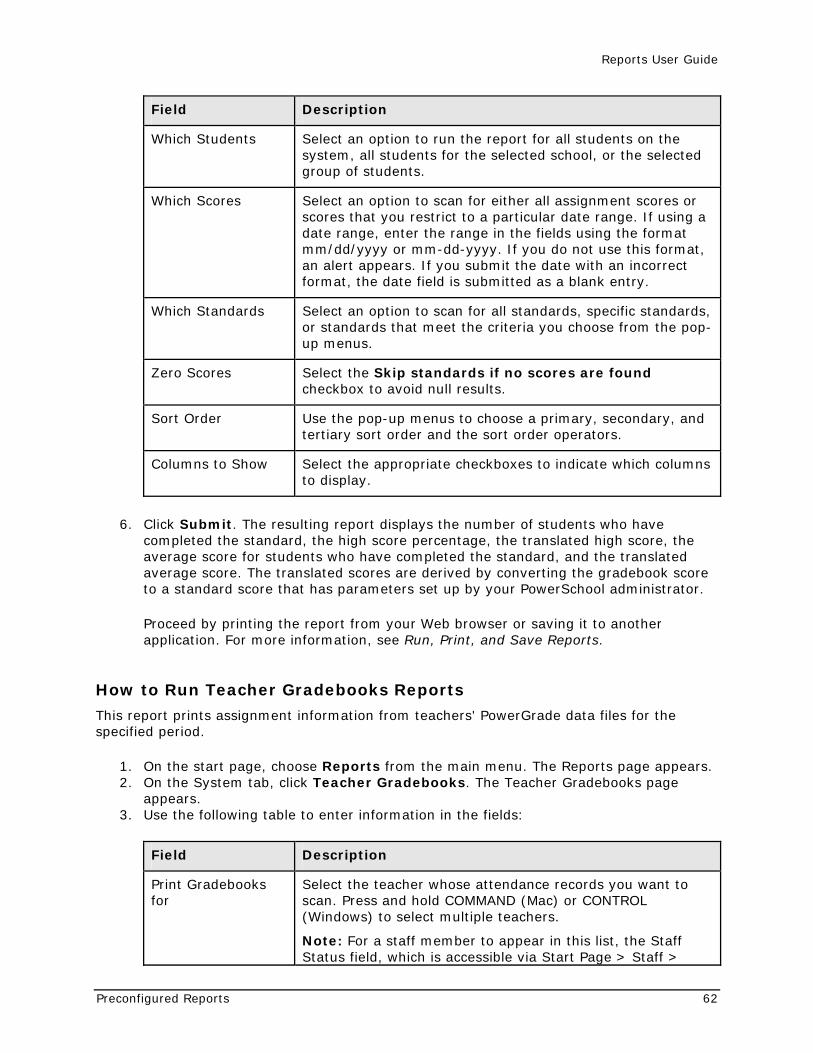
Reports User Guide
Preconfigured Reports 62
Field Description
Which Students Select an option to run the report for all students on the system, all students for the selected school, or the selected group of students.
Which Scores Select an option to scan for either all assignment scores or scores that you restrict to a particular date range. If using a date range, enter the range in the fields using the format mm/dd/yyyy or mm-dd-yyyy. If you do not use this format, an alert appears. If you submit the date with an incorrect format, the date field is submitted as a blank entry.
Which Standards Select an option to scan for all standards, specific standards, or standards that meet the criteria you choose from the pop-up menus.
Zero Scores Select the Skip standards if no scores are found checkbox to avoid null results.
Sort Order Use the pop-up menus to choose a primary, secondary, and tertiary sort order and the sort order operators.
Columns to Show Select the appropriate checkboxes to indicate which columns to display.
6. Click Submit. The resulting report displays the number of students who have completed the standard, the high score percentage, the translated high score, the average score for students who have completed the standard, and the translated average score. The translated scores are derived by converting the gradebook score to a standard score that has parameters set up by your PowerSchool administrator.
Proceed by printing the report from your Web browser or saving it to another application. For more information, see Run, Print, and Save Reports.
How to Run Teacher Gradebooks Reports
This report prints assignment information from teachers' PowerGrade data files for the specified period.
1. On the start page, choose Reports from the main menu. The Reports page appears. 2. On the System tab, click Teacher Gradebooks. The Teacher Gradebooks page
appears. 3. Use the following table to enter information in the fields:
Field Description
Print Gradebooks for
Select the teacher whose attendance records you want to scan. Press and hold COMMAND (Mac) or CONTROL (Windows) to select multiple teachers.
Note: For a staff member to appear in this list, the Staff Status field, which is accessible via Start Page > Staff >
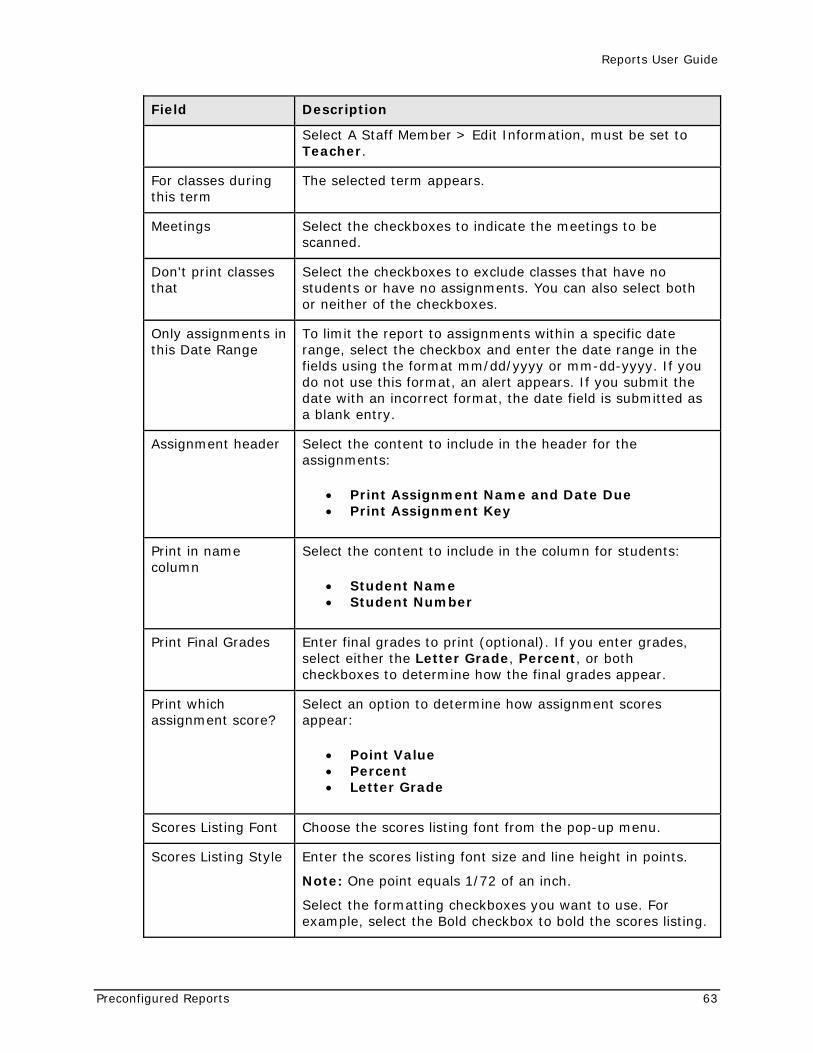
Reports User Guide
Preconfigured Reports 63
Field Description
Select A Staff Member > Edit Information, must be set to Teacher.
For classes during this term
The selected term appears.
Meetings Select the checkboxes to indicate the meetings to be scanned.
Don't print classes that
Select the checkboxes to exclude classes that have no students or have no assignments. You can also select both or neither of the checkboxes.
Only assignments in this Date Range
To limit the report to assignments within a specific date range, select the checkbox and enter the date range in the fields using the format mm/dd/yyyy or mm-dd-yyyy. If you do not use this format, an alert appears. If you submit the date with an incorrect format, the date field is submitted as a blank entry.
Assignment header Select the content to include in the header for the assignments:
• Print Assignment Name and Date Due • Print Assignment Key
Print in name column
Select the content to include in the column for students:
• Student Name • Student Number
Print Final Grades Enter final grades to print (optional). If you enter grades, select either the Letter Grade, Percent, or both checkboxes to determine how the final grades appear.
Print which assignment score?
Select an option to determine how assignment scores appear:
• Point Value • Percent • Letter Grade
Scores Listing Font Choose the scores listing font from the pop-up menu.
Scores Listing Style Enter the scores listing font size and line height in points.
Note: One point equals 1/72 of an inch.
Select the formatting checkboxes you want to use. For example, select the Bold checkbox to bold the scores listing.
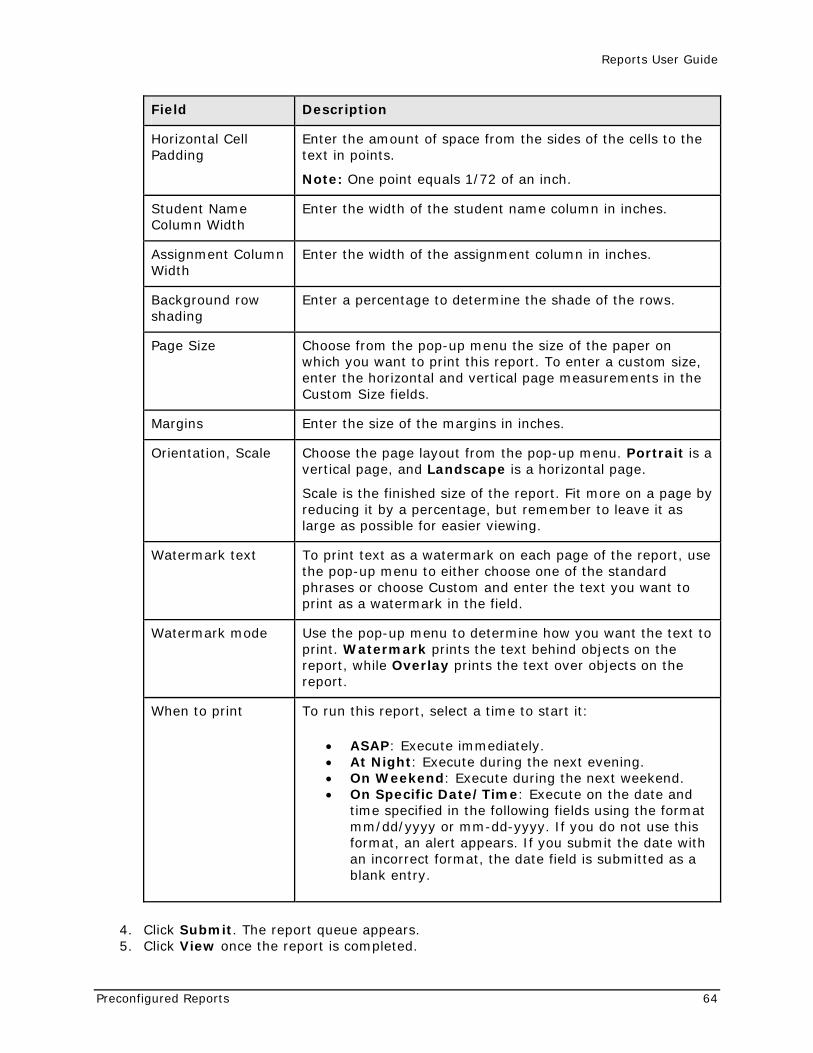
Reports User Guide
Preconfigured Reports 64
Field Description
Horizontal Cell Padding
Enter the amount of space from the sides of the cells to the text in points.
Note: One point equals 1/72 of an inch.
Student Name Column Width
Enter the width of the student name column in inches.
Assignment Column Width
Enter the width of the assignment column in inches.
Background row shading
Enter a percentage to determine the shade of the rows.
Page Size Choose from the pop-up menu the size of the paper on which you want to print this report. To enter a custom size, enter the horizontal and vertical page measurements in the Custom Size fields.
Margins Enter the size of the margins in inches.
Orientation, Scale Choose the page layout from the pop-up menu. Portrait is a vertical page, and Landscape is a horizontal page.
Scale is the finished size of the report. Fit more on a page by reducing it by a percentage, but remember to leave it as large as possible for easier viewing.
Watermark text To print text as a watermark on each page of the report, use the pop-up menu to either choose one of the standard phrases or choose Custom and enter the text you want to print as a watermark in the field.
Watermark mode Use the pop-up menu to determine how you want the text to print. Watermark prints the text behind objects on the report, while Overlay prints the text over objects on the report.
When to print To run this report, select a time to start it:
• ASAP: Execute immediately. • At Night: Execute during the next evening. • On Weekend: Execute during the next weekend. • On Specific Date/Time: Execute on the date and
time specified in the following fields using the format mm/dd/yyyy or mm-dd-yyyy. If you do not use this format, an alert appears. If you submit the date with an incorrect format, the date field is submitted as a blank entry.
4. Click Submit. The report queue appears. 5. Click View once the report is completed.
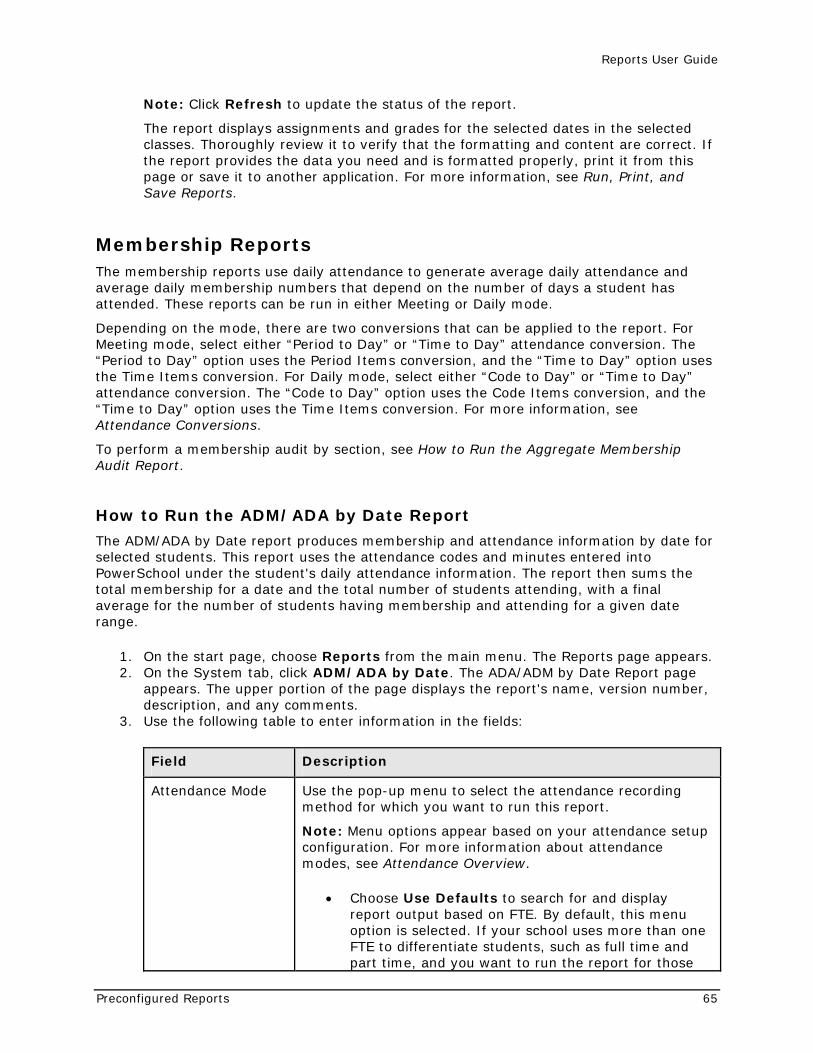
Reports User Guide
Preconfigured Reports 65
Note: Click Refresh to update the status of the report.
The report displays assignments and grades for the selected dates in the selected classes. Thoroughly review it to verify that the formatting and content are correct. If the report provides the data you need and is formatted properly, print it from this page or save it to another application. For more information, see Run, Print, and Save Reports.
Membership Reports The membership reports use daily attendance to generate average daily attendance and average daily membership numbers that depend on the number of days a student has attended. These reports can be run in either Meeting or Daily mode.
Depending on the mode, there are two conversions that can be applied to the report. For Meeting mode, select either “Period to Day” or “Time to Day” attendance conversion. The “Period to Day” option uses the Period Items conversion, and the “Time to Day” option uses the Time Items conversion. For Daily mode, select either “Code to Day” or “Time to Day” attendance conversion. The “Code to Day” option uses the Code Items conversion, and the “Time to Day” option uses the Time Items conversion. For more information, see Attendance Conversions.
To perform a membership audit by section, see How to Run the Aggregate Membership Audit Report.
How to Run the ADM/ADA by Date Report
The ADM/ADA by Date report produces membership and attendance information by date for selected students. This report uses the attendance codes and minutes entered into PowerSchool under the student's daily attendance information. The report then sums the total membership for a date and the total number of students attending, with a final average for the number of students having membership and attending for a given date range.
1. On the start page, choose Reports from the main menu. The Reports page appears. 2. On the System tab, click ADM/ADA by Date. The ADA/ADM by Date Report page
appears. The upper portion of the page displays the report's name, version number, description, and any comments.
3. Use the following table to enter information in the fields:
Field Description
Attendance Mode Use the pop-up menu to select the attendance recording method for which you want to run this report.
Note: Menu options appear based on your attendance setup configuration. For more information about attendance modes, see Attendance Overview.
• Choose Use Defaults to search for and display report output based on FTE. By default, this menu option is selected. If your school uses more than one FTE to differentiate students, such as full time and part time, and you want to run the report for those
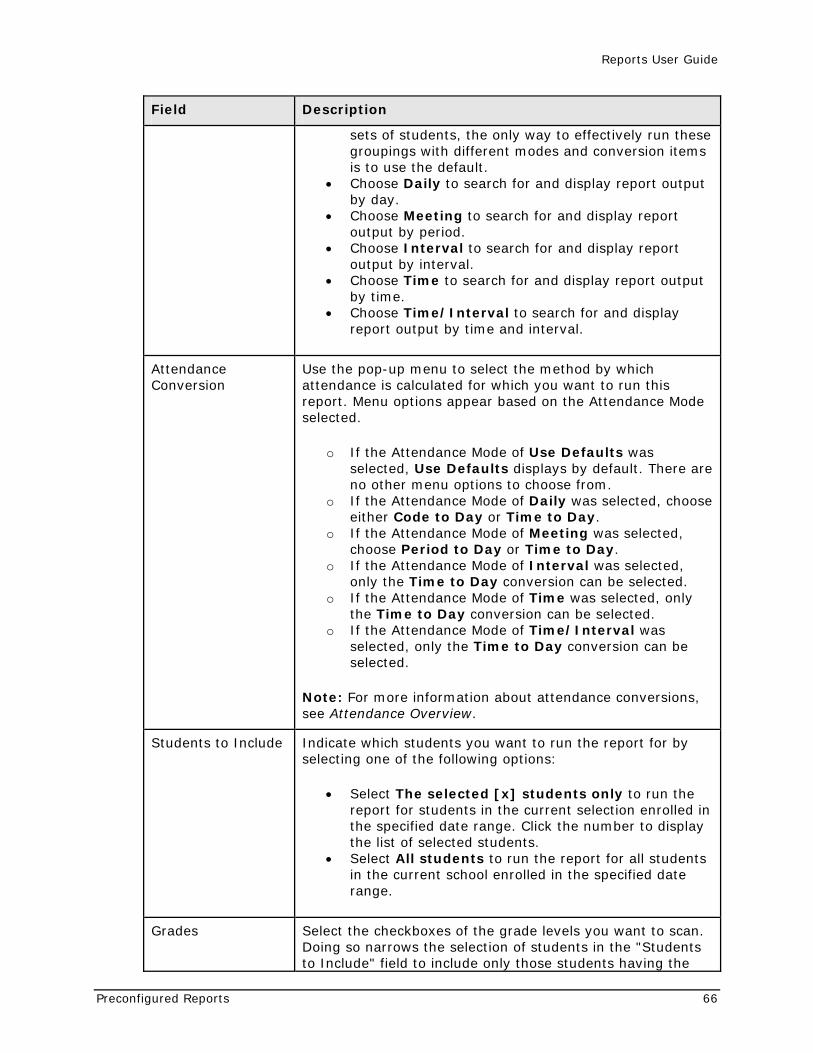
Reports User Guide
Preconfigured Reports 66
Field Description
sets of students, the only way to effectively run these groupings with different modes and conversion items is to use the default.
• Choose Daily to search for and display report output by day.
• Choose Meeting to search for and display report output by period.
• Choose Interval to search for and display report output by interval.
• Choose Time to search for and display report output by time.
• Choose Time/Interval to search for and display report output by time and interval.
Attendance Conversion
Use the pop-up menu to select the method by which attendance is calculated for which you want to run this report. Menu options appear based on the Attendance Mode selected.
o If the Attendance Mode of Use Defaults was selected, Use Defaults displays by default. There are no other menu options to choose from.
o If the Attendance Mode of Daily was selected, choose either Code to Day or Time to Day.
o If the Attendance Mode of Meeting was selected, choose Period to Day or Time to Day.
o If the Attendance Mode of Interval was selected, only the Time to Day conversion can be selected.
o If the Attendance Mode of Time was selected, only the Time to Day conversion can be selected.
o If the Attendance Mode of Time/Interval was selected, only the Time to Day conversion can be selected.
Note: For more information about attendance conversions, see Attendance Overview.
Students to Include Indicate which students you want to run the report for by selecting one of the following options:
• Select The selected [x] students only to run the report for students in the current selection enrolled in the specified date range. Click the number to display the list of selected students.
• Select All students to run the report for all students in the current school enrolled in the specified date range.
Grades Select the checkboxes of the grade levels you want to scan. Doing so narrows the selection of students in the "Students to Include" field to include only those students having the
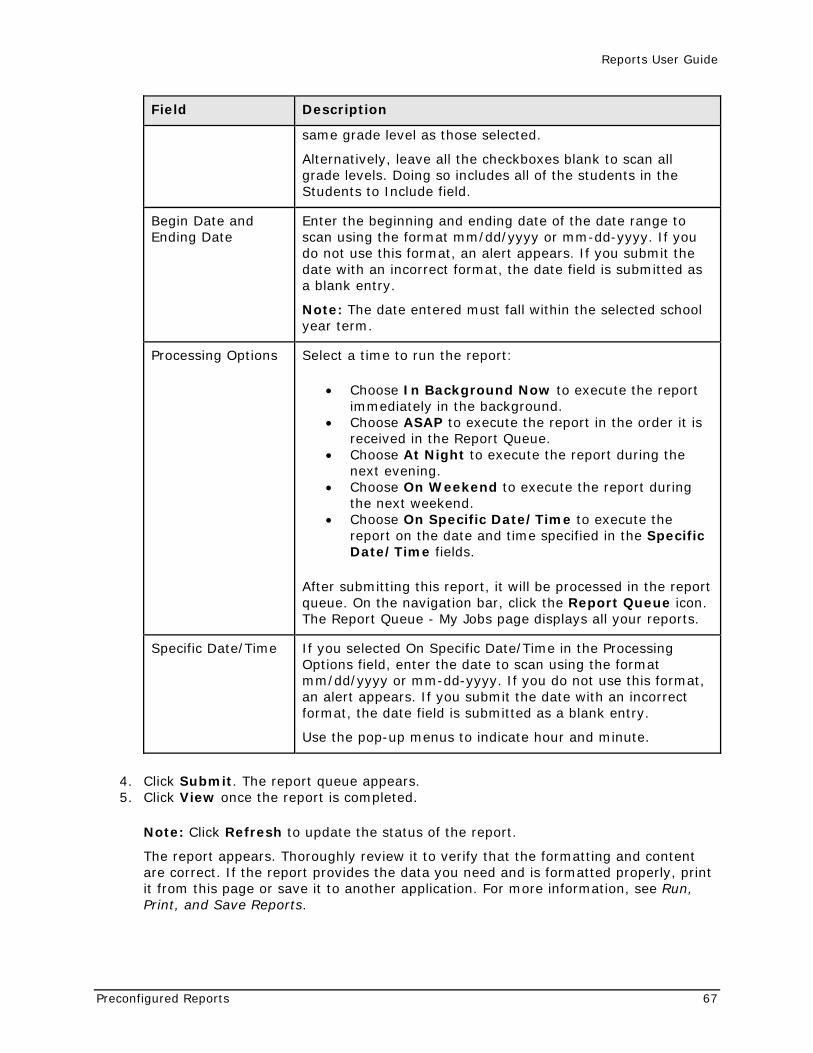
Reports User Guide
Preconfigured Reports 67
Field Description
same grade level as those selected.
Alternatively, leave all the checkboxes blank to scan all grade levels. Doing so includes all of the students in the Students to Include field.
Begin Date and Ending Date
Enter the beginning and ending date of the date range to scan using the format mm/dd/yyyy or mm-dd-yyyy. If you do not use this format, an alert appears. If you submit the date with an incorrect format, the date field is submitted as a blank entry.
Note: The date entered must fall within the selected school year term.
Processing Options Select a time to run the report:
• Choose In Background Now to execute the report immediately in the background.
• Choose ASAP to execute the report in the order it is received in the Report Queue.
• Choose At Night to execute the report during the next evening.
• Choose On Weekend to execute the report during the next weekend.
• Choose On Specific Date/Time to execute the report on the date and time specified in the Specific Date/Time fields.
After submitting this report, it will be processed in the report queue. On the navigation bar, click the Report Queue icon. The Report Queue - My Jobs page displays all your reports.
Specific Date/Time If you selected On Specific Date/Time in the Processing Options field, enter the date to scan using the format mm/dd/yyyy or mm-dd-yyyy. If you do not use this format, an alert appears. If you submit the date with an incorrect format, the date field is submitted as a blank entry.
Use the pop-up menus to indicate hour and minute.
4. Click Submit. The report queue appears. 5. Click View once the report is completed.
Note: Click Refresh to update the status of the report.
The report appears. Thoroughly review it to verify that the formatting and content are correct. If the report provides the data you need and is formatted properly, print it from this page or save it to another application. For more information, see Run, Print, and Save Reports.
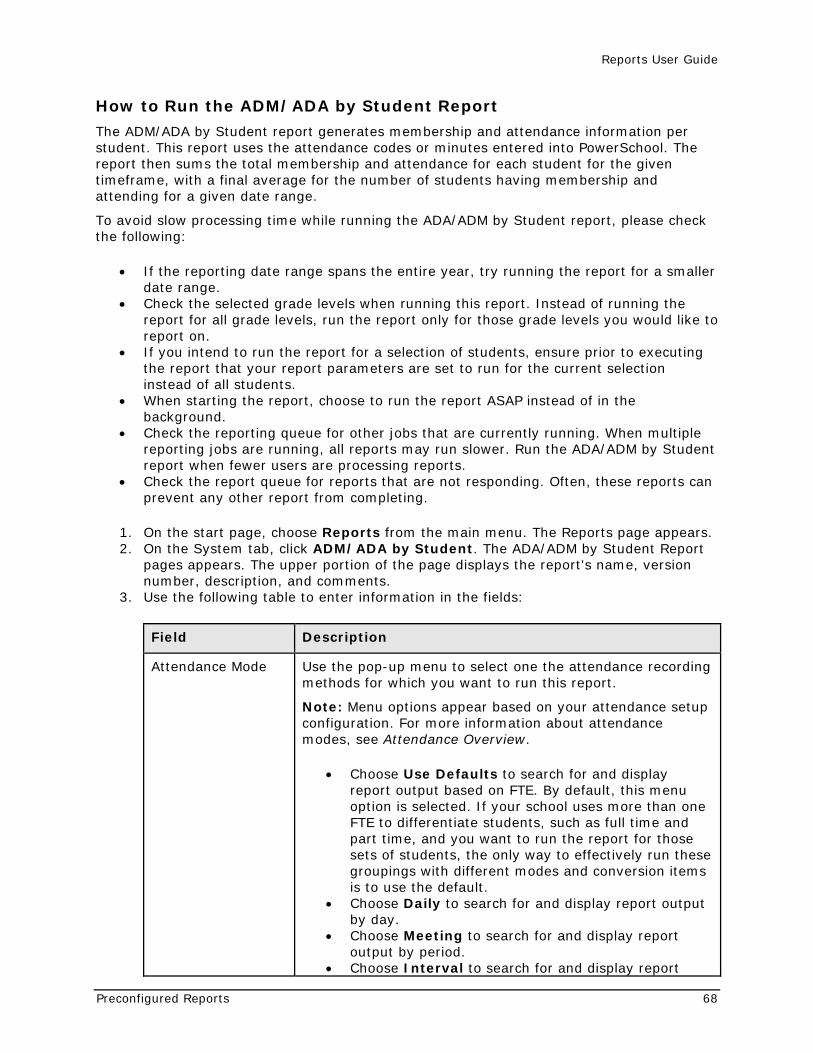
Reports User Guide
Preconfigured Reports 68
How to Run the ADM/ADA by Student Report
The ADM/ADA by Student report generates membership and attendance information per student. This report uses the attendance codes or minutes entered into PowerSchool. The report then sums the total membership and attendance for each student for the given timeframe, with a final average for the number of students having membership and attending for a given date range.
To avoid slow processing time while running the ADA/ADM by Student report, please check the following:
• If the reporting date range spans the entire year, try running the report for a smaller date range.
• Check the selected grade levels when running this report. Instead of running the report for all grade levels, run the report only for those grade levels you would like to report on.
• If you intend to run the report for a selection of students, ensure prior to executing the report that your report parameters are set to run for the current selection instead of all students.
• When starting the report, choose to run the report ASAP instead of in the background.
• Check the reporting queue for other jobs that are currently running. When multiple reporting jobs are running, all reports may run slower. Run the ADA/ADM by Student report when fewer users are processing reports.
• Check the report queue for reports that are not responding. Often, these reports can prevent any other report from completing.
1. On the start page, choose Reports from the main menu. The Reports page appears. 2. On the System tab, click ADM/ADA by Student. The ADA/ADM by Student Report
pages appears. The upper portion of the page displays the report's name, version number, description, and comments.
3. Use the following table to enter information in the fields:
Field Description
Attendance Mode Use the pop-up menu to select one the attendance recording methods for which you want to run this report.
Note: Menu options appear based on your attendance setup configuration. For more information about attendance modes, see Attendance Overview.
• Choose Use Defaults to search for and display report output based on FTE. By default, this menu option is selected. If your school uses more than one FTE to differentiate students, such as full time and part time, and you want to run the report for those sets of students, the only way to effectively run these groupings with different modes and conversion items is to use the default.
• Choose Daily to search for and display report output by day.
• Choose Meeting to search for and display report output by period.
• Choose Interval to search for and display report
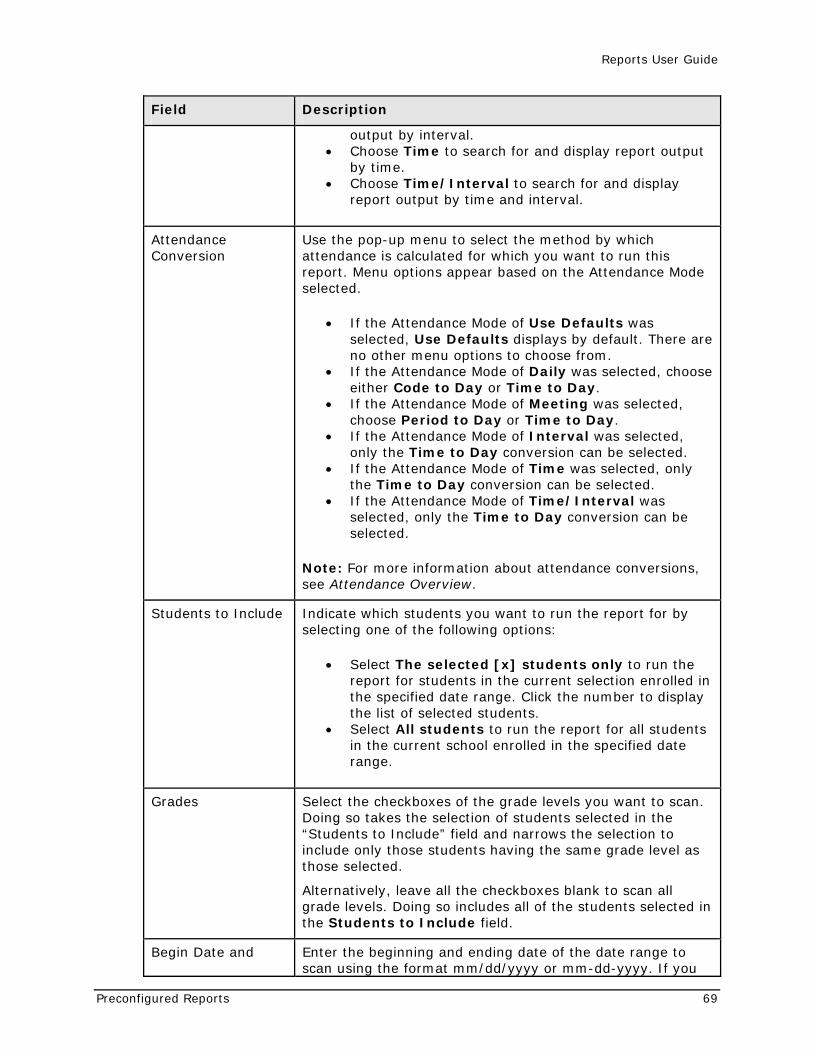
Reports User Guide
Preconfigured Reports 69
Field Description
output by interval. • Choose Time to search for and display report output
by time. • Choose Time/Interval to search for and display
report output by time and interval.
Attendance Conversion
Use the pop-up menu to select the method by which attendance is calculated for which you want to run this report. Menu options appear based on the Attendance Mode selected.
• If the Attendance Mode of Use Defaults was selected, Use Defaults displays by default. There are no other menu options to choose from.
• If the Attendance Mode of Daily was selected, choose either Code to Day or Time to Day.
• If the Attendance Mode of Meeting was selected, choose Period to Day or Time to Day.
• If the Attendance Mode of Interval was selected, only the Time to Day conversion can be selected.
• If the Attendance Mode of Time was selected, only the Time to Day conversion can be selected.
• If the Attendance Mode of Time/Interval was selected, only the Time to Day conversion can be selected.
Note: For more information about attendance conversions, see Attendance Overview.
Students to Include Indicate which students you want to run the report for by selecting one of the following options:
• Select The selected [x] students only to run the report for students in the current selection enrolled in the specified date range. Click the number to display the list of selected students.
• Select All students to run the report for all students in the current school enrolled in the specified date range.
Grades Select the checkboxes of the grade levels you want to scan. Doing so takes the selection of students selected in the “Students to Include” field and narrows the selection to include only those students having the same grade level as those selected.
Alternatively, leave all the checkboxes blank to scan all grade levels. Doing so includes all of the students selected in the Students to Include field.
Begin Date and Enter the beginning and ending date of the date range to scan using the format mm/dd/yyyy or mm-dd-yyyy. If you
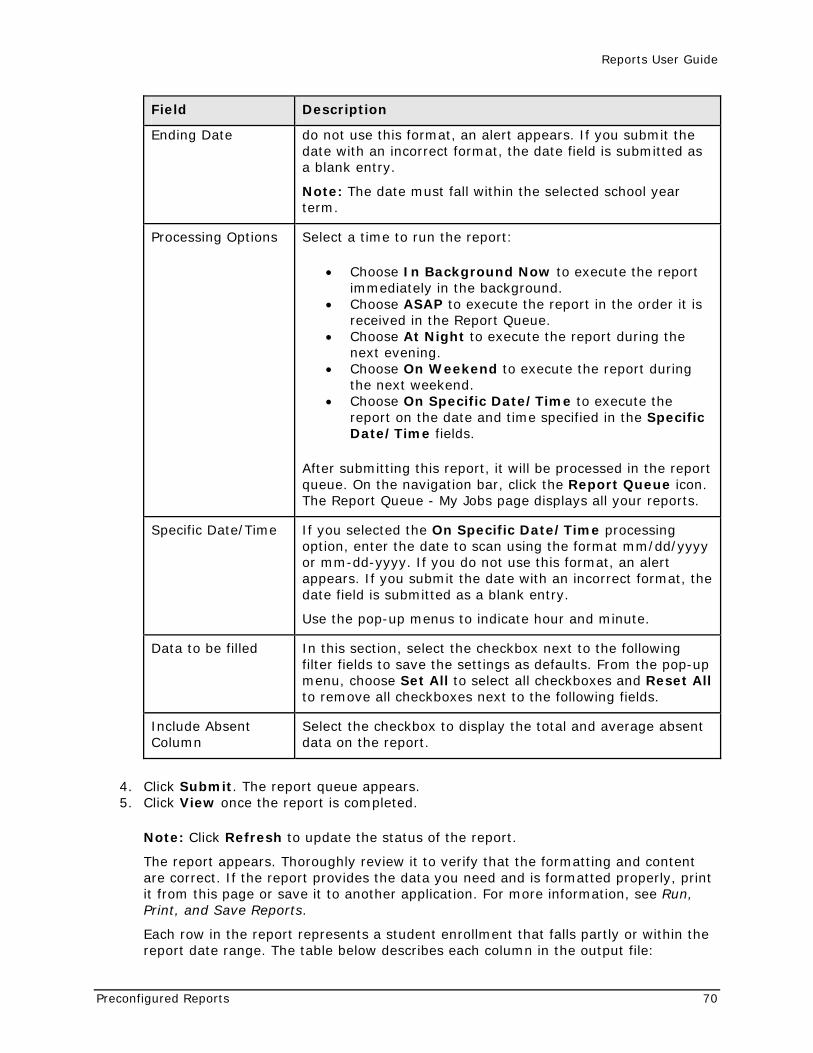
Reports User Guide
Preconfigured Reports 70
Field Description
Ending Date do not use this format, an alert appears. If you submit the date with an incorrect format, the date field is submitted as a blank entry.
Note: The date must fall within the selected school year term.
Processing Options Select a time to run the report:
• Choose In Background Now to execute the report immediately in the background.
• Choose ASAP to execute the report in the order it is received in the Report Queue.
• Choose At Night to execute the report during the next evening.
• Choose On Weekend to execute the report during the next weekend.
• Choose On Specific Date/Time to execute the report on the date and time specified in the Specific Date/Time fields.
After submitting this report, it will be processed in the report queue. On the navigation bar, click the Report Queue icon. The Report Queue - My Jobs page displays all your reports.
Specific Date/Time If you selected the On Specific Date/Time processing option, enter the date to scan using the format mm/dd/yyyy or mm-dd-yyyy. If you do not use this format, an alert appears. If you submit the date with an incorrect format, the date field is submitted as a blank entry.
Use the pop-up menus to indicate hour and minute.
Data to be filled In this section, select the checkbox next to the following filter fields to save the settings as defaults. From the pop-up menu, choose Set All to select all checkboxes and Reset All to remove all checkboxes next to the following fields.
Include Absent Column
Select the checkbox to display the total and average absent data on the report.
4. Click Submit. The report queue appears. 5. Click View once the report is completed.
Note: Click Refresh to update the status of the report.
The report appears. Thoroughly review it to verify that the formatting and content are correct. If the report provides the data you need and is formatted properly, print it from this page or save it to another application. For more information, see Run, Print, and Save Reports.
Each row in the report represents a student enrollment that falls partly or within the report date range. The table below describes each column in the output file:
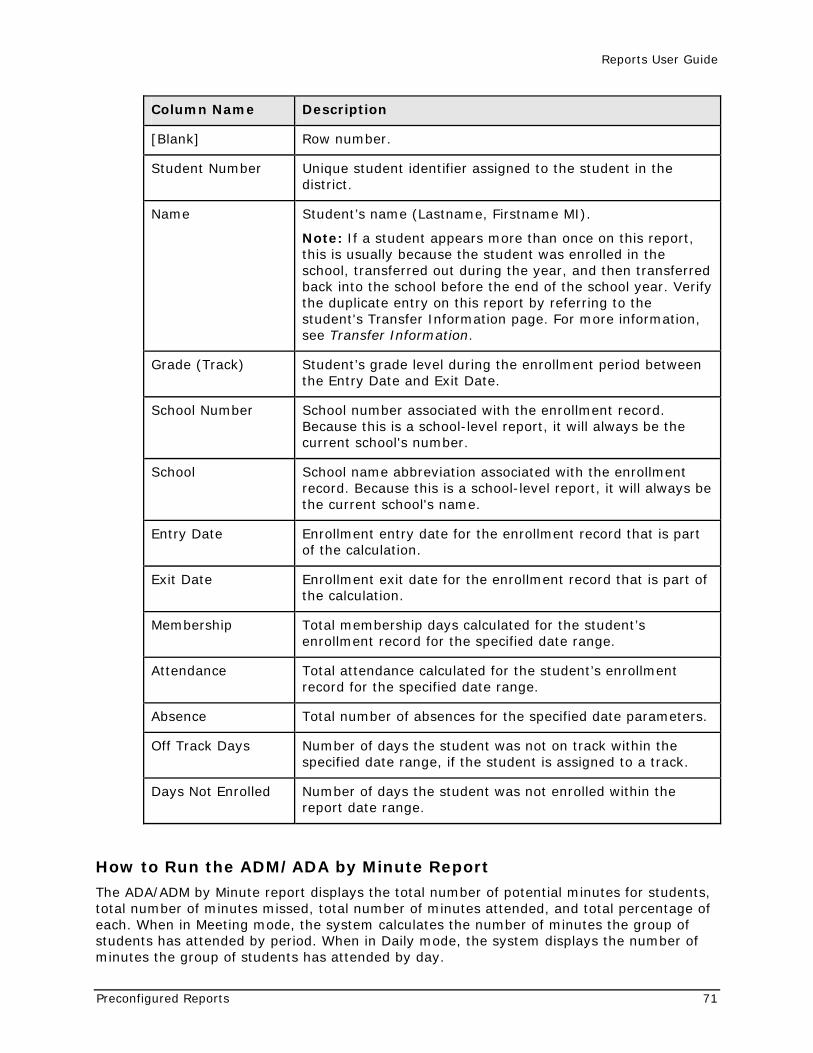
Reports User Guide
Preconfigured Reports 71
Column Name Description
[Blank] Row number.
Student Number Unique student identifier assigned to the student in the district.
Name Student’s name (Lastname, Firstname MI).
Note: If a student appears more than once on this report, this is usually because the student was enrolled in the school, transferred out during the year, and then transferred back into the school before the end of the school year. Verify the duplicate entry on this report by referring to the student's Transfer Information page. For more information, see Transfer Information.
Grade (Track) Student’s grade level during the enrollment period between the Entry Date and Exit Date.
School Number School number associated with the enrollment record. Because this is a school-level report, it will always be the current school's number.
School School name abbreviation associated with the enrollment record. Because this is a school-level report, it will always be the current school's name.
Entry Date Enrollment entry date for the enrollment record that is part of the calculation.
Exit Date Enrollment exit date for the enrollment record that is part of the calculation.
Membership Total membership days calculated for the student’s enrollment record for the specified date range.
Attendance Total attendance calculated for the student’s enrollment record for the specified date range.
Absence Total number of absences for the specified date parameters.
Off Track Days Number of days the student was not on track within the specified date range, if the student is assigned to a track.
Days Not Enrolled Number of days the student was not enrolled within the report date range.
How to Run the ADM/ADA by Minute Report
The ADA/ADM by Minute report displays the total number of potential minutes for students, total number of minutes missed, total number of minutes attended, and total percentage of each. When in Meeting mode, the system calculates the number of minutes the group of students has attended by period. When in Daily mode, the system displays the number of minutes the group of students has attended by day.
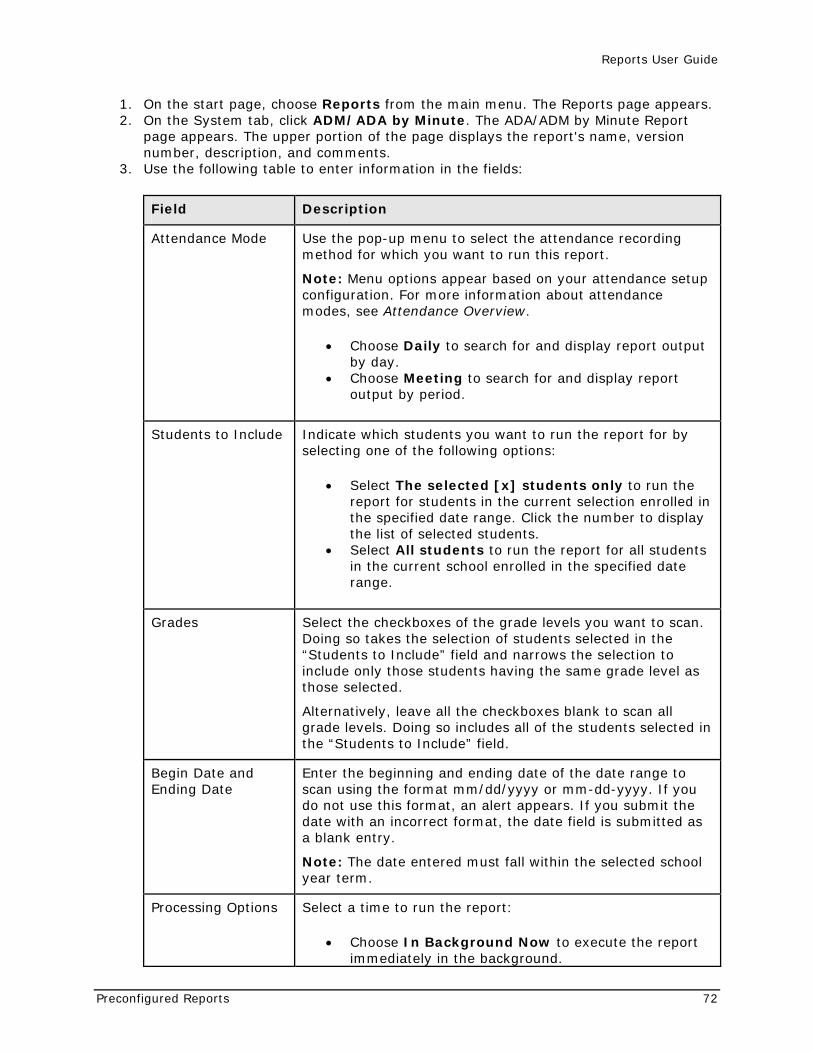
Reports User Guide
Preconfigured Reports 72
1. On the start page, choose Reports from the main menu. The Reports page appears. 2. On the System tab, click ADM/ADA by Minute. The ADA/ADM by Minute Report
page appears. The upper portion of the page displays the report's name, version number, description, and comments.
3. Use the following table to enter information in the fields:
Field Description
Attendance Mode Use the pop-up menu to select the attendance recording method for which you want to run this report.
Note: Menu options appear based on your attendance setup configuration. For more information about attendance modes, see Attendance Overview.
• Choose Daily to search for and display report output by day.
• Choose Meeting to search for and display report output by period.
Students to Include Indicate which students you want to run the report for by selecting one of the following options:
• Select The selected [x] students only to run the report for students in the current selection enrolled in the specified date range. Click the number to display the list of selected students.
• Select All students to run the report for all students in the current school enrolled in the specified date range.
Grades Select the checkboxes of the grade levels you want to scan. Doing so takes the selection of students selected in the “Students to Include” field and narrows the selection to include only those students having the same grade level as those selected.
Alternatively, leave all the checkboxes blank to scan all grade levels. Doing so includes all of the students selected in the “Students to Include” field.
Begin Date and Ending Date
Enter the beginning and ending date of the date range to scan using the format mm/dd/yyyy or mm-dd-yyyy. If you do not use this format, an alert appears. If you submit the date with an incorrect format, the date field is submitted as a blank entry.
Note: The date entered must fall within the selected school year term.
Processing Options Select a time to run the report:
• Choose In Background Now to execute the report immediately in the background.
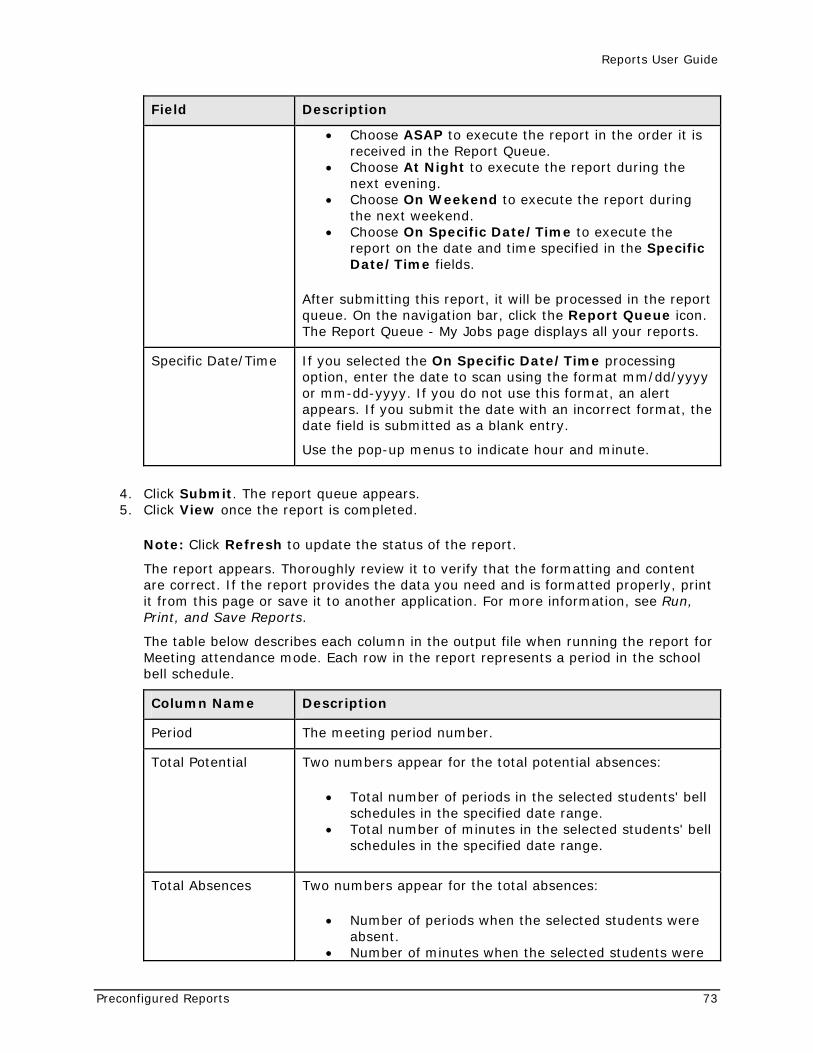
Reports User Guide
Preconfigured Reports 73
Field Description
• Choose ASAP to execute the report in the order it is received in the Report Queue.
• Choose At Night to execute the report during the next evening.
• Choose On Weekend to execute the report during the next weekend.
• Choose On Specific Date/Time to execute the report on the date and time specified in the Specific Date/Time fields.
After submitting this report, it will be processed in the report queue. On the navigation bar, click the Report Queue icon. The Report Queue - My Jobs page displays all your reports.
Specific Date/Time If you selected the On Specific Date/Time processing option, enter the date to scan using the format mm/dd/yyyy or mm-dd-yyyy. If you do not use this format, an alert appears. If you submit the date with an incorrect format, the date field is submitted as a blank entry.
Use the pop-up menus to indicate hour and minute.
4. Click Submit. The report queue appears. 5. Click View once the report is completed.
Note: Click Refresh to update the status of the report.
The report appears. Thoroughly review it to verify that the formatting and content are correct. If the report provides the data you need and is formatted properly, print it from this page or save it to another application. For more information, see Run, Print, and Save Reports.
The table below describes each column in the output file when running the report for Meeting attendance mode. Each row in the report represents a period in the school bell schedule.
Column Name Description
Period The meeting period number.
Total Potential Two numbers appear for the total potential absences:
• Total number of periods in the selected students' bell schedules in the specified date range.
• Total number of minutes in the selected students' bell schedules in the specified date range.
Total Absences Two numbers appear for the total absences:
• Number of periods when the selected students were absent.
• Number of minutes when the selected students were
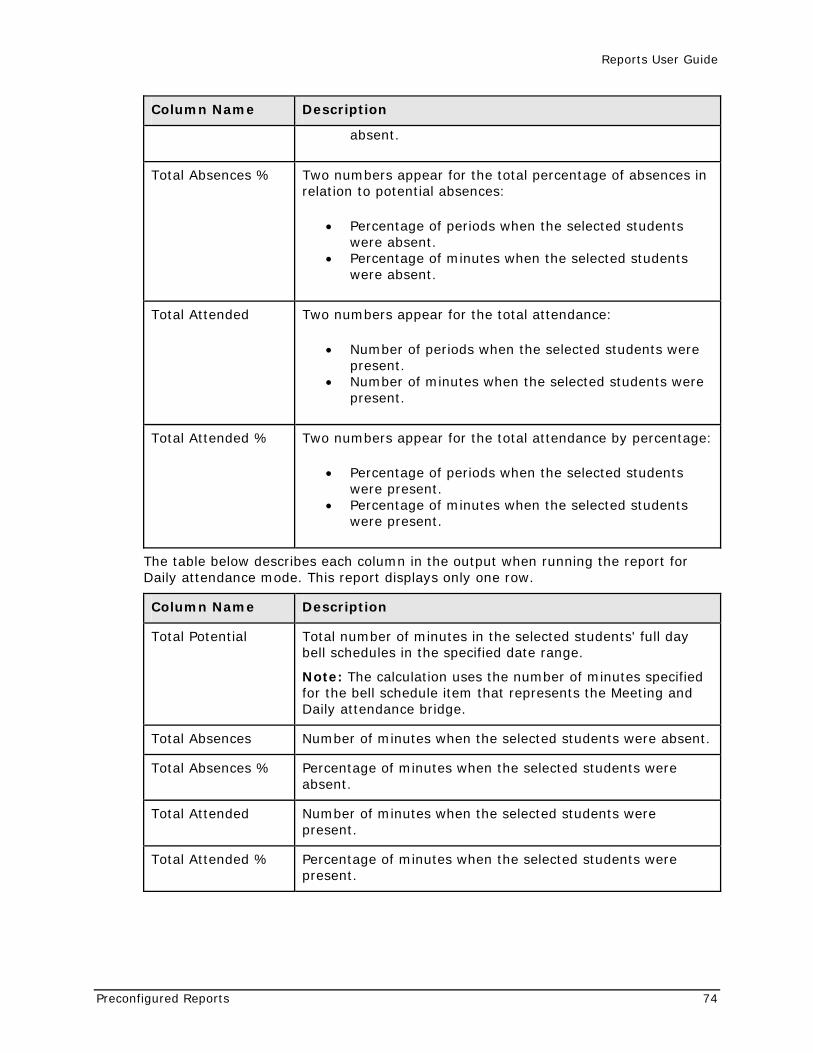
Reports User Guide
Preconfigured Reports 74
Column Name Description
absent.
Total Absences % Two numbers appear for the total percentage of absences in relation to potential absences:
• Percentage of periods when the selected students were absent.
• Percentage of minutes when the selected students were absent.
Total Attended Two numbers appear for the total attendance:
• Number of periods when the selected students were present.
• Number of minutes when the selected students were present.
Total Attended % Two numbers appear for the total attendance by percentage:
• Percentage of periods when the selected students were present.
• Percentage of minutes when the selected students were present.
The table below describes each column in the output when running the report for Daily attendance mode. This report displays only one row.
Column Name Description
Total Potential Total number of minutes in the selected students' full day bell schedules in the specified date range.
Note: The calculation uses the number of minutes specified for the bell schedule item that represents the Meeting and Daily attendance bridge.
Total Absences Number of minutes when the selected students were absent.
Total Absences % Percentage of minutes when the selected students were absent.
Total Attended Number of minutes when the selected students were present.
Total Attended % Percentage of minutes when the selected students were present.
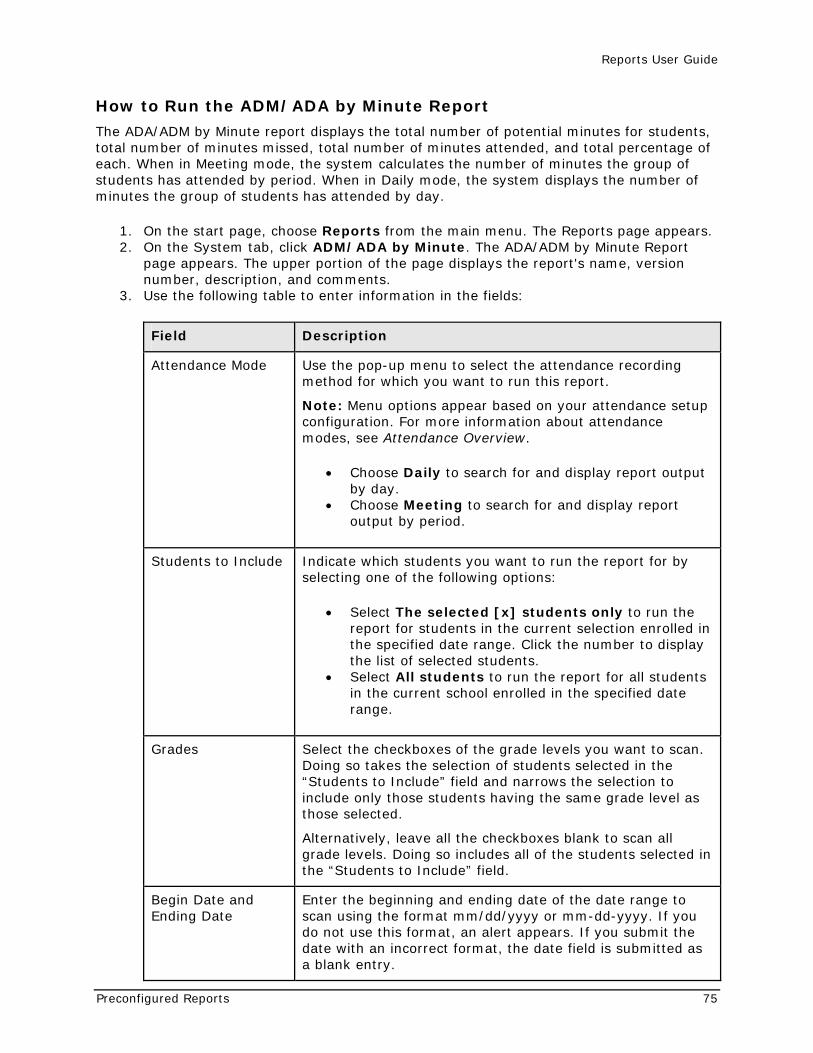
Reports User Guide
Preconfigured Reports 75
How to Run the ADM/ADA by Minute Report
The ADA/ADM by Minute report displays the total number of potential minutes for students, total number of minutes missed, total number of minutes attended, and total percentage of each. When in Meeting mode, the system calculates the number of minutes the group of students has attended by period. When in Daily mode, the system displays the number of minutes the group of students has attended by day.
1. On the start page, choose Reports from the main menu. The Reports page appears. 2. On the System tab, click ADM/ADA by Minute. The ADA/ADM by Minute Report
page appears. The upper portion of the page displays the report's name, version number, description, and comments.
3. Use the following table to enter information in the fields:
Field Description
Attendance Mode Use the pop-up menu to select the attendance recording method for which you want to run this report.
Note: Menu options appear based on your attendance setup configuration. For more information about attendance modes, see Attendance Overview.
• Choose Daily to search for and display report output by day.
• Choose Meeting to search for and display report output by period.
Students to Include Indicate which students you want to run the report for by selecting one of the following options:
• Select The selected [x] students only to run the report for students in the current selection enrolled in the specified date range. Click the number to display the list of selected students.
• Select All students to run the report for all students in the current school enrolled in the specified date range.
Grades Select the checkboxes of the grade levels you want to scan. Doing so takes the selection of students selected in the “Students to Include” field and narrows the selection to include only those students having the same grade level as those selected.
Alternatively, leave all the checkboxes blank to scan all grade levels. Doing so includes all of the students selected in the “Students to Include” field.
Begin Date and Ending Date
Enter the beginning and ending date of the date range to scan using the format mm/dd/yyyy or mm-dd-yyyy. If you do not use this format, an alert appears. If you submit the date with an incorrect format, the date field is submitted as a blank entry.
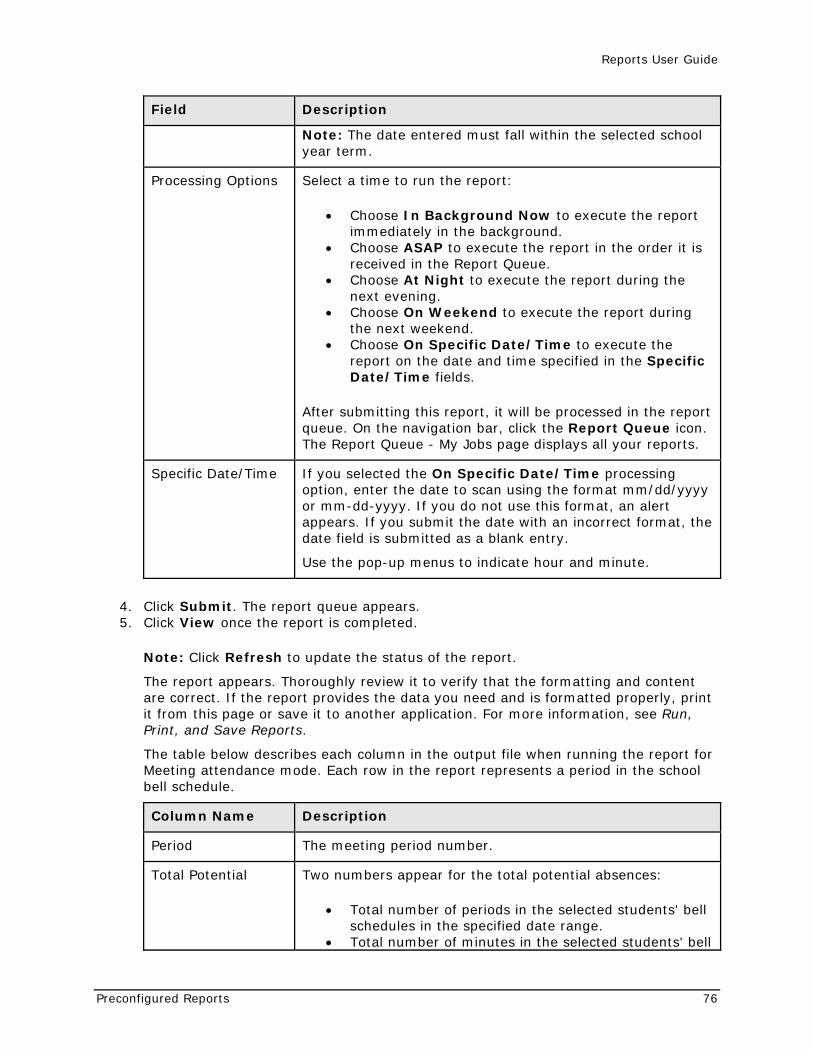
Reports User Guide
Preconfigured Reports 76
Field Description
Note: The date entered must fall within the selected school year term.
Processing Options Select a time to run the report:
• Choose In Background Now to execute the report immediately in the background.
• Choose ASAP to execute the report in the order it is received in the Report Queue.
• Choose At Night to execute the report during the next evening.
• Choose On Weekend to execute the report during the next weekend.
• Choose On Specific Date/Time to execute the report on the date and time specified in the Specific Date/Time fields.
After submitting this report, it will be processed in the report queue. On the navigation bar, click the Report Queue icon. The Report Queue - My Jobs page displays all your reports.
Specific Date/Time If you selected the On Specific Date/Time processing option, enter the date to scan using the format mm/dd/yyyy or mm-dd-yyyy. If you do not use this format, an alert appears. If you submit the date with an incorrect format, the date field is submitted as a blank entry.
Use the pop-up menus to indicate hour and minute.
4. Click Submit. The report queue appears. 5. Click View once the report is completed.
Note: Click Refresh to update the status of the report.
The report appears. Thoroughly review it to verify that the formatting and content are correct. If the report provides the data you need and is formatted properly, print it from this page or save it to another application. For more information, see Run, Print, and Save Reports.
The table below describes each column in the output file when running the report for Meeting attendance mode. Each row in the report represents a period in the school bell schedule.
Column Name Description
Period The meeting period number.
Total Potential Two numbers appear for the total potential absences:
• Total number of periods in the selected students' bell schedules in the specified date range.
• Total number of minutes in the selected students' bell
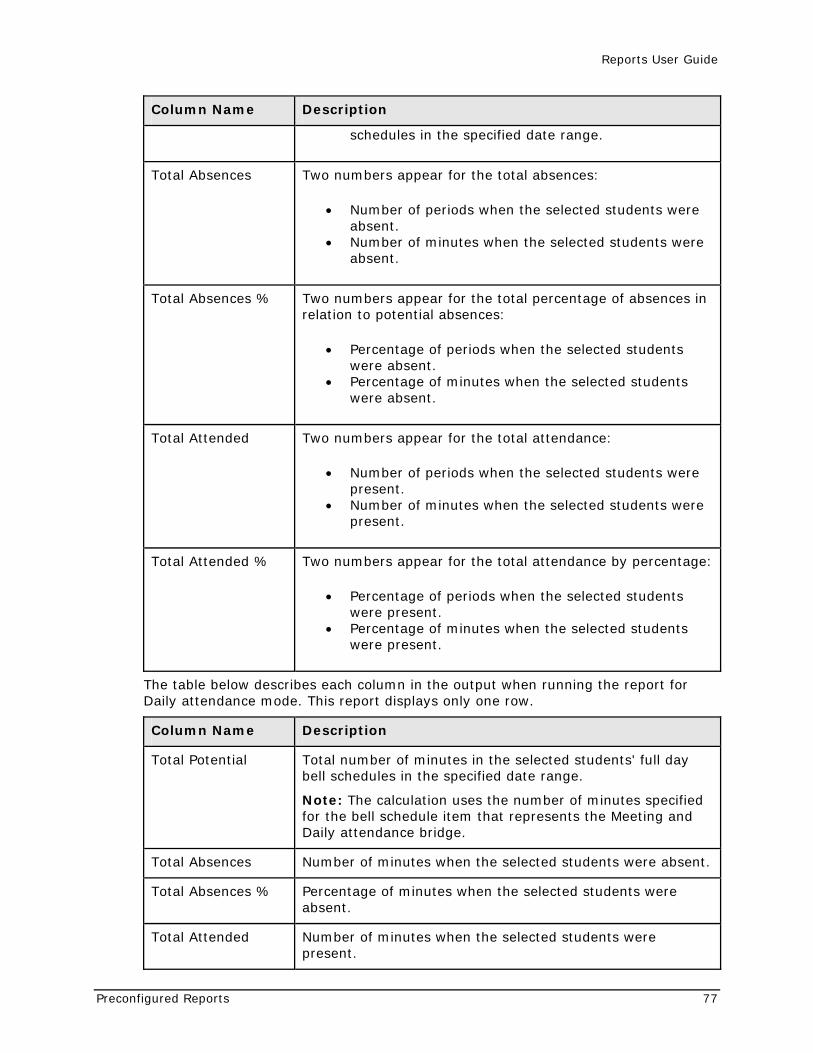
Reports User Guide
Preconfigured Reports 77
Column Name Description
schedules in the specified date range.
Total Absences Two numbers appear for the total absences:
• Number of periods when the selected students were absent.
• Number of minutes when the selected students were absent.
Total Absences % Two numbers appear for the total percentage of absences in relation to potential absences:
• Percentage of periods when the selected students were absent.
• Percentage of minutes when the selected students were absent.
Total Attended Two numbers appear for the total attendance:
• Number of periods when the selected students were present.
• Number of minutes when the selected students were present.
Total Attended % Two numbers appear for the total attendance by percentage:
• Percentage of periods when the selected students were present.
• Percentage of minutes when the selected students were present.
The table below describes each column in the output when running the report for Daily attendance mode. This report displays only one row.
Column Name Description
Total Potential Total number of minutes in the selected students' full day bell schedules in the specified date range.
Note: The calculation uses the number of minutes specified for the bell schedule item that represents the Meeting and Daily attendance bridge.
Total Absences Number of minutes when the selected students were absent.
Total Absences % Percentage of minutes when the selected students were absent.
Total Attended Number of minutes when the selected students were present.
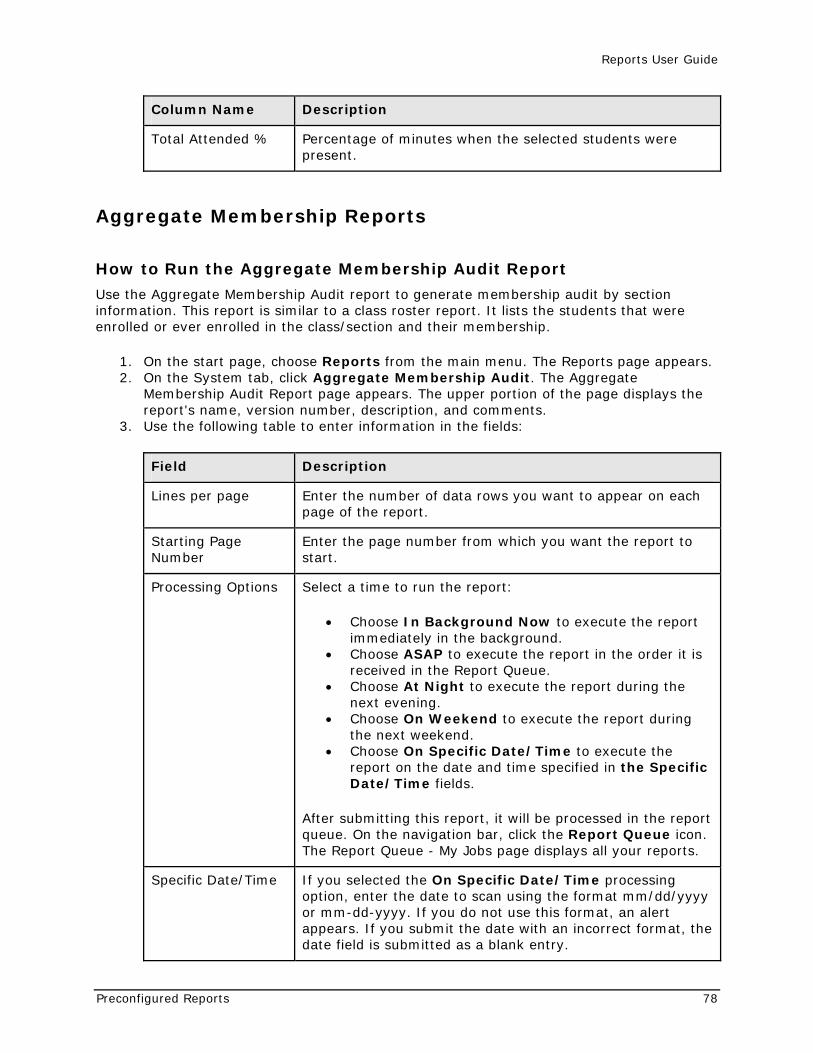
Reports User Guide
Preconfigured Reports 78
Column Name Description
Total Attended % Percentage of minutes when the selected students were present.
Aggregate Membership Reports
How to Run the Aggregate Membership Audit Report
Use the Aggregate Membership Audit report to generate membership audit by section information. This report is similar to a class roster report. It lists the students that were enrolled or ever enrolled in the class/section and their membership.
1. On the start page, choose Reports from the main menu. The Reports page appears. 2. On the System tab, click Aggregate Membership Audit. The Aggregate
Membership Audit Report page appears. The upper portion of the page displays the report's name, version number, description, and comments.
3. Use the following table to enter information in the fields:
Field Description
Lines per page Enter the number of data rows you want to appear on each page of the report.
Starting Page Number
Enter the page number from which you want the report to start.
Processing Options Select a time to run the report:
• Choose In Background Now to execute the report immediately in the background.
• Choose ASAP to execute the report in the order it is received in the Report Queue.
• Choose At Night to execute the report during the next evening.
• Choose On Weekend to execute the report during the next weekend.
• Choose On Specific Date/Time to execute the report on the date and time specified in the Specific Date/Time fields.
After submitting this report, it will be processed in the report queue. On the navigation bar, click the Report Queue icon. The Report Queue - My Jobs page displays all your reports.
Specific Date/Time If you selected the On Specific Date/Time processing option, enter the date to scan using the format mm/dd/yyyy or mm-dd-yyyy. If you do not use this format, an alert appears. If you submit the date with an incorrect format, the date field is submitted as a blank entry.
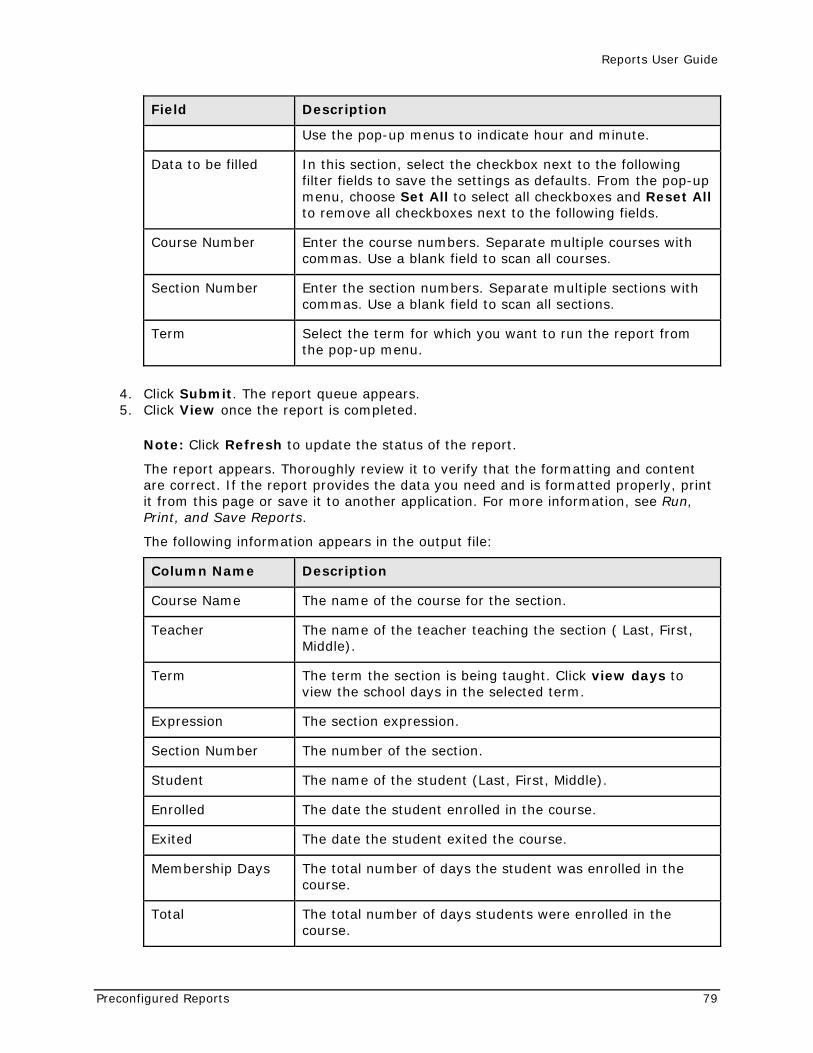
Reports User Guide
Preconfigured Reports 79
Field Description
Use the pop-up menus to indicate hour and minute.
Data to be filled In this section, select the checkbox next to the following filter fields to save the settings as defaults. From the pop-up menu, choose Set All to select all checkboxes and Reset All to remove all checkboxes next to the following fields.
Course Number Enter the course numbers. Separate multiple courses with commas. Use a blank field to scan all courses.
Section Number Enter the section numbers. Separate multiple sections with commas. Use a blank field to scan all sections.
Term Select the term for which you want to run the report from the pop-up menu.
4. Click Submit. The report queue appears. 5. Click View once the report is completed.
Note: Click Refresh to update the status of the report.
The report appears. Thoroughly review it to verify that the formatting and content are correct. If the report provides the data you need and is formatted properly, print it from this page or save it to another application. For more information, see Run, Print, and Save Reports.
The following information appears in the output file:
Column Name Description
Course Name The name of the course for the section.
Teacher The name of the teacher teaching the section ( Last, First, Middle).
Term The term the section is being taught. Click view days to view the school days in the selected term.
Expression The section expression.
Section Number The number of the section.
Student The name of the student (Last, First, Middle).
Enrolled The date the student enrolled in the course.
Exited The date the student exited the course.
Membership Days The total number of days the student was enrolled in the course.
Total The total number of days students were enrolled in the course.
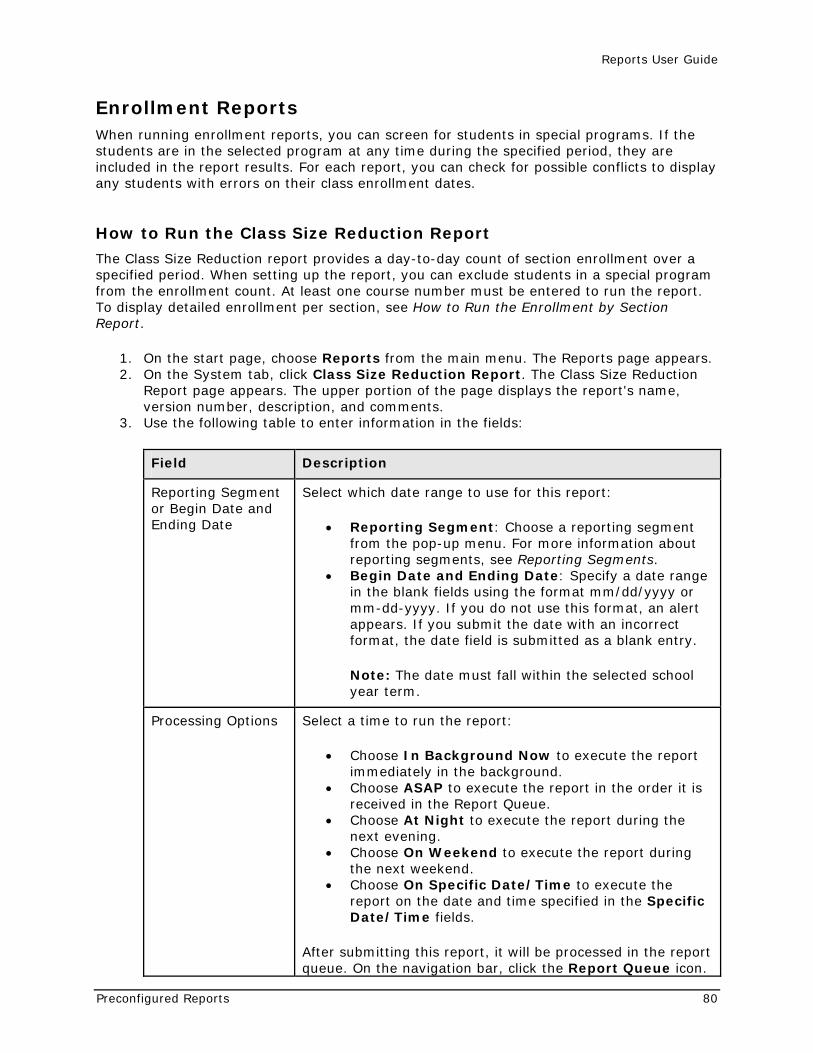
Reports User Guide
Preconfigured Reports 80
Enrollment Reports When running enrollment reports, you can screen for students in special programs. If the students are in the selected program at any time during the specified period, they are included in the report results. For each report, you can check for possible conflicts to display any students with errors on their class enrollment dates.
How to Run the Class Size Reduction Report
The Class Size Reduction report provides a day-to-day count of section enrollment over a specified period. When setting up the report, you can exclude students in a special program from the enrollment count. At least one course number must be entered to run the report. To display detailed enrollment per section, see How to Run the Enrollment by Section Report.
1. On the start page, choose Reports from the main menu. The Reports page appears. 2. On the System tab, click Class Size Reduction Report. The Class Size Reduction
Report page appears. The upper portion of the page displays the report's name, version number, description, and comments.
3. Use the following table to enter information in the fields:
Field Description
Reporting Segment or Begin Date and Ending Date
Select which date range to use for this report:
• Reporting Segment: Choose a reporting segment from the pop-up menu. For more information about reporting segments, see Reporting Segments.
• Begin Date and Ending Date: Specify a date range in the blank fields using the format mm/dd/yyyy or mm-dd-yyyy. If you do not use this format, an alert appears. If you submit the date with an incorrect format, the date field is submitted as a blank entry.
Note: The date must fall within the selected school year term.
Processing Options Select a time to run the report:
• Choose In Background Now to execute the report immediately in the background.
• Choose ASAP to execute the report in the order it is received in the Report Queue.
• Choose At Night to execute the report during the next evening.
• Choose On Weekend to execute the report during the next weekend.
• Choose On Specific Date/Time to execute the report on the date and time specified in the Specific Date/Time fields.
After submitting this report, it will be processed in the report queue. On the navigation bar, click the Report Queue icon.
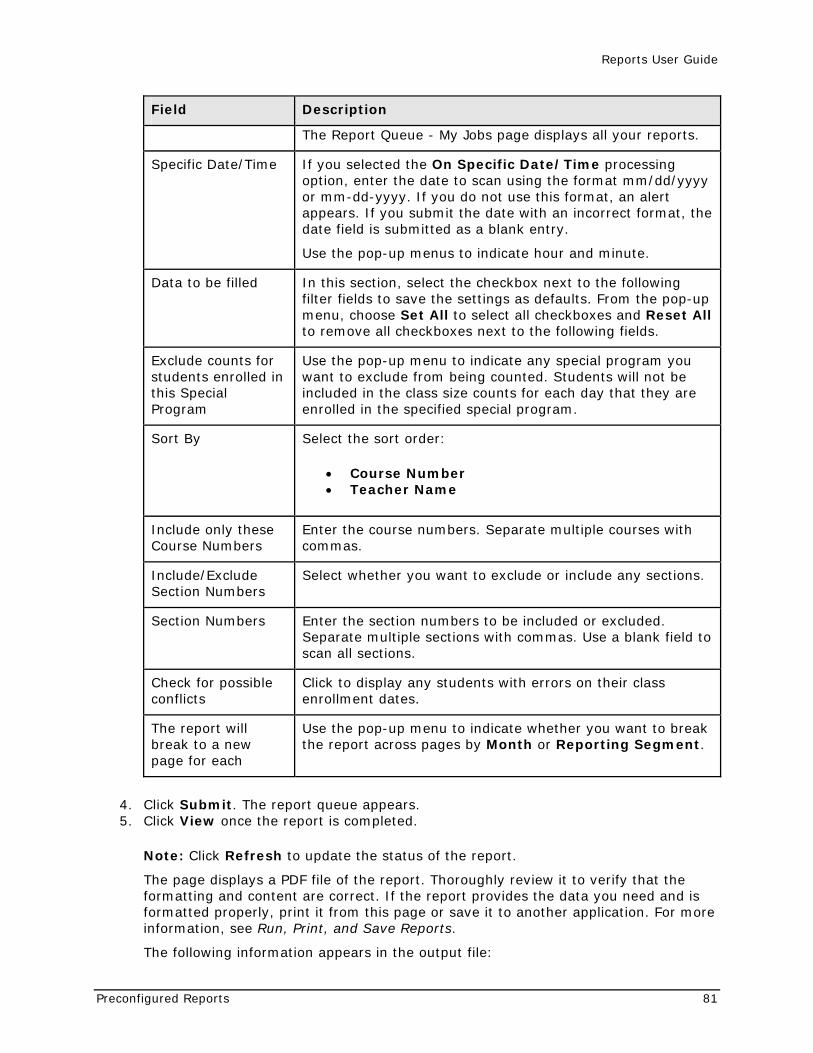
Reports User Guide
Preconfigured Reports 81
Field Description
The Report Queue - My Jobs page displays all your reports.
Specific Date/Time If you selected the On Specific Date/Time processing option, enter the date to scan using the format mm/dd/yyyy or mm-dd-yyyy. If you do not use this format, an alert appears. If you submit the date with an incorrect format, the date field is submitted as a blank entry.
Use the pop-up menus to indicate hour and minute.
Data to be filled In this section, select the checkbox next to the following filter fields to save the settings as defaults. From the pop-up menu, choose Set All to select all checkboxes and Reset All to remove all checkboxes next to the following fields.
Exclude counts for students enrolled in this Special Program
Use the pop-up menu to indicate any special program you want to exclude from being counted. Students will not be included in the class size counts for each day that they are enrolled in the specified special program.
Sort By Select the sort order:
• Course Number • Teacher Name
Include only these Course Numbers
Enter the course numbers. Separate multiple courses with commas.
Include/Exclude Section Numbers
Select whether you want to exclude or include any sections.
Section Numbers Enter the section numbers to be included or excluded. Separate multiple sections with commas. Use a blank field to scan all sections.
Check for possible conflicts
Click to display any students with errors on their class enrollment dates.
The report will break to a new page for each
Use the pop-up menu to indicate whether you want to break the report across pages by Month or Reporting Segment.
4. Click Submit. The report queue appears. 5. Click View once the report is completed.
Note: Click Refresh to update the status of the report.
The page displays a PDF file of the report. Thoroughly review it to verify that the formatting and content are correct. If the report provides the data you need and is formatted properly, print it from this page or save it to another application. For more information, see Run, Print, and Save Reports.
The following information appears in the output file:
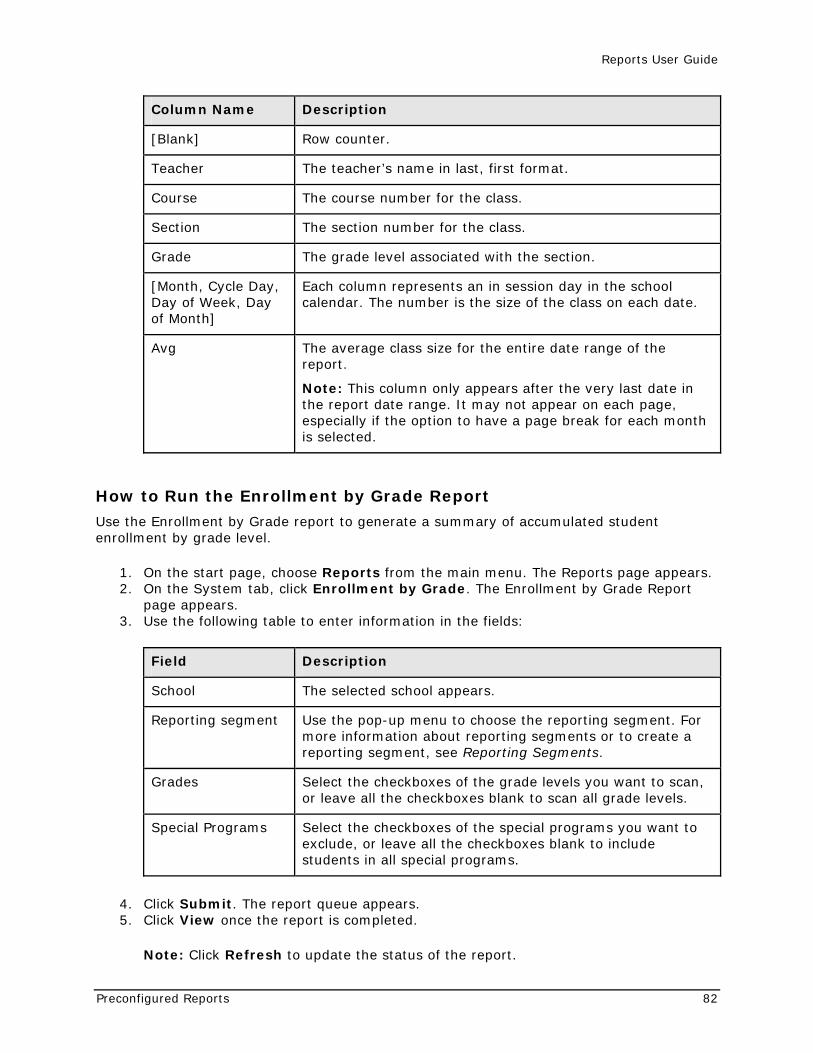
Reports User Guide
Preconfigured Reports 82
Column Name Description
[Blank] Row counter.
Teacher The teacher’s name in last, first format.
Course The course number for the class.
Section The section number for the class.
Grade The grade level associated with the section.
[Month, Cycle Day, Day of Week, Day of Month]
Each column represents an in session day in the school calendar. The number is the size of the class on each date.
Avg The average class size for the entire date range of the report.
Note: This column only appears after the very last date in the report date range. It may not appear on each page, especially if the option to have a page break for each month is selected.
How to Run the Enrollment by Grade Report
Use the Enrollment by Grade report to generate a summary of accumulated student enrollment by grade level.
1. On the start page, choose Reports from the main menu. The Reports page appears. 2. On the System tab, click Enrollment by Grade. The Enrollment by Grade Report
page appears. 3. Use the following table to enter information in the fields:
Field Description
School The selected school appears.
Reporting segment Use the pop-up menu to choose the reporting segment. For more information about reporting segments or to create a reporting segment, see Reporting Segments.
Grades Select the checkboxes of the grade levels you want to scan, or leave all the checkboxes blank to scan all grade levels.
Special Programs Select the checkboxes of the special programs you want to exclude, or leave all the checkboxes blank to include students in all special programs.
4. Click Submit. The report queue appears. 5. Click View once the report is completed.
Note: Click Refresh to update the status of the report.
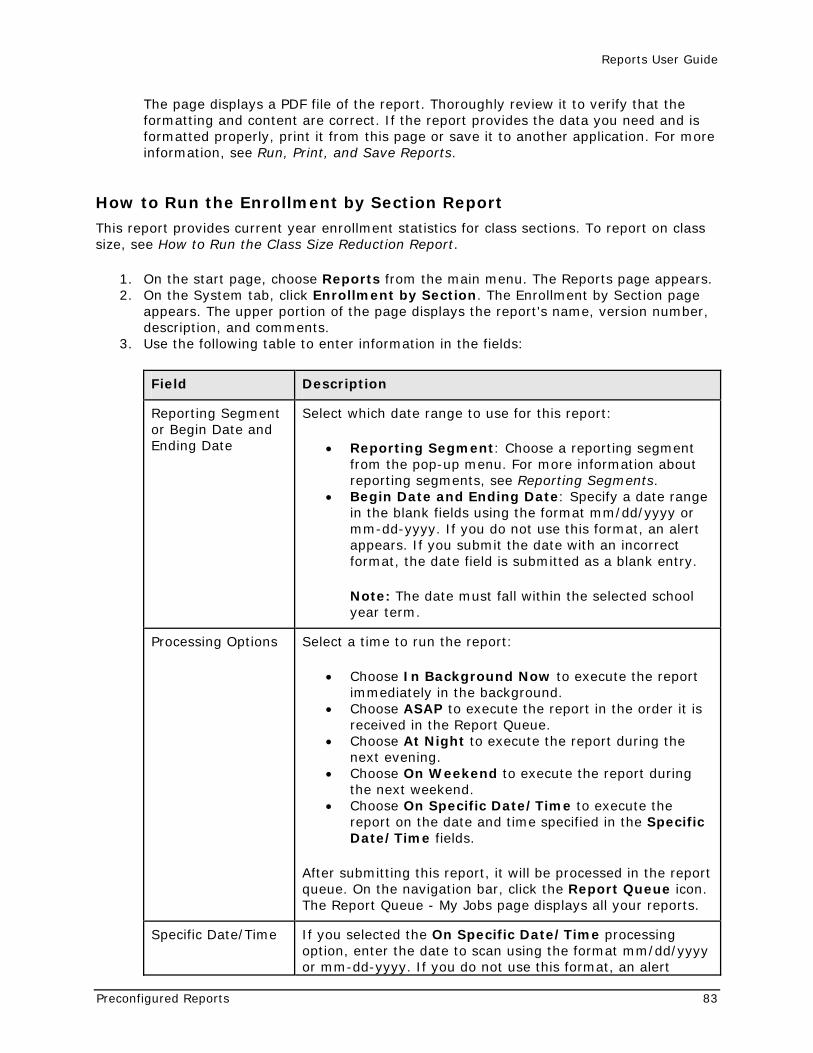
Reports User Guide
Preconfigured Reports 83
The page displays a PDF file of the report. Thoroughly review it to verify that the formatting and content are correct. If the report provides the data you need and is formatted properly, print it from this page or save it to another application. For more information, see Run, Print, and Save Reports.
How to Run the Enrollment by Section Report
This report provides current year enrollment statistics for class sections. To report on class size, see How to Run the Class Size Reduction Report.
1. On the start page, choose Reports from the main menu. The Reports page appears. 2. On the System tab, click Enrollment by Section. The Enrollment by Section page
appears. The upper portion of the page displays the report's name, version number, description, and comments.
3. Use the following table to enter information in the fields:
Field Description
Reporting Segment or Begin Date and Ending Date
Select which date range to use for this report:
• Reporting Segment: Choose a reporting segment from the pop-up menu. For more information about reporting segments, see Reporting Segments.
• Begin Date and Ending Date: Specify a date range in the blank fields using the format mm/dd/yyyy or mm-dd-yyyy. If you do not use this format, an alert appears. If you submit the date with an incorrect format, the date field is submitted as a blank entry.
Note: The date must fall within the selected school year term.
Processing Options Select a time to run the report:
• Choose In Background Now to execute the report immediately in the background.
• Choose ASAP to execute the report in the order it is received in the Report Queue.
• Choose At Night to execute the report during the next evening.
• Choose On Weekend to execute the report during the next weekend.
• Choose On Specific Date/Time to execute the report on the date and time specified in the Specific Date/Time fields.
After submitting this report, it will be processed in the report queue. On the navigation bar, click the Report Queue icon. The Report Queue - My Jobs page displays all your reports.
Specific Date/Time If you selected the On Specific Date/Time processing option, enter the date to scan using the format mm/dd/yyyy or mm-dd-yyyy. If you do not use this format, an alert
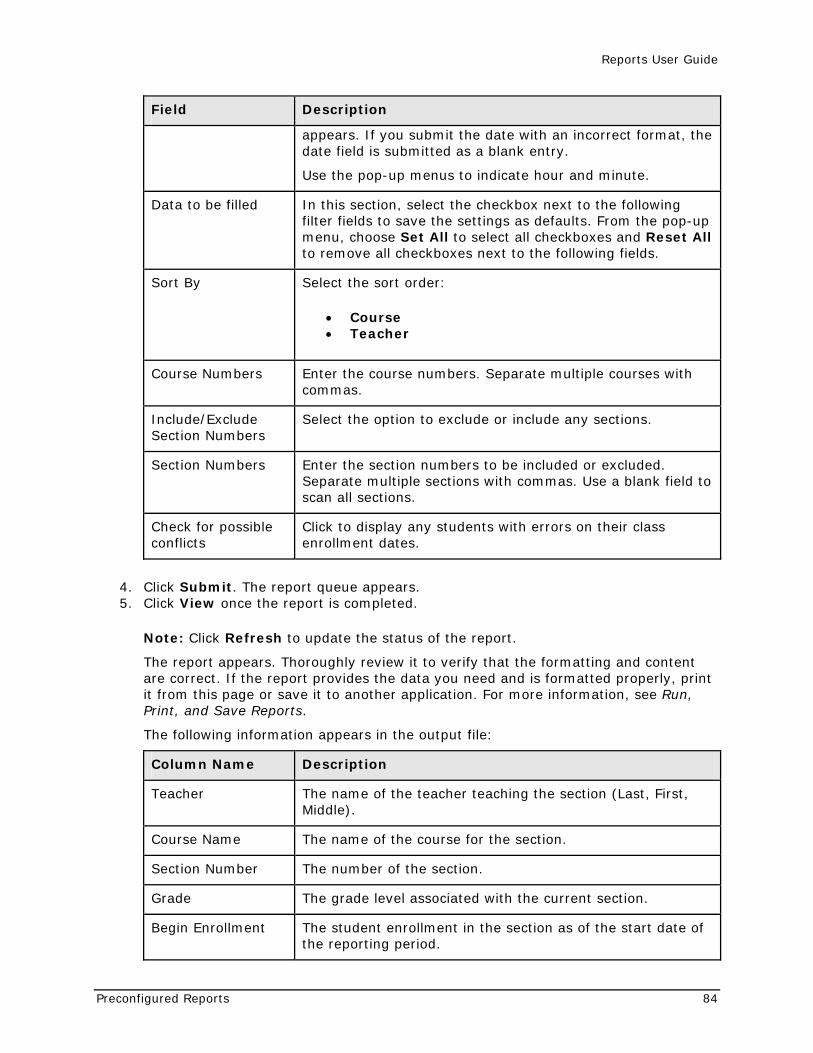
Reports User Guide
Preconfigured Reports 84
Field Description
appears. If you submit the date with an incorrect format, the date field is submitted as a blank entry.
Use the pop-up menus to indicate hour and minute.
Data to be filled In this section, select the checkbox next to the following filter fields to save the settings as defaults. From the pop-up menu, choose Set All to select all checkboxes and Reset All to remove all checkboxes next to the following fields.
Sort By Select the sort order:
• Course • Teacher
Course Numbers Enter the course numbers. Separate multiple courses with commas.
Include/Exclude Section Numbers
Select the option to exclude or include any sections.
Section Numbers Enter the section numbers to be included or excluded. Separate multiple sections with commas. Use a blank field to scan all sections.
Check for possible conflicts
Click to display any students with errors on their class enrollment dates.
4. Click Submit. The report queue appears. 5. Click View once the report is completed.
Note: Click Refresh to update the status of the report.
The report appears. Thoroughly review it to verify that the formatting and content are correct. If the report provides the data you need and is formatted properly, print it from this page or save it to another application. For more information, see Run, Print, and Save Reports.
The following information appears in the output file:
Column Name Description
Teacher The name of the teacher teaching the section (Last, First, Middle).
Course Name The name of the course for the section.
Section Number The number of the section.
Grade The grade level associated with the current section.
Begin Enrollment The student enrollment in the section as of the start date of the reporting period.
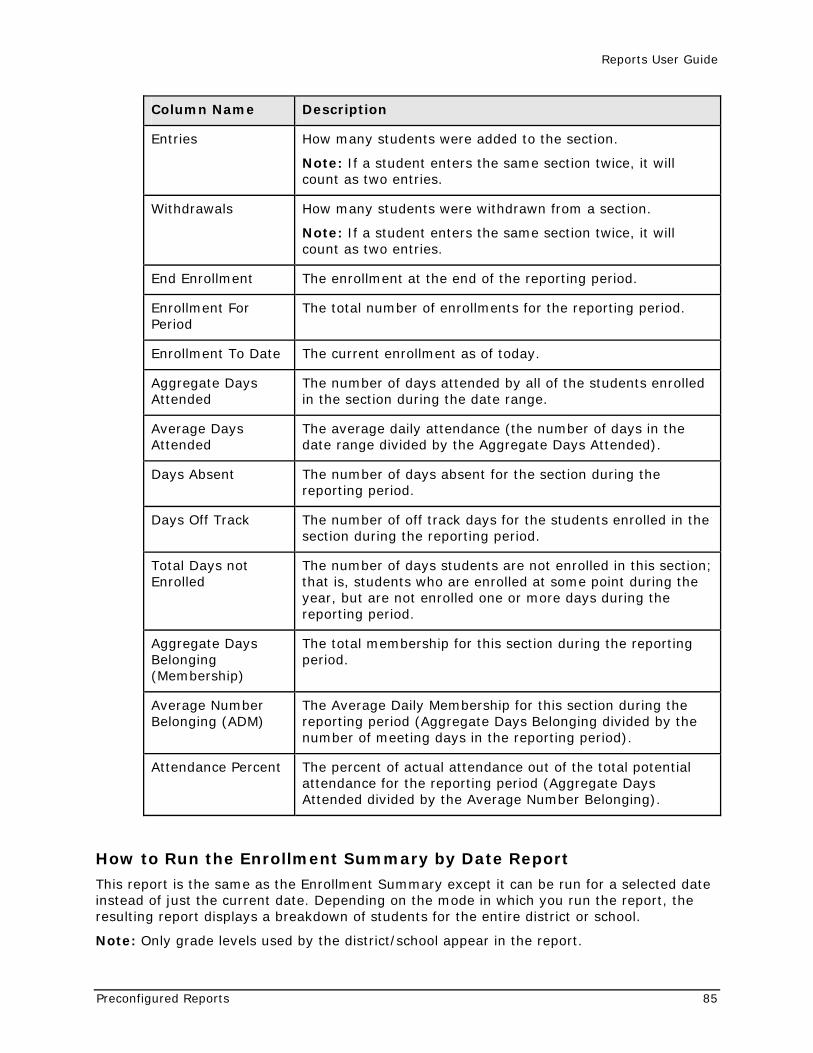
Reports User Guide
Preconfigured Reports 85
Column Name Description
Entries How many students were added to the section.
Note: If a student enters the same section twice, it will count as two entries.
Withdrawals How many students were withdrawn from a section.
Note: If a student enters the same section twice, it will count as two entries.
End Enrollment The enrollment at the end of the reporting period.
Enrollment For Period
The total number of enrollments for the reporting period.
Enrollment To Date The current enrollment as of today.
Aggregate Days Attended
The number of days attended by all of the students enrolled in the section during the date range.
Average Days Attended
The average daily attendance (the number of days in the date range divided by the Aggregate Days Attended).
Days Absent The number of days absent for the section during the reporting period.
Days Off Track The number of off track days for the students enrolled in the section during the reporting period.
Total Days not Enrolled
The number of days students are not enrolled in this section; that is, students who are enrolled at some point during the year, but are not enrolled one or more days during the reporting period.
Aggregate Days Belonging (Membership)
The total membership for this section during the reporting period.
Average Number Belonging (ADM)
The Average Daily Membership for this section during the reporting period (Aggregate Days Belonging divided by the number of meeting days in the reporting period).
Attendance Percent The percent of actual attendance out of the total potential attendance for the reporting period (Aggregate Days Attended divided by the Average Number Belonging).
How to Run the Enrollment Summary by Date Report
This report is the same as the Enrollment Summary except it can be run for a selected date instead of just the current date. Depending on the mode in which you run the report, the resulting report displays a breakdown of students for the entire district or school.
Note: Only grade levels used by the district/school appear in the report.
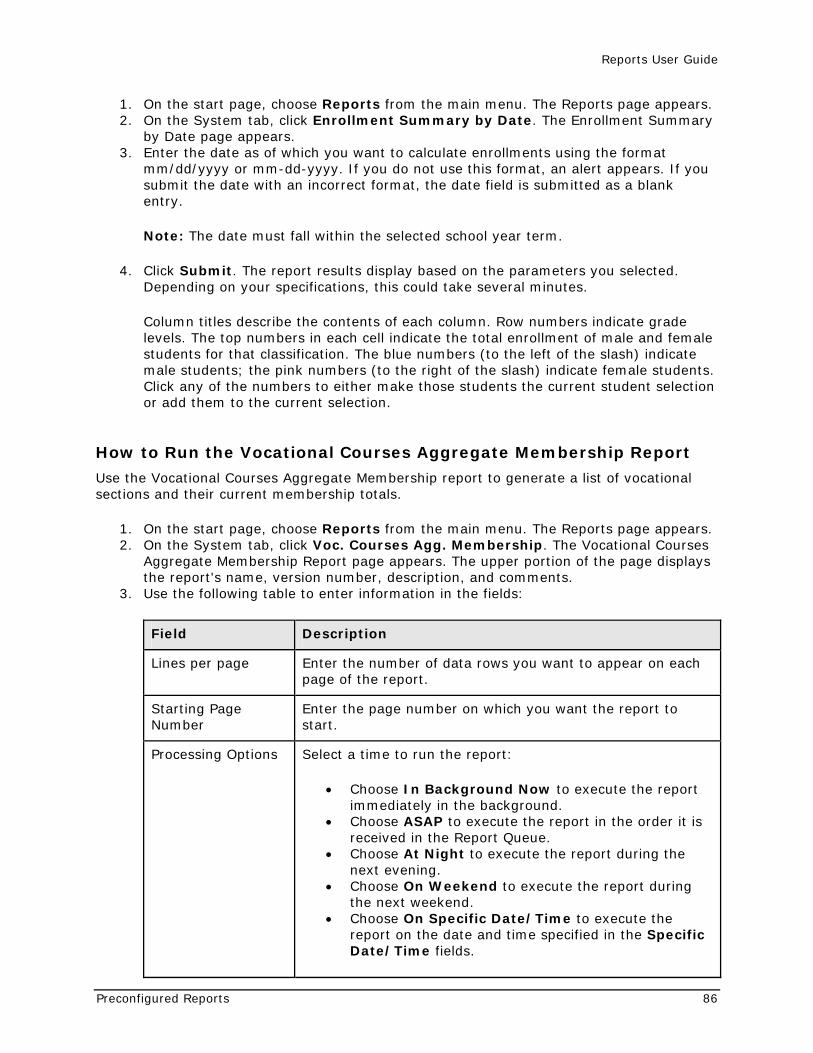
Reports User Guide
Preconfigured Reports 86
1. On the start page, choose Reports from the main menu. The Reports page appears. 2. On the System tab, click Enrollment Summary by Date. The Enrollment Summary
by Date page appears. 3. Enter the date as of which you want to calculate enrollments using the format
mm/dd/yyyy or mm-dd-yyyy. If you do not use this format, an alert appears. If you submit the date with an incorrect format, the date field is submitted as a blank entry.
Note: The date must fall within the selected school year term.
4. Click Submit. The report results display based on the parameters you selected. Depending on your specifications, this could take several minutes.
Column titles describe the contents of each column. Row numbers indicate grade levels. The top numbers in each cell indicate the total enrollment of male and female students for that classification. The blue numbers (to the left of the slash) indicate male students; the pink numbers (to the right of the slash) indicate female students. Click any of the numbers to either make those students the current student selection or add them to the current selection.
How to Run the Vocational Courses Aggregate Membership Report
Use the Vocational Courses Aggregate Membership report to generate a list of vocational sections and their current membership totals.
1. On the start page, choose Reports from the main menu. The Reports page appears. 2. On the System tab, click Voc. Courses Agg. Membership. The Vocational Courses
Aggregate Membership Report page appears. The upper portion of the page displays the report's name, version number, description, and comments.
3. Use the following table to enter information in the fields:
Field Description
Lines per page Enter the number of data rows you want to appear on each page of the report.
Starting Page Number
Enter the page number on which you want the report to start.
Processing Options Select a time to run the report:
• Choose In Background Now to execute the report immediately in the background.
• Choose ASAP to execute the report in the order it is received in the Report Queue.
• Choose At Night to execute the report during the next evening.
• Choose On Weekend to execute the report during the next weekend.
• Choose On Specific Date/Time to execute the report on the date and time specified in the Specific Date/Time fields.
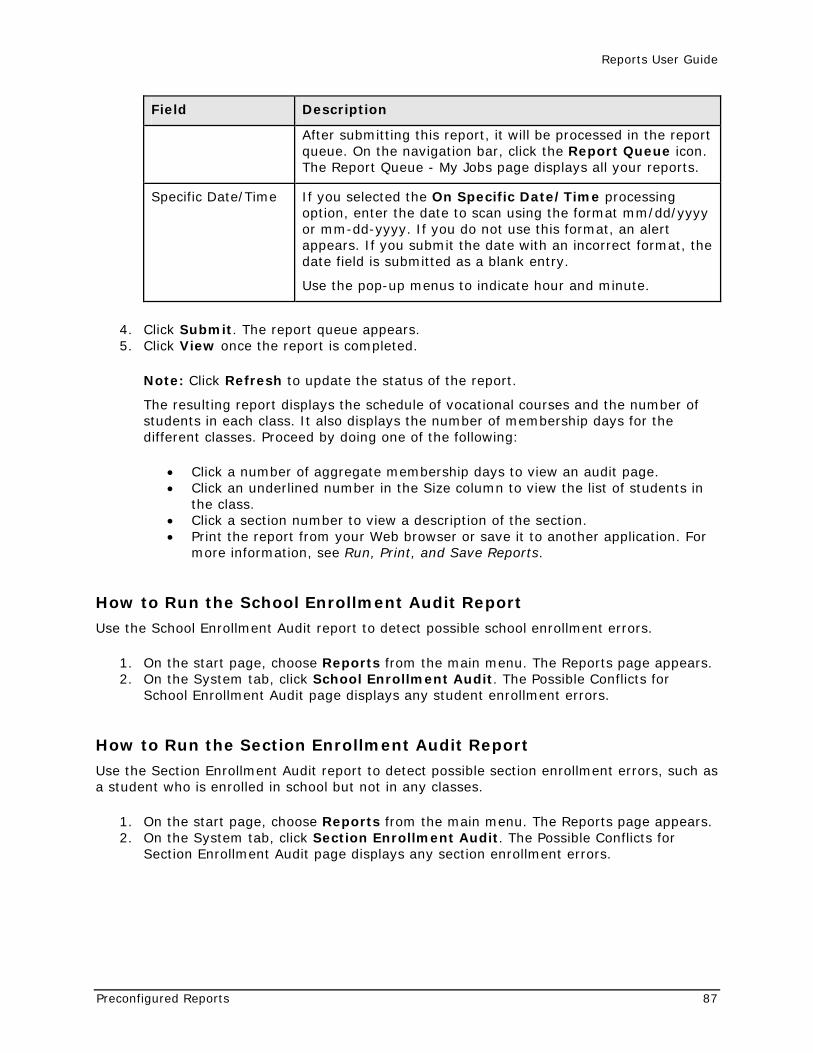
Reports User Guide
Preconfigured Reports 87
Field Description
After submitting this report, it will be processed in the report queue. On the navigation bar, click the Report Queue icon. The Report Queue - My Jobs page displays all your reports.
Specific Date/Time If you selected the On Specific Date/Time processing option, enter the date to scan using the format mm/dd/yyyy or mm-dd-yyyy. If you do not use this format, an alert appears. If you submit the date with an incorrect format, the date field is submitted as a blank entry.
Use the pop-up menus to indicate hour and minute.
4. Click Submit. The report queue appears. 5. Click View once the report is completed.
Note: Click Refresh to update the status of the report.
The resulting report displays the schedule of vocational courses and the number of students in each class. It also displays the number of membership days for the different classes. Proceed by doing one of the following:
• Click a number of aggregate membership days to view an audit page. • Click an underlined number in the Size column to view the list of students in
the class. • Click a section number to view a description of the section. • Print the report from your Web browser or save it to another application. For
more information, see Run, Print, and Save Reports.
How to Run the School Enrollment Audit Report
Use the School Enrollment Audit report to detect possible school enrollment errors.
1. On the start page, choose Reports from the main menu. The Reports page appears. 2. On the System tab, click School Enrollment Audit. The Possible Conflicts for
School Enrollment Audit page displays any student enrollment errors.
How to Run the Section Enrollment Audit Report
Use the Section Enrollment Audit report to detect possible section enrollment errors, such as a student who is enrolled in school but not in any classes.
1. On the start page, choose Reports from the main menu. The Reports page appears. 2. On the System tab, click Section Enrollment Audit. The Possible Conflicts for
Section Enrollment Audit page displays any section enrollment errors.
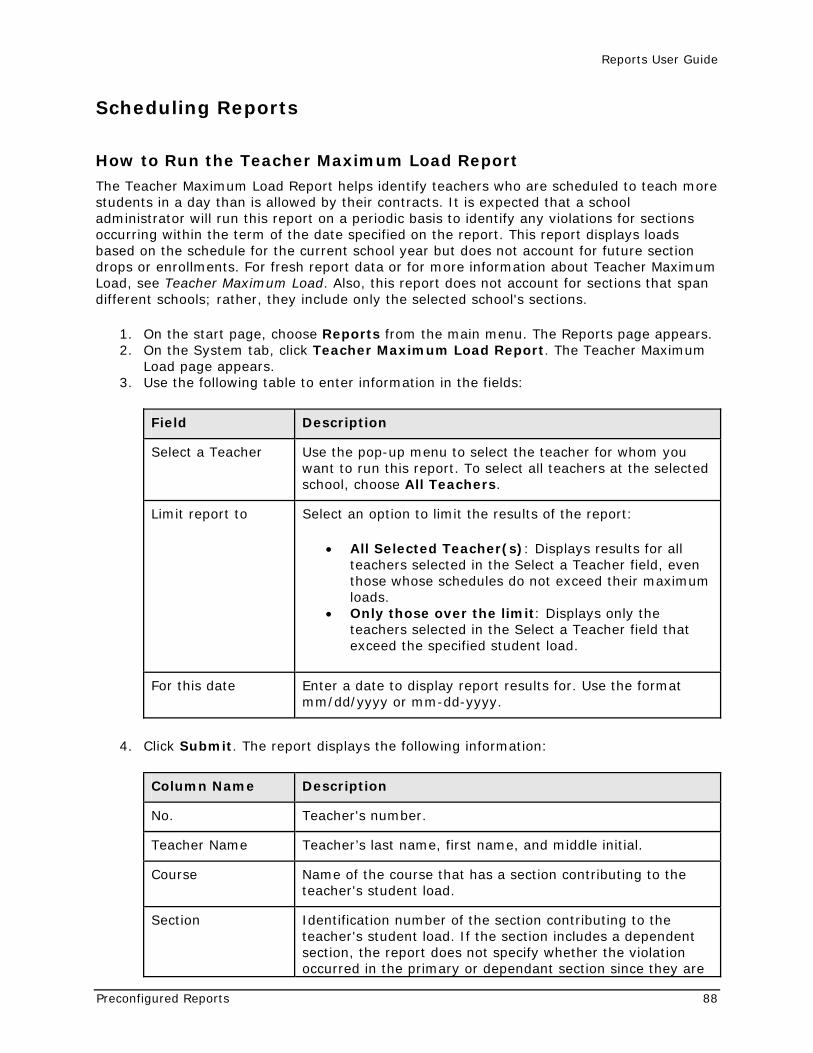
Reports User Guide
Preconfigured Reports 88
Scheduling Reports
How to Run the Teacher Maximum Load Report
The Teacher Maximum Load Report helps identify teachers who are scheduled to teach more students in a day than is allowed by their contracts. It is expected that a school administrator will run this report on a periodic basis to identify any violations for sections occurring within the term of the date specified on the report. This report displays loads based on the schedule for the current school year but does not account for future section drops or enrollments. For fresh report data or for more information about Teacher Maximum Load, see Teacher Maximum Load. Also, this report does not account for sections that span different schools; rather, they include only the selected school's sections.
1. On the start page, choose Reports from the main menu. The Reports page appears. 2. On the System tab, click Teacher Maximum Load Report. The Teacher Maximum
Load page appears. 3. Use the following table to enter information in the fields:
Field Description
Select a Teacher Use the pop-up menu to select the teacher for whom you want to run this report. To select all teachers at the selected school, choose All Teachers.
Limit report to Select an option to limit the results of the report:
• All Selected Teacher(s): Displays results for all teachers selected in the Select a Teacher field, even those whose schedules do not exceed their maximum loads.
• Only those over the limit: Displays only the teachers selected in the Select a Teacher field that exceed the specified student load.
For this date Enter a date to display report results for. Use the format mm/dd/yyyy or mm-dd-yyyy.
4. Click Submit. The report displays the following information:
Column Name Description
No. Teacher's number.
Teacher Name Teacher’s last name, first name, and middle initial.
Course Name of the course that has a section contributing to the teacher's student load.
Section Identification number of the section contributing to the teacher's student load. If the section includes a dependent section, the report does not specify whether the violation occurred in the primary or dependant section since they are
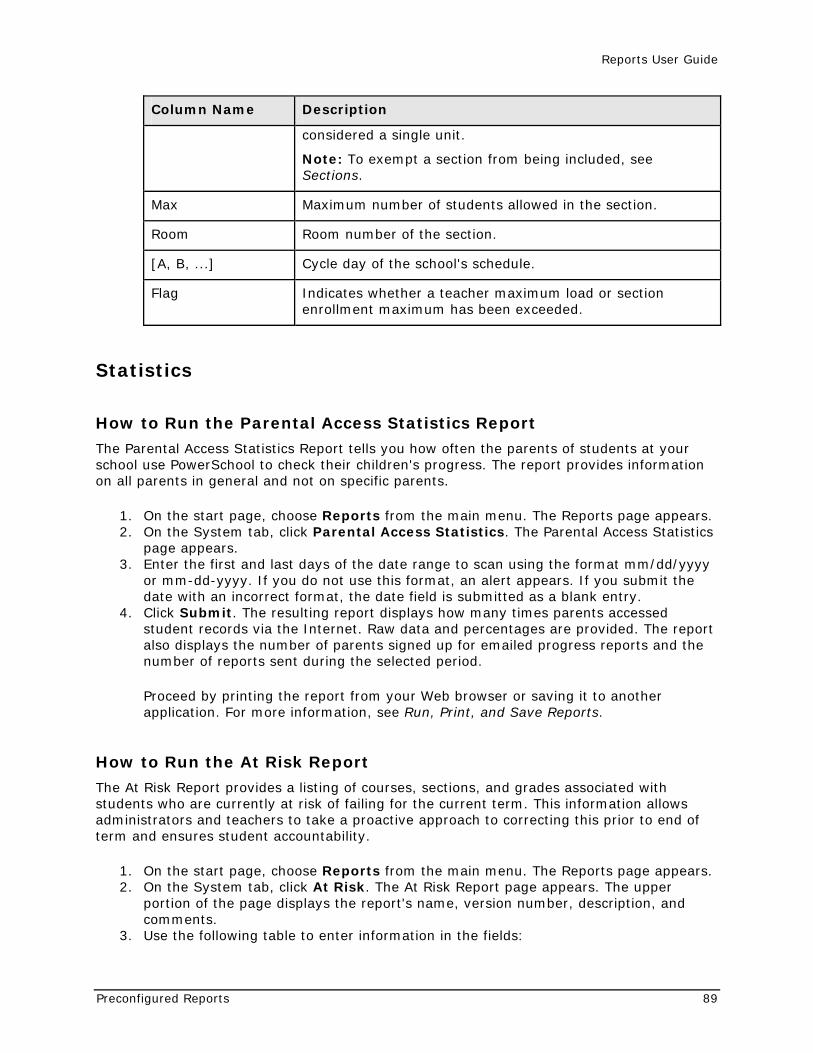
Reports User Guide
Preconfigured Reports 89
Column Name Description
considered a single unit.
Note: To exempt a section from being included, see Sections.
Max Maximum number of students allowed in the section.
Room Room number of the section.
[A, B, ...] Cycle day of the school's schedule.
Flag Indicates whether a teacher maximum load or section enrollment maximum has been exceeded.
Statistics
How to Run the Parental Access Statistics Report
The Parental Access Statistics Report tells you how often the parents of students at your school use PowerSchool to check their children's progress. The report provides information on all parents in general and not on specific parents.
1. On the start page, choose Reports from the main menu. The Reports page appears. 2. On the System tab, click Parental Access Statistics. The Parental Access Statistics
page appears. 3. Enter the first and last days of the date range to scan using the format mm/dd/yyyy
or mm-dd-yyyy. If you do not use this format, an alert appears. If you submit the date with an incorrect format, the date field is submitted as a blank entry.
4. Click Submit. The resulting report displays how many times parents accessed student records via the Internet. Raw data and percentages are provided. The report also displays the number of parents signed up for emailed progress reports and the number of reports sent during the selected period.
Proceed by printing the report from your Web browser or saving it to another application. For more information, see Run, Print, and Save Reports.
How to Run the At Risk Report
The At Risk Report provides a listing of courses, sections, and grades associated with students who are currently at risk of failing for the current term. This information allows administrators and teachers to take a proactive approach to correcting this prior to end of term and ensures student accountability.
1. On the start page, choose Reports from the main menu. The Reports page appears. 2. On the System tab, click At Risk. The At Risk Report page appears. The upper
portion of the page displays the report's name, version number, description, and comments.
3. Use the following table to enter information in the fields:
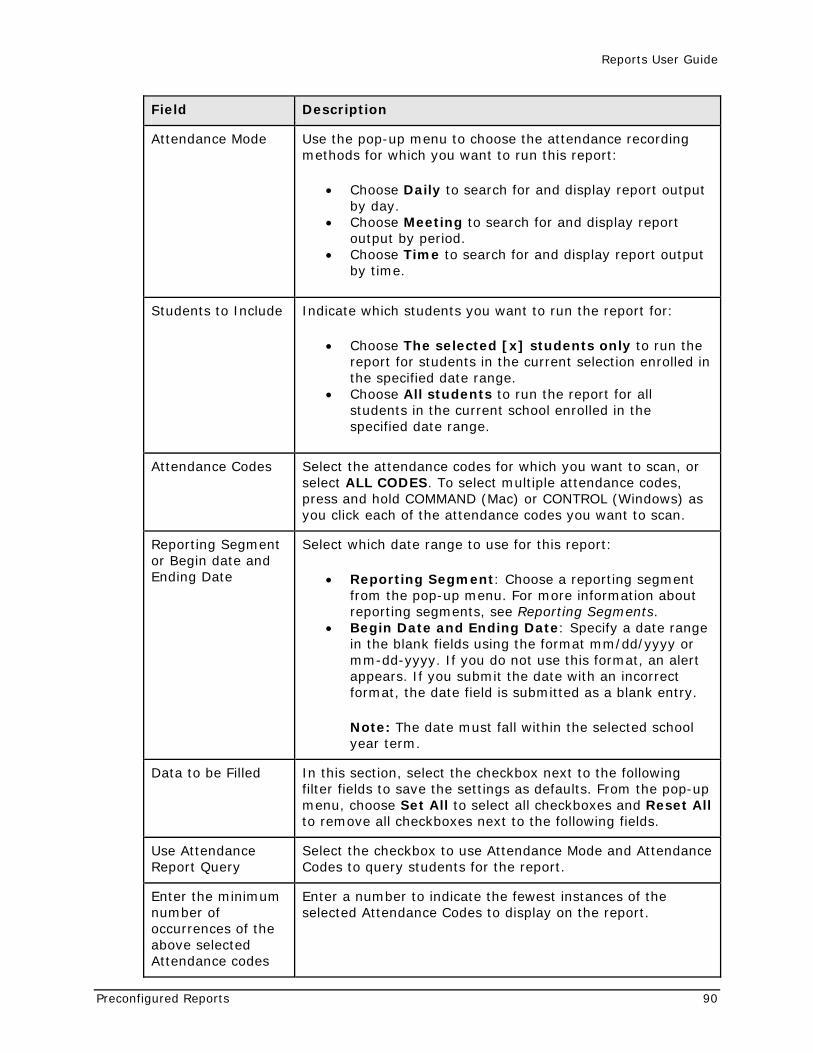
Reports User Guide
Preconfigured Reports 90
Field Description
Attendance Mode Use the pop-up menu to choose the attendance recording methods for which you want to run this report:
• Choose Daily to search for and display report output by day.
• Choose Meeting to search for and display report output by period.
• Choose Time to search for and display report output by time.
Students to Include Indicate which students you want to run the report for:
• Choose The selected [x] students only to run the report for students in the current selection enrolled in the specified date range.
• Choose All students to run the report for all students in the current school enrolled in the specified date range.
Attendance Codes Select the attendance codes for which you want to scan, or select ALL CODES. To select multiple attendance codes, press and hold COMMAND (Mac) or CONTROL (Windows) as you click each of the attendance codes you want to scan.
Reporting Segment or Begin date and Ending Date
Select which date range to use for this report:
• Reporting Segment: Choose a reporting segment from the pop-up menu. For more information about reporting segments, see Reporting Segments.
• Begin Date and Ending Date: Specify a date range in the blank fields using the format mm/dd/yyyy or mm-dd-yyyy. If you do not use this format, an alert appears. If you submit the date with an incorrect format, the date field is submitted as a blank entry.
Note: The date must fall within the selected school year term.
Data to be Filled In this section, select the checkbox next to the following filter fields to save the settings as defaults. From the pop-up menu, choose Set All to select all checkboxes and Reset All to remove all checkboxes next to the following fields.
Use Attendance Report Query
Select the checkbox to use Attendance Mode and Attendance Codes to query students for the report.
Enter the minimum number of occurrences of the above selected Attendance codes
Enter a number to indicate the fewest instances of the selected Attendance Codes to display on the report.
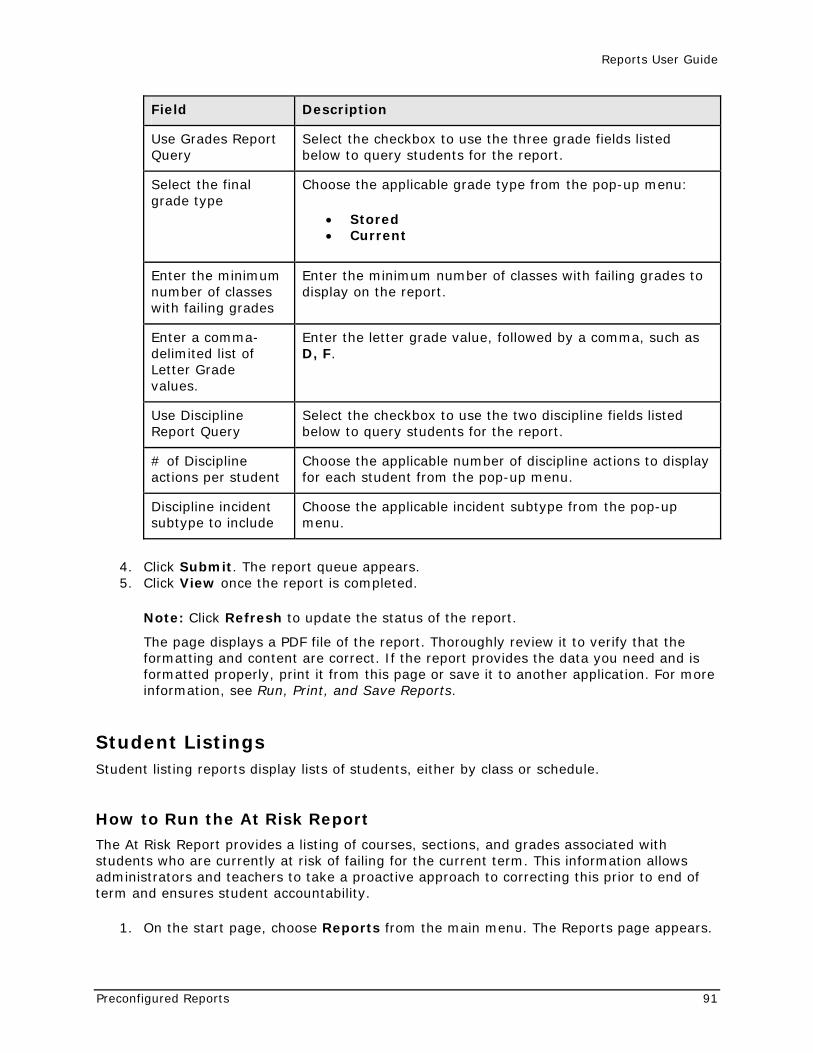
Reports User Guide
Preconfigured Reports 91
Field Description
Use Grades Report Query
Select the checkbox to use the three grade fields listed below to query students for the report.
Select the final grade type
Choose the applicable grade type from the pop-up menu:
• Stored • Current
Enter the minimum number of classes with failing grades
Enter the minimum number of classes with failing grades to display on the report.
Enter a comma-delimited list of Letter Grade values.
Enter the letter grade value, followed by a comma, such as D, F.
Use Discipline Report Query
Select the checkbox to use the two discipline fields listed below to query students for the report.
# of Discipline actions per student
Choose the applicable number of discipline actions to display for each student from the pop-up menu.
Discipline incident subtype to include
Choose the applicable incident subtype from the pop-up menu.
4. Click Submit. The report queue appears. 5. Click View once the report is completed.
Note: Click Refresh to update the status of the report.
The page displays a PDF file of the report. Thoroughly review it to verify that the formatting and content are correct. If the report provides the data you need and is formatted properly, print it from this page or save it to another application. For more information, see Run, Print, and Save Reports.
Student Listings Student listing reports display lists of students, either by class or schedule.
How to Run the At Risk Report
The At Risk Report provides a listing of courses, sections, and grades associated with students who are currently at risk of failing for the current term. This information allows administrators and teachers to take a proactive approach to correcting this prior to end of term and ensures student accountability.
1. On the start page, choose Reports from the main menu. The Reports page appears.
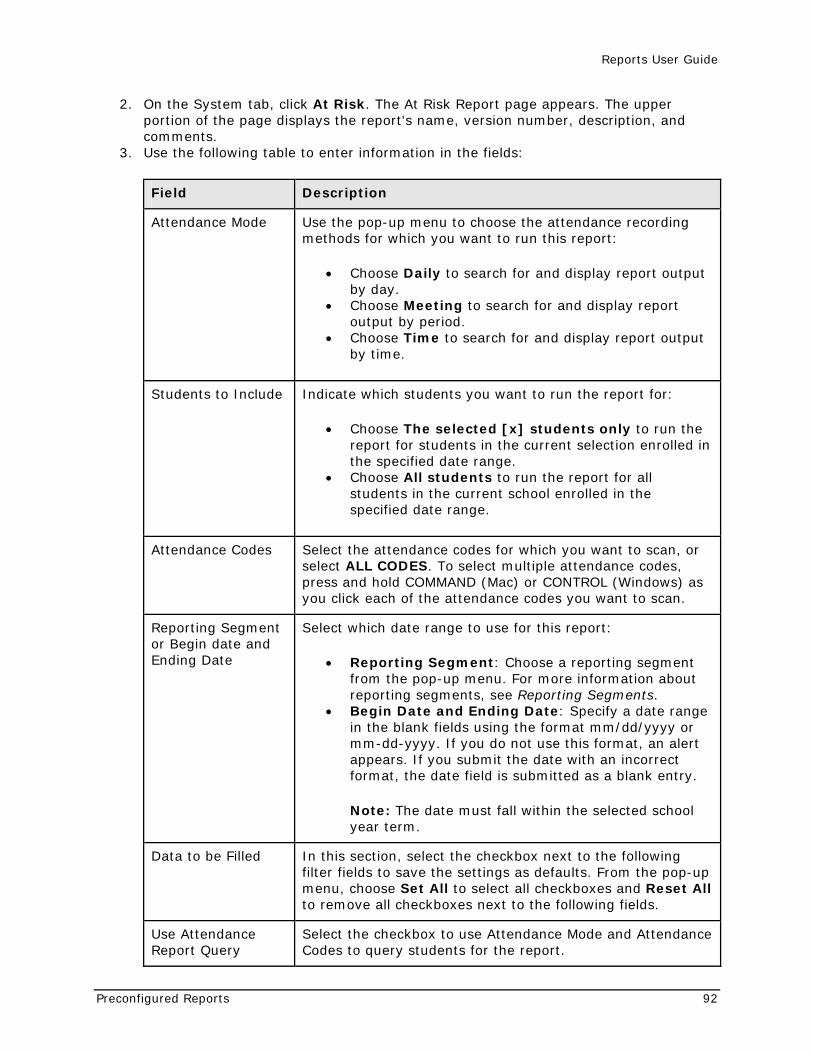
Reports User Guide
Preconfigured Reports 92
2. On the System tab, click At Risk. The At Risk Report page appears. The upper portion of the page displays the report's name, version number, description, and comments.
3. Use the following table to enter information in the fields:
Field Description
Attendance Mode Use the pop-up menu to choose the attendance recording methods for which you want to run this report:
• Choose Daily to search for and display report output by day.
• Choose Meeting to search for and display report output by period.
• Choose Time to search for and display report output by time.
Students to Include Indicate which students you want to run the report for:
• Choose The selected [x] students only to run the report for students in the current selection enrolled in the specified date range.
• Choose All students to run the report for all students in the current school enrolled in the specified date range.
Attendance Codes Select the attendance codes for which you want to scan, or select ALL CODES. To select multiple attendance codes, press and hold COMMAND (Mac) or CONTROL (Windows) as you click each of the attendance codes you want to scan.
Reporting Segment or Begin date and Ending Date
Select which date range to use for this report:
• Reporting Segment: Choose a reporting segment from the pop-up menu. For more information about reporting segments, see Reporting Segments.
• Begin Date and Ending Date: Specify a date range in the blank fields using the format mm/dd/yyyy or mm-dd-yyyy. If you do not use this format, an alert appears. If you submit the date with an incorrect format, the date field is submitted as a blank entry.
Note: The date must fall within the selected school year term.
Data to be Filled In this section, select the checkbox next to the following filter fields to save the settings as defaults. From the pop-up menu, choose Set All to select all checkboxes and Reset All to remove all checkboxes next to the following fields.
Use Attendance Report Query
Select the checkbox to use Attendance Mode and Attendance Codes to query students for the report.
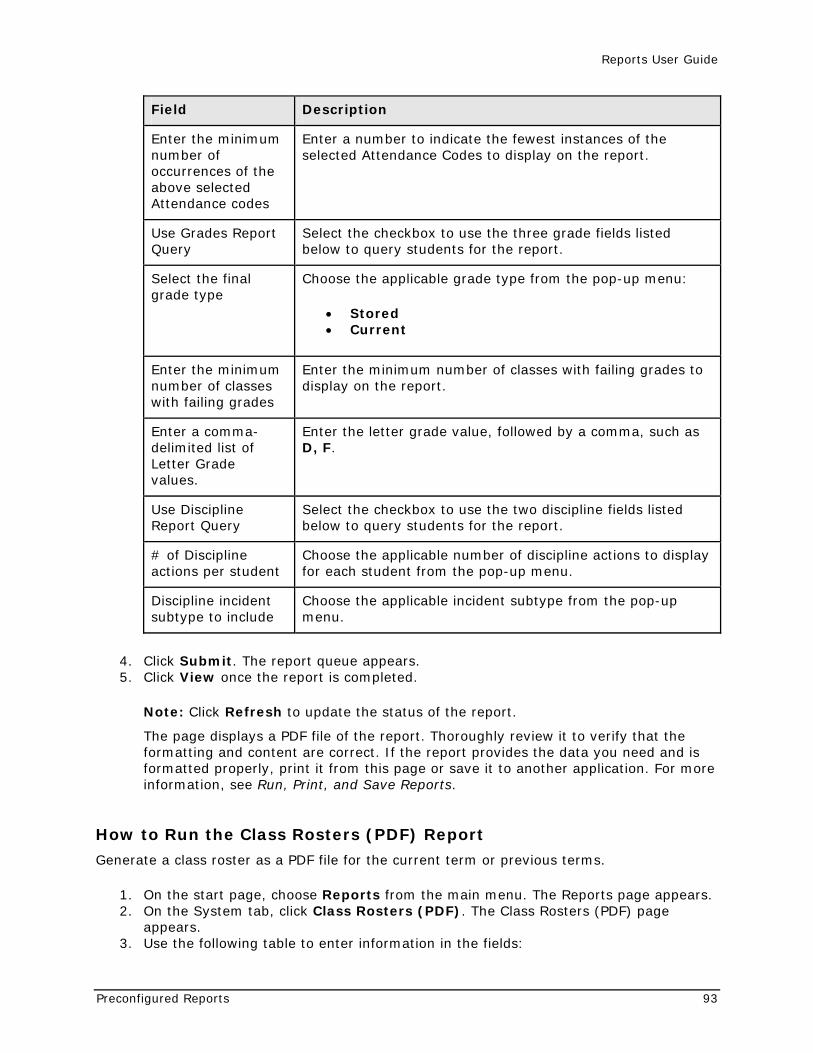
Reports User Guide
Preconfigured Reports 93
Field Description
Enter the minimum number of occurrences of the above selected Attendance codes
Enter a number to indicate the fewest instances of the selected Attendance Codes to display on the report.
Use Grades Report Query
Select the checkbox to use the three grade fields listed below to query students for the report.
Select the final grade type
Choose the applicable grade type from the pop-up menu:
• Stored • Current
Enter the minimum number of classes with failing grades
Enter the minimum number of classes with failing grades to display on the report.
Enter a comma-delimited list of Letter Grade values.
Enter the letter grade value, followed by a comma, such as D, F.
Use Discipline Report Query
Select the checkbox to use the two discipline fields listed below to query students for the report.
# of Discipline actions per student
Choose the applicable number of discipline actions to display for each student from the pop-up menu.
Discipline incident subtype to include
Choose the applicable incident subtype from the pop-up menu.
4. Click Submit. The report queue appears. 5. Click View once the report is completed.
Note: Click Refresh to update the status of the report.
The page displays a PDF file of the report. Thoroughly review it to verify that the formatting and content are correct. If the report provides the data you need and is formatted properly, print it from this page or save it to another application. For more information, see Run, Print, and Save Reports.
How to Run the Class Rosters (PDF) Report
Generate a class roster as a PDF file for the current term or previous terms.
1. On the start page, choose Reports from the main menu. The Reports page appears. 2. On the System tab, click Class Rosters (PDF). The Class Rosters (PDF) page
appears. 3. Use the following table to enter information in the fields:
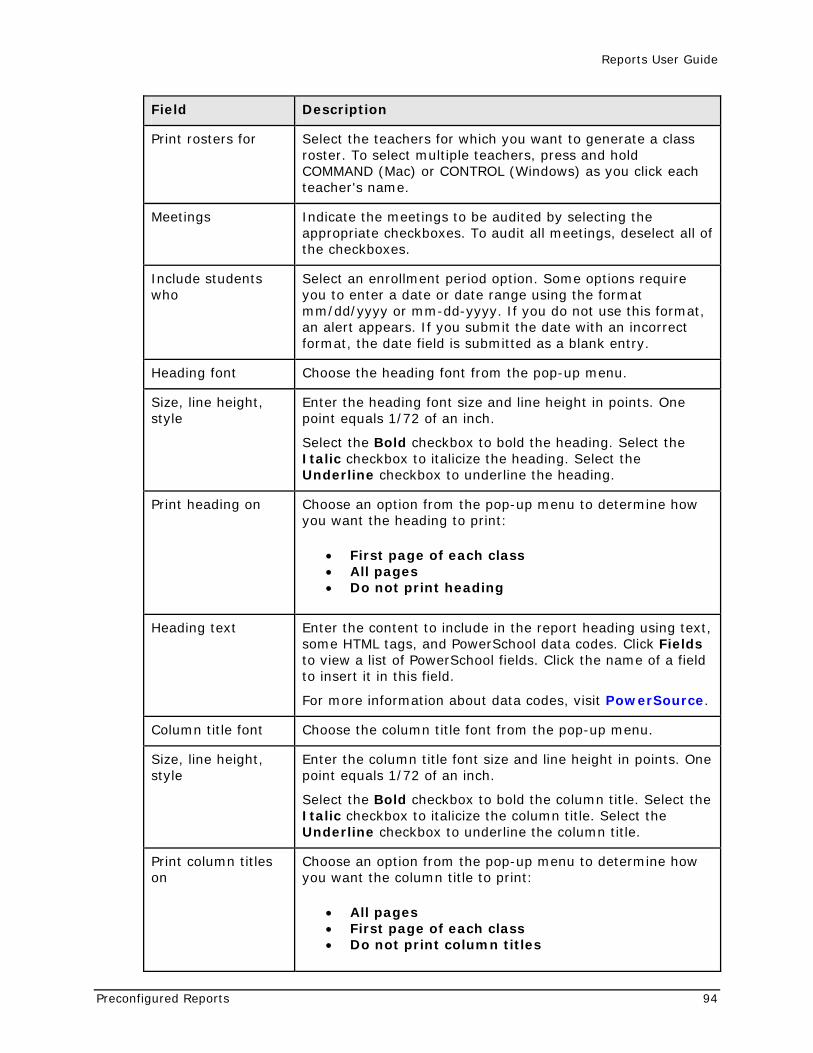
Reports User Guide
Preconfigured Reports 94
Field Description
Print rosters for Select the teachers for which you want to generate a class roster. To select multiple teachers, press and hold COMMAND (Mac) or CONTROL (Windows) as you click each teacher's name.
Meetings Indicate the meetings to be audited by selecting the appropriate checkboxes. To audit all meetings, deselect all of the checkboxes.
Include students who
Select an enrollment period option. Some options require you to enter a date or date range using the format mm/dd/yyyy or mm-dd-yyyy. If you do not use this format, an alert appears. If you submit the date with an incorrect format, the date field is submitted as a blank entry.
Heading font Choose the heading font from the pop-up menu.
Size, line height, style
Enter the heading font size and line height in points. One point equals 1/72 of an inch.
Select the Bold checkbox to bold the heading. Select the Italic checkbox to italicize the heading. Select the Underline checkbox to underline the heading.
Print heading on Choose an option from the pop-up menu to determine how you want the heading to print:
• First page of each class • All pages • Do not print heading
Heading text Enter the content to include in the report heading using text, some HTML tags, and PowerSchool data codes. Click Fields to view a list of PowerSchool fields. Click the name of a field to insert it in this field.
For more information about data codes, visit PowerSource.
Column title font Choose the column title font from the pop-up menu.
Size, line height, style
Enter the column title font size and line height in points. One point equals 1/72 of an inch.
Select the Bold checkbox to bold the column title. Select the Italic checkbox to italicize the column title. Select the Underline checkbox to underline the column title.
Print column titles on
Choose an option from the pop-up menu to determine how you want the column title to print:
• All pages • First page of each class • Do not print column titles
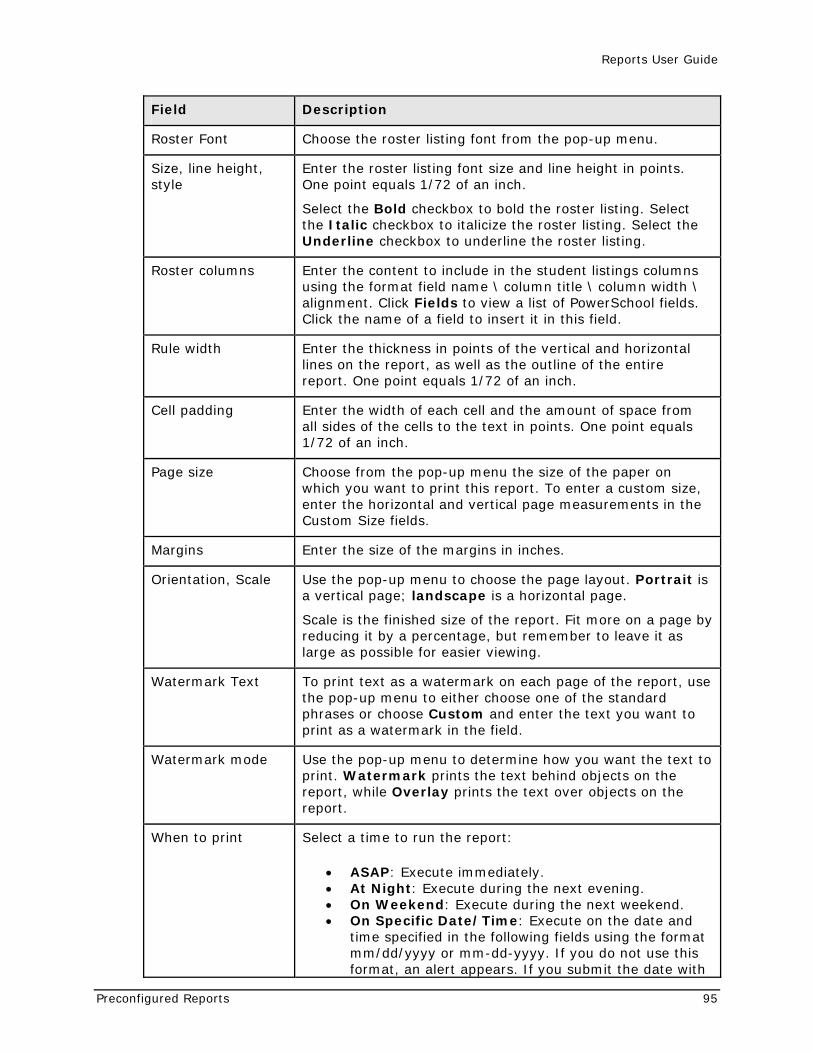
Reports User Guide
Preconfigured Reports 95
Field Description
Roster Font Choose the roster listing font from the pop-up menu.
Size, line height, style
Enter the roster listing font size and line height in points. One point equals 1/72 of an inch.
Select the Bold checkbox to bold the roster listing. Select the Italic checkbox to italicize the roster listing. Select the Underline checkbox to underline the roster listing.
Roster columns Enter the content to include in the student listings columns using the format field name \ column title \ column width \ alignment. Click Fields to view a list of PowerSchool fields. Click the name of a field to insert it in this field.
Rule width Enter the thickness in points of the vertical and horizontal lines on the report, as well as the outline of the entire report. One point equals 1/72 of an inch.
Cell padding Enter the width of each cell and the amount of space from all sides of the cells to the text in points. One point equals 1/72 of an inch.
Page size Choose from the pop-up menu the size of the paper on which you want to print this report. To enter a custom size, enter the horizontal and vertical page measurements in the Custom Size fields.
Margins Enter the size of the margins in inches.
Orientation, Scale Use the pop-up menu to choose the page layout. Portrait is a vertical page; landscape is a horizontal page.
Scale is the finished size of the report. Fit more on a page by reducing it by a percentage, but remember to leave it as large as possible for easier viewing.
Watermark Text To print text as a watermark on each page of the report, use the pop-up menu to either choose one of the standard phrases or choose Custom and enter the text you want to print as a watermark in the field.
Watermark mode Use the pop-up menu to determine how you want the text to print. Watermark prints the text behind objects on the report, while Overlay prints the text over objects on the report.
When to print Select a time to run the report:
• ASAP: Execute immediately. • At Night: Execute during the next evening. • On Weekend: Execute during the next weekend. • On Specific Date/Time: Execute on the date and
time specified in the following fields using the format mm/dd/yyyy or mm-dd-yyyy. If you do not use this format, an alert appears. If you submit the date with
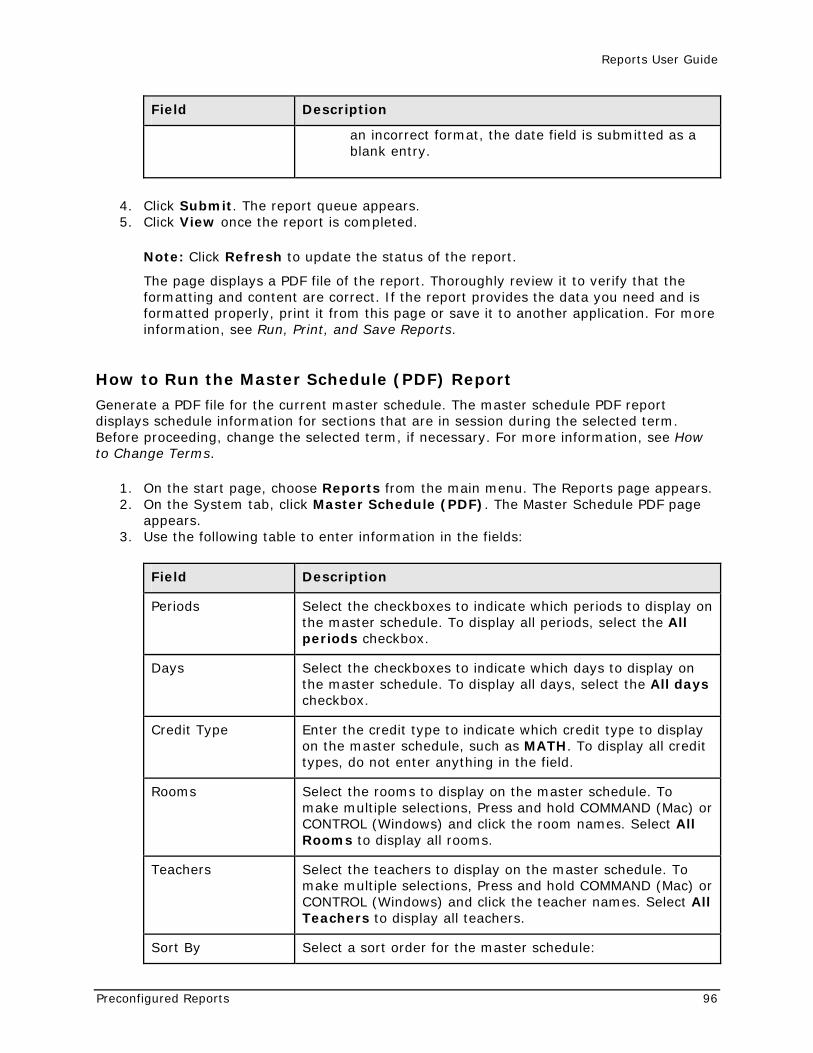
Reports User Guide
Preconfigured Reports 96
Field Description
an incorrect format, the date field is submitted as a blank entry.
4. Click Submit. The report queue appears. 5. Click View once the report is completed.
Note: Click Refresh to update the status of the report.
The page displays a PDF file of the report. Thoroughly review it to verify that the formatting and content are correct. If the report provides the data you need and is formatted properly, print it from this page or save it to another application. For more information, see Run, Print, and Save Reports.
How to Run the Master Schedule (PDF) Report
Generate a PDF file for the current master schedule. The master schedule PDF report displays schedule information for sections that are in session during the selected term. Before proceeding, change the selected term, if necessary. For more information, see How to Change Terms.
1. On the start page, choose Reports from the main menu. The Reports page appears. 2. On the System tab, click Master Schedule (PDF). The Master Schedule PDF page
appears. 3. Use the following table to enter information in the fields:
Field Description
Periods Select the checkboxes to indicate which periods to display on the master schedule. To display all periods, select the All periods checkbox.
Days Select the checkboxes to indicate which days to display on the master schedule. To display all days, select the All days checkbox.
Credit Type Enter the credit type to indicate which credit type to display on the master schedule, such as MATH. To display all credit types, do not enter anything in the field.
Rooms Select the rooms to display on the master schedule. To make multiple selections, Press and hold COMMAND (Mac) or CONTROL (Windows) and click the room names. Select All Rooms to display all rooms.
Teachers Select the teachers to display on the master schedule. To make multiple selections, Press and hold COMMAND (Mac) or CONTROL (Windows) and click the teacher names. Select All Teachers to display all teachers.
Sort By Select a sort order for the master schedule:
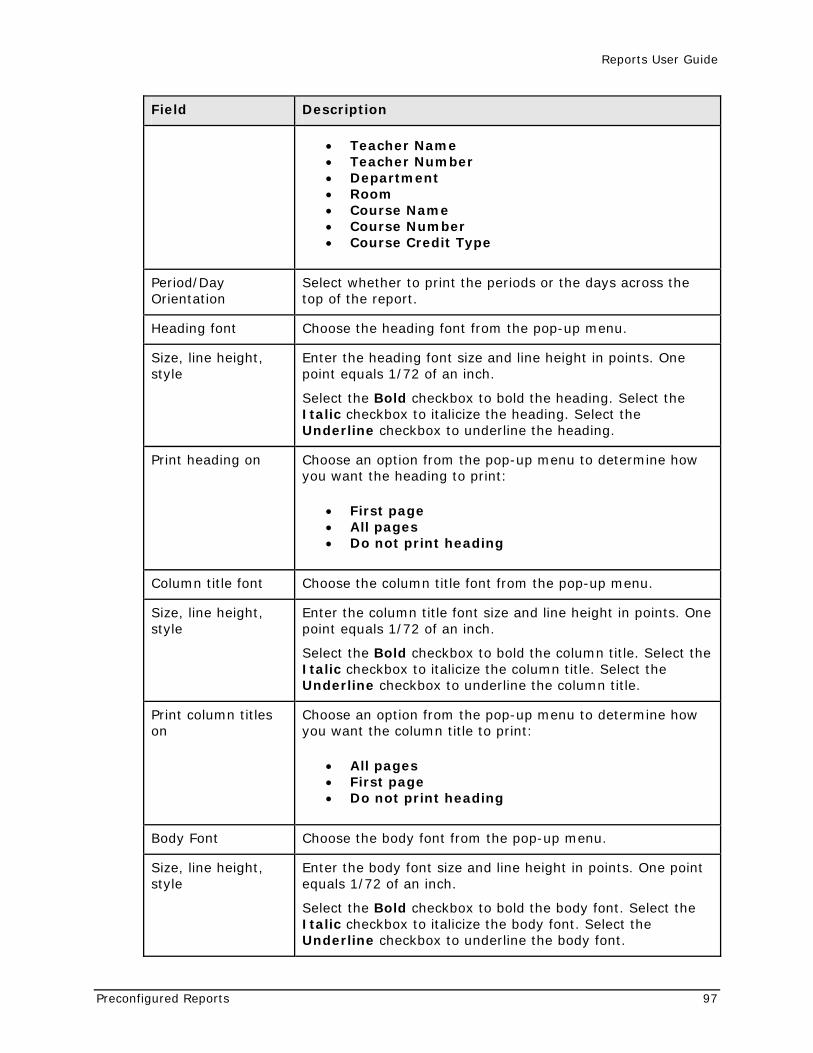
Reports User Guide
Preconfigured Reports 97
Field Description
• Teacher Name • Teacher Number • Department • Room • Course Name • Course Number • Course Credit Type
Period/Day Orientation
Select whether to print the periods or the days across the top of the report.
Heading font Choose the heading font from the pop-up menu.
Size, line height, style
Enter the heading font size and line height in points. One point equals 1/72 of an inch.
Select the Bold checkbox to bold the heading. Select the Italic checkbox to italicize the heading. Select the Underline checkbox to underline the heading.
Print heading on Choose an option from the pop-up menu to determine how you want the heading to print:
• First page • All pages • Do not print heading
Column title font Choose the column title font from the pop-up menu.
Size, line height, style
Enter the column title font size and line height in points. One point equals 1/72 of an inch.
Select the Bold checkbox to bold the column title. Select the Italic checkbox to italicize the column title. Select the Underline checkbox to underline the column title.
Print column titles on
Choose an option from the pop-up menu to determine how you want the column title to print:
• All pages • First page • Do not print heading
Body Font Choose the body font from the pop-up menu.
Size, line height, style
Enter the body font size and line height in points. One point equals 1/72 of an inch.
Select the Bold checkbox to bold the body font. Select the Italic checkbox to italicize the body font. Select the Underline checkbox to underline the body font.
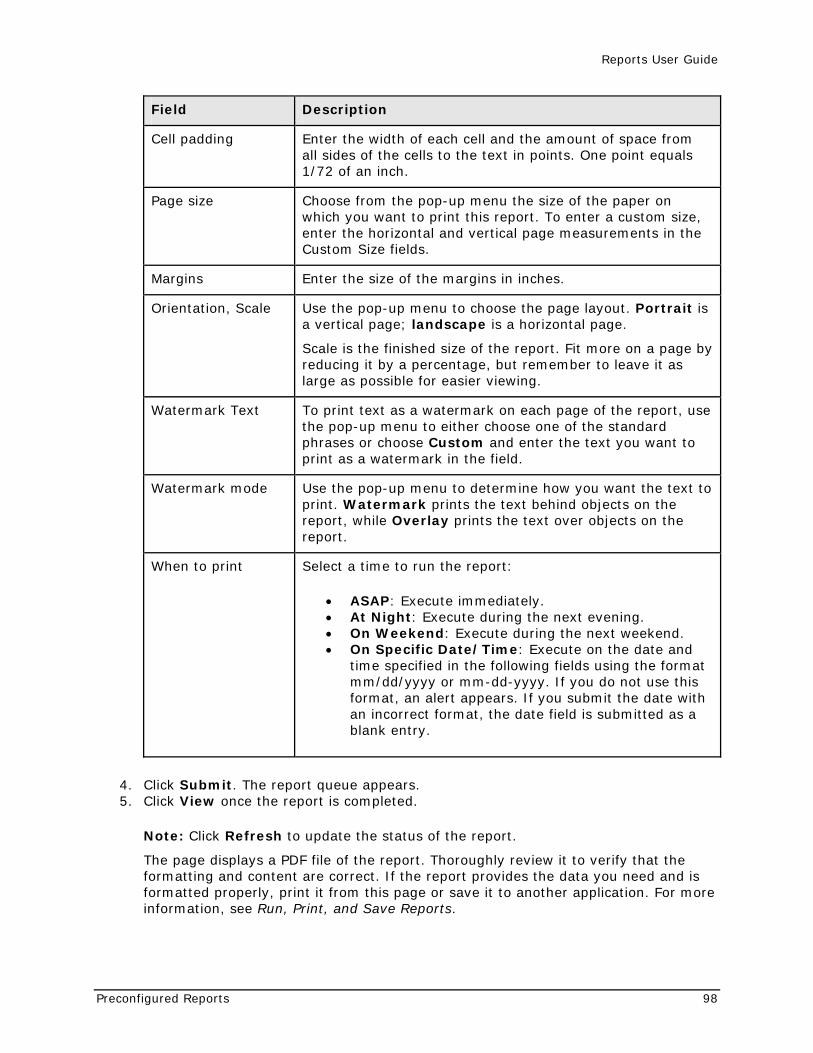
Reports User Guide
Preconfigured Reports 98
Field Description
Cell padding Enter the width of each cell and the amount of space from all sides of the cells to the text in points. One point equals 1/72 of an inch.
Page size Choose from the pop-up menu the size of the paper on which you want to print this report. To enter a custom size, enter the horizontal and vertical page measurements in the Custom Size fields.
Margins Enter the size of the margins in inches.
Orientation, Scale Use the pop-up menu to choose the page layout. Portrait is a vertical page; landscape is a horizontal page.
Scale is the finished size of the report. Fit more on a page by reducing it by a percentage, but remember to leave it as large as possible for easier viewing.
Watermark Text To print text as a watermark on each page of the report, use the pop-up menu to either choose one of the standard phrases or choose Custom and enter the text you want to print as a watermark in the field.
Watermark mode Use the pop-up menu to determine how you want the text to print. Watermark prints the text behind objects on the report, while Overlay prints the text over objects on the report.
When to print Select a time to run the report:
• ASAP: Execute immediately. • At Night: Execute during the next evening. • On Weekend: Execute during the next weekend. • On Specific Date/Time: Execute on the date and
time specified in the following fields using the format mm/dd/yyyy or mm-dd-yyyy. If you do not use this format, an alert appears. If you submit the date with an incorrect format, the date field is submitted as a blank entry.
4. Click Submit. The report queue appears. 5. Click View once the report is completed.
Note: Click Refresh to update the status of the report.
The page displays a PDF file of the report. Thoroughly review it to verify that the formatting and content are correct. If the report provides the data you need and is formatted properly, print it from this page or save it to another application. For more information, see Run, Print, and Save Reports.
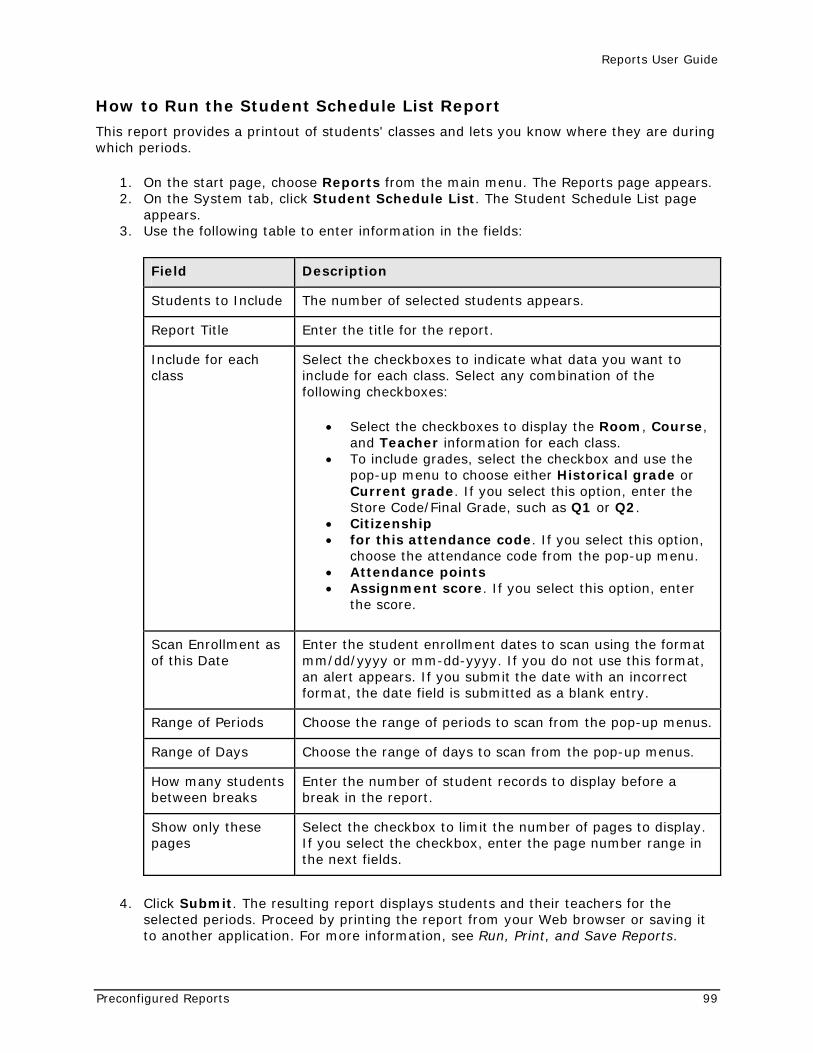
Reports User Guide
Preconfigured Reports 99
How to Run the Student Schedule List Report
This report provides a printout of students' classes and lets you know where they are during which periods.
1. On the start page, choose Reports from the main menu. The Reports page appears. 2. On the System tab, click Student Schedule List. The Student Schedule List page
appears. 3. Use the following table to enter information in the fields:
Field Description
Students to Include The number of selected students appears.
Report Title Enter the title for the report.
Include for each class
Select the checkboxes to indicate what data you want to include for each class. Select any combination of the following checkboxes:
• Select the checkboxes to display the Room, Course, and Teacher information for each class.
• To include grades, select the checkbox and use the pop-up menu to choose either Historical grade or Current grade. If you select this option, enter the Store Code/Final Grade, such as Q1 or Q2.
• Citizenship • for this attendance code. If you select this option,
choose the attendance code from the pop-up menu. • Attendance points • Assignment score. If you select this option, enter
the score.
Scan Enrollment as of this Date
Enter the student enrollment dates to scan using the format mm/dd/yyyy or mm-dd-yyyy. If you do not use this format, an alert appears. If you submit the date with an incorrect format, the date field is submitted as a blank entry.
Range of Periods Choose the range of periods to scan from the pop-up menus.
Range of Days Choose the range of days to scan from the pop-up menus.
How many students between breaks
Enter the number of student records to display before a break in the report.
Show only these pages
Select the checkbox to limit the number of pages to display. If you select the checkbox, enter the page number range in the next fields.
4. Click Submit. The resulting report displays students and their teachers for the selected periods. Proceed by printing the report from your Web browser or saving it to another application. For more information, see Run, Print, and Save Reports.
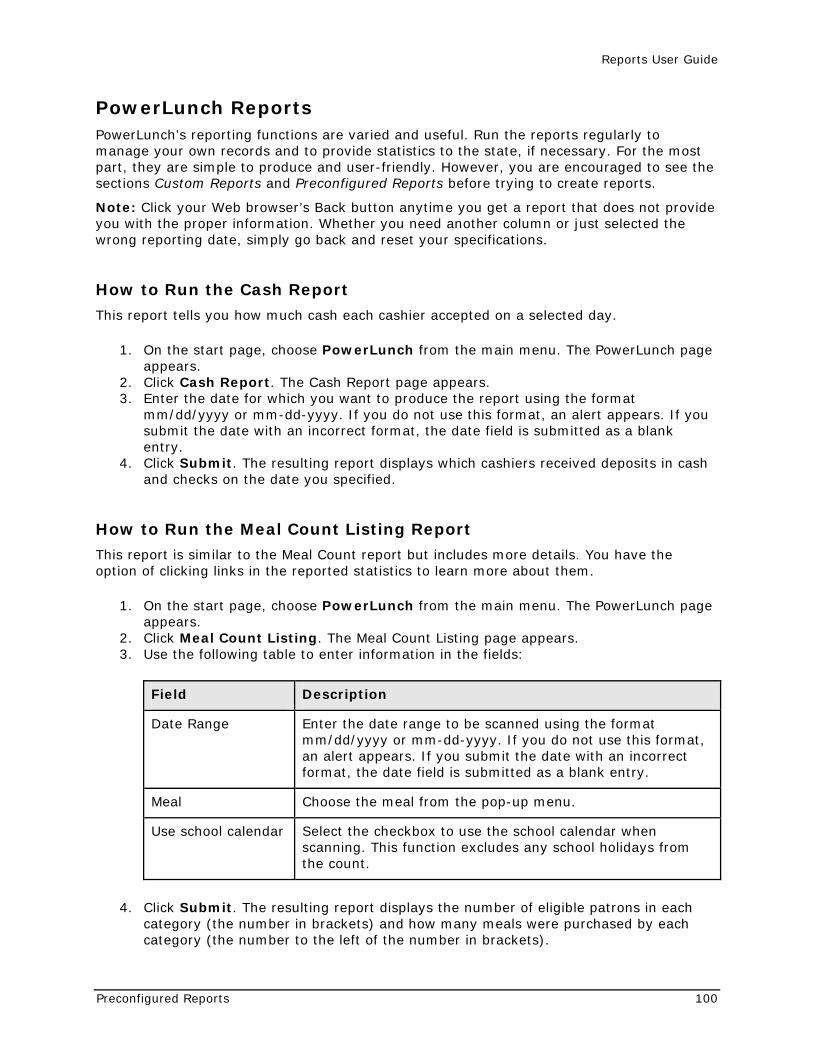
Reports User Guide
Preconfigured Reports 100
PowerLunch Reports PowerLunch’s reporting functions are varied and useful. Run the reports regularly to manage your own records and to provide statistics to the state, if necessary. For the most part, they are simple to produce and user-friendly. However, you are encouraged to see the sections Custom Reports and Preconfigured Reports before trying to create reports.
Note: Click your Web browser’s Back button anytime you get a report that does not provide you with the proper information. Whether you need another column or just selected the wrong reporting date, simply go back and reset your specifications.
How to Run the Cash Report
This report tells you how much cash each cashier accepted on a selected day.
1. On the start page, choose PowerLunch from the main menu. The PowerLunch page appears.
2. Click Cash Report. The Cash Report page appears. 3. Enter the date for which you want to produce the report using the format
mm/dd/yyyy or mm-dd-yyyy. If you do not use this format, an alert appears. If you submit the date with an incorrect format, the date field is submitted as a blank entry.
4. Click Submit. The resulting report displays which cashiers received deposits in cash and checks on the date you specified.
How to Run the Meal Count Listing Report
This report is similar to the Meal Count report but includes more details. You have the option of clicking links in the reported statistics to learn more about them.
1. On the start page, choose PowerLunch from the main menu. The PowerLunch page appears.
2. Click Meal Count Listing. The Meal Count Listing page appears. 3. Use the following table to enter information in the fields:
Field Description
Date Range Enter the date range to be scanned using the format mm/dd/yyyy or mm-dd-yyyy. If you do not use this format, an alert appears. If you submit the date with an incorrect format, the date field is submitted as a blank entry.
Meal Choose the meal from the pop-up menu.
Use school calendar Select the checkbox to use the school calendar when scanning. This function excludes any school holidays from the count.
4. Click Submit. The resulting report displays the number of eligible patrons in each category (the number in brackets) and how many meals were purchased by each category (the number to the left of the number in brackets).
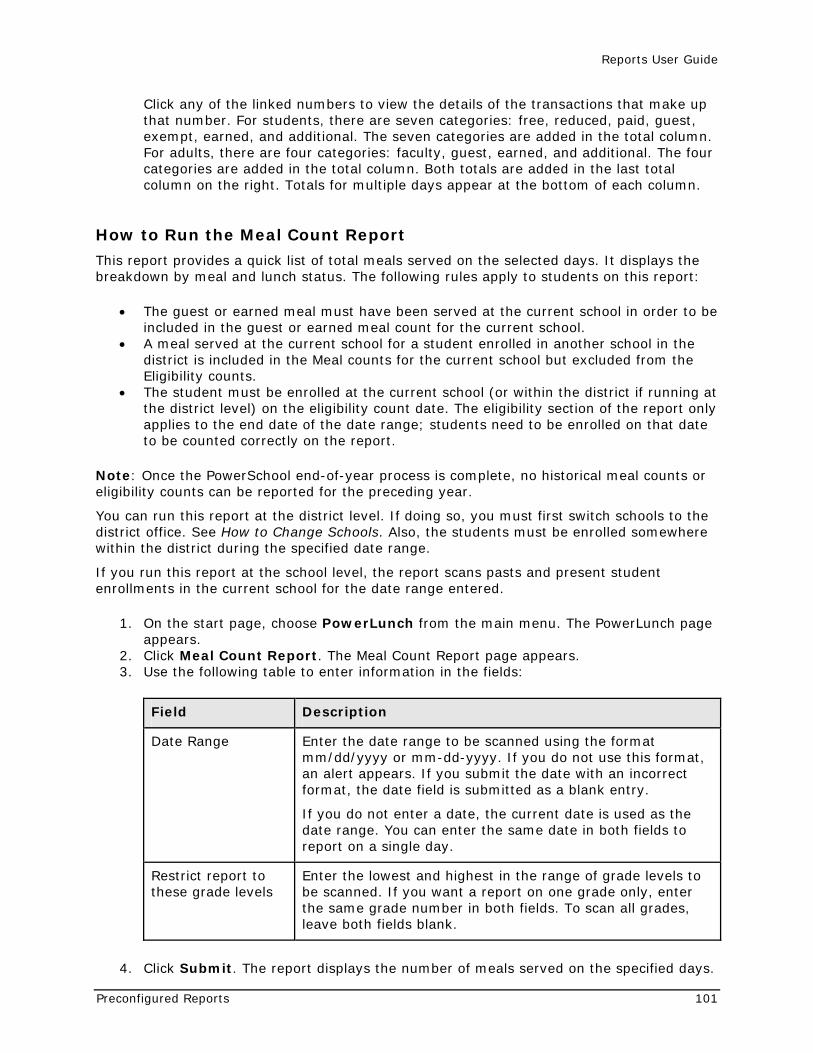
Reports User Guide
Preconfigured Reports 101
Click any of the linked numbers to view the details of the transactions that make up that number. For students, there are seven categories: free, reduced, paid, guest, exempt, earned, and additional. The seven categories are added in the total column. For adults, there are four categories: faculty, guest, earned, and additional. The four categories are added in the total column. Both totals are added in the last total column on the right. Totals for multiple days appear at the bottom of each column.
How to Run the Meal Count Report
This report provides a quick list of total meals served on the selected days. It displays the breakdown by meal and lunch status. The following rules apply to students on this report:
• The guest or earned meal must have been served at the current school in order to be included in the guest or earned meal count for the current school.
• A meal served at the current school for a student enrolled in another school in the district is included in the Meal counts for the current school but excluded from the Eligibility counts.
• The student must be enrolled at the current school (or within the district if running at the district level) on the eligibility count date. The eligibility section of the report only applies to the end date of the date range; students need to be enrolled on that date to be counted correctly on the report.
Note: Once the PowerSchool end-of-year process is complete, no historical meal counts or eligibility counts can be reported for the preceding year.
You can run this report at the district level. If doing so, you must first switch schools to the district office. See How to Change Schools. Also, the students must be enrolled somewhere within the district during the specified date range.
If you run this report at the school level, the report scans pasts and present student enrollments in the current school for the date range entered.
1. On the start page, choose PowerLunch from the main menu. The PowerLunch page appears.
2. Click Meal Count Report. The Meal Count Report page appears. 3. Use the following table to enter information in the fields:
Field Description
Date Range Enter the date range to be scanned using the format mm/dd/yyyy or mm-dd-yyyy. If you do not use this format, an alert appears. If you submit the date with an incorrect format, the date field is submitted as a blank entry.
If you do not enter a date, the current date is used as the date range. You can enter the same date in both fields to report on a single day.
Restrict report to these grade levels
Enter the lowest and highest in the range of grade levels to be scanned. If you want a report on one grade only, enter the same grade number in both fields. To scan all grades, leave both fields blank.
4. Click Submit. The report displays the number of meals served on the specified days.
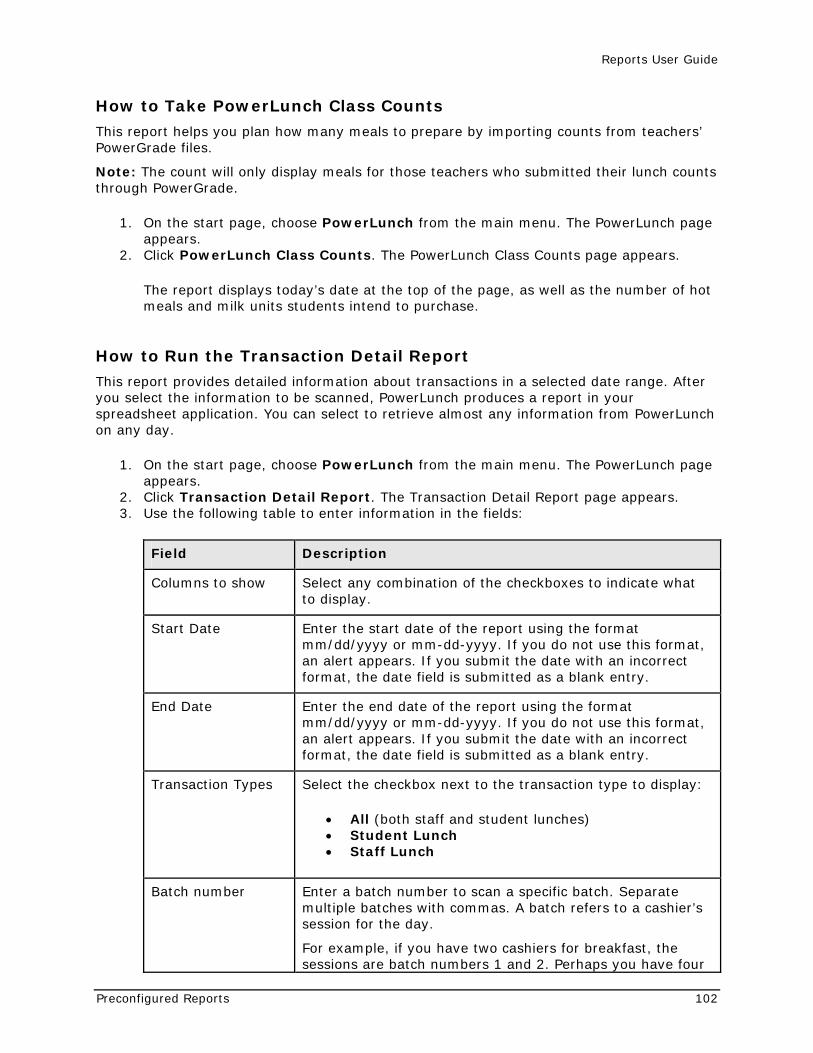
Reports User Guide
Preconfigured Reports 102
How to Take PowerLunch Class Counts
This report helps you plan how many meals to prepare by importing counts from teachers’ PowerGrade files.
Note: The count will only display meals for those teachers who submitted their lunch counts through PowerGrade.
1. On the start page, choose PowerLunch from the main menu. The PowerLunch page appears.
2. Click PowerLunch Class Counts. The PowerLunch Class Counts page appears.
The report displays today’s date at the top of the page, as well as the number of hot meals and milk units students intend to purchase.
How to Run the Transaction Detail Report
This report provides detailed information about transactions in a selected date range. After you select the information to be scanned, PowerLunch produces a report in your spreadsheet application. You can select to retrieve almost any information from PowerLunch on any day.
1. On the start page, choose PowerLunch from the main menu. The PowerLunch page appears.
2. Click Transaction Detail Report. The Transaction Detail Report page appears. 3. Use the following table to enter information in the fields:
Field Description
Columns to show Select any combination of the checkboxes to indicate what to display.
Start Date Enter the start date of the report using the format mm/dd/yyyy or mm-dd-yyyy. If you do not use this format, an alert appears. If you submit the date with an incorrect format, the date field is submitted as a blank entry.
End Date Enter the end date of the report using the format mm/dd/yyyy or mm-dd-yyyy. If you do not use this format, an alert appears. If you submit the date with an incorrect format, the date field is submitted as a blank entry.
Transaction Types Select the checkbox next to the transaction type to display:
• All (both staff and student lunches) • Student Lunch • Staff Lunch
Batch number Enter a batch number to scan a specific batch. Separate multiple batches with commas. A batch refers to a cashier’s session for the day.
For example, if you have two cashiers for breakfast, the sessions are batch numbers 1 and 2. Perhaps you have four
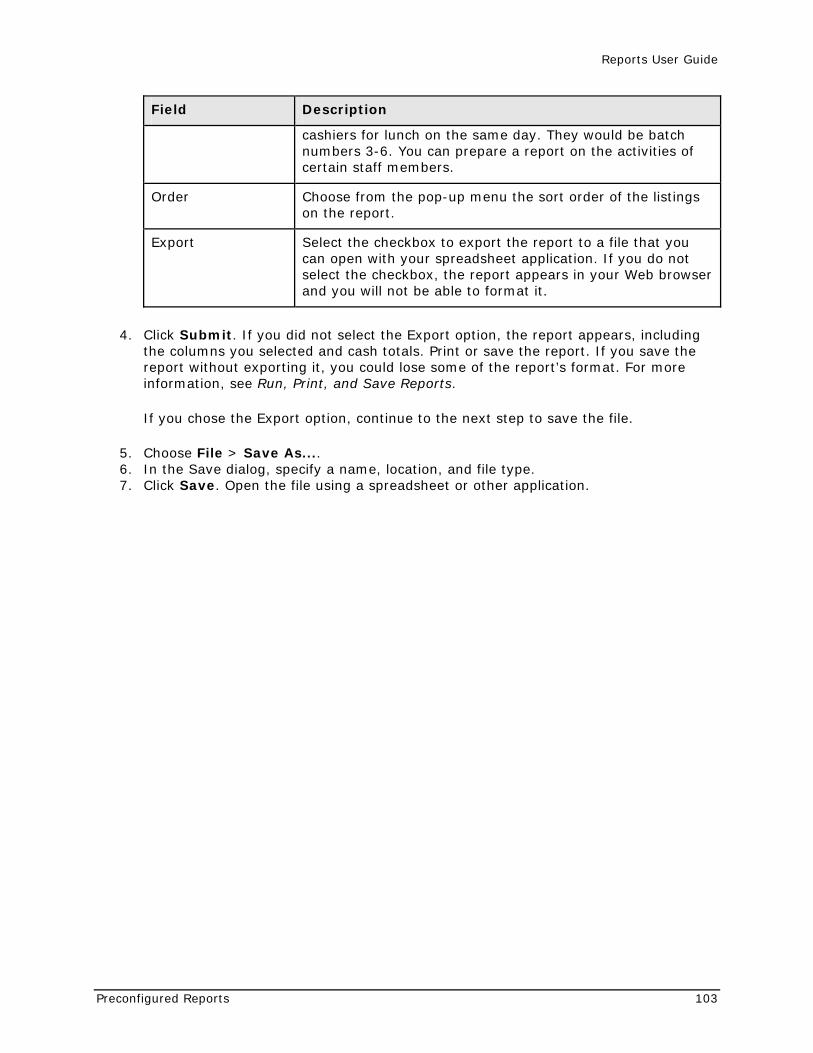
Reports User Guide
Preconfigured Reports 103
Field Description
cashiers for lunch on the same day. They would be batch numbers 3-6. You can prepare a report on the activities of certain staff members.
Order Choose from the pop-up menu the sort order of the listings on the report.
Export Select the checkbox to export the report to a file that you can open with your spreadsheet application. If you do not select the checkbox, the report appears in your Web browser and you will not be able to format it.
4. Click Submit. If you did not select the Export option, the report appears, including the columns you selected and cash totals. Print or save the report. If you save the report without exporting it, you could lose some of the report’s format. For more information, see Run, Print, and Save Reports.
If you chose the Export option, continue to the next step to save the file.
5. Choose File > Save As.... 6. In the Save dialog, specify a name, location, and file type. 7. Click Save. Open the file using a spreadsheet or other application.
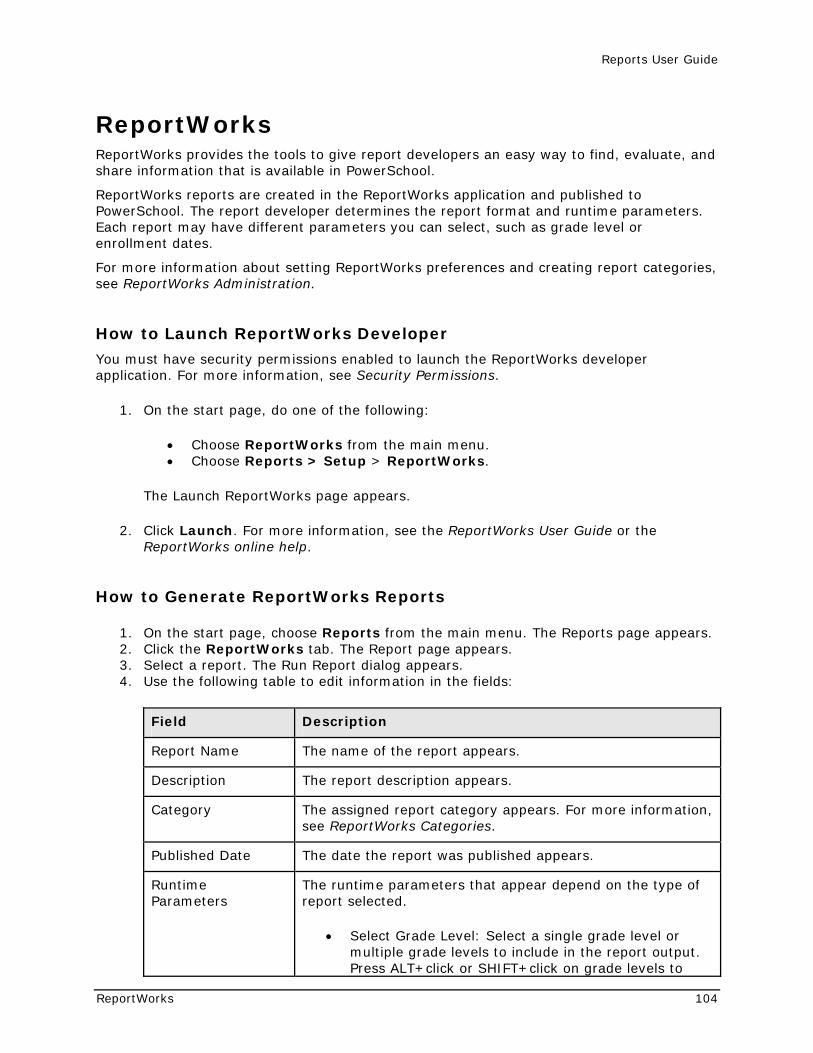
Reports User Guide
ReportWorks 104
ReportWorks ReportWorks provides the tools to give report developers an easy way to find, evaluate, and share information that is available in PowerSchool.
ReportWorks reports are created in the ReportWorks application and published to PowerSchool. The report developer determines the report format and runtime parameters. Each report may have different parameters you can select, such as grade level or enrollment dates.
For more information about setting ReportWorks preferences and creating report categories, see ReportWorks Administration.
How to Launch ReportWorks Developer
You must have security permissions enabled to launch the ReportWorks developer application. For more information, see Security Permissions.
1. On the start page, do one of the following:
• Choose ReportWorks from the main menu. • Choose Reports > Setup > ReportWorks.
The Launch ReportWorks page appears.
2. Click Launch. For more information, see the ReportWorks User Guide or the ReportWorks online help.
How to Generate ReportWorks Reports
1. On the start page, choose Reports from the main menu. The Reports page appears. 2. Click the ReportWorks tab. The Report page appears. 3. Select a report. The Run Report dialog appears. 4. Use the following table to edit information in the fields:
Field Description
Report Name The name of the report appears.
Description The report description appears.
Category The assigned report category appears. For more information, see ReportWorks Categories.
Published Date The date the report was published appears.
Runtime Parameters
The runtime parameters that appear depend on the type of report selected.
• Select Grade Level: Select a single grade level or multiple grade levels to include in the report output. Press ALT+click or SHIFT+click on grade levels to
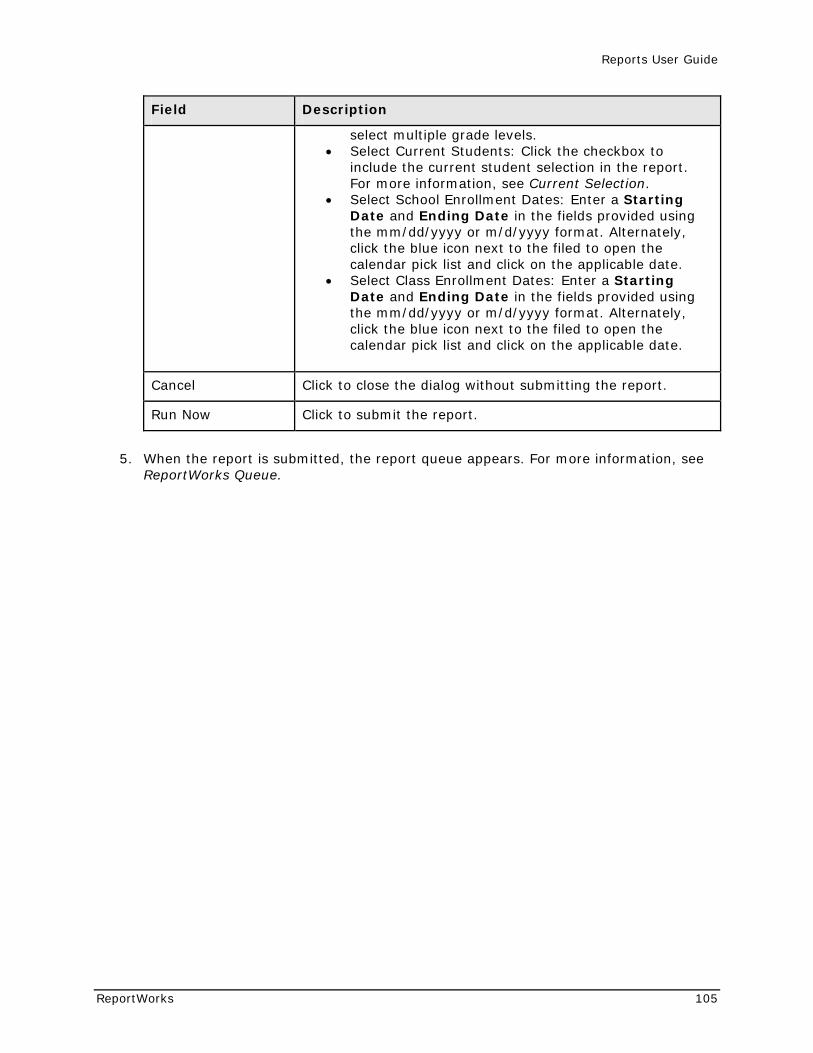
Reports User Guide
ReportWorks 105
Field Description
select multiple grade levels. • Select Current Students: Click the checkbox to
include the current student selection in the report. For more information, see Current Selection.
• Select School Enrollment Dates: Enter a Starting Date and Ending Date in the fields provided using the mm/dd/yyyy or m/d/yyyy format. Alternately, click the blue icon next to the filed to open the calendar pick list and click on the applicable date.
• Select Class Enrollment Dates: Enter a Starting Date and Ending Date in the fields provided using the mm/dd/yyyy or m/d/yyyy format. Alternately, click the blue icon next to the filed to open the calendar pick list and click on the applicable date.
Cancel Click to close the dialog without submitting the report.
Run Now Click to submit the report.
5. When the report is submitted, the report queue appears. For more information, see ReportWorks Queue.
Reports User Guide
Custom Reports 106
Custom Reports Use PowerSchool to set up reusable report templates according to your individual needs. The resulting reports provide you with customized views of the information stored in PowerSchool. Print the reports, save them, or use them as view-only tools. As the data stored on the system changes regularly, the report results will likely change every time you run a new report, even if you use the same template.
Custom reports are different from preconfigured reports because you decide what information to include in the final report and how it will look.
While all reports can be run for all students, some can be run for a selected group of students. If the report you choose allows this option, select the group of students and click the PowerSchool logo to return to the start page. PowerSchool remembers the group while you are logged in and will allow you to select the group as you build the report template.
There are four styles of PowerSchool custom reports: report cards, mailing labels, form letters, and object reports. Each can be created to meet your needs, and all four styles can be saved as templates for reuse. For more information about report templates, see Report Templates. For more information about other ways to create reports, see Alternate Ways to Create Reports.
Report Cards Report card reports can be used for much more than just end-of-the-term reports. You can also use them to create other types of documents, such as custom letters or progress reports. Any report card-style report can include text as well as PowerSchool fields.
You can only create report cards for the term selected on the start page. To report on more than one term, create an object report. For more information, see Object Reports.
How to Open a Preview Page
When creating custom reports, it is a good idea to preview them often as you work. Therefore, before you create any new reports, you should open a preview page in your Web browser.
1. On the start page, search for and select any student or group of students. For more information, see Select a Group of Students.
2. Click the PowerSchool logo. The start page appears. 3. Choose Reports from the main menu. The Reports page appears. 4. Click the Setup tab. The Report Setup page appears. 5. Click Form Letters. The Form Letters page appears. 6. Click Print. Leave the Print Reports page open as you create each type of report in a
new Web browser window. You will return to it to review the report template as you work. Within other instructions, this page is referred to as the preview page.
How to Add a Custom Report Card Template
You can customize the following elements of a report card template:
• Heading • Schedule Listing
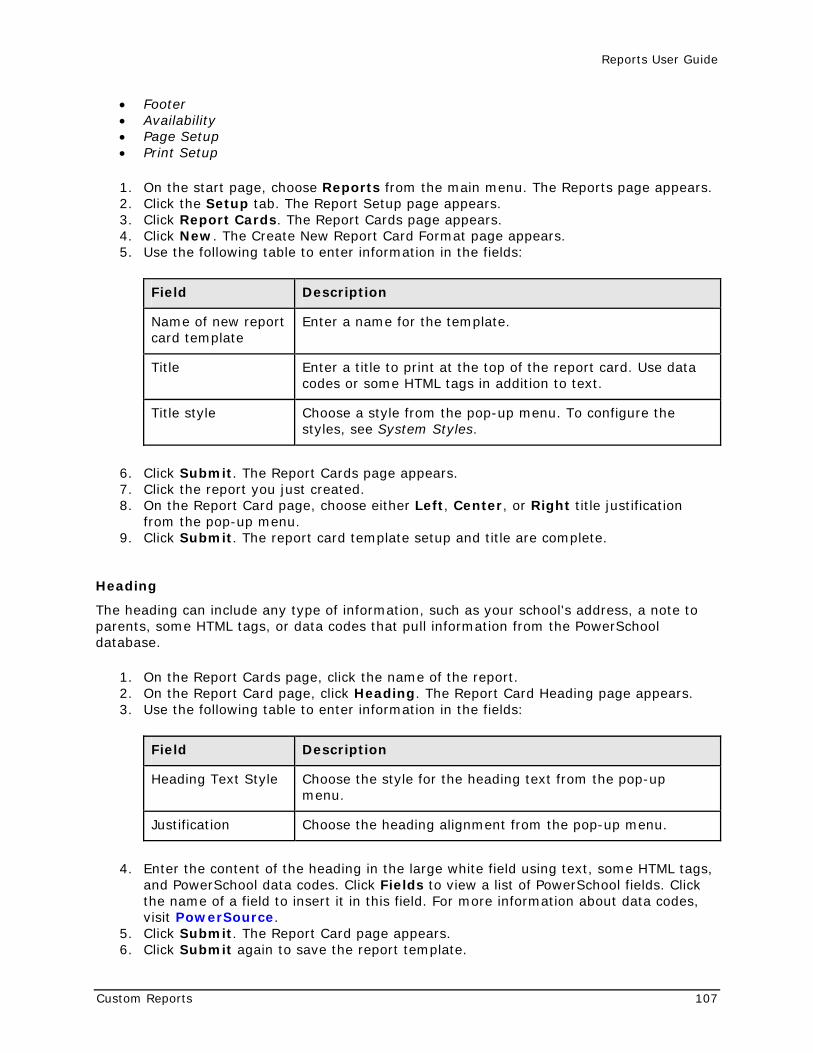
Reports User Guide
Custom Reports 107
• Footer • Availability • Page Setup • Print Setup
1. On the start page, choose Reports from the main menu. The Reports page appears. 2. Click the Setup tab. The Report Setup page appears. 3. Click Report Cards. The Report Cards page appears. 4. Click New. The Create New Report Card Format page appears. 5. Use the following table to enter information in the fields:
Field Description
Name of new report card template
Enter a name for the template.
Title Enter a title to print at the top of the report card. Use data codes or some HTML tags in addition to text.
Title style Choose a style from the pop-up menu. To configure the styles, see System Styles.
6. Click Submit. The Report Cards page appears. 7. Click the report you just created. 8. On the Report Card page, choose either Left, Center, or Right title justification
from the pop-up menu. 9. Click Submit. The report card template setup and title are complete.
Heading
The heading can include any type of information, such as your school's address, a note to parents, some HTML tags, or data codes that pull information from the PowerSchool database.
1. On the Report Cards page, click the name of the report. 2. On the Report Card page, click Heading. The Report Card Heading page appears. 3. Use the following table to enter information in the fields:
Field Description
Heading Text Style Choose the style for the heading text from the pop-up menu.
Justification Choose the heading alignment from the pop-up menu.
4. Enter the content of the heading in the large white field using text, some HTML tags, and PowerSchool data codes. Click Fields to view a list of PowerSchool fields. Click the name of a field to insert it in this field. For more information about data codes, visit PowerSource.
5. Click Submit. The Report Card page appears. 6. Click Submit again to save the report template.
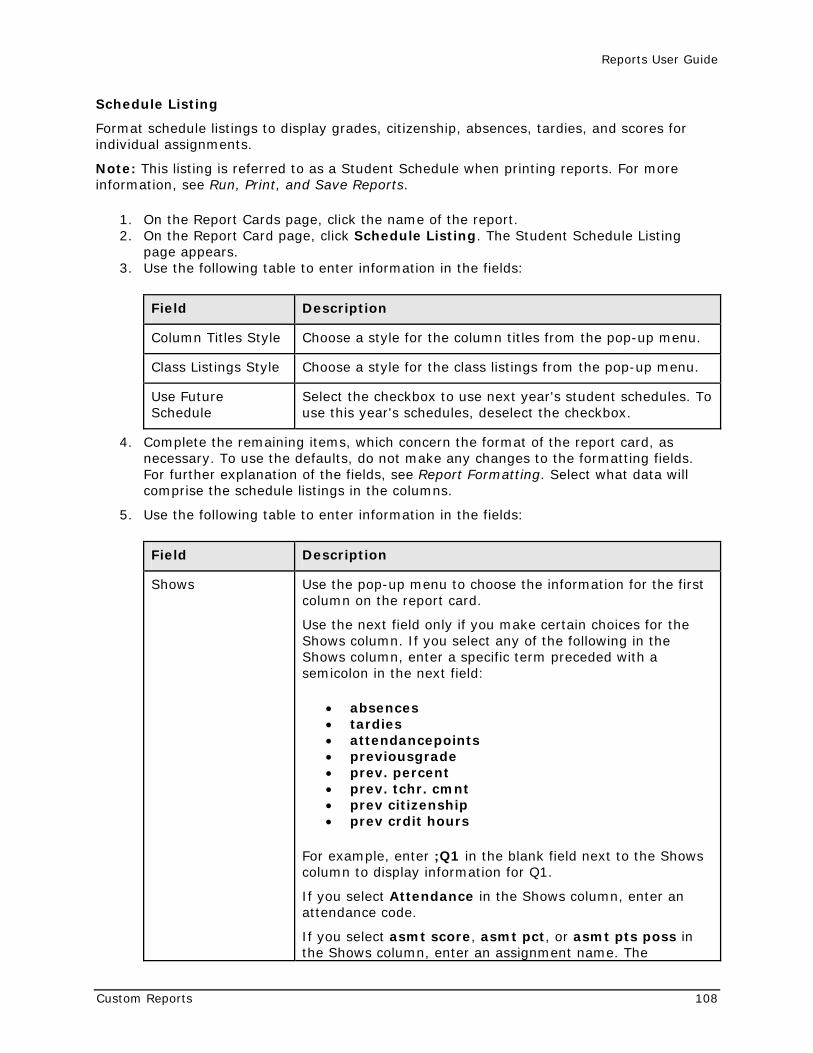
Reports User Guide
Custom Reports 108
Schedule Listing
Format schedule listings to display grades, citizenship, absences, tardies, and scores for individual assignments.
Note: This listing is referred to as a Student Schedule when printing reports. For more information, see Run, Print, and Save Reports.
1. On the Report Cards page, click the name of the report. 2. On the Report Card page, click Schedule Listing. The Student Schedule Listing
page appears. 3. Use the following table to enter information in the fields:
Field Description
Column Titles Style Choose a style for the column titles from the pop-up menu.
Class Listings Style Choose a style for the class listings from the pop-up menu.
Use Future Schedule
Select the checkbox to use next year's student schedules. To use this year's schedules, deselect the checkbox.
4. Complete the remaining items, which concern the format of the report card, as necessary. To use the defaults, do not make any changes to the formatting fields. For further explanation of the fields, see Report Formatting. Select what data will comprise the schedule listings in the columns.
5. Use the following table to enter information in the fields:
Field Description
Shows Use the pop-up menu to choose the information for the first column on the report card.
Use the next field only if you make certain choices for the Shows column. If you select any of the following in the Shows column, enter a specific term preceded with a semicolon in the next field:
• absences • tardies • attendancepoints • previousgrade • prev. percent • prev. tchr. cmnt • prev citizenship • prev crdit hours
For example, enter ;Q1 in the blank field next to the Shows column to display information for Q1.
If you select Attendance in the Shows column, enter an attendance code.
If you select asmt score, asmt pct, or asmt pts poss in the Shows column, enter an assignment name. The
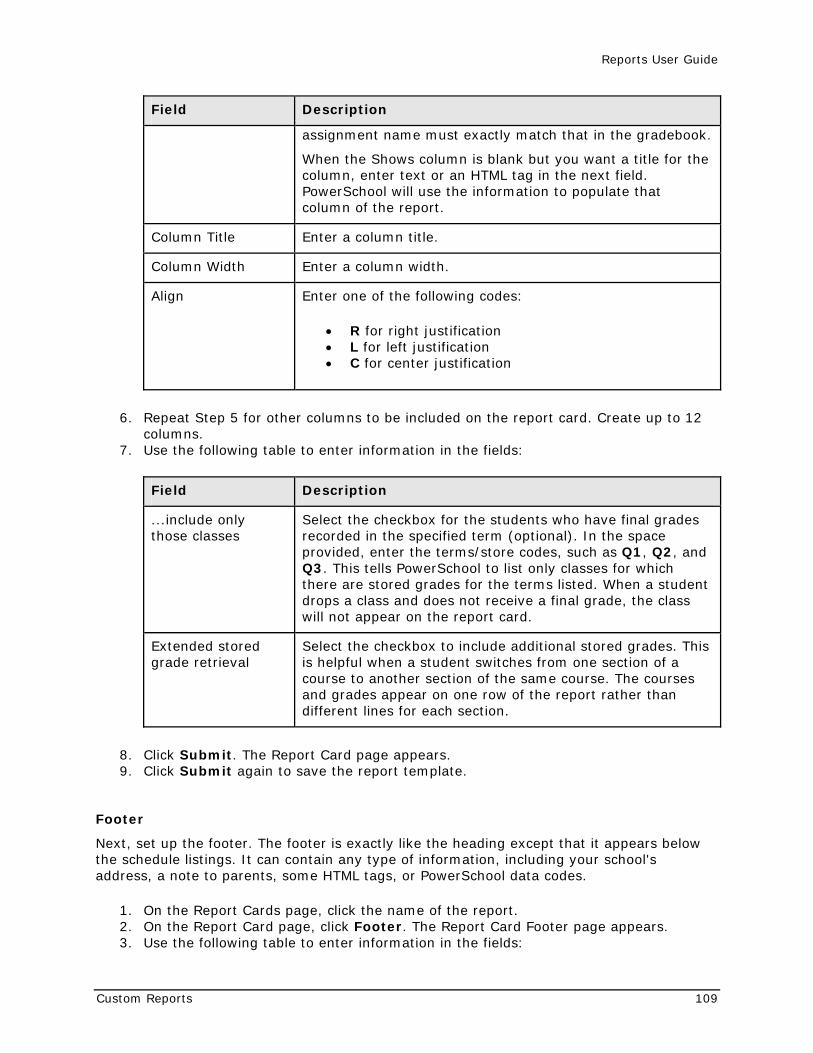
Reports User Guide
Custom Reports 109
Field Description
assignment name must exactly match that in the gradebook.
When the Shows column is blank but you want a title for the column, enter text or an HTML tag in the next field. PowerSchool will use the information to populate that column of the report.
Column Title Enter a column title.
Column Width Enter a column width.
Align Enter one of the following codes:
• R for right justification • L for left justification • C for center justification
6. Repeat Step 5 for other columns to be included on the report card. Create up to 12 columns.
7. Use the following table to enter information in the fields:
Field Description
...include only those classes
Select the checkbox for the students who have final grades recorded in the specified term (optional). In the space provided, enter the terms/store codes, such as Q1, Q2, and Q3. This tells PowerSchool to list only classes for which there are stored grades for the terms listed. When a student drops a class and does not receive a final grade, the class will not appear on the report card.
Extended stored grade retrieval
Select the checkbox to include additional stored grades. This is helpful when a student switches from one section of a course to another section of the same course. The courses and grades appear on one row of the report rather than different lines for each section.
8. Click Submit. The Report Card page appears. 9. Click Submit again to save the report template.
Footer
Next, set up the footer. The footer is exactly like the heading except that it appears below the schedule listings. It can contain any type of information, including your school's address, a note to parents, some HTML tags, or PowerSchool data codes.
1. On the Report Cards page, click the name of the report. 2. On the Report Card page, click Footer. The Report Card Footer page appears. 3. Use the following table to enter information in the fields:
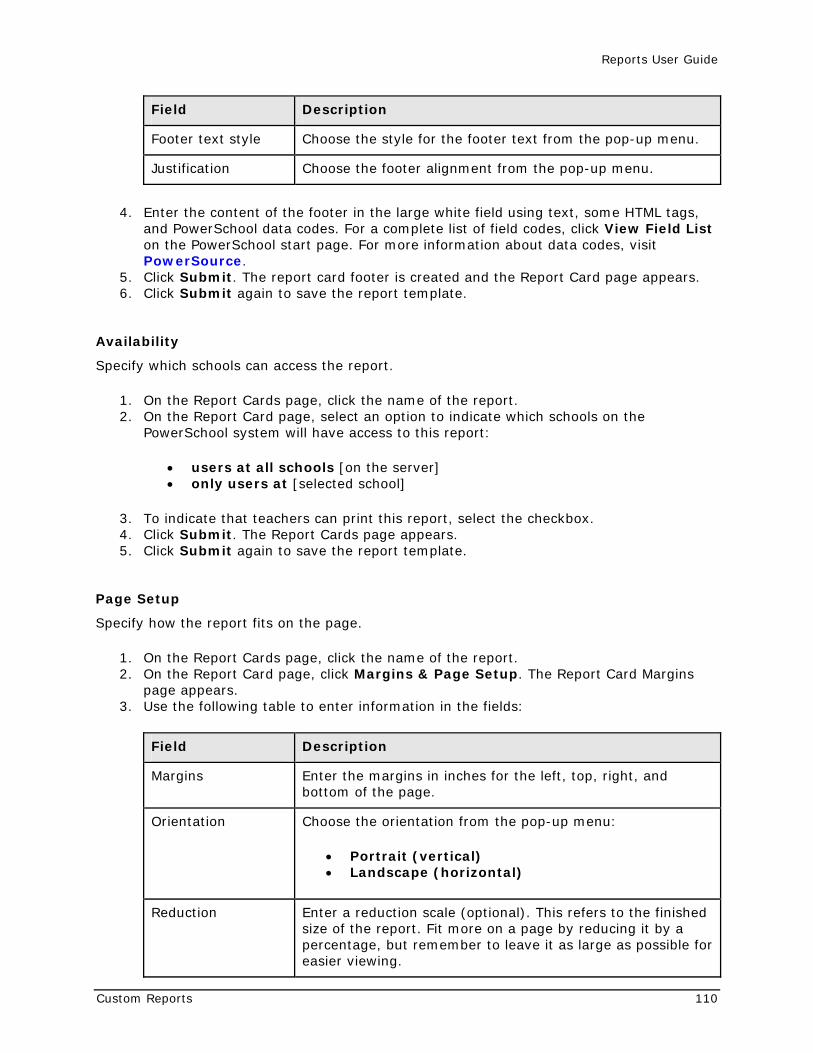
Reports User Guide
Custom Reports 110
Field Description
Footer text style Choose the style for the footer text from the pop-up menu.
Justification Choose the footer alignment from the pop-up menu.
4. Enter the content of the footer in the large white field using text, some HTML tags, and PowerSchool data codes. For a complete list of field codes, click View Field List on the PowerSchool start page. For more information about data codes, visit PowerSource.
5. Click Submit. The report card footer is created and the Report Card page appears. 6. Click Submit again to save the report template.
Availability
Specify which schools can access the report.
1. On the Report Cards page, click the name of the report. 2. On the Report Card page, select an option to indicate which schools on the
PowerSchool system will have access to this report:
• users at all schools [on the server] • only users at [selected school]
3. To indicate that teachers can print this report, select the checkbox. 4. Click Submit. The Report Cards page appears. 5. Click Submit again to save the report template.
Page Setup
Specify how the report fits on the page.
1. On the Report Cards page, click the name of the report. 2. On the Report Card page, click Margins & Page Setup. The Report Card Margins
page appears. 3. Use the following table to enter information in the fields:
Field Description
Margins Enter the margins in inches for the left, top, right, and bottom of the page.
Orientation Choose the orientation from the pop-up menu:
• Portrait (vertical) • Landscape (horizontal)
Reduction Enter a reduction scale (optional). This refers to the finished size of the report. Fit more on a page by reducing it by a percentage, but remember to leave it as large as possible for easier viewing.
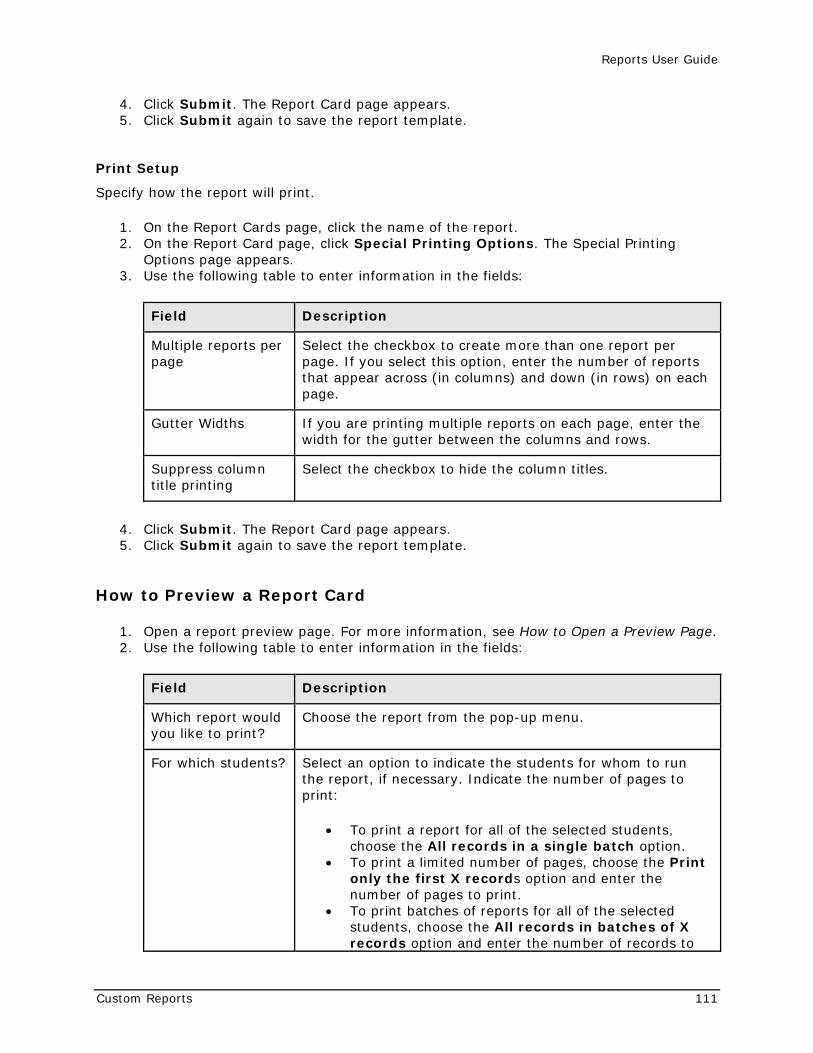
Reports User Guide
Custom Reports 111
4. Click Submit. The Report Card page appears. 5. Click Submit again to save the report template.
Print Setup
Specify how the report will print.
1. On the Report Cards page, click the name of the report. 2. On the Report Card page, click Special Printing Options. The Special Printing
Options page appears. 3. Use the following table to enter information in the fields:
Field Description
Multiple reports per page
Select the checkbox to create more than one report per page. If you select this option, enter the number of reports that appear across (in columns) and down (in rows) on each page.
Gutter Widths If you are printing multiple reports on each page, enter the width for the gutter between the columns and rows.
Suppress column title printing
Select the checkbox to hide the column titles.
4. Click Submit. The Report Card page appears. 5. Click Submit again to save the report template.
How to Preview a Report Card
1. Open a report preview page. For more information, see How to Open a Preview Page. 2. Use the following table to enter information in the fields:
Field Description
Which report would you like to print?
Choose the report from the pop-up menu.
For which students? Select an option to indicate the students for whom to run the report, if necessary. Indicate the number of pages to print:
• To print a report for all of the selected students, choose the All records in a single batch option.
• To print a limited number of pages, choose the Print only the first X records option and enter the number of pages to print.
• To print batches of reports for all of the selected students, choose the All records in batches of X records option and enter the number of records to
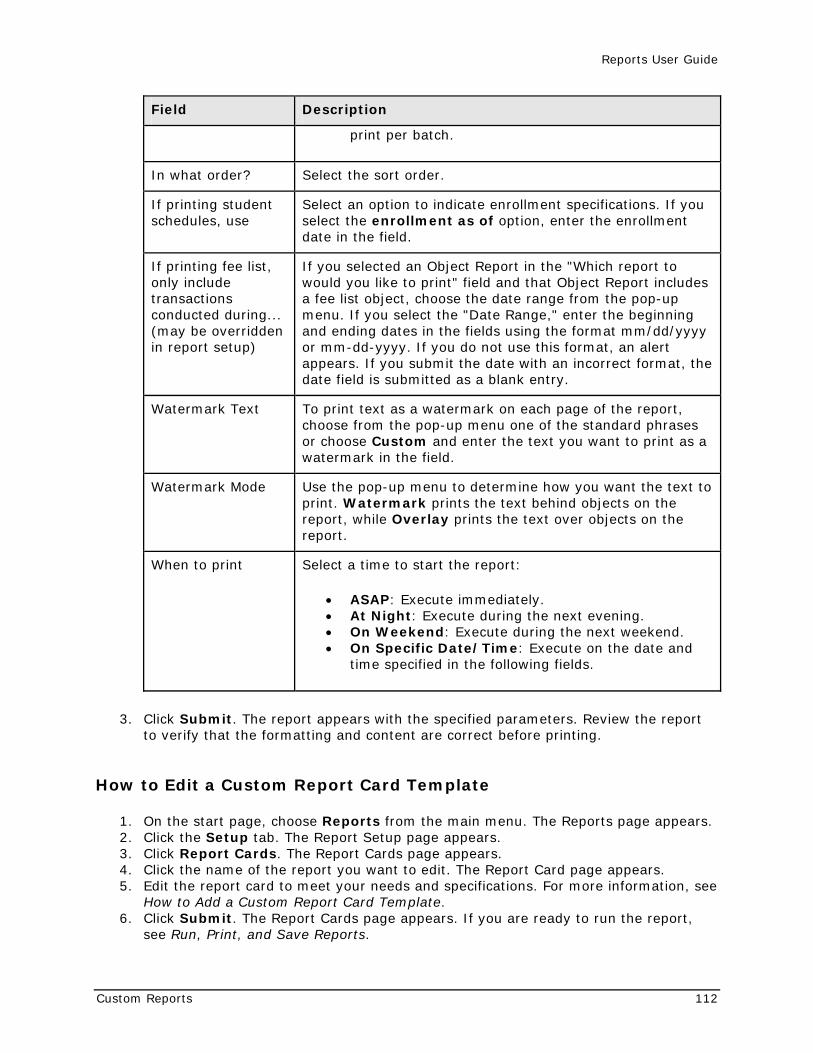
Reports User Guide
Custom Reports 112
Field Description
print per batch.
In what order? Select the sort order.
If printing student schedules, use
Select an option to indicate enrollment specifications. If you select the enrollment as of option, enter the enrollment date in the field.
If printing fee list, only include transactions conducted during... (may be overridden in report setup)
If you selected an Object Report in the "Which report to would you like to print" field and that Object Report includes a fee list object, choose the date range from the pop-up menu. If you select the "Date Range," enter the beginning and ending dates in the fields using the format mm/dd/yyyy or mm-dd-yyyy. If you do not use this format, an alert appears. If you submit the date with an incorrect format, the date field is submitted as a blank entry.
Watermark Text To print text as a watermark on each page of the report, choose from the pop-up menu one of the standard phrases or choose Custom and enter the text you want to print as a watermark in the field.
Watermark Mode Use the pop-up menu to determine how you want the text to print. Watermark prints the text behind objects on the report, while Overlay prints the text over objects on the report.
When to print Select a time to start the report:
• ASAP: Execute immediately. • At Night: Execute during the next evening. • On Weekend: Execute during the next weekend. • On Specific Date/Time: Execute on the date and
time specified in the following fields.
3. Click Submit. The report appears with the specified parameters. Review the report to verify that the formatting and content are correct before printing.
How to Edit a Custom Report Card Template
1. On the start page, choose Reports from the main menu. The Reports page appears. 2. Click the Setup tab. The Report Setup page appears. 3. Click Report Cards. The Report Cards page appears. 4. Click the name of the report you want to edit. The Report Card page appears. 5. Edit the report card to meet your needs and specifications. For more information, see
How to Add a Custom Report Card Template. 6. Click Submit. The Report Cards page appears. If you are ready to run the report,
see Run, Print, and Save Reports.
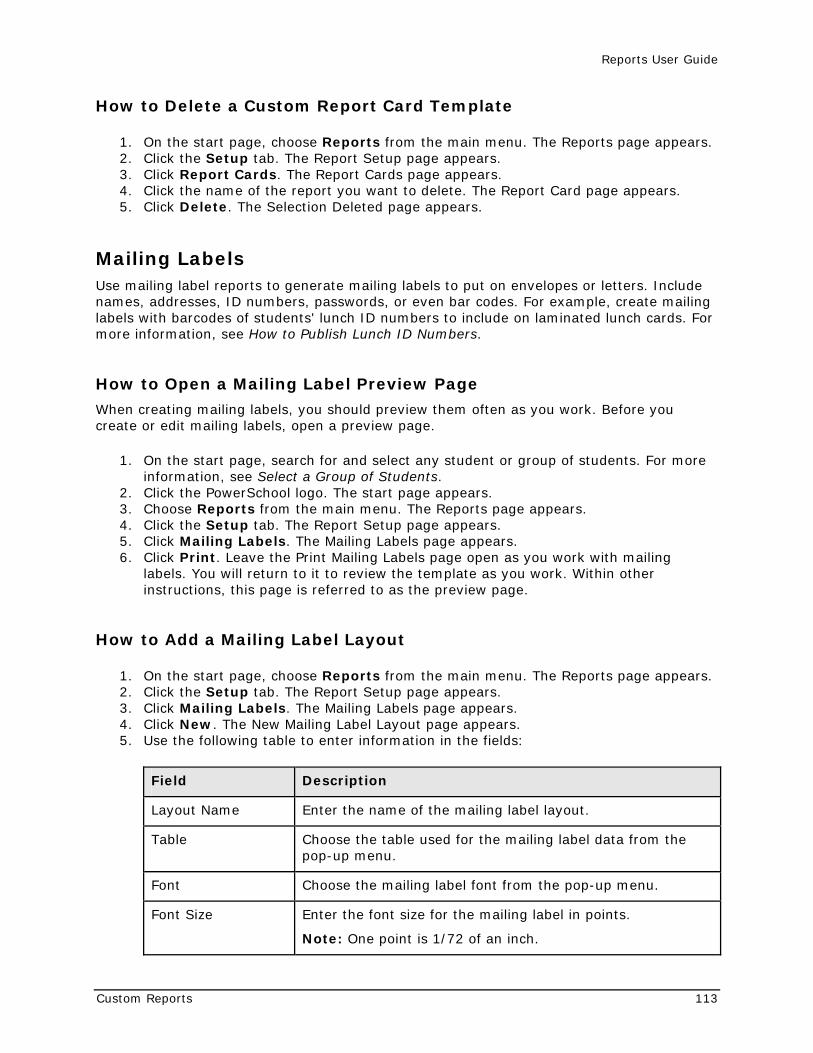
Reports User Guide
Custom Reports 113
How to Delete a Custom Report Card Template
1. On the start page, choose Reports from the main menu. The Reports page appears. 2. Click the Setup tab. The Report Setup page appears. 3. Click Report Cards. The Report Cards page appears. 4. Click the name of the report you want to delete. The Report Card page appears. 5. Click Delete. The Selection Deleted page appears.
Mailing Labels Use mailing label reports to generate mailing labels to put on envelopes or letters. Include names, addresses, ID numbers, passwords, or even bar codes. For example, create mailing labels with barcodes of students' lunch ID numbers to include on laminated lunch cards. For more information, see How to Publish Lunch ID Numbers.
How to Open a Mailing Label Preview Page
When creating mailing labels, you should preview them often as you work. Before you create or edit mailing labels, open a preview page.
1. On the start page, search for and select any student or group of students. For more information, see Select a Group of Students.
2. Click the PowerSchool logo. The start page appears. 3. Choose Reports from the main menu. The Reports page appears. 4. Click the Setup tab. The Report Setup page appears. 5. Click Mailing Labels. The Mailing Labels page appears. 6. Click Print. Leave the Print Mailing Labels page open as you work with mailing
labels. You will return to it to review the template as you work. Within other instructions, this page is referred to as the preview page.
How to Add a Mailing Label Layout
1. On the start page, choose Reports from the main menu. The Reports page appears. 2. Click the Setup tab. The Report Setup page appears. 3. Click Mailing Labels. The Mailing Labels page appears. 4. Click New. The New Mailing Label Layout page appears. 5. Use the following table to enter information in the fields:
Field Description
Layout Name Enter the name of the mailing label layout.
Table Choose the table used for the mailing label data from the pop-up menu.
Font Choose the mailing label font from the pop-up menu.
Font Size Enter the font size for the mailing label in points.
Note: One point is 1/72 of an inch.
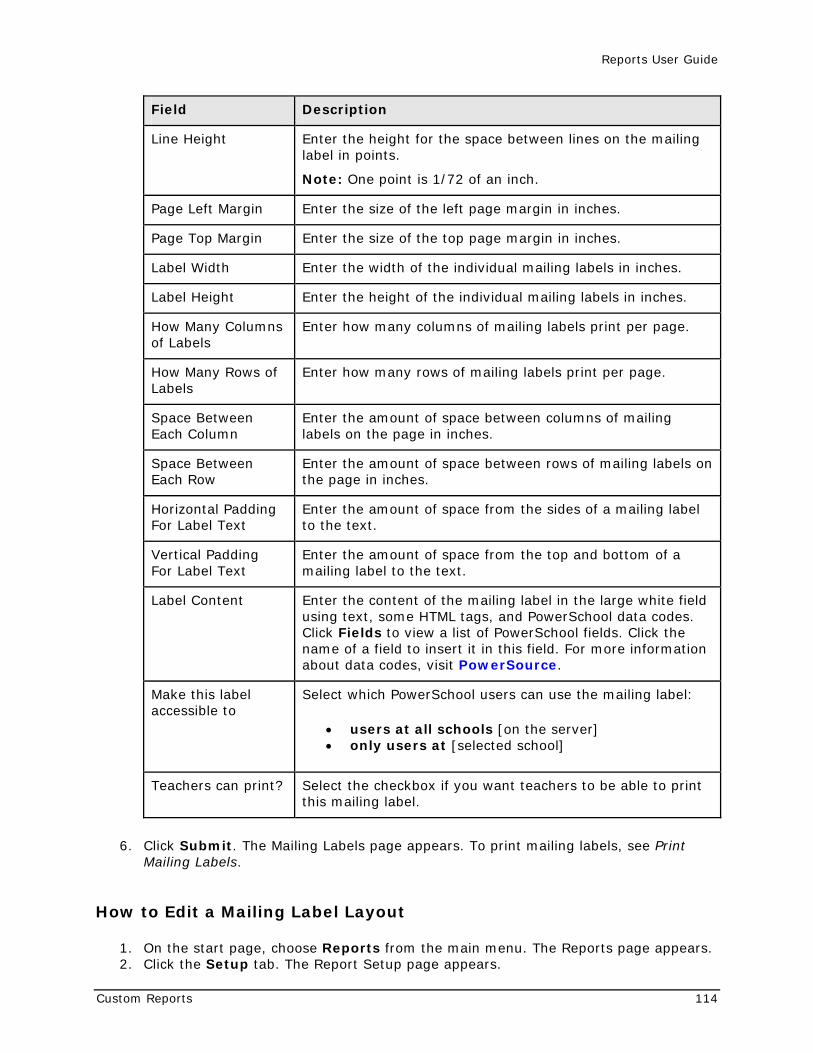
Reports User Guide
Custom Reports 114
Field Description
Line Height Enter the height for the space between lines on the mailing label in points.
Note: One point is 1/72 of an inch.
Page Left Margin Enter the size of the left page margin in inches.
Page Top Margin Enter the size of the top page margin in inches.
Label Width Enter the width of the individual mailing labels in inches.
Label Height Enter the height of the individual mailing labels in inches.
How Many Columns of Labels
Enter how many columns of mailing labels print per page.
How Many Rows of Labels
Enter how many rows of mailing labels print per page.
Space Between Each Column
Enter the amount of space between columns of mailing labels on the page in inches.
Space Between Each Row
Enter the amount of space between rows of mailing labels on the page in inches.
Horizontal Padding For Label Text
Enter the amount of space from the sides of a mailing label to the text.
Vertical Padding For Label Text
Enter the amount of space from the top and bottom of a mailing label to the text.
Label Content Enter the content of the mailing label in the large white field using text, some HTML tags, and PowerSchool data codes. Click Fields to view a list of PowerSchool fields. Click the name of a field to insert it in this field. For more information about data codes, visit PowerSource.
Make this label accessible to
Select which PowerSchool users can use the mailing label:
• users at all schools [on the server] • only users at [selected school]
Teachers can print? Select the checkbox if you want teachers to be able to print this mailing label.
6. Click Submit. The Mailing Labels page appears. To print mailing labels, see Print Mailing Labels.
How to Edit a Mailing Label Layout
1. On the start page, choose Reports from the main menu. The Reports page appears. 2. Click the Setup tab. The Report Setup page appears.
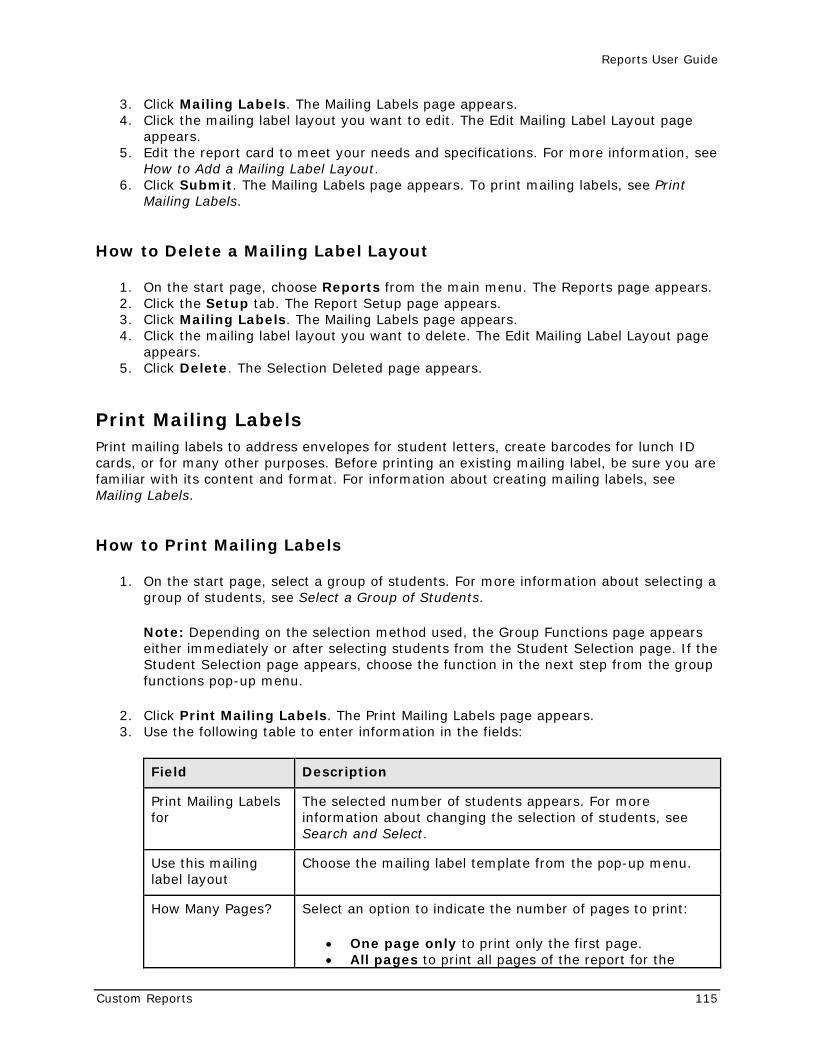
Reports User Guide
Custom Reports 115
3. Click Mailing Labels. The Mailing Labels page appears. 4. Click the mailing label layout you want to edit. The Edit Mailing Label Layout page
appears. 5. Edit the report card to meet your needs and specifications. For more information, see
How to Add a Mailing Label Layout. 6. Click Submit. The Mailing Labels page appears. To print mailing labels, see Print
Mailing Labels.
How to Delete a Mailing Label Layout
1. On the start page, choose Reports from the main menu. The Reports page appears. 2. Click the Setup tab. The Report Setup page appears. 3. Click Mailing Labels. The Mailing Labels page appears. 4. Click the mailing label layout you want to delete. The Edit Mailing Label Layout page
appears. 5. Click Delete. The Selection Deleted page appears.
Print Mailing Labels Print mailing labels to address envelopes for student letters, create barcodes for lunch ID cards, or for many other purposes. Before printing an existing mailing label, be sure you are familiar with its content and format. For information about creating mailing labels, see Mailing Labels.
How to Print Mailing Labels
1. On the start page, select a group of students. For more information about selecting a group of students, see Select a Group of Students.
Note: Depending on the selection method used, the Group Functions page appears either immediately or after selecting students from the Student Selection page. If the Student Selection page appears, choose the function in the next step from the group functions pop-up menu.
2. Click Print Mailing Labels. The Print Mailing Labels page appears. 3. Use the following table to enter information in the fields:
Field Description
Print Mailing Labels for
The selected number of students appears. For more information about changing the selection of students, see Search and Select.
Use this mailing label layout
Choose the mailing label template from the pop-up menu.
How Many Pages? Select an option to indicate the number of pages to print:
• One page only to print only the first page. • All pages to print all pages of the report for the
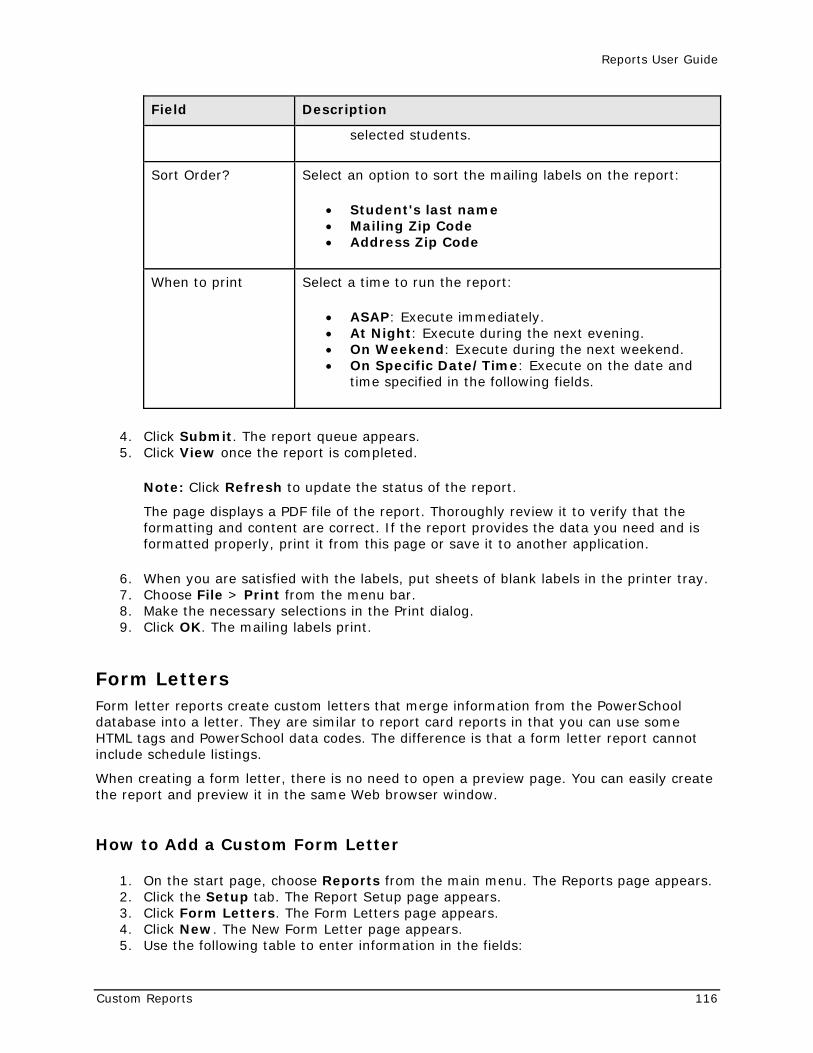
Reports User Guide
Custom Reports 116
Field Description
selected students.
Sort Order? Select an option to sort the mailing labels on the report:
• Student's last name • Mailing Zip Code • Address Zip Code
When to print Select a time to run the report:
• ASAP: Execute immediately. • At Night: Execute during the next evening. • On Weekend: Execute during the next weekend. • On Specific Date/Time: Execute on the date and
time specified in the following fields.
4. Click Submit. The report queue appears. 5. Click View once the report is completed.
Note: Click Refresh to update the status of the report.
The page displays a PDF file of the report. Thoroughly review it to verify that the formatting and content are correct. If the report provides the data you need and is formatted properly, print it from this page or save it to another application.
6. When you are satisfied with the labels, put sheets of blank labels in the printer tray. 7. Choose File > Print from the menu bar. 8. Make the necessary selections in the Print dialog. 9. Click OK. The mailing labels print.
Form Letters Form letter reports create custom letters that merge information from the PowerSchool database into a letter. They are similar to report card reports in that you can use some HTML tags and PowerSchool data codes. The difference is that a form letter report cannot include schedule listings.
When creating a form letter, there is no need to open a preview page. You can easily create the report and preview it in the same Web browser window.
How to Add a Custom Form Letter
1. On the start page, choose Reports from the main menu. The Reports page appears. 2. Click the Setup tab. The Report Setup page appears. 3. Click Form Letters. The Form Letters page appears. 4. Click New. The New Form Letter page appears. 5. Use the following table to enter information in the fields:
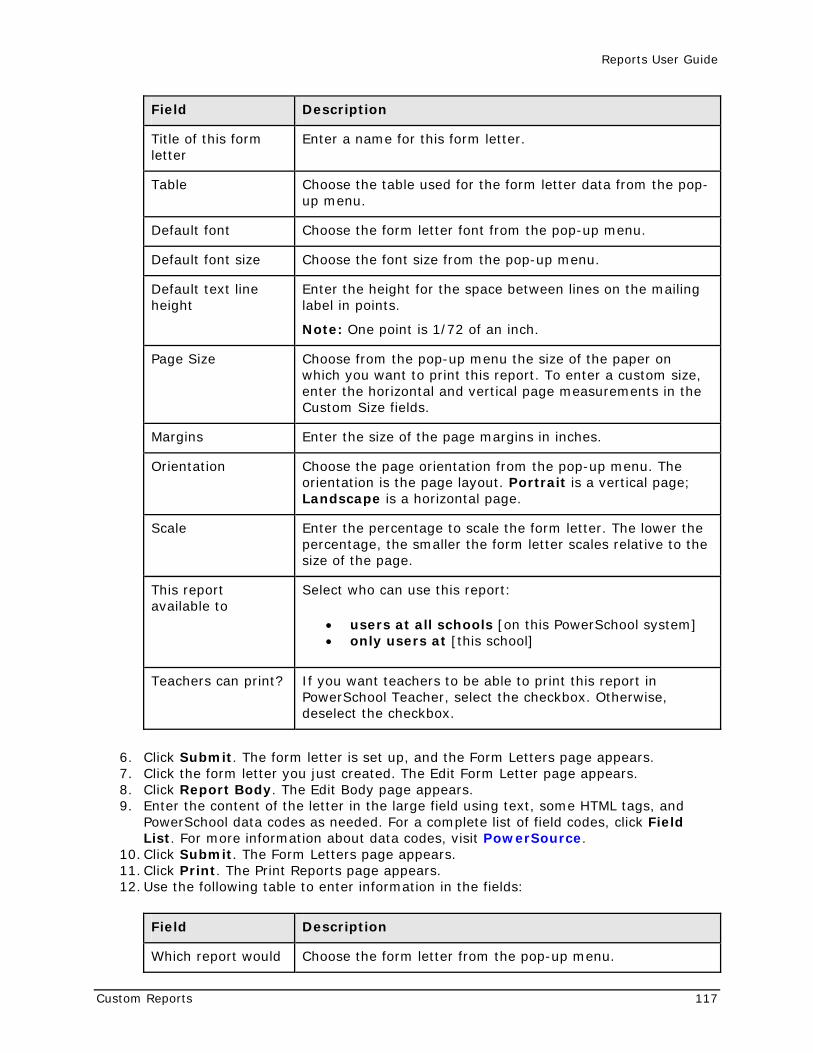
Reports User Guide
Custom Reports 117
Field Description
Title of this form letter
Enter a name for this form letter.
Table Choose the table used for the form letter data from the pop-up menu.
Default font Choose the form letter font from the pop-up menu.
Default font size Choose the font size from the pop-up menu.
Default text line height
Enter the height for the space between lines on the mailing label in points.
Note: One point is 1/72 of an inch.
Page Size Choose from the pop-up menu the size of the paper on which you want to print this report. To enter a custom size, enter the horizontal and vertical page measurements in the Custom Size fields.
Margins Enter the size of the page margins in inches.
Orientation Choose the page orientation from the pop-up menu. The orientation is the page layout. Portrait is a vertical page; Landscape is a horizontal page.
Scale Enter the percentage to scale the form letter. The lower the percentage, the smaller the form letter scales relative to the size of the page.
This report available to
Select who can use this report:
• users at all schools [on this PowerSchool system] • only users at [this school]
Teachers can print? If you want teachers to be able to print this report in PowerSchool Teacher, select the checkbox. Otherwise, deselect the checkbox.
6. Click Submit. The form letter is set up, and the Form Letters page appears. 7. Click the form letter you just created. The Edit Form Letter page appears. 8. Click Report Body. The Edit Body page appears. 9. Enter the content of the letter in the large field using text, some HTML tags, and
PowerSchool data codes as needed. For a complete list of field codes, click Field List. For more information about data codes, visit PowerSource.
10. Click Submit. The Form Letters page appears. 11. Click Print. The Print Reports page appears. 12. Use the following table to enter information in the fields:
Field Description
Which report would Choose the form letter from the pop-up menu.
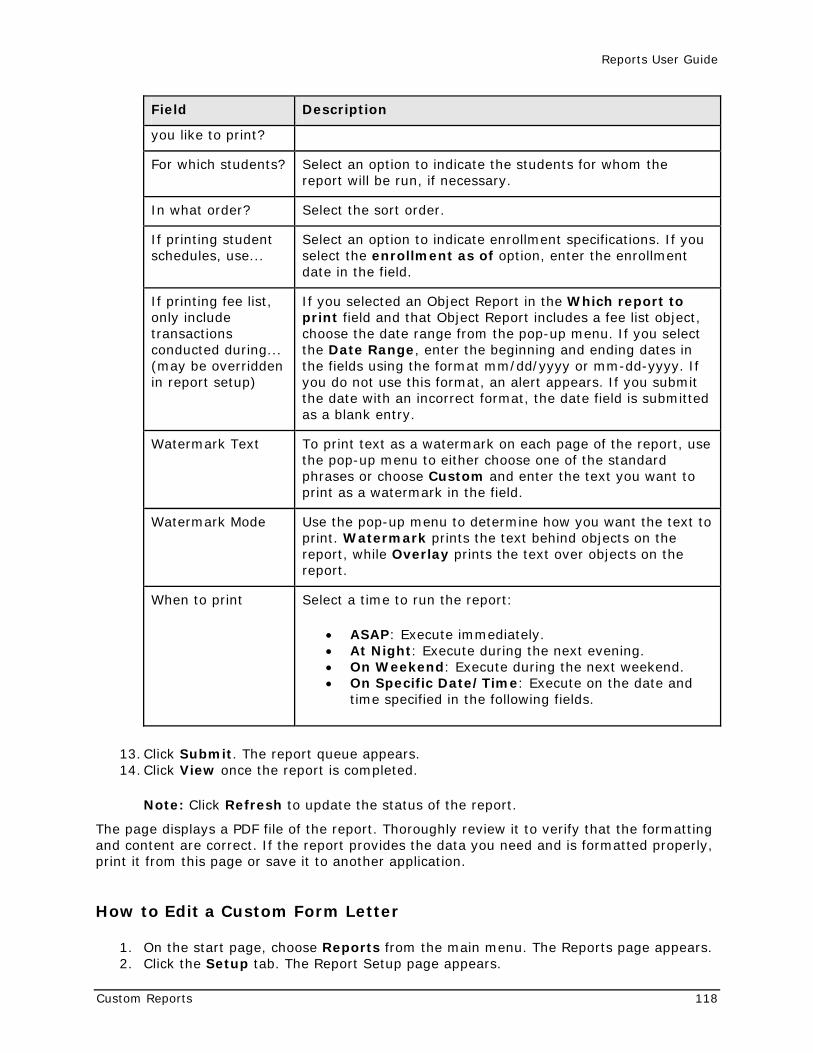
Reports User Guide
Custom Reports 118
Field Description
you like to print?
For which students? Select an option to indicate the students for whom the report will be run, if necessary.
In what order? Select the sort order.
If printing student schedules, use...
Select an option to indicate enrollment specifications. If you select the enrollment as of option, enter the enrollment date in the field.
If printing fee list, only include transactions conducted during... (may be overridden in report setup)
If you selected an Object Report in the Which report to print field and that Object Report includes a fee list object, choose the date range from the pop-up menu. If you select the Date Range, enter the beginning and ending dates in the fields using the format mm/dd/yyyy or mm-dd-yyyy. If you do not use this format, an alert appears. If you submit the date with an incorrect format, the date field is submitted as a blank entry.
Watermark Text To print text as a watermark on each page of the report, use the pop-up menu to either choose one of the standard phrases or choose Custom and enter the text you want to print as a watermark in the field.
Watermark Mode Use the pop-up menu to determine how you want the text to print. Watermark prints the text behind objects on the report, while Overlay prints the text over objects on the report.
When to print Select a time to run the report:
• ASAP: Execute immediately. • At Night: Execute during the next evening. • On Weekend: Execute during the next weekend. • On Specific Date/Time: Execute on the date and
time specified in the following fields.
13. Click Submit. The report queue appears. 14. Click View once the report is completed.
Note: Click Refresh to update the status of the report.
The page displays a PDF file of the report. Thoroughly review it to verify that the formatting and content are correct. If the report provides the data you need and is formatted properly, print it from this page or save it to another application.
How to Edit a Custom Form Letter
1. On the start page, choose Reports from the main menu. The Reports page appears. 2. Click the Setup tab. The Report Setup page appears.
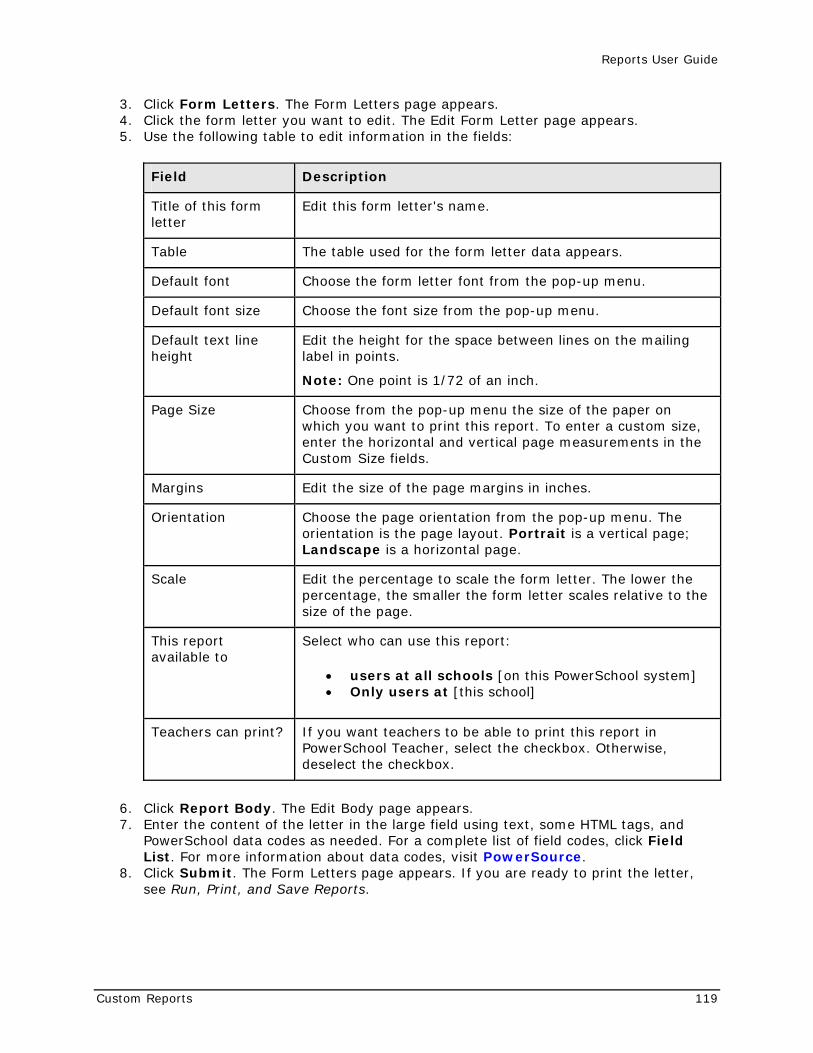
Reports User Guide
Custom Reports 119
3. Click Form Letters. The Form Letters page appears. 4. Click the form letter you want to edit. The Edit Form Letter page appears. 5. Use the following table to edit information in the fields:
Field Description
Title of this form letter
Edit this form letter's name.
Table The table used for the form letter data appears.
Default font Choose the form letter font from the pop-up menu.
Default font size Choose the font size from the pop-up menu.
Default text line height
Edit the height for the space between lines on the mailing label in points.
Note: One point is 1/72 of an inch.
Page Size Choose from the pop-up menu the size of the paper on which you want to print this report. To enter a custom size, enter the horizontal and vertical page measurements in the Custom Size fields.
Margins Edit the size of the page margins in inches.
Orientation Choose the page orientation from the pop-up menu. The orientation is the page layout. Portrait is a vertical page; Landscape is a horizontal page.
Scale Edit the percentage to scale the form letter. The lower the percentage, the smaller the form letter scales relative to the size of the page.
This report available to
Select who can use this report:
• users at all schools [on this PowerSchool system] • Only users at [this school]
Teachers can print? If you want teachers to be able to print this report in PowerSchool Teacher, select the checkbox. Otherwise, deselect the checkbox.
6. Click Report Body. The Edit Body page appears. 7. Enter the content of the letter in the large field using text, some HTML tags, and
PowerSchool data codes as needed. For a complete list of field codes, click Field List. For more information about data codes, visit PowerSource.
8. Click Submit. The Form Letters page appears. If you are ready to print the letter, see Run, Print, and Save Reports.
Reports User Guide
Custom Reports 120
How to Delete a Custom Form Letter
1. On the start page, choose Reports from the main menu. The Reports page appears. 2. Click the Setup tab. The Report Setup page appears. 3. Click Form Letters. The Form Letters page appears. 4. Click the name of the form letter you want to delete. The Edit Form Letter page
appears. 5. Click Delete. The Selection Deleted page appears.
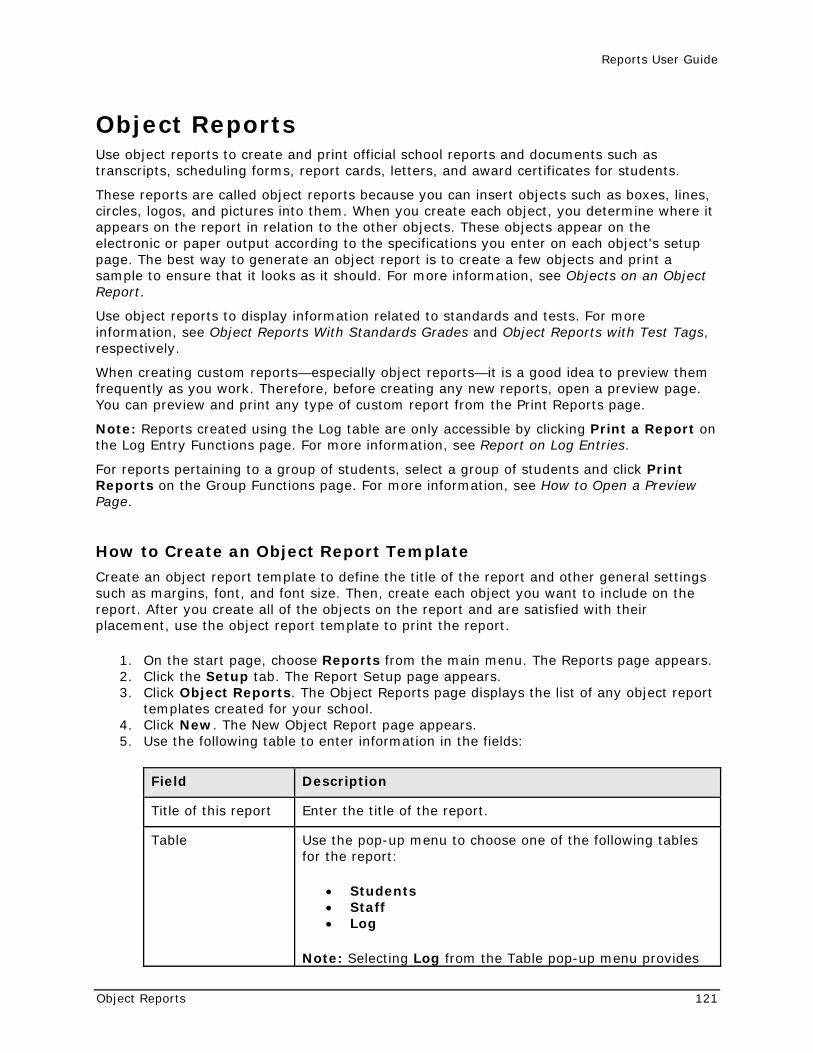
Reports User Guide
Object Reports 121
Object Reports Use object reports to create and print official school reports and documents such as transcripts, scheduling forms, report cards, letters, and award certificates for students.
These reports are called object reports because you can insert objects such as boxes, lines, circles, logos, and pictures into them. When you create each object, you determine where it appears on the report in relation to the other objects. These objects appear on the electronic or paper output according to the specifications you enter on each object's setup page. The best way to generate an object report is to create a few objects and print a sample to ensure that it looks as it should. For more information, see Objects on an Object Report.
Use object reports to display information related to standards and tests. For more information, see Object Reports With Standards Grades and Object Reports with Test Tags, respectively.
When creating custom reports—especially object reports—it is a good idea to preview them frequently as you work. Therefore, before creating any new reports, open a preview page. You can preview and print any type of custom report from the Print Reports page.
Note: Reports created using the Log table are only accessible by clicking Print a Report on the Log Entry Functions page. For more information, see Report on Log Entries.
For reports pertaining to a group of students, select a group of students and click Print Reports on the Group Functions page. For more information, see How to Open a Preview Page.
How to Create an Object Report Template
Create an object report template to define the title of the report and other general settings such as margins, font, and font size. Then, create each object you want to include on the report. After you create all of the objects on the report and are satisfied with their placement, use the object report template to print the report.
1. On the start page, choose Reports from the main menu. The Reports page appears. 2. Click the Setup tab. The Report Setup page appears. 3. Click Object Reports. The Object Reports page displays the list of any object report
templates created for your school. 4. Click New. The New Object Report page appears. 5. Use the following table to enter information in the fields:
Field Description
Title of this report Enter the title of the report.
Table Use the pop-up menu to choose one of the following tables for the report:
• Students • Staff • Log
Note: Selecting Log from the Table pop-up menu provides
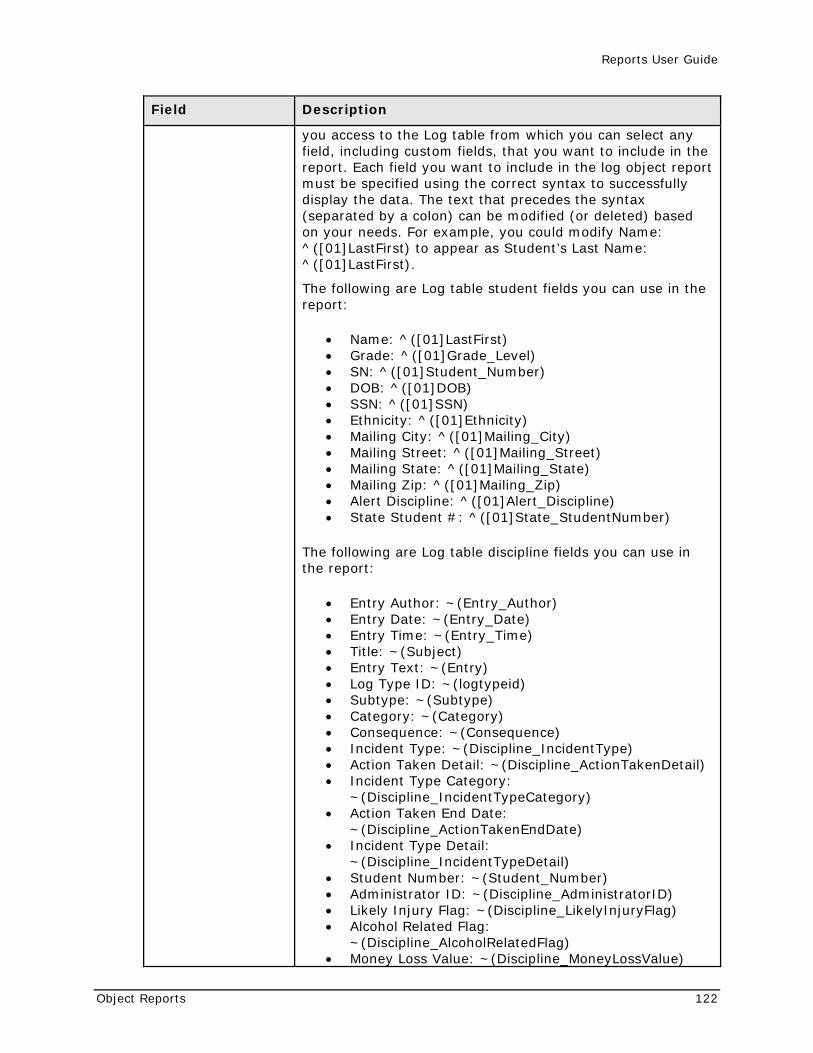
Reports User Guide
Object Reports 122
Field Description
you access to the Log table from which you can select any field, including custom fields, that you want to include in the report. Each field you want to include in the log object report must be specified using the correct syntax to successfully display the data. The text that precedes the syntax (separated by a colon) can be modified (or deleted) based on your needs. For example, you could modify Name: ^([01]LastFirst) to appear as Student’s Last Name: ^([01]LastFirst).
The following are Log table student fields you can use in the report:
• Name: ^([01]LastFirst) • Grade: ^([01]Grade_Level) • SN: ^([01]Student_Number) • DOB: ^([01]DOB) • SSN: ^([01]SSN) • Ethnicity: ^([01]Ethnicity) • Mailing City: ^([01]Mailing_City) • Mailing Street: ^([01]Mailing_Street) • Mailing State: ^([01]Mailing_State) • Mailing Zip: ^([01]Mailing_Zip) • Alert Discipline: ^([01]Alert_Discipline) • State Student #: ^([01]State_StudentNumber)
The following are Log table discipline fields you can use in the report:
• Entry Author: ~(Entry_Author) • Entry Date: ~(Entry_Date) • Entry Time: ~(Entry_Time) • Title: ~(Subject) • Entry Text: ~(Entry) • Log Type ID: ~(logtypeid) • Subtype: ~(Subtype) • Category: ~(Category) • Consequence: ~(Consequence) • Incident Type: ~(Discipline_IncidentType) • Action Taken Detail: ~(Discipline_ActionTakenDetail) • Incident Type Category:
~(Discipline_IncidentTypeCategory) • Action Taken End Date:
~(Discipline_ActionTakenEndDate) • Incident Type Detail:
~(Discipline_IncidentTypeDetail) • Student Number: ~(Student_Number) • Administrator ID: ~(Discipline_AdministratorID) • Likely Injury Flag: ~(Discipline_LikelyInjuryFlag) • Alcohol Related Flag:
~(Discipline_AlcoholRelatedFlag) • Money Loss Value: ~(Discipline_MoneyLossValue)
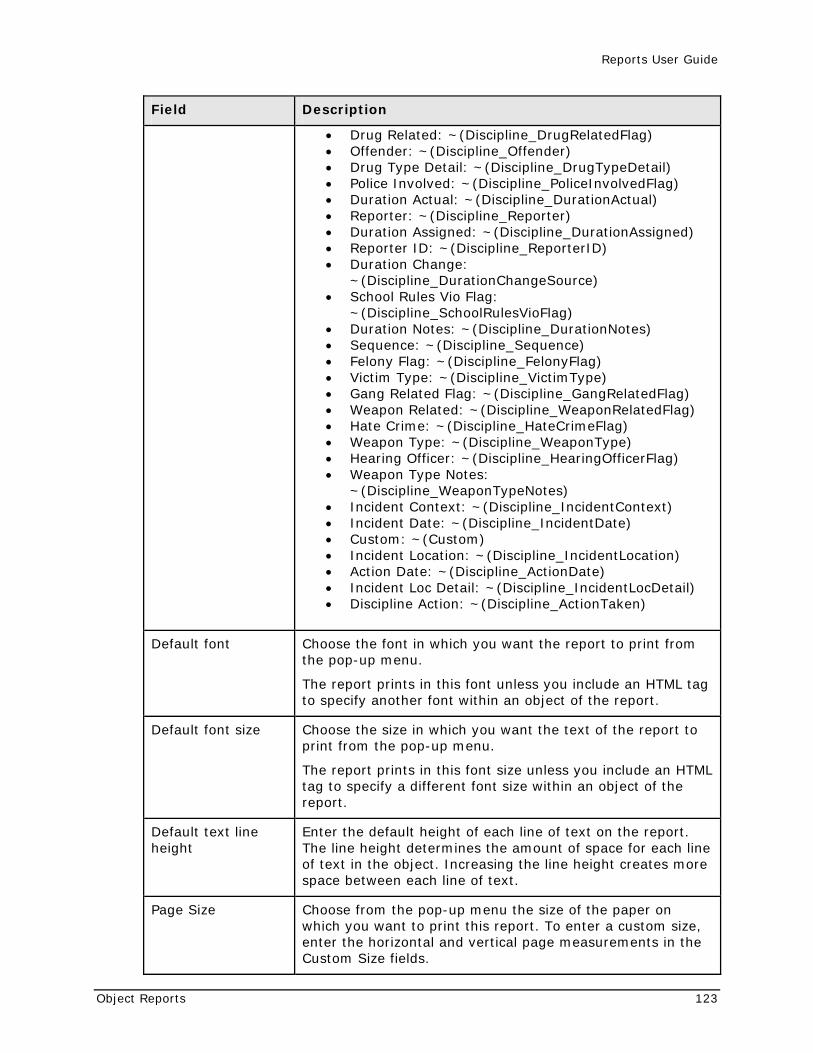
Reports User Guide
Object Reports 123
Field Description
• Drug Related: ~(Discipline_DrugRelatedFlag) • Offender: ~(Discipline_Offender) • Drug Type Detail: ~(Discipline_DrugTypeDetail) • Police Involved: ~(Discipline_PoliceInvolvedFlag) • Duration Actual: ~(Discipline_DurationActual) • Reporter: ~(Discipline_Reporter) • Duration Assigned: ~(Discipline_DurationAssigned) • Reporter ID: ~(Discipline_ReporterID) • Duration Change:
~(Discipline_DurationChangeSource) • School Rules Vio Flag:
~(Discipline_SchoolRulesVioFlag) • Duration Notes: ~(Discipline_DurationNotes) • Sequence: ~(Discipline_Sequence) • Felony Flag: ~(Discipline_FelonyFlag) • Victim Type: ~(Discipline_VictimType) • Gang Related Flag: ~(Discipline_GangRelatedFlag) • Weapon Related: ~(Discipline_WeaponRelatedFlag) • Hate Crime: ~(Discipline_HateCrimeFlag) • Weapon Type: ~(Discipline_WeaponType) • Hearing Officer: ~(Discipline_HearingOfficerFlag) • Weapon Type Notes:
~(Discipline_WeaponTypeNotes) • Incident Context: ~(Discipline_IncidentContext) • Incident Date: ~(Discipline_IncidentDate) • Custom: ~(Custom) • Incident Location: ~(Discipline_IncidentLocation) • Action Date: ~(Discipline_ActionDate) • Incident Loc Detail: ~(Discipline_IncidentLocDetail) • Discipline Action: ~(Discipline_ActionTaken)
Default font Choose the font in which you want the report to print from the pop-up menu.
The report prints in this font unless you include an HTML tag to specify another font within an object of the report.
Default font size Choose the size in which you want the text of the report to print from the pop-up menu.
The report prints in this font size unless you include an HTML tag to specify a different font size within an object of the report.
Default text line height
Enter the default height of each line of text on the report. The line height determines the amount of space for each line of text in the object. Increasing the line height creates more space between each line of text.
Page Size Choose from the pop-up menu the size of the paper on which you want to print this report. To enter a custom size, enter the horizontal and vertical page measurements in the Custom Size fields.
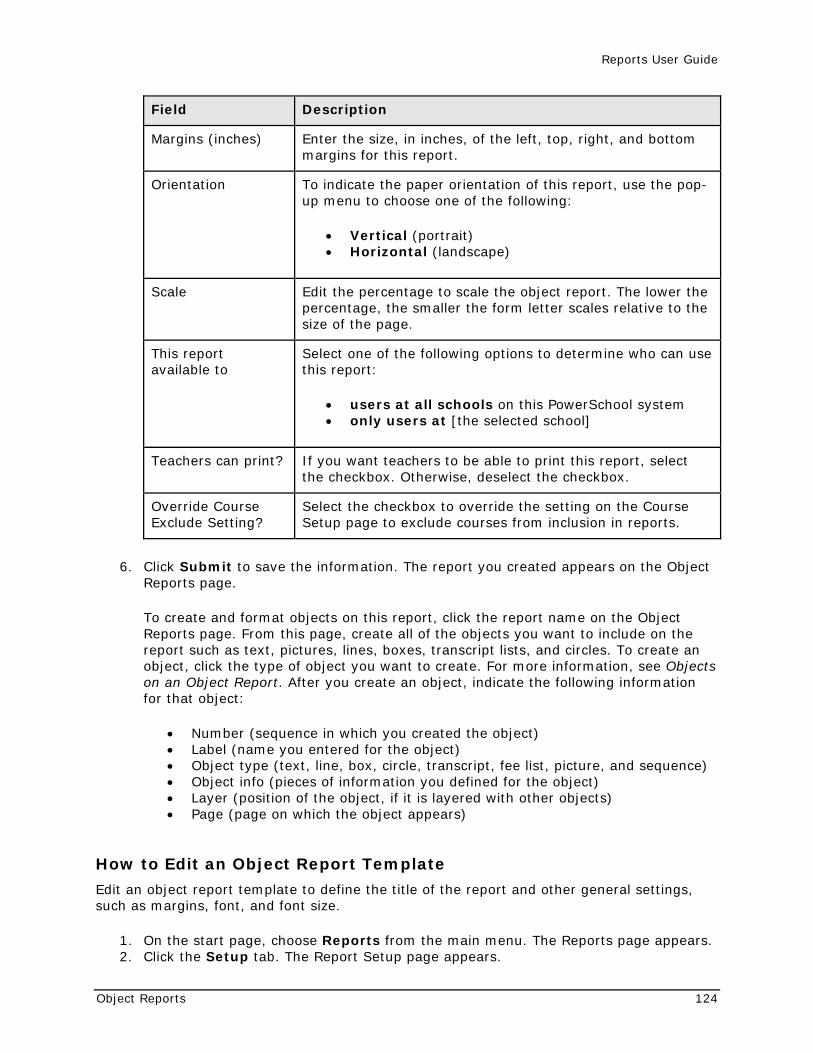
Reports User Guide
Object Reports 124
Field Description
Margins (inches) Enter the size, in inches, of the left, top, right, and bottom margins for this report.
Orientation To indicate the paper orientation of this report, use the pop-up menu to choose one of the following:
• Vertical (portrait) • Horizontal (landscape)
Scale Edit the percentage to scale the object report. The lower the percentage, the smaller the form letter scales relative to the size of the page.
This report available to
Select one of the following options to determine who can use this report:
• users at all schools on this PowerSchool system • only users at [the selected school]
Teachers can print? If you want teachers to be able to print this report, select the checkbox. Otherwise, deselect the checkbox.
Override Course Exclude Setting?
Select the checkbox to override the setting on the Course Setup page to exclude courses from inclusion in reports.
6. Click Submit to save the information. The report you created appears on the Object Reports page.
To create and format objects on this report, click the report name on the Object Reports page. From this page, create all of the objects you want to include on the report such as text, pictures, lines, boxes, transcript lists, and circles. To create an object, click the type of object you want to create. For more information, see Objects on an Object Report. After you create an object, indicate the following information for that object:
• Number (sequence in which you created the object) • Label (name you entered for the object) • Object type (text, line, box, circle, transcript, fee list, picture, and sequence) • Object info (pieces of information you defined for the object) • Layer (position of the object, if it is layered with other objects) • Page (page on which the object appears)
How to Edit an Object Report Template
Edit an object report template to define the title of the report and other general settings, such as margins, font, and font size.
1. On the start page, choose Reports from the main menu. The Reports page appears. 2. Click the Setup tab. The Report Setup page appears.
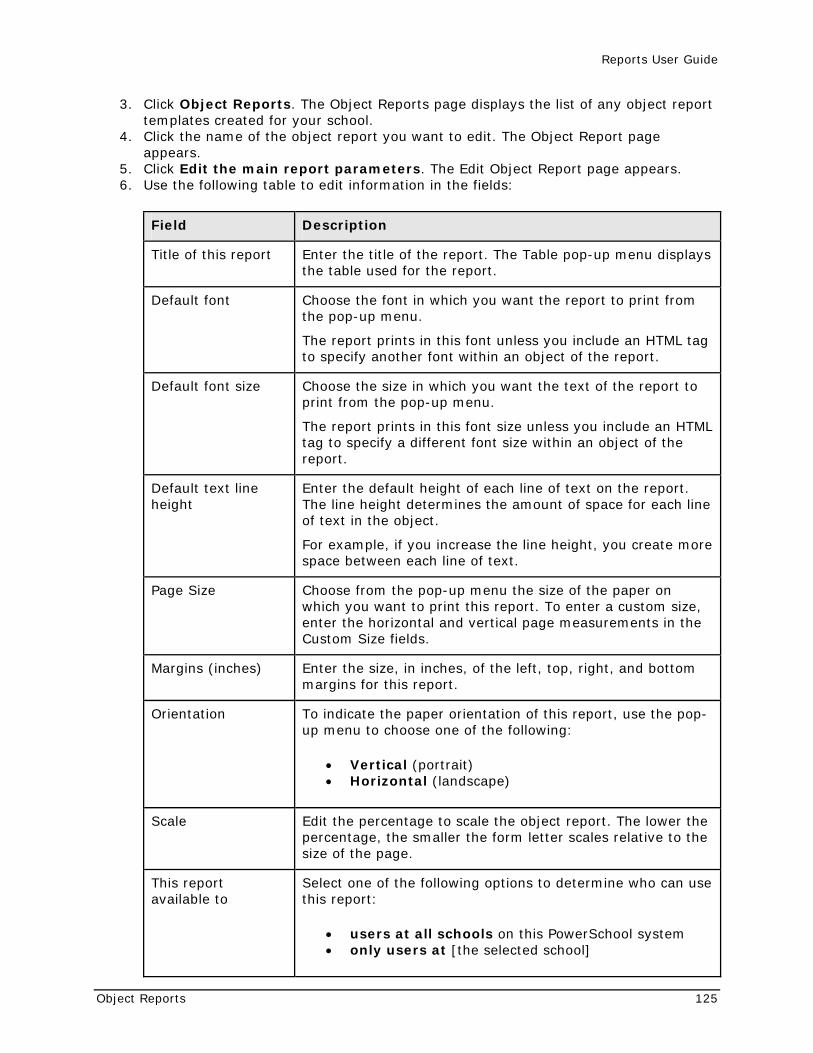
Reports User Guide
Object Reports 125
3. Click Object Reports. The Object Reports page displays the list of any object report templates created for your school.
4. Click the name of the object report you want to edit. The Object Report page appears.
5. Click Edit the main report parameters. The Edit Object Report page appears. 6. Use the following table to edit information in the fields:
Field Description
Title of this report Enter the title of the report. The Table pop-up menu displays the table used for the report.
Default font Choose the font in which you want the report to print from the pop-up menu.
The report prints in this font unless you include an HTML tag to specify another font within an object of the report.
Default font size Choose the size in which you want the text of the report to print from the pop-up menu.
The report prints in this font size unless you include an HTML tag to specify a different font size within an object of the report.
Default text line height
Enter the default height of each line of text on the report. The line height determines the amount of space for each line of text in the object.
For example, if you increase the line height, you create more space between each line of text.
Page Size Choose from the pop-up menu the size of the paper on which you want to print this report. To enter a custom size, enter the horizontal and vertical page measurements in the Custom Size fields.
Margins (inches) Enter the size, in inches, of the left, top, right, and bottom margins for this report.
Orientation To indicate the paper orientation of this report, use the pop-up menu to choose one of the following:
• Vertical (portrait) • Horizontal (landscape)
Scale Edit the percentage to scale the object report. The lower the percentage, the smaller the form letter scales relative to the size of the page.
This report available to
Select one of the following options to determine who can use this report:
• users at all schools on this PowerSchool system • only users at [the selected school]
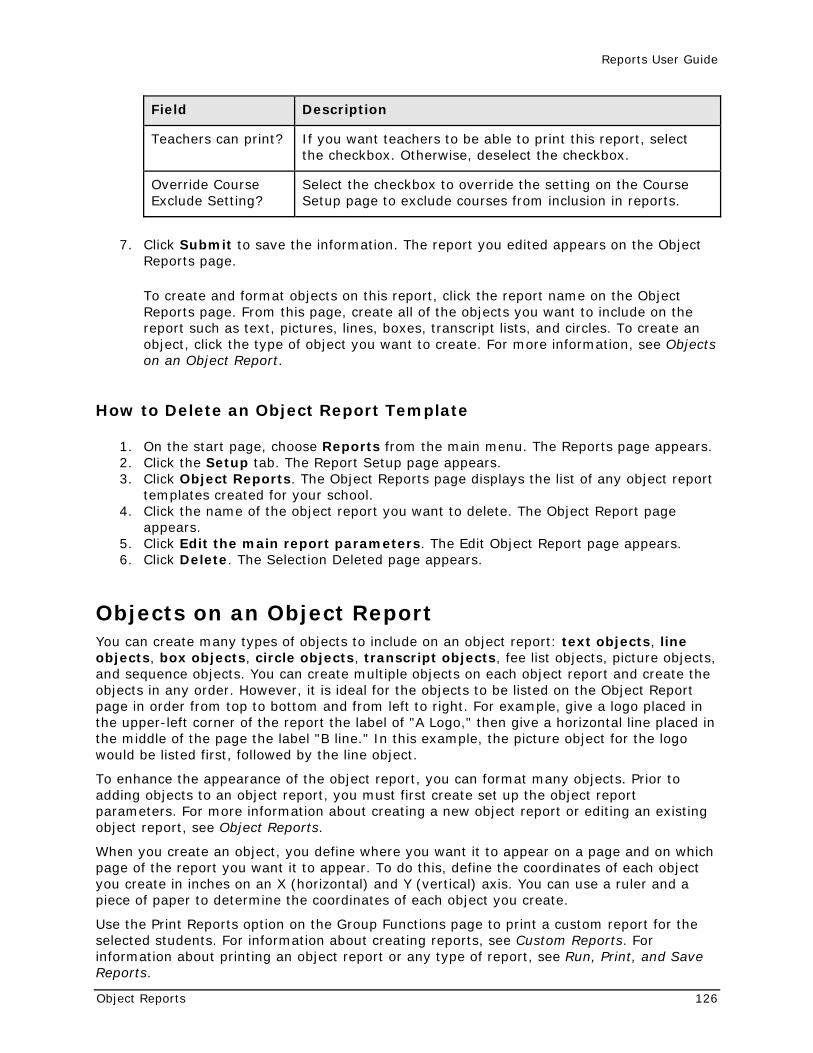
Reports User Guide
Object Reports 126
Field Description
Teachers can print? If you want teachers to be able to print this report, select the checkbox. Otherwise, deselect the checkbox.
Override Course Exclude Setting?
Select the checkbox to override the setting on the Course Setup page to exclude courses from inclusion in reports.
7. Click Submit to save the information. The report you edited appears on the Object Reports page.
To create and format objects on this report, click the report name on the Object Reports page. From this page, create all of the objects you want to include on the report such as text, pictures, lines, boxes, transcript lists, and circles. To create an object, click the type of object you want to create. For more information, see Objects on an Object Report.
How to Delete an Object Report Template
1. On the start page, choose Reports from the main menu. The Reports page appears. 2. Click the Setup tab. The Report Setup page appears. 3. Click Object Reports. The Object Reports page displays the list of any object report
templates created for your school. 4. Click the name of the object report you want to delete. The Object Report page
appears. 5. Click Edit the main report parameters. The Edit Object Report page appears. 6. Click Delete. The Selection Deleted page appears.
Objects on an Object Report You can create many types of objects to include on an object report: text objects, line objects, box objects, circle objects, transcript objects, fee list objects, picture objects, and sequence objects. You can create multiple objects on each object report and create the objects in any order. However, it is ideal for the objects to be listed on the Object Report page in order from top to bottom and from left to right. For example, give a logo placed in the upper-left corner of the report the label of "A Logo," then give a horizontal line placed in the middle of the page the label "B line." In this example, the picture object for the logo would be listed first, followed by the line object.
To enhance the appearance of the object report, you can format many objects. Prior to adding objects to an object report, you must first create set up the object report parameters. For more information about creating a new object report or editing an existing object report, see Object Reports.
When you create an object, you define where you want it to appear on a page and on which page of the report you want it to appear. To do this, define the coordinates of each object you create in inches on an X (horizontal) and Y (vertical) axis. You can use a ruler and a piece of paper to determine the coordinates of each object you create.
Use the Print Reports option on the Group Functions page to print a custom report for the selected students. For information about creating reports, see Custom Reports. For information about printing an object report or any type of report, see Run, Print, and Save Reports.
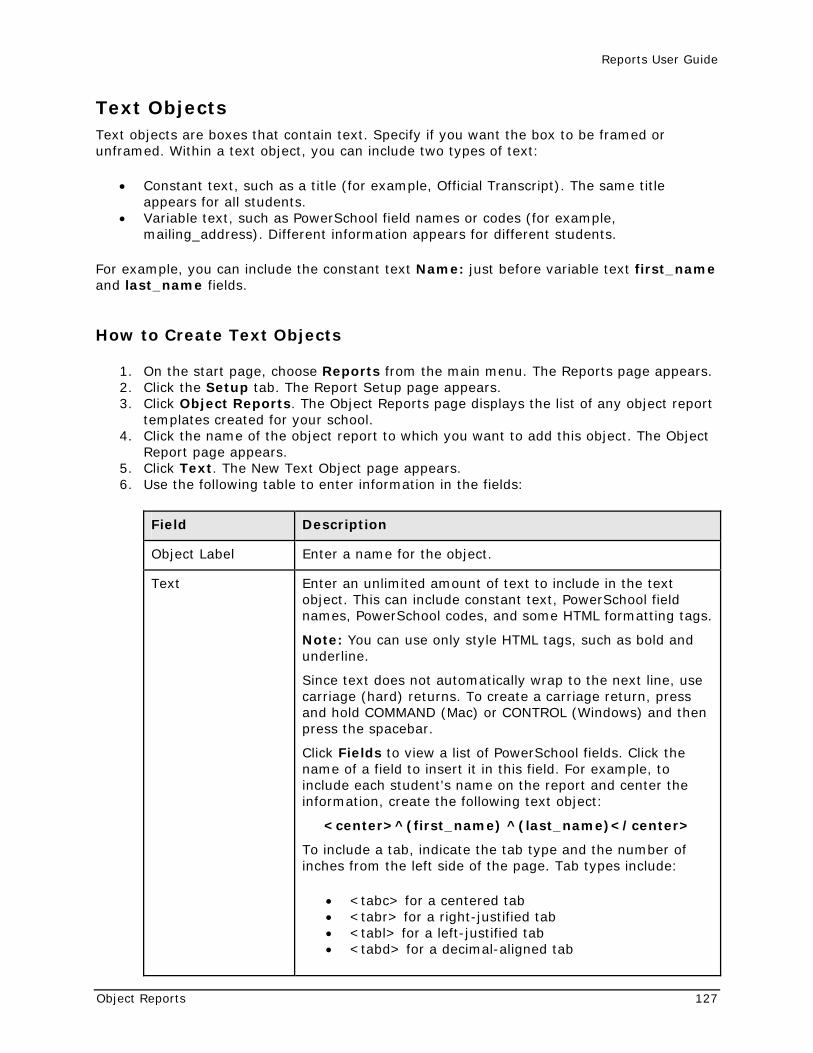
Reports User Guide
Object Reports 127
Text Objects Text objects are boxes that contain text. Specify if you want the box to be framed or unframed. Within a text object, you can include two types of text:
• Constant text, such as a title (for example, Official Transcript). The same title appears for all students.
• Variable text, such as PowerSchool field names or codes (for example, mailing_address). Different information appears for different students.
For example, you can include the constant text Name: just before variable text first_name and last_name fields.
How to Create Text Objects
1. On the start page, choose Reports from the main menu. The Reports page appears. 2. Click the Setup tab. The Report Setup page appears. 3. Click Object Reports. The Object Reports page displays the list of any object report
templates created for your school. 4. Click the name of the object report to which you want to add this object. The Object
Report page appears. 5. Click Text. The New Text Object page appears. 6. Use the following table to enter information in the fields:
Field Description
Object Label Enter a name for the object.
Text Enter an unlimited amount of text to include in the text object. This can include constant text, PowerSchool field names, PowerSchool codes, and some HTML formatting tags.
Note: You can use only style HTML tags, such as bold and underline.
Since text does not automatically wrap to the next line, use carriage (hard) returns. To create a carriage return, press and hold COMMAND (Mac) or CONTROL (Windows) and then press the spacebar.
Click Fields to view a list of PowerSchool fields. Click the name of a field to insert it in this field. For example, to include each student's name on the report and center the information, create the following text object:
<center>^(first_name) ^(last_name)</center>
To include a tab, indicate the tab type and the number of inches from the left side of the page. Tab types include:
• <tabc> for a centered tab • <tabr> for a right-justified tab • <tabl> for a left-justified tab • <tabd> for a decimal-aligned tab
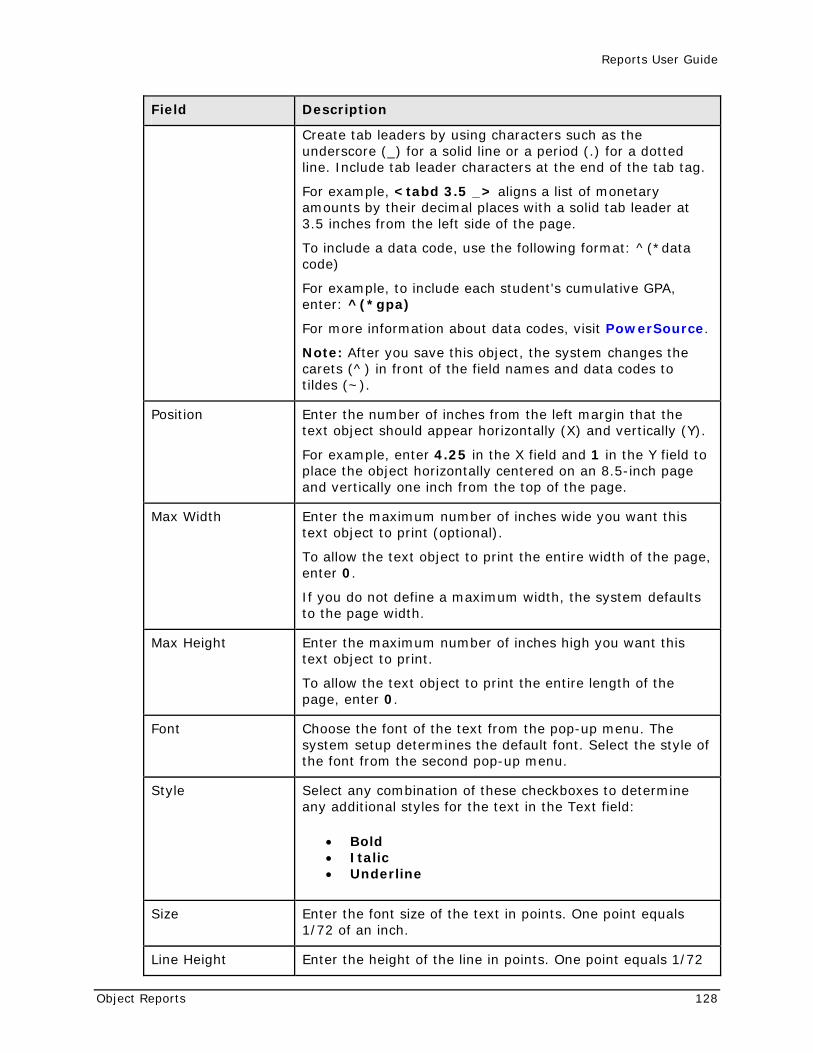
Reports User Guide
Object Reports 128
Field Description
Create tab leaders by using characters such as the underscore (_) for a solid line or a period (.) for a dotted line. Include tab leader characters at the end of the tab tag.
For example, <tabd 3.5 _> aligns a list of monetary amounts by their decimal places with a solid tab leader at 3.5 inches from the left side of the page.
To include a data code, use the following format: ^(*data code)
For example, to include each student's cumulative GPA, enter: ^(*gpa)
For more information about data codes, visit PowerSource.
Note: After you save this object, the system changes the carets (^) in front of the field names and data codes to tildes (~).
Position Enter the number of inches from the left margin that the text object should appear horizontally (X) and vertically (Y).
For example, enter 4.25 in the X field and 1 in the Y field to place the object horizontally centered on an 8.5-inch page and vertically one inch from the top of the page.
Max Width Enter the maximum number of inches wide you want this text object to print (optional).
To allow the text object to print the entire width of the page, enter 0.
If you do not define a maximum width, the system defaults to the page width.
Max Height Enter the maximum number of inches high you want this text object to print.
To allow the text object to print the entire length of the page, enter 0.
Font Choose the font of the text from the pop-up menu. The system setup determines the default font. Select the style of the font from the second pop-up menu.
Style Select any combination of these checkboxes to determine any additional styles for the text in the Text field:
• Bold • Italic • Underline
Size Enter the font size of the text in points. One point equals 1/72 of an inch.
Line Height Enter the height of the line in points. One point equals 1/72
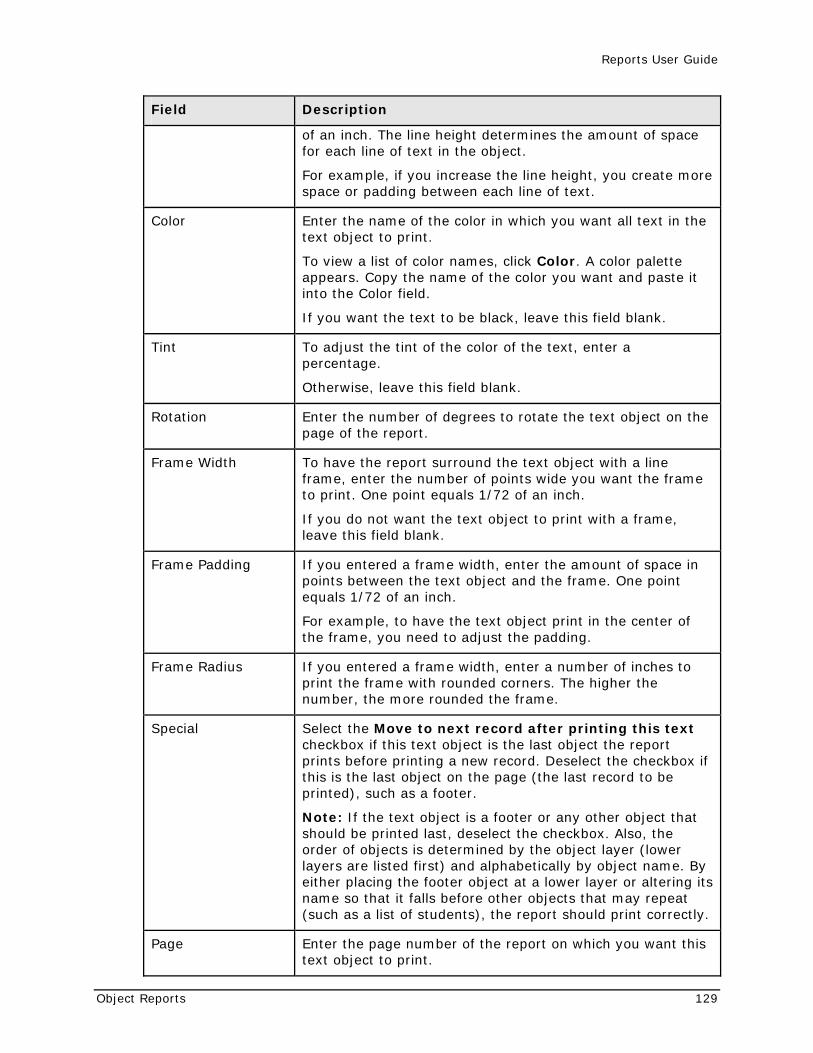
Reports User Guide
Object Reports 129
Field Description
of an inch. The line height determines the amount of space for each line of text in the object.
For example, if you increase the line height, you create more space or padding between each line of text.
Color Enter the name of the color in which you want all text in the text object to print.
To view a list of color names, click Color. A color palette appears. Copy the name of the color you want and paste it into the Color field.
If you want the text to be black, leave this field blank.
Tint To adjust the tint of the color of the text, enter a percentage.
Otherwise, leave this field blank.
Rotation Enter the number of degrees to rotate the text object on the page of the report.
Frame Width To have the report surround the text object with a line frame, enter the number of points wide you want the frame to print. One point equals 1/72 of an inch.
If you do not want the text object to print with a frame, leave this field blank.
Frame Padding If you entered a frame width, enter the amount of space in points between the text object and the frame. One point equals 1/72 of an inch.
For example, to have the text object print in the center of the frame, you need to adjust the padding.
Frame Radius If you entered a frame width, enter a number of inches to print the frame with rounded corners. The higher the number, the more rounded the frame.
Special Select the Move to next record after printing this text checkbox if this text object is the last object the report prints before printing a new record. Deselect the checkbox if this is the last object on the page (the last record to be printed), such as a footer.
Note: If the text object is a footer or any other object that should be printed last, deselect the checkbox. Also, the order of objects is determined by the object layer (lower layers are listed first) and alphabetically by object name. By either placing the footer object at a lower layer or altering its name so that it falls before other objects that may repeat (such as a list of students), the report should print correctly.
Page Enter the page number of the report on which you want this text object to print.
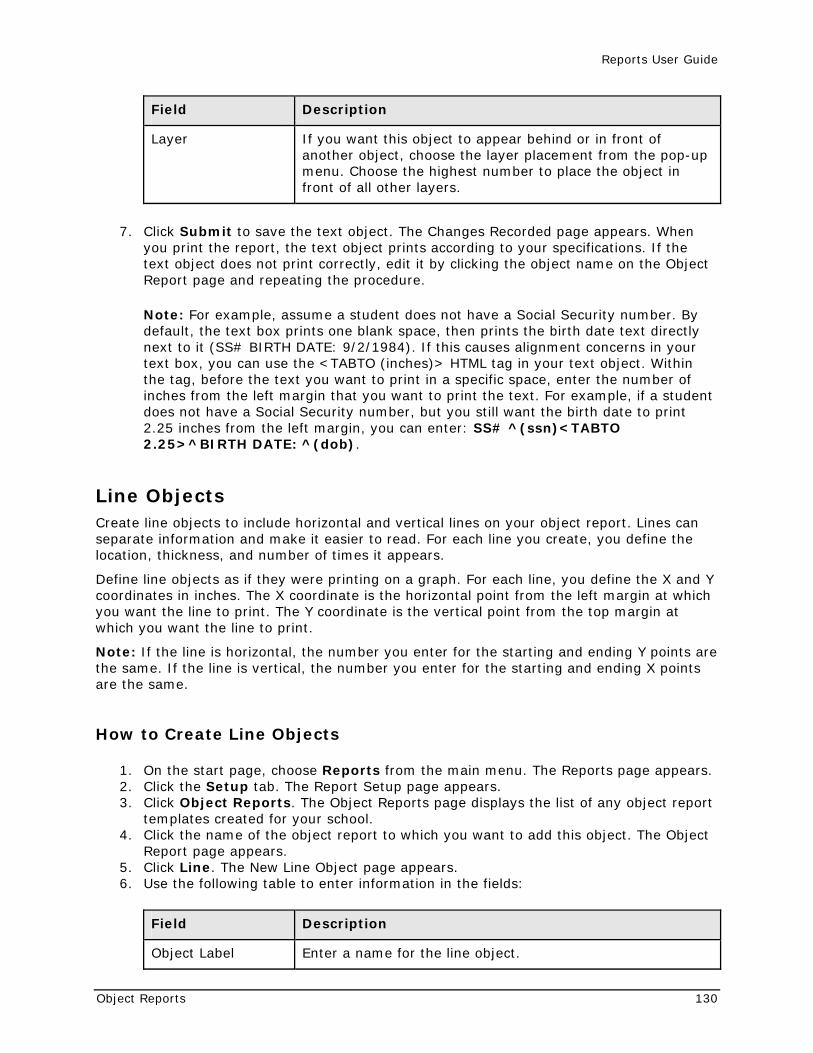
Reports User Guide
Object Reports 130
Field Description
Layer If you want this object to appear behind or in front of another object, choose the layer placement from the pop-up menu. Choose the highest number to place the object in front of all other layers.
7. Click Submit to save the text object. The Changes Recorded page appears. When you print the report, the text object prints according to your specifications. If the text object does not print correctly, edit it by clicking the object name on the Object Report page and repeating the procedure.
Note: For example, assume a student does not have a Social Security number. By default, the text box prints one blank space, then prints the birth date text directly next to it (SS# BIRTH DATE: 9/2/1984). If this causes alignment concerns in your text box, you can use the <TABTO (inches)> HTML tag in your text object. Within the tag, before the text you want to print in a specific space, enter the number of inches from the left margin that you want to print the text. For example, if a student does not have a Social Security number, but you still want the birth date to print 2.25 inches from the left margin, you can enter: SS# ^(ssn)<TABTO 2.25>^BIRTH DATE: ^(dob).
Line Objects Create line objects to include horizontal and vertical lines on your object report. Lines can separate information and make it easier to read. For each line you create, you define the location, thickness, and number of times it appears.
Define line objects as if they were printing on a graph. For each line, you define the X and Y coordinates in inches. The X coordinate is the horizontal point from the left margin at which you want the line to print. The Y coordinate is the vertical point from the top margin at which you want the line to print.
Note: If the line is horizontal, the number you enter for the starting and ending Y points are the same. If the line is vertical, the number you enter for the starting and ending X points are the same.
How to Create Line Objects
1. On the start page, choose Reports from the main menu. The Reports page appears. 2. Click the Setup tab. The Report Setup page appears. 3. Click Object Reports. The Object Reports page displays the list of any object report
templates created for your school. 4. Click the name of the object report to which you want to add this object. The Object
Report page appears. 5. Click Line. The New Line Object page appears. 6. Use the following table to enter information in the fields:
Field Description
Object Label Enter a name for the line object.
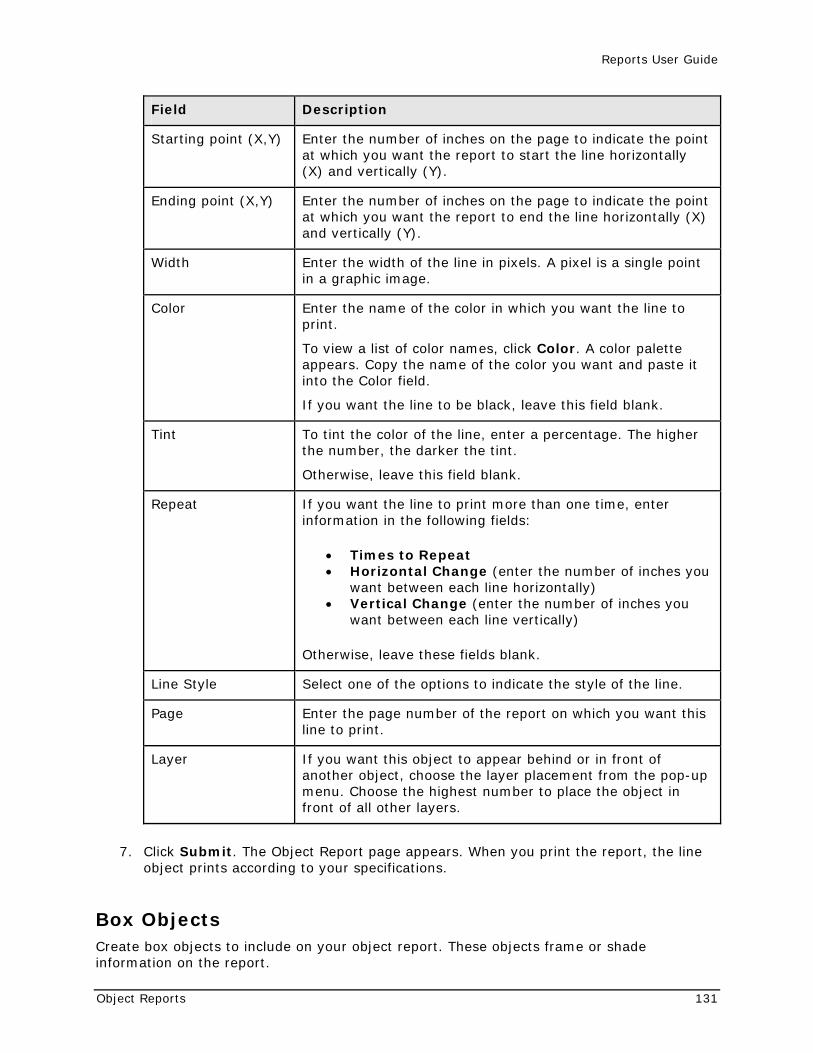
Reports User Guide
Object Reports 131
Field Description
Starting point (X,Y) Enter the number of inches on the page to indicate the point at which you want the report to start the line horizontally (X) and vertically (Y).
Ending point (X,Y) Enter the number of inches on the page to indicate the point at which you want the report to end the line horizontally (X) and vertically (Y).
Width Enter the width of the line in pixels. A pixel is a single point in a graphic image.
Color Enter the name of the color in which you want the line to print.
To view a list of color names, click Color. A color palette appears. Copy the name of the color you want and paste it into the Color field.
If you want the line to be black, leave this field blank.
Tint To tint the color of the line, enter a percentage. The higher the number, the darker the tint.
Otherwise, leave this field blank.
Repeat If you want the line to print more than one time, enter information in the following fields:
• Times to Repeat • Horizontal Change (enter the number of inches you
want between each line horizontally) • Vertical Change (enter the number of inches you
want between each line vertically)
Otherwise, leave these fields blank.
Line Style Select one of the options to indicate the style of the line.
Page Enter the page number of the report on which you want this line to print.
Layer If you want this object to appear behind or in front of another object, choose the layer placement from the pop-up menu. Choose the highest number to place the object in front of all other layers.
7. Click Submit. The Object Report page appears. When you print the report, the line object prints according to your specifications.
Box Objects Create box objects to include on your object report. These objects frame or shade information on the report.

Reports User Guide
Object Reports 132
How to Create Box Objects
1. On the start page, choose Reports from the main menu. The Reports page appears. 2. Click the Setup tab. The Report Setup page appears. 3. Click Object Reports. The Object Reports page displays the list of any object report
templates created for your school. 4. Click the name of the object report to which you want to add this object. The Object
Report page appears. 5. Click Box. The New Box Object page appears. 6. Use the following table to enter information in the fields:
Field Description
Object Label Enter a name for the box object.
Coordinates To determine where the box prints on the page, enter the number of inches from the left, top, right, and bottom margins you want the box to print.
Line width (frame) To print a frame around the box, define the width of the line and the percentage the line is shaded in points. One point equals 1/72 of an inch.
Line Color Enter the name of the color in which you want the line that prints around the box to print.
To view a list of color names, click Color. A color palette appears. Copy the name of the color you want and paste it into the Color field.
If you want the line to be black, leave this field blank.
Line Tint To tint the color of the line, enter a percentage.
Otherwise, leave this field blank.
Corner Radius Enter a number to indicate how round you want the corners of the box to be in inches. The greater the number, the rounder the corners.
Fill Color To shade or color inside the box, enter the name of the color. To view a list of color names, click Color. A color palette appears. Copy the name of the color you want and paste it into the Color field.
To view a list of color names, click the field name Color.
Fill Tint To tint the fill color of the box, enter a percentage.
Otherwise, leave this field blank.
Repeat If you want the box to print repeatedly, define information in the following fields:
• Times to Repeat • Horizontal Change (enter the number of inches you
want between each box horizontally)
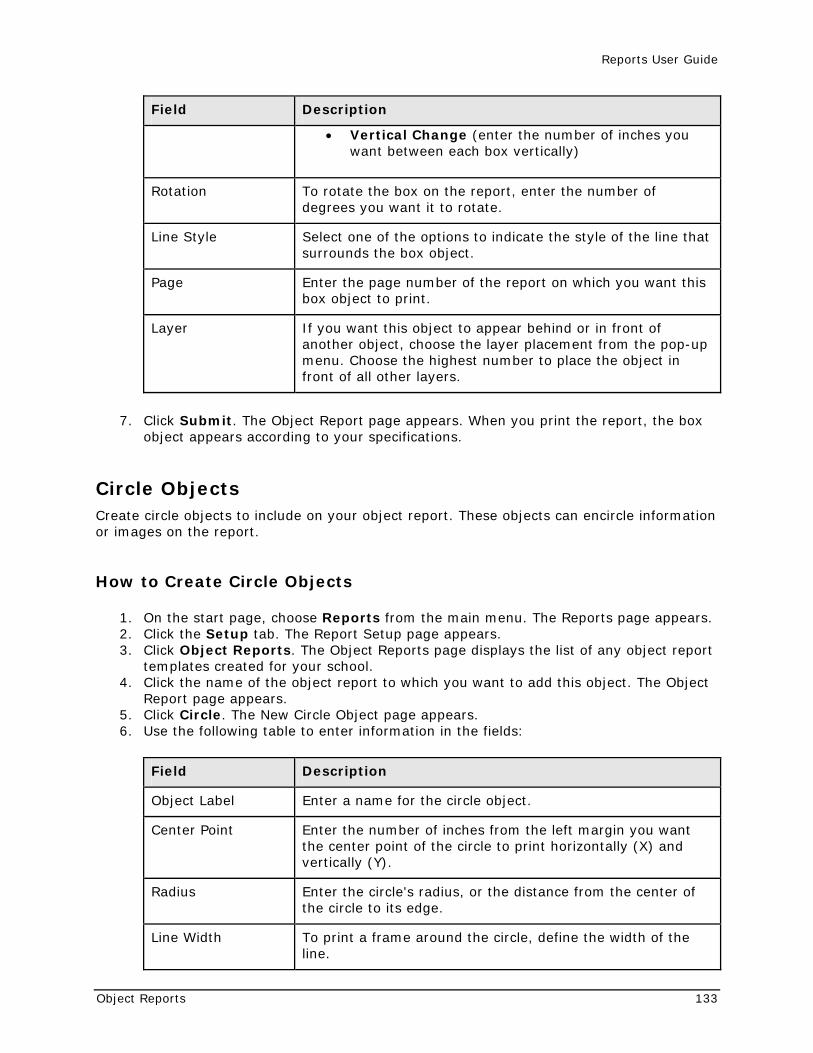
Reports User Guide
Object Reports 133
Field Description
• Vertical Change (enter the number of inches you want between each box vertically)
Rotation To rotate the box on the report, enter the number of degrees you want it to rotate.
Line Style Select one of the options to indicate the style of the line that surrounds the box object.
Page Enter the page number of the report on which you want this box object to print.
Layer If you want this object to appear behind or in front of another object, choose the layer placement from the pop-up menu. Choose the highest number to place the object in front of all other layers.
7. Click Submit. The Object Report page appears. When you print the report, the box object appears according to your specifications.
Circle Objects Create circle objects to include on your object report. These objects can encircle information or images on the report.
How to Create Circle Objects
1. On the start page, choose Reports from the main menu. The Reports page appears. 2. Click the Setup tab. The Report Setup page appears. 3. Click Object Reports. The Object Reports page displays the list of any object report
templates created for your school. 4. Click the name of the object report to which you want to add this object. The Object
Report page appears. 5. Click Circle. The New Circle Object page appears. 6. Use the following table to enter information in the fields:
Field Description
Object Label Enter a name for the circle object.
Center Point Enter the number of inches from the left margin you want the center point of the circle to print horizontally (X) and vertically (Y).
Radius Enter the circle's radius, or the distance from the center of the circle to its edge.
Line Width To print a frame around the circle, define the width of the line.
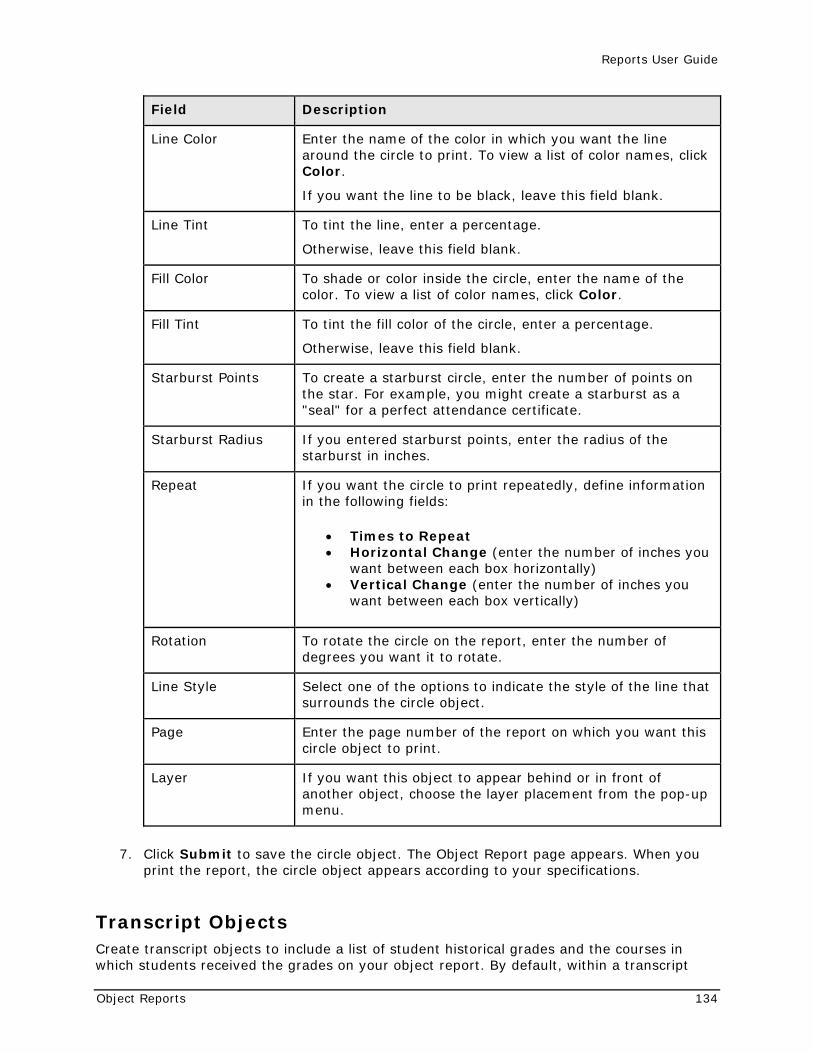
Reports User Guide
Object Reports 134
Field Description
Line Color Enter the name of the color in which you want the line around the circle to print. To view a list of color names, click Color.
If you want the line to be black, leave this field blank.
Line Tint To tint the line, enter a percentage.
Otherwise, leave this field blank.
Fill Color To shade or color inside the circle, enter the name of the color. To view a list of color names, click Color.
Fill Tint To tint the fill color of the circle, enter a percentage.
Otherwise, leave this field blank.
Starburst Points To create a starburst circle, enter the number of points on the star. For example, you might create a starburst as a "seal" for a perfect attendance certificate.
Starburst Radius If you entered starburst points, enter the radius of the starburst in inches.
Repeat If you want the circle to print repeatedly, define information in the following fields:
• Times to Repeat • Horizontal Change (enter the number of inches you
want between each box horizontally) • Vertical Change (enter the number of inches you
want between each box vertically)
Rotation To rotate the circle on the report, enter the number of degrees you want it to rotate.
Line Style Select one of the options to indicate the style of the line that surrounds the circle object.
Page Enter the page number of the report on which you want this circle object to print.
Layer If you want this object to appear behind or in front of another object, choose the layer placement from the pop-up menu.
7. Click Submit to save the circle object. The Object Report page appears. When you print the report, the circle object appears according to your specifications.
Transcript Objects Create transcript objects to include a list of student historical grades and the courses in which students received the grades on your object report. By default, within a transcript
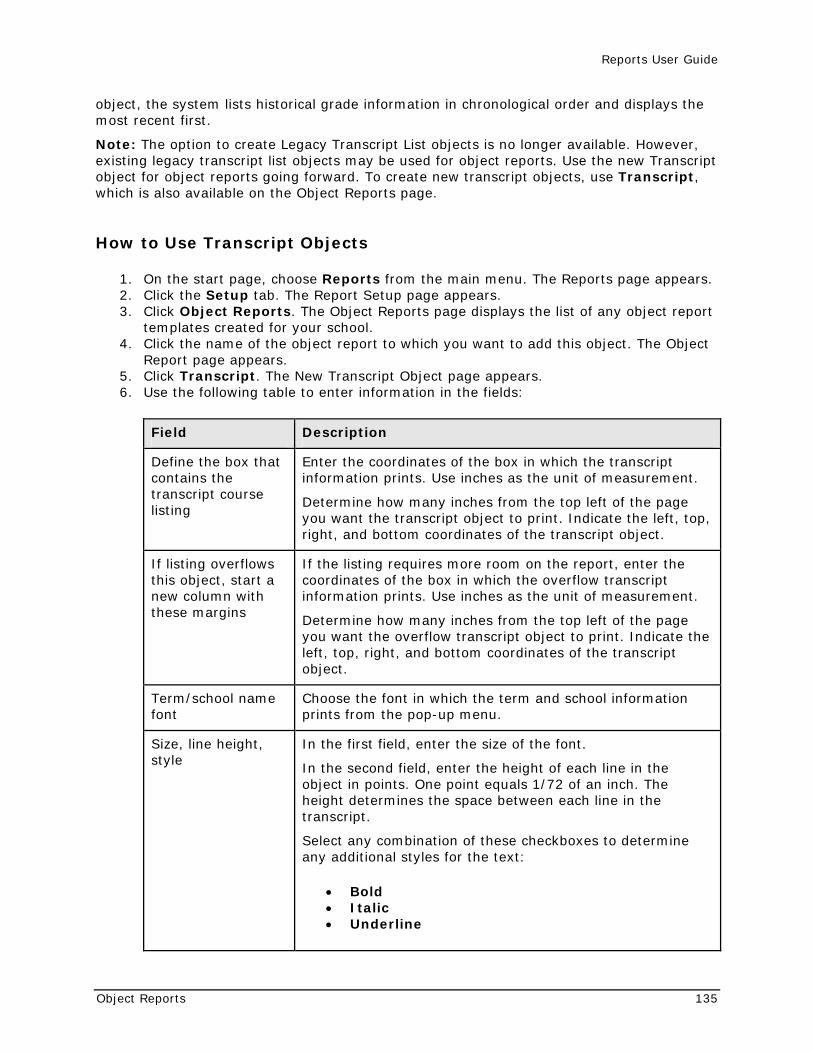
Reports User Guide
Object Reports 135
object, the system lists historical grade information in chronological order and displays the most recent first.
Note: The option to create Legacy Transcript List objects is no longer available. However, existing legacy transcript list objects may be used for object reports. Use the new Transcript object for object reports going forward. To create new transcript objects, use Transcript, which is also available on the Object Reports page.
How to Use Transcript Objects
1. On the start page, choose Reports from the main menu. The Reports page appears. 2. Click the Setup tab. The Report Setup page appears. 3. Click Object Reports. The Object Reports page displays the list of any object report
templates created for your school. 4. Click the name of the object report to which you want to add this object. The Object
Report page appears. 5. Click Transcript. The New Transcript Object page appears. 6. Use the following table to enter information in the fields:
Field Description
Define the box that contains the transcript course listing
Enter the coordinates of the box in which the transcript information prints. Use inches as the unit of measurement.
Determine how many inches from the top left of the page you want the transcript object to print. Indicate the left, top, right, and bottom coordinates of the transcript object.
If listing overflows this object, start a new column with these margins
If the listing requires more room on the report, enter the coordinates of the box in which the overflow transcript information prints. Use inches as the unit of measurement.
Determine how many inches from the top left of the page you want the overflow transcript object to print. Indicate the left, top, right, and bottom coordinates of the transcript object.
Term/school name font
Choose the font in which the term and school information prints from the pop-up menu.
Size, line height, style
In the first field, enter the size of the font.
In the second field, enter the height of each line in the object in points. One point equals 1/72 of an inch. The height determines the space between each line in the transcript.
Select any combination of these checkboxes to determine any additional styles for the text:
• Bold • Italic • Underline
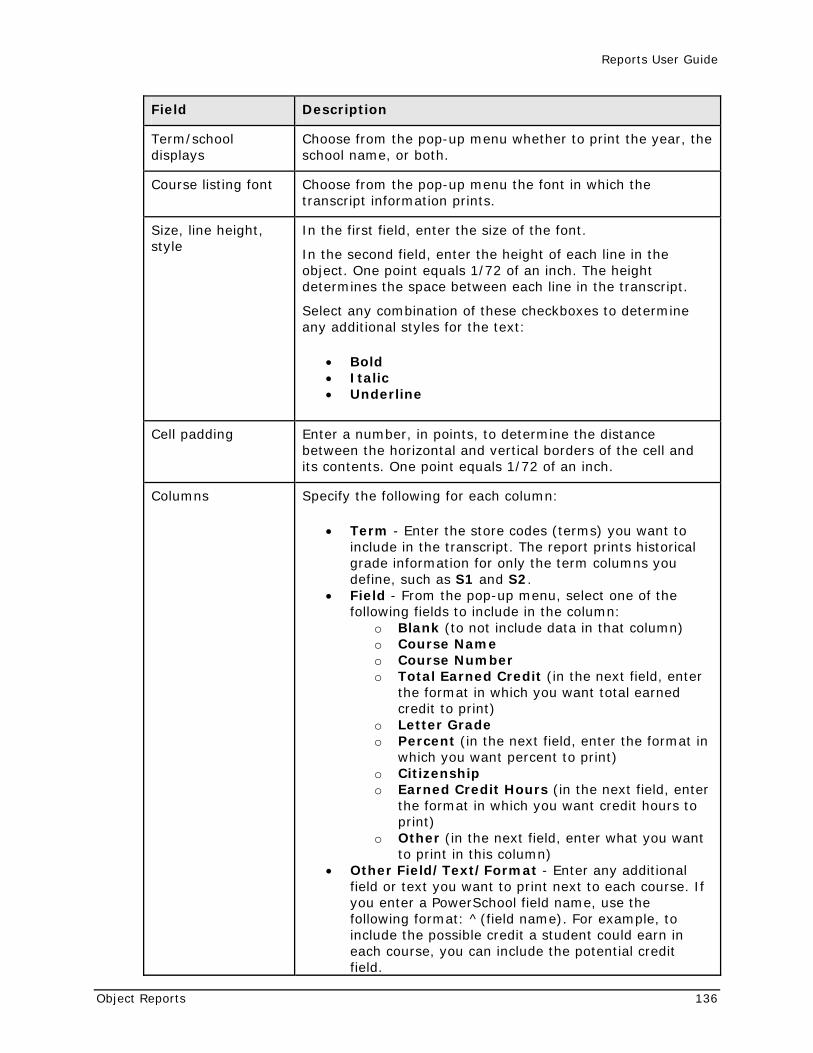
Reports User Guide
Object Reports 136
Field Description
Term/school displays
Choose from the pop-up menu whether to print the year, the school name, or both.
Course listing font Choose from the pop-up menu the font in which the transcript information prints.
Size, line height, style
In the first field, enter the size of the font.
In the second field, enter the height of each line in the object. One point equals 1/72 of an inch. The height determines the space between each line in the transcript.
Select any combination of these checkboxes to determine any additional styles for the text:
• Bold • Italic • Underline
Cell padding Enter a number, in points, to determine the distance between the horizontal and vertical borders of the cell and its contents. One point equals 1/72 of an inch.
Columns Specify the following for each column:
• Term - Enter the store codes (terms) you want to include in the transcript. The report prints historical grade information for only the term columns you define, such as S1 and S2.
• Field - From the pop-up menu, select one of the following fields to include in the column:
o Blank (to not include data in that column) o Course Name o Course Number o Total Earned Credit (in the next field, enter
the format in which you want total earned credit to print)
o Letter Grade o Percent (in the next field, enter the format in
which you want percent to print) o Citizenship o Earned Credit Hours (in the next field, enter
the format in which you want credit hours to print)
o Other (in the next field, enter what you want to print in this column)
• Other Field/Text/Format - Enter any additional field or text you want to print next to each course. If you enter a PowerSchool field name, use the following format: ^(field name). For example, to include the possible credit a student could earn in each course, you can include the potential credit field.
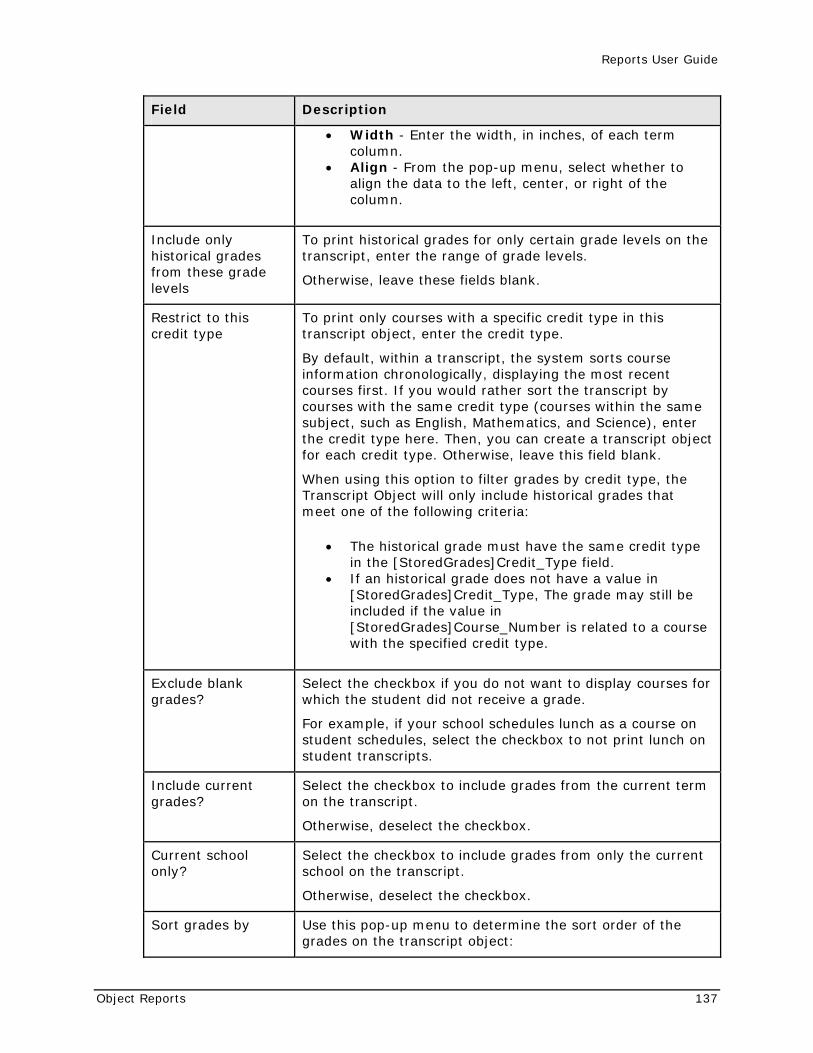
Reports User Guide
Object Reports 137
Field Description
• Width - Enter the width, in inches, of each term column.
• Align - From the pop-up menu, select whether to align the data to the left, center, or right of the column.
Include only historical grades from these grade levels
To print historical grades for only certain grade levels on the transcript, enter the range of grade levels.
Otherwise, leave these fields blank.
Restrict to this credit type
To print only courses with a specific credit type in this transcript object, enter the credit type.
By default, within a transcript, the system sorts course information chronologically, displaying the most recent courses first. If you would rather sort the transcript by courses with the same credit type (courses within the same subject, such as English, Mathematics, and Science), enter the credit type here. Then, you can create a transcript object for each credit type. Otherwise, leave this field blank.
When using this option to filter grades by credit type, the Transcript Object will only include historical grades that meet one of the following criteria:
• The historical grade must have the same credit type in the [StoredGrades]Credit_Type field.
• If an historical grade does not have a value in [StoredGrades]Credit_Type, The grade may still be included if the value in [StoredGrades]Course_Number is related to a course with the specified credit type.
Exclude blank grades?
Select the checkbox if you do not want to display courses for which the student did not receive a grade.
For example, if your school schedules lunch as a course on student schedules, select the checkbox to not print lunch on student transcripts.
Include current grades?
Select the checkbox to include grades from the current term on the transcript.
Otherwise, deselect the checkbox.
Current school only?
Select the checkbox to include grades from only the current school on the transcript.
Otherwise, deselect the checkbox.
Sort grades by Use this pop-up menu to determine the sort order of the grades on the transcript object:
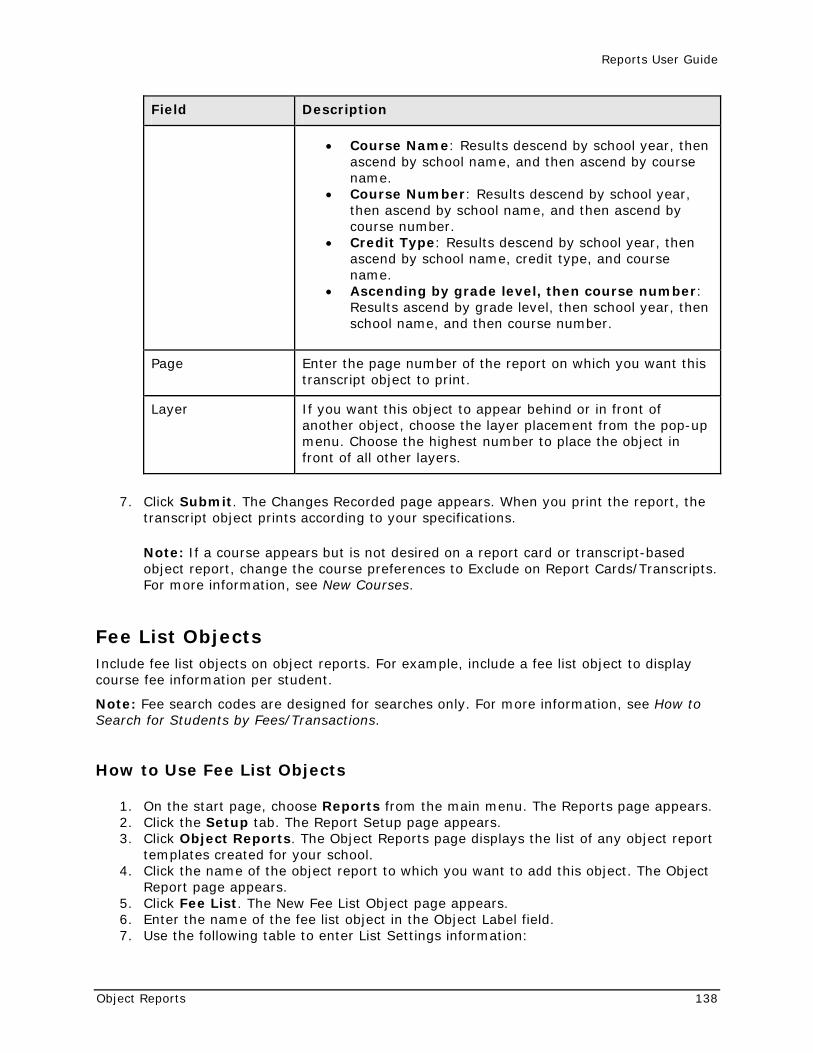
Reports User Guide
Object Reports 138
Field Description
• Course Name: Results descend by school year, then ascend by school name, and then ascend by course name.
• Course Number: Results descend by school year, then ascend by school name, and then ascend by course number.
• Credit Type: Results descend by school year, then ascend by school name, credit type, and course name.
• Ascending by grade level, then course number: Results ascend by grade level, then school year, then school name, and then course number.
Page Enter the page number of the report on which you want this transcript object to print.
Layer If you want this object to appear behind or in front of another object, choose the layer placement from the pop-up menu. Choose the highest number to place the object in front of all other layers.
7. Click Submit. The Changes Recorded page appears. When you print the report, the transcript object prints according to your specifications.
Note: If a course appears but is not desired on a report card or transcript-based object report, change the course preferences to Exclude on Report Cards/Transcripts. For more information, see New Courses.
Fee List Objects Include fee list objects on object reports. For example, include a fee list object to display course fee information per student.
Note: Fee search codes are designed for searches only. For more information, see How to Search for Students by Fees/Transactions.
How to Use Fee List Objects
1. On the start page, choose Reports from the main menu. The Reports page appears. 2. Click the Setup tab. The Report Setup page appears. 3. Click Object Reports. The Object Reports page displays the list of any object report
templates created for your school. 4. Click the name of the object report to which you want to add this object. The Object
Report page appears. 5. Click Fee List. The New Fee List Object page appears. 6. Enter the name of the fee list object in the Object Label field. 7. Use the following table to enter List Settings information:
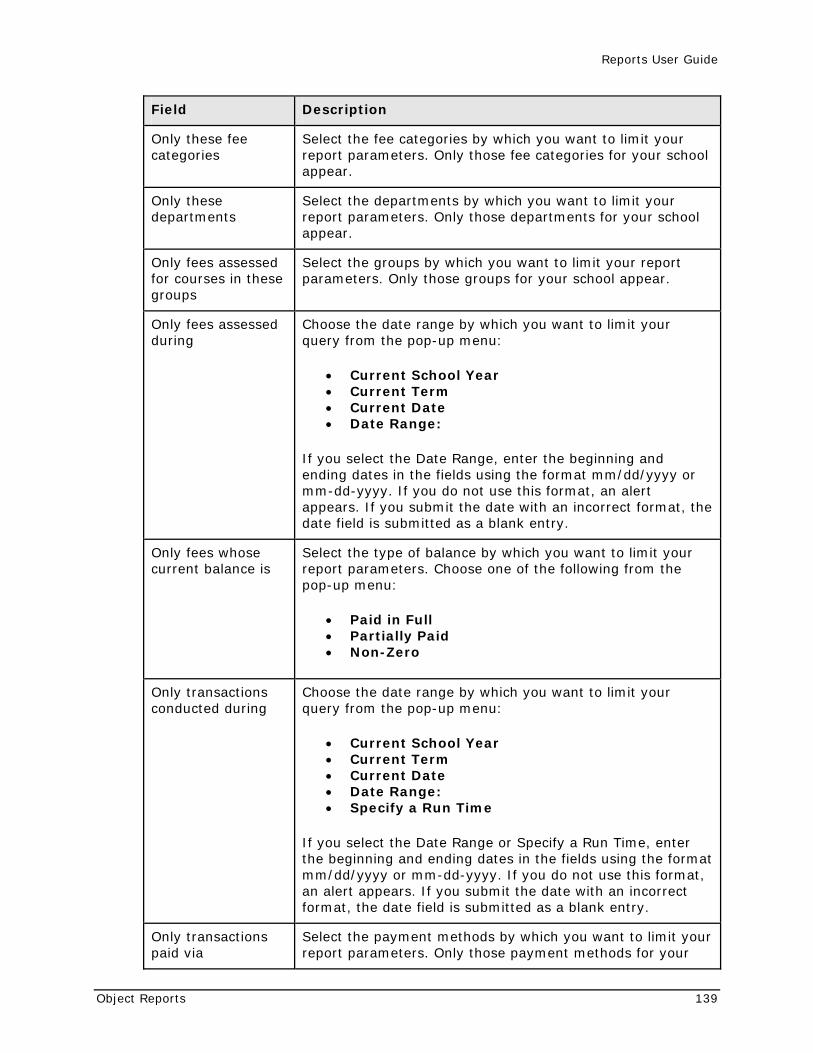
Reports User Guide
Object Reports 139
Field Description
Only these fee categories
Select the fee categories by which you want to limit your report parameters. Only those fee categories for your school appear.
Only these departments
Select the departments by which you want to limit your report parameters. Only those departments for your school appear.
Only fees assessed for courses in these groups
Select the groups by which you want to limit your report parameters. Only those groups for your school appear.
Only fees assessed during
Choose the date range by which you want to limit your query from the pop-up menu:
• Current School Year • Current Term • Current Date • Date Range:
If you select the Date Range, enter the beginning and ending dates in the fields using the format mm/dd/yyyy or mm-dd-yyyy. If you do not use this format, an alert appears. If you submit the date with an incorrect format, the date field is submitted as a blank entry.
Only fees whose current balance is
Select the type of balance by which you want to limit your report parameters. Choose one of the following from the pop-up menu:
• Paid in Full • Partially Paid • Non-Zero
Only transactions conducted during
Choose the date range by which you want to limit your query from the pop-up menu:
• Current School Year • Current Term • Current Date • Date Range: • Specify a Run Time
If you select the Date Range or Specify a Run Time, enter the beginning and ending dates in the fields using the format mm/dd/yyyy or mm-dd-yyyy. If you do not use this format, an alert appears. If you submit the date with an incorrect format, the date field is submitted as a blank entry.
Only transactions paid via
Select the payment methods by which you want to limit your report parameters. Only those payment methods for your
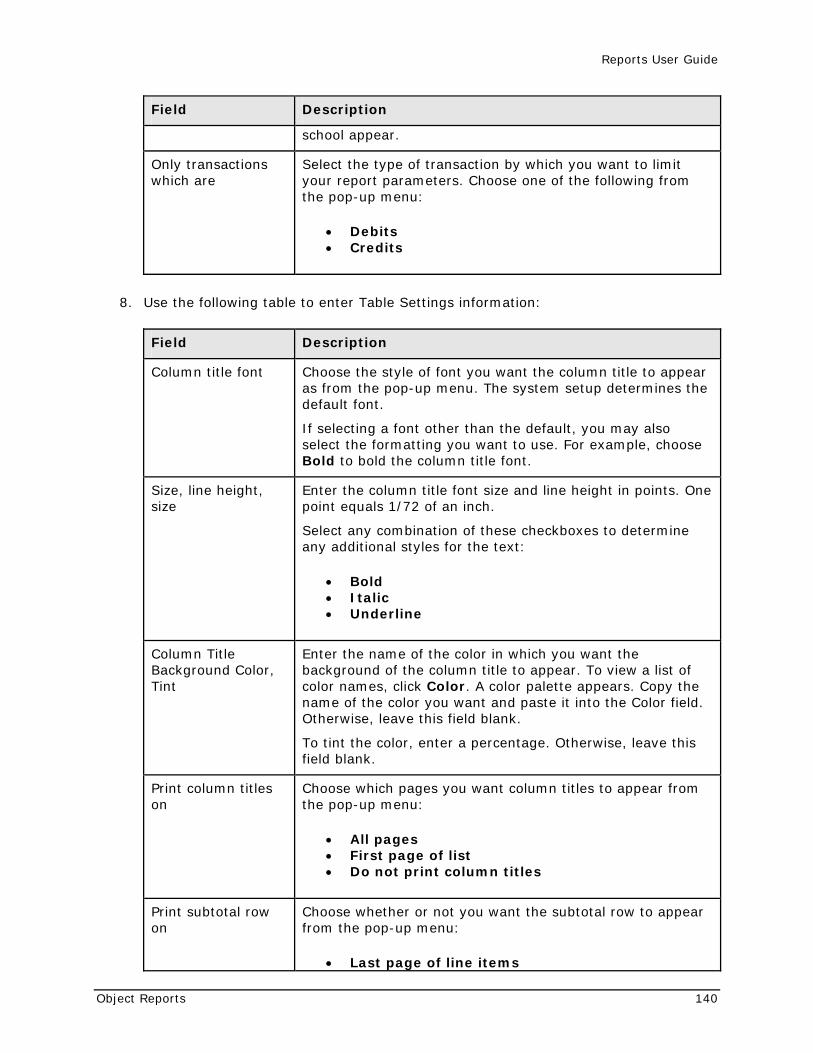
Reports User Guide
Object Reports 140
Field Description
school appear.
Only transactions which are
Select the type of transaction by which you want to limit your report parameters. Choose one of the following from the pop-up menu:
• Debits • Credits
8. Use the following table to enter Table Settings information:
Field Description
Column title font Choose the style of font you want the column title to appear as from the pop-up menu. The system setup determines the default font.
If selecting a font other than the default, you may also select the formatting you want to use. For example, choose Bold to bold the column title font.
Size, line height, size
Enter the column title font size and line height in points. One point equals 1/72 of an inch.
Select any combination of these checkboxes to determine any additional styles for the text:
• Bold • Italic • Underline
Column Title Background Color, Tint
Enter the name of the color in which you want the background of the column title to appear. To view a list of color names, click Color. A color palette appears. Copy the name of the color you want and paste it into the Color field. Otherwise, leave this field blank.
To tint the color, enter a percentage. Otherwise, leave this field blank.
Print column titles on
Choose which pages you want column titles to appear from the pop-up menu:
• All pages • First page of list • Do not print column titles
Print subtotal row on
Choose whether or not you want the subtotal row to appear from the pop-up menu:
• Last page of line items
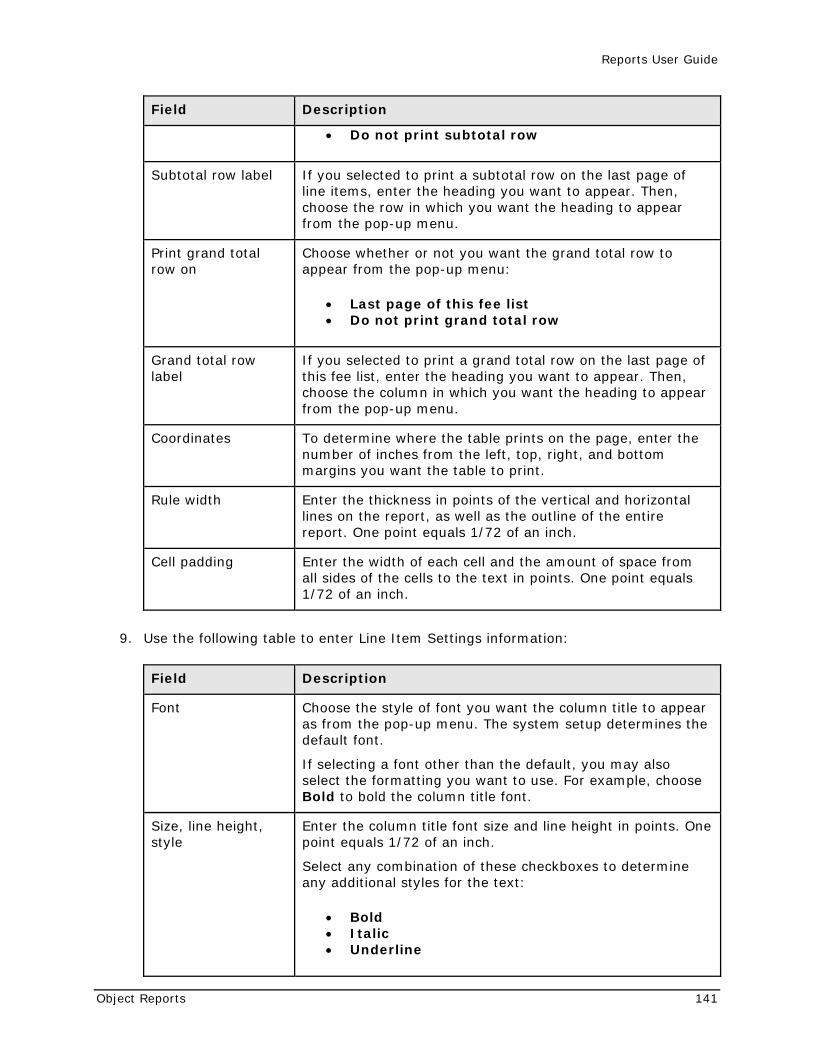
Reports User Guide
Object Reports 141
Field Description
• Do not print subtotal row
Subtotal row label If you selected to print a subtotal row on the last page of line items, enter the heading you want to appear. Then, choose the row in which you want the heading to appear from the pop-up menu.
Print grand total row on
Choose whether or not you want the grand total row to appear from the pop-up menu:
• Last page of this fee list • Do not print grand total row
Grand total row label
If you selected to print a grand total row on the last page of this fee list, enter the heading you want to appear. Then, choose the column in which you want the heading to appear from the pop-up menu.
Coordinates To determine where the table prints on the page, enter the number of inches from the left, top, right, and bottom margins you want the table to print.
Rule width Enter the thickness in points of the vertical and horizontal lines on the report, as well as the outline of the entire report. One point equals 1/72 of an inch.
Cell padding Enter the width of each cell and the amount of space from all sides of the cells to the text in points. One point equals 1/72 of an inch.
9. Use the following table to enter Line Item Settings information:
Field Description
Font Choose the style of font you want the column title to appear as from the pop-up menu. The system setup determines the default font.
If selecting a font other than the default, you may also select the formatting you want to use. For example, choose Bold to bold the column title font.
Size, line height, style
Enter the column title font size and line height in points. One point equals 1/72 of an inch.
Select any combination of these checkboxes to determine any additional styles for the text:
• Bold • Italic • Underline
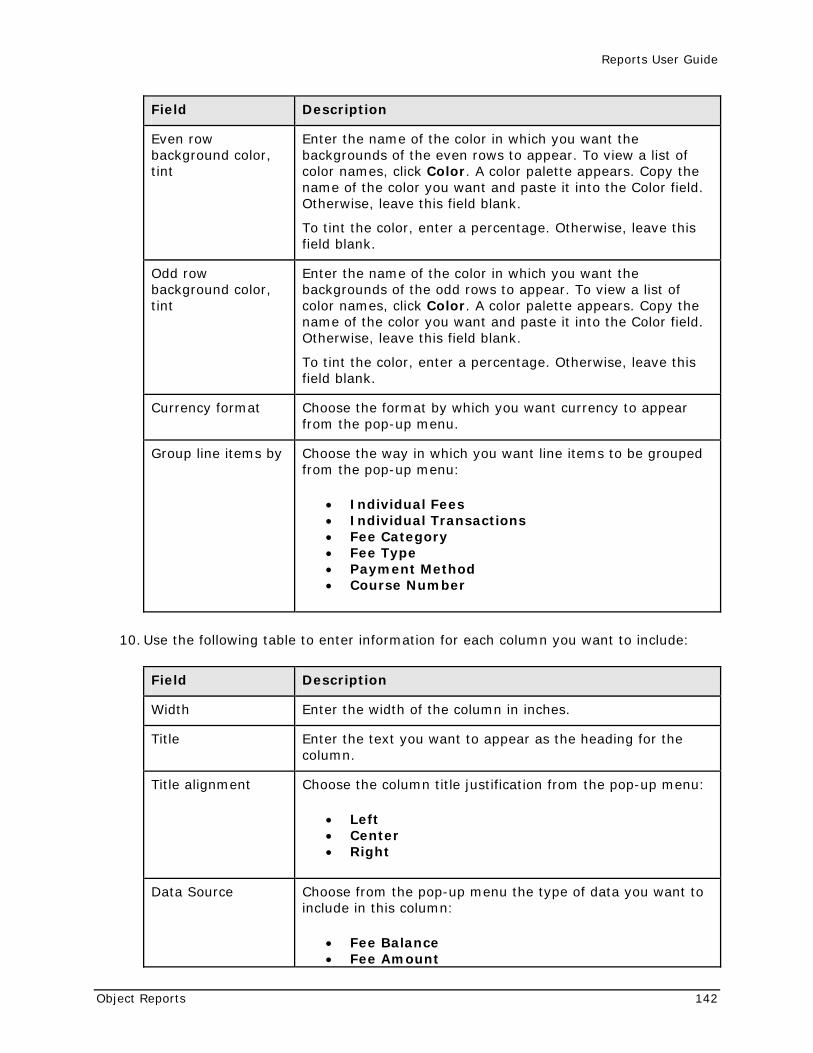
Reports User Guide
Object Reports 142
Field Description
Even row background color, tint
Enter the name of the color in which you want the backgrounds of the even rows to appear. To view a list of color names, click Color. A color palette appears. Copy the name of the color you want and paste it into the Color field. Otherwise, leave this field blank.
To tint the color, enter a percentage. Otherwise, leave this field blank.
Odd row background color, tint
Enter the name of the color in which you want the backgrounds of the odd rows to appear. To view a list of color names, click Color. A color palette appears. Copy the name of the color you want and paste it into the Color field. Otherwise, leave this field blank.
To tint the color, enter a percentage. Otherwise, leave this field blank.
Currency format Choose the format by which you want currency to appear from the pop-up menu.
Group line items by Choose the way in which you want line items to be grouped from the pop-up menu:
• Individual Fees • Individual Transactions • Fee Category • Fee Type • Payment Method • Course Number
10. Use the following table to enter information for each column you want to include:
Field Description
Width Enter the width of the column in inches.
Title Enter the text you want to appear as the heading for the column.
Title alignment Choose the column title justification from the pop-up menu:
• Left • Center • Right
Data Source Choose from the pop-up menu the type of data you want to include in this column:
• Fee Balance • Fee Amount
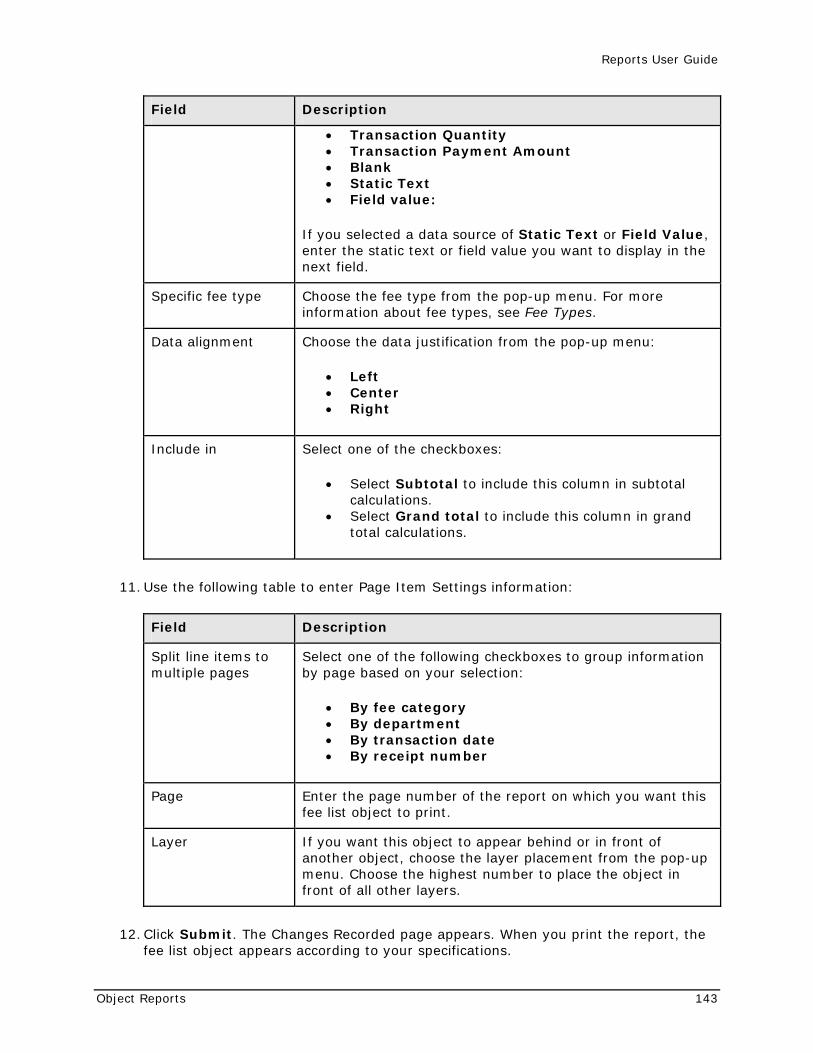
Reports User Guide
Object Reports 143
Field Description
• Transaction Quantity • Transaction Payment Amount • Blank • Static Text • Field value:
If you selected a data source of Static Text or Field Value, enter the static text or field value you want to display in the next field.
Specific fee type Choose the fee type from the pop-up menu. For more information about fee types, see Fee Types.
Data alignment Choose the data justification from the pop-up menu:
• Left • Center • Right
Include in Select one of the checkboxes:
• Select Subtotal to include this column in subtotal calculations.
• Select Grand total to include this column in grand total calculations.
11. Use the following table to enter Page Item Settings information:
Field Description
Split line items to multiple pages
Select one of the following checkboxes to group information by page based on your selection:
• By fee category • By department • By transaction date • By receipt number
Page Enter the page number of the report on which you want this fee list object to print.
Layer If you want this object to appear behind or in front of another object, choose the layer placement from the pop-up menu. Choose the highest number to place the object in front of all other layers.
12. Click Submit. The Changes Recorded page appears. When you print the report, the fee list object appears according to your specifications.
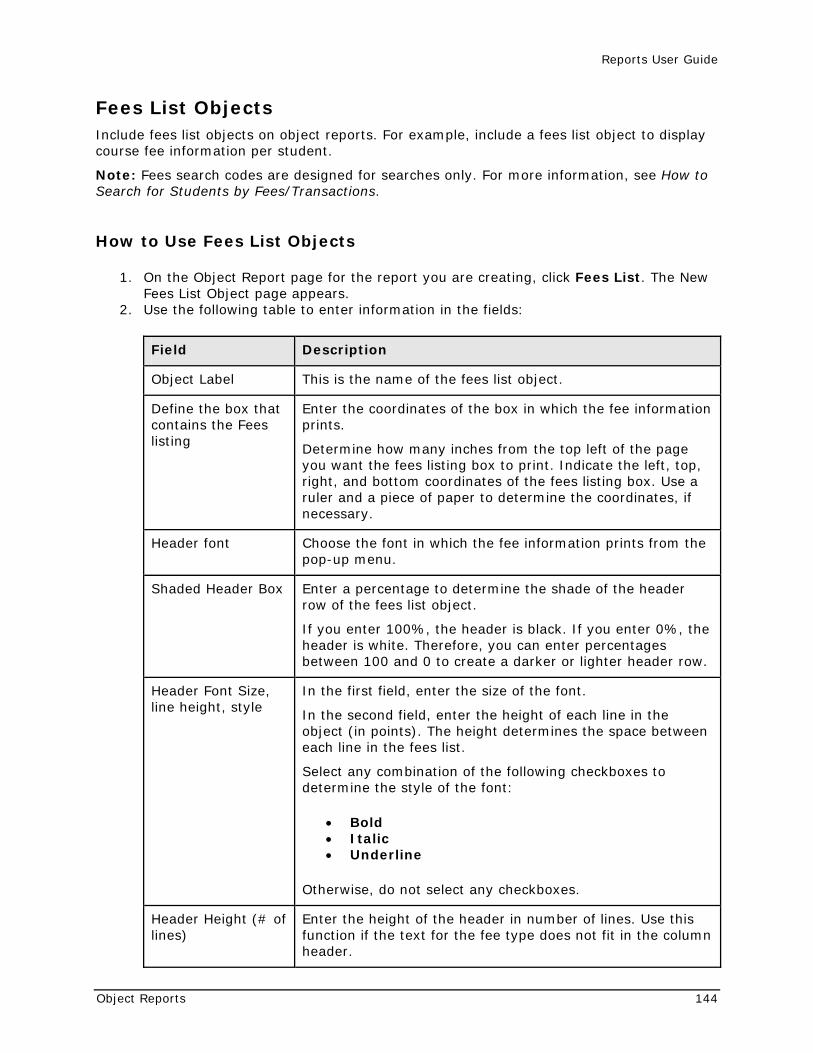
Reports User Guide
Object Reports 144
Fees List Objects Include fees list objects on object reports. For example, include a fees list object to display course fee information per student.
Note: Fees search codes are designed for searches only. For more information, see How to Search for Students by Fees/Transactions.
How to Use Fees List Objects
1. On the Object Report page for the report you are creating, click Fees List. The New Fees List Object page appears.
2. Use the following table to enter information in the fields:
Field Description
Object Label This is the name of the fees list object.
Define the box that contains the Fees listing
Enter the coordinates of the box in which the fee information prints.
Determine how many inches from the top left of the page you want the fees listing box to print. Indicate the left, top, right, and bottom coordinates of the fees listing box. Use a ruler and a piece of paper to determine the coordinates, if necessary.
Header font Choose the font in which the fee information prints from the pop-up menu.
Shaded Header Box Enter a percentage to determine the shade of the header row of the fees list object.
If you enter 100%, the header is black. If you enter 0%, the header is white. Therefore, you can enter percentages between 100 and 0 to create a darker or lighter header row.
Header Font Size, line height, style
In the first field, enter the size of the font.
In the second field, enter the height of each line in the object (in points). The height determines the space between each line in the fees list.
Select any combination of the following checkboxes to determine the style of the font:
• Bold • Italic • Underline
Otherwise, do not select any checkboxes.
Header Height (# of lines)
Enter the height of the header in number of lines. Use this function if the text for the fee type does not fit in the column header.
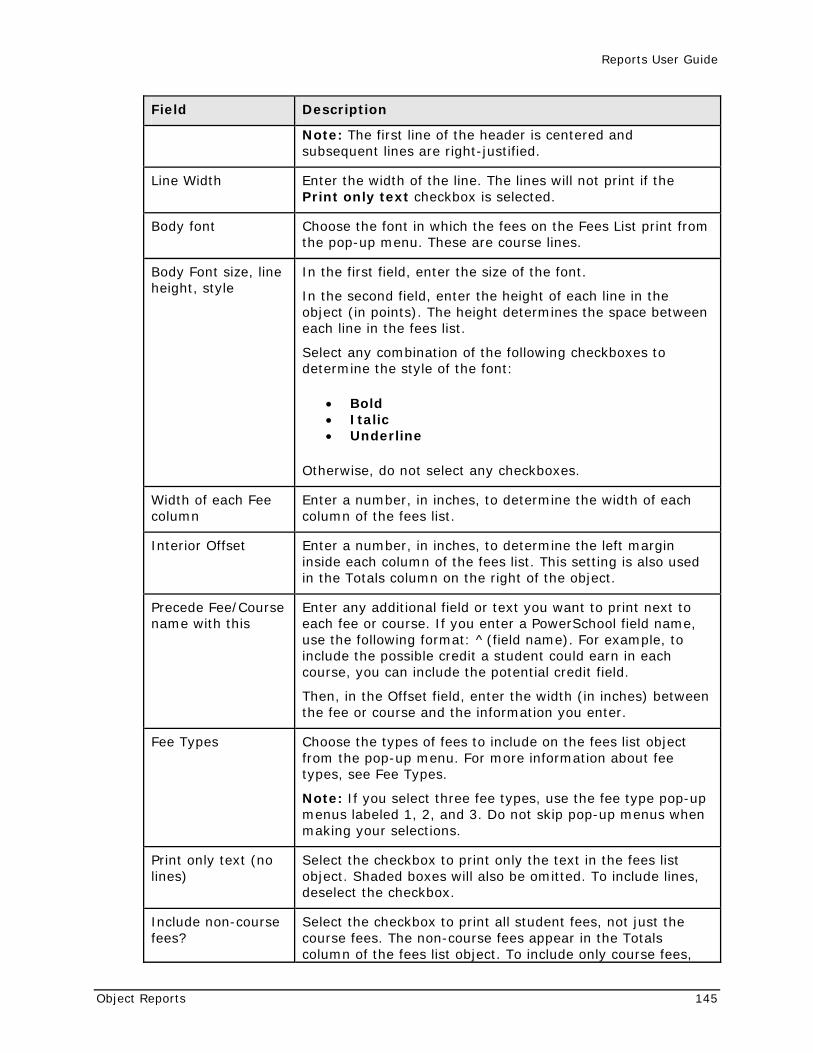
Reports User Guide
Object Reports 145
Field Description
Note: The first line of the header is centered and subsequent lines are right-justified.
Line Width Enter the width of the line. The lines will not print if the Print only text checkbox is selected.
Body font Choose the font in which the fees on the Fees List print from the pop-up menu. These are course lines.
Body Font size, line height, style
In the first field, enter the size of the font.
In the second field, enter the height of each line in the object (in points). The height determines the space between each line in the fees list.
Select any combination of the following checkboxes to determine the style of the font:
• Bold • Italic • Underline
Otherwise, do not select any checkboxes.
Width of each Fee column
Enter a number, in inches, to determine the width of each column of the fees list.
Interior Offset Enter a number, in inches, to determine the left margin inside each column of the fees list. This setting is also used in the Totals column on the right of the object.
Precede Fee/Course name with this
Enter any additional field or text you want to print next to each fee or course. If you enter a PowerSchool field name, use the following format: ^(field name). For example, to include the possible credit a student could earn in each course, you can include the potential credit field.
Then, in the Offset field, enter the width (in inches) between the fee or course and the information you enter.
Fee Types Choose the types of fees to include on the fees list object from the pop-up menu. For more information about fee types, see Fee Types.
Note: If you select three fee types, use the fee type pop-up menus labeled 1, 2, and 3. Do not skip pop-up menus when making your selections.
Print only text (no lines)
Select the checkbox to print only the text in the fees list object. Shaded boxes will also be omitted. To include lines, deselect the checkbox.
Include non-course fees?
Select the checkbox to print all student fees, not just the course fees. The non-course fees appear in the Totals column of the fees list object. To include only course fees,
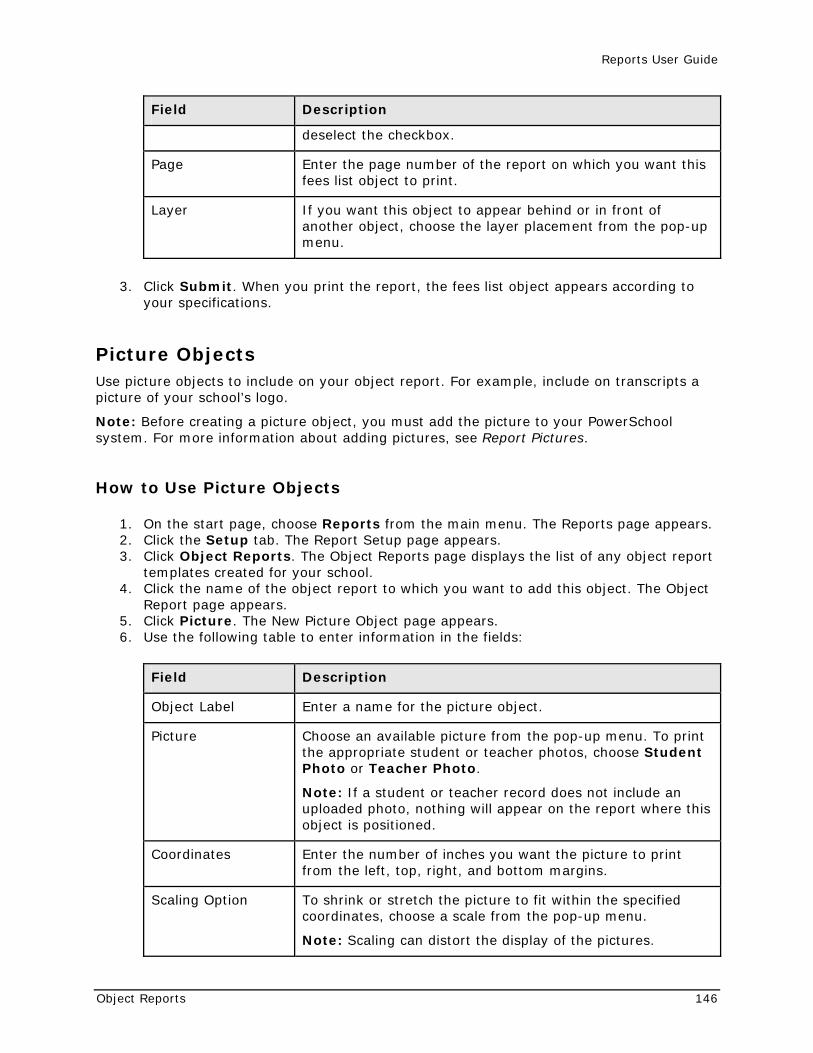
Reports User Guide
Object Reports 146
Field Description
deselect the checkbox.
Page Enter the page number of the report on which you want this fees list object to print.
Layer If you want this object to appear behind or in front of another object, choose the layer placement from the pop-up menu.
3. Click Submit. When you print the report, the fees list object appears according to your specifications.
Picture Objects Use picture objects to include on your object report. For example, include on transcripts a picture of your school’s logo.
Note: Before creating a picture object, you must add the picture to your PowerSchool system. For more information about adding pictures, see Report Pictures.
How to Use Picture Objects
1. On the start page, choose Reports from the main menu. The Reports page appears. 2. Click the Setup tab. The Report Setup page appears. 3. Click Object Reports. The Object Reports page displays the list of any object report
templates created for your school. 4. Click the name of the object report to which you want to add this object. The Object
Report page appears. 5. Click Picture. The New Picture Object page appears. 6. Use the following table to enter information in the fields:
Field Description
Object Label Enter a name for the picture object.
Picture Choose an available picture from the pop-up menu. To print the appropriate student or teacher photos, choose Student Photo or Teacher Photo.
Note: If a student or teacher record does not include an uploaded photo, nothing will appear on the report where this object is positioned.
Coordinates Enter the number of inches you want the picture to print from the left, top, right, and bottom margins.
Scaling Option To shrink or stretch the picture to fit within the specified coordinates, choose a scale from the pop-up menu.
Note: Scaling can distort the display of the pictures.
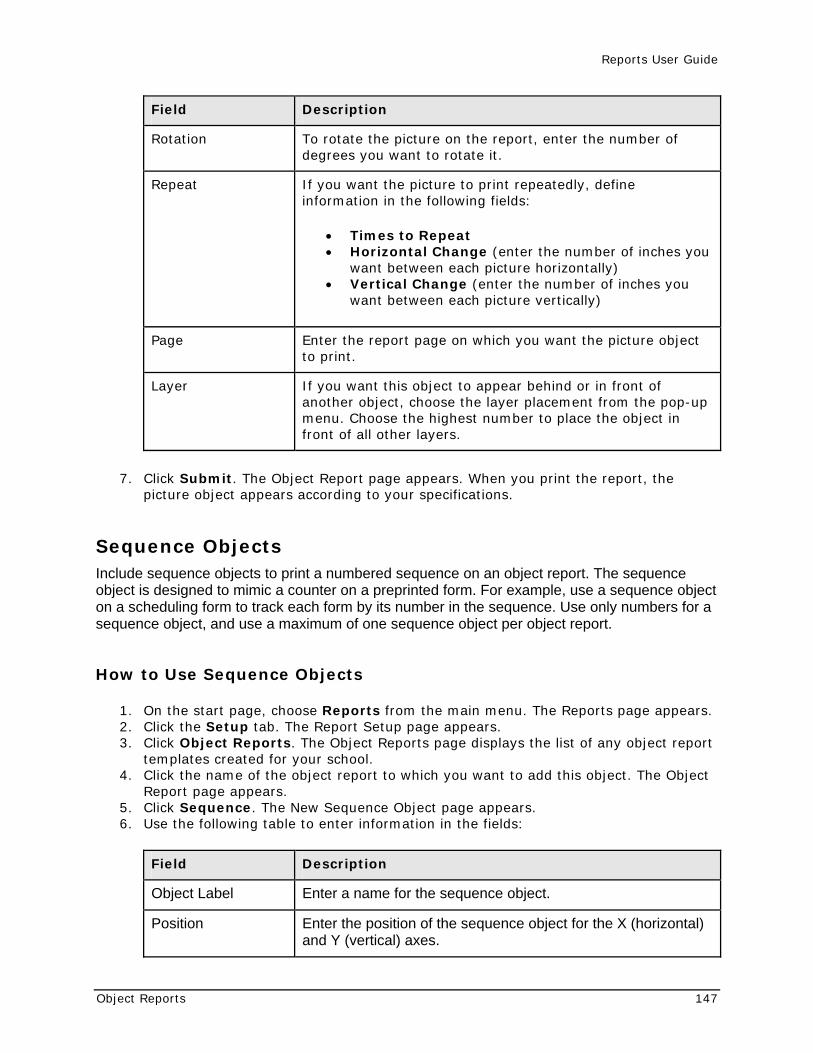
Reports User Guide
Object Reports 147
Field Description
Rotation To rotate the picture on the report, enter the number of degrees you want to rotate it.
Repeat If you want the picture to print repeatedly, define information in the following fields:
• Times to Repeat • Horizontal Change (enter the number of inches you
want between each picture horizontally) • Vertical Change (enter the number of inches you
want between each picture vertically)
Page Enter the report page on which you want the picture object to print.
Layer If you want this object to appear behind or in front of another object, choose the layer placement from the pop-up menu. Choose the highest number to place the object in front of all other layers.
7. Click Submit. The Object Report page appears. When you print the report, the picture object appears according to your specifications.
Sequence Objects Include sequence objects to print a numbered sequence on an object report. The sequence object is designed to mimic a counter on a preprinted form. For example, use a sequence object on a scheduling form to track each form by its number in the sequence. Use only numbers for a sequence object, and use a maximum of one sequence object per object report.
How to Use Sequence Objects
1. On the start page, choose Reports from the main menu. The Reports page appears. 2. Click the Setup tab. The Report Setup page appears. 3. Click Object Reports. The Object Reports page displays the list of any object report
templates created for your school. 4. Click the name of the object report to which you want to add this object. The Object
Report page appears. 5. Click Sequence. The New Sequence Object page appears. 6. Use the following table to enter information in the fields:
Field Description
Object Label Enter a name for the sequence object.
Position Enter the position of the sequence object for the X (horizontal) and Y (vertical) axes.
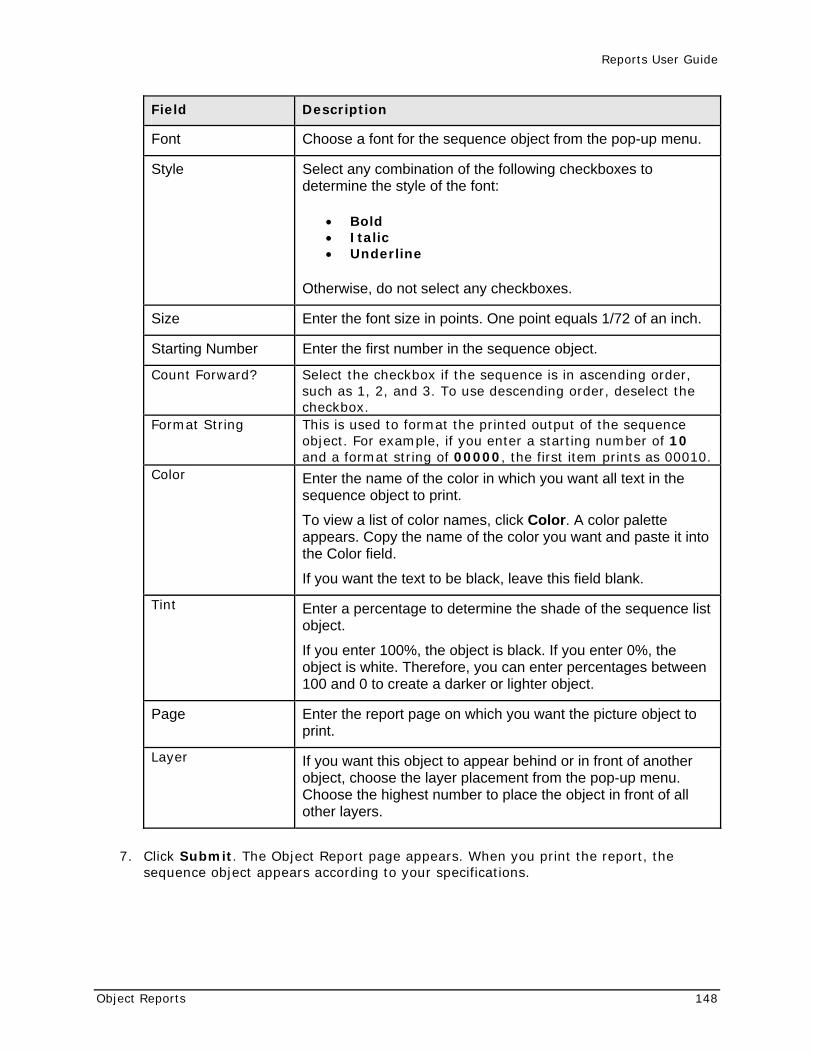
Reports User Guide
Object Reports 148
Field Description
Font Choose a font for the sequence object from the pop-up menu.
Style Select any combination of the following checkboxes to determine the style of the font:
• Bold • Italic • Underline
Otherwise, do not select any checkboxes.
Size Enter the font size in points. One point equals 1/72 of an inch.
Starting Number Enter the first number in the sequence object.
Count Forward? Select the checkbox if the sequence is in ascending order, such as 1, 2, and 3. To use descending order, deselect the checkbox.
Format String This is used to format the printed output of the sequence object. For example, if you enter a starting number of 10 and a format string of 00000, the first item prints as 00010.
Color Enter the name of the color in which you want all text in the sequence object to print.
To view a list of color names, click Color. A color palette appears. Copy the name of the color you want and paste it into the Color field.
If you want the text to be black, leave this field blank.
Tint Enter a percentage to determine the shade of the sequence list object.
If you enter 100%, the object is black. If you enter 0%, the object is white. Therefore, you can enter percentages between 100 and 0 to create a darker or lighter object.
Page Enter the report page on which you want the picture object to print.
Layer If you want this object to appear behind or in front of another object, choose the layer placement from the pop-up menu. Choose the highest number to place the object in front of all other layers.
7. Click Submit. The Object Report page appears. When you print the report, the sequence object appears according to your specifications.
Reports User Guide
Object Reports 149
Report Pictures Include pictures on object reports to enhance their appearance. Pictures like logos and seals are useful for object reports such as transcripts. For more information about adding pictures to a report, see Objects on an Object Report.
To make pictures available to include in reports, you must first upload the picture files to your server.
How to View a Report Picture
1. On the start page, choose Reports from the main menu. The Reports page appears. 2. Click the Setup tab. The Report Setup page appears. 3. Click Pictures. The Pictures page appears. 4. Click the name of the picture in the "Available pictures" field. The picture appears.
How to Add a Report Picture
Add a report picture for use in object reports. All pictures must be saved as JPEG files with the filename extension .jpg.
1. On the start page, choose Reports from the main menu. The Reports page appears. 2. Click the Setup tab. The Report Setup page appears. 3. Click Pictures. The Pictures page appears. 4. Either enter the file path and name of the picture in the "Upload a new picture" field,
or click Browse... to search for and select the file. 5. Click Submit. The Pictures page displays the new picture file name in the "Available
pictures" field.
How to Delete a Report Picture
To save system space and minimize possible confusion, delete a report picture when it is no longer needed . For example, delete a picture when your school logo changes. Then, add the picture of the new logo. For more information about adding pictures, see How to Add a Report Picture.
1. On the start page, choose Reports from the main menu. The Reports page appears. 2. Click the Setup tab. The Report Setup page appears. 3. Click Pictures. The Pictures page appears. 4. Select the checkbox next to the picture you want to delete. 5. Click Submit. The Pictures page appears without the deleted picture in the
"Available pictures" field.
Object Reports With Standards Grades Object reports can display standards scores. Use the following list of codes to generate object reports with standards grades.
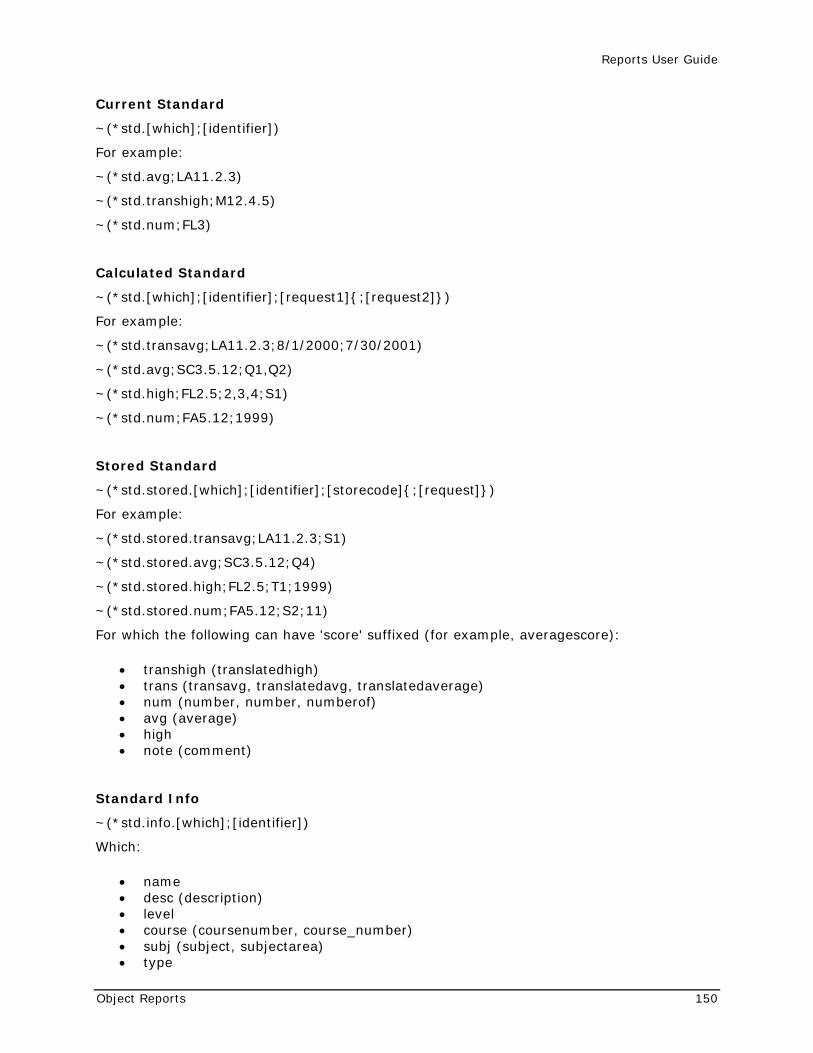
Reports User Guide
Object Reports 150
Current Standard
~(*std.[which];[identifier])
For example:
~(*std.avg;LA11.2.3)
~(*std.transhigh;M12.4.5)
~(*std.num;FL3)
Calculated Standard
~(*std.[which];[identifier];[request1]{;[request2]})
For example:
~(*std.transavg;LA11.2.3;8/1/2000;7/30/2001)
~(*std.avg;SC3.5.12;Q1,Q2)
~(*std.high;FL2.5;2,3,4;S1)
~(*std.num;FA5.12;1999)
Stored Standard
~(*std.stored.[which];[identifier];[storecode]{;[request]})
For example:
~(*std.stored.transavg;LA11.2.3;S1)
~(*std.stored.avg;SC3.5.12;Q4)
~(*std.stored.high;FL2.5;T1;1999)
~(*std.stored.num;FA5.12;S2;11)
For which the following can have 'score' suffixed (for example, averagescore):
• transhigh (translatedhigh) • trans (transavg, translatedavg, translatedaverage) • num (number, number, numberof) • avg (average) • high • note (comment)
Standard Info
~(*std.info.[which];[identifier])
Which:
• name • desc (description) • level • course (coursenumber, course_number) • subj (subject, subjectarea) • type
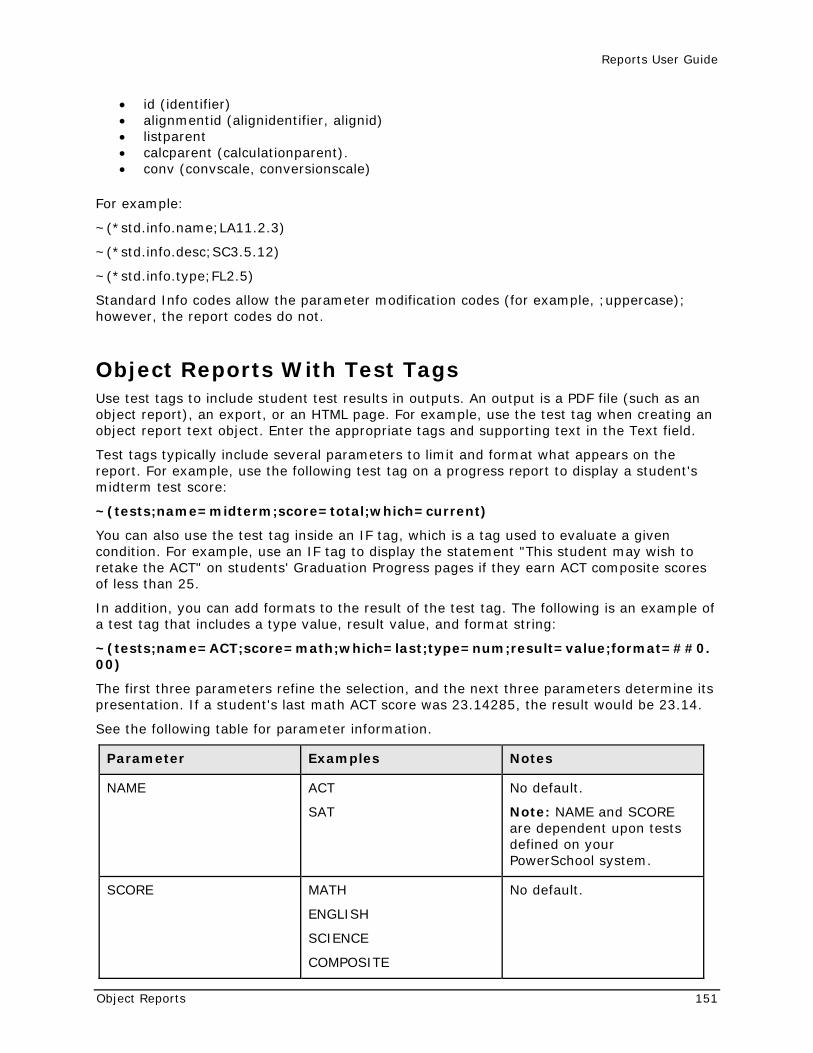
Reports User Guide
Object Reports 151
• id (identifier) • alignmentid (alignidentifier, alignid) • listparent • calcparent (calculationparent). • conv (convscale, conversionscale)
For example:
~(*std.info.name;LA11.2.3)
~(*std.info.desc;SC3.5.12)
~(*std.info.type;FL2.5)
Standard Info codes allow the parameter modification codes (for example, ;uppercase); however, the report codes do not.
Object Reports With Test Tags Use test tags to include student test results in outputs. An output is a PDF file (such as an object report), an export, or an HTML page. For example, use the test tag when creating an object report text object. Enter the appropriate tags and supporting text in the Text field.
Test tags typically include several parameters to limit and format what appears on the report. For example, use the following test tag on a progress report to display a student's midterm test score:
~(tests;name=midterm;score=total;which=current)
You can also use the test tag inside an IF tag, which is a tag used to evaluate a given condition. For example, use an IF tag to display the statement "This student may wish to retake the ACT" on students' Graduation Progress pages if they earn ACT composite scores of less than 25.
In addition, you can add formats to the result of the test tag. The following is an example of a test tag that includes a type value, result value, and format string:
~(tests;name=ACT;score=math;which=last;type=num;result=value;format=##0.00)
The first three parameters refine the selection, and the next three parameters determine its presentation. If a student's last math ACT score was 23.14285, the result would be 23.14.
See the following table for parameter information.
Parameter Examples Notes
NAME ACT
SAT
No default.
Note: NAME and SCORE are dependent upon tests defined on your PowerSchool system.
SCORE MATH
ENGLISH
SCIENCE
COMPOSITE
No default.
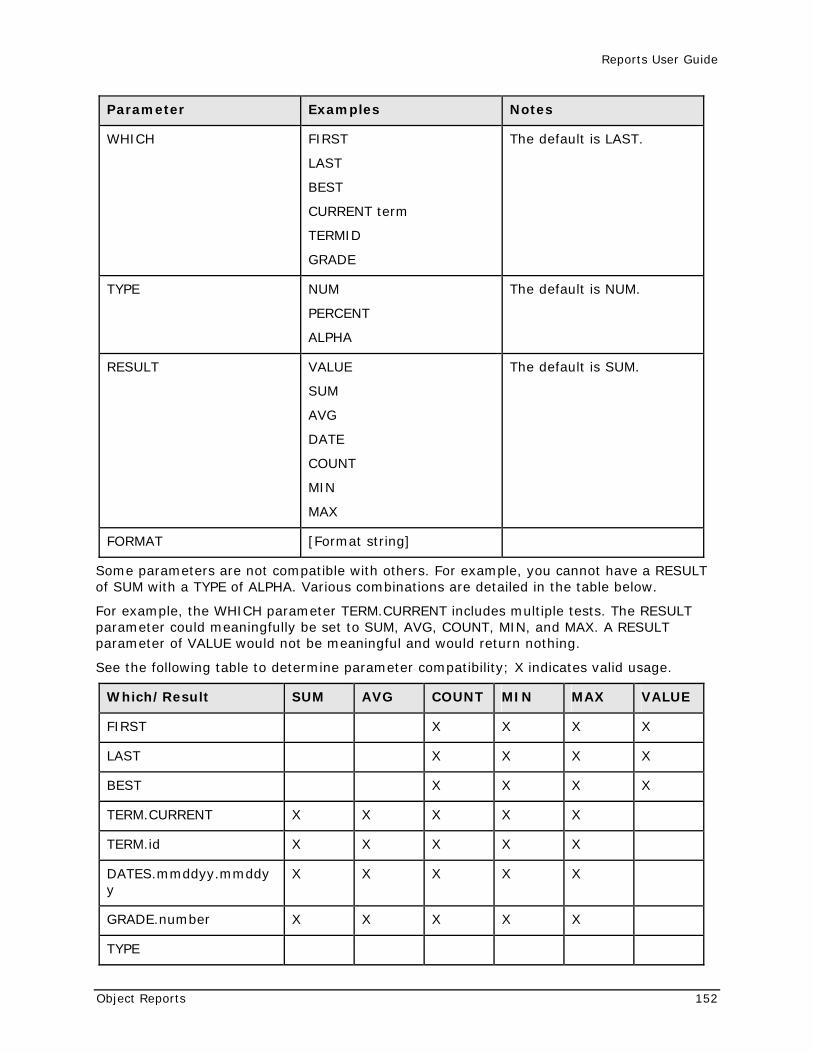
Reports User Guide
Object Reports 152
Parameter Examples Notes
WHICH FIRST
LAST
BEST
CURRENT term
TERMID
GRADE
The default is LAST.
TYPE NUM
PERCENT
ALPHA
The default is NUM.
RESULT VALUE
SUM
AVG
DATE
COUNT
MIN
MAX
The default is SUM.
FORMAT [Format string]
Some parameters are not compatible with others. For example, you cannot have a RESULT of SUM with a TYPE of ALPHA. Various combinations are detailed in the table below.
For example, the WHICH parameter TERM.CURRENT includes multiple tests. The RESULT parameter could meaningfully be set to SUM, AVG, COUNT, MIN, and MAX. A RESULT parameter of VALUE would not be meaningful and would return nothing.
See the following table to determine parameter compatibility; X indicates valid usage.
Which/Result SUM AVG COUNT MIN MAX VALUE
FIRST X X X X
LAST X X X X
BEST X X X X
TERM.CURRENT X X X X X
TERM.id X X X X X
DATES.mmddyy.mmddyy
X X X X X
GRADE.number X X X X X
TYPE
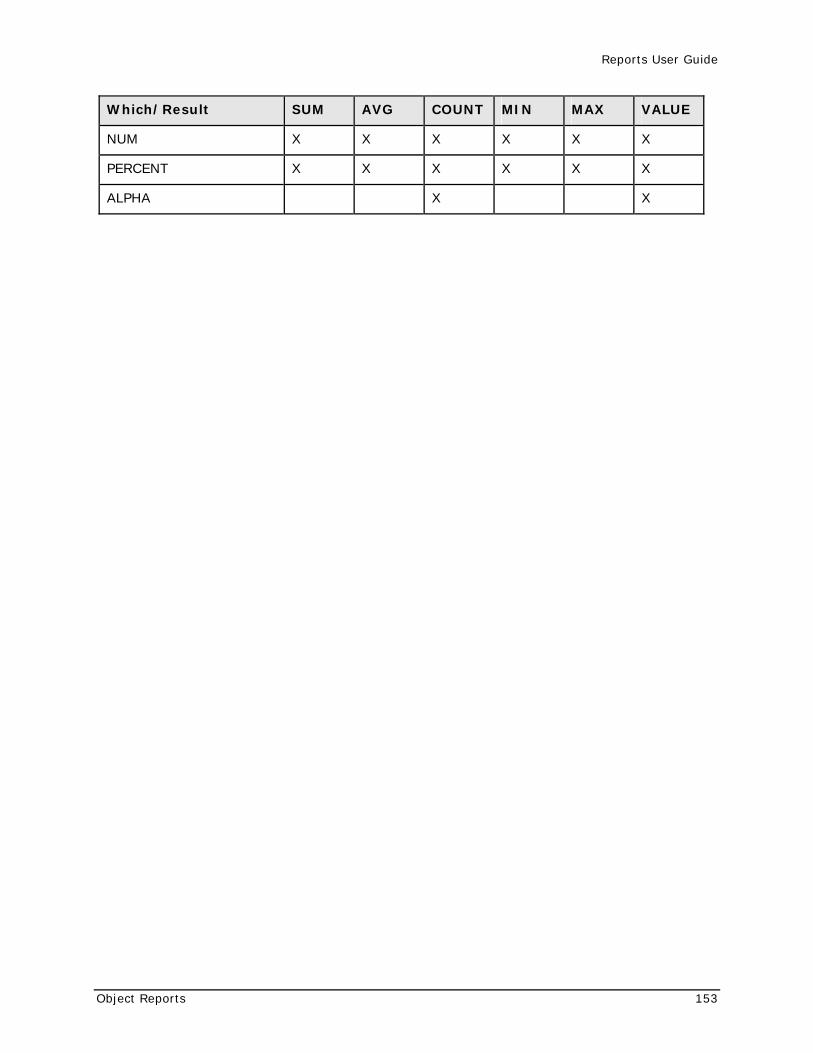
Reports User Guide
Object Reports 153
Which/Result SUM AVG COUNT MIN MAX VALUE
NUM X X X X X X
PERCENT X X X X X X
ALPHA X X

www.PearsonSchoolSystems.com