PowerProbe User's Guide - Lauterbach · · 2018-03-22PowerProbe User’s Guide 1 ... be switched...
46
PowerProbe User’s Guide 1 ©1989-2018 Lauterbach GmbH PowerProbe User’s Guide TRACE32 Online Help TRACE32 Directory TRACE32 Index TRACE32 Documents ...................................................................................................................... PowerProbe ................................................................................................................................... PowerProbe User's Guide ......................................................................................................... 1 Functional Units ...................................................................................................................... 3 Timing Analyzer 4 SOC Interface (Optional) 5 Pattern Generator (Optional) 5 Pulse Generator 5 Input/Output Lines 6 Input Connector Assignments ............................................................................................... 7 General Functions ................................................................................................................... 8 Initialisation 8 Signal Names 8 POD threshold levels and signal display 9 Timing Analyzer ....................................................................................................................... 10 Function 10 Analyzer Control ...................................................................................................................... 12 Basic Trace Control 12 Operation Modes 13 Automatic Trace Control 14 Using the Trigger Delay and Predelay 14 SOC Trace 15 Display Trace ........................................................................................................................... 16 Display Commands 16 Tracking 19 Search and Compare 20 Real-Time Displays 20 Saving Trace Buffers 21 Simple Trigger ......................................................................................................................... 22 Function 23 Trigger Channel Selector 23 Trigger Word 24 Trigger Combiner 25
-
Upload
truongngoc -
Category
Documents
-
view
213 -
download
0
Transcript of PowerProbe User's Guide - Lauterbach · · 2018-03-22PowerProbe User’s Guide 1 ... be switched...

PowerProbe User’s Guide
TRACE32 Online Help
TRACE32 Directory
TRACE32 Index
TRACE32 Documents ......................................................................................................................
PowerProbe ...................................................................................................................................
PowerProbe User's Guide ......................................................................................................... 1
Functional Units ...................................................................................................................... 3
Timing Analyzer 4
SOC Interface (Optional) 5
Pattern Generator (Optional) 5
Pulse Generator 5
Input/Output Lines 6
Input Connector Assignments ............................................................................................... 7
General Functions ................................................................................................................... 8
Initialisation 8
Signal Names 8
POD threshold levels and signal display 9
Timing Analyzer ....................................................................................................................... 10
Function 10
Analyzer Control ...................................................................................................................... 12
Basic Trace Control 12
Operation Modes 13
Automatic Trace Control 14
Using the Trigger Delay and Predelay 14
SOC Trace 15
Display Trace ........................................................................................................................... 16
Display Commands 16
Tracking 19
Search and Compare 20
Real-Time Displays 20
Saving Trace Buffers 21
Simple Trigger ......................................................................................................................... 22
Function 23
Trigger Channel Selector 23
Trigger Word 24
Trigger Combiner 25
PowerProbe User’s Guide 1 ©1989-2018 Lauterbach GmbH

Trigger PreDelay 25
Trigger Filter 25
Trigger Counter 25
Trigger Delay 26
Trigger Out 26
Trigger Setting 26
Complex Trigger ...................................................................................................................... 27
Asynchronous Trigger ............................................................................................................ 28
Asynchronous Trigger Setting 31
Pattern Generator .................................................................................................................... 33
Function 33
System Control 34
Clock Generator 35
Trigger System 35
Pattern Storage 36
Examples 38
Pattern Display 39
Counter ..................................................................................................................................... 41
Signal Selection 41
Universal Counter ................................................................................................................... 42
Function 42
Level Display 43
Display Window 43
Setup 44
Pulse Generator ....................................................................................................................... 45
Function 45
Setup 46
Examples 46
PowerProbe User’s Guide 2 ©1989-2018 Lauterbach GmbH

PowerProbe User’s Guide
Version 22-Mar-2018
Functional Units
The timing analyzer module consists of 3 parts: The timing analyzer, the pattern generator (optional) and the pulse generator.
PODBUS
64
32
9
1
SOC Interface
Timing Analyzer
Pattern Generator
Pulse Generator
PowerProbe User’s Guide 3 ©1989-2018 Lauterbach GmbH

Timing Analyzer
The features of the TIMING ANALYZER are:
Trace The timing analyzer can trace up to 64 channels at 100 MHz sample rate, 32 channels at 200 MHz or 16 channels at 400 MHz. The trace depth is 128K or 256K.
Transient Recording The sampling of the input lines is stored to the trace buffer by changes of the input level only. The total recording time depends on the occurance of changes of the input signals. If the traced signals change only once in one ms only, the total sampling time will be 128 seconds. The minimum trace time is 1.2 ms, which may appear if high-speed clock signals are recorded.
Mixed Trace Every input line can be used for synchronous or asynchronous events. Synchronous events are sampled on the clock edge of the clock input (SCLK0 .. SCLK3). The sampled data are synchronized to the asynchronous trace information.
Simple Triggering The simple trigger unit uses one trigger mask, with can include level or edge detection, a trigger filter and a trigger counter for generating a trigger event. Trigger programming can be done in the data window as easy as setting trigger conditions on a scope.
Complex Triggering The trigger sequence can be defined on 4 trigger levels. The trigger definition is similar to the trigger unit of the state analyzer. 3 Counters are used for generating complex trigger events.
Asynchronous Triggering
This trigger works asynchronous and can detect very short trigger events like glitches. 8 input lines are used to generate a trigger event.
PowerProbe User’s Guide 4 ©1989-2018 Lauterbach GmbH
SOC Interface (Optional)
Pattern Generator (Optional)
The pattern generator can supply up to 9 channels with a resolution of 20 ns. The maximum sequence time is 100 s.
Pulse Generator
One pulse generator is integrated inside the system.
SOC Connector For tracing signals inside FPGAs or ASICs, a scanner module (VHDL) can be integrated inside the chip. Up to 1024 nodes can be traced at a max. speed of 100 MHz. Synchronous operation with target clocks up to 100 MHz is possible.
9 Channels The pattern generator can supply 8 channels on output AUX0 to AUX8.
Repeat Function Every pattern can be defined to be stable for at time up to 100 s.
Clock The clock signal can be generated internally (fixed to 50 MHz) or externally. An extra clock enable signal qualifies the clock signal.
Trigger A trigger signal can be used for continuing the sequence.
Programming The programming of the pattern generator is done in a text window. Macros can be used for repeating the same sequence for many times.
Rate Generator The max. speed of the rate generator is 20 ns/50 MHz. The rate can be changed in steps of 10 ns. The max. rate is 40 s
Pulse Width The pulse width can be set in steps on 10 ns. The max. pulse width is 40 s.
PowerProbe User’s Guide 5 ©1989-2018 Lauterbach GmbH

Input/Output Lines
TRACE32 PowerProbe has high-speed input buffers with probe line compensation. The threshold level can be switched between 1.0 and 1.4 V. Default is 1.4 V for all CMOS and TTL targets down to 2.5 V supply voltage. For 2.5 V targets, 1.0 V threshold level should be selected, for 1.8 V targets, 1.0 V must be selected. The PowerProbe is designed for input voltages of 0.0 V to +5.0 V. If you want to connect higher voltages you have to put a serial resistor in front of the input of the PowerProbe and make sure the input voltage stays below 5.0 V and does never exceed 7.0 V.
X.00..X.15 Input for 100, 200 and 400 MHz
X.16..X.31 Input for 100 and 200 MHz
X.32..X.63 Input for 100 MHz
SCLK0..SCLK3 Input signals for synchronous clocks
AUX0..AUX8 Pattern Generator Output
TOUT0..TOUT8 Trigger Output (0..3), Asynchr. Output (4), Pulse Generator (5), universal counter (6), breaksignals (7, 8)
GND GND Pins
SOCCON Connector for SOC-Adapter
PowerProbe User’s Guide 6 ©1989-2018 Lauterbach GmbH

Input Connector Assignments
X.31
PowerProbe Input Connector
X.00
X.63
X.32
GNDGNDres.res.res.res.AUX8AUX7AUX6AUX5AUX4AUX3AUX2AUX1AUX0TOUT8TOUT7TOUT6TOUT5TOUT4TOUT3TOUT2TOUT1TOUT0GNDGNDSCLK3SCLK2SCLK1SCLK0GNDGND
PowerProbe User’s Guide 7 ©1989-2018 Lauterbach GmbH

General Functions
Initialisation
Signal Names
The NAME function generates logical names for input lines and additionally the polarity of the signal. In the trigger program of the analyzer, logical definitions can be used instead of physical pin names.
The POD function defines the threshold level for input lines. 1.0 and 1.4 V can be selected.
RESet Initialize analyzer, pattern generator and serial line tester
SAVE Save setup
NAME.list Display logical names
NAME.RESet Erase logical names for input pins
NAME.Set Define logical names for input pins
NAME.Group Define logical names for input groups
NAME.Word Define logical names for busses
NAME.Delete Erase logical groups or words for input pins
namepin name pol configuration
word w.BUS x.0 x.1 x.2 x.3 x.4 x.5 x.6 x.7group g.INT x.NMI x.INT0 x.INT1 x.INT2
x.0 x.0 + Syncx.1 x.1 + Syncx.2 x.2 + Syncx.3 x.3 + Syncx.4 x.4 + Syncx.5 x.5 + Syncx.6 x.6 + Syncx.7 x.7 + Syncx.8 x.NMI - Transientx.9 x.INT0 - Transient
x.10 x.INT1 - Transientx.11 x.INT2 - Transient
PowerProbe User’s Guide 8 ©1989-2018 Lauterbach GmbH

POD threshold levels and signal display
POD.state Display threshold level
POD.Level Select threshold level
POD.RESet Set to default
POD0-15 0 1 2 3 4 5 Input1.0 000000000000000016-31 0 1 2 3 4 5 Input1.0 000000000000000032-47 0 1 2 3 4 5 Input1.4 000000000000000048-63 0 1 2 3 4 5 Input1.4 0000000000000000
PowerProbe User’s Guide 9 ©1989-2018 Lauterbach GmbH

Timing Analyzer
Function
Input Control The 64 input lines on the timing analyzer are switched to 16, 32 or 64 input line depending on the sample frequency of the analyzer.
SOC Interface Up to 1024 signals are sampled and transferred in multiplexed mode to the timing analyzer. Then the signals are regenerated and traced.
Trace Memory The trace memory stores all data from the input line.
Time Stamp As the trace memory samples only differences to the previous state, a time-stamp memory is needed to sample the time information.
Transient Detection The circuit detects all changes of the state of the input lines.
Trace Control The trace control unit generates the control signals for the trace and the time-stamp memory, depending on the output of transient detection circuit.
Simple Trigger The simple trigger system has one trigger pattern detection for 64 signals, a trigger filter and a trigger counter.
Asynch. Trigger The asynchronous trigger system has a high-speed trigger comparator for 8 input lines.
64
32
Timing Analyzer Schematics
Simple Trigger
Complex Trigger
Asynch Trigger
Trans. Detector
TraceMemory
TimeStamp
TraceControl
TriggerInput Probes
SOC Interface
PowerProbe User’s Guide 10 ©1989-2018 Lauterbach GmbH

Complex Trigger The complex trigger system consists of the trigger pattern detection, the trigger edge detection, the trigger counters and the trigger sequencer. The trigger sequencer has 4 trigger levels. Every operation in every level is freely programmable. The programming of the trigger unit is done interactively by a special programming language. This language is described in the “PowerProbe Trigger Unit Programming Guide” (powerprobe_prog.pdf)
PowerProbe User’s Guide 11 ©1989-2018 Lauterbach GmbH

Analyzer Control
Basic Trace Control
The trace buffer can either sample information or display the results. In the Arm state the input lines are sampled. The trace can be displayed in the Off or Break state.
Probe.state Show the analyzer state window
Probe.OFF Turn off the analyzer
Probe.Arm Arm the analyzer
Probe.Init Clear the trace buffer and restart the trigger unit and the counters.
Probe.TEST Combination of Init and Arm
Probe.RESet Restore all setting to the default values
Condition: OFFProbe.OFF
Analyzer disabled or break afterAutoArm
Probe.Arm or AutoArm and program start
Condition: ARMED
Analyzer and Trigger enabled
Trigger UnitTrigger reached
STACKmode Condition: TRIGGEREDtrace Probe.Armand Analyzer and Trigger enabled or AutoArm andtrace program startfull
STACK mode trace or Trigger Delayand trace full expired
Condition: BREAKED
Analyzer and Trigger disabled
Analyzer Operation States
PowerProbe User’s Guide 12 ©1989-2018 Lauterbach GmbH

All basic functions of the Power Probe can be controlled by the probe state window.
The window displays information about the actual state, the mode and the number of records in the trace buffer. It also shows information about the trigger unit, like logical trigger level, counters and flags.
Operation Modes
The behavior characteristics of the analyzer can be changed by the Probe.Mode command. The basic operation mode for the trace storage can be FIFO or STACK.
TRIGGER The analyzer is waiting for the expiration of the trigger delay.
Break The trigger unit has stopped the recording
used Displays the used records in the trace buffer
Probe.Mode Fifo FIFO operation mode, analyzer records the last cycles before stop recording
Probe.Mode Stack STACK operation mode, the analyzer stops recording, when the trace buffer is full
Probe.Mode 50|100|200|400 Selects the trace speed of the analyzer In 200 MHz mode only 32 input lines are active, in 400 MHz mode only 16 lines are used. The 50 MHz mode is used with the SOC Connector and slow target systems.
Probe.Mode 1X32, … Settings for SOC trace
PowerProbe User’s Guide 13 ©1989-2018 Lauterbach GmbH

Automatic Trace Control
To simplify the controlling of the analyzer, different automatic control options are available. As a default the AutoArm option is active. This means that the analyzer will be armed automatically when the user program is started, and switches to off, after stopping the real-time emulation.
The combination of AutoTEST and Stack operation mode can be used for making random samples and displaying the results continuously:
The result will be a continuously updated trace list window, which shows the last sampled signals.
Using the Trigger Delay and Predelay
The trigger delay is used for the adjustment of the trigger point inside the whole sampling.
The selected value is the percentage of trace memory records which will be sampled respectively overwritten after the occurrence of the trigger event released from the trigger unit.
The actual value could be less if the sampling is switched to off manually by the user before the maximum value is reached.
Probe.AutoArm Arm the analyzer before starting the user program (ICE or ICD), switch off after stopping
Probe.AutoTEST Automatically arm the analyzer after all windows have been updated
Probe.m autotest ON
Probe.m stack
Probe.l
Go
Probe.TDelay Define the trigger delay
Probe.TPreDelay Define the trigger predelay
PowerProbe User’s Guide 14 ©1989-2018 Lauterbach GmbH

The default trigger delay is 0. In this case the trigger point is at the last sampled record in the trace memory.
e.g. 0 = the sampling stops immediately
50 = up to 64K records will be recorded
100 = up to all 128K records will be recorded
SOC Trace
The SOC trace system allows tracing of internal signals in ASIC and FPGA designs. Signals are sampled by a module named “SOC scanner” and send-out to a standardized connector. Up to 1024 signals can be sampled simultaneously. The transfer to the analyzer in on a 100 MHz synchronous bus. For information how to implement the SOC cell in your design, refer to ”PowerProbe SOC User’s Guide” (powerprobe_soc.pdf).
Probe.Mode Defines the type of the SOC scanner module
Probe.SELect Selects the signals sampled by the analyzer
a.td 0%
0 128K sampled records Ttrigger point
p.td 50%
0 128K sampled records Ttrigger point
p.td 100%
0 128K sampled records Ttrigger point
PowerProbe User’s Guide 15 ©1989-2018 Lauterbach GmbH

Display Trace
Display Commands
The trace buffer can be displayed in tabular form or in graphical form.
The Probe.Get command displays the actual input state and activity.
Probe.List Displays trace in table format
Probe.Timing Displays channels as waveform graphics
Probe.Get Displays the input signal level and activity
Probe.View Displays one line
Probe.Chart Display graphically
HIGH Signal stays high
LOW Signal stays low
HILO Signal is toggling
PowerProbe User’s Guide 16 ©1989-2018 Lauterbach GmbH
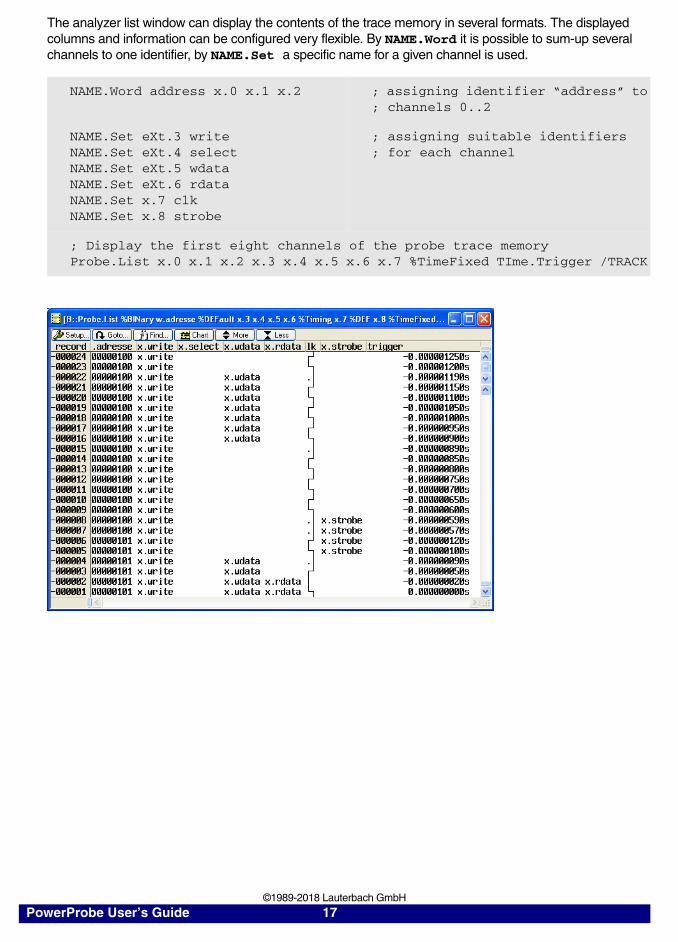
The analyzer list window can display the contents of the trace memory in several formats. The displayed columns and information can be configured very flexible. By NAME.Word it is possible to sum-up several channels to one identifier, by NAME.Set a specific name for a given channel is used.
NAME.Word address x.0 x.1 x.2 ; assigning identifier “address” to; channels 0..2
NAME.Set eXt.3 writeNAME.Set eXt.4 selectNAME.Set eXt.5 wdataNAME.Set eXt.6 rdataNAME.Set x.7 clkNAME.Set x.8 strobe
; assigning suitable identifiers; for each channel
; Display the first eight channels of the probe trace memoryProbe.List x.0 x.1 x.2 x.3 x.4 x.5 x.6 x.7 %TimeFixed TIme.Trigger /TRACK
PowerProbe User’s Guide 17 ©1989-2018 Lauterbach GmbH
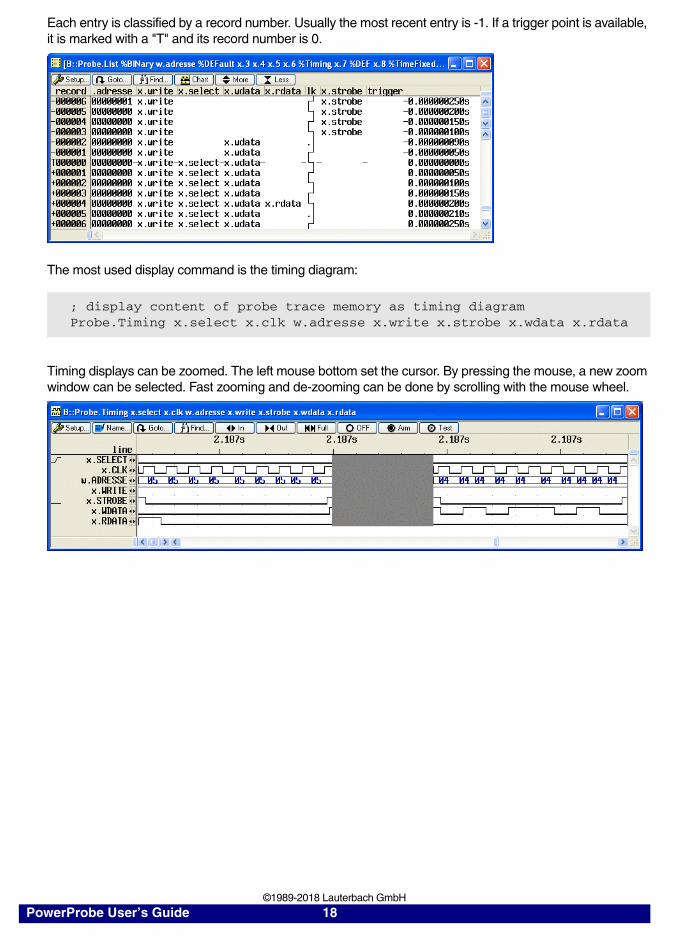
Each entry is classified by a record number. Usually the most recent entry is -1. If a trigger point is available, it is marked with a "T" and its record number is 0.
The most used display command is the timing diagram:
Timing displays can be zoomed. The left mouse bottom set the cursor. By pressing the mouse, a new zoom window can be selected. Fast zooming and de-zooming can be done by scrolling with the mouse wheel.
; display content of probe trace memory as timing diagramProbe.Timing x.select x.clk w.adresse x.write x.strobe x.wdata x.rdata
PowerProbe User’s Guide 18 ©1989-2018 Lauterbach GmbH

Tracking
The tracking option forces all port analyzer windows, which are in tracking mode (option /Track), to pan to the same position like the reference window. The reference window can be any analyzer display window from the state analyzer, the timing analyzer or the port analyzer. The reference point is fixed to the absolute time. Every analyzer system has an independent, but correlated, time-stamp unit. The tracking function can be used also for displaying port analyzer windows with different zoom rates. Tracking can also be done subsequently by drag-and-drop.
The Probe.View shows only one frame of the trace storate:
Probe.View /TrackProbe.Timing
; define tracking window for port analyzer
PowerProbe User’s Guide 19 ©1989-2018 Lauterbach GmbH

Search and Compare
Several commands allow to search for specific events, or compare the trace against a reference:
The Find command allows to search for the occurrence of a data pattern:
The ComPare command can compare the current trace against a reference trace saved on disk:
Real-Time DisplaysThe information recorded by the analyzer can be displayed, while the analyzer is sampling information.
The command AutoTEST can be used to make random samples and show the results continuously.
Probe.GOTO Track the display window to a new record
Probe.Find Search for records matching the pattern
Probe.ComPare Compare two traces or the trace buffer against a file
Probe.REF Set reference record for timing measurements
p.f , data w.test:0x55 ; search for matching data on; probe A is 55h
p.f , x.puls1 on at -1. x.nmi off ; search for rising edge of; the puls1 signal
p.f , w.dat 0x5--0x44 or w.dat 0xff ; search for different data bytes
p.f ; search for next occurrence
p.load x1
p.l /track ; display current trace
p.l /track /file ; display reference trace
p.cp , , x.0 x.0 /file ; compare two lines against; file (complete trace memory)
p.cp ; compare next entrys
Probe.AutoTEST Arm the analyzer after all windows have been updated
PowerProbe User’s Guide 20 ©1989-2018 Lauterbach GmbH

Saving Trace Buffers
The contents of the trace buffer can be saved on disk and recalled later. The recalled trace buffer can be accessed by all regular analyzer commands by adding the option /FILE.
Saving a part of the trace buffer can be done by the following command:
Exporting signals of the trace buffer to a VHDL Wait file can be done by the following command:
The trace can be recalled and viewed again by the Load command:
Comparing the file against a new record is possible with the ComPare command:
Probe.SAVE Save the contents of the trace buffer
Probe.EXPORT Exports trace data to VHDL file
Probe.LOAD Load a saved trace buffer as a reference
p.save test (-1000.)--0x0
p.export test x.0 x.1 x.2 w.test
p.load test
p.l /file
p.load test
p.cp (-1000.)--0x0 -1000. C0 C1 /file
PowerProbe User’s Guide 21 ©1989-2018 Lauterbach GmbH
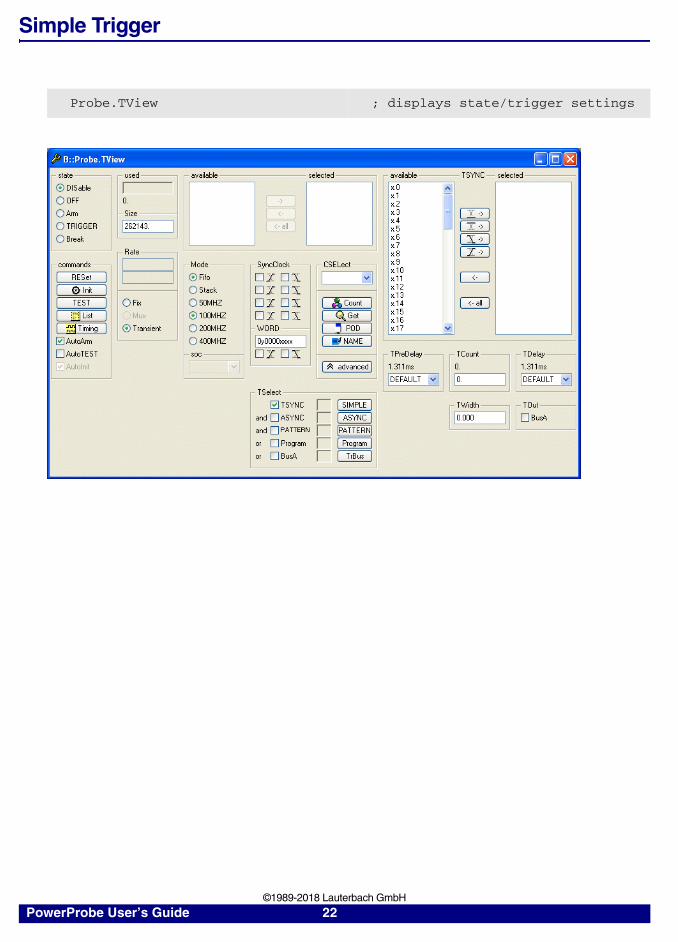
Simple Trigger
Probe.TView ; displays state/trigger settings
PowerProbe User’s Guide 22 ©1989-2018 Lauterbach GmbH

Function
The trigger concept allows fast programming of trigger events related to the application of the port analyzer.
Trigger Channel Selector
The selected signals for trigger and trace (in fixed or transient mode) are the same. If a trigger signal has been selected which is not in the list of the selected trace signals, the signal will be added automatically. Max. 32 signals can be selected out of the 1024 SOC signals. The external signals (from the front connector of the port analyzer) can be used for triggering at any time. These signals are always selected.
TriggerComparatorandEdge Detector
TriggerCombiner
TriggerFilter
TriggerCounter
TriggerDelayCounter
PretriggerDelay
TriggerLatch
Trigger
Break
BUSA
ASYNC
Program
PATTERN
&
&
&
&
&
TSYNC
PowerProbe User’s Guide 23 ©1989-2018 Lauterbach GmbH

Trigger Word
The trigger signal can be generated out of the 32 port channels and the 32 external channels. Every signal can be qualified as high, low, rising and falling edge.
More than 1 edge can be combined to a trigger word. To detect a valid combination of edges, the edges must have a max. skew of 20 ns.
Edges and state signals can be combined. The state signal must be stable 40 ns before the edge. The sampling of the state signal is guaranteed before the edge is detected.
HighLowRising
FallingDon’t CareDon’t Care
Don’t CareDon’t CareDon’t Care
Channel 0
Channel 63
10 ns max.
Rising
Falling
20 ns min.
Rising
Low
PowerProbe User’s Guide 24 ©1989-2018 Lauterbach GmbH

Trigger Combiner
The trigger signals from the trigger word selector, the asynchronous trigger unit and the bus trigger signals can be combined to form a valid trigger signals. The combining is made on a and basis. Therefore trigger conditions can be qualified by bus trigger signals generated by the state analyzer or other systems.
The trigger or break signals from the emulator can be used to stop the port analyzer.
Trigger PreDelay
For avoiding nearly empty trace buffers, the trigger system can be activated only after the trace buffer is filled partly.
Trigger Filter
The trigger filter selects valid trigger signals from glitches or runts on the input lines. It can be used to trigger on a minimum pulse width. Trigger filtering should not be used, if edge triggering is selected in the trigger word qualifier.
Trigger Counter
The trigger counter delays the triggering on the n-th event of a valid trigger condition. The value zero means triggering immediately, one on the first occurrence of the trigger event.
Filter Time
Input Signal
Trigger Signal
Trigger Signal
Trigger Counter = 0 Trigger Counter = 1Trigger Counter = 2
PowerProbe User’s Guide 25 ©1989-2018 Lauterbach GmbH

Trigger Delay
Alter the trigger condition has been latched, a trigger delay is used before stopping the port analyzer. The delay can be defined with an absolute time (1 ms to 10 s) or in percentage of the trace storage.
Trigger Out
When reaching the trigger state (trigger latch is true), some other systems of the emulator system can be triggered by the port analyzer. The trigger out signals are true as long as the port analyzer is running and the trigger latch has been set. The port analyzer can trigger the emulator directly.
Trigger Setting
Probe.TView Trigger state window
Probe.TSYNC Selects trigger source and level/edge mode
Probe.TPreDelay Select pre-trigger delay
Probe.TWidth Select minimum trigger width
Probe.TCount Sets trigger counter
Probe.TDelay Defines trigger delay
Probe.TOut Activate Trigger Output Signals
Trigger Point Stopped
TOUT8, TOUT9
Trigger Point Stopped
TOUT0..TOUT3
PowerProbe User’s Guide 26 ©1989-2018 Lauterbach GmbH

Complex Trigger
If the trigger unit is not programmed, the analyzer samples all signals on the input probe. For selective recording or complex triggering, the trigger unit must be programmed. The command Probe.Program opens a special editor window for entering an analyzer trigger program. The input is guided by softkeys and the context selective help.
A click on the compile button starts the trigger language compiler. When the compilation is error-free, the "compiled successfully" message in the state line will appear. The name of the program is shown in the analyzer state window. The analyzer is now ready to perform the programmed actions.
Probe.Program Write a program for the trigger unit interactive with softkey support
Probe.ReProgram Load a program into the trigger unit without interactive window
Probe.state Displays the name of the trigger program and the values of counters and flags
PowerProbe User’s Guide 27 ©1989-2018 Lauterbach GmbH
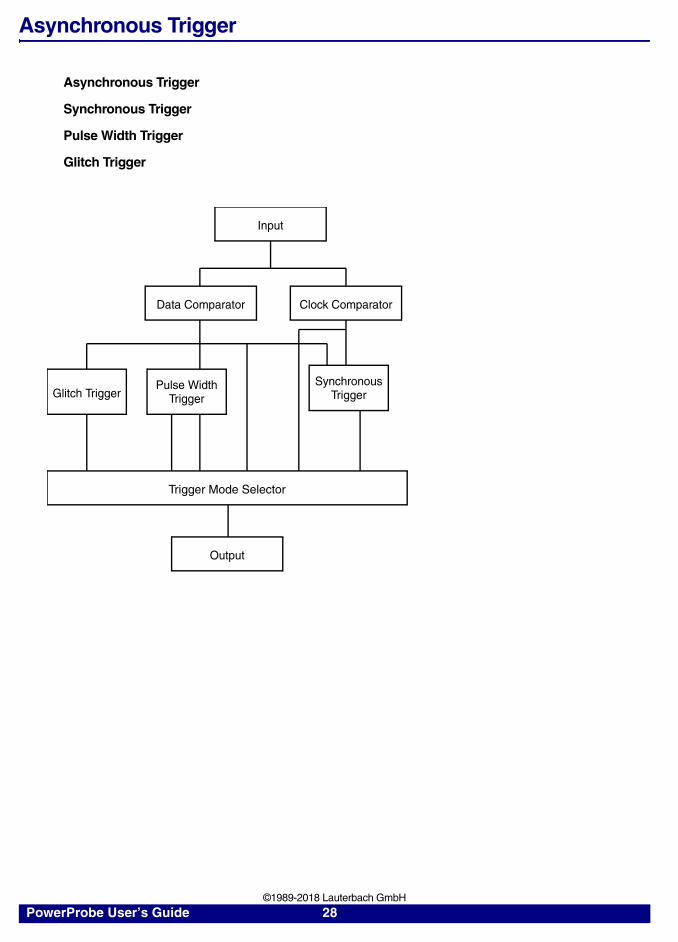
Asynchronous Trigger
Asynchronous Trigger
Synchronous Trigger
Pulse Width Trigger
Glitch Trigger
Input
Data Comparator Clock Comparator
Output
Pulse WidthTrigger
SynchronousTriggerGlitch Trigger
Trigger Mode Selector
PowerProbe User’s Guide 28 ©1989-2018 Lauterbach GmbH

The asynchronous trigger system can be divided into four functional groups:
Data Comparator The data comparator generates a signal out of the 8 input signals. Every line can be set to high, low or don’t care. The output can be active high or low.
Clock Comparator The clock comparator generates a signal out of the 8 input signals. Every line can be set to high, low or don’t care. The signal is used as a clock signal for the synchronous trigger function. The output can be active high or low.
Input0
Input7
Input1Input2Input3Input4Input5Input6
& -1DATA
Input0
Input7
Input1Input2Input3Input4Input5Input6
& -1CLOCK
PowerProbe User’s Guide 29 ©1989-2018 Lauterbach GmbH
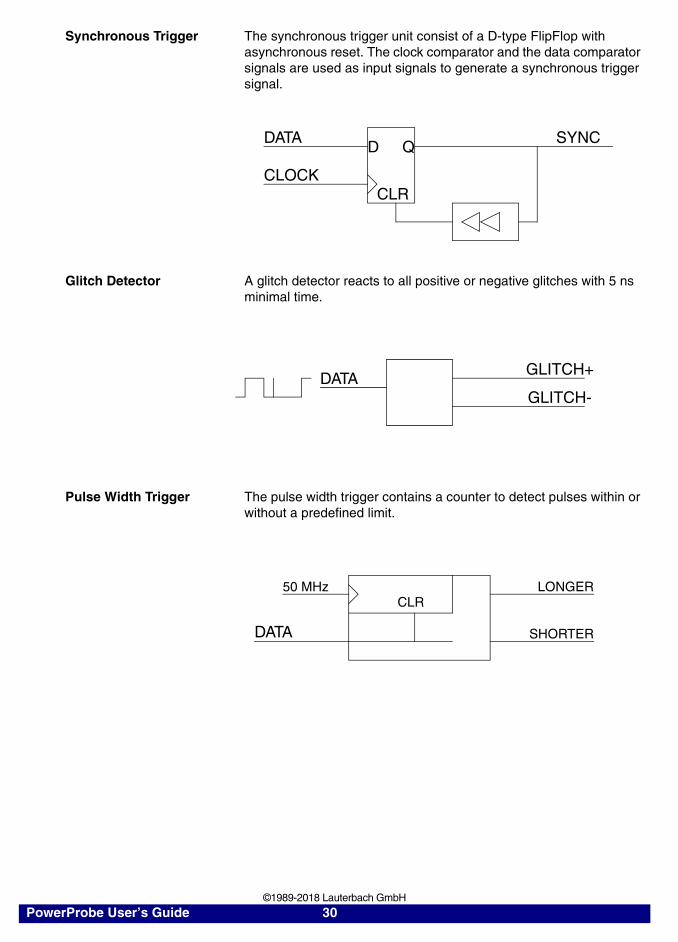
Synchronous Trigger The synchronous trigger unit consist of a D-type FlipFlop with asynchronous reset. The clock comparator and the data comparator signals are used as input signals to generate a synchronous trigger signal.
Glitch Detector A glitch detector reacts to all positive or negative glitches with 5 ns minimal time.
Pulse Width Trigger The pulse width trigger contains a counter to detect pulses within or without a predefined limit.
DATA
CLOCK
D Q
CLR
SYNC
DATAGLITCH+
GLITCH-
50 MHz
DATA
CLRLONGER
SHORTER
PowerProbe User’s Guide 30 ©1989-2018 Lauterbach GmbH

Asynchronous Trigger Setting
The asynchronous trigger window is used for setting up the asynchronous trigger mode and the trigger signals,
Example
Trigger is done on falling edge of input line 7 when input line 0 and 1 are high
Probe.ASYNC.view Show window
Probe.ASYNC.Mode Select trigger mode
Probe.ASYNC.Data Select data mask
Probe.ASYNC.DataPOL Select polarity for data signal
Probe.ASYNC.Clock Select clock mask
Probe.ASYNC.ClockPOL Select polarity for clock signal
Probe.ASYNC.Time Define pulse width
Probe.ASYNC.Data 0yxxxxxx11Probe.ASYNC.DataPOL +
; Defines bit 0 and 1 for high
Probe.ASYNC.Clock 0y1xxxxxxxProbe.ASYNC.ClockPOL -
; Defines bit 7 for high; Selects falling edge
Probe.ASYNC.Mode SYNC ; Select SYNC mode
PP::a.asyncTime Data Clock
0.000 0yxxxxxxxx 0yxxxxxxxx
Mode 0 1 0 1 DATA 0 1 0 1
CLOCK 0 1 0 1SYNC 0 1 0 1
LONGER 0 1 0 1SHORTER 0 1 0 1GLITCH+ 0 1 0 1GLITCH- 0 1 0 1GLITCH DataPOL ClockPOL
+ +- -
PowerProbe User’s Guide 31 ©1989-2018 Lauterbach GmbH
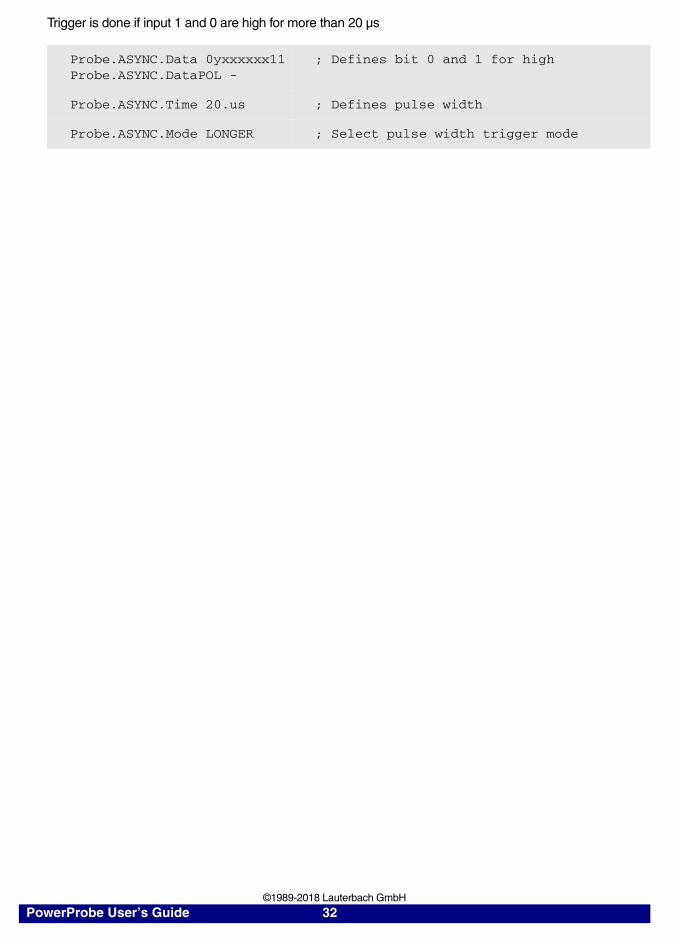
Trigger is done if input 1 and 0 are high for more than 20 µs
Probe.ASYNC.Data 0yxxxxxx11Probe.ASYNC.DataPOL -
; Defines bit 0 and 1 for high
Probe.ASYNC.Time 20.us ; Defines pulse width
Probe.ASYNC.Mode LONGER ; Select pulse width trigger mode
PowerProbe User’s Guide 32 ©1989-2018 Lauterbach GmbH

Pattern Generator
Function
The pattern generator storage memory is 256 frames in depth and 16 bit width. The pattern storage can hold data patterns, delay times and control commands. PowerProbe has 9 outputs (AUX0...AUX8). Additionally the pattern generator can send a trigger to the podbus, or trigger the analyzer. The max. external clock speed is 100 MHz, clock to output time is approx. 15 ns.
2
6
Pattern Generator
9
ClockGenerator
TriggerSystem
System Control
Pattern Storage Ouput Control
PowerProbe User’s Guide 33 ©1989-2018 Lauterbach GmbH

System Control
After programming the pattern generator, the pattern sequence can be started by the command Pattern.Arm. On every clock edge the next data pattern is activated on the output probes. The pattern generator can be stopped by the command Pattern.OFF. The pattern sequence is restarted by the Pattern.Init command.
Pattern.state Display control window of pattern generator
Pattern.Arm Starts pattern generator
Pattern.OFF Stops pattern generator
Pattern.Init Stops pattern generator and sets pattern counter to start position
Pattern.TEST Init and Arm pattern generator
Pattern.Step Single-step
Pattern.RESet Reset pattern generator to power-on state
PP::pstate used pattern program file
OFF edit browseArm records
wait 0. CMode TMode TSelecttriggered clocks Intern High OFFstopped 0. Single Low X26
time Rising Rising X27commands 0.000 Falling Falling X28
RESet SYnch X29Init clock TLatch TRIGGERTEST CEnable TLatch BusAStep High RESTARTTiming Low
ALways
PowerProbe User’s Guide 34 ©1989-2018 Lauterbach GmbH

Clock GeneratorThe pattern generator can run with internal or external clock and in single-step mode. The internal clock is fixed to 100 MHz. The external clock edge may be selected. An additional clock enable inputs qualifies the internal or external clock signal. The external clock signal is on input x.24, the clock-enable signal on input x.25. Additional the clock generated by the synchronous clock qualifier can be used.
Trigger System
The trigger input is either edge or level sensitive. The trigger input is either external or internal from the podbus or the complex trigger. Usually the trigger signal is only sensed, if the pattern generator is in WAIT state. Previous trigger events are ignored. By the function TLatch previous trigger events are stored until the next WAIT instruction occurs in the pattern sequence. Trigger overruns are ignored. The external trigger inputs are on X.26 to X29.
Pattern.CMode Selects internal or external clock and clock edge
Pattern.CEnable Controls clock qualifier
Pattern.Step Single-Step function
Pattern.TSELect Selects the trigger input
Pattern.TMode Selects the trigger mode
Pattern.TLatch Selects trigger latch mode
PowerProbe User’s Guide 35 ©1989-2018 Lauterbach GmbH

Pattern Storage
The pattern memory is programmed by an ASCII file. Every line in the text defines a new pattern setup. A delay function repeats the previous state n times. 9 pattern lines can be controlled by the pattern generator. The pattern file commands are:
Set <pattern> Defines the state of the pattern generator output lines. A string is interpreted as multiple patterns. A mask is used to change only some bits in the sequence. All bit positions with don't care bits don't change the previous bits. Pattern storage usage: 1 frame per state
DEFAULT Defines the default setup for Delay, Wait or NONE
WAIT Hold previous state until trigger event occursPattern storage usage: 1 frame
DELAY <delaytime> Hold previous state for the specified timePattern storage usage:0.01us..2.57us: 1 frame2.58us..167ms: 2 frames>167ms: (<delaytime>/167ms) * 2 frames
RESTART The pattern sequence starts again with the first linePattern storage usage: 1 frame
STOP The pattern sequence stops here. It can be started by the commands INIT and ARM (or TEST) only.Pattern storage usage: 1 frame
PP::w.p.pset p.0:0 repeat 3(
set p.0:1set p.1:0
)delay 0.3usset p.1:1delay 0.3usset p.1:0waitrestart
PowerProbe User’s Guide 36 ©1989-2018 Lauterbach GmbH

REPEAT <count>( <command> <command> ...)
Repeat pattern sequence. The next line or the next block will be repeated <count> times. Repeat functions may be nested.Pattern storage usage: (amount used by commands) * <count>
Trigger Send a trigger to the analyzer or to the podbus.Pattern storage usage: 1 frame
Pattern.Program Defines the pattern sequence
Pattern.ReProgram Load an already defined pattern sequence
PowerProbe User’s Guide 37 ©1989-2018 Lauterbach GmbH

Examples
Monoflop function with delay
set p.0:0waitdelay 990nsset p.0:1delay 1990nsset p.0:0restart
; set channel p.0 to zero; wait for trigger event; delay 990 ns; set channel p.0 (aux0) to high; delay for 1990 ns again; set channel p.0 (aux0) to low; restart pattern sequence
Triple pulse every second
set p.0:0repeat 3.(set p.0:1delay 1990nsset p.0:0delay 990ns)delay 1.s-6.us-0.02usrestart
; set channel 0
; set aux0 to high; delay for 1990 ns; set aux0 to low; pulse low time 990 ns
; restart pattern sequence
Cascading pulses
set 0set p.0:1delay 1990nsset p.1:1delay 1990nsset p.2:1stop
; set all aux lines to zero; set aux0 to high; delay for 1.9 µs; set aux1 to high
; set aux2 to high
1.0 us 2.0 us
Trigger Event
.....
.....3.us 3.us 1.s-6.us
PowerProbe User’s Guide 38 ©1989-2018 Lauterbach GmbH
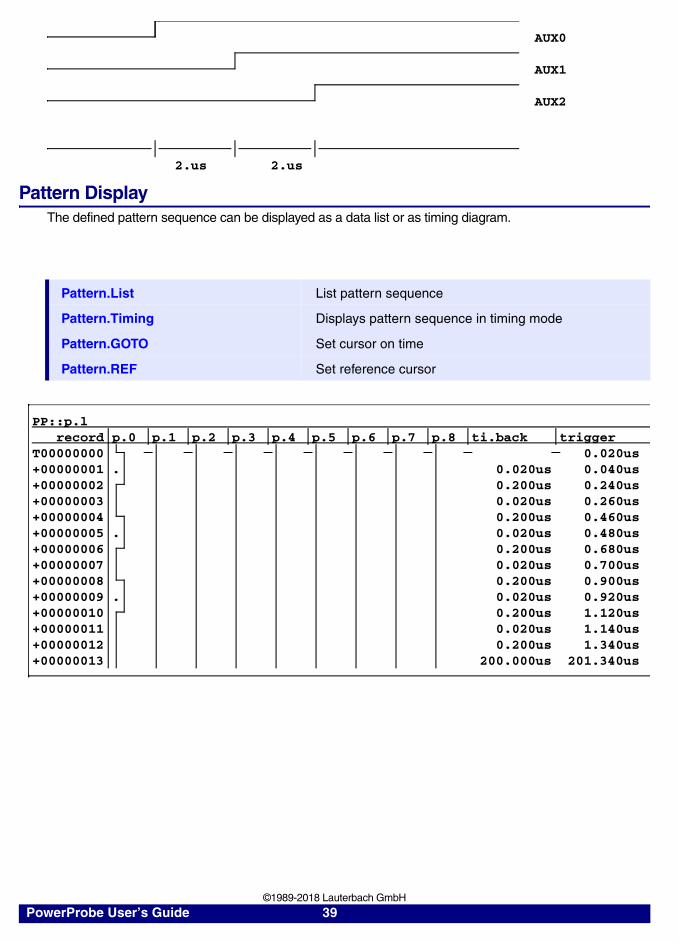
Pattern DisplayThe defined pattern sequence can be displayed as a data list or as timing diagram.
Pattern.List List pattern sequence
Pattern.Timing Displays pattern sequence in timing mode
Pattern.GOTO Set cursor on time
Pattern.REF Set reference cursor
AUX0
AUX1
AUX2
2.us 2.us
PP::p.lrecord p.0 p.1 p.2 p.3 p.4 p.5 p.6 p.7 p.8 ti.back trigger
T00000000 0.020us+00000001 . 0.020us 0.040us+00000002 0.200us 0.240us+00000003 0.020us 0.260us+00000004 0.200us 0.460us+00000005 . 0.020us 0.480us+00000006 0.200us 0.680us+00000007 0.020us 0.700us+00000008 0.200us 0.900us+00000009 . 0.020us 0.920us+00000010 0.200us 1.120us+00000011 0.020us 1.140us+00000012 0.200us 1.340us+00000013 200.000us 201.340us
PowerProbe User’s Guide 39 ©1989-2018 Lauterbach GmbH
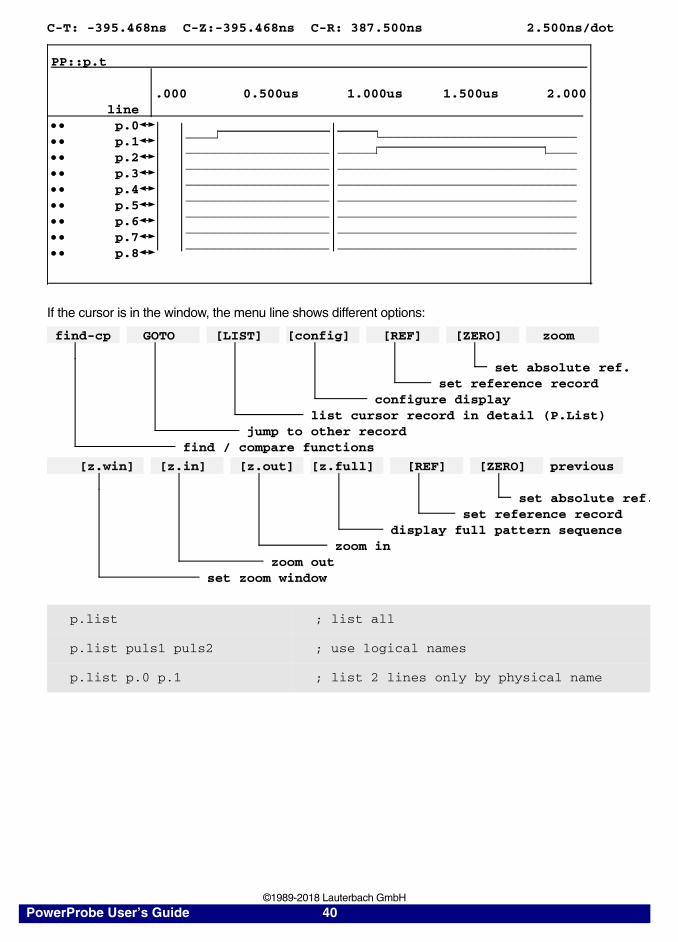
If the cursor is in the window, the menu line shows different options:
p.list ; list all
p.list puls1 puls2 ; use logical names
p.list p.0 p.1 ; list 2 lines only by physical name
C-T: -395.468ns C-Z:-395.468ns C-R: 387.500ns 2.500ns/dot
PP::p.t
.000 0.500us 1.000us 1.500us 2.000line
p.0 p.1 p.2 p.3 p.4 p.5 p.6 p.7 p.8
____ ___________________________________________ _____ ______________________ ________________________________________________ ________________________________________________ ________________________________________________ ________________________________________________ ________________________________________________ ______________________________
find-cp GOTO [LIST] [config] [REF] [ZERO] zoom
set absolute ref.set reference record
configure displaylist cursor record in detail (P.List)
jump to other recordfind / compare functions
[z.win] [z.in] [z.out] [z.full] [REF] [ZERO] previous
set absolute ref.set reference record
display full pattern sequencezoom in
zoom outset zoom window
PowerProbe User’s Guide 40 ©1989-2018 Lauterbach GmbH

Counter
Every signal (inputs and regenerated SOC nodes) can be feeded to the universal counter.
Signal Selection
Example
Probe.CSELelect Select counter signal
Probe.CSEL X.0 ; selects signal RD
C.Select X.0 ; selects signal
PowerProbe User’s Guide 41 ©1989-2018 Lauterbach GmbH

Universal Counter
Function
The universal counter is the logic measurement system for sampling of pulses and frequencies. The input multiplexer enables the counter to measure all important CPU lines and all external probe inputs. Therefore the counter input normally need not be hard wired to the signal.
The count ranges are:
The input signal is selected with the function Count.Select. The function Count.Mode is used to change the counter mode and the Count.Gate function defines the gate time. Frequency and event analyzing may be qualified by the foreground running signal.
If there is no event counting, it will be possible to activate more than one count window. Every window represents a separate counter. For example it is possible to check the clock frequency and the puls width on some probe inputs simultaneously.
frequency: 0 … 200 MHzPuls width: 100 ns 300 daysPeriod: 100 ns 300 daysEvents: 2.8 * 10E+14, max. rate 10 MHz
ClockX.0X.1.................. Input... multiplexer Universal... Counter...........................
Principle of Universal Counter
PowerProbe User’s Guide 42 ©1989-2018 Lauterbach GmbH

Level Display
If there is no signal (frequency is zero), the level of the input signal will be displayed (high or low level).
Display Window
. . 7 .9 9 9 .9 2 0 . Hz Clock (*80) Low
Gate Value Type Channel Resolution Level detection
PowerProbe User’s Guide 43 ©1989-2018 Lauterbach GmbH
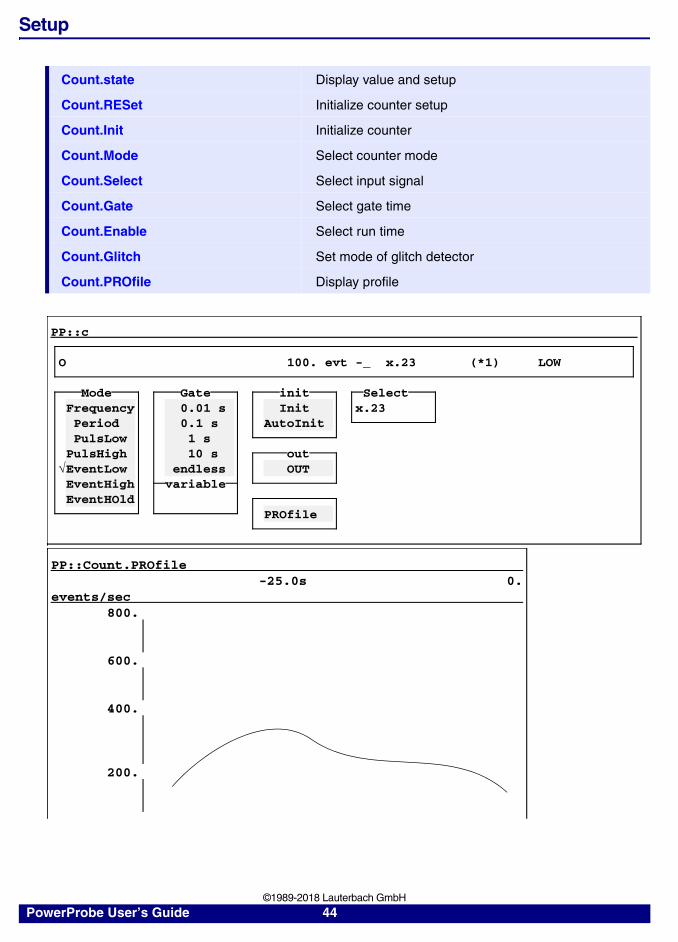
Setup
Count.state Display value and setup
Count.RESet Initialize counter setup
Count.Init Initialize counter
Count.Mode Select counter mode
Count.Select Select input signal
Count.Gate Select gate time
Count.Enable Select run time
Count.Glitch Set mode of glitch detector
Count.PROfile Display profile
PP::c
O 100. evt -_ x.23 (*1) LOW
Mode Gate init SelectFrequency 0.01 s Init x.23Period 0.1 s AutoInitPulsLow 1 s
PulsHigh 10 s outEventLow endless OUTEventHigh variableEventHOld
PROfile
PP::Count.PROfile-25.0s 0.
events/sec800.
600.
400.
200.
PowerProbe User’s Guide 44 ©1989-2018 Lauterbach GmbH
Pulse Generator
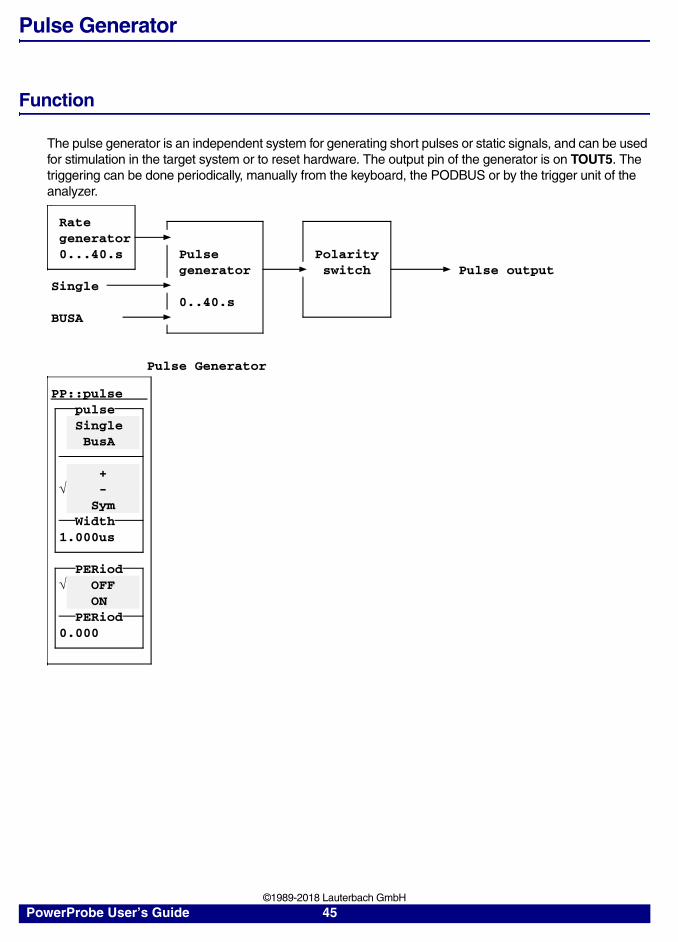
Function
The pulse generator is an independent system for generating short pulses or static signals, and can be used for stimulation in the target system or to reset hardware. The output pin of the generator is on TOUT5. The triggering can be done periodically, manually from the keyboard, the PODBUS or by the trigger unit of the analyzer.
Rategenerator0...40.s Pulse Polarity
generator switch Pulse output Single
0..40.sBUSA
Pulse Generator
PP::pulsepulseSingleBusA
+ -
SymWidth
1.000us
PERiod OFF
ONPERiod
0.000
PowerProbe User’s Guide 45 ©1989-2018 Lauterbach GmbH
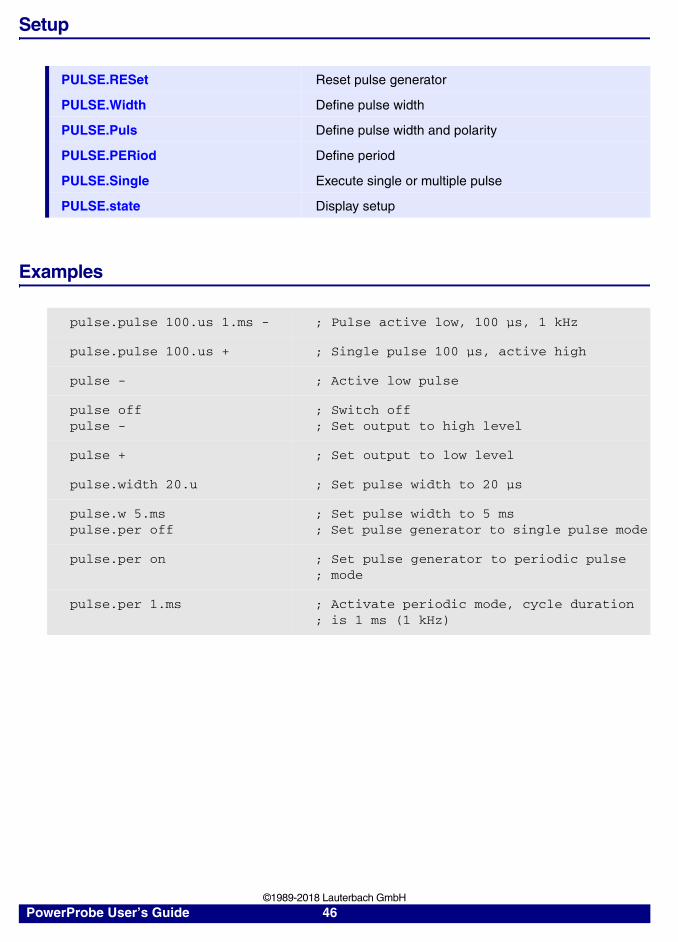
Setup
Examples
PULSE.RESet Reset pulse generator
PULSE.Width Define pulse width
PULSE.Puls Define pulse width and polarity
PULSE.PERiod Define period
PULSE.Single Execute single or multiple pulse
PULSE.state Display setup
pulse.pulse 100.us 1.ms - ; Pulse active low, 100 µs, 1 kHz
pulse.pulse 100.us + ; Single pulse 100 µs, active high
pulse - ; Active low pulse
pulse offpulse -
; Switch off; Set output to high level
pulse + ; Set output to low level
pulse.width 20.u ; Set pulse width to 20 µs
pulse.w 5.mspulse.per off
; Set pulse width to 5 ms; Set pulse generator to single pulse mode
pulse.per on ; Set pulse generator to periodic pulse; mode
pulse.per 1.ms ; Activate periodic mode, cycle duration; is 1 ms (1 kHz)
PowerProbe User’s Guide 46 ©1989-2018 Lauterbach GmbH