General Commands Reference Guide L - Lauterbach
59
MANUAL Release 09.2021 General Commands Reference Guide L
Transcript of General Commands Reference Guide L - Lauterbach
MANUAL
Release 09.2021
General Commands Reference Guide L

General Commands Reference Guide L
TRACE32 Online Help
TRACE32 Directory
TRACE32 Index
TRACE32 Documents ......................................................................................................................
General Commands ......................................................................................................................
General Commands Reference Guide L ................................................................................... 1
LA .............................................................................................................................................. 7
LA Logic analyzer 7
LA-specific Trace Commands ................................................................................................ 8
LA.IMPORT Import trace information 8
LA.IMPORT.CoreByteStream Import pure single core trace data 10
LA.IMPORT.cycles Import bus trace data 11
LA.IMPORT.ELA Import ELA trace data 11
LA.IMPORT.ETB Import on-chip trace data 11
LA.IMPORT.GUESSWRAP Guess wrap pointer 13
LA.IMPORT.StartInvalid Set start of trace as invalid 13
LA.IMPORT.StartValid Set start of trace as valid 14
LA.IMPORT.STP Import STP recording from file (nibble) 14
LA.IMPORT.STPByteStream Import STP recording from file (byte) 15
LA.IMPORT.TraceFile Import trace data where processing has failed 15
LA.IMPORT.TracePort Import off-chip trace data 16
LA.IMPORT.UltraSOC Import raw UltraSOC flow trace data 16
LA.IMPORT.VCD Import recorded signals in VCD file format 16
LA.IMPORT.WRAP Define wrap pointer 17
LA.Mode Set the trace operation mode 18
Generic LA Trace Commands ................................................................................................ 19
LA.ACCESS Define access path to program code for trace decoding 19
LA.Arm Arm the trace 19
LA.AutoArm Arm automatically 19
LA.AutoInit Automatic initialization 19
LA.BookMark Set a bookmark in trace listing 19
LA.Chart Display trace contents graphically 19
LA.CLOCK Clock to calculate time out of cycle count information 20
LA.ComPare Compare trace contents 20
LA.ComPareCODE Compare trace with memory 20
LA.DISable Disable the trace 20
LA.DRAW Plot trace data against time 20
General Commands Reference Guide L | 2©1989-2021 Lauterbach GmbH
LA.EXPORT Export trace data for processing in other applications 20
LA.FILE Load a file into the file trace buffer 20
LA.Find Find specified entry in trace 20
LA.FindAll Find all specified entries in trace 21
LA.FindChange Search for changes in trace flow 21
LA.FLOWPROCESS Process flowtrace 21
LA.FLOWSTART Restart flowtrace processing 21
LA.GOTO Move cursor to specified trace record 21
LA.Init Initialize trace 21
LA.List List trace contents 21
LA.ListNesting Analyze function nesting 22
LA.ListVar List variable recorded to trace 22
LA.LOAD Load trace file for offline processing 22
LA.OFF Switch off 22
LA.PROfileChart Profile charts 22
LA.PROTOcol Protocol analysis 22
LA.PROTOcol.Chart Graphic display for user-defined protocol 22
LA.PROTOcol.Draw Graphic display for user-defined protocol 23
LA.PROTOcol.EXPORT Export trace buffer for user-defined protocol 23
LA.PROTOcol.Find Find in trace buffer for user-defined protocol 23
LA.PROTOcol.List Display trace buffer for user-defined protocol 23
LA.PROTOcol.PROfileChart Profile chart for user-defined protocol 23
LA.PROTOcol.PROfileSTATistic Profile chart for user-defined protocol 23
LA.PROTOcol.STATistic Display statistics for user-defined protocol 23
LA.REF Set reference point for time measurement 24
LA.RESet Reset command 24
LA.SAVE Save trace for postprocessing in TRACE32 24
LA.SelfArm Automatic restart of trace recording 24
LA.SIZE Define buffer size 24
LA.SnapShot Restart trace capturing once 24
LA.state Display trace configuration window 24
LA.STATistic Statistic analysis 24
LA.Timing Waveform of trace buffer 25
LA.TRACK Set tracking record 25
LA.View Display single record 25
LA.ZERO Align timestamps of trace and timing analyzers 25
List ............................................................................................................................................ 26
List Display modes for programs 26
List.auto Display program listing 27
List.Asm Display disassembler 35
List.EXPORT Export a listing to an XML file 36
List.EXPORT.Asm Export disassembler listing 36
List.EXPORT.auto Export source and disassembler listing 37
General Commands Reference Guide L | 3©1989-2021 Lauterbach GmbH
List.EXPORT.Hll Export source listing 37
List.EXPORT.Mix Export source and disassembler listing 38
List.Hll Display source 40
List.Java Display Java byte code 41
List.Mix Disassembler and source 43
LOGGER ................................................................................................................................... 44
LOGGER Trace method LOGGER, recording and analysis commands 44
LOGGER-specific Trace Commands ..................................................................................... 45
LOGGER.ADDRESS Software trace address 45
LOGGER.Mode Set LOGGER operation mode 45
LOGGER.TimeStamp Configure timestamp usage of LOGGER trace 46
Generic LOGGER Trace Commands ..................................................................................... 47
LOGGER.Arm Arm the trace 47
LOGGER.AutoArm Arm automatically 47
LOGGER.AutoInit Automatic initialization 47
LOGGER.BookMark Set a bookmark in trace listing 47
LOGGER.Chart Display trace contents graphically 47
LOGGER.ComPare Compare trace contents 47
LOGGER.DISable Disable the trace 48
LOGGER.DRAW Plot trace data against time 48
LOGGER.EXPORT Export trace data for processing in other applications 48
LOGGER.FILE Load a file into the file trace buffer 48
LOGGER.Find Find specified entry in trace 48
LOGGER.FindAll Find all specified entries in trace 48
LOGGER.FindChange Search for changes in trace flow 48
LOGGER.FLOWPROCESS Process flowtrace 48
LOGGER.FLOWSTART Restart flowtrace processing 49
LOGGER.GOTO Move cursor to specified trace record 49
LOGGER.Init Initialize trace 49
LOGGER.List List trace contents 49
LOGGER.ListNesting Analyze function nesting 49
LOGGER.ListVar List variable recorded to trace 49
LOGGER.LOAD Load trace file for offline processing 49
LOGGER.OFF Switch off 49
LOGGER.PROfileChart Profile charts 50
LOGGER.PROfileSTATistic Statistical analysis in a table versus time 50
LOGGER.PROTOcol Protocol analysis 50
LOGGER.PROTOcol.Chart Graphic display for user-defined protocol 50
LOGGER.PROTOcol.Draw Graphic display for user-defined protocol 50
LOGGER.PROTOcol.EXPORT Export trace buffer for user-defined protocol 50
LOGGER.PROTOcol.Find Find in trace buffer for user-defined protocol 50
LOGGER.PROTOcol.List Display trace buffer for user-defined protocol 51
General Commands Reference Guide L | 4©1989-2021 Lauterbach GmbH
LOGGER.PROTOcol.PROfileChart Profile chart for user-defined protocol 51
LOGGER.PROTOcol.PROfileSTATistic Profile chart for user-defined protocol 51
LOGGER.PROTOcol.STATistic Display statistics for user-defined protocol 51
LOGGER.REF Set reference point for time measurement 51
LOGGER.RESet Reset command 51
LOGGER.SAVE Save trace for postprocessing in TRACE32 51
LOGGER.SelfArm Automatic restart of trace recording 52
LOGGER.SIZE Define buffer size 52
LOGGER.SnapShot Restart trace capturing once 52
LOGGER.state Display trace configuration window 52
LOGGER.STATistic Statistic analysis 52
LOGGER.Timing Waveform of trace buffer 52
LOGGER.TRACK Set tracking record 52
LOGGER.View Display single record 52
LOGGER.ZERO Align timestamps of trace and timing analyzers 53
LUA ........................................................................................................................................... 54
LUA Support for the Lua script language 54
LUA.List List the current Lua scripts 54
LUA.LOAD Load a Lua script to debugger 55
LUA.RESet Reset the Lua context 55
LUA.RUN Execute a Lua script 56
LUA.SET Modify the Lua input buffer 57
LUA.ShowInput Show current content of the input buffer 57
LUA.ShowOutput Show current content of the output buffer 58
LUA.UNLOAD Remove a Lua script from the debugger 58
General Commands Reference Guide L | 5©1989-2021 Lauterbach GmbH

General Commands Reference Guide L
Version 04-Nov-2021
General Commands Reference Guide L | 6©1989-2021 Lauterbach GmbH

LA
LA Logic analyzer
The trace method LA is used for remote control of logic analyzer systems.
For selecting and configuring the trace method LA, use the TRACE32 command line or a PRACTICE script (*.cmm) or the LA.state window [A].
Alternatively, use the Trace.state window: click the option LA or execute the command Trace.METHOD LA in order to select the trace method LA [B].
The chapter “LA-specific Trace Commands”, page 8 describes the LA-specific configuration commands. While the chapter “Generic LA Trace Commands”, page 19 lists the LA trace analysis and display commands, which are shared with other TRACE32 trace methods.
See also
■ Trace.METHOD
▲ ’Generic LA Trace Commands’ in ’General Commands Reference Guide L’▲ ’Release Information’ in ’Release History’
A
B
General Commands Reference Guide L | 7©1989-2021 Lauterbach GmbH
LA-specific Trace Commands
LA.IMPORT Import trace information[Example]
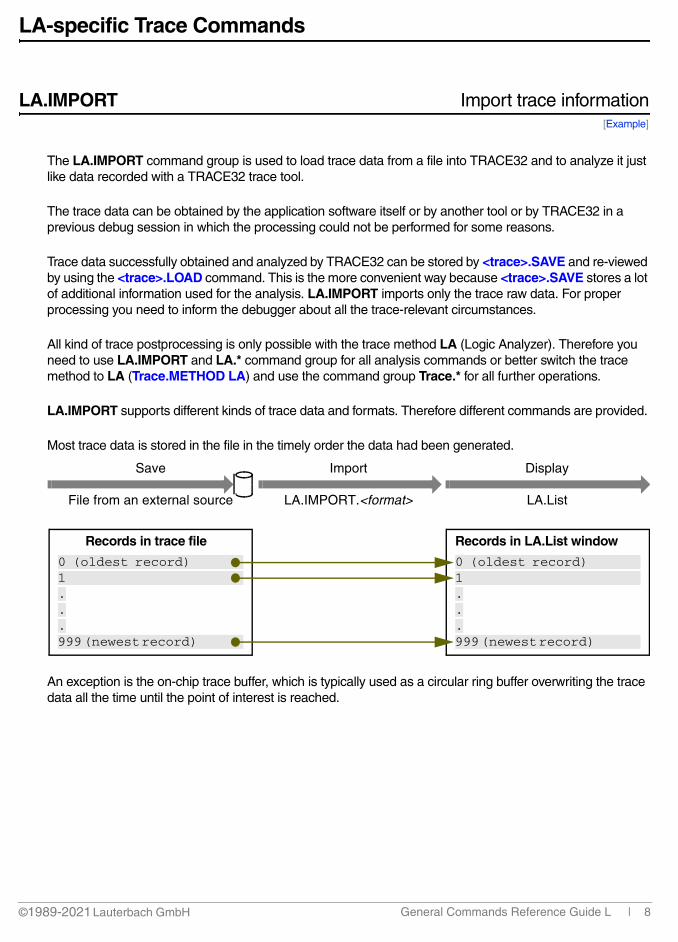
The LA.IMPORT command group is used to load trace data from a file into TRACE32 and to analyze it just like data recorded with a TRACE32 trace tool.
The trace data can be obtained by the application software itself or by another tool or by TRACE32 in a previous debug session in which the processing could not be performed for some reasons.
Trace data successfully obtained and analyzed by TRACE32 can be stored by <trace>.SAVE and re-viewed by using the <trace>.LOAD command. This is the more convenient way because <trace>.SAVE stores a lot of additional information used for the analysis. LA.IMPORT imports only the trace raw data. For proper processing you need to inform the debugger about all the trace-relevant circumstances.
All kind of trace postprocessing is only possible with the trace method LA (Logic Analyzer). Therefore you need to use LA.IMPORT and LA.* command group for all analysis commands or better switch the trace method to LA (Trace.METHOD LA) and use the command group Trace.* for all further operations.
LA.IMPORT supports different kinds of trace data and formats. Therefore different commands are provided.
Most trace data is stored in the file in the timely order the data had been generated.
An exception is the on-chip trace buffer, which is typically used as a circular ring buffer overwriting the trace data all the time until the point of interest is reached.
Import
LA.IMPORT.<format>
Records in trace file
0 (oldest record) 1 ...999 (newest record)
Records in LA.List window
Save
File from an external source
Display
LA.List
0 (oldest record) 1 ...999 (newest record)
General Commands Reference Guide L | 8©1989-2021 Lauterbach GmbH

If this buffer is saved into a file, you need to know the wrap pointer for being able to get the data in a timely order. LA.IMPORT.WRAP and LA.IMPORT.GUESSWRAP will deal with this concern.
For post processing trace data loaded by LA.IMPORT you need to take the following steps:
1. Start TRACE32 to run as simulator (config.t32 -> PBI=SIM). You neither need a debugger hardware nor a target. You can run TRACE32 as debugger as well, but for the postprocessing this is not needed.
2. Adjust all trace relevant settings like for a real target by running the start-up script you used for generating the trace data. For postprocessing an ETMv4 even further setups might be needed which normally the debugger would read out from the ETM module (ETM.COND, ETM.INSTPO, ETM.QE).
If the start-up script is not available, then try this:
- At best selecting the chip you are debugging (SYStem.CPU ...) is sufficient.
- For trace data coming from a ARM CoreSight system, all commands describing the trace system on the chip are required (SYStem.CONFIG ...).
- Further all settings for the trace sources done at recording time are needed (e.g. ETM. ...).
3. Load your target application (Data.LOAD ...).
4. Import the trace raw data (LA.IMPORT. ...).
5. Now you can use all trace display and analysis functions, e.g.
LA.List TP TPC TPINFO DEFault List.NoDummy.OFF ; with diagnostics
Import
LA.IMPORT.ETB
0 1 ...996 (newest record)
Records in LA.List window-3 (oldest record) -2 -1
Save
e.g. by external tool
Display
LA.List
Re-order
LA.IMPORT.WRAP
Process:
Circular Ring Buffer
997 (oldest record) 998 999
Records in trace file0 1 ...996 (newest record)
Wrap pointer
Result:
Re-
orde
r
General Commands Reference Guide L | 9©1989-2021 Lauterbach GmbH
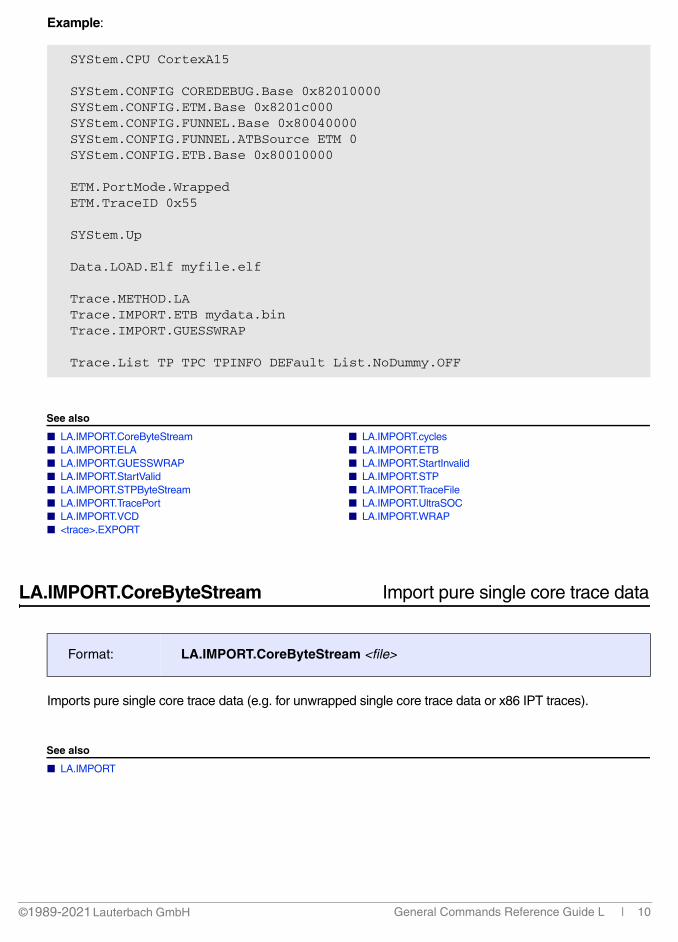
Example:
See also
■ LA.IMPORT.CoreByteStream ■ LA.IMPORT.cycles ■ LA.IMPORT.ELA ■ LA.IMPORT.ETB ■ LA.IMPORT.GUESSWRAP ■ LA.IMPORT.StartInvalid ■ LA.IMPORT.StartValid ■ LA.IMPORT.STP ■ LA.IMPORT.STPByteStream ■ LA.IMPORT.TraceFile ■ LA.IMPORT.TracePort ■ LA.IMPORT.UltraSOC ■ LA.IMPORT.VCD ■ LA.IMPORT.WRAP ■ <trace>.EXPORT
LA.IMPORT.CoreByteStream Import pure single core trace data
Imports pure single core trace data (e.g. for unwrapped single core trace data or x86 IPT traces).
See also
■ LA.IMPORT
SYStem.CPU CortexA15
SYStem.CONFIG COREDEBUG.Base 0x82010000SYStem.CONFIG.ETM.Base 0x8201c000SYStem.CONFIG.FUNNEL.Base 0x80040000SYStem.CONFIG.FUNNEL.ATBSource ETM 0SYStem.CONFIG.ETB.Base 0x80010000
ETM.PortMode.WrappedETM.TraceID 0x55
SYStem.Up
Data.LOAD.Elf myfile.elf
Trace.METHOD.LATrace.IMPORT.ETB mydata.binTrace.IMPORT.GUESSWRAP
Trace.List TP TPC TPINFO DEFault List.NoDummy.OFF
Format: LA.IMPORT.CoreByteStream <file>
General Commands Reference Guide L | 10©1989-2021 Lauterbach GmbH
LA.IMPORT.cycles Import bus trace data
Re-imports a file that has been exported with <trace>.EXPORT.cycles. This bus trace data comes from capturing the fetched instructions and data accesses done on an external bus to figure out the program behavior. It works only if no cache is used and if the bus accesses can be captured. This command can be used to import traces from external tools or simulators.
See also
■ LA.IMPORT
▲ ’Release Information’ in ’Release History’
LA.IMPORT.ELA Import ELA trace data
Imports a pure binary trace data file obtained from an ARM CoreSight Embedded Logic Analyzer (ELA).
See also
■ LA.IMPORT
LA.IMPORT.ETB Import on-chip trace data
Imports a pure binary trace data file obtained from an on-chip trace buffer like ARM CoreSight ETB, ETF, ETR.
You additionally need to use LA.IMPORT.WRAP or LA.IMPORT.GUESSWRAP if the following conditions apply:
• The on-chip trace buffer was used as a circular ring buffer.
• The on-chip trace data was stored as is, it was not read out in the timely order starting from the write pointer position.
Format: LA.IMPORT.cycles <file>
Format: LA.IMPORT.ELA <file>
Format: LA.IMPORT.ETB <file>
General Commands Reference Guide L | 11©1989-2021 Lauterbach GmbH
LA.Mode FlowTrace will automatically be set when using this command.
See also
■ LA.IMPORT
▲ ’Release Information’ in ’Release History’
General Commands Reference Guide L | 12©1989-2021 Lauterbach GmbH
LA.IMPORT.GUESSWRAP Guess wrap pointer
Reformats external trace data loaded to TRACE32 in a timely order. The external trace data of a circular ring buffer is loaded to TRACE32 using LA.IMPORT.ETB. The command LA.IMPORT.GUESSWRAP scans the loaded trace data and guesses where the wrap pointer might have been.
Optionally, you can pass a record number where the search for the wrap pointer shall start. Without a parameter it starts from the beginning.
Use LA.IMPORT.WRAP if you know where the wrap pointer is.
See the figures in the introduction to <trace>.IMPORT.
See also
■ LA.IMPORT ■ LA.IMPORT.WRAP
LA.IMPORT.StartInvalid Set start of trace as invalid
Reverts the setting done with LA.IMPORT.StartValid.
See also
■ LA.IMPORT
Format: LA.IMPORT.GUESSWRAP [<record_number>]
Format: LA.IMPORT.StartInvalid
General Commands Reference Guide L | 13©1989-2021 Lauterbach GmbH
LA.IMPORT.StartValid Set start of trace as valid
This command informs the debugger that the start of the loaded trace is valid and that it should not wait for Sync packets.
See also
■ LA.IMPORT
LA.IMPORT.STP Import STP recording from file (nibble)
Imports an STP trace from <file> to process it within TRACE32. One trace record is generated per nibble.
In order to unwrap the trace information for processing, TRACE32 needs to know the following information: STM base address and the STP protocol version.
If TRACE32 is aware of the chip characteristic, setting up the chip is sufficient.
Example:
Format: LA.IMPORT.StartValid [<address1> <address2> …]
<address1> <address2> …
The trace is set as valid starting from the given address. On SMP systems, the first address corresponds to the first core, the second to the second core...
Format: LA.IMPORT.STP <file>
SYStem.CPU OMAP4430APP1
LA.IMPORT.STP my_recording.stp
STMLA.List
General Commands Reference Guide L | 14©1989-2021 Lauterbach GmbH
Otherwise the following setup has to be done.
See also
■ LA.IMPORT
LA.IMPORT.STPByteStream Import STP recording from file (byte)
Same as LA.IMPORT.STP, but one trace record is generated per byte.
See also
■ LA.IMPORT
▲ ’Release Information’ in ’Release History’
LA.IMPORT.TraceFile Import trace data where processing has failed
Re-imports trace data stored by <trace>.SAVE for re-processing. This is useful if processing was not possible when the trace recording was made. For example if you had no access to the target code at that moment.
Only the trace raw data will be extracted from the saved (*.ad) file.
LA.Mode FlowTrace will automatically be set when using this command.
See also
■ LA.IMPORT
▲ ’Release Information’ in ’Release History’
SYStem.CONFIG.STM.Base DAP:0xd4161000 ; any base address != 0x0 is; fine
SYStem.CONFIG.STM.Mode STPv2 ; specify the STP protocol; version
LA.IMPORT.STP my_recording.stp
STMLA.List
Format: LA.IMPORT.STPByteStream <file>
Format: LA.IMPORT.TraceFile <file>
General Commands Reference Guide L | 15©1989-2021 Lauterbach GmbH
LA.IMPORT.TracePort Import off-chip trace data
Imports a pure binary trace data file from an external trace port like an ARM CoreSight TPIU. Unlike on-chip trace data, off-chip trace data includes synchronization packages and depend on the port size of the trace port.
LA.Mode FlowTrace will automatically be set when using this command.
See also
■ LA.IMPORT
▲ ’Release Information’ in ’Release History’
LA.IMPORT.UltraSOC Import raw UltraSOC flow trace data
This command allows to load raw UltraSOC flow trace data.
See also
■ LA.IMPORT
LA.IMPORT.VCD Import recorded signals in VCD file format
Imports a VCD (Value Change Dump) file, which is an industrial standard format for waveforms (not for program trace). It is used for visualizing and analyzing the captured signals in the <trace>.Timing window.
See also
■ LA.IMPORT
Format: LA.IMPORT.TracePort <file>
Format: LA.IMPORT.UltraSOC <file>
Format: LA.IMPORT.VCD <file>
General Commands Reference Guide L | 16©1989-2021 Lauterbach GmbH
LA.IMPORT.WRAP Define wrap pointer
Reformats external trace data loaded to TRACE32 in a timely order. The external trace data of a circular ring buffer is loaded to TRACE32 using LA.IMPORT.ETB.
Use LA.IMPORT.GUESSWRAP if you do not know where the wrap pointer is.
See the figures in the introduction to LA.IMPORT.
See also
■ LA.IMPORT ■ LA.IMPORT.GUESSWRAP
Format: LA.IMPORT.WRAP <record_number>
<record_number> You pass the <record_number> of the first trace record in time (wrap pointer). This is the write pointer location of a circular ring buffer the moment the data has been stored.
NOTE: On a CoreSight trace, the write pointer points to a 32-bit value. You need to multiply this value by 4 because each CoreSight trace record is 8 bit in size.
General Commands Reference Guide L | 17©1989-2021 Lauterbach GmbH
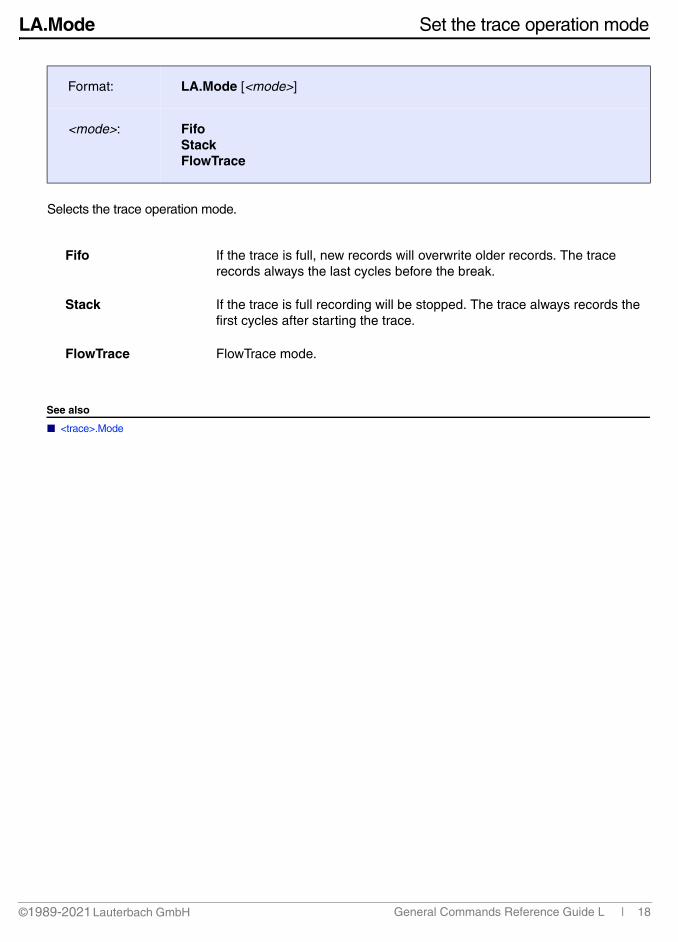
LA.Mode Set the trace operation mode
Selects the trace operation mode.
See also
■ <trace>.Mode
Format: LA.Mode [<mode>]
<mode>: FifoStackFlowTrace
Fifo If the trace is full, new records will overwrite older records. The trace records always the last cycles before the break.
Stack If the trace is full recording will be stopped. The trace always records the first cycles after starting the trace.
FlowTrace FlowTrace mode.
General Commands Reference Guide L | 18©1989-2021 Lauterbach GmbH
Generic LA Trace Commands
LA.ACCESS Define access path to program code for trace decoding
See command <trace>.ACCESS in 'General Commands Reference Guide T' (general_ref_t.pdf, page 128).
LA.Arm Arm the trace
See command <trace>.Arm in 'General Commands Reference Guide T' (general_ref_t.pdf, page 130).
LA.AutoArm Arm automatically
See command <trace>.AutoArm in 'General Commands Reference Guide T' (general_ref_t.pdf, page 131).
LA.AutoInit Automatic initialization
See command <trace>.AutoInit in 'General Commands Reference Guide T' (general_ref_t.pdf, page 136).
LA.BookMark Set a bookmark in trace listing
See command <trace>.BookMark in 'General Commands Reference Guide T' (general_ref_t.pdf, page 137).
LA.Chart Display trace contents graphically
See command <trace>.Chart in 'General Commands Reference Guide T' (general_ref_t.pdf, page 140).
General Commands Reference Guide L | 19©1989-2021 Lauterbach GmbH

LA.CLOCK Clock to calculate time out of cycle count information
See command <trace>.CLOCK in 'General Commands Reference Guide T' (general_ref_t.pdf, page 185).
LA.ComPare Compare trace contents
See command <trace>.ComPare in 'General Commands Reference Guide T' (general_ref_t.pdf, page 186).
LA.ComPareCODE Compare trace with memory
See command <trace>.ComPareCODE in 'General Commands Reference Guide T' (general_ref_t.pdf, page 188).
LA.DISable Disable the trace
See command <trace>.DISable in 'General Commands Reference Guide T' (general_ref_t.pdf, page 191).
LA.DRAW Plot trace data against time
See command <trace>.DRAW in 'General Commands Reference Guide T' (general_ref_t.pdf, page 195).
LA.EXPORT Export trace data for processing in other applications
See command <trace>.EXPORT in 'General Commands Reference Guide T' (general_ref_t.pdf, page 205).
LA.FILE Load a file into the file trace buffer
See command <trace>.FILE in 'General Commands Reference Guide T' (general_ref_t.pdf, page 222).
LA.Find Find specified entry in trace
See command <trace>.Find in 'General Commands Reference Guide T' (general_ref_t.pdf, page 224).
General Commands Reference Guide L | 20©1989-2021 Lauterbach GmbH

LA.FindAll Find all specified entries in trace
See command <trace>.FindAll in 'General Commands Reference Guide T' (general_ref_t.pdf, page 226).
LA.FindChange Search for changes in trace flow
See command <trace>.FindChange in 'General Commands Reference Guide T' (general_ref_t.pdf, page 227).
LA.FLOWPROCESS Process flowtrace
See command <trace>.FLOWPROCESS in 'General Commands Reference Guide T' (general_ref_t.pdf, page 229).
LA.FLOWSTART Restart flowtrace processing
See command <trace>.FLOWSTART in 'General Commands Reference Guide T' (general_ref_t.pdf, page 229).
LA.GOTO Move cursor to specified trace record
See command <trace>.GOTO in 'General Commands Reference Guide T' (general_ref_t.pdf, page 232).
LA.Init Initialize trace
See command <trace>.Init in 'General Commands Reference Guide T' (general_ref_t.pdf, page 234).
LA.List List trace contents
See command <trace>.List in 'General Commands Reference Guide T' (general_ref_t.pdf, page 236).
General Commands Reference Guide L | 21©1989-2021 Lauterbach GmbH
LA.ListNesting Analyze function nesting
See command <trace>.ListNesting in 'General Commands Reference Guide T' (general_ref_t.pdf, page 249).
LA.ListVar List variable recorded to trace
See command <trace>.ListVar in 'General Commands Reference Guide T' (general_ref_t.pdf, page 252).
LA.LOAD Load trace file for offline processing
See command <trace>.LOAD in 'General Commands Reference Guide T' (general_ref_t.pdf, page 255).
LA.OFF Switch off
See command <trace>.OFF in 'General Commands Reference Guide T' (general_ref_t.pdf, page 262).
LA.PROfileChart Profile charts
See command <trace>.PROfileChart in 'General Commands Reference Guide T' (general_ref_t.pdf, page 268).
LA.PROTOcol Protocol analysis
See command <trace>.PROTOcol in 'General Commands Reference Guide T' (general_ref_t.pdf, page 323).
LA.PROTOcol.Chart Graphic display for user-defined protocol
See command <trace>.PROTOcol.Chart in 'General Commands Reference Guide T' (general_ref_t.pdf, page 323).
General Commands Reference Guide L | 22©1989-2021 Lauterbach GmbH
LA.PROTOcol.Draw Graphic display for user-defined protocol
See command <trace>.PROTOcol.Draw in 'General Commands Reference Guide T' (general_ref_t.pdf, page 325).
LA.PROTOcol.EXPORT Export trace buffer for user-defined protocol
See command <trace>.PROTOcol.EXPORT in 'General Commands Reference Guide T' (general_ref_t.pdf, page 326).
LA.PROTOcol.Find Find in trace buffer for user-defined protocol
See command <trace>.PROTOcol.Find in 'General Commands Reference Guide T' (general_ref_t.pdf, page 327).
LA.PROTOcol.List Display trace buffer for user-defined protocol
See command <trace>.PROTOcol.List in 'General Commands Reference Guide T' (general_ref_t.pdf, page 328).
LA.PROTOcol.PROfileChart Profile chart for user-defined protocol
See command <trace>.PROTOcol.PROfileChart in 'General Commands Reference Guide T' (general_ref_t.pdf, page 331).
LA.PROTOcol.PROfileSTATistic Profile chart for user-defined protocol
See command <trace>.PROTOcol.PROfileSTATistic in 'General Commands Reference Guide T' (general_ref_t.pdf, page 332).
LA.PROTOcol.STATistic Display statistics for user-defined protocol
See command <trace>.PROTOcol.STATistic in 'General Commands Reference Guide T' (general_ref_t.pdf, page 334).
General Commands Reference Guide L | 23©1989-2021 Lauterbach GmbH
LA.REF Set reference point for time measurement
See command <trace>.REF in 'General Commands Reference Guide T' (general_ref_t.pdf, page 341).
LA.RESet Reset command
See command <trace>.RESet in 'General Commands Reference Guide T' (general_ref_t.pdf, page 341).
LA.SAVE Save trace for postprocessing in TRACE32
See command <trace>.SAVE in 'General Commands Reference Guide T' (general_ref_t.pdf, page 342).
LA.SelfArm Automatic restart of trace recording
See command <trace>.SelfArm in 'General Commands Reference Guide T' (general_ref_t.pdf, page 346).
LA.SIZE Define buffer size
See command <trace>.SIZE in 'General Commands Reference Guide T' (general_ref_t.pdf, page 356).
LA.SnapShot Restart trace capturing once
See command <trace>.SnapShot in 'General Commands Reference Guide T' (general_ref_t.pdf, page 356).
LA.state Display trace configuration window
See command <trace>.state in 'General Commands Reference Guide T' (general_ref_t.pdf, page 358).
LA.STATistic Statistic analysis
See command <trace>.STATistic in 'General Commands Reference Guide T' (general_ref_t.pdf, page 360).
General Commands Reference Guide L | 24©1989-2021 Lauterbach GmbH
LA.Timing Waveform of trace buffer
See command <trace>.Timing in 'General Commands Reference Guide T' (general_ref_t.pdf, page 474).
LA.TRACK Set tracking record
See command <trace>.TRACK in 'General Commands Reference Guide T' (general_ref_t.pdf, page 477).
LA.View Display single record
See command <trace>.View in 'General Commands Reference Guide T' (general_ref_t.pdf, page 479).
LA.ZERO Align timestamps of trace and timing analyzers
See command <trace>.ZERO in 'General Commands Reference Guide T' (general_ref_t.pdf, page 480).
General Commands Reference Guide L | 25©1989-2021 Lauterbach GmbH
List
List Display modes for programs
The List command group displays a program listing:
• Source code and object code in the List.Mix window
• Object code only in the List.Asm window
• Source code only in the List.Hll window
• Java byte code in the List.Java window
In addition, the program listing can be exported with List.EXPORT.
See also
■ List.Asm ■ List.auto ■ List.EXPORT ■ List.Hll ■ List.Java ■ List.Mix ■ Data.dump ■ Data.LOAD ■ Go ■ SETUP.DIS ■ SETUP.LISTCLICK ■ SETUP.sYmbol ■ SETUP.TIMEOUT ■ Step ■ WinOverlay ❏ ADDRESS.isPHYSICAL() ❏ ADDRESS.OFFSET() ❏ ADDRESS.SEGMENT() ❏ ADDRESS.STRACCESS() ❏ ADDRESS.WIDTH() ❏ sYmbol.END() ❏ sYmbol.EXIT()
▲ ’Release Information’ in ’Release History’
General Commands Reference Guide L | 26©1989-2021 Lauterbach GmbH
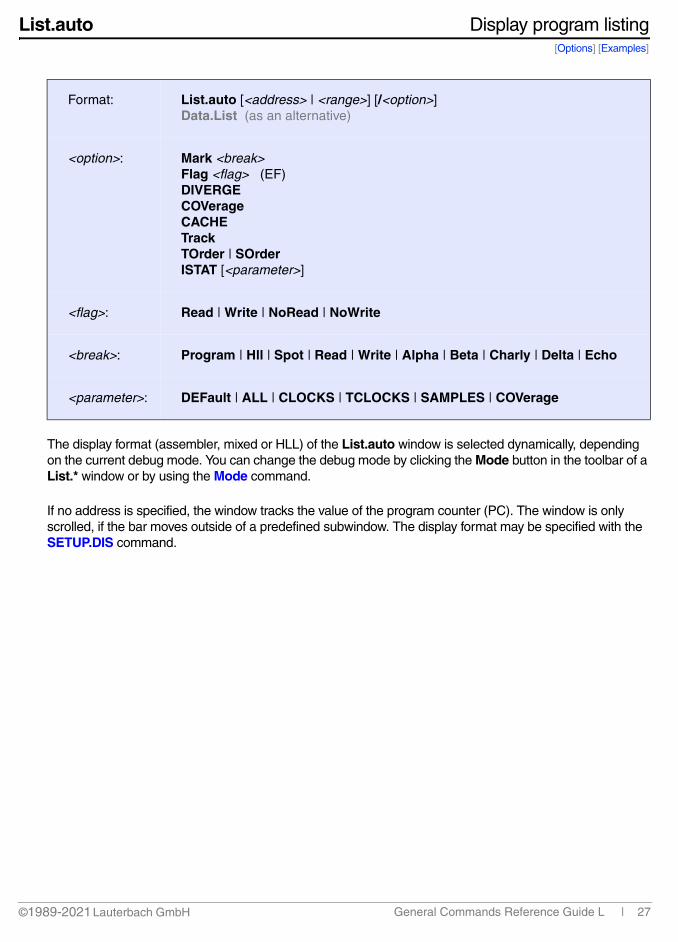
List.auto Display program listing[Options] [Examples]
The display format (assembler, mixed or HLL) of the List.auto window is selected dynamically, depending on the current debug mode. You can change the debug mode by clicking the Mode button in the toolbar of a List.* window or by using the Mode command.
If no address is specified, the window tracks the value of the program counter (PC). The window is only scrolled, if the bar moves outside of a predefined subwindow. The display format may be specified with the SETUP.DIS command.
Format: List.auto [<address> | <range>] [/<option>]Data.List (as an alternative)
<option>: Mark <break>Flag <flag> (EF)DIVERGECOVerageCACHETrackTOrder | SOrderISTAT [<parameter>]
<flag>: Read | Write | NoRead | NoWrite
<break>: Program | Hll | Spot | Read | Write | Alpha | Beta | Charly | Delta | Echo
<parameter>: DEFault | ALL | CLOCKS | TCLOCKS | SAMPLES | COVerage
General Commands Reference Guide L | 27©1989-2021 Lauterbach GmbH
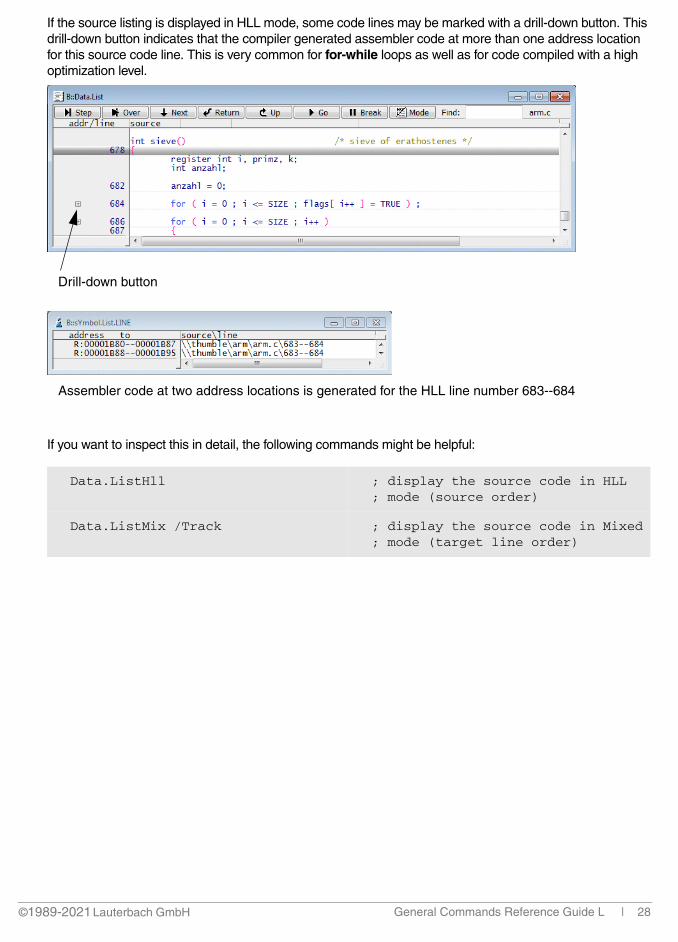
If the source listing is displayed in HLL mode, some code lines may be marked with a drill-down button. This drill-down button indicates that the compiler generated assembler code at more than one address location for this source code line. This is very common for for-while loops as well as for code compiled with a high optimization level.
If you want to inspect this in detail, the following commands might be helpful:
Data.ListHll ; display the source code in HLL; mode (source order)
Data.ListMix /Track ; display the source code in Mixed; mode (target line order)
Drill-down button
Assembler code at two address locations is generated for the HLL line number 683--684
General Commands Reference Guide L | 28©1989-2021 Lauterbach GmbH

If you push the drill-down button to get detailed information, a duplicate of the original HLL line is generated for each assembler code address location.
If you now select one of the duplicates, the cursor in the Data.ListMix window points automatically to the corresponding assembler code. This feature is enabled by the /Track option.
Shaded lines indicate that the source information is not on disk or in the wrong directory. See command sYmbol.SPATH. For an example of shaded lines in a List window, see screenshot in List.Mix.
General Commands Reference Guide L | 29©1989-2021 Lauterbach GmbH
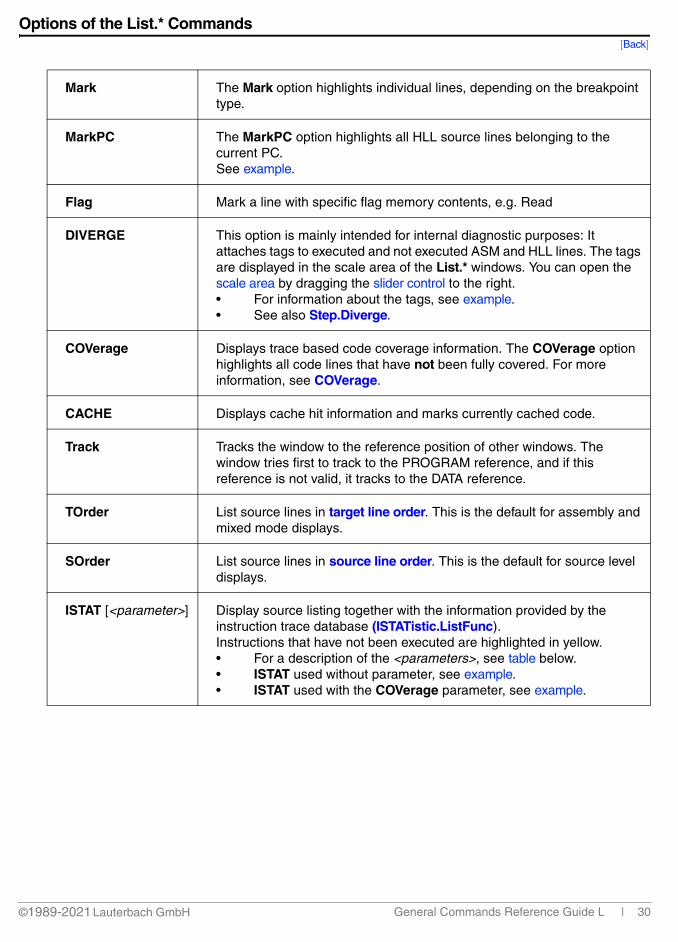
Options of the List.* Commands[Back]
Mark The Mark option highlights individual lines, depending on the breakpoint type.
MarkPC The MarkPC option highlights all HLL source lines belonging to the current PC.See example.
Flag Mark a line with specific flag memory contents, e.g. Read
DIVERGE This option is mainly intended for internal diagnostic purposes: It attaches tags to executed and not executed ASM and HLL lines. The tags are displayed in the scale area of the List.* windows. You can open the scale area by dragging the slider control to the right.• For information about the tags, see example.• See also Step.Diverge.
COVerage Displays trace based code coverage information. The COVerage option highlights all code lines that have not been fully covered. For more information, see COVerage.
CACHE Displays cache hit information and marks currently cached code.
Track Tracks the window to the reference position of other windows. The window tries first to track to the PROGRAM reference, and if this reference is not valid, it tracks to the DATA reference.
TOrder List source lines in target line order. This is the default for assembly and mixed mode displays.
SOrder List source lines in source line order. This is the default for source level displays.
ISTAT [<parameter>] Display source listing together with the information provided by the instruction trace database (ISTATistic.ListFunc).Instructions that have not been executed are highlighted in yellow.• For a description of the <parameters>, see table below.• ISTAT used without parameter, see example.• ISTAT used with the COVerage parameter, see example.
General Commands Reference Guide L | 30©1989-2021 Lauterbach GmbH
Parameters for the ISTAT Option
[Back]
Examples
Example for the ISTAT option - without <parameter>
[Back]
DEFault Display the default information provided by the ISTAT database.
ALL Display all information provided by the ISTAT database.
CLOCK Display the clock and CPI information provided by the ISTAT database.
TCLOCK (only for special purposes)
SAMPLES Display recorded samples, time and ratio.
COVerage Display the code coverage information provided by the ISTAT database.
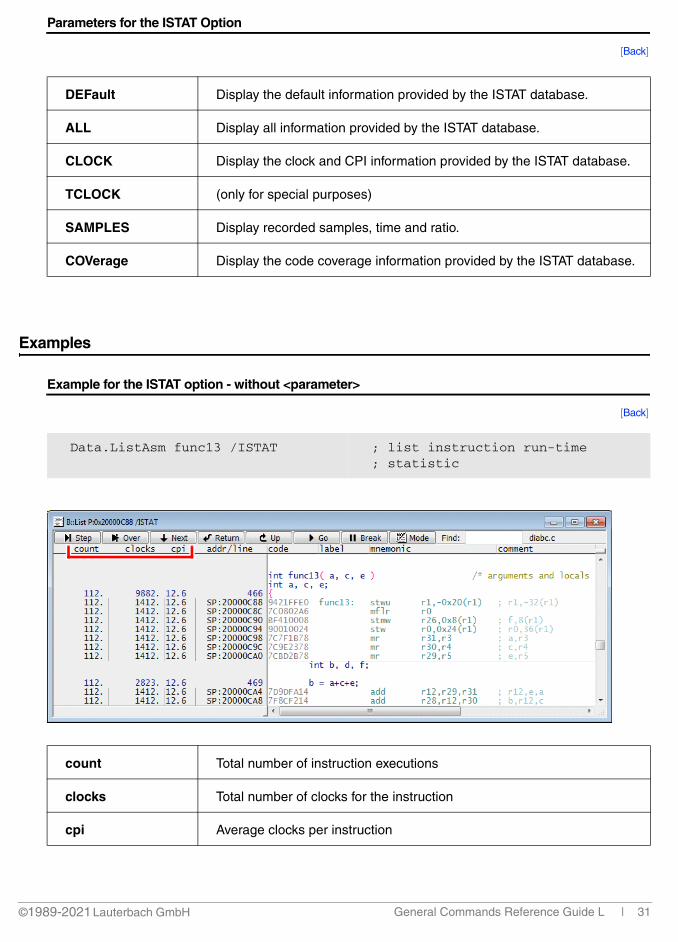
Data.ListAsm func13 /ISTAT ; list instruction run-time; statistic
count Total number of instruction executions
clocks Total number of clocks for the instruction
cpi Average clocks per instruction
General Commands Reference Guide L | 31©1989-2021 Lauterbach GmbH

Example for the ISTAT option - with the COVerage <parameter>
[Back]
If exec or/and notexec is 0 for an instruction with condition, the instruction is bold-printed on a yellow background. All other instruction are bold-printed on a yellow background if they were not executed.
List func11 /ISTAT COVerage ; list instruction coverage
exec conditional instructions: number of times the instruction was executed because the condition was true.
other instructions: number of times the instruction was executed
notexec conditional instructions: number of times the instruction wasn’t executed because the condition was false.
coverage Instruction coverage
Data.List ; display source listing around the; current PC
Data.List /Mark Program
Data.List /Mark
; display source listing, bold print ; all instructions / HLL lines on a; yellow background if a program; breakpoint is set
; remove bold printing on yellow; background
General Commands Reference Guide L | 32©1989-2021 Lauterbach GmbH

Example for the DIVERGE option
[Back]
Data.List /Track ; track the window to a reference, e.g. ; analyzer
Data.List Register(a0) ; follow the register A0 of the CPU
PRINT Data.Long(d:0x200) ; prints the memory contents of addresses; D:0x200..0x203; Do not mix up the command Data.List; with the function Data.Long()
; Short form of the command is D.L; Short form of the function is D.L()
Tags in the columns s, state, and i
h Line in HLL mode (Mode.Hll).
a Address in ASM mode (Mode.Asm).
stop Reached by a breakpoint.
done An executed line or address.
hit A reached line or address that has not yet been executed, e.g. in a linear code sequence.
target This line or address is a possible target of the next Step.Diverge. Once reached, target is replaced with hit.
i Indirect branch instruction.
General Commands Reference Guide L | 33©1989-2021 Lauterbach GmbH

Example for the MarkPC option
[Back]
See also
■ List ■ List.Asm ■ List.EXPORT ■ List.Hll ■ List.Java ■ List.Mix ■ SETUP.DIS ■ SETUP.LISTCLICK ■ SETUP.sYmbol ■ SETUP.TIMEOUT ❏ ADDRESS.isPHYSICAL() ❏ ADDRESS.OFFSET() ❏ ADDRESS.SEGMENT() ❏ ADDRESS.STRACCESS() ❏ ADDRESS.WIDTH() ❏ sYmbol.END() ❏ sYmbol.EXIT()
▲ ’Release Information’ in ’Release History’
Register.Set PC main ; set the Program Counter to the label mainList.auto main /MarkPC ; highlight all instructions related to the ; current HLL line
MarkPC
General Commands Reference Guide L | 34©1989-2021 Lauterbach GmbH
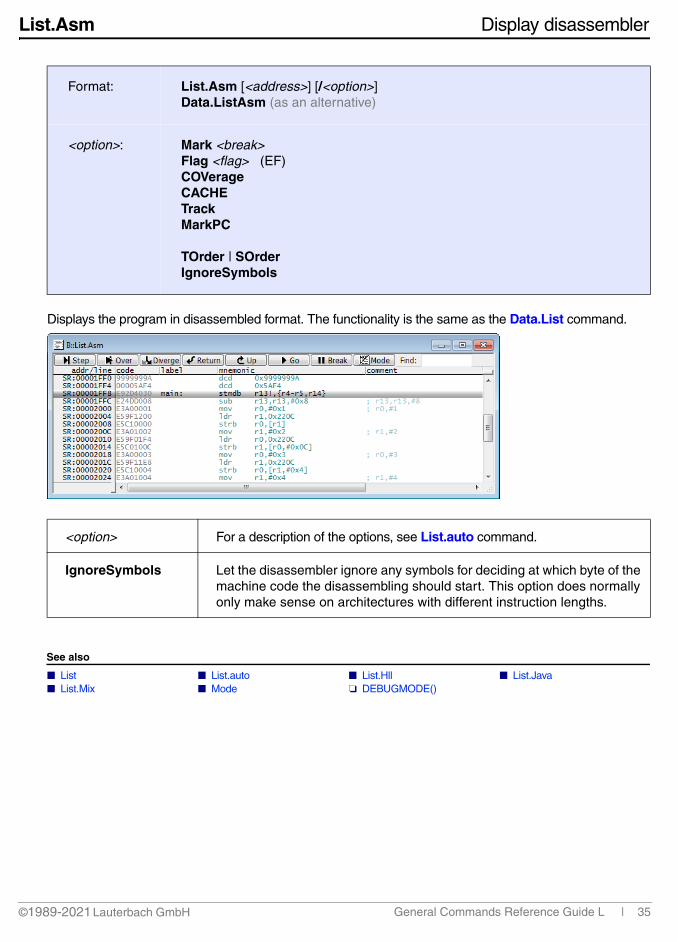
List.Asm Display disassembler
Displays the program in disassembled format. The functionality is the same as the Data.List command.
See also
■ List ■ List.auto ■ List.Hll ■ List.Java ■ List.Mix ■ Mode ❏ DEBUGMODE()
Format: List.Asm [<address>] [/<option>] Data.ListAsm (as an alternative)
<option>: Mark <break>Flag <flag> (EF)COVerageCACHETrackMarkPC
TOrder | SOrderIgnoreSymbols
<option> For a description of the options, see List.auto command.
IgnoreSymbols Let the disassembler ignore any symbols for deciding at which byte of the machine code the disassembling should start. This option does normally only make sense on architectures with different instruction lengths.
General Commands Reference Guide L | 35©1989-2021 Lauterbach GmbH
List.EXPORT Export a listing to an XML file
Using the List.EXPORT command group, you can export a source or disassembler listing or both listings to an XML file.
In addition, TRACE32 provides an XSL transformation template for formatting the XML file. The formatting is automatically applied to the XML file when it is opened in an external browser window. Prerequisite: The XSL file is placed in the same folder as the XML file.
For demo scripts, see List.EXPORT.Mix.
See also
■ List.EXPORT.Asm ■ List.EXPORT.auto ■ List.EXPORT.Hll ■ List.EXPORT.Mix ■ List ■ List.auto ■ COVerage.EXPORT ■ ISTATistic.EXPORT
List.EXPORT.Asm Export disassembler listing
Creates an XML file containing the disassembler listing. For an example and a description of the options, see List.EXPORT.Mix.
See also
■ List.EXPORT
Format: List.EXPORT.Asm <file> <range> [/<option>]Data.ListEXPORTAsm (as an alternative)
<option>: COVerage | ISTATistic Append | NoData
General Commands Reference Guide L | 36©1989-2021 Lauterbach GmbH
List.EXPORT.auto Export source and disassembler listing
Creates an XML file containing the source listing and the disassembler listing - same as List.EXPORT.Mix. For an example and a description of the options, see List.EXPORT.Mix.
See also
■ List.EXPORT
List.EXPORT.Hll Export source listing
Creates an XML file containing just the source listing. For an example and a description of the options, see List.EXPORT.Mix.
See also
■ List.EXPORT
Format: List.EXPORT.auto <file> <range> [/<option>]Data.ListEXPORT (as an alternative)
<option>: COVerage | ISTATistic | TOrder | SOrder Append | NoData
Format: List.EXPORT.Hll <file> <range> [/<option>]Data.ListEXPORTHll (as an alternative)
<option>: COVerage | ISTATistic | Append | NoData
General Commands Reference Guide L | 37©1989-2021 Lauterbach GmbH
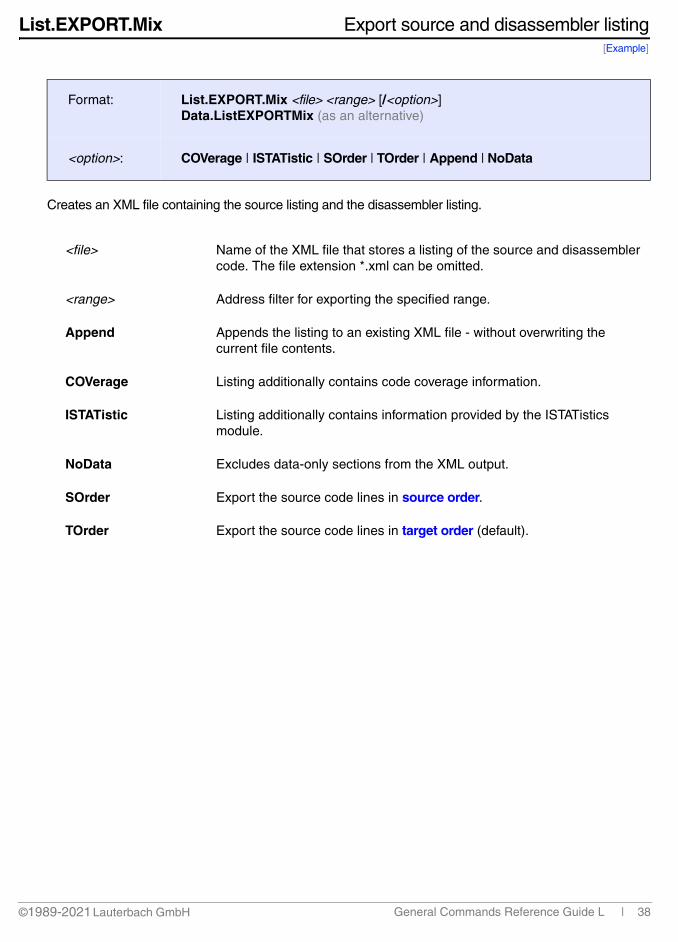
List.EXPORT.Mix Export source and disassembler listing[Example]
Creates an XML file containing the source listing and the disassembler listing.
Format: List.EXPORT.Mix <file> <range> [/<option>] Data.ListEXPORTMix (as an alternative)
<option>: COVerage | ISTATistic | SOrder | TOrder | Append | NoData
<file> Name of the XML file that stores a listing of the source and disassembler code. The file extension *.xml can be omitted.
<range> Address filter for exporting the specified range.
Append Appends the listing to an existing XML file - without overwriting the current file contents.
COVerage Listing additionally contains code coverage information.
ISTATistic Listing additionally contains information provided by the ISTATistics module.
NoData Excludes data-only sections from the XML output.
SOrder Export the source code lines in source order.
TOrder Export the source code lines in target order (default).
General Commands Reference Guide L | 38©1989-2021 Lauterbach GmbH
Example 1: The prerequisites for the following example are that the debug symbols have already been loaded, the address bookmarks have been created, and trace data has been recorded.
The tildes ~~ expand to your TRACE32 system directory, by default c:\t32.
Example 2: A more complex demo script is included in your TRACE32 installation. To access the script, run this command:B::CD.PSTEP ~~/demo/coverage/example.cmm
See also
■ List.EXPORT
COVerage.ADD ;update the coverage databaseData.List /COVerage /Track ;display source listingCOVerage.ListFunc ;display coverage for HLL functions
;export all bookmarksBookMark.EXPORT "~~/list.xml"
;export the source listing of the functions “main” and “sieve”List.EXPORT.Mix "~~/list.xml" main /COVerage /AppendList.EXPORT.Mix "~~/list.xml" sieve /COVerage /Append
;for demo purposes: let's open the unformatted result in TRACE32EDIT "~~/list.xml"
;place the transformation template in the same folder as the XML fileCOPY "~~/demo/coverage/single_file_report/t32transform.xsl" \ "~~/t32transform.xsl"
;you can now open the formatted result in an external browser windowOS.Command start iexplore.exe "file:///C:/t32/list.xml"
General Commands Reference Guide L | 39©1989-2021 Lauterbach GmbH

List.Hll Display source
Displays the program in source format. The functionality is the same as the Data.List command. If the starting address in not an HLL (High Level Language) line, assembler code is displayed to the next HLL line found in the code segment.
Shaded lines indicate that the source information is not on disk or in the wrong directory. See command sYmbol.SPATH.
See also
■ List ■ List.Asm ■ List.auto ■ List.Java ■ List.Mix ■ Mode ❏ DEBUGMODE()
Format: List.Hll [<address>] [/<option>] Data.ListHll (as an alternative)
<option>: Mark <break>Flag <flag> (EF)COVerageCACHETrackMarkPCTOrder | SOrder
<option> For a description of the options, see List.auto.
Program counter (PC)
Shaded lines
General Commands Reference Guide L | 40©1989-2021 Lauterbach GmbH
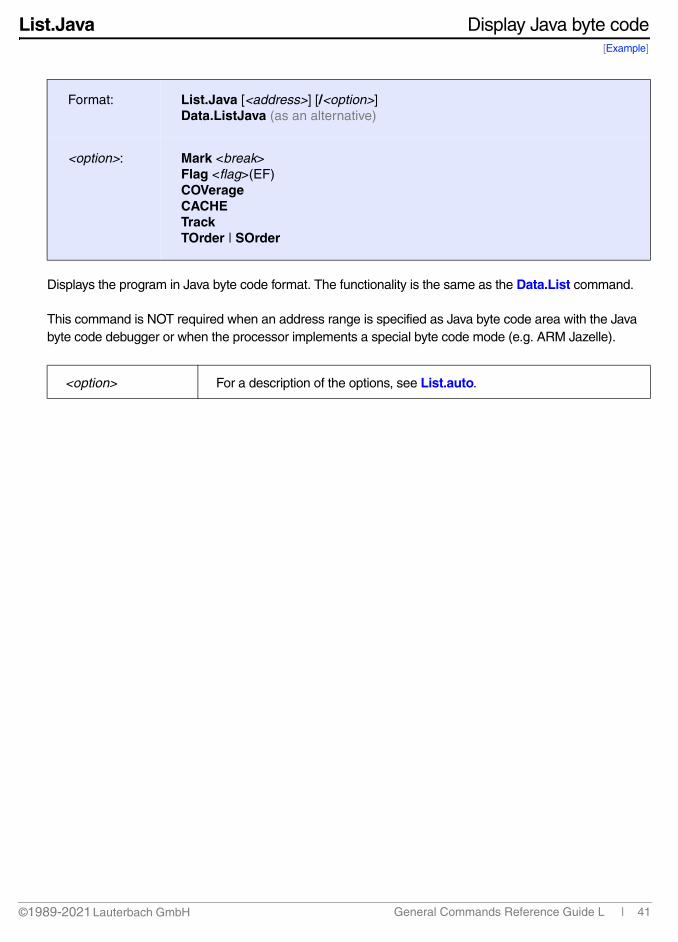
List.Java Display Java byte code[Example]
Displays the program in Java byte code format. The functionality is the same as the Data.List command.
This command is NOT required when an address range is specified as Java byte code area with the Java byte code debugger or when the processor implements a special byte code mode (e.g. ARM Jazelle).
Format: List.Java [<address>] [/<option>] Data.ListJava (as an alternative)
<option>: Mark <break>Flag <flag>(EF)COVerageCACHETrackTOrder | SOrder
<option> For a description of the options, see List.auto.
General Commands Reference Guide L | 41©1989-2021 Lauterbach GmbH

Android is used in this example:
See also
■ List ■ List.Asm ■ List.auto ■ List.Hll ■ List.Mix
;list all running tasks by magic number, task name, task ID, etc.TASK.List.tasks
;change view to a task by specifying the magic number, task name or ID Frame.TASK 0xEFD29700
;display a source listing at this address for the task specified aboveList.Java J:0x0690:0x583A3D14
;alternatively, use the label to display the same source listing.List.Java `<clinit>()` ;enclose the label in backticks `...`
Java file name:Click to open the symbol browser.
Access class J for Java
Thread ID
Address
General Commands Reference Guide L | 42©1989-2021 Lauterbach GmbH

List.Mix Disassembler and source
The code is displayed in HLL (High Level Language) and additionally disassembled from the memory. The functionality is the same as the Data.List command.
Shaded lines indicate that the source information is not on disk or in the wrong directory. See the command sYmbol.SPATH.
See also
■ List ■ List.Asm ■ List.auto ■ List.Hll ■ List.Java ■ Mode ❏ DEBUGMODE()
Format: List.Mix [<address>] [/<option>] Data.ListMix (as an alternative)
<option>: Mark <break>Flag <flag> (EF)COVerageCACHETrackMarkPCTOrder | SOrder
<option> For a description of the options, see List.auto command.
Program counter (PC)
Shaded lines
General Commands Reference Guide L | 43©1989-2021 Lauterbach GmbH
LOGGER
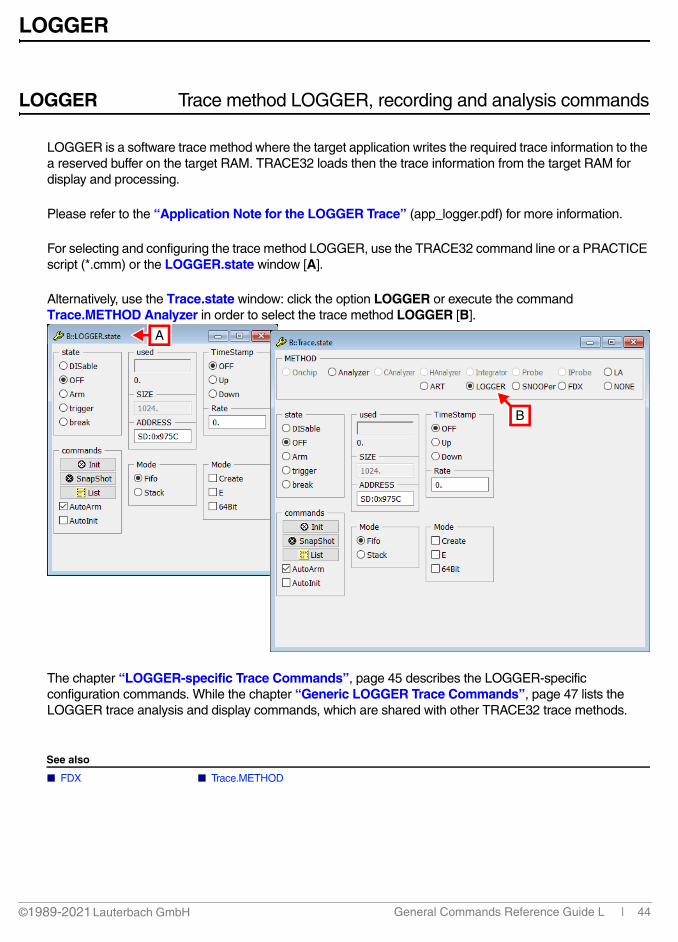
LOGGER Trace method LOGGER, recording and analysis commands
LOGGER is a software trace method where the target application writes the required trace information to the a reserved buffer on the target RAM. TRACE32 loads then the trace information from the target RAM for display and processing.
Please refer to the “Application Note for the LOGGER Trace” (app_logger.pdf) for more information.
For selecting and configuring the trace method LOGGER, use the TRACE32 command line or a PRACTICE script (*.cmm) or the LOGGER.state window [A].
Alternatively, use the Trace.state window: click the option LOGGER or execute the command Trace.METHOD Analyzer in order to select the trace method LOGGER [B].
The chapter “LOGGER-specific Trace Commands”, page 45 describes the LOGGER-specific configuration commands. While the chapter “Generic LOGGER Trace Commands”, page 47 lists the LOGGER trace analysis and display commands, which are shared with other TRACE32 trace methods.
See also
■ FDX ■ Trace.METHOD
A
B
General Commands Reference Guide L | 44©1989-2021 Lauterbach GmbH

LOGGER-specific Trace Commands
LOGGER.ADDRESS Software trace address
Defines the address of the logger trace control block in target memory.
LOGGER.Mode Set LOGGER operation mode
Selects the trace operation mode.
See also
■ <trace>.Mode
Format: LOGGER.ADDRESS [<address>]
Format: LOGGER.Mode [<mode>]
<mode>: Fifo | Stack
CreateE64bit
FlowTrace
Fifo If the trace is full, new records will overwrite older records. The trace records always the last cycles before the break.
Stack If the trace is full recording will be stopped. The trace always records the first cycles after starting the trace.
Create Create LOGGER software trace control block by debugger.
E Dualport access.
64Bit LOGGER mode for 64-bit traces.
FlowTrace Special mode where the LOGGEr is used to sample the program flow. The LOGGER trace listing reconstructs the program flow based on the sampled information. Only supported for PowerPC and SH4.
General Commands Reference Guide L | 45©1989-2021 Lauterbach GmbH
LOGGER.TimeStamp Configure timestamp usage of LOGGER trace
Configure timestamps for the LOGGER trace. The LOGGER trace record format includes a timestamp field for up to 48 bit timestamps. The direction and rate information passed by this command is required to convert the timestamp into the time in seconds.
Example: The timestamp used by the LOGGER target code increments at a rate of 16 million per second (16 MHz):
Format: LOGGER.TimeStamp OFF | Up | Down | Rate <rate>
OFF (default)
Disable timestamps. Use this setting if the LOGGER target code does not store timestamps in the LOGGER trace records. When this setting is used, the x-direction in chart views is the record number axis instead of the time axis.
Up Enable timestamp counter, counting upwards. Use this setting if the LOGGER target code stores timestamps in the LOGGER trace records and if the timestamp increments with each timer tick.
Down Enable timestamp counter, counting downwards. Use this setting if the LOGGER target code stores timestamps in the LOGGER trace records and if the timestamp decrements with each timer tick.
Rate <rate> Frequency of the timestamp in ticks per second.
AllCycles[ON | OFF]SH only
Set timestamp generation frequency.• OFF (default): Generate a single timestamp for 6 trace cycles.• ON: Generate dedicated timestamps for all trace cycles.
LOGGER.TimeStamp UpLOGGER.TimeStamp Rate 16000000.
General Commands Reference Guide L | 46©1989-2021 Lauterbach GmbH
Generic LOGGER Trace Commands
LOGGER.Arm Arm the trace
See command <trace>.Arm in 'General Commands Reference Guide T' (general_ref_t.pdf, page 130).
LOGGER.AutoArm Arm automatically
See command <trace>.AutoArm in 'General Commands Reference Guide T' (general_ref_t.pdf, page 131).
LOGGER.AutoInit Automatic initialization
See command <trace>.AutoInit in 'General Commands Reference Guide T' (general_ref_t.pdf, page 136).
LOGGER.BookMark Set a bookmark in trace listing
See command <trace>.BookMark in 'General Commands Reference Guide T' (general_ref_t.pdf, page 137).
LOGGER.Chart Display trace contents graphically
See command <trace>.Chart in 'General Commands Reference Guide T' (general_ref_t.pdf, page 140).
LOGGER.ComPare Compare trace contents
See command <trace>.ComPare in 'General Commands Reference Guide T' (general_ref_t.pdf, page 186).
General Commands Reference Guide L | 47©1989-2021 Lauterbach GmbH
LOGGER.DISable Disable the trace
See command <trace>.DISable in 'General Commands Reference Guide T' (general_ref_t.pdf, page 191).
LOGGER.DRAW Plot trace data against time
See command <trace>.DRAW in 'General Commands Reference Guide T' (general_ref_t.pdf, page 195).
LOGGER.EXPORT Export trace data for processing in other applications
See command <trace>.EXPORT in 'General Commands Reference Guide T' (general_ref_t.pdf, page 205).
LOGGER.FILE Load a file into the file trace buffer
See command <trace>.FILE in 'General Commands Reference Guide T' (general_ref_t.pdf, page 222).
LOGGER.Find Find specified entry in trace
See command <trace>.Find in 'General Commands Reference Guide T' (general_ref_t.pdf, page 224).
LOGGER.FindAll Find all specified entries in trace
See command <trace>.FindAll in 'General Commands Reference Guide T' (general_ref_t.pdf, page 226).
LOGGER.FindChange Search for changes in trace flow
See command <trace>.FindChange in 'General Commands Reference Guide T' (general_ref_t.pdf, page 227).
LOGGER.FLOWPROCESS Process flowtrace
See command <trace>.FLOWPROCESS in 'General Commands Reference Guide T' (general_ref_t.pdf, page 229).
General Commands Reference Guide L | 48©1989-2021 Lauterbach GmbH

LOGGER.FLOWSTART Restart flowtrace processing
See command <trace>.FLOWSTART in 'General Commands Reference Guide T' (general_ref_t.pdf, page 229).
LOGGER.GOTO Move cursor to specified trace record
See command <trace>.GOTO in 'General Commands Reference Guide T' (general_ref_t.pdf, page 232).
LOGGER.Init Initialize trace
See command <trace>.Init in 'General Commands Reference Guide T' (general_ref_t.pdf, page 234).
LOGGER.List List trace contents
See command <trace>.List in 'General Commands Reference Guide T' (general_ref_t.pdf, page 236).
LOGGER.ListNesting Analyze function nesting
See command <trace>.ListNesting in 'General Commands Reference Guide T' (general_ref_t.pdf, page 249).
LOGGER.ListVar List variable recorded to trace
See command <trace>.ListVar in 'General Commands Reference Guide T' (general_ref_t.pdf, page 252).
LOGGER.LOAD Load trace file for offline processing
See command <trace>.LOAD in 'General Commands Reference Guide T' (general_ref_t.pdf, page 255).
LOGGER.OFF Switch off
See command <trace>.OFF in 'General Commands Reference Guide T' (general_ref_t.pdf, page 262).
General Commands Reference Guide L | 49©1989-2021 Lauterbach GmbH

LOGGER.PROfileChart Profile charts
See command <trace>.PROfileChart in 'General Commands Reference Guide T' (general_ref_t.pdf, page 268).
LOGGER.PROfileSTATistic Statistical analysis in a table versus time
See command <trace>.PROfileSTATistic in 'General Commands Reference Guide T' (general_ref_t.pdf, page 307).
LOGGER.PROTOcol Protocol analysis
See command <trace>.PROTOcol in 'General Commands Reference Guide T' (general_ref_t.pdf, page 323).
LOGGER.PROTOcol.Chart Graphic display for user-defined protocol
See command <trace>.PROTOcol.Chart in 'General Commands Reference Guide T' (general_ref_t.pdf, page 323).
LOGGER.PROTOcol.Draw Graphic display for user-defined protocol
See command <trace>.PROTOcol.Draw in 'General Commands Reference Guide T' (general_ref_t.pdf, page 325).
LOGGER.PROTOcol.EXPORT Export trace buffer for user-defined protocol
See command <trace>.PROTOcol.EXPORT in 'General Commands Reference Guide T' (general_ref_t.pdf, page 326).
LOGGER.PROTOcol.Find Find in trace buffer for user-defined protocol
See command <trace>.PROTOcol.Find in 'General Commands Reference Guide T' (general_ref_t.pdf, page 327).
General Commands Reference Guide L | 50©1989-2021 Lauterbach GmbH
LOGGER.PROTOcol.List Display trace buffer for user-defined protocol
See command <trace>.PROTOcol.List in 'General Commands Reference Guide T' (general_ref_t.pdf, page 328).
LOGGER.PROTOcol.PROfileChart Profile chart for user-defined protocol
See command <trace>.PROTOcol.PROfileChart in 'General Commands Reference Guide T' (general_ref_t.pdf, page 331).
LOGGER.PROTOcol.PROfileSTATistic Profile chart for user-defined protocol
See command <trace>.PROTOcol.PROfileSTATistic in 'General Commands Reference Guide T' (general_ref_t.pdf, page 332).
LOGGER.PROTOcol.STATistic Display statistics for user-defined protocol
See command <trace>.PROTOcol.STATistic in 'General Commands Reference Guide T' (general_ref_t.pdf, page 334).
LOGGER.REF Set reference point for time measurement
See command <trace>.REF in 'General Commands Reference Guide T' (general_ref_t.pdf, page 341).
LOGGER.RESet Reset command
See command <trace>.RESet in 'General Commands Reference Guide T' (general_ref_t.pdf, page 341).
LOGGER.SAVE Save trace for postprocessing in TRACE32
See command <trace>.SAVE in 'General Commands Reference Guide T' (general_ref_t.pdf, page 342).
General Commands Reference Guide L | 51©1989-2021 Lauterbach GmbH
LOGGER.SelfArm Automatic restart of trace recording
See command <trace>.SelfArm in 'General Commands Reference Guide T' (general_ref_t.pdf, page 346).
LOGGER.SIZE Define buffer size
See command <trace>.SIZE in 'General Commands Reference Guide T' (general_ref_t.pdf, page 356).
LOGGER.SnapShot Restart trace capturing once
See command <trace>.SnapShot in 'General Commands Reference Guide T' (general_ref_t.pdf, page 356).
LOGGER.state Display trace configuration window
See command <trace>.state in 'General Commands Reference Guide T' (general_ref_t.pdf, page 358).
LOGGER.STATistic Statistic analysis
See command <trace>.STATistic in 'General Commands Reference Guide T' (general_ref_t.pdf, page 360).
LOGGER.Timing Waveform of trace buffer
See command <trace>.Timing in 'General Commands Reference Guide T' (general_ref_t.pdf, page 474).
LOGGER.TRACK Set tracking record
See command <trace>.TRACK in 'General Commands Reference Guide T' (general_ref_t.pdf, page 477).
LOGGER.View Display single record
See command <trace>.View in 'General Commands Reference Guide T' (general_ref_t.pdf, page 479).
General Commands Reference Guide L | 52©1989-2021 Lauterbach GmbH
LOGGER.ZERO Align timestamps of trace and timing analyzers
See command <trace>.ZERO in 'General Commands Reference Guide T' (general_ref_t.pdf, page 480).
General Commands Reference Guide L | 53©1989-2021 Lauterbach GmbH

LUA
LUA Support for the Lua script language
The TRACE32 Lua API allows the user to load and execute Lua scripts directly in the debugger. This feature can be used to accelerate execution of certain debug commands by avoiding the interaction between the TRACE32 host software and the debug driver. A Lua interpreter is built into the debug box, supporting the complete Lua language. Please refer to the official website of Lua www.lua.org for documentation.
In addition to the standard language elements, Lauterbach has extended Lua with a set of TRACE32 specific libraries. This allows you to, for example, use the JTAG shift functions directly in the Lua script. For a description of the TRACE32 specific libraries, refer to “TRACE32 Lua Library” (lua_library.pdf).
The Lua API can be used both as TRACE32 commands and through the remote C API. The LUA command group is described in the following sections and the C API is introduced in chapter Remote Lua API.
See also
■ LUA.List ■ LUA.LOAD ■ LUA.RESet ■ LUA.RUN ■ LUA.SET ■ LUA.ShowInput ■ LUA.ShowOutput ■ LUA.UNLOAD
▲ ’TRACE32 Lua Library’ in ’TRACE32 Lua Library’
LUA.List List the current Lua scripts
Lists the Lua scripts that have been loaded into the debugger. The output is redirected to the AREA window and has the following format: <id> : <label>, <attribute>, <file>. See example.
See also
■ LUA.LOAD ■ LUA ■ LUA.RESet ■ LUA.RUN ■ LUA.SET ■ LUA.ShowInput ■ LUA.ShowOutput ■ LUA.UNLOAD
Format: LUA.List
ID An auto-generated sequential index of the current Lua scripts. Note that the ID of a certain script may change after loading/unloading another script.
label A unique string to identify a Lua script.
attribute EXE: an executable script.LIB: a library script.See LUA.LOAD for more details.
filename Path to the Lua file.
General Commands Reference Guide L | 54©1989-2021 Lauterbach GmbH
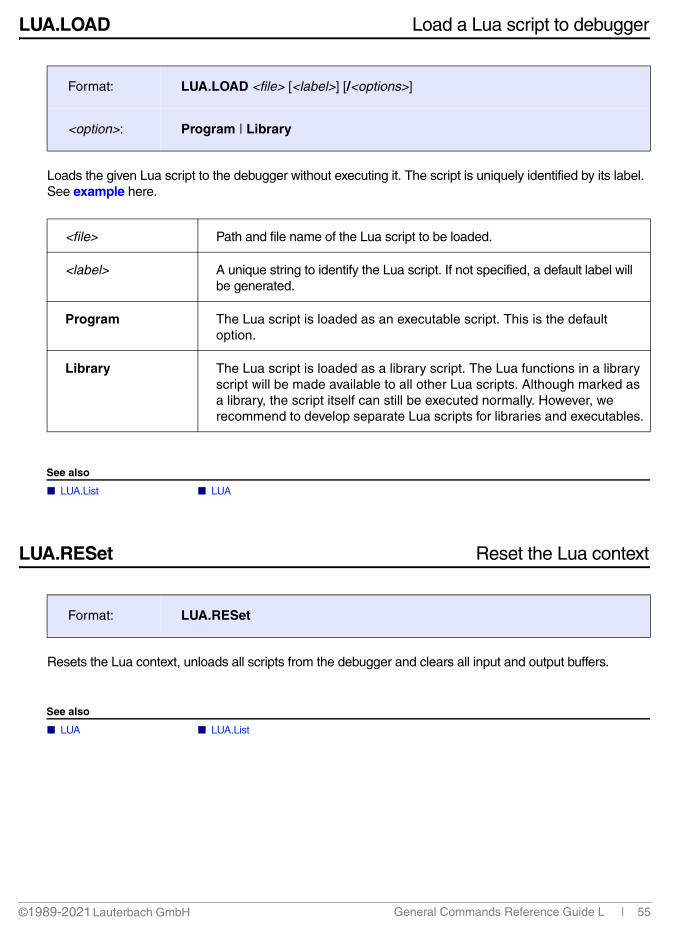
LUA.LOAD Load a Lua script to debugger
Loads the given Lua script to the debugger without executing it. The script is uniquely identified by its label. See example here.
See also
■ LUA.List ■ LUA
LUA.RESet Reset the Lua context
Resets the Lua context, unloads all scripts from the debugger and clears all input and output buffers.
See also
■ LUA ■ LUA.List
Format: LUA.LOAD <file> [<label>] [/<options>]
<option>: Program | Library
<file> Path and file name of the Lua script to be loaded.
<label> A unique string to identify the Lua script. If not specified, a default label will be generated.
Program The Lua script is loaded as an executable script. This is the default option.
Library The Lua script is loaded as a library script. The Lua functions in a library script will be made available to all other Lua scripts. Although marked as a library, the script itself can still be executed normally. However, we recommend to develop separate Lua scripts for libraries and executables.
Format: LUA.RESet
General Commands Reference Guide L | 55©1989-2021 Lauterbach GmbH
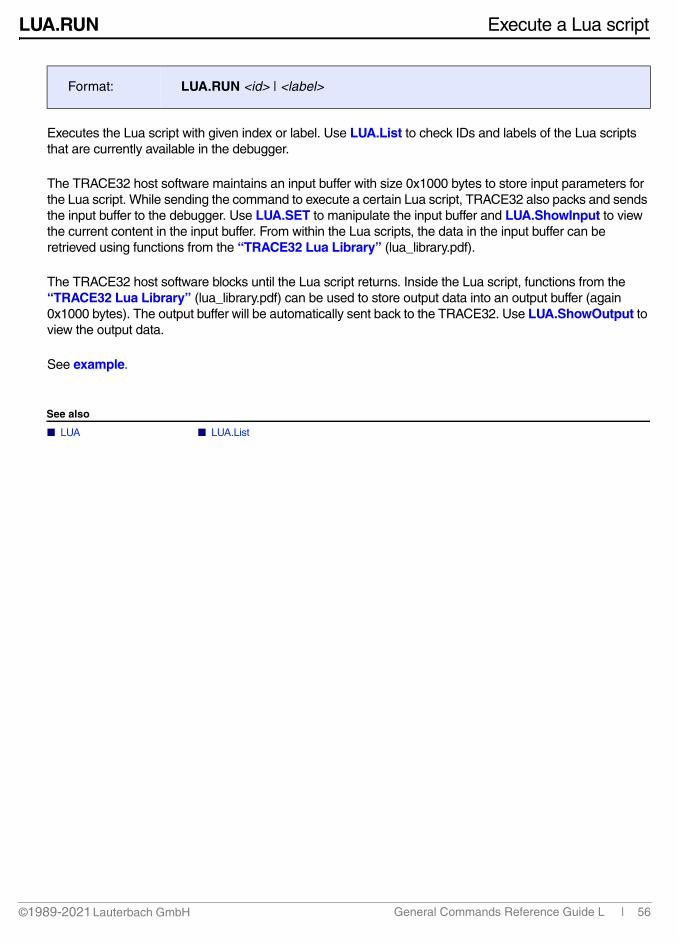
LUA.RUN Execute a Lua script
Executes the Lua script with given index or label. Use LUA.List to check IDs and labels of the Lua scripts that are currently available in the debugger.
The TRACE32 host software maintains an input buffer with size 0x1000 bytes to store input parameters for the Lua script. While sending the command to execute a certain Lua script, TRACE32 also packs and sends the input buffer to the debugger. Use LUA.SET to manipulate the input buffer and LUA.ShowInput to view the current content in the input buffer. From within the Lua scripts, the data in the input buffer can be retrieved using functions from the “TRACE32 Lua Library” (lua_library.pdf).
The TRACE32 host software blocks until the Lua script returns. Inside the Lua script, functions from the “TRACE32 Lua Library” (lua_library.pdf) can be used to store output data into an output buffer (again 0x1000 bytes). The output buffer will be automatically sent back to the TRACE32. Use LUA.ShowOutput to view the output data.
See example.
See also
■ LUA ■ LUA.List
Format: LUA.RUN <id> | <label>
General Commands Reference Guide L | 56©1989-2021 Lauterbach GmbH
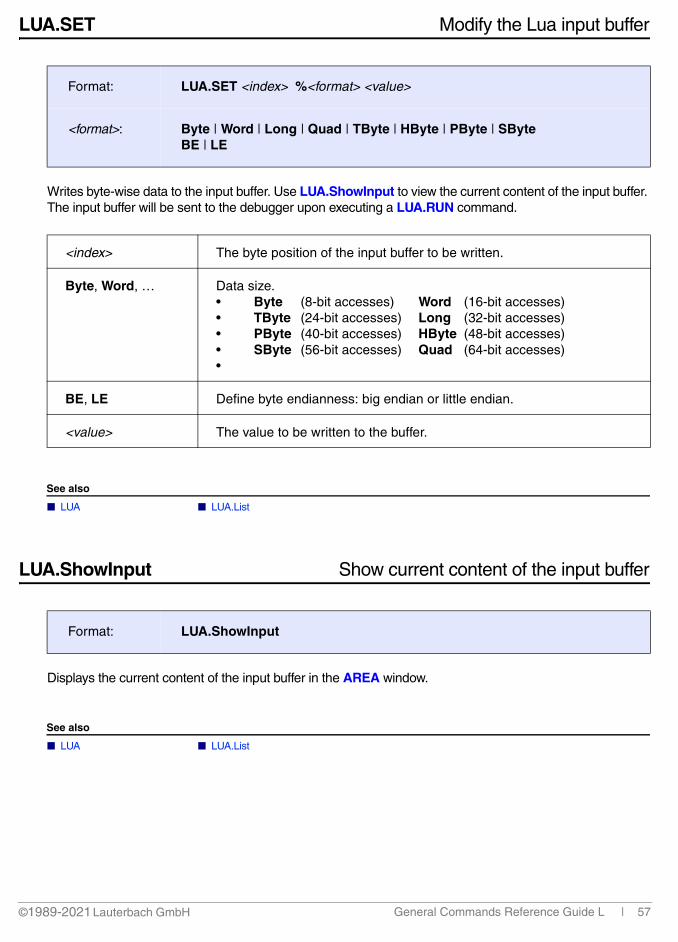
LUA.SET Modify the Lua input buffer
Writes byte-wise data to the input buffer. Use LUA.ShowInput to view the current content of the input buffer. The input buffer will be sent to the debugger upon executing a LUA.RUN command.
See also
■ LUA ■ LUA.List
LUA.ShowInput Show current content of the input buffer
Displays the current content of the input buffer in the AREA window.
See also
■ LUA ■ LUA.List
Format: LUA.SET <index> %<format> <value>
<format>: Byte | Word | Long | Quad | TByte | HByte | PByte | SByte BE | LE
<index> The byte position of the input buffer to be written.
Byte, Word, … Data size.• Byte (8-bit accesses) Word (16-bit accesses)• TByte (24-bit accesses) Long (32-bit accesses)• PByte (40-bit accesses) HByte (48-bit accesses)• SByte (56-bit accesses) Quad (64-bit accesses)•
BE, LE Define byte endianness: big endian or little endian.
<value> The value to be written to the buffer.
Format: LUA.ShowInput
General Commands Reference Guide L | 57©1989-2021 Lauterbach GmbH
LUA.ShowOutput Show current content of the output buffer
Displays the current content of the output buffer in the AREA window.The output buffer contains the return values from the Lua script. Inside the Lua script, functions from the “TRACE32 Lua Library” (lua_library.pdf) can be used to write to the output buffer.
See also
■ LUA ■ LUA.List
LUA.UNLOAD Remove a Lua script from the debugger
Removes a previously loaded Lua script from the debugger. Use LUA.List to see the current set of scripts available.
Format: LUA.ShowOutput
Format: LUA.UNLOAD <id> | <label>
General Commands Reference Guide L | 58©1989-2021 Lauterbach GmbH
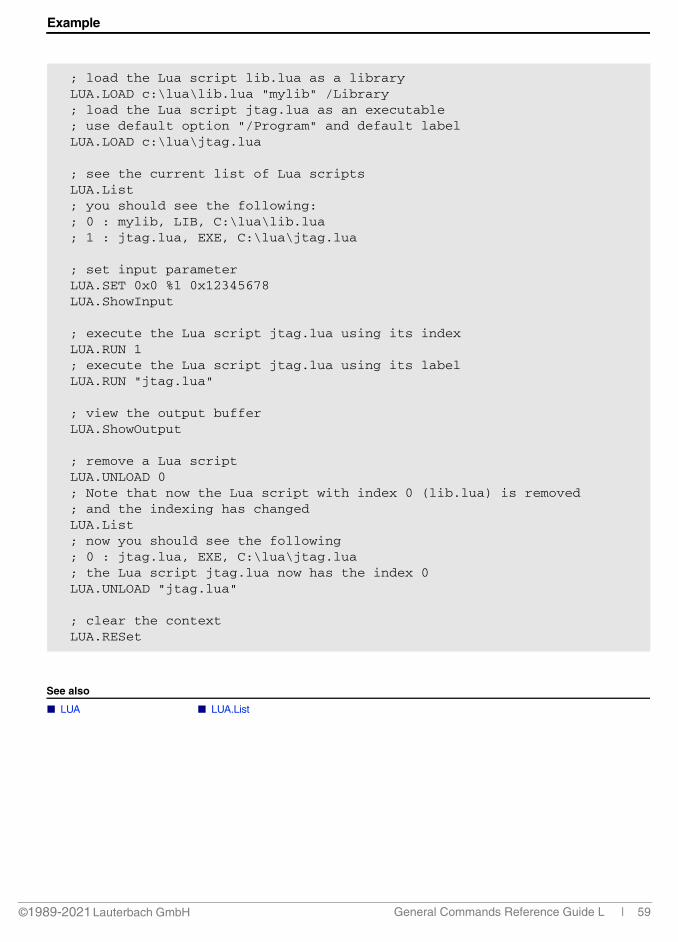
Example
See also
■ LUA ■ LUA.List
; load the Lua script lib.lua as a libraryLUA.LOAD c:\lua\lib.lua "mylib" /Library; load the Lua script jtag.lua as an executable; use default option "/Program" and default labelLUA.LOAD c:\lua\jtag.lua
; see the current list of Lua scriptsLUA.List; you should see the following:; 0 : mylib, LIB, C:\lua\lib.lua; 1 : jtag.lua, EXE, C:\lua\jtag.lua
; set input parameterLUA.SET 0x0 %l 0x12345678LUA.ShowInput
; execute the Lua script jtag.lua using its indexLUA.RUN 1; execute the Lua script jtag.lua using its labelLUA.RUN "jtag.lua"
; view the output bufferLUA.ShowOutput
; remove a Lua scriptLUA.UNLOAD 0; Note that now the Lua script with index 0 (lib.lua) is removed; and the indexing has changedLUA.List; now you should see the following; 0 : jtag.lua, EXE, C:\lua\jtag.lua; the Lua script jtag.lua now has the index 0LUA.UNLOAD "jtag.lua"
; clear the contextLUA.RESet
General Commands Reference Guide L | 59©1989-2021 Lauterbach GmbH


![AT Reference Guide - multitech.com€¦ · CE910 Series AT commands reference guide – commands [...]](https://static.fdocuments.in/doc/165x107/6062516d02f817666972114f/at-reference-guide-ce910-series-at-commands-reference-guide-a-commands-.jpg)