PowerPoint Presentation · Underpenetrated Category Provides Secular Tailwinds 4 1 Match survey....
21
Q4 2018 Investor Presentation – February 6, 2019
Transcript of PowerPoint Presentation · Underpenetrated Category Provides Secular Tailwinds 4 1 Match survey....

Q4 2018
Investor Presentation – February 6, 2019

Safe Harbor Disclosure and Definitions
2
This presentation contains forward-looking statements. The use of words such as "anticipates," "estimates," "expects," "plans" and "believes," among others, generally identify forward-looking statements. Similarly, statements herein that describe Match Group’s future financial performance, prospects, strategy, outlook, objectives, plans, intentions or goals, or anticipated trends and other similar matters are also forward-looking statements. These forward-looking statements are based on management’s current expectations and assumptions about future events, which are inherently subject to uncertainties, risks and changes in circumstances that are difficult to predict. Actual results could differ materially from those contained in these forward-looking statements for a variety of reasons, including, among others: competition, our ability to maintain user rates on our higher monetizing dating products, our ability to attract users to our dating products through cost-effective marketing and related efforts, foreign currency exchange rate fluctuations, our ability to distribute our dating products through third parties and offset related fees, the integrity and scalability of our systems and infrastructure (and those of third parties) and our ability to adapt ours to changes in a timely and cost-effective manner, our ability to protect our systems from cyberattacks and to protect personal and confidential user information, risks relating to certain of our international operations and acquisitions and certain risks relating to our relationship with IAC/InterActiveCorp, among other risks. Certain of these and other risks and uncertainties are discussed in Match Group’s filings with the Securities and Exchange Commission. Other unknown or unpredictable factors that could also adversely affect our business, financial condition and results of operations may arise from time to time. In light of these risks and uncertainties, these forward-looking statements may not prove to be accurate. Accordingly, you should not place undue reliance on these forward-looking statements, which only reflect the views of Match Group management as of the date of this presentation. Match Group does not undertake to update these forward-looking statements.
This presentation includes certain non-GAAP financial measures in addition to financial measures presented in accordance with U.S. GAAP. These non-GAAP financial measures are in addition to, and not a substitute for or superior to, measures of financial performance prepared in accordance with U.S. GAAP. See the Appendix for a reconciliation of the non-GAAP financial measures to their most comparable GAAP measure.
This presentation contains statistical data that we obtained from third party publications, surveys and reports. Although we have not independently verified the accuracy or completeness of the data contained in these industry publications, surveys and reports, we believe the publications, surveys and reports are generally reliable, although such information is inherently subject to uncertainties and imprecise.
“Average Subscribers” is the number of Subscribers at the end of each day in the relevant measurement period divided by the number of calendar days in that period. Subscribers as of any given time represent the number of users who purchased a subscription to one of our products at that time. Users who purchase only à la carte features are not included in Subscribers. Unless otherwise noted, Subscribers refers to Average Subscribers in this presentation. “Ending Subscribers” is the number of Subscribers at the end of the relevant measurement period. ‘‘ARPU’’ or Average Revenue per Subscriber, is Direct Revenue from Subscribers in the relevant measurement period (whether in the form of Subscription or à la carte) divided by the Average Subscribers in such period and further divided by the number of calendar days in such period. Direct Revenue from users who are not Subscribers and have purchased only à la carte features is not included in ARPU. Direct Revenue is revenue that is received directly from end users of our products and includes both subscription and à la carte revenue. "North America" or "NA" as used in this presentation refers to the United States and Canada.

3
Category and Business Trends

Underpenetrated Category Provides Secular Tailwinds
4
1 Match survey. Percent of respondents that have ever used a dating app or site (single, and not in a relationship).2 Match survey.
North America and Europe
Dating Product Usage1
# of Apps Used – U.S.2
APAC / Africa / Middle East / LatAm
Significant runway remains – more than half of singles have never tried dating products
Category usage continues to grow
‒ More singles using dating products
‒ Increasing multiple-app usage
Massive opportunity, ~75% of global singles
2/3 of singles have never tried dating products
‒ Comparable to US and Europe usage prior to 2012
Young and very mobile-savvy population
Dating Product Usage in 20181
2.0 2.23.3
4.2
All Ages Under 352015 Today
29%16%
39%47%
All U.S. Singles 18-24 U.S. Singles
2012 Today
11%
17%
29%
42%44%
India Japan S. Korea Taiwan Brazil

Average Subscribers (in 000’s)
FY 2018
Nearly doubled Direct Revenue YoY to $805 million and added 1.2 million Average Subscribers
ARPU increased YoY by 23% primarily due to Tinder Gold
Q4 2018
57% YoY Direct Revenue growth
‒ 40% YoY Average Subscriber growth
‒ ARPU up 12% YoY driven by continued shift to Gold and record à la carte revenue
915 1,121
1,386 1,631
1,858 2,082
2,558
3,101 3,470
3,769 4,113
4,346
Q1'16 Q2'16 Q3'16 Q4'16 Q1'17 Q2'17 Q3'17 Q4'17 Q1'18 Q2'18 Q3'18 Q4'18
Tinder: Monetization Strength Continues
5

Tinder: Roadmap Centers on Key Objectives
6
Most Engaging User ExperienceExtend Appeal in Key Demos Fuel Underpenetrated Geos
Relevant matches (e.g. recommendation engine)
Fun interactions and messaging (e.g. Swipe Surge, music sharing)
Fresh experiences reflecting cultural moments and events
Trust and safety
Revenue optimizations
Focusing on high-growth emerging dating markets, including Japan, India and South Korea
Localizing product UX and features
Adding alternative payment methods
Driving brand awareness and messaging with TV and influencers
Continuing to solidify position among core 18 – 22 demo via Tinder U
Expanding college coverage in the U.S. and internationally
Supporting with brand ambassadors, influencers and events tied to school calendar (e.g. Rivalry Week)
Rivalry Week
31 2
Spotify Music Sharing
India TV Campaign
S. Korea TV Campaign
Swipe Surge
0.0 M
0.5 M
1.0 M
1.5 M
2.0 M
Q4'17 Q4'18
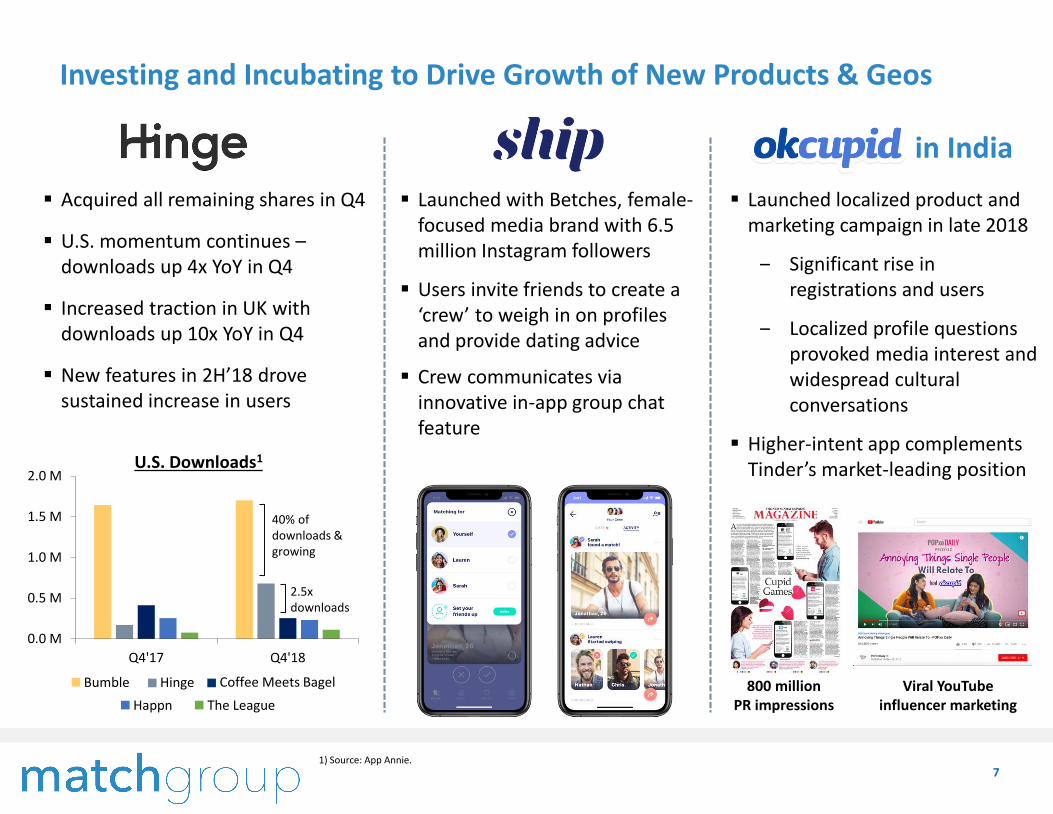
Investing and Incubating to Drive Growth of New Products & Geos
Acquired all remaining shares in Q4
U.S. momentum continues –downloads up 4x YoY in Q4
Increased traction in UK with downloads up 10x YoY in Q4
New features in 2H’18 drove sustained increase in users
7
Launched with Betches, female-focused media brand with 6.5 million Instagram followers
Users invite friends to create a ‘crew’ to weigh in on profiles and provide dating advice
Crew communicates via innovative in-app group chat feature
Launched localized product and marketing campaign in late 2018
‒ Significant rise in registrations and users
‒ Localized profile questions provoked media interest and widespread cultural conversations
Higher-intent app complements Tinder’s market-leading position
in India
Viral YouTube influencer marketing
800 million PR impressions
U.S. Downloads1
Happn The League
1) Source: App Annie.
40% of downloads & growing
2.5x downloads
HingeBumble Coffee Meets Bagel

8
Financial Overview and Outlook
9
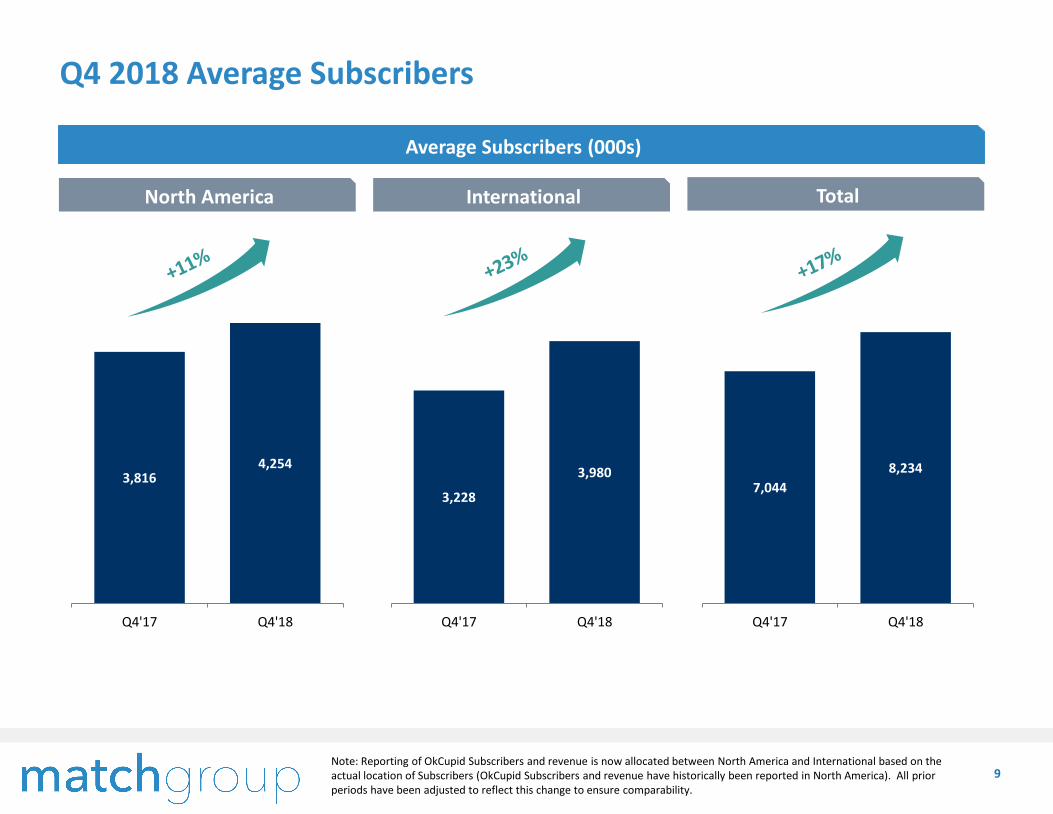
North America International Total
Q4 2018 Average Subscribers
Average Subscribers (000s)
3,816 4,254
Q4'17 Q4'18
3,228
3,980
Q4'17 Q4'18
7,044
8,234
Q4'17 Q4'18
Note: Reporting of OkCupid Subscribers and revenue is now allocated between North America and International based on the actual location of Subscribers (OkCupid Subscribers and revenue have historically been reported in North America). All prior periods have been adjusted to reflect this change to ensure comparability.

$0.57 $0.54 $0.55
$0.59 $0.56 $0.58
North America International Total
Q4'17 Q4'18
10
ARPU
Tinder ARPU continues to approach Match Group ARPU
$0.30
$0.45
$0.60
Q4'16 Q4'17 Q4'18
Tinder All Other Brands
Tinder ARPU has increased ~50% since 2016 while All Other Brands’ ARPU has been stable
Match Group
Note: Reporting of OkCupid Subscribers and revenue is now allocated between North America and International based on the actual location of Subscribers (OkCupid Subscribers and revenue have historically been reported in North America). All prior periods have been adjusted to reflect this change to ensure comparability.

Indirect
11
Q4 2018 Results
Revenue ($M) Operating Income ($M) Adjusted EBITDA ($M)
Revenue Q4’18 YoY Change
Direct North America 17%
Direct International 28%
Total Direct Revenue 22%
Margin 34% 33% 40% 38%Margin
$153
$176
Q4'17 Q4'18
$128
$151
$0
$20
$40
$60
$80
$10 0
$12 0
$14 0
$16 0
$18 0
$20 0
Q4'17 Q4'18
Direct InternationalDirect North America
$15 $12
$201 $235
$163
$210
$379
$457
Q4'17 Q4'18
Note: Reporting of OkCupid Subscribers and revenue is now allocated between North America and International based on the actual location of Subscribers (OkCupid Subscribers and revenue have historically been reported in North America). All prior periods have been adjusted to reflect this change to ensure comparability.

Tinder –Direct
Outstanding Financial Performance
12
Revenue ($M) Operating Income ($M) Adjusted EBITDA ($M)
Note: All results are for continuing operations. 2015 and 2016 results are pro forma for POF acquisition.
37%
Margin
25% 30% 27% 32%
Margin
- All Other Brands stable in ’18 / ‘17
- Affinity rundown caused decline in ’17 / ‘16
33% 36% 35% 38%
2018 YoY margins up 250bps; continue to approach 40%+ long-term target
$328 $409
$469
$654
2015 2016 2017 2018
All Other Brands –Direct
Indirect
$58 $51 $49 $53
$874 $904 $878 $872
$47 $169
$403
$805
$979
$1,124
$1,331
$1,730
2015 2016 2017 2018
$242
$333 $361
$553
2015 2016 2017 2018

13
Note: Rounding differences may occur. 1 Cash balance includes cash and cash equivalents.
Strong Balance Sheet and FCF
Free Cash Flow ($M)Leverage
Cash balance at 12/31/18 of $187 million1
Drew $260M from our revolver in Q4 to fund dividend
‒ Current amount drawn on revolver of $185 million
2016 2017 2018
Net Cash From Op Activities $260 $321 $603
Less: CapEx $46 $29 $31
FCF $213 $292 $573
37%53% 62% 88%FCF to Adjusted
EBITDA %
4.5x
3.0x2.7x
2.0x2.3x
4.1x
2.3x2.1x
1.4x
2.1x
12/31/15 12/31/16 12/31/17 9/30/18 12/31/18
Gross Leverage Net Leverage
$213
$292
$573
FY 2016 FY 2017 FY 2018

14
Key Drivers for FY 2019
Expect mid-teens revenue growth
‒ Tinder to continue to drive revenue growth; overall stability at other brands
Adjusted EBITDA of $740 – $790 million, depending on precise levels of marketing spend and investments in new and existing brands
‒ YoY marketing spend increase at Tinder, Hinge and a number of other emerging growth brands, particularly concentrated in 1H’19
Other
Capital Expenditures of ~$35 million
Depreciation & Amortization of ~$35 million
Stock-based compensation expense of ~$80 million
Expect mid 20s% GAAP effective tax rate excluding the estimated tax benefit of equity award vesting and exercises; not expecting to be a material US cash tax payer until 2021
FCF / Adjusted EBITDA conversion of 70%+
Financial Outlook
Metric Q1 2019 Outlook
Total Revenue $455 to $465 million
Adjusted EBITDA $150 to $155 million
Reflects YoY negative FX impact on revenue of ~3%
Tinder sequential increase in Average Subscribers above historical levels of 200 – 250K
Q1 2019 Commentary

15
Appendix

16
GAAP to Non-GAAP Reconciliations
Note: Rounding differences may occur
Three Months Ended December 31,
($Ms) 4Q17 4Q18
Net Earnings attributable to Match Group, Inc. shareholders ($9.0) $115.5
Add back:
Net earnings (loss) attributable to noncontrolling interests 0.1 (1.6)
Loss from discontinued operations, net of tax 1.0 -
Income tax provision 110.2 21.1
Other expense (income), net 5.4 (3.1)
Interest expense 20.0 19.0
Operating Income 127.7 151.0
Stock-based compensation expense 15.5 16.2
Depreciation 9.0 7.9
Amortization of intangibles 0.3 0.4
Acquisition-related contingent consideration fair value adjustments 0.9 0.1
Adjusted EBITDA $153.2 $175.6
Direct Revenue 364.0 445.2
Indirect Revenue 14.9 12.2
Revenue $378.9 $457.3
Operating income margin 34% 33%
Adjusted EBITDA margin 40% 38%

17
GAAP to Non-GAAP Reconciliations
Note: Rounding differences may occur(a) Pro forma results include adjustments for the acquisition of PlentyOfFish for the years ended December 31, 2015 and 2016.
As Reported Pro Forma(a)
Years Ended December 31,
2015 2016 2017 2018 2015 2016
Net earnings attributable to Match Group, Inc. shareholders $120.4 $171.5 $350.1 $477.9 $139.7 $188.5
Add back:
Net earnings (loss) attributable to noncontrolling interests $0.1 $0.6 $0.2 ($5.3) $0.1 $0.6
Loss from discontinued operations, net of tax $12.7 $6.3 $5.7 $0.4 $12.7 $6.3
Income tax provision (benefit) $65.5 $62.9 ($103.9) $14.7 $74.1 $62.9
Other (income) expense, net ($11.6) ($7.9) $30.8 ($7.8) ($11.0) ($7.9)
Interest expense $25.9 $82.2 $77.6 $73.4 $25.9 $82.2
Operating Income $213.0 $315.5 $360.5 $553.3 $241.5 $332.6
Stock-based compensation expense $49.4 $52.4 $69.1 $66.0 $49.4 $52.4
Depreciation $19.8 $27.7 $32.6 $33.0 $22.1 $27.7
Amortization of intangibles $13.4 $16.9 $1.5 $1.3 $26.1 $5.4
Acquisition-related contingent consideration fair value adjustments ($11.1) ($9.2) $5.3 $0.3 ($11.1) ($9.2)
Adjusted EBITDA $284.6 $403.4 $468.9 $653.9 $328.0 $408.9
Direct Revenue $866.6 $1,067.4 $1,281.2 $1,677.2 $921.5 $1,072.9
Indirect Revenue $43.1 $50.7 $49.4 $52.7 $57.7 $50.7
Revenue $909.7 $1,118.1 $1,330.7 $1,729.9 $979.2 $1,123.6
Operating income margin 23% 28% 27% 32% 25% 30%
Adjusted EBITDA margin 31% 36% 35% 38% 33% 36%
Years Ended December 31,

($Ms) 2018 2017
Net cash provided by operating activities attributable to continuing operations $603.5 $321.1
Capital expenditures (31.0) (28.8)
Free Cash Flow $572.5 $292.3
Twelve Months Ended December 31,
18
GAAP to Non-GAAP Reconciliations

19
GAAP to Non-GAAP Reconciliations
($Ms) Q1 FY
Operating Income $115 to $120 $625 to $675
Stock-based compensation expense 27 80
Depreciation & Amortization of intangibles 8 35
Adjusted EBITDA $150 to $155 $740 to $790
2019

20
Q4 2018 & Q4 2017 Operating Expenses
($Ms) Q4 2018% of
RevenueQ4 2017
% of
RevenueChange
Cost of Revenue $111.2 24% $85.9 23% 29%
Selling and marketing expense 103.1 23% 85.9 23% 20%
General and administrative expense 50.2 11% 42.1 11% 19%
Product development expense 33.5 7% 28.1 7% 19%
Depreciation 7.9 2% 9.0 2% (12%)
Amortization of intangibles 0.4 0% 0.3 0% 55%
Total Operating Costs and Expenses $306.3 67% $251.2 66% 22%
Revenue $457.3 100% $378.9 100% 21%

21
Trended Key Metrics (a)
Note: Rounding differences may occur
(a) Reporting of OkCupid subscribers and revenue is now allocated between North America and International based on the actual location of subscribers (OkCupid subscribers and revenue have historically been reported in North America). All prior periods have been adjusted to reflect this change to ensure comparability.
(b) Pro forma results include adjustments for the acquisition of PlentyOfFish for the year ended December 31, 2016.
2016 2017 2018
FY Q1 Q2 Q3 Q4 FY Q1 Q2 Q3 Q4 FY
Average Subscribers (000s)
North America 3,268 3,386 3,452 3,615 3,816 3,569 3,976 4,131 4,278 4,254 4,161
International 2,140 2,525 2,649 2,944 3,228 2,839 3,457 3,592 3,812 3,980 3,712
Total 5,408 5,911 6,101 6,559 7,044 6,408 7,433 7,723 8,090 8,234 7,873
ARPU (b) (pro forma)
North America $0.56 $0.57 $0.56 $0.56 $0.57 $0.56 $0.58 $0.58 $0.59 $0.59 $0.59
International $0.50 $0.48 $0.49 $0.52 $0.54 $0.51 $0.57 $0.56 $0.55 $0.56 $0.56
Total $0.54 $0.53 $0.53 $0.54 $0.55 $0.54 $0.58 $0.57 $0.57 $0.58 $0.57
Revenue (b) (pro forma, $Ms)
North America Direct $678.3 $175.3 $178.5 $186.9 $200.6 $741.3 $211.4 $222.2 $233.6 $235.3 $902.5
International Direct $394.6 $112.4 $120.9 $143.2 $163.3 $539.9 $181.4 $185.6 $197.9 $209.8 $774.7
Total Direct $1,072.9 $287.8 $299.4 $330.1 $364.0 $1,281.2 $392.7 $407.7 $431.5 $445.2 $1,677.2
Indirect Revenue $50.7 $11.0 $10.1 $13.3 $14.9 $49.4 $14.6 $13.5 $12.4 $12.2 $52.7
Total Revenue $1,123.6 $298.8 $309.6 $343.4 $378.9 $1,330.7 $407.4 $421.2 $443.9 $457.3 $1,729.9
Revenue (as reported, $Ms)
North America Direct $673.9 $175.3 $178.5 $186.9 $200.6 $741.3 $211.4 $222.2 $233.6 $235.3 $902.5
International Direct $393.4 $112.4 $120.9 $143.2 $163.3 $539.9 $181.4 $185.6 $197.9 $209.8 $774.7
Total Direct $1,067.4 $287.8 $299.4 $330.1 $364.0 $1,281.2 $392.7 $407.7 $431.5 $445.2 $1,677.2
Indirect Revenue $50.7 $11.0 $10.1 $13.3 $14.9 $49.4 $14.6 $13.5 $12.4 $12.2 $52.7
Total Revenue $1,118.1 $298.8 $309.6 $343.4 $378.9 $1,330.7 $407.4 $421.2 $443.9 $457.3 $1,729.9