
Powered two wheeler user casualties in Greater London · Powered two wheeler user casualties in...
27
Factsheet Transport for London Surface Transport London Road Safety Unit LAAU topic 2009-2 October 2009 Powered two wheeler user casualties in Greater London This factsheet looks into the scale and nature of road traffic collisions resulting in injury to powered two wheeler (P2W) users (riders and passengers) in the Greater London area. It gives an overview of such collisions for the period 1986 to 2008 and then looks in detail at the profile of the casualties and factors relating to the collisions that occurred in 2008 (the latest year for which finalised data are available at the time of writing). It provides background information to support the Government and Mayor for London’s targets to reduce road casualties by the year 2010. The target in London for P2W casualties is a 40% reduction in those killed or seriously injured (KSI) by 2010 from a baseline of the average number of casualties for 1994-98. The data provided are for personal injury road traffic collisions that occurred on the public highway and were reported to the police in accordance with the STATS 19 national reporting system. Prior to 1999 STATS 19 categorised P2W vehicles as mopeds, motor scooters and motor cycles. From January 1999 the P2W categories were changed to mopeds, motor cycles up to and including 125cc and motorcycles over 125cc. A further change took place from January 2005, whereby the P2W categories became motorcycle 50cc and under, motorcycle over 50cc and up to 125cc, motorcycle over 125cc and up to 500cc and motorcycle over 500cc. Key facts • 4,111 collisions in Greater London in 2008 resulted in injury to 4,222 P2W users; these represented 18% of all collisions and 15% of all casualties. • P2W user KSI casualties accounted for 21% of all KSI casualties in 2008. • In terms of the casualty reduction targets for London, P2W KSI casualties fell by 21% between the 1994-98 average and 2008; all P2W casualties fell by 30%. • In 2008 90% of P2W casualties were male. • Just over one third (35%) of P2W user casualties of known age in 2008 were aged between 25 and 34 years. • P2W casualties averaged 12 a day in Greater London during 2008 London Road Safety Unit 1
Transcript of Powered two wheeler user casualties in Greater London · Powered two wheeler user casualties in...
Factsheet
Transport for London
Surface Transport
London Road Safety Unit LAAU topic 2009-2 October 2009 Powered two wheeler user casualties in Greater London This factsheet looks into the scale and nature of road traffic collisions resulting in injury to powered two wheeler (P2W) users (riders and passengers) in the Greater London area. It gives an overview of such collisions for the period 1986 to 2008 and then looks in detail at the profile of the casualties and factors relating to the collisions that occurred in 2008 (the latest year for which finalised data are available at the time of writing). It provides background information to support the Government and Mayor for London’s targets to reduce road casualties by the year 2010. The target in London for P2W casualties is a 40% reduction in those killed or seriously injured (KSI) by 2010 from a baseline of the average number of casualties for 1994-98. The data provided are for personal injury road traffic collisions that occurred on the public highway and were reported to the police in accordance with the STATS 19 national reporting system. Prior to 1999 STATS 19 categorised P2W vehicles as mopeds, motor scooters and motor cycles. From January 1999 the P2W categories were changed to mopeds, motor cycles up to and including 125cc and motorcycles over 125cc. A further change took place from January 2005, whereby the P2W categories became motorcycle 50cc and under, motorcycle over 50cc and up to 125cc, motorcycle over 125cc and up to 500cc and motorcycle over 500cc. Key facts
• 4,111 collisions in Greater London in 2008 resulted in injury to 4,222 P2W users; these represented 18% of all collisions and 15% of all casualties.
• P2W user KSI casualties accounted for 21% of all KSI casualties in 2008.
• In terms of the casualty reduction targets for London, P2W KSI casualties fell by 21% between the 1994-98 average and 2008; all P2W casualties fell by 30%.
• In 2008 90% of P2W casualties were male.
• Just over one third (35%) of P2W user casualties of known age in 2008 were aged between 25 and 34 years.
• P2W casualties averaged 12 a day in Greater London during 2008
London Road Safety Unit 1
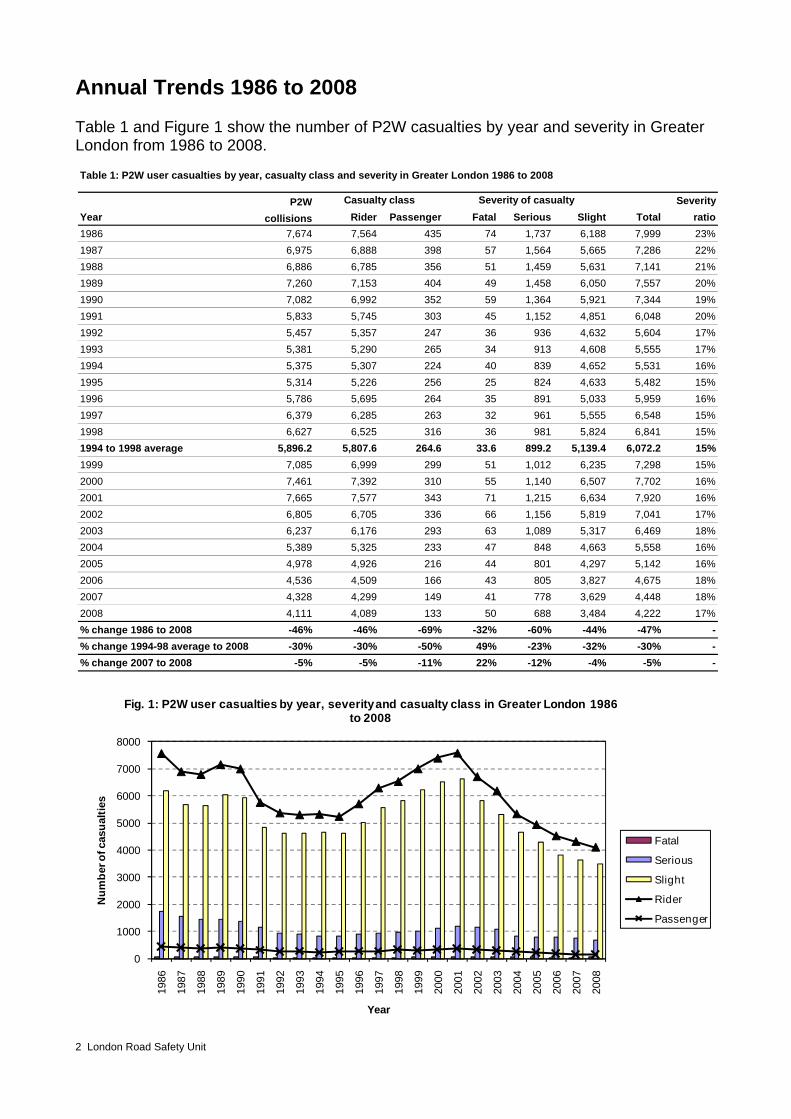
Annual Trends 1986 to 2008 Table 1 and Figure 1 show the number of P2W casualties by year and severity in Greater London from 1986 to 2008.
2 London Road Safety Unit
Table 1: P2W user casualties by year, casualty class and severity in Greater London 1986 to 2008
P2W SeverityYear collisions Rider Passenger Fatal Serious Slight Total ratio1986 7,674 7,564 435 74 1,737 6,188 7,999 23%1987 6,975 6,888 398 57 1,564 5,665 7,286 22%1988 6,886 6,785 356 51 1,459 5,631 7,141 21%1989 7,260 7,153 404 49 1,458 6,050 7,557 20%1990 7,082 6,992 352 59 1,364 5,921 7,344 19%1991 5,833 5,745 303 45 1,152 4,851 6,048 20%1992 5,457 5,357 247 36 936 4,632 5,604 17%1993 5,381 5,290 265 34 913 4,608 5,555 17%1994 5,375 5,307 224 40 839 4,652 5,531 16%1995 5,314 5,226 256 25 824 4,633 5,482 15%1996 5,786 5,695 264 35 891 5,033 5,959 16%1997 6,379 6,285 263 32 961 5,555 6,548 15%1998 6,627 6,525 316 36 981 5,824 6,841 15%1994 to 1998 average 5,896.2 5,807.6 264.6 33.6 899.2 5,139.4 6,072.2 15%1999 7,085 6,999 299 51 1,012 6,235 7,298 15%2000 7,461 7,392 310 55 1,140 6,507 7,702 16%2001 7,665 7,577 343 71 1,215 6,634 7,920 16%2002 6,805 6,705 336 66 1,156 5,819 7,041 17%2003 6,237 6,176 293 63 1,089 5,317 6,469 18%2004 5,389 5,325 233 47 848 4,663 5,558 16%2005 4,978 4,926 216 44 801 4,297 5,142 16%2006 4,536 4,509 166 43 805 3,827 4,675 18%2007 4,328 4,299 149 41 778 3,629 4,448 18%2008 4,111 4,089 133 50 688 3,484 4,222 17%% change 1986 to 2008 -46% -46% -69% -32% -60% -44% -47% -% change 1994-98 average to 2008 -30% -30% -50% 49% -23% -32% -30% -% change 2007 to 2008 -5% -5% -11% 22% -12% -4% -5% -
Casualty class Severity of casualty
0
1000
2000
3000
4000
5000
6000
7000
8000
1986
1987
1988
1989
1990
1991
1992
1993
1994
1995
1996
1997
1998
1999
2000
2001
2002
2003
2004
2005
2006
2007
2008
Num
ber o
f cas
ualti
es
Year
Fig. 1: P2W user casualties by year, severity and casualty class in Greater London 1986 to 2008
Fatal
Serious
Slight
Rider
Passenger
P2W user casualties showed a downward trend for 10 years from a high of 7,999 in 1986 to a low of 5,482 in 1995. This trend reversed from 1996 when casualty numbers rose year on year to a second high of 7,920 in 2001. Since this time casualty numbers have again been falling steadily to an all time low of 4,222 in 2008. This represents a reduction of 47% from 1986 to 2008. Fatal and serious injuries fell by 32% and 60% respectively between 1986 and 2008, while slight casualties fell by 44%. Overall, collisions involving injury to P2W users fell by 46% during this period. Comparing 2008 with the 1994-98 average (the period against which progress towards the current casualty reduction targets are measured); all P2W user casualties fell by 30%, serious injuries by 23% and slight by 32%. P2W fatalities however rose by 49%. P2W KSI casualties fell by 21% overall. Comparing 2008 with 2007, P2W casualties fell by 5% with serious and slight injuries falling by 12% and 4% respectively. P2W fatalities rose by 22%, from 41 in 2007 to 50 in 2008, while KSIs overall fell by 10%. Year on year fluctuations in fatalities are not uncommon and numbers have varied from a high of 74 in 1986 to a low of 25 in 1995, averaging 48 per year between 1986 and 2008. The severity ratio (the percentage of fatal and serious injuries to all injuries) reduced quite steadily between 1986 and 1999 from 23% to 15%. It rose again to 18% in 2007 and fell to 17% in 2008. Casualty class In terms of casualty class, P2W passenger casualties have shown the biggest reduction during this period, decreasing by 69% between 1986 and 2008, while P2W rider casualties fell by 46%. Passenger casualties fell by 50% between the 1994-98 average and 2008, while rider casualties fell by 30%. Comparing 2008 with 2007, passenger casualties fell by 11% and riders by 5%. The proportion of P2W rider to passenger casualties has remained fairly constant throughout this period, averaging 96% riders to 4% passengers. Casualty gender Figure 2 shows P2W user casualties by gender in Greater London 1986 to 2008.
0
1000
2000
3000
4000
5000
6000
7000
8000
1986
1987
1988
1989
1990
1991
1992
1993
1994
1995
1996
1997
1998
1999
2000
2001
2002
2003
2004
2005
2006
2007
2008
Num
ber o
f cas
ualti
es
Year
Fig. 2: P2W user casualties by gender in Greater London 1986 to 2008
Male
Female
London Road Safety Unit 3
By far the greatest proportion of P2W user casualties were male, with an average of 90% per year over this period. The male/female split has remained fairly constant during this time. The number of P2W casualties of both genders reached a peak in 2001 and have been falling steadily since that time. Male and female P2W user casualties fell by 46% and 56% respectively between 1986 and 2008 and by 31% and 28% respectively between the 1994-98 average and 2008. Males fell by 5% and females by 8% between 2007 and 2008. On average over the 1986 to 2008 period, 96% of P2W user casualties were riders, of which 92% were male. Of the average of 4% P2W passenger casualties however, 58% were female. Casualty age Table 2 and Figure 3 show P2W user casualties by year and age (banded) in Greater London from 1986 to 2008.
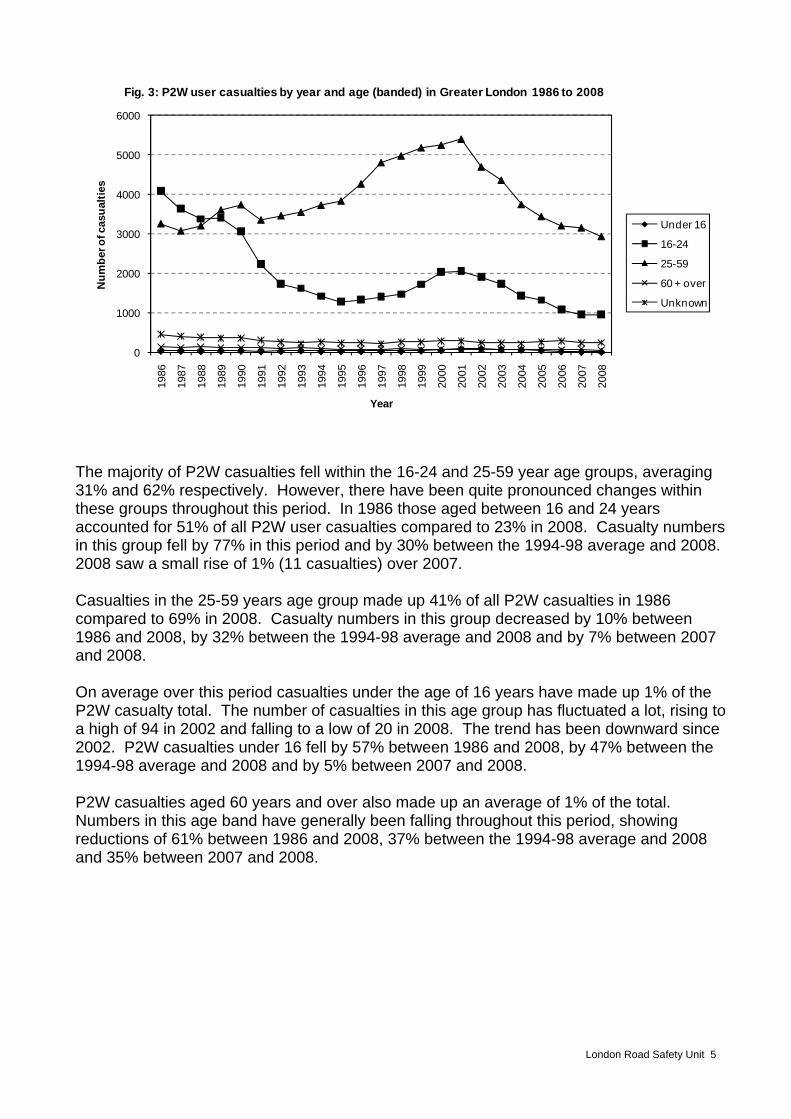
Table 2: P2W user casualties by year and age (banded) in Greater London 1986 to 2008
% aged % aged % aged % agedYear Under 16 16-24 25-59 60 + over Unknown Total <16 16-24 25-59 60+1986 46 4,092 3,257 141 463 7,999 0.6% 51.2% 40.7% 1.8%1987 43 3,639 3,075 125 404 7,286 0.6% 49.9% 42.2% 1.7%1988 37 3,376 3,205 143 380 7,141 0.5% 47.3% 44.9% 2.0%1989 45 3,410 3,608 121 373 7,557 0.6% 45.1% 47.7% 1.6%1990 46 3,063 3,738 123 374 7,344 0.6% 41.7% 50.9% 1.7%1991 31 2,232 3,352 124 309 6,048 0.5% 36.9% 55.4% 2.1%1992 40 1,729 3,461 98 276 5,604 0.7% 30.9% 61.8% 1.7%1993 52 1,613 3,549 111 230 5,555 0.9% 29.0% 63.9% 2.0%1994 37 1,420 3,726 90 258 5,531 0.7% 25.7% 67.4% 1.6%1995 37 1,279 3,833 84 249 5,482 0.7% 23.3% 69.9% 1.5%1996 39 1,323 4,269 83 245 5,959 0.7% 22.2% 71.6% 1.4%1997 36 1,401 4,810 85 216 6,548 0.5% 21.4% 73.5% 1.3%1998 39 1,470 4,980 94 258 6,841 0.6% 21.5% 72.8% 1.4%1994 to 1998 average 37.6 1,379 4,323.6 87.2 245.2 6,072.2 0.6% 22.7% 71.2% 1.4%1999 50 1,720 5,187 79 262 7,298 0.7% 23.6% 71.1% 1.1%2000 57 2,025 5,253 81 286 7,702 0.7% 26.3% 68.2% 1.1%2001 89 2,055 5,406 74 296 7,920 1.1% 25.9% 68.3% 0.9%2002 94 1,912 4,700 79 256 7,041 1.3% 27.2% 66.8% 1.1%2003 77 1,725 4,362 73 232 6,469 1.2% 26.7% 67.4% 1.1%2004 72 1,431 3,745 79 231 5,558 1.3% 25.7% 67.4% 1.4%2005 56 1,320 3,439 69 258 5,142 1.1% 25.7% 66.9% 1.3%2006 32 1,076 3,205 74 288 4,675 0.7% 23.0% 68.6% 1.6%2007 21 948 3,152 84 243 4,448 0.5% 21.3% 70.9% 1.9%2008 20 959 2,932 55 256 4,222 0.5% 22.7% 69.4% 1.3%% change 1986 to 2008 -57% -77% -10% -61% -45% -47% - - - -% change 1994-98 average to 2008 -47% -30% -32% -37% 4% -30% - - - -% change 2007 to 2008 -5% 1% -7% -35% 5% -5% - - - -
Casualty age banded
4 London Road Safety Unit
0
1000
2000
3000
4000
5000
6000
1986
1987
1988
1989
1990
1991
1992
1993
1994
1995
1996
1997
1998
1999
2000
2001
2002
2003
2004
2005
2006
2007
2008
Num
ber o
f cas
ualti
es
Year
Fig. 3: P2W user casualties by year and age (banded) in Greater London 1986 to 2008
Under 16
16-24
25-59
60 + over
Unknown
The majority of P2W casualties fell within the 16-24 and 25-59 year age groups, averaging 31% and 62% respectively. However, there have been quite pronounced changes within these groups throughout this period. In 1986 those aged between 16 and 24 years accounted for 51% of all P2W user casualties compared to 23% in 2008. Casualty numbers in this group fell by 77% in this period and by 30% between the 1994-98 average and 2008. 2008 saw a small rise of 1% (11 casualties) over 2007. Casualties in the 25-59 years age group made up 41% of all P2W casualties in 1986 compared to 69% in 2008. Casualty numbers in this group decreased by 10% between 1986 and 2008, by 32% between the 1994-98 average and 2008 and by 7% between 2007 and 2008. On average over this period casualties under the age of 16 years have made up 1% of the P2W casualty total. The number of casualties in this age group has fluctuated a lot, rising to a high of 94 in 2002 and falling to a low of 20 in 2008. The trend has been downward since 2002. P2W casualties under 16 fell by 57% between 1986 and 2008, by 47% between the 1994-98 average and 2008 and by 5% between 2007 and 2008. P2W casualties aged 60 years and over also made up an average of 1% of the total. Numbers in this age band have generally been falling throughout this period, showing reductions of 61% between 1986 and 2008, 37% between the 1994-98 average and 2008 and 35% between 2007 and 2008.
London Road Safety Unit 5
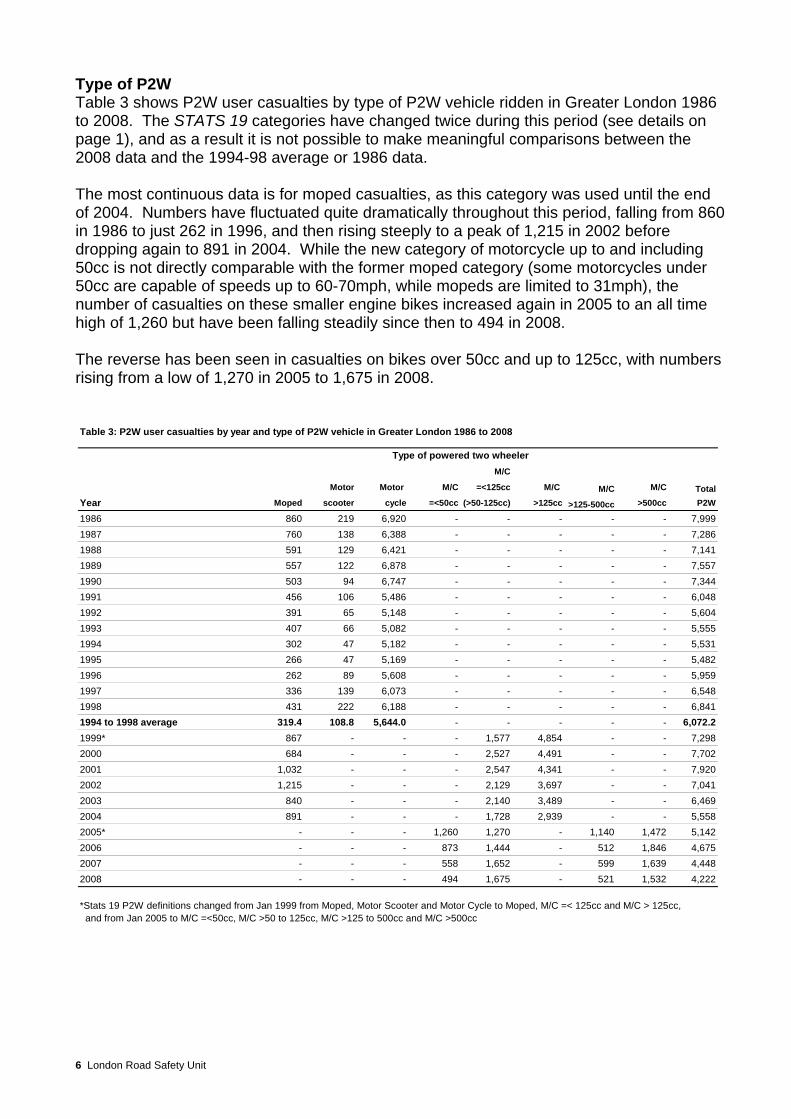
Type of P2W Table 3 shows P2W user casualties by type of P2W vehicle ridden in Greater London 1986 to 2008. The STATS 19 categories have changed twice during this period (see details on page 1), and as a result it is not possible to make meaningful comparisons between the 2008 data and the 1994-98 average or 1986 data. The most continuous data is for moped casualties, as this category was used until the end of 2004. Numbers have fluctuated quite dramatically throughout this period, falling from 860 in 1986 to just 262 in 1996, and then rising steeply to a peak of 1,215 in 2002 before dropping again to 891 in 2004. While the new category of motorcycle up to and including 50cc is not directly comparable with the former moped category (some motorcycles under 50cc are capable of speeds up to 60-70mph, while mopeds are limited to 31mph), the number of casualties on these smaller engine bikes increased again in 2005 to an all time high of 1,260 but have been falling steadily since then to 494 in 2008. The reverse has been seen in casualties on bikes over 50cc and up to 125cc, with numbers rising from a low of 1,270 in 2005 to 1,675 in 2008.
Table 3: P2W user casualties by year and type of P2W vehicle in Greater London 1986 to 2008
M/C
Motor Motor M/C =<125cc M/C M/C M/C TotalYear Moped scooter cycle =<50cc (>50-125cc) >125cc >125-500cc >500cc P2W
1986 860 219 6,920 - - - - - 7,9991987 760 138 6,388 - - - - - 7,2861988 591 129 6,421 - - - - - 7,1411989 557 122 6,878 - - - - - 7,5571990 503 94 6,747 - - - - - 7,3441991 456 106 5,486 - - - - - 6,0481992 391 65 5,148 - - - - - 5,6041993 407 66 5,082 - - - - - 5,5551994 302 47 5,182 - - - - - 5,5311995 266 47 5,169 - - - - - 5,4821996 262 89 5,608 - - - - - 5,9591997 336 139 6,073 - - - - - 6,5481998 431 222 6,188 - - - - - 6,8411994 to 1998 average 319.4 108.8 5,644.0 - - - - - 6,072.21999* 867 - - - 1,577 4,854 - - 7,2982000 684 - - - 2,527 4,491 - - 7,7022001 1,032 - - - 2,547 4,341 - - 7,9202002 1,215 - - - 2,129 3,697 - - 7,0412003 840 - - - 2,140 3,489 - - 6,4692004 891 - - - 1,728 2,939 - - 5,5582005* - - - 1,260 1,270 - 1,140 1,472 5,1422006 - - - 873 1,444 - 512 1,846 4,6752007 - - - 558 1,652 - 599 1,639 4,4482008 - - - 494 1,675 - 521 1,532 4,222
*Stats 19 P2W definitions changed from Jan 1999 from Moped, Motor Scooter and Motor Cycle to Moped, M/C =< 125cc and M/C > 125cc, and from Jan 2005 to M/C =<50cc, M/C >50 to 125cc, M/C >125 to 500cc and M/C >500cc
Type of powered two wheeler
6 London Road Safety Unit
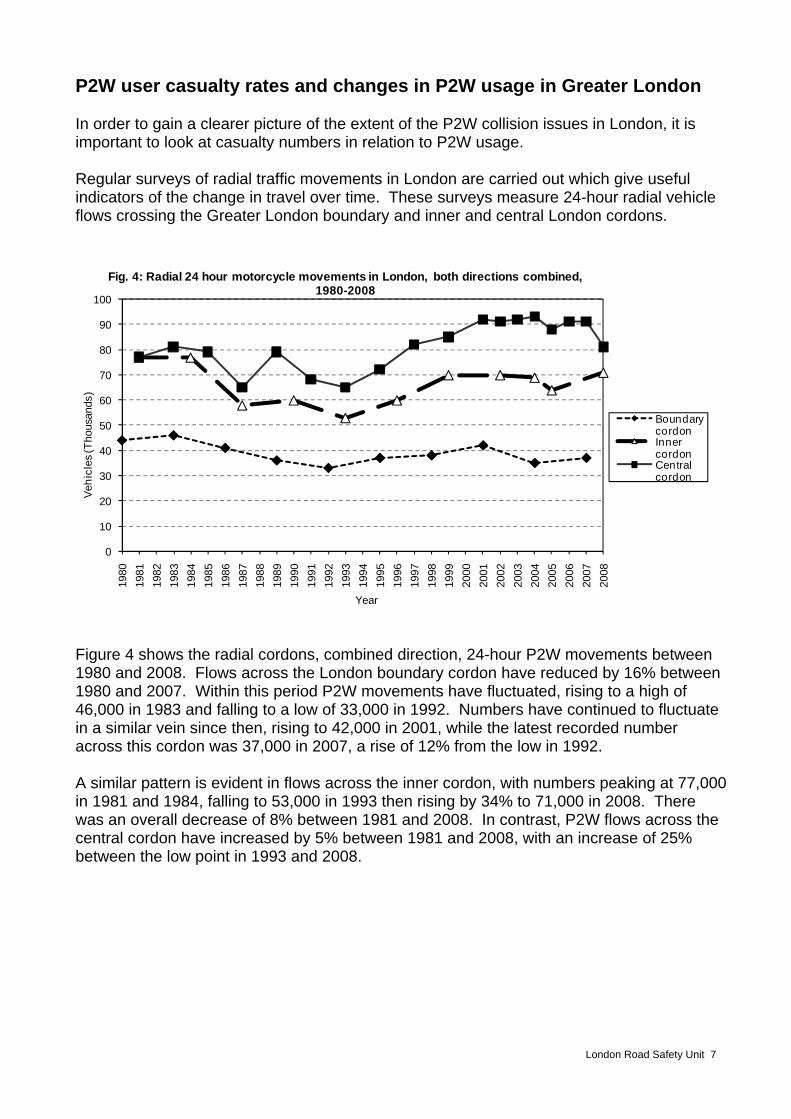
P2W user casualty rates and changes in P2W usage in Greater London In order to gain a clearer picture of the extent of the P2W collision issues in London, it is important to look at casualty numbers in relation to P2W usage. Regular surveys of radial traffic movements in London are carried out which give useful indicators of the change in travel over time. These surveys measure 24-hour radial vehicle flows crossing the Greater London boundary and inner and central London cordons.
0
10
20
30
40
50
60
70
80
90
100
1980
1981
1982
1983
1984
1985
1986
1987
1988
1989
1990
1991
1992
1993
1994
1995
1996
1997
1998
1999
2000
2001
2002
2003
2004
2005
2006
2007
2008
Vehi
cles
(Tho
usan
ds)
Year
Fig. 4: Radial 24 hour motorcycle movements in London, both directions combined, 1980-2008
Boundary cordonInner cordonCentral cordon
Figure 4 shows the radial cordons, combined direction, 24-hour P2W movements between 1980 and 2008. Flows across the London boundary cordon have reduced by 16% between 1980 and 2007. Within this period P2W movements have fluctuated, rising to a high of 46,000 in 1983 and falling to a low of 33,000 in 1992. Numbers have continued to fluctuate in a similar vein since then, rising to 42,000 in 2001, while the latest recorded number across this cordon was 37,000 in 2007, a rise of 12% from the low in 1992. A similar pattern is evident in flows across the inner cordon, with numbers peaking at 77,000 in 1981 and 1984, falling to 53,000 in 1993 then rising by 34% to 71,000 in 2008. There was an overall decrease of 8% between 1981 and 2008. In contrast, P2W flows across the central cordon have increased by 5% between 1981 and 2008, with an increase of 25% between the low point in 1993 and 2008.
London Road Safety Unit 7
8 London Road Safety Unit
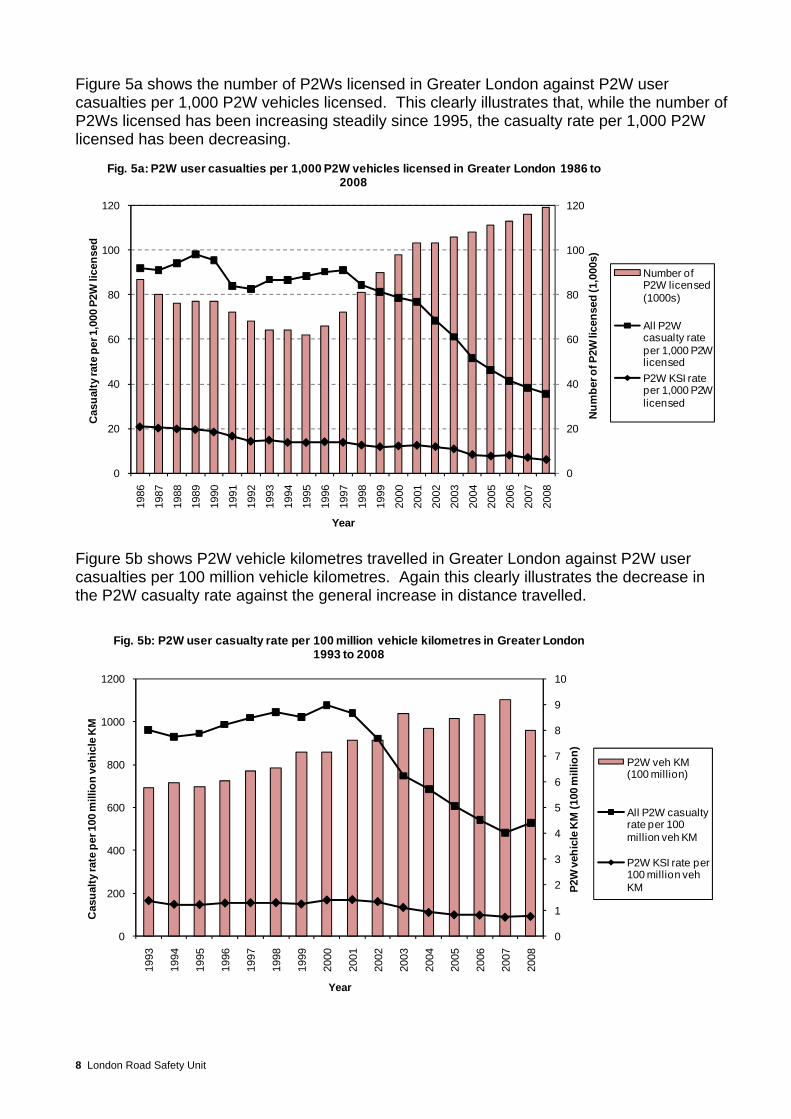
Figure 5a shows the number of P2Ws licensed in Greater London against P2W user casualties per 1,000 P2W vehicles licensed. This clearly illustrates that, while the number of P2Ws licensed has been increasing steadily since 1995, the casualty rate per 1,000 P2W licensed has been decreasing.
0
20
40
60
80
100
120
0
20
40
60
80
100
120
1986
1987
1988
1989
1990
1991
1992
1993
1994
1995
1996
1997
1998
1999
2000
2001
2002
2003
2004
2005
2006
2007
2008
Num
ber o
f P2W
lice
nsed
(1,0
00s)
Cas
ualty
rate
per
1,0
00 P
2W li
cens
ed
Year
Fig. 5a: P2W user casualties per 1,000 P2W vehicles licensed in Greater London 1986 to 2008
Number of P2W licensed (1000s)
All P2W casualty rate per 1,000 P2W licensedP2W KSI rate per 1,000 P2W licensed
Figure 5b shows P2W vehicle kilometres travelled in Greater London against P2W user casualties per 100 million vehicle kilometres. Again this clearly illustrates the decrease in the P2W casualty rate against the general increase in distance travelled.
0
1
2
3
4
5
6
7
8
9
10
0
200
400
600
800
1000
1200
1993
1994
1995
1996
1997
1998
1999
2000
2001
2002
2003
2004
2005
2006
2007
2008
P2W
veh
icle
KM
(100
mill
ion)
Cas
ualty
rate
per
100
mill
ion
vehi
cle
KM
Year
Fig. 5b: P2W user casualty rate per 100 million vehicle kilometres in Greater London 1993 to 2008
P2W veh KM (100 million)
All P2W casualty rate per 100 million veh KM
P2W KSI rate per 100 million veh KM
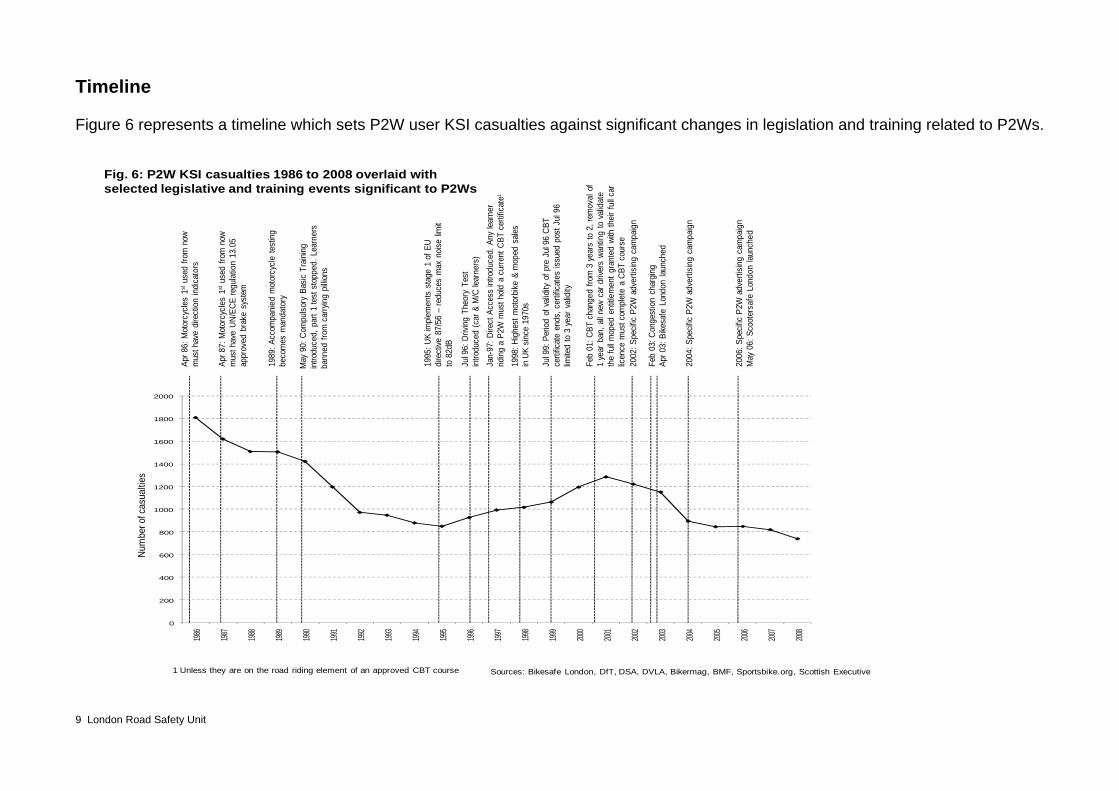
Timeline Figure 6 represents a timeline which sets P2W user KSI casualties against significant changes in legislation and training related to P2Ws.
0
200
400
600
800
1000
1200
1400
1600
1800
2000
1986
1987
1988
1989
1990
1991
1992
1993
1994
1995
1996
1997
1998
1999
2000
2001
2002
2003
2004
2005
2006
2007
2008
Apr 8
6: M
otor
cycl
es 1
stus
ed fr
om n
ow
mus
t hav
e di
rect
ion
indi
cato
rs
Apr 8
7: M
otor
cycl
es 1
stus
ed fr
om n
ow
mus
t hav
e UN
/ECE
regu
latio
n 13
.05
appr
oved
bra
ke s
yste
m
1989
: Acc
ompa
nied
mot
orcy
cle
test
ing
beco
mes
man
dato
ry
May
90:
Com
puls
ory
Basic
Tra
inin
g in
trodu
ced,
par
t 1 te
st s
topp
ed. L
earn
ers
bann
ed fr
om c
arry
ing
pillio
ns
1995
: UK
impl
emen
ts s
tage
1 o
f EU
dire
ctive
87/
56 –
redu
ces
max
nois
e lim
it to
82d
B
Jul 9
6: D
rivin
g Th
eory
Tes
t in
trodu
ced
(car
& M
/C le
arne
rs)
Jan-
97: D
irect
Acc
ess
intro
duce
d. A
ny le
arne
r rid
ing
a P2
W m
ust h
old a
cur
rent
CBT
cer
tifica
te1
1998
: Hig
hest
mot
orbi
ke &
mop
ed s
ales
in U
K sin
ce 1
970s
Jul 9
9: P
erio
d of
vali
dity
of p
re J
ul 9
6 CB
T ce
rtific
ate
ends
, cer
tifica
tes
issue
d po
st J
ul 9
6 lim
ited
to 3
yea
r vali
dity
Feb
01: C
BT c
hang
ed fr
om 3
yea
rs to
2, r
emov
al o
f 1
year
ban
, all
new
car d
river
s wa
ntin
g to
vali
date
th
e fu
ll mop
ed e
ntitle
men
t gra
nted
with
their
full
car
licen
ce m
ust c
ompl
ete
a CB
T co
urse
2002
: Spe
cific
P2W
adv
ertis
ing
cam
paig
n
Feb
03: C
onge
stio
n ch
argi
ngAp
r 03:
Bike
safe
Lond
on la
unch
ed
2004
: Spe
cific
P2W
adv
ertis
ing
cam
paig
n
2006
: Spe
cific
P2W
adv
ertis
ing
cam
paig
nM
ay 0
6: S
coot
ersa
feLo
ndon
laun
ched
Fig. 6: P2W KSI casualties 1986 to 2008 overlaid with selected legislative and training events significant to P2Ws
1 Unless they are on the road riding element of an approved CBT course
Num
ber o
f cas
ualti
es
Sources: Bikesafe London, DfT, DSA, DVLA, Bikermag, BMF, Sportsbike.org, Scottish Executive
9 London Road Safety Unit
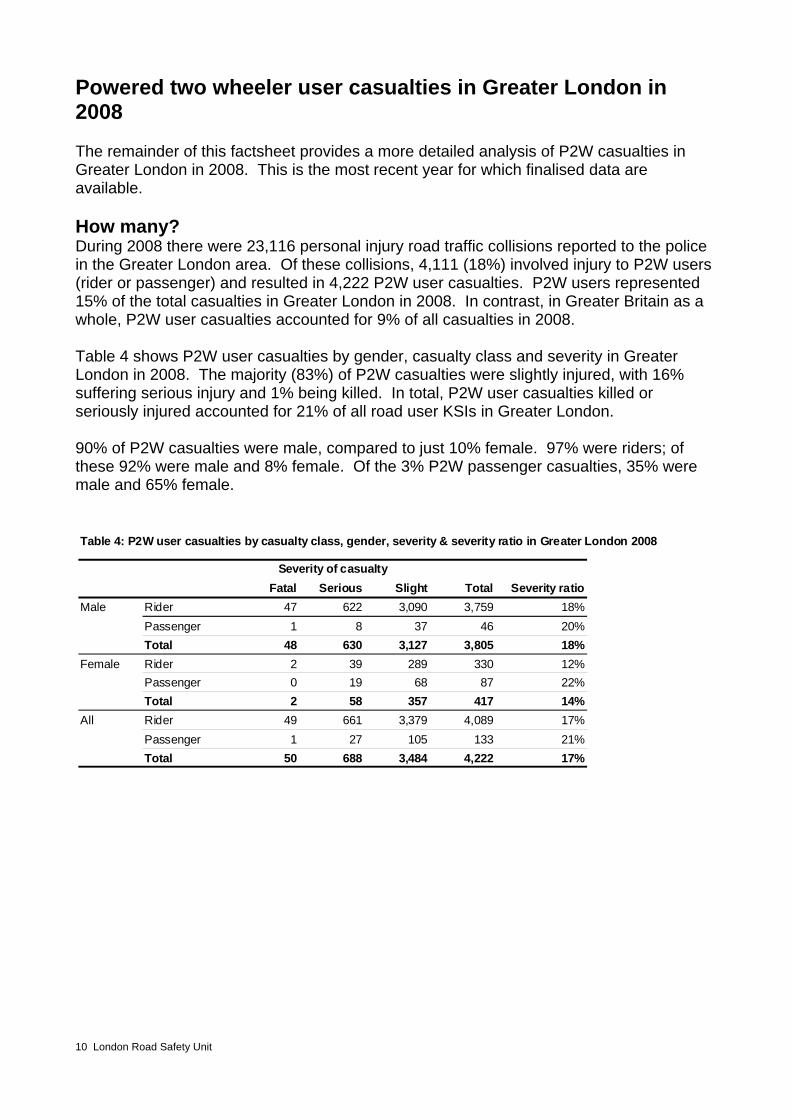
Powered two wheeler user casualties in Greater London in 2008 The remainder of this factsheet provides a more detailed analysis of P2W casualties in Greater London in 2008. This is the most recent year for which finalised data are available. How many? During 2008 there were 23,116 personal injury road traffic collisions reported to the police in the Greater London area. Of these collisions, 4,111 (18%) involved injury to P2W users (rider or passenger) and resulted in 4,222 P2W user casualties. P2W users represented 15% of the total casualties in Greater London in 2008. In contrast, in Greater Britain as a whole, P2W user casualties accounted for 9% of all casualties in 2008. Table 4 shows P2W user casualties by gender, casualty class and severity in Greater London in 2008. The majority (83%) of P2W casualties were slightly injured, with 16% suffering serious injury and 1% being killed. In total, P2W user casualties killed or seriously injured accounted for 21% of all road user KSIs in Greater London. 90% of P2W casualties were male, compared to just 10% female. 97% were riders; of these 92% were male and 8% female. Of the 3% P2W passenger casualties, 35% were male and 65% female.
10 London Road Safety Unit
Table 4: P2W user casualties by casualty class, gender, severity & severity ratio in Greater London 2008
Fatal Serious Slight Total Severity ratioMale Rider 47 622 3,090 3,759 18%
Passenger 1 8 37 46 20%Total 48 630 3,127 3,805 18%
Female Rider 2 39 289 330 12%Passenger 0 19 68 87 22%Total 2 58 357 417 14%
All Rider 49 661 3,379 4,089 17%Passenger 1 27 105 133 21%Total 50 688 3,484 4,222 17%
Severity of casualty
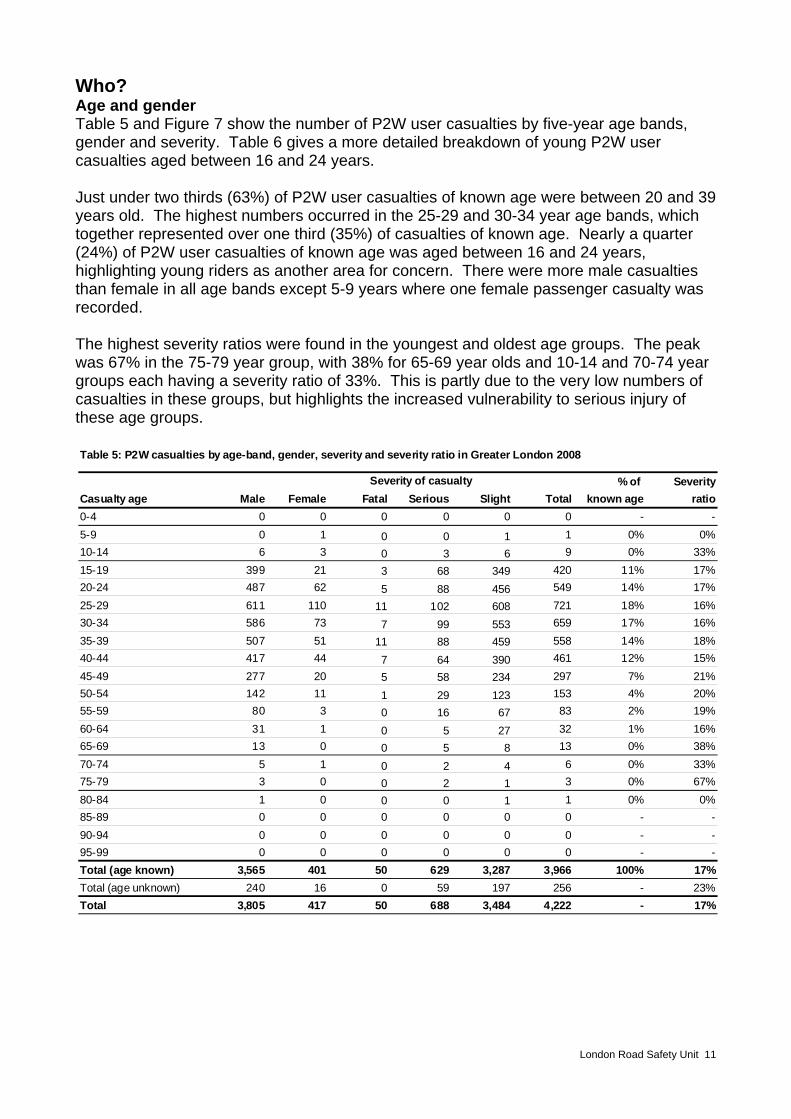
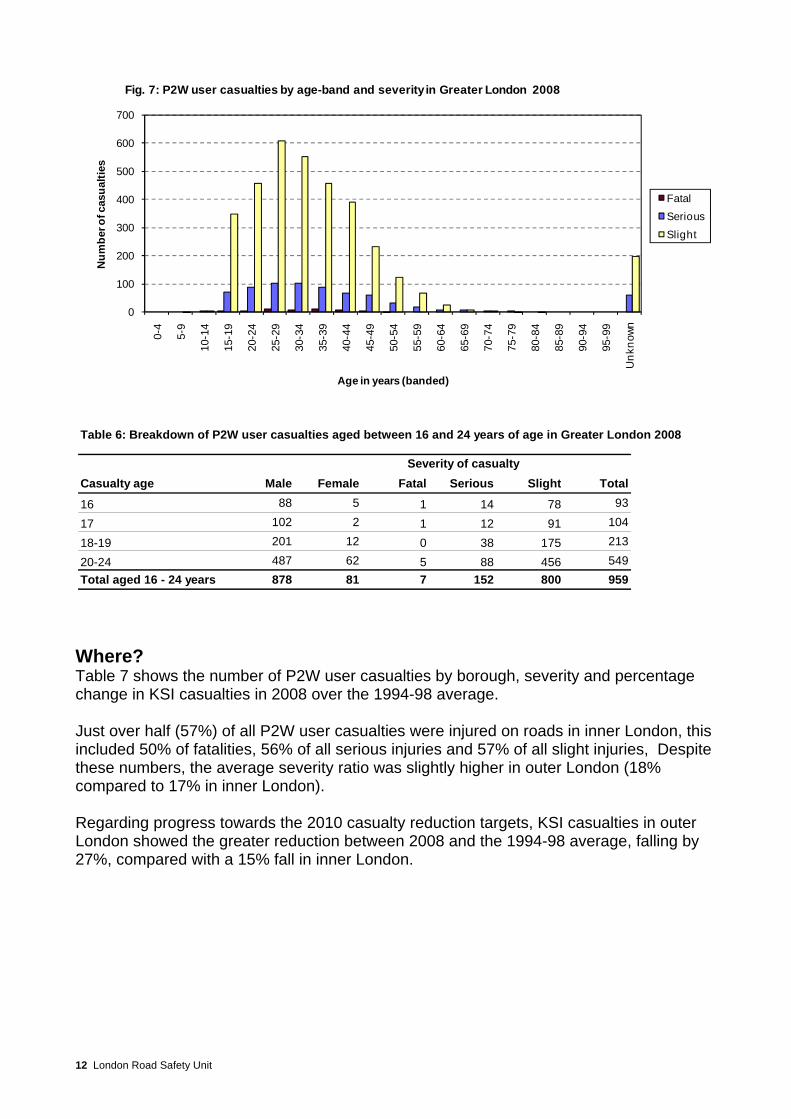
Who? Age and gender Table 5 and Figure 7 show the number of P2W user casualties by five-year age bands, gender and severity. Table 6 gives a more detailed breakdown of young P2W user casualties aged between 16 and 24 years. Just under two thirds (63%) of P2W user casualties of known age were between 20 and 39 years old. The highest numbers occurred in the 25-29 and 30-34 year age bands, which together represented over one third (35%) of casualties of known age. Nearly a quarter (24%) of P2W user casualties of known age was aged between 16 and 24 years, highlighting young riders as another area for concern. There were more male casualties than female in all age bands except 5-9 years where one female passenger casualty was recorded. The highest severity ratios were found in the youngest and oldest age groups. The peak was 67% in the 75-79 year group, with 38% for 65-69 year olds and 10-14 and 70-74 year groups each having a severity ratio of 33%. This is partly due to the very low numbers of casualties in these groups, but highlights the increased vulnerability to serious injury of these age groups. Table 5: P2W casualties by age-band, gender, severity and severity ratio in Greater London 2008
% of SeverityCasualty age Male Female Fatal Serious Slight Total known age ratio0-4 0 0 0 0 0 0 -5-9 0 1 0 0 1 1 0%10-14 6 3 0 3 6 9 0%15-19 399 21 3 68 349 420 11% 17%20-24 487 62 5 88 456 549 14% 17%25-29 611 110 11 102 608 721 18% 16%30-34 586 73 7 99 553 659 17% 16%35-39 507 51 11 88 459 558 14% 18%40-44 417 44 7 64 390 461 12% 15%45-49 277 20 5 58 234 297 7% 21%50-54 142 11 1 29 123 153 4% 20%55-59 80 3 0 16 67 83 2% 19%60-64 31 1 0 5 27 32 1% 16%65-69 13 0 0 5 8 13 0% 38%70-74 5 1 0 2 4 6 0%75-79 3 0 0 2 1 3 0%80-84 1 0 0 0 1 1 0%85-89 0 0 0 0 0 0 -90-94 0 0 0 0 0 0 -95-99 0 0 0 0 0 0 -Total (age known) 3,565 401 50 629 3,287 3,966 100% 17%Total (age unknown) 240 16 0 59 197 256 - 23%Total 3,805 417 50 688 3,484 4,222 - 17%
Severity of casualty
-0%
33%
33%67%0%
---
London Road Safety Unit 11
0
100
200
300
400
500
600
700
0-4
5-9
10-1
4
15-1
9
20-2
4
25-2
9
30-3
4
35-3
9
40-4
4
45-4
9
50-5
4
55-5
9
60-6
4
65-6
9
70-7
4
75-7
9
80-8
4
85-8
9
90-9
4
95-9
9
Unk
nown
Num
ber o
f cas
ualti
es
Age in years (banded)
Fig. 7: P2W user casualties by age-band and severity in Greater London 2008
FatalSerious
Slight
Table 6: Breakdown of P2W user casualties aged between 16 and 24 years of age in Greater London 2008
Casualty age Male Female Fatal Serious Slight Total
16 88 5 1 14 78 93
17 102 2 1 12 91 104
18-19 201 12 0 38 175 213
20-24 487 62 5 88 456 549Total aged 16 - 24 years 878 81 7 152 800 959
Severity of casualty
Where? Table 7 shows the number of P2W user casualties by borough, severity and percentage change in KSI casualties in 2008 over the 1994-98 average. Just over half (57%) of all P2W user casualties were injured on roads in inner London, this included 50% of fatalities, 56% of all serious injuries and 57% of all slight injuries, Despite these numbers, the average severity ratio was slightly higher in outer London (18% compared to 17% in inner London). Regarding progress towards the 2010 casualty reduction targets, KSI casualties in outer London showed the greater reduction between 2008 and the 1994-98 average, falling by 27%, compared with a 15% fall in inner London.
12 London Road Safety Unit
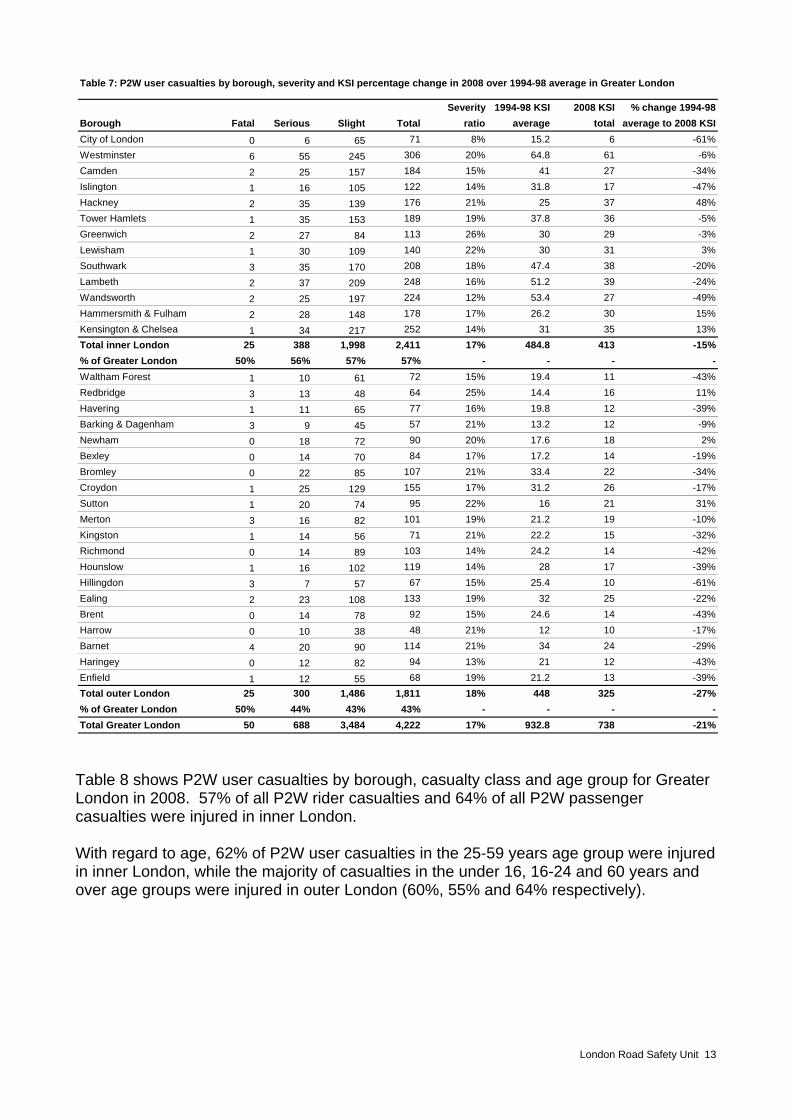
Table 7: P2W user casualties by borough, severity and KSI percentage change in 2008 over 1994-98 average in Greater London
Severity 1994-98 KSI 2008 KSI % change 1994-98Borough Fatal Serious Slight Total ratio average total average to 2008 KSICity of London 0 6 65 71 8% 15.2 6 -61%Westminster 6 55 245 306 20% 64.8 61 -6%Camden 2 25 157 184 15% 41 27 -34%Islington 1 16 105 122 14% 31.8 17 -47%Hackney 2 35 139 176 21% 25 37 48%Tower Hamlets 1 35 153 189 19% 37.8 36 -5%Greenwich 2 27 84 113 26% 30 29 -3%Lewisham 1 30 109 140 22% 30 31 3%Southwark 3 35 170 208 18% 47.4 38 -20%Lambeth 2 37 209 248 16% 51.2 39 -24%Wandsworth 2 25 197 224 12% 53.4 27 -49%Hammersmith & Fulham 2 28 148 178 17% 26.2 30 15%Kensington & Chelsea 1 34 217 252 14% 31 35 13%Total inner London 25 388 1,998 2,411 17% 484.8 413 -15%% of Greater London 50% 56% 57% 57% - - - -Waltham Forest 1 10 61 72 15% 19.4 11 -43%Redbridge 3 13 48 64 25% 14.4 16 11%Havering 1 11 65 77 16% 19.8 12 -39%Barking & Dagenham 3 9 45 57 21% 13.2 12 -9%Newham 0 18 72 90 20% 17.6 18 2%Bexley 0 14 70 84 17% 17.2 14 -19%Bromley 0 22 85 107 21% 33.4 22 -34%Croydon 1 25 129 155 17% 31.2 26 -17%Sutton 1 20 74 95 22% 16 21 31%Merton 3 16 82 101 19% 21.2 19 -10%Kingston 1 14 56 71 21% 22.2 15 -32%Richmond 0 14 89 103 14% 24.2 14 -42%Hounslow 1 16 102 119 14% 28 17 -39%Hillingdon 3 7 57 67 15% 25.4 10 -61%Ealing 2 23 108 133 19% 32 25 -22%Brent 0 14 78 92 15% 24.6 14 -43%Harrow 0 10 38 48 21% 12 10 -17%Barnet 4 20 90 114 21% 34 24 -29%Haringey 0 12 82 94 13% 21 12 -43%Enfield 1 12 55 68 19% 21.2 13 -39%Total outer London 25 300 1,486 1,811 18% 448 325 -27%% of Greater London 50% 44% 43% 43% - - - -Total Greater London 50 688 3,484 4,222 17% 932.8 738 -21%
Table 8 shows P2W user casualties by borough, casualty class and age group for Greater London in 2008. 57% of all P2W rider casualties and 64% of all P2W passenger casualties were injured in inner London. With regard to age, 62% of P2W user casualties in the 25-59 years age group were injured in inner London, while the majority of casualties in the under 16, 16-24 and 60 years and over age groups were injured in outer London (60%, 55% and 64% respectively).
London Road Safety Unit 13
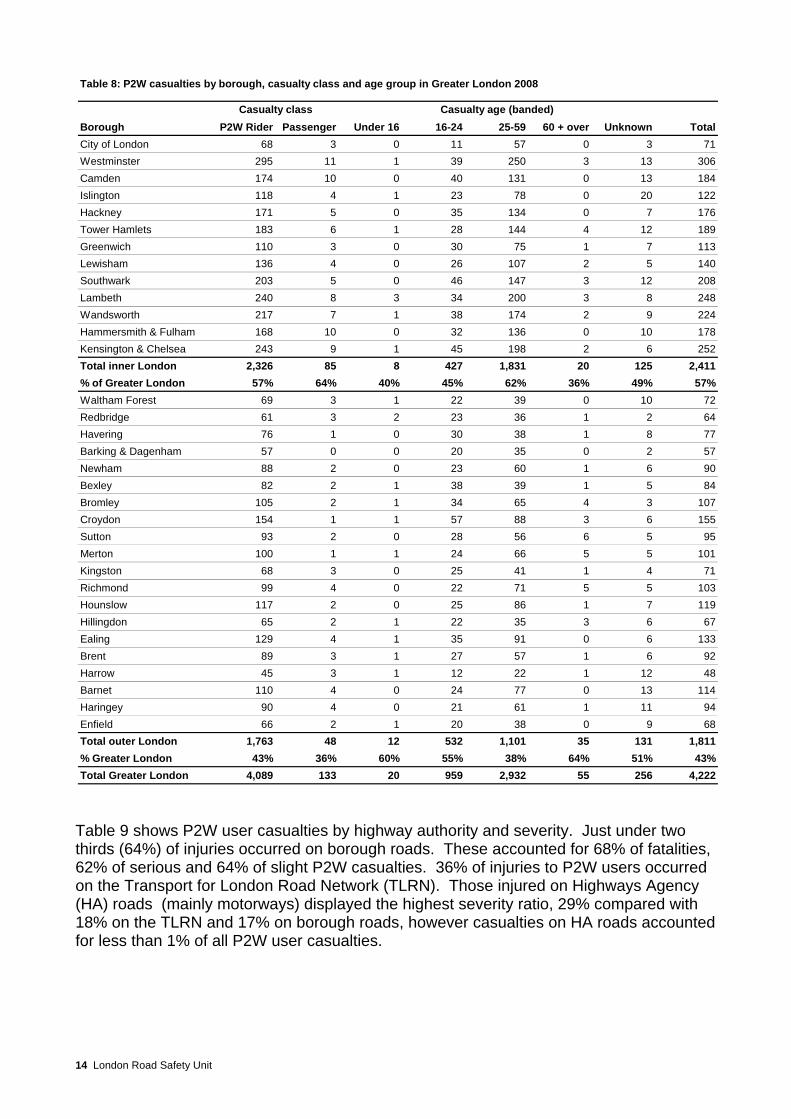
Table 8: P2W casualties by borough, casualty class and age group in Greater London 2008
Borough P2W Rider Passenger Under 16 16-24 25-59 60 + over Unknown TotalCity of London 68 3 0 11 57 0 3 71Westminster 295 11 1 39 250 3 13 306Camden 174 10 0 40 131 0 13 184Islington 118 4 1 23 78 0 20 122Hackney 171 5 0 35 134 0 7 176Tower Hamlets 183 6 1 28 144 4 12 189Greenwich 110 3 0 30 75 1 7 113Lewisham 136 4 0 26 107 2 5 140Southwark 203 5 0 46 147 3 12 208Lambeth 240 8 3 34 200 3 8 248Wandsworth 217 7 1 38 174 2 9 224Hammersmith & Fulham 168 10 0 32 136 0 10 178Kensington & Chelsea 243 9 1 45 198 2 6 252Total inner London 2,326 85 8 427 1,831 20 125 2,411% of Greater London 57% 64% 40% 45% 62% 36% 49% 57%Waltham Forest 69 3 1 22 39 0 10 72Redbridge 61 3 2 23 36 1 2 6Havering 76 1 0 30 38 1 8 77Barking & Dagenham 57 0 0 20 35 0 2 57Newham 88 2 0 23 60 1 6 90Bexley 82 2 1 38 39 1 5 84Bromley 105 2 1 34 65 4 3 107Croydon 154 1 1 57 88 3 6 155Sutton 93 2 0 28 56 6 5 9Merton 100 1 1 24 66 5 5Kingston 68 3 0 25 41 1 4 7Richmond 99 4 0 22 71 5 5 103Hounslow 117 2 0 25 86 1 7 119Hillingdon 65 2 1 22 35 3 6 67Ealing 129 4 1 35 91 0 6 133Brent 89 3 1 27 57 1 6 9Harrow 45 3 1 12 22 1 12 48Barnet 110 4 0 24 77 0 13Haringey 90 4 0 21 61 1 11 94Enfield 66 2 1 20 38 0 9 6Total outer London 1,763 48 12 532 1,101 35 131 1,811% Greater London 43% 36% 60% 55% 38% 64% 51% 43%Total Greater London 4,089 133 20 959 2,932 55 256 4,222
Casualty class Casualty age (banded)
4
5101
1
2
114
8
Table 9 shows P2W user casualties by highway authority and severity. Just under two thirds (64%) of injuries occurred on borough roads. These accounted for 68% of fatalities, 62% of serious and 64% of slight P2W casualties. 36% of injuries to P2W users occurred on the Transport for London Road Network (TLRN). Those injured on Highways Agency (HA) roads (mainly motorways) displayed the highest severity ratio, 29% compared with 18% on the TLRN and 17% on borough roads, however casualties on HA roads accounted for less than 1% of all P2W user casualties.
14 London Road Safety Unit
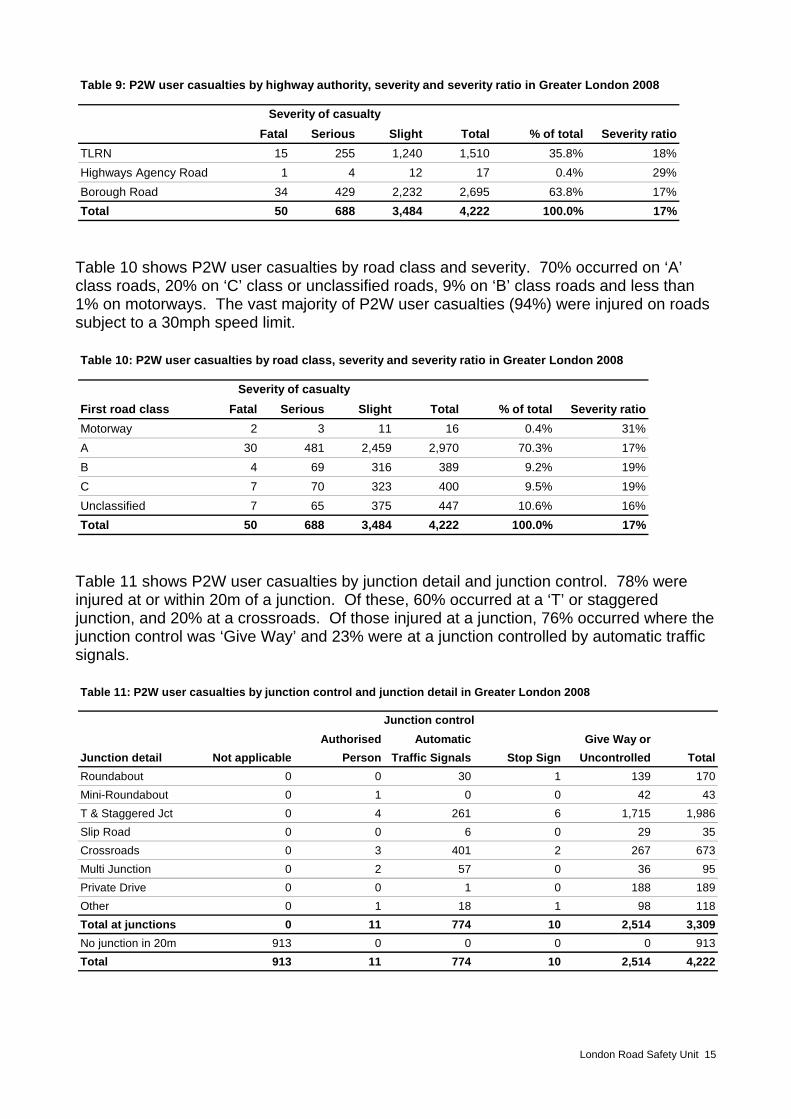
Table 9: P2W user casualties by highway authority, severity and severity ratio in Greater London 2008
Fatal Serious Slight Total % of total Severity ratioTLRN 15 255 1,240 1,510 35.8% 18%Highways Agency Road 1 4 12 17 0.4% 29%Borough Road 34 429 2,232 2,695 63.8% 17%Total 50 688 3,484 4,222 100.0% 17%
Severity of casualty
Table 10 shows P2W user casualties by road class and severity. 70% occurred on ‘A’ class roads, 20% on ‘C’ class or unclassified roads, 9% on ‘B’ class roads and less than 1% on motorways. The vast majority of P2W user casualties (94%) were injured on roads subject to a 30mph speed limit.
Table 10: P2W user casualties by road class, severity and severity ratio in Greater London 2008
First road class Fatal Serious Slight Total % of total Severity ratioMotorway 2 3 11 16 0.4% 31%A 30 481 2,459 2,970 70.3% 17%B 4 69 316 389 9.2% 19%C 7 70 323 400 9.5% 19%Unclassified 7 65 375 447 10.6% 16%Total 50 688 3,484 4,222 100.0% 17%
Severity of casualty
Table 11 shows P2W user casualties by junction detail and junction control. 78% were injured at or within 20m of a junction. Of these, 60% occurred at a ‘T’ or staggered junction, and 20% at a crossroads. Of those injured at a junction, 76% occurred where the junction control was ‘Give Way’ and 23% were at a junction controlled by automatic traffic signals.
Table 11: P2W user casualties by junction control and junction detail in Greater London 2008
Authorised Automatic Give Way orJunction detail Not applicable Person Traffic Signals Stop Sign Uncontrolled TotalRoundabout 0 0 30 1 139 170Mini-Roundabout 0 1 0 0 42 43T & Staggered Jct 0 4 261 6 1,715 1,986Slip Road 0 0 6 0 29 35Crossroads 0 3 401 2 267 673Multi Junction 0 2 57 0 36 95Private Drive 0 0 1 0 188 189Other 0 1 18 1 98 118Total at junctions 0 11 774 10 2,514 3,309No junction in 20m 913 0 0 0 0 913Total 913 11 774 10 2,514 4,222
Junction control
London Road Safety Unit 15
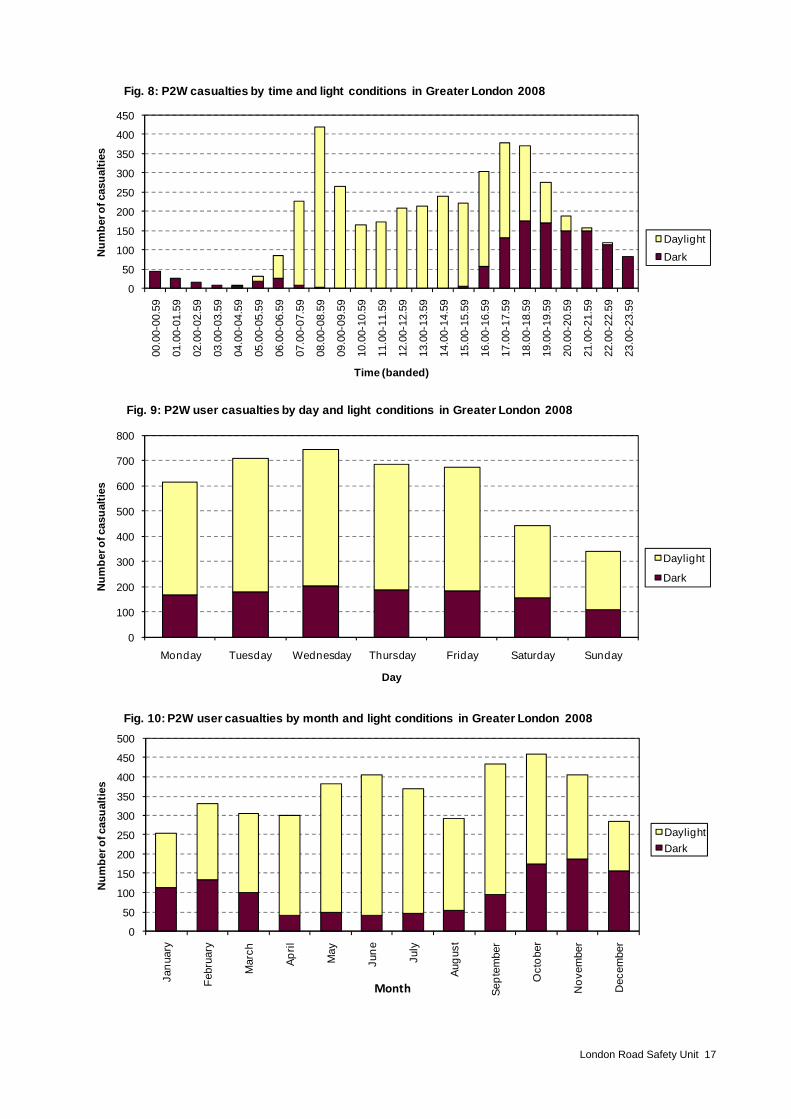
Road surface/weather The majority of P2W user casualties were injured on a dry road surface (76%) and in fine weather conditions (82%). 13% of all P2W user casualties and 22% of P2W KSIs were injured in a collision where their vehicle skidded. 20% of those injured on a wet road surface and 36% of those on a surface with snow, frost or ice involved the P2W skidding. When? Figures 8, 9 and 10 show the number of P2W user casualties by time of day, day of week and month in Greater London in 2008. They also indicate the proportions occurring in the light or during the hours of darkness. Time of day Three quarters (75%) of P2W user casualties were injured between 7am and 7pm. Within this 12 hour period there were two clear peaks, with 22% occurring between 7am and 10am and 25% between 4pm and 7pm. The single highest hour was between 8am and 9am with 10% of casualties. 72% of P2W user casualties were injured during daylight hours. Day of week 81% of P2W user casualties were injured on a week day, an average of 16% per day, with 11% on a Saturday and 8% on a Sunday. However, the highest proportion of P2W user casualties injured in the dark occurred at the weekend with 35% on Saturdays and 32% on Sundays. Month of year The highest number of P2W user casualties (11%) were recorded in October and the lowest number (6%) in January. 31% of casualties were injured in the autumn period (September to November), with 21% in the winter (December to February), 23% in the spring (March to May) and 25% in the summer (June to August). 40% or more of casualties in January, February, November and December occurred in the dark, peaking in December when over half (55%) were injured during the hours of darkness.
16 London Road Safety Unit
0
50
100
150
200
250
300
350
400
450
00.0
0-00
.59
01.0
0-01
.59
02.0
0-02
.59
03.0
0-03
.59
04.0
0-04
.59
05.0
0-05
.59
06.0
0-06
.59
07.0
0-07
.59
08.0
0-08
.59
09.0
0-09
.59
10.0
0-10
.59
11.0
0-11
.59
12.0
0-12
.59
13.0
0-13
.59
14.0
0-14
.59
15.0
0-15
.59
16.0
0-16
.59
17.0
0-17
.59
18.0
0-18
.59
19.0
0-19
.59
20.0
0-20
.59
21.0
0-21
.59
22.0
0-22
.59
23.0
0-23
.59
Num
ber o
f cas
ualti
es
Time (banded)
Fig. 8: P2W casualties by time and light conditions in Greater London 2008
DaylightDark
0
100
200
300
400
500
600
700
800
Monday Tuesday Wednesday Thursday Friday Saturday Sunday
Num
ber o
f cas
ualti
es
Day
Fig. 9: P2W user casualties by day and light conditions in Greater London 2008
Daylight
Dark
0
50
100
150
200
250
300
350
400
450
500
Janu
ary
Febr
uary
Mar
ch
April
May
June
July
Augu
st
Sept
embe
r
Oct
ober
Nov
embe
r
Dec
embe
r
Num
ber o
f cas
ualti
es
Month
Fig. 10: P2W user casualties by month and light conditions in Greater London 2008
DaylightDark
London Road Safety Unit 17
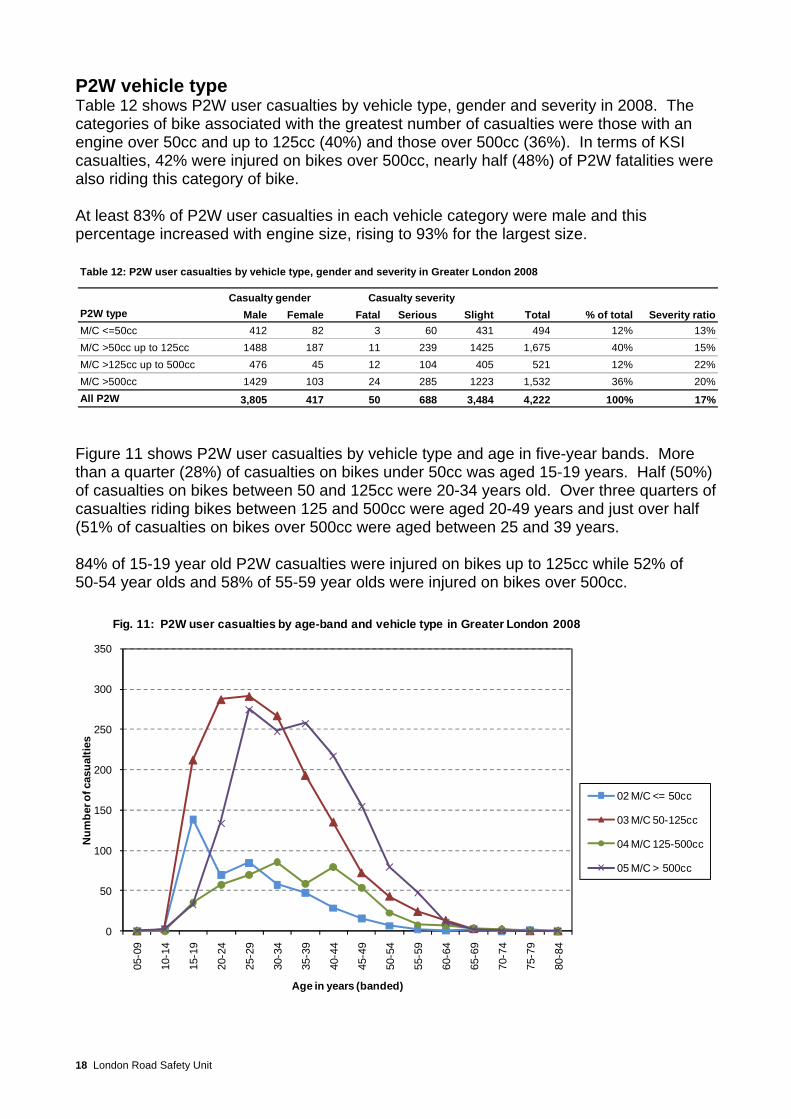
P2W vehicle type Table 12 shows P2W user casualties by vehicle type, gender and severity in 2008. The categories of bike associated with the greatest number of casualties were those with an engine over 50cc and up to 125cc (40%) and those over 500cc (36%). In terms of KSI casualties, 42% were injured on bikes over 500cc, nearly half (48%) of P2W fatalities were also riding this category of bike. At least 83% of P2W user casualties in each vehicle category were male and this percentage increased with engine size, rising to 93% for the largest size.
Table 12: P2W user casualties by vehicle type, gender and severity in Greater London 2008
P2W type Male Female Fatal Serious Slight Total % of total Severity ratioM/C <=50cc 412 82 3 60 431 494 12% 13%M/C >50cc up to 125cc 1488 187 11 239 1425 1,675 40% 15%M/C >125cc up to 500cc 476 45 12 104 405 521 12% 22%M/C >500cc 1429 103 24 285 1223 1,532 36% 20%All P2W 3,805 417 50 688 3,484 4,222 100% 17%
Casualty gender Casualty severity
Figure 11 shows P2W user casualties by vehicle type and age in five-year bands. More than a quarter (28%) of casualties on bikes under 50cc was aged 15-19 years. Half (50%) of casualties on bikes between 50 and 125cc were 20-34 years old. Over three quarters of casualties riding bikes between 125 and 500cc were aged 20-49 years and just over half (51% of casualties on bikes over 500cc were aged between 25 and 39 years. 84% of 15-19 year old P2W casualties were injured on bikes up to 125cc while 52% of 50-54 year olds and 58% of 55-59 year olds were injured on bikes over 500cc.
0
50
100
150
200
250
300
350
05-0
9
10-1
4
15-1
9
20-2
4
25-2
9
30-3
4
35-3
9
40-4
4
45-4
9
50-5
4
55-5
9
60-6
4
65-6
9
70-7
4
75-7
9
80-8
4
Num
ber o
f cas
ualti
es
Age in years (banded)
Fig. 11: P2W user casualties by age-band and vehicle type in Greater London 2008
02 M/C <= 50cc
03 M/C 50-125cc
04 M/C 125-500cc
05 M/C > 500cc
18 London Road Safety Unit
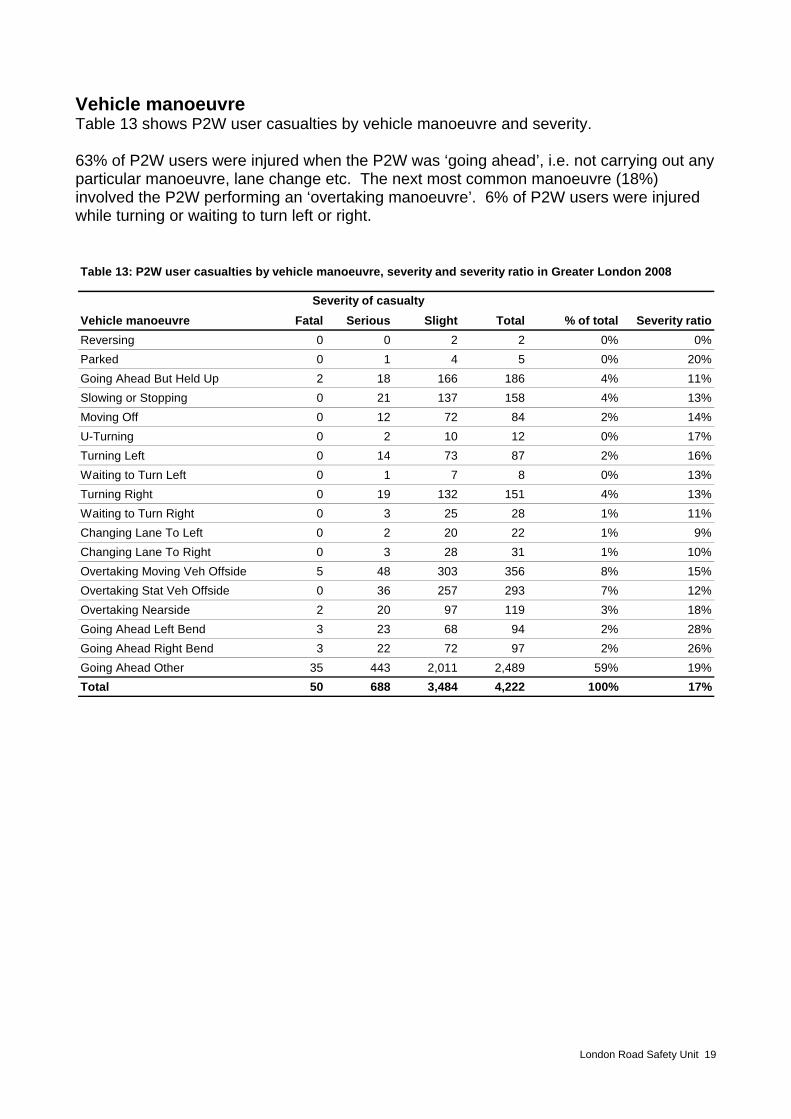
Vehicle manoeuvre Table 13 shows P2W user casualties by vehicle manoeuvre and severity. 63% of P2W users were injured when the P2W was ‘going ahead’, i.e. not carrying out any particular manoeuvre, lane change etc. The next most common manoeuvre (18%) involved the P2W performing an ‘overtaking manoeuvre’. 6% of P2W users were injured while turning or waiting to turn left or right. Table 13: P2W user casualties by vehicle manoeuvre, severity and severity ratio in Greater London 2008
Vehicle manoeuvre Fatal Serious Slight Total % of total Severity ratioReversing 0 0 2 2 0%Parked 0 1 4 5 0% 20%Going Ahead But Held Up 2 18 166 186 4% 11%Slowing or Stopping 0 21 137 158 4% 13%Moving Off 0 12 72 84 2% 14%U-Turning 0 2 10 12 0%Turning Left 0 14 73 87 2%Waiting to Turn Left 0 1 7 8 0% 13%Turning Right 0 19 132 151 4% 13%Waiting to Turn Right 0 3 25 28 1% 11%Changing Lane To Left 0 2 20 22 1% 9%Changing Lane To Right 0 3 28 31 1% 10%Overtaking Moving Veh Offside 5 48 303 356 8% 15%Overtaking Stat Veh Offside 0 36 257 293 7% 12%Overtaking Nearside 2 20 97 119 3% 18%Going Ahead Left Bend 3 23 68 94 2% 28%Going Ahead Right Bend 3 22 72 97 2% 26%Going Ahead Other 35 443 2,011 2,489 59% 19%Total 50 688 3,484 4,222 100% 17%
Severity of casualty
0%
17%16%
London Road Safety Unit 19
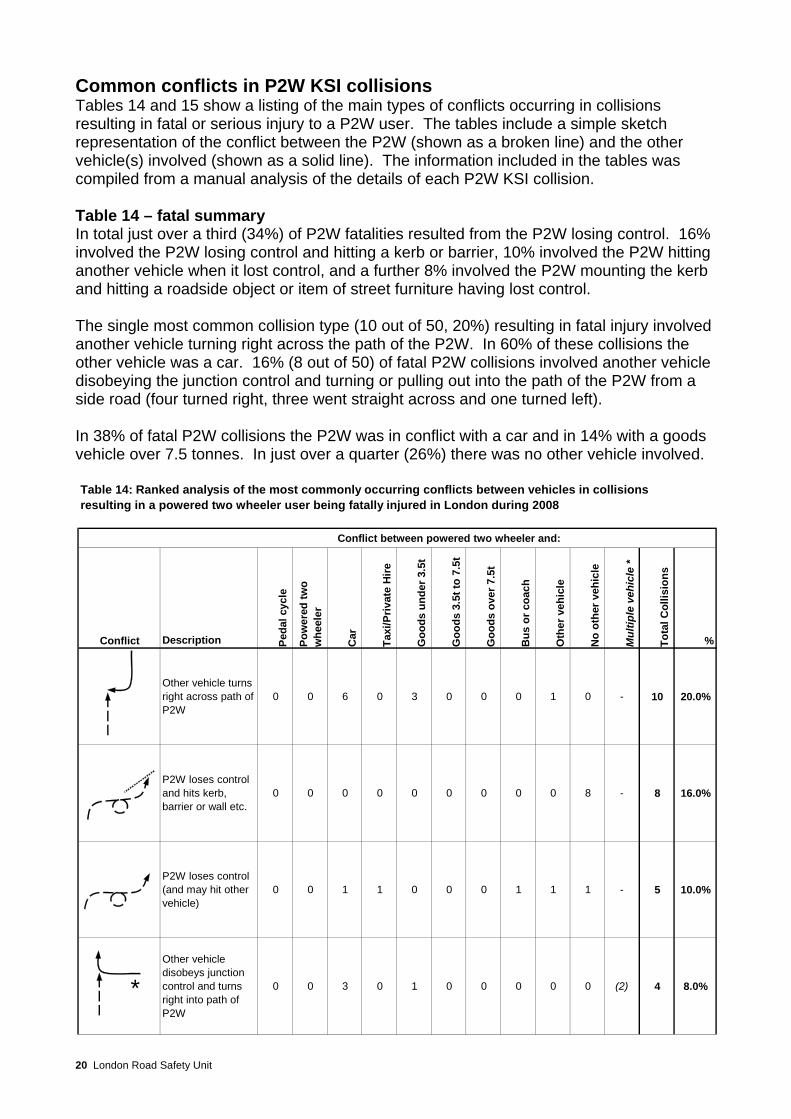
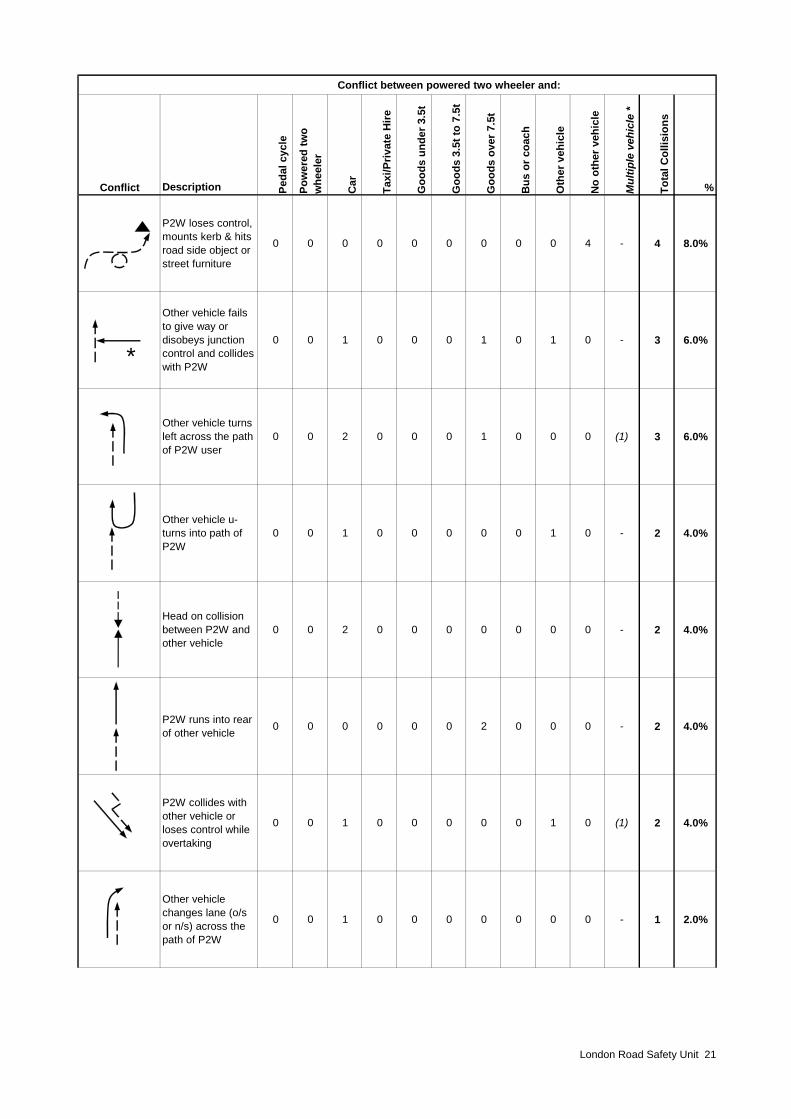
Common conflicts in P2W KSI collisions Tables 14 and 15 show a listing of the main types of conflicts occurring in collisions resulting in fatal or serious injury to a P2W user. The tables include a simple sketch representation of the conflict between the P2W (shown as a broken line) and the other vehicle(s) involved (shown as a solid line). The information included in the tables was compiled from a manual analysis of the details of each P2W KSI collision. Table 14 – fatal summary In total just over a third (34%) of P2W fatalities resulted from the P2W losing control. 16% involved the P2W losing control and hitting a kerb or barrier, 10% involved the P2W hitting another vehicle when it lost control, and a further 8% involved the P2W mounting the kerb and hitting a roadside object or item of street furniture having lost control. The single most common collision type (10 out of 50, 20%) resulting in fatal injury involved another vehicle turning right across the path of the P2W. In 60% of these collisions the other vehicle was a car. 16% (8 out of 50) of fatal P2W collisions involved another vehicle disobeying the junction control and turning or pulling out into the path of the P2W from a side road (four turned right, three went straight across and one turned left). In 38% of fatal P2W collisions the P2W was in conflict with a car and in 14% with a goods vehicle over 7.5 tonnes. In just over a quarter (26%) there was no other vehicle involved.
Table 14: Ranked analysis of the most commonly occurring conflicts between vehicles in collisionsresulting in a powered two wheeler user being fatally injured in London during 2008
Conflict between powered two wheeler and:
Conflict Description Peda
l cyc
le
Pow
ered
two
whe
eler
Car
Taxi
/Priv
ate
Hire
Goo
ds u
nder
3.5
t
Goo
ds 3
.5t t
o 7.
5t
Goo
ds o
ver 7
.5t
Bus
or c
oach
Oth
er v
ehic
le
No
othe
r veh
icle
Mul
tiple
veh
icle
*
Tota
l Col
lisio
ns
%
Other vehicle turns right across path of P2W
0 0 6 0 3 0 0 0 1 0 - 10 20.0%
P2W loses control and hits kerb, barrier or wall etc.
0 0 0 0 0 0 0 0 0 8 - 8 16.0%
P2W loses control (and may hit other vehicle)
0 0 1 1 0 0 0 1 1 1 - 5 10.0%
Other vehicle disobeys junction control and turns right into path of P2W
0 0 3 0 1 0 0 0 0 0 (2) 4 8.0%*
20 London Road Safety Unit
Conflict between powered two wheeler and:
Conflict Description Peda
l cyc
le
Pow
ered
two
whe
eler
Car
Taxi
/Priv
ate
Hire
Goo
ds u
nder
3.5
t
Goo
ds 3
.5t t
o 7.
5t
Goo
ds o
ver 7
.5t
Bus
or c
oach
Oth
er v
ehic
le
No
othe
r veh
icle
Mul
tiple
veh
icle
*
Tota
l Col
lisio
ns
%
P2W loses control, mounts kerb & hits road side object or street furniture
0 0 0 0 0 0 0 0 0 4 - 4 8.0%
Other vehicle fails to give way or disobeys junction control and collides with P2W
0 0 1 0 0 0 1 0 1 0 - 3 6.0%
Other vehicle turns left across the path of P2W user
0 0 2 0 0 0 1 0 0 0 (1) 3 6.0%
Other vehicle u-turns into path of P2W
0 0 1 0 0 0 0 0 1 0 - 2 4.0%
Head on collision between P2W and other vehicle
0 0 2 0 0 0 0 0 0 0 - 2 4.0%
P2W runs into rear of other vehicle 0 0 0 0 0 0 2 0 0 0 - 2 4.0%
P2W collides with other vehicle or loses control while overtaking
0 0 1 0 0 0 0 0 1 0 (1) 2 4.0%
Other vehicle changes lane (o/s or n/s) across the path of P2W
0 0 1 0 0 0 0 0 0 0 - 1 2.0%
*
London Road Safety Unit 21
Conflict between powered two wheeler and:
Conflict Description Peda
l cyc
le
Pow
ered
two
whe
eler
Car
Taxi
/Priv
ate
Hire
Goo
ds u
nder
3.5
t
Goo
ds 3
.5t t
o 7.
5t
Goo
ds o
ver 7
.5t
Bus
or c
oach
Oth
er v
ehic
le
No
othe
r veh
icle
Mul
tiple
veh
icle
*
Tota
l Col
lisio
ns
%
Other vehicle disobeys junction control and turns left into path of P2W
0 0 0 0 0 0 1 0 0 0 - 1 2.0%
Other vehicle runs into rear of P2W 0 0 1 0 0 0 0 0 0 0 (1) 1 2.0%
Other vehicle starts off or pulls out into path of P2W
0 0 0 0 0 0 1 0 0 0 - 1 2.0%
P2W and other vehicle travelling too close alongside each other
0 0 0 0 0 0 1 0 0 0 - 1 2.0%
Total 0 0 19 1 4 0 7 1 5 13 (5) 50 100%
*collisions involving three or more vehicles - the main vehicle in such collisions is recorded in the relevant column
*
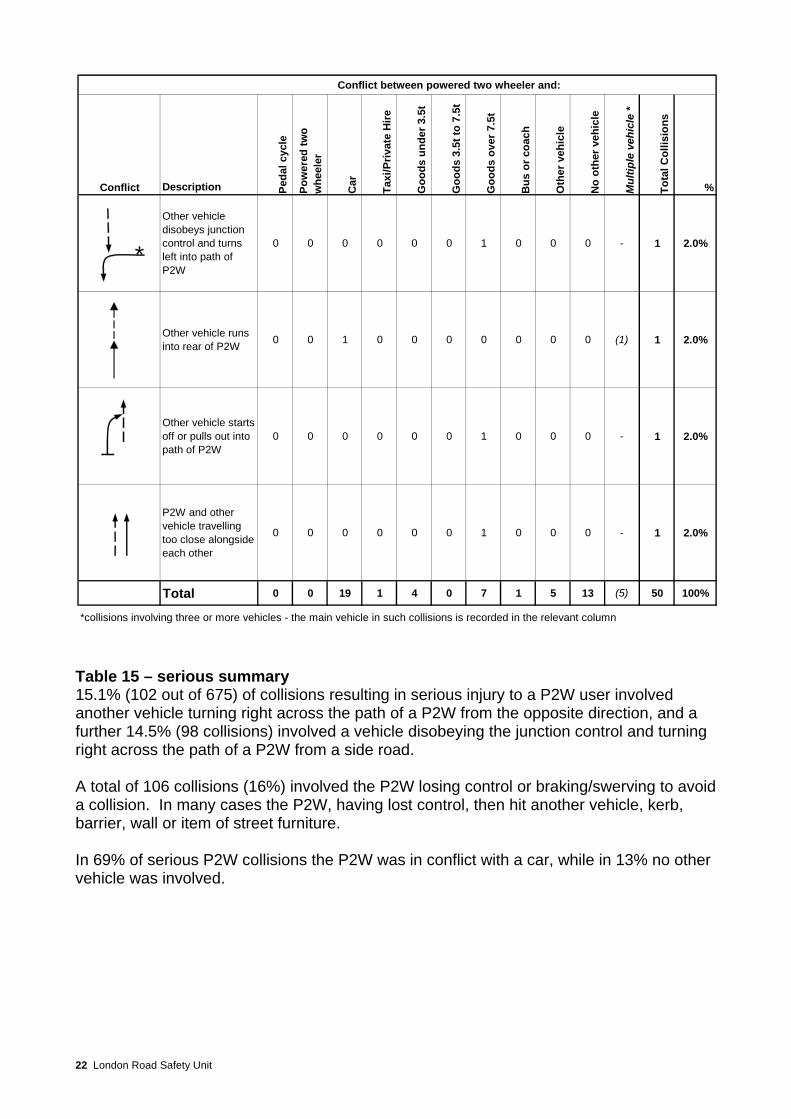
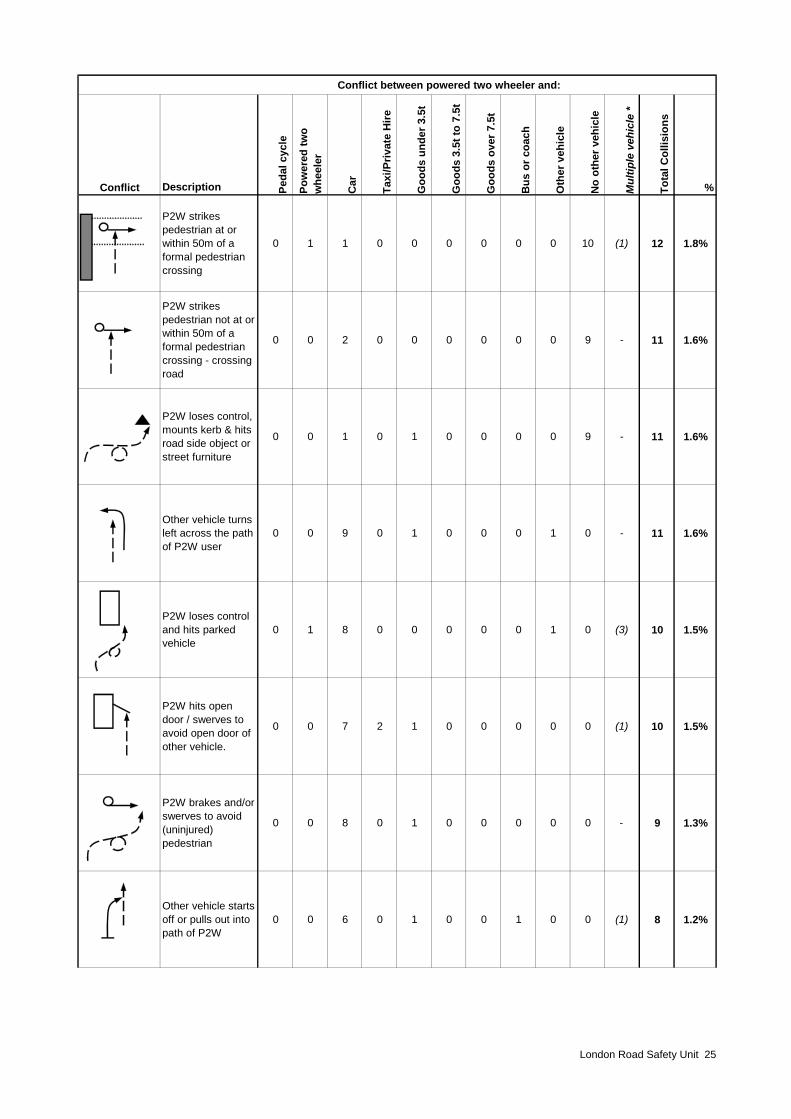
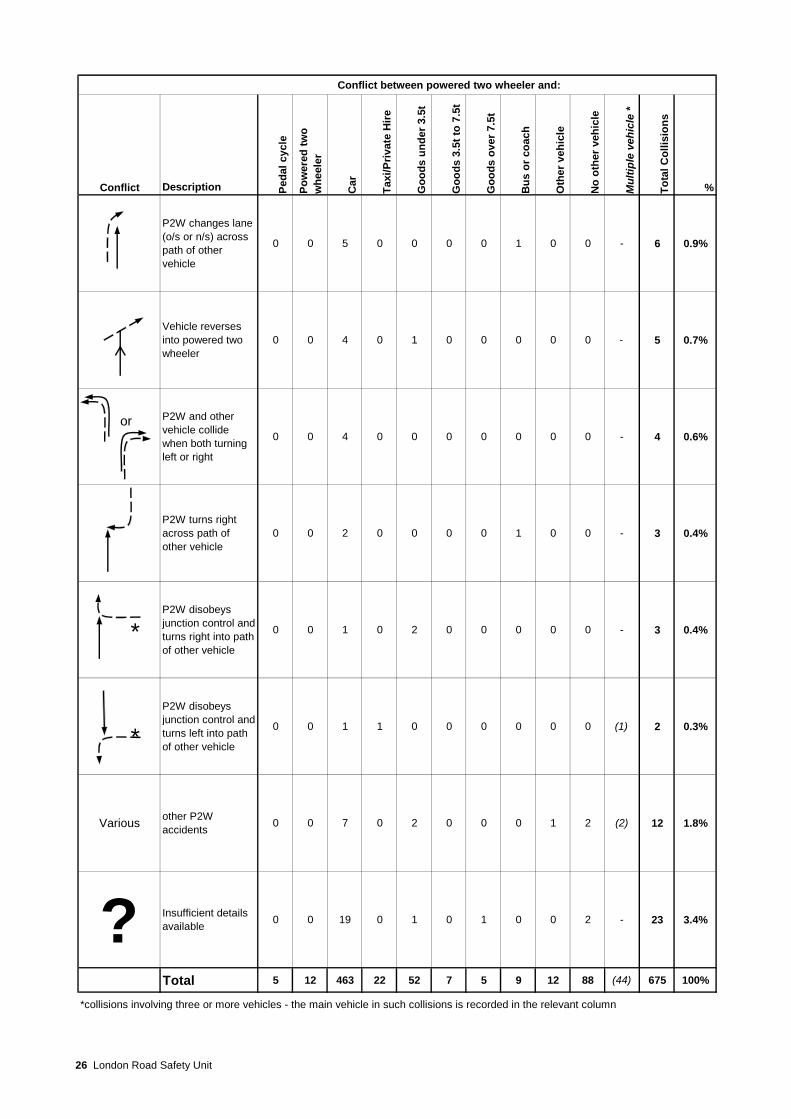
Table 15 – serious summary 15.1% (102 out of 675) of collisions resulting in serious injury to a P2W user involved another vehicle turning right across the path of a P2W from the opposite direction, and a further 14.5% (98 collisions) involved a vehicle disobeying the junction control and turning right across the path of a P2W from a side road. A total of 106 collisions (16%) involved the P2W losing control or braking/swerving to avoid a collision. In many cases the P2W, having lost control, then hit another vehicle, kerb, barrier, wall or item of street furniture. In 69% of serious P2W collisions the P2W was in conflict with a car, while in 13% no other vehicle was involved.
22 London Road Safety Unit
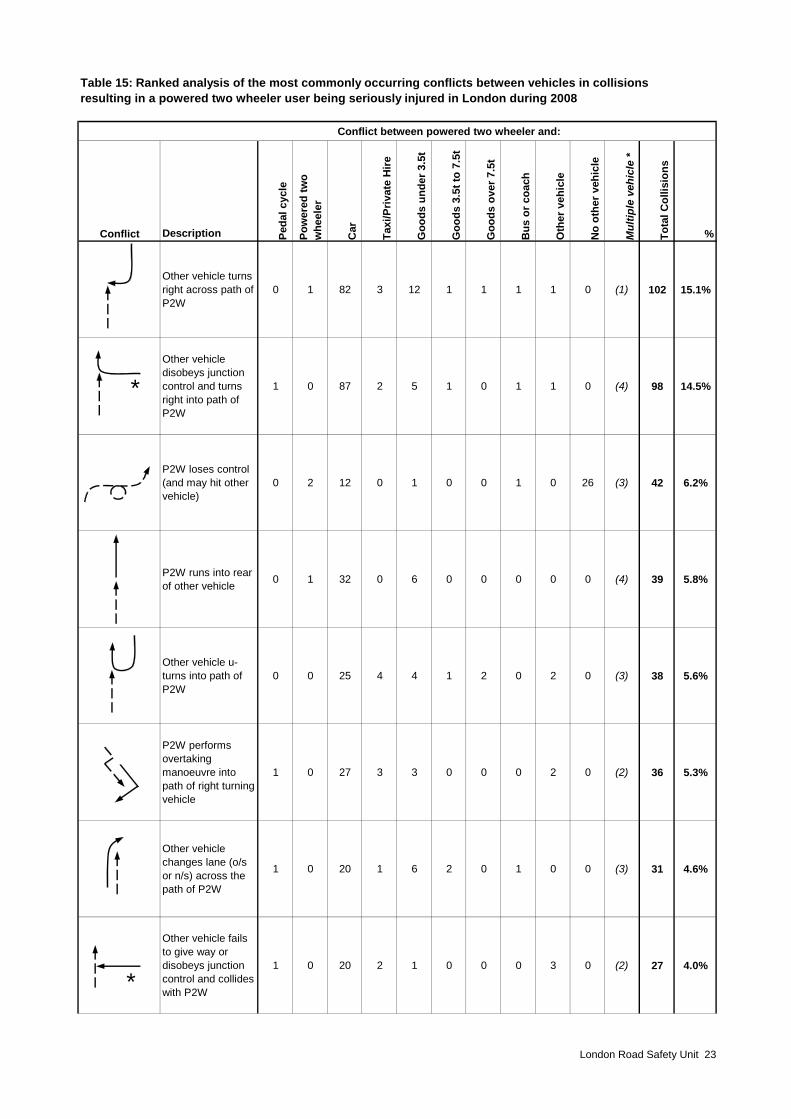
Table 15: Ranked analysis of the most commonly occurring conflicts between vehicles in collisionsresulting in a powered two wheeler user being seriously injured in London during 2008
Conflict between powered two wheeler and:
Conflict Description Peda
l cyc
le
Pow
ered
two
whe
eler
Car
Taxi
/Priv
ate
Hire
Goo
ds u
nder
3.5
t
Goo
ds 3
.5t t
o 7.
5t
Goo
ds o
ver 7
.5t
Bus
or c
oach
Oth
er v
ehic
le
No
othe
r veh
icle
Mul
tiple
veh
icle
*
Tota
l Col
lisio
ns
%
Other vehicle turns right across path of P2W
0 1 82 3 12 1 1 1 1 0 (1) 102 15.1%
Other vehicle disobeys junction control and turns right into path of P2W
1 0 87 2 5 1 0 1 1 0 (4) 98 14.5%
P2W loses control (and may hit other vehicle)
0 2 12 0 1 0 0 1 0 26 (3) 42 6.2%
P2W runs into rear of other vehicle 0 1 32 0 6 0 0 0 0 0 (4) 39 5.8%
Other vehicle u-turns into path of P2W
0 0 25 4 4 1 2 0 2 0 (3) 38 5.6%
P2W performs overtaking manoeuvre into path of right turning vehicle
1 0 27 3 3 0 0 0 2 0 (2) 36 5.3%
Other vehicle changes lane (o/s or n/s) across the path of P2W
1 0 20 1 6 2 0 1 0 0 (3) 31 4.6%
Other vehicle fails to give way or disobeys junction control and collides with P2W
1 0 20 2 1 0 0 0 3 0 (2) 27 4.0%
*
*
London Road Safety Unit 23
Conflict between powered two wheeler and:
Conflict Description Peda
l cyc
le
Pow
ered
two
whe
eler
Car
Taxi
/Priv
ate
Hire
Goo
ds u
nder
3.5
t
Goo
ds 3
.5t t
o 7.
5t
Goo
ds o
ver 7
.5t
Bus
or c
oach
Oth
er v
ehic
le
No
othe
r veh
icle
Mul
tiple
veh
icle
*
Tota
l Col
lisio
ns
%
Head on collision between P2W and other vehicle
0 2 15 1 1 0 0 0 0 0 - 19 2.8%
P2W loses control and hits kerb, barrier or wall etc.
0 0 2 0 0 1 0 0 0 14 (1) 17 2.5%
P2W loses control and may hit other vehicle - road surface condition/spillage/weather
0 0 1 0 0 0 0 0 0 16 - 17 2.5%
Other vehicle runs into rear of P2W 0 2 8 1 0 1 1 2 0 0 (4) 15 2.2%
P2W collides with other vehicle or loses control while overtaking
1 1 11 1 1 0 0 0 0 0 (2) 15 2.2%
Other vehicle disobeys junction control and turns left into path of P2W
0 0 13 1 0 0 0 0 0 0 (1) 14 2.1%
P2W and other vehicle travelling too close alongside each other
0 1 11 0 1 0 0 0 0 0 (2) 13 1.9%
P2W fails to give way or disobeys junction control and collides with other vehicle
0 0 12 0 0 0 0 0 0 0 (3) 12 1.8%
*
*
24 London Road Safety Unit
Conflict between powered two wheeler and:
Conflict Description Peda
l cyc
le
Pow
ered
two
whe
eler
Car
Taxi
/Priv
ate
Hire
Goo
ds u
nder
3.5
t
Goo
ds 3
.5t t
o 7.
5t
Goo
ds o
ver 7
.5t
Bus
or c
oach
Oth
er v
ehic
le
No
othe
r veh
icle
Mul
tiple
veh
icle
*
Tota
l Col
lisio
ns
%
P2W strikes pedestrian at or within 50m of a formal pedestrian crossing
0 1 1 0 0 0 0 0 0 10 (1) 12 1.8%
P2W strikes pedestrian not at or within 50m of a formal pedestrian crossing - crossing road
0 0 2 0 0 0 0 0 0 9 - 11 1.6%
P2W loses control, mounts kerb & hits road side object or street furniture
0 0 1 0 1 0 0 0 0 9 - 11 1.6%
Other vehicle turns left across the path of P2W user
0 0 9 0 1 0 0 0 1 0 - 11 1.6%
P2W loses control and hits parked vehicle
0 1 8 0 0 0 0 0 1 0 (3) 10 1.5%
P2W hits open door / swerves to avoid open door of other vehicle.
0 0 7 2 1 0 0 0 0 0 (1) 10 1.5%
P2W brakes and/or swerves to avoid (uninjured) pedestrian
0 0 8 0 1 0 0 0 0 0 - 9 1.3%
Other vehicle starts off or pulls out into path of P2W
0 0 6 0 1 0 0 1 0 0 (1) 8 1.2%
London Road Safety Unit 25
Conflict between powered two wheeler and:
Conflict Description Peda
l cyc
le
Pow
ered
two
whe
eler
Car
Taxi
/Priv
ate
Hire
Goo
ds u
nder
3.5
t
Goo
ds 3
.5t t
o 7.
5t
Goo
ds o
ver 7
.5t
Bus
or c
oach
Oth
er v
ehic
le
No
othe
r veh
icle
Mul
tiple
veh
icle
*
Tota
l Col
lisio
ns
%
P2W changes lane (o/s or n/s) across path of other vehicle
0 0 5 0 0 0 0 1 0 0 - 6 0.9%
Vehicle reverses into powered two wheeler
0 0 4 0 1 0 0 0 0 0 - 5 0.7%
P2W and other vehicle collide when both turning left or right
0 0 4 0 0 0 0 0 0 0 - 4 0.6%
P2W turns right across path of other vehicle
0 0 2 0 0 0 0 1 0 0 - 3 0.4%
P2W disobeys junction control and turns right into path of other vehicle
0 0 1 0 2 0 0 0 0 0 - 3 0.4%
P2W disobeys junction control and turns left into path of other vehicle
0 0 1 1 0 0 0 0 0 0 (1) 2 0.3%
Various other P2W accidents 0 0 7 0 2 0 0 0 1 2 (2) 12 1.8%
? Insufficient details available 0 0 19 0 1 0 1 0 0 2 - 23 3.4%
Total 5 12 463 22 52 7 5 9 12 88 (44) 675 100%
*collisions involving three or more vehicles - the main vehicle in such collisions is recorded in the relevant column
*
or
*
26 London Road Safety Unit
London Road Safety Unit 27
What is the cost? Based on the average cost of motorised two-wheeler rider and passenger casualties as published by the Department for Transport in the Accidents Sub-Objective (Transport Analysis Guidance Unit 3.4.1), the cost to the community of P2W user casualties in 2008 is estimated at around £430 million at December 2008 prices. P2W casualties averaged 12 a day in Greater London in 2008, with a subsequent cost to the community of approximately £1.2 million per day. Background documents
• Transport Statistics Bulletin Road Casualties Great Britain Main Results: 2008 (Department for Transport) http://www.dft.gov.uk/adobepdf/162469/221412/221549/227864/479748/rcgbmainresults08.pdf
• Transport Analysis Guidance (TAG) Unit 3.4.1 – The Accidents Sub-Objective
(Department for Transport – April 2009) http://www.dft.gov.uk/webtag/webdocuments/3_Expert/4_Safety_Objective/pdf/3.4.1.pdf
• Radial Traffic Movements in London 1980 to 2008 (TfL - unpublished)
• Licensed vehicles in Greater London 1981 to 2008 (Department for Transport)
• DfT National Road Traffic Survey data
Copies of reports and research published by LRSU can be found at – www.tfl.gov.uk/londonroadsafety Prepared by: Sandra Cowland, London Road Safety Unit Reviewed by: John Devenport, London Road Safety Unit Cleared by: Ben Plowden Director, Integrated Programme Delivery


![State Summary of War Casualties - Utah State Archivesarchives.utah.gov/research/guides/wwii-navy-war-casualties-utah.pdf · State Summary of War Casualties [UTAH] U. s. NAVY 1946](https://static.fdocuments.in/doc/165x107/5b3e06517f8b9a28308c5edf/state-summary-of-war-casualties-utah-state-state-summary-of-war-casualties.jpg)


![Passenger Vehicle-Powered Two Wheeler Pre-Crash Trajectory ...indexsmart.mirasmart.com/26esv/PDFfiles/26ESV-000096.pdf · Motorcycle Crash Causation Study (MCCS) database [9]. Both](https://static.fdocuments.in/doc/165x107/5edabf62434f4178104f9054/passenger-vehicle-powered-two-wheeler-pre-crash-trajectory-motorcycle-crash.jpg)