
Power to Memphis · 2019-02-14 · electric power industry, Memphis an historic opportunity to...
48
Power to Memphis OPTIONS FOR A RELIABLE, AFFORDABLE AND GREENER FUTURE PREPARED FOR Friends of the Earth PREPARED BY Jurgen Weiss Judy Chang Nicholas Powers Kai van Horn January 2019
Transcript of Power to Memphis · 2019-02-14 · electric power industry, Memphis an historic opportunity to...

Power to Memphis
OPTIONS FOR A RELIABLE, AFFORDABLE AND GREENER FUTURE
PREPARED FOR
Friends of the Earth
PREPARED BY Jurgen Weiss Judy Chang Nicholas Powers Kai van Horn
January 2019

Notice ––––– This report was prepared for Friends of the Earth, in accordance with The Brattle Group’s engagement terms, and is intended to be read and used as a whole and not in parts. The report reflects the analyses and opinions of the authors and does not necessarily reflect those of The Brattle Group’s clients or other consultants.
Copyright © 2019 The Brattle Group, Inc.

bratt le.com | i
Table of Contents ––––– Executive Summary............................................................................................................. ii
I. Introduction ............................................................................................................... 1
II. Relevant Background ................................................................................................. 1
Summary of Methodology ................................................................................................... 3
A. Overview of Methodology ...................................................................................... 3
B. Summary of Assumptions........................................................................................ 4
III. 2024 Portfolio Options ............................................................................................... 8
A. Reliability and Emissions .......................................................................................10
B. Portfolio Costs ........................................................................................................15
C. Other Considerations .............................................................................................18
IV. 2050 Portfolios ..........................................................................................................19
A. Transmission Considerations..................................................................................25
B. Indicative Costs ......................................................................................................27
V. Risks of Staying with the TVA versus Alternative Supply........................................30
VI. Conclusion ................................................................................................................33
VII. Appendix – Detailed Description of Methodology and Assumptions .......................35
A. Portfolio Construction Approach ...........................................................................35
B. Resource Assumptions ...........................................................................................35
1. Generation Costs ................................................................................................35 a. Overnight Costs.............................................................................................35 b. Fixed O&M ....................................................................................................36 c. Renewables Generation Profiles ...................................................................36 d. Operating Costs – Gas Generation ................................................................36 e. Transmission Costs ........................................................................................37
2. Demand-Side Resources.....................................................................................37
C. Load Assumptions ..................................................................................................38
1. Electric Vehicles ................................................................................................38
2. Energy Efficiency...............................................................................................38
D. Other Operational Assumptions ............................................................................39
E. Financial Assumptions ...........................................................................................39
F. Power System Optimizer (PSO) .............................................................................40

bratt le.com | ii
Executive Summary ––––– The current contract between the Tennessee Valley Authority (TVA) and Memphis Light, Gas & Water (“MLGW”), Memphis’ municipal utility and TVA’s largest retail customer, provides that Memphis can end its contract by giving the TVA five years notice. Given the rapid and profound transformation of the electric power (and indeed the broader energy) industry, driven primarily by technological progress, changing consumer preferences and policy imperatives such as those related to the risks associated with climate change, this option creates a unique opportunity for the city of Memphis and its citizens to evaluate whether alternative power supply options could be more attractive than a continued contract with the TVA in the sense of being more affordable, more sustainable and/or less risky, while continuing to provide high levels of reliability.
We evaluated a number of such alternatives, assuming that MLGW would provide notice to TVA in 2019 so that an alternative to the current power supply would need to be in place by and after 2024. Given that investments in electricity infrastructure tend to have long lives, we evaluated alternative power supply options for 2024 and for 2050, capturing short and longer-term opportunities to lower costs and take advantage of opportunities or policy imperatives to reduce GHG emissions. In particular, we examined whether Memphis could obtain a portfolio of power supply that reduces the cost of electricity supply to Memphis relative to current (and potential future) TVA rates, does not rely on immediate investments in new transmission to access non-TVA resources, and maximizes immediate opportunities to use renewable energy while setting the city onto a path towards potentially (near) 100% renewable power supply by 2050.
Using a detailed power system model to simulate the Memphis power supply, we find that several local supply resource portfolios combining natural gas and renewable energy, potentially with some imports of renewable energy over existing transmission from the West, would likely provide Memphis with reliable power supplies at a power supply cost substantially below current and projected TVA rates for 2024 and at emissions below those associated with the current and likely also TVA’s projected future resource mix.
Indeed, we find that in 2024 electricity supply costs of the portfolios we evaluated could be as much as a third or $240-333 million per year lower than costs incurred by Memphis under the current TVA. These portfolios also meet Memphis’ power supply needs with lower carbon dioxide emissions than those associated with the TVA’s current power supply mix, and would put Memphis on a path towards potentially increasing the share of renewable energy over time to reach close to 100% renewable supply by 2050. Figure ES-1 shows the three different resource supply portfolios we evaluated for 2024 as well as three different resource supply portfolios for 2050, two of which achieve close to 100% renewable energy supply.

bratt le.com | I I I
Figure ES-1: Evaluated Memphis Alternative Supply Portfolios1
2024
(a): Capacity in 2024 Alternative Supply Portfolios
(b): Costs for 2024 Alternative Supply Portfolios
2050
(c): Capacity in 2050 Alternative Supply Portfolios
(d): Costs for 2050 Alternative Supply Portfolios
Our analysis indicates that by 2024 a local mix of gas-fired generation, solar PV, battery storage, energy efficiency and demand response would result in wholesale power supply costs substantially below the current TVA rate. Even adding more renewables both in Memphis and outside, but delivered over the assumed to be limited transmission connecting Memphis to MISO would likely still lead to substantially lower wholesale power supply costs compared to the costs incurred under the TVA’s current Memphis rate. None of the near term options we evaluated require the construction of new transmission connections to other areas or the use of existing TVA transmission. This is not to say that cheaper power supply options could not be constructed if the use of the strong interconnection of Memphis with the TVA system could be used. Rather, it
1 Renewable penetrations shown on the charts reflect the renewable generation as a percentage of annual
load consumption.

bratt le.com | I V
illustrates the feasibility and potential economic attractiveness of alternative supply portfolios even without the use of existing TVA transmission infrastructure.
With either of the 2024 portfolios in place, Memphis would then have the option to move away from gas-fired generation towards a higher share of renewable energy resources over time, if economics or policy preferences would make doing so attractive. To indicate the potential impact of staying primarily with a natural gas based versus moving towards substantially more renewables over time, we also constructed three hypothetical 2050 portfolios. The first of these is essentially identical to the cost-minimizing 2024 portfolio. The other two would mostly or fully decarbonize Memphis’ power supply by mid-century. Which of these portfolios is most attractive depends on a number of uncertain factors, including the evolution of gas prices and the cost of various renewables and storage technologies, but also local preferences and state and national energy policy. For example, the cost of a natural-gas portfolio does not assume that GHG emissions will be subjected to any restrictions by 2050. Consequently, the gas-based portfolio appears substantially less costly than a mostly renewable portfolio. However, a natural-gas focused portfolio would expose Memphis to potentially substantial risk related to changes gas prices and also to the possibility that over the coming decades some form of carbon pricing will further increase the cost of power generation with fossil fuels including natural gas. On the other hand, the costs of renewables-focused portfolios depend critically on the evolution of renewable (and storage) costs over time. The costs in Figure ES-1 above assume significant further cost reductions for these technologies. However, the costs of these technologies have been declining more rapidly than predicted and could decline more rapidly than we assume going forward. With a natural-gas focused portfolio in 2024, Memphis has the opportunity to learn about the pace of cost reductions for renewable and storage before deciding how to adjust its supply portfolio over time.
Whether or not such portfolios would reduce the cost relative to renewing a contract with TVA depends on many factors, including the evolution of TVA’s own power supply mix. Over the time the TVA has been Memphis’ power supplier, TVA rates have certainly not remained constant and, depending on the investment decisions made by the TVA and external factors such as natural gas prices, future TVA rates for Memphis could well increase in a way that makes even the renewables-focused 2050 portfolios very competitive with future TVA rates. Memphis may also be able to leverage its access to tax-advantaged financing to lower the cost of a renewable-focused portfolio it owns relative to the costs we have assumed in Figure ES-1 above. We note that access to tax advantaged financing would have a more important impact on a renewables-focused portfolio than a gas-focused portfolio since the share of capital expenditure is higher for the former, with the cost of the latter including a significant portion of fuel costs. Memphis would of course be in charge of its own future and would be able to pursue whatever lowest cost options it might choose, with the three 2050 portfolios we analyzed providing some insights as to the potential costs associated with some of those options.
Finally, to achieve a near 100% renewable power supply in 2050 on average, the renewables-focused portfolios produce “surplus” renewable electricity during times when production from these renewables exceeds the ability of Memphis to absorb all of it. The estimated cost of the renewables-focused 2050 portfolios depends significantly on the market value of this surplus

bratt le.com | V
renewable electricity. The magnitude of this surplus depends on how well the production of renewable electricity is aligned with load (or can be aligned with added storage). Greater diversity in renewables profiles as well as load results in better alignment and reduces the amount of excess renewable generation. This highlights the importance (and value) of balancing renewable generation over a wider geographic footprint as the share of variable renewable resources in Memphis increases.
There could be other benefits of exploring power supply options other than a continuation of the current contract with the TVA, both in the short and in the longer run. Developing its own power supply would provide MLGW with an opportunity to consider the local economic development impacts of its supply portfolio, for example by emphasizing energy efficiency investments and/or the choice of local over more remote supply resources. Since renewable energy resources can be installed in relatively small increments, MLGW may also be able to make more incremental decisions, choosing how to build its long-term supply portfolio as it learns about the evolution of the relative costs of the various options available to it.
In sum, our analyses indicate that the option to end the current power supply contract with the TVA with a five-year notice provides Memphis and MLGW with opportunities to develop its own reliable power supply at potentially substantial cost savings over the current (and expected future) TVA rate. Doing so would give Memphis:
• Access to lower cost electricity; • A choice to use its electricity supply to foster local economic development; • The opportunity to take advantage of the very large and ongoing reductions in the cost of
various new and renewable technologies; • The ability to guide the city on a path towards a sustainable energy future.
bratt le.com | 1
I. Introduction ––––– Memphis Light, Gas & Water (“MLGW”), Memphis’ municipal utility for electric, gas and water service, is the single largest electric customer of the Tennessee Valley Authority (“TVA”); in 2017 it purchased 13,308 gigawatt-hours (“GWh”) from the TVA at a cost of $991.5 million, for resale to its retail electric customers.2 In the middle of a fundamental technological transformation of the electric power industry, Memphis has an historic opportunity to reexamine its current power supply options.
To better understand whether alternatives to TVA supply could provide the city of Memphis and its citizens with a reliable, but more affordable and sustainable source of power, Friends of the Earth asked The Brattle Group to assess how alternative power supply portfolios to both the current and planned TVA portfolio might serve the city of Memphis over the coming decades.
Clearly, the decision to end its current contract with TVA with five years notice involves many factors beyond the scope of the analyses presented in this report. Nonetheless, the results of the analyses presented here provide an important basis for making such a decision at a time of fundamental change in the industry.
II. Relevant Background ––––– The electricity (and broader energy) industry is in the middle of what may well be the most fundamental transformation in a century. After decades of reliance on fossil fuels – first coal and some oil and in recent decades increasingly natural gas, nuclear, and hydro power, new technologies are rapidly taking on a more significant role. Wind and solar photovoltaic (PV) generation, and also more recently battery storage, are maturing to the point where they are becoming attractive alternatives to the current set of generation sources, not just for environmental, but increasingly for economic reasons. At the same time, technological innovation also enables electricity consumers to play a much more active role in ensuring a reliable and affordable electricity system. Energy efficiency and various forms of demand response, i.e., programs that reward customers for shifting or reducing their electricity consumption for short
2 In 2017, MLGW sold 13,308.2 GWh of electricity, at a cost of $991.5 million, or 7.45 cents per kWh.
See MLGW’s 2017 Annual Report (pp. M-3, M-13). For ease of comparison with costs to MLGW under its current supply arrangement, cost projections throughout this report are expressed in 2017 dollars.

bratt le.com | 2
periods of time, are creating cost-effective opportunities for consumers to more actively control their electricity consumption and affect the cost of doing so. Finally, concerns about climate change as well as advances in technology and business model innovation are changing energy consumption more broadly. Electric vehicles, shared mobility services and, in the future, autonomous driving make possible or even likely a future in which electricity will be the “fuel” for a broader set of energy-consuming services that power our lives.
Much uncertainty remains with respect to the speed of this transformation as well as the evolution of the costs of the newer alternatives to the more traditional power supply options, some of which, due to the shale gas development, have also become less expensive over recent years.
Given that the current contract between MLGW and the TVA permits MLGW to end its TVA contract with five years notice, the city of Memphis has a unique opportunity to examine how these changes to the electricity and broader energy system might be leveraged in ways that reduce the cost of energy to its residents, provide economic development opportunities, and position the city for a potential longer-term transition away from older, more polluting and greenhouse gas (GHG) emitting resources towards an ultimately GHG and pollution-free energy supply. One option for MLGW is to continue its current contract with the TVA. Given the TVA’s past resource decisions and current Integrated Resource Plan, this likely implies an ongoing commitment to substantial amounts of nuclear and fossil fuel power supply sources and associated price and environmental risks. But other options may exist. They could involve a more heavy reliance on Memphis-owned local resources or a combination of local and non-local resources, either of which could result in a generation mix that differs significantly from the TVA’s current and planned generation mix, in terms of costs, emissions and risks.
We have analyzed several such options and present them in this report. Since electricity infrastructure – power plants, transmission and distribution wires, storage, etc. – tend to have long lives and since both continuing the current contract with the TVA and pursuing an alternative power supply path would require long-term commitments, our analysis focused both on the near and the longer term. In particular, we examined options that are likely implementable by 2024, which is the earliest year Memphis could implement its own power supply, given the five-year notice period. We also took a view of the potential developments over the period between 2024 and 2050, a time period which roughly corresponds to the low end of the useful lives of many of the elements of a power system, to examine how power supply portfolios might look like in 2050.
In the subsequent sections, we describe our methodology for developing potential future alternatives to a continued contract with the TVA, present the alternatives, and discuss our findings.

bratt le.com | 3
Summary of Methodology ––––– In this section we provide a brief overview of the methodology we employed in this study. A more detailed discussion is provided in the Appendix.
A. Overview of Methodology The analyses presented in this report make use of two models: a power system simulation model and a system cost model. The power system simulation model leverages Power System Optimizer (“PSO”), a state-of-the-art modeling platform that allowed us to conduct an hourly production simulation to test the hourly supply and demand balance of the Memphis electricity system for a given set of resource portfolios. The results of this model provided information about both the reliability of the proposed resource mix as well as the production costs of such a mix over the course of a representative year.
The system cost model relied in part on the production cost estimates, and is used to estimate the capital costs of constructing each portfolio considered.
Multiple rounds of iteration between these two modeling tools provided information about the feasibility, reliability, and economics of the various supply portfolios considered, ultimately leading us to focus on the portfolios described in this report.
To construct various portfolios, we relied on information provided by MLGW as well as publicly available information from various sources. In particular, we used information about historic hourly demand as well as the composition of various customer groups (residential, commercial, and industrial) provided by MLGW to develop projections of future demand (including demand due to EVs) and demand flexibility by customer group. We also used information from various sources including the National Renewable Energy Laboratory (NREL), U.S. Department of Energy (DOE), PJM Interconnection LLC, and the U.S. Energy Information Administration (EIA) to develop cost and performance assumptions for various generation technologies (natural gas, wind, solar, and battery storage) as well as for options for energy efficiency and demand response.
Since, with the arrival of electric vehicles, the transportation industry is undergoing a rapid and fundamental transformation with potentially significant implications for electricity demand over the coming decades, we have modeled an increase in electric vehicle related electricity demand between now and 2050. Electrified transport will lead to additional electricity demand, both in terms of total energy needs and potentially in terms of peak demand, but will also create more flexibility, by inducing vehicle owners to charge their vehicles when it is beneficial to the (Memphis) system to do so. We conservatively assumed that EV penetration of light-duty vehicles

bratt le.com | 4
in Memphis will be approximately 10% in 2024 and grow to about 50% by 2050.3 We have used publicly available data as well as our own analysis and research to estimate the impact of electrified transport on the load shape of the Memphis system over time and also to estimate the amount and shape of additional flexibility created through “beneficial” charging.
B. Summary of Assumptions To develop alternative electricity supply portfolios for Memphis, we needed to make assumptions about the costs of various portfolio components over time. These components include power generation (natural gas, wind, solar, and battery storage), demand (energy efficiency, demand response, and incremental demand due to electric vehicles) and potentially transmission assets needed to connect Memphis to markets and regions other than the TVA system. Here, we provide a brief overview of our assumptions. We discuss our assumptions in detail in the Appendix.
Over the past decade or so, the United States electricity industry has been undergoing, and continues to undergo, fundamental transformation. This transformation was first led by the discovery of vast unconventional domestic reserves of natural gas (“shale gas”) and increasingly by declines in cost and improvements in performance of various renewable technologies, most notably wind (both onshore and offshore), solar PV, and battery storage.4 At the same time, technological progress is also fundamentally altering the role of demand, with ongoing efforts to improve energy efficiency and increasing options to cost-effectively incentivize demand to respond to price signals in ways that provide significant additional flexibility to the electric system.
Figure 1 below shows projected costs of wind and solar resources in Memphis and in surrounding regions on a levelized cost of energy (“LCOE”) basis.5 Figure 1 also shows the projected capital cost of batteries over the next 30 years. Even though the costs of wind, solar and batteries have already decreased dramatically, the costs of all three technologies are expected to continue their downwards trend over the coming decades. As Figure 1 also shows, the cost of wind and solar depend on where the resources are located – the wind blows stronger and the sun shines more in some areas than in others. Finally, Figure 1 shows that there are significant cost differences for
3 Forecasting the speed and extent of EV adoption over the next 30 years is very challenging. There are
many signs that adoption of electric vehicles is accelerating and will continue to do so. Some forecasts assume that by 2050 most passenger vehicles will be electric. Our assumed 2050 EV penetration is therefore conservative in the sense that we model an EV related electricity demand that is substantially smaller than what would occur if all passenger transport by 2050 were electric. EV assumptions are mostly to illustrate the potential impact of electric cars. The magnitude of EV adoption has no material impact on the cost of the portfolios we analyzed.
4 While another solar technology known as concentrated solar power (“CSP”) is technologically viable, there is little to no continued development of CSP projects anticipated in the near-term in the U.S. This is in large part driven by the cost advantage of solar PV over CSP in the U.S. context.
5 LCOE is a measure of the average cost of electricity and is often used to express the cost of renewable energy. It spreads the capital investment costs (there are no fuel costs) over the electricity production from a facility over the expected life of the facility.

bratt le.com | 5
solar energy based on the size and type of installation, with distributed (rooftop) solar systems using less open space (and therefore being easier to install in Memphis itself), but also being substantially more expensive when compared to larger installations.
Figure 1: Wind (a) and Solar PV (b) LCOE Assumptions and Battery (c) Overnight Cost Assumptions
(a): Wind Cost Projections
(b): Solar Cost Projections
(c): Battery Storage Cost Projections
Notes: Our LCOE assumptions in (a) and (b) are based on the mid-range projections for capital costs in NREL’s 2018 Annual Technology Baseline study. We employ a financial model using standard assumptions to convert these costs into cents per kWh over the expected life of the generating assets. All costs are expressed in 2017 dollars. The discontinuities in graph (b) reflect the expected ramping down of the federal investment tax credit over time. The overnight cost assumptions for battery storage presented in (c) are based on a Brattle review of industry projections from various sources. The assumptions presented here and used in our model approximately represent the mid-point of those projections.

bratt le.com | 6
In addition to natural gas fired plants, our 2024 portfolios include these three resources, primarily located in Memphis. Our 2050 scenarios take greater advantage of remote renewable resources, as there is enough time between now and 2050 to build new transmission lines.
We develop portfolios from these resources to meet an evolving Memphis load, which has been growing relatively slowly. We assume that historically slow load growth will be supplemented by new load related to the adoption of EVs, to a relatively modest extent by 2024, but increasingly so thereafter.6 We also include in our portfolios opportunities to activate additional energy efficiency and demand response opportunities.7 Figure 2 below shows our assumed 2024 and 2050 load shapes for typical days, taking into account existing load, EV related load, and energy efficiency and demand response measures.8 Our assumed peak load including the impacts of added EV demand and energy efficiency is 3,030 MW in 2024, growing modestly to 3,120 MW by 2050.9
Figure 2: Representative Day Memphis Load Shapes and Components for 2024 and 2050
Because of its historic connection to the TVA, Memphis is tightly interconnected to the TVA transmission system, as shown in Figure 3 below. Connections to other regions such as MISO-
6 We use data from MLGW, the US Census, the Department of Energy, and the Department of
Transportation to simulate additional load from electric vehicles. We estimate EV charging program costs based on a study from the Rocky Mountain Institute and reports on pilot EV charging programs from the BMW Group and PG&E and DiUS. These assumptions are described in more detail in the Appendix.
7 We use data from an EPRI study and the TVA’s 2015 IRP to extrapolate the effect of energy efficiency on load shape in Memphis, and data from a study from the Lawrence Berkeley National Laboratory to estimate program costs. We model automated demand response based on a study from the Lawrence Berkeley National Laboratory and a conference paper from the 2006 ACEEE Summer Study on Energy Efficiency in Buildings. We estimate the impact of water heating demand response programs based on a 2016 report by Brattle economists. These assumptions are described in more detail in the Appendix.
8 We assume two types of demand response, peak-shaving and load-shifting. Peak-shaving demand response is assumed to reduce the simulated peak in the top 5% of load hours. Load-shifting demand response is dispatched by the model within operational constraints to reduce system costs.
9 MLGW’s peak load in 2017 was 3,107 MW, on the afternoon of July 26.

bratt le.com | 7
South (Entergy) and Alabama Power are much weaker, likely as a result of Memphis’s historic orientation towards the East and the TVA.
At present, the reliability of Memphis’ power supply is supported by TVA’s generation resources as well as its transmission system and the connections between TVA’s and MLGW’s own transmission system. From an economic perspective, continuing to rely on the strong existing transmission interconnections with the TVA likely provides the lowest cost option for Memphis solely from a transmission cost perspective. But given that it is unclear whether Memphis would have the ability to use the TVA’s transmission system after cancelling its power supply contract with the TVA, we focused our analysis on alternative power supply portfolios that do not need to use the TVA transmission system.10 MLGW’s ability to strengthen existing transmission to other areas is uncertain for a variety of reasons, especially in the near term. Accordingly, we have developed several portfolios for 2024 that can only rely on local generation as well as existing transmission infrastructure to areas other than the TVA and do not rely on the TVA transmission system. In the longer run, however, strengthening existing and building new transmission ties to adjacent regions is a viable option and we include the possibility (and estimated cost) of doing so in our 2050 portfolios.
Figure 3: Map of TVA Transmission System and Existing Generation, and Memphis Location
Source: U.S. Energy Information Administration, based on ABB (Formerly Ventyx)
As the map in Figure 3 shows, Memphis sits at the Western edge of the TVA system (in yellow). Geographically, Memphis is directly adjacent to Entergy’s service territory. In 2013, Entergy joined the Midcontinent Independent System Operator (MISO), an organized market and system operator that is also adjacent to other parts of the TVA system. As the dense web of transmission lines in
10 It is possible that the TVA could provide access to its transmission system and potentially other system
services under an alternative to continuing the current power supply contract with TVA. To account for this possibility, we include in our portfolios one option that does so.
Memphis

bratt le.com | 8
the yellow parts of the map show, Memphis is tightly interconnected with the TVA system. The current map, i.e., the current interconnections to the TVA and other systems as well as the location of power plants and Memphis’s geographic location all informed our choice of power supply alternatives to the current TVA supply.
In the next section, we present three portfolios of supply and demand resources that could provide reliable electricity supply to Memphis by 2024 at a power supply cost below the costs incurred by MLGW under the current TVA rate, which is approximately $0.075/kWh.11 In the subsequent section we will show how such portfolios could evolve towards (almost) fully renewable power supply portfolios by 2050. All costs herein are presented in 2017 dollars.12
III. 2024 Portfolio Options Our analysis and simulation of portfolio buildouts to 2024 suggest that it is possible for Memphis to become self-sufficient at a power supply cost substantially below the cost incurrent under the current contract with TVA, and that such portfolios of resources can be feasibly developed in that timeframe. Furthermore, our analyses show that Memphis could simultaneously achieve a share of renewables in its supply mix equal to 30% or higher while keeping the overall power supply cost well below the power supply cost incurred under the current TVA rate.
Through the iterative process described above, we identified three portfolios—which we refer to as “Cost-Minimizing Local”, “Local + RE”, and “Higher RE”—that typify a range of options.13 The makeup of the three portfolios is the following:
Cost-Minimizing Local: this portfolio is focused primarily on achieving self-sufficiency at the greatest savings relative to the costs incurred under the TVA rate by 2024, with some build-out of local solar PV. It includes the development or acquisition of gas-fired combined-cycle and combustion turbine units, as well as
11 See MLGW’s 2017 Annual Report (pp. M-3, M-13) 12 We understand that the actual rate the TVA charges to MLGW may not evolve with inflation. Also, the
composition of the rate may change, with a purely volumetric rate being replaced by multi-part rates over time.
13 According to the TVA, TVA’s emissions rate in 2017 was 851 lbs/MWh (https://www.tva.gov/Environment/Environmental-Stewardship/Air-Quality/Carbon-Dioxide, accessed November 18, 2018), roughly equivalent to the emissions of a mix of natural gas fired combined cycle and combustion turbine plants. The portfolios we assessed are a mix of natural gas and renewable energy sources. Hence, at the high end, the emissions rate of our 2024 portfolios is similar to TVA’s current rate. The more renewables-focused 2024 portfolios have lower emissions rates and all of our 2050 portfolios will achieve near zero carbon emissions.

bratt le.com | 9
the development of locally available utility-scale and distributed solar PV resources.14
Local + RE: this portfolio shifts the focus toward a lower-emissions set of resources, while still achieving self-sufficiency and cost savings. This is attained by developing 500 MW of local wind and 500 MW of four-hour-duration battery storage instead of one gas-fired combustion turbine that is included in the Cost-Minimizing Local portfolio.
Higher RE: this portfolio builds on the Local + RE portfolio by expanding the range of options for further developing renewable resources located outside of the local area/region, while considering the transmission limitations associated with those developments. We consider the addition of 500 MW of high-quality wind resources in MISO or the Southwest Power Pool (SPP) (west of Memphis) in addition to the local renewable resource and battery developments considered in the Local + RE portfolio. The generation from these resources would need to be sent over transmission lines crossing SPP and/or MISO south to be delivered to the Memphis area. We understand that at present Memphis has a relatively weak transmission interconnection with SPP and/or MISO South, which is the primary path into Memphis for western renewables in either SPP or MISO South.15 As such, we assume that relatively little western wind (a maximum of 200 MW in this portfolio) is deliverable to Memphis in any hour. The 500 MW of additional wind capacity we chose to add would utilize, on average, nearly the full 200 MW of assumed transmission capability. This portfolio achieves self-sufficiency and cost savings relative to the TVA rate, but the feasibility of development by 2024 may be less certain than for the first two portfolios, due to the potential need for transmission upgrades to deliver the remote wind resources to the Memphis area.
We summarize the portfolio capacity in Figure 4, and provide details on the resources added in each portfolio in Table 1.
14 TVA’s Allen plant, a natural gas fired combined cycle plant with 1,100 MW capacity, is located inside
MLGW’s footprint and would be an obvious candidate to provide some of the gas-fired capacity needed. However, we used the cost of newly constructed gas plants in our model to allow for the possibility that the Allen plant could not be purchased or only at a price equal to the cost of a new plant (the Allen plant is brand new and began operations in 2018).
15 Without a more in-depth transmission study, it is not clear how much transfer capacity is actually available over the existing interconnection to MISO. A feasible portfolio would therefore likely lie somewhere between the Local + RE and Higher RE portfolios.

bratt le.com | 10
Figure 4: Capacity Breakdown by Resource Type and 2024 Portfolio (MW)
Table 1: Summary of Evaluated 2024 Memphis Resource Portfolios
Resource Types Cost-Minimizing Local Local + RE Higher RE MW MW MW Local Combined Cycle 1,800 1,800 1,800 Local Combustion Turbines 1,400 1,050 1,050 Local Utility-Scale Solar 100 100 100 Local Distributed Solar 250 250 250 Local Wind — 500 500 Local Battery — 500 (2,000 MWh) 500 (2,000 MWh) Imported Western Wind — — 500
We have not assumed that any particular existing plant would be used in these portfolios. However, a new combined cycle plant, the Allen plant located very close to the City of Memphis, with a capacity of 1,100 MW, which began operations in 2018, could be a candidate for a substantial portion of the gas generation assumed in our portfolio. Because it is unclear whether or not the Allen plant could be purchased and if so at what cost, in our cost calculations, we have used standard industry costs for the construction of new plants rather than a hypothetical purchase of the Allen plant in case the contract with TVA is terminated.
A. Reliability and Emissions Our analyses show that all three 2024 portfolios could likely reliably serve Memphis’ electricity needs. Hourly production simulations of each portfolio show that the dispatchable resources (gas-fired generation, battery, and demand response) are able to balance the available renewable resources to meet demand around-the-clock. The three portfolios also provide for a sufficient capacity margin to reliably meet Memphis’ projected 2024 peak load, including assumed growth in EV demand. As we show in Figure 5 below, all three portfolios provide capacity margins in excess of 15%, taking into account the lower capacity value of renewables due to their

bratt le.com | 11
intermittency.16 The figure shows the capacity margin of each portfolio (black text) and the capacity required to meet the planning margin of 15% (red lines). The Cost-Minimizing Local portfolio achieves a 15% reserve margin. However, the objective of maintaining self-sufficiency while achieving higher levels of renewables by building battery storage and additional renewables in the Local + RE and Higher RE portfolios results in capacity margins above the 15% planning margin.17 As a consequence, the two portfolios with higher renewables result in somewhat higher cost alongside a somewhat higher reserve margin.
Figure 5: Expected Load Carrying Capability and Availability-Adjusted Capacity by Resource Type and 2024 Portfolio (MW)
The Local + RE and Higher RE portfolios also deliver increasing levels of renewable generation. As we show in Figure 6, the amount of Memphis load served by renewable generation increases from
16 The 15% reserve margin is consistent with the planning reserve margin used by TVA in their most
recent integrated resource plan. See: TVA 2015 Integrated Resource Plan p. 30.
The capacity value of renewables is often measured in terms of their effective load carrying capability (ELCC), rather than availability as for more conventional generating technologies. ELCC establishes the MW of load that can be met by adding an additional 1 MW of renewable capacity, which is to say the marginal contribution of renewable resources to meeting peak load.
17 Adding renewables and storage (to balance those renewable resources) increases the renewables share and offsets gas capacity. However, while battery storage adds capacity, it does not provide energy (it just shifts energy, and that with some losses). Also, the energy provided by renewables is not always aligned with load, even with added battery storage. As a consequence, meeting Memphis load in all hours with the generation resources in the portfolio does not allow reducing gas capacity in an amount equal to the added battery storage and renewable capacity. The results is a capacity margin in excess of the 15% planning margin.

bratt le.com | 12
3% in the Cost-Minimizing Local portfolio to 17% in the Local + RE portfolio and 26% or 32% in the Higher RE portfolio.18
Figure 6: Annual Generation by Resource Type and 2024 Portfolio (GWh)
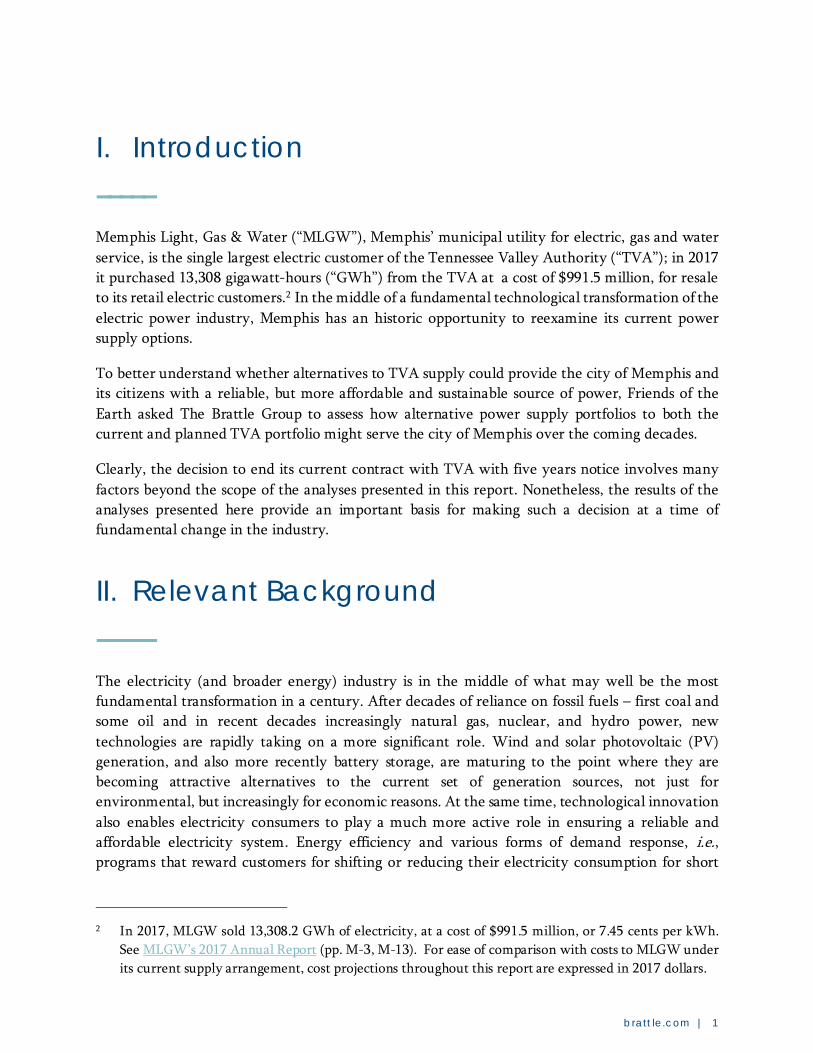
Figure 7 shows how the hourly use of resources in the portfolios during the peak day differs among portfolios with different amounts of renewable resources. Specifically, additional renewables displace gas-fired resources and increasingly make use of the flexibility provided by demand response and batteries.
18 The different measures of renewable penetration in the Higher RE portfolio reflects whether or not the
excess renewables not delivered to Memphis count towards the renewable share. On the low end, we do not include any excess renewables sold off-system in the renewable penetration calculation. On the high end, we include these renewable MWh. The high end essentially represents a model where Memphis retains the renewable attributes of generation not delivered to Memphis after selling energy (and capacity) that cannot be delivered to Memphis.
bratt le.com | 13
Figure 7: Peak Day Generation Profile for Each 2024 Portfolio (MW)
The peak day dispatch in the Cost-Minimizing Local portfolio is consistent with a system primarily based on gas-fired or other forms of thermal generation. The more efficient combined-cycle units are running consistently throughout the peak day, while less-efficient combustion turbines provide energy during higher-load periods to complement the solar output. Shifting demand response is used minimally to move energy away from peak periods, when it would be served by

bratt le.com | 14
the relatively more costly combustion turbines, to off-peak periods when there is otherwise unused combined-cycle capacity.
The peak day dispatch in the Local + RE portfolio reflects the addition of local wind and battery storage capacity. The local wind provides additional low-marginal-cost electricity that, when combined with the battery and flexible demand response, displace significant combustion turbine generation during the peak day.
The peak day dispatch in the Higher RE portfolio is shaped by the addition of 500 MW of wind to the system. This portfolio shows periods of surplus renewable supply that cannot be absorbed to be used later. Surplus western wind supply occurs when the assumed 200 MW of transmission between Memphis and MISO south is fully utilized and no more western wind can be delivered to Memphis. This surplus supply must be either sold off-system, or curtailed. We present the cost impacts of both possibilities when discussing portfolio costs in the next section.
We show in Figure 8, all three portfolios meet Memphis’ supply needs with a lower average carbon dioxide emissions rate (annual emissions divided by delivered energy) than what is associated with the TVA’s current power supply mix.19 The reliance on newer, more efficient gas generation in our evaluated Memphis portfolios results in lower emissions rate than TVA even in the mostly-gas focused Cost-Minimizing Local portfolio, and substantial reductions as we increase the level of renewables.
19 According to TVA, TVA’s emissions rate in 2017 was 851 lbs/MWh
(https://www.tva.gov/Environment/Environmental-Stewardship/Air-Quality/Carbon-Dioxide, accessed November 18, 2018).

bratt le.com | 15
Figure 8: 2024 Portfolio Average Carbon Dioxide Emissions Rates Compared to TVA
B. Portfolio Costs To assess the attractiveness of various alternative supply portfolios requires an assessment of how the costs of such portfolios would translate into costs to Memphis customers and how those costs compare to the costs that would be incurred if Memphis decided to continue its contract with the TVA.20
All three portfolios result in costs that are below the costs incurred under the current TVA rate. The cost of the Cost-Minimizing Local portfolio is equivalent to a rate of 5.0 cents per kWh, roughly two-thirds of the current TVA rate. The cost increases to 5.6 cents per kWh in the Local + RE portfolio, and to 5.6 to 6.0 cents per kWh in the Higher RE portfolio, depending on the price at which the surplus renewable energy generated with this portfolio can be sold, as depicted in rows [5] and [6] of Table 2.
20 The calculation of a cost metric that is directly comparable to the wholesale power supply rate currently
paid to TVA is complex and beyond the scope of this report. However, our financial model estimates annual electricity supply cost for each of our modeled portfolios by taking into account the longevity of each asset as well as typical financing arrangements and estimates average costs per kWh by dividing these revenue requirements by total demand.

bratt le.com | 16
Table 2: Generation LCOE and Margin for Other Expenses
Source: The Brattle Group Notes: All dollars are in $2017. Surplus Renewable Generation is assumed to be resold using energy prices for Entergy forecast by The Brattle Group in a June 2016 study at an average value of $44/MWh, which translates into $0.003/kWh of total assumed Memphis load..
Because some of the renewable capacity included in the “Higher RE” portfolio is assumed to be located outside of the Memphis footprint in MISO, we have calculated and included an estimate of transmission wheeling costs for this scenario. This increases the cost of the portfolio to 6.0 cents/kWh, adding about 0.1 cents/kWh to the portfolio cost. However, given the transmission constraints we have assumed between MISO and Memphis, there will be some surplus generation in MISO that could potentially be sold in MISO and more than pay for these wheeling costs. We estimate the market value of the excess renewables would be $38.6 million in 2024,21 which would lower the effective cost by 0.3 cents per kWh, reducing the “net cost” of this portfolio to 5.7 cents/kWh.
Thus, the average wholesale power supply costs of the three 2024 scenarios we analyzed range from 5.0 to 5.7 cents per kWh, or 23 to 32% less than the costs incurred under the current TVA rate. In terms of potential savings for Memphis ratepayers, this amounts to an annual cost of wholesale power supply between $240 and $333 million below projected power supply payments to TVA by 2024.22 Even assuming that renewable generation not deliverable to Memphis with the
21 The portfolio results in approximately 20% of Memphis’ overall renewable generation (876 GWh),
which we assume can be sold at an average price of $44/MWh. If the average price at which surplus energy can be sold is below $44/MWh, the effective cost of this portfolio would increase. At a price of $0/MWh, the portfolio cost would be equal to $0.06/kWh.
22 Note that this calculation implicitly assumes that MLGW’s load would be the same if MLGW were to continue to purchase its supply from TVA. However, it is not clear that the same level of investments
Cost-Minimizing Local Local + RE Higher RE2024 2024 2024
Benchmark TVA Cost $/kWh [1] 0.075 0.075 0.075
Portfolio CostsLevelized Generation Cost $/kWh [2] 0.050 0.056 0.059Approximate Wheeling Costs $/kWh [3] 0.000 0.000 0.001Value of Surplus Renewable Generation $/kWh [4] 0.000 0.000 0.003
Portfolio Cost excluding resale of excess Renewables $/kWh [5] 0.050 0.056 0.060Portfolio Cost including resale of excess Renewables $/kWh [6] 0.050 0.056 0.057
Savings Relative to Current TVA CostsSavings before Value of Surplus Renewables $/kWh [7] 0.024 0.019 0.015Savings including Value of Surplus Renewables $/kWh [8] 0.024 0.019 0.017Assumed Load GWh/year [9] 13,786 13,786 13,786Savings before Value of Surplus Renewables $ M [10] 332.9 259.2 201.5Savings including Value of Surplus Renewables $ M [11] 332.9 259.2 240.0
bratt le.com | 17
Higher RE portfolio cannot be sold, wholesale power supply costs would be approximately $200 million below annual payments to TVA.
We acknowledge that there could also to be some additional costs associated with incremental transmission investments within Memphis needed to connect new capacity to the existing Memphis network, as well as administrative costs associated with deploying and maintaining the technology and staffing needed to take over the management of Memphis’ power supply from TVA. While we have not explicitly estimated these additional costs, they are unlikely to even approach the $240-333 million in annual cost difference.23
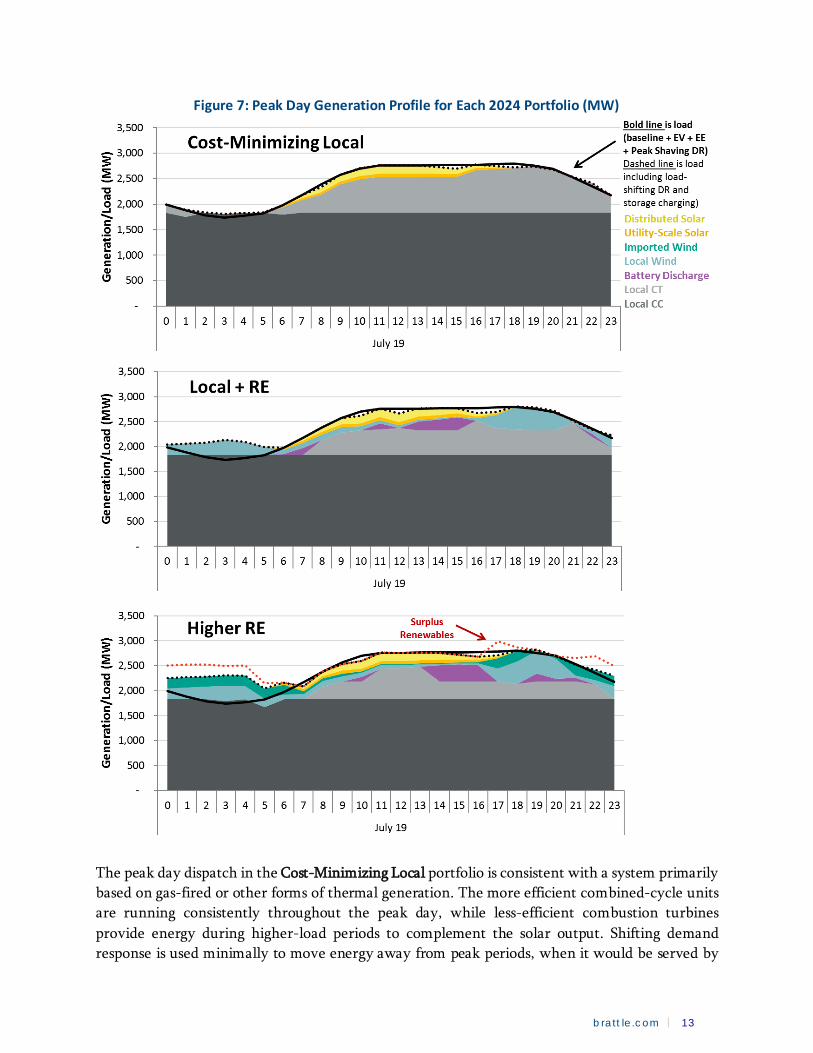
Figure 9 below summarizes the results from Table 2 in graphical format. We present two versions of the Higher RE portfolio: without and with the assumed market value of excess renewable generation taken into account. The graph also depicts the relative contribution of the various portfolio components to the total portfolio cost. In all cases, the dark blue bar associated with gas-fired generation (including both capital and operating costs) is the largest component. Smaller portions of the overall cost represent the costs associated with the costs of renewables and storage, the costs associated with demand-side programs, and, for the columns associated with the Higher RE portfolio, transmission wheeling costs. The horizontal red line represents the benchmark TVA costs, and thus the distance between the top of each column and the horizontal red line represents potential cost savings, some of which would be needed to cover incremental transmission and system operation costs as described above, but the bulk of which would likely accrue to the city of Memphis and MLGW’s ratepayers.
into load-shaving DR and EE technologies would occur under a continued power supply contract with the TVA. Therefore, load could be even higher if MLGW remained with TVA, meaning we may have understated the cost savings from maintaining the current TVA contract.
23 For example, these savings would be sufficient to finance local transmission and distribution system upgrades in the range of $3-4 billion. Our analysis does not take into consideration any potential one-time costs of terminating the current TVA contract.

bratt le.com | 18
Figure 9: Portfolio Costs by Source
Note: Cost-Minimizing Local and Local + RE scenarios do not result in excess renewable generation available for sale.
C. Other Considerations There are several other factors that Memphis might consider when assessing the relative merits of pursuing supply options like the ones we presented here versus continuing its current contract with the TVA. They include potential economic development impacts as well as the ability to avoid locking into long-term commitments at a time of a rapid transformation of the power and broader energy system.
Even though the current unemployment rate in Memphis is at an 18-year low, it remains among the highest in Tennessee and substantially higher than in other larger Tennessee cities such as Nashville. 24 Hence, the impact of any chosen power supply option on economic development opportunities for Memphis and Shelby County could be a relevant factor in choosing the City’s power supply.
There are two dimensions to assessing this economic development impact. First, to the extent an alternative power supply reduces energy costs, it would provide opportunities for economic activities, where the cost of electricity is important and thus could lead to the creation of additional jobs. It would also mean that Memphis residents would have more money left over to spend, with some of such spending in turn creating more economic activity in Memphis across many sectors.
24 See https://www.memphisflyer.com/NewsBlog/archives/2018/08/16/state-unemployment-rate-
historically-low-third-month-in-a-row

bratt le.com | 19
Second, different electricity supply portfolio strategies could have different impacts on direct, electricity related jobs in Shelby County. At present, it is likely that the Allen plant provides some employment in Shelby County directly related to the production of electricity. However, Memphis overall imports much of its electricity needs. Our portfolios assume a shift towards more local electricity production. In the short run (by 2024), this is driven in part by the relatively weak transmission links to adjacent markets, which requires that, for reliability reasons, a system that does not rely on TVA transmission produces more electricity locally. As part of local production, our portfolios also assume a shift towards more investments in local distributed solar (and potentially some local wind) and an increased emphasis on energy efficiency and demand response. Energy efficiency measures in particular have the potential to both lower the costs of electricity and create additional local economic activity. Energy efficiency measures typically require on-site labor, both for conducting energy audits as well as implementing energy efficiency programs, for example by improving insulation. 25 Rooftop solar PV tends to be more expensive than larger solar installations. However, one of the primary reasons for the cost difference is its higher installation cost, which in turn translates into higher (local) employment.26 Our 2024 portfolios also include some utility-scale solar PV capacity. Utility scale solar generation is likely to be associated with less employment than installing and maintaining distributed rooftop solar, but certainly creates more local employment than the TVA’s non-local generating resources.
Finally, ending the current contract with the TVA provides Memphis with an opportunity to position itself for a transition towards an electricity system that leverages the advances in several key technologies, all of which will tend to reduce both cost and emissions over time. We turn to discussing these longer term options next.
IV. 2050 Portfolios To better understand how its own power supply might evolve over time, we also developed several portfolios for 2050, mostly with a focus on a substantial increase in renewables deployment. The development of these higher renewable portfolios was shaped by the desire to investigate supply portfolios that, by mid-century, are capable of providing Memphis with essentially GHG free power supply. However, since the 2024 portfolios we analyzed provide an option, not an obligation to increase the share of renewables over time, when comparing the costs of these portfolios further
25 Nationwide, almost 900,000 jobs out of 1.9 million involved in energy efficiency technologies spent the
majority of their time on energy efficiency. According to one study, in 2016, Tennessee employed 27,529 workers in the energy efficiency area and ranked 25th in the nation on the ACEEE energy efficiency scorecard, suggesting significant untapped potential for additional energy efficiency and associated employment. (See Energy Efficiency Jobs in America, E2 and E4 The Future, December 2016.)
26 On average, each MW of installed rooftop solar PV was associated with 4.82 “field jobs”, as compared to 2.42 field jobs per MW of installed utility scale solar PV. (See Solar Foundation, 2017 National Solar Jobs Census)

bratt le.com | 20
below we also include the costs of an option that essentially maintains the cost-minimizing and gas-focused 2024 portfolio through 2050. As with our 2024 portfolios, we focused on portfolios that are capable of reliably meeting Memphis’ electricity needs, which we assume to include 50% penetration of EVs by 2050. Unlike our 2024 portfolios, we assume that in the ensuing 25 years it is possible to significantly strengthen the currently weak interconnections of Memphis to the west, where many of the Nation’s best renewable resources are located. However, we also developed a portfolio that relies primarily on the existing strong transmission interconnections to the TVA system and which would provide access to renewable resources in the East. The resulting portfolios thus represent a trade-off between using lower cost renewable resources and adding transmission on the one hand, and on the other hand using existing transmission to access somewhat higher cost renewable resources in the East.
We refer to the two portfolios as “Western RE” and “Eastern RE”:
Western RE: this portfolio focuses on the development of high-quality wind and solar PV in SPP and MISO, as well as local battery capacity to balance the timing of renewables availability and demand. This portfolio would require “wheeling” (transmitting) renewable power through SPP and/or MISO South and the development of additional transmission capability between Memphis and MISO South, or wheeling through the TVA system from MISO North in order to deliver the portfolio resources to Memphis.
Eastern RE: this portfolio focuses on the development of relatively higher cost wind and solar PV (lower wind speeds, less solar insolation) in eastern Tennessee. Due to the lower quality of the wind and solar PV, this portfolio requires the development of more renewable capacity to achieve the same renewable energy output as the Western RE portfolio. This portfolio also includes the development of local battery resources for renewables balancing. Memphis has strong interconnections with the TVA system, which itself has ample transfer capability. Thus, we assume these resources could be delivered to Memphis over the TVA system without the need for incremental transmission.
Both portfolios also include a local gas combined-cycle plant to meet load during longer-term stretches of low renewables output. One reason for this choice is that our 2024 portfolios also include significant gas-fired generation and it is possible that by 2050 this generation would still be capable of providing balancing power to Memphis. However, it is also reasonable to view the gas-fired combined cycle resource in these portfolios as a proxy for any number of resources that could serve the longer-duration and/or seasonal energy needs that would arise when meeting close to 100% of Memphis’ electricity needs with renewable resources. In the future, this need could be met by non-emitting alternatives, such as seasonal energy via renewable natural gas27 or other technologies as they develop and as the costs for those technologies fall.
27 We discuss seasonal issues below. Renewable Natural Gas is a term used to describe gaseous fuels derived
from renewable energy resources. Renewable Natural Gas can be “made” from renewable electricity via

bratt le.com | 21
We summarize the 2050 portfolio capacities in Figure 10, and provide details on the resources in each portfolio in Table 3.28
Figure 10: Capacity Breakdown by Resource Type and 2050 Portfolio (MW)
water electrolysis, which generates hydrogen, and by subsequently adding CO2 to make methane, or from anaerobic digestion of various farm residues. A key advantage of maintaining a gaseous fuel supply, if GHG free, is that it allows leveraging existing infrastructure such as gas pipelines, gas storage and gas fired generation and that fuel in gaseous form can be stored long term at relatively low cost.
28 These 2050 scenarios are not directly tied to the 2024 scenarios presented above, but intended to illustrate possible trajectories to a mostly-renewable Memphis power supply. The 2050 scenarios are most similar to the trajectory in the Higher RE 2024 scenario, though the mix of remaining local gas generation in 2050 would likely tend towards combustion turbines rather than the combined-cycle plant if the 2024 Higher RE portfolio were the starting point. They represent significant departures from the trajectory under the current TVA contract, which, as per TVA’s most recent integrated resource plan, does not anticipate full decarbonization by 2050.

bratt le.com | 22
Table 3: Summary of Evaluated 2050 Memphis Resource Portfolios Resource Types Western RE Eastern RE
MW MW Local Combined Cycle 1,100 1,100 Local Combustion Turbines — — Local Utility-Scale Solar 250 250 Local Distributed Solar 1,300 1,300 Local Wind — — Local Battery 1000 (2,000 MWh) 1000/(2,000 MWh) Imported Western Wind 3,370 — Imported Western Solar 2,425 — Imported Eastern Wind — 3,680 Imported Eastern Solar — 2,900
As we show in Figure 11, both portfolios provide a reserve margin at or above 15% deemed necessary for reliable power supply.29 The Western RE portfolio exactly meets the 15% planning margin target. Since the renewable capacity in the Eastern RE portfolio have lower capacity factors, generating the same amount of energy over the course of the year requires more capacity in the Eastern RE portfolio than in the Western RE portfolio. Since we assume the same capacity contribution of renewables in both portfolios, the Eastern RE portfolio results in a reserve margin above 15%.
Figure 11: ELCC/Availability-Adjusted Capacity by Resource Type and 2050 Portfolio (MW)
Note: ELCC (Effective Load Carrying Capability) is a common measure of the ability of a resource to contribute to providing electricity during the (net) peak demand. The ELCC of renewable resources decreases with penetration.
29 We assume that the much higher reliance on wind and solar PV reduces the ELCC of those resources
relative to 2024, and, thus, their contribution to Memphis’ reserve margin. We also assume the ELCC is the same for Eastern and Western wind and solar resources.

bratt le.com | 23
Both 2050 portfolios rely almost entirely on renewable generation to meet Memphis’ energy needs, with local gas-fired generation being used for backup power to provide the needed capacity to meet reliability requirements. As we show in Figure 12, the total available renewable generation in each portfolio would easily provide for 100% of Memphis’s needs. In fact, these portfolios produce renewable energy equal to 138% of the annual Memphis load.
However, the output profile from the renewable resources in either portfolio is not fully aligned with Memphis’ load, resulting in coincident renewable energy delivered to the Memphis area that meets 95% of electricity demand in the Western RE portfolio, and 89% in the Eastern RE portfolio.
We assume the excess renewable supply is either sold in the market where renewable resources are located (i.e., in MISO, SPP, or TVA), or curtailed. Though not delivered to the Memphis area, this surplus renewable supply could still be deemed to contribute to reducing electricity sector GHG emissions by displacing thermal generation elsewhere, as long as it is not curtailed. Furthermore, if Memphis owns the renewable resources (or has contractual rights to their output), it could retain the renewable energy credits generated by the excess supply and thus de-facto achieve 100% renewable energy powering Memphis by 2050.30
Figure 12: Annual Generation by Resource Type and 2050 Portfolio (GWh)
Compared to our 2024 portfolios, the dispatch of the system is substantially altered by a shift towards 100% renewable energy by 2050. In Figure 13 below, we show a representative spring day with the higher renewables portfolios. On this day, Memphis’ load is met in every hour of the day by 100% renewable generation, even during the nearly 2,000 MW ramp down of solar in the late
30 As long as surplus renewable energy displaces fossil generation, such generation still contributes to
lowering overall GHG emissions in the electric sector, although only if measured over a broader geographic footprint. Including this surplus renewable energy in the calculation of the percentage of Memphis load that is served by renewable energy (even if it is not delivered to Memphis) would mean that Memphis generates an amount of renewable energy in excess of its total electricity demand.

bratt le.com | 24
afternoon. Doing so requires harnessing the full range of flexibility options available, from shifting demand from periods of lower renewables output to periods of higher renewables output, to discharging the battery to meet ramping needs.
Figure 13: Representative Daily Generation Profile for Higher Renewables Portfolios
Consequently, the 2050 portfolios result in a (nearly) carbon-free Memphis supply mix, depending on the treatment of surplus renewable generation. We show in Figure 14 below the most recent average emission rate (annual emissions divided by delivered energy) reported by TVA as well as the projected 2033 TVA emissions rate compared to the two 2050 portfolios.31 We also note that the emissions shown here for each portfolio could be even lower if the gas-fired generation uses renewable natural gas.
31 TVA’s emissions rate is also projected to decline over time. TVA’s Target Power Supply (TPS) in its 2015
IRP (pp. 202-204) is projected to reduce average system emissions from 851 lbs/MWh in 2017 to between 420 lbs/MWh and 715 lbs/MWh by 2033. However, the pace of change in TVA’s supply mix from fossil generation to renewable generation would need to increase considerably between 2033 and 2050 compared to the prior period if TVA were to achieve the supply emissions reductions contemplated in our Western RE and Eastern RE portfolios.

bratt le.com | 25
Figure 14: 2050 Portfolio Average Carbon Dioxide Emissions Rates Compared to TVA32
Note: Assumes residual gas-fired generation uses fossil natural gas and that surplus renewable energy is not counted against Memphis emissions.
A. Transmission Considerations Both portfolios assume the existence of and access to sufficient transmission to import power from regions with more favorable renewables resources to Memphis. Wind resources in MISO and SPP tend to be preferable to those in MLGW’s current footprint (and in fact most of the country). Similarly, solar resources in parts of SPP tend to be among the best in the Eastern Interconnection. The difference, in terms of cost, are substantial enough that renewables development in such remote locations can be more economically attractive than developing resources locally (assuming that resources of this scale could be developed locally, which is doubtful), provided the cost of transmission does not fully offset the energy cost advantages.
As we mention above, we understand that Memphis currently owns some limited direct transmission connections to MISO South.33 Fully delivering the lower-cost renewable resources in the Western RE portfolio to the Memphis area would therefore require a substantial increase in the transfer capability between Memphis and MISO.
32 In its most recent IRP filed in 2015 TVA does not project its supply emissions rates out to 2050. As such,
for 2050, we compare our portfolio emissions rates to a range of potential 2050 TVA system emissions rates. The high end of the range is TVA’s current rate of 891 lbs/MWh. The low end of the range is TVA’s low end estimate of its 2033 emissions rate for the Target Power Supply in its 2015 IRP. See the TVA 2015 IRP, pp. 202-204.
33 For the purpose of developing illustrative power supply portfolios we have assumed this capacity to be 200 MW.

bratt le.com | 26
We recognize that transmission raises various technical, regulatory, and legal complexities that are beyond the scope of this report, and that further analysis will be needed to decide on an optimal way to develop renewables for MLGW. Nevertheless, we have carried out our analyses assuming that the most likely pathways for developing renewables beyond MLGW’s immediate footprint are (1) adding transmission with MISO to increase transfer capability, and (2) purchasing network service from TVA. We discuss these options, as well as other alternatives, in this section.
One option is to significantly strengthen the transmission interconnection with MISO – the RTO to the immediate south and west of MLGW– to increase the capability to import lower cost renewables from MISO (and/or regions further westward, namely SPP).34 Given the geographic proximity between Memphis and the MISO system (both Entergy Arkansas and Entergy Mississippi own several substations within miles of MLGW-owned substations), the development of additional interconnections should be feasible. Engineering analyses of both the development costs associated with additional connections as well as the resulting changes to power flows would be needed to know how cost effective this option would be. For our Western RE portfolio, we have assumed a significant strengthening of the connection between MLGW and MISO, and relied on cost estimates from several other short-distance transmission projects in developing an approximation of the cost of such an investment. We have also incorporated an estimate of the cost of wheeling power from both SPP and MISO to MLGW. Details are provided in the Appendix.
A second possibility, which we have assumed in our Eastern RE portfolio, is to develop renewable generating capacity elsewhere in the TVA footprint and to purchase network transmission service from the TVA.35 For the purpose of our analysis, we have assumed that this is feasible at the Open Access Transmission Tariff (OATT) rates for firm point-to-point transmission service published by
34 The regional differences in renewables costs and performance can be significant. For example, the
average capacity factor of wind projects built in Tennessee between 1998 and 2016 was 18.3%, compared to capacity factors above 40% or higher for wind projects built in the same time frame in Oklahoma, Kansas or Nebraska. These differences are reflected in recent power purchase agreement (PPA) prices for wind contracts in the Interior (MISO and SPP) around $20/MWh (including the benefit of the Production Tax Credit) as compared to PPA prices closer to $40/MWh in the Southeast. See U.S. Department of Energy, 2017 Wind Technologies Market Report, Figure 50 and page 65.
35 As discussed in the context of our 2024 portfolios, it may not be possible for Memphis to use the TVA’s transmission system at least initially after canceling its contract with the TVA. However, we assume that in the long run TVA transmission is available for the purpose of constructing an alternative 2050 portfolio based on renewable resources primarily located in the Eastern United States. While we did not investigate portfolios that mix renewable resources over an even broader geographic footprint, it is possible that constructing such a portfolio would result in lower costs than either of the two portfolios we present, in part because of the additional generation diversity that could be created by such a portfolio.

bratt le.com | 27
the TVA. 36 Again, the detailed assumptions we used are discussed in further detail in the Appendix.
A third option for MLGW to cost-effectively benefit from remote renewables development would be to participate in a dedicated transmission line such as the Southern Cross Project, which is a high voltage direct current (“HVDC”) line that will deliver as much as 2,000 MW of wind energy from Texas to customers in the Southeast.37 These types of dedicated line projects avoid RTO wheeling costs and have less electric losses than an equivalently sized alternating current (“AC”) system. While HVDC lines require narrower right-of-way footprints (which all things equal, can facilitate permitting and siting processes), these long-distance projects often need to clear regulatory and permitting hurdles in multiple jurisdictions before construction can begin. Further, HVDC lines are generally costly. Any renewables using such HVDC transmission facilities would need to pay for the use of such lines, which could significantly offset any value from accessing low cost remote renewables, compared to renewable generation located locally in or near Memphis.
Yet another option is physically integrating into MISO South. Much of Entergy’s operating companies, including Entergy Arkansas and Entergy Mississippi, integrated into MISO in 2013, realizing cost reductions in the process, MLGW could explore this option. It would likely require similar or perhaps even greater levels of incremental transmission investment as that assumed in our 2050 Western RE scenario, but it would also allow for cost savings as MLGW could avoid costs associated with being its own balancing area.
B. Indicative Costs Our analysis shows that (near) 100% renewable power supply portfolios, in combination with the use of flexible demand side resources, energy efficiency, battery storage and some residual traditional generation technology, result in average wholesale supply costs that, under certain assumptions, are similar to the costs associated with a more conventional portfolio comprised of mostly gas-fired resources, particularly when considering the fuel price and emissions cost risks associated with such a portfolio.38
36 For the purpose of our analysis we assume that Memphis would be able to obtain transmission services
from TVA under its OATT. 37 See http://southerncrosstransmission.com/ for details. 38 We provide an estimate of the costs associated with a 2050 gas-focused portfolio as a conservative
reference point against which to compare the renewables-focused Western RE and Eastern RE portfolios. The gas-focused portfolio costs are derived from our 2024 Cost-Minimizing Local portfolio simulation results with adjustments to provide for increases in the gas price and total demand, and decreases in the capital costs of gas resources, between 2024 and 2050.

bratt le.com | 28
Figure 15: Indicative Average 2050 Portfolio Cost by Source
The costs of our fully renewable portfolios are highly dependent on “integration” and transmission costs as well as on the ability to sell surplus renewable energy; for each of the 2050 portfolios we have presented cost estimates with and without the expected value of selling excess renewable generation in a neighboring market. For reference, Figure 15 also includes a fifth cost projection, which corresponds to the expected cost in 2050 of a generation portfolio that would be essentially identical to the Cost-Minimizing Local portfolio presented for 2024.
Given the significant uncertainties related to both the cost of building additional transmission and to the projected cost of both wind and solar by 2050, the cost of either of the renewables-focused portfolios could exceed the cost of a Gas-Focused portfolio.39 However, not only could the cost of a gas-focused portfolio be higher under different future assumptions of fuel and emissions prices, the cost of our 2050 renewable-focused portfolios could also be substantially lower if cost declines of the technologies that make up these portfolios exceed expectations. As shown in Figure 16, both wind and solar costs at the low end of the forecast range could be one third lower than our assumption, which is based on the “Mid” scenarios in the figure below.
39 The projected decline in the cost of renewables is due in large part to projected declines in capital costs.
In the case of wind, it is also partially driven by projected improvements in capacity factors from renewable resources. These can be significant; for example, according to NREL’s 2018 Annual Technology Baseline, the net capacity factor for a medium-quality wind resource is expected to increase from 38% in 2018 to 49% in 2050. We have conservatively not incorporated these capacity factor improvements into our 2050 modeling scenarios.

bratt le.com | 29
Figure 16: Range of LCOEs across NREL Assumptions
Notes: LCOEs are calculated using NREL ATB’s low and mid scenarios for capacity factors, overnight costs, and Fixed O&M.
A second reason why our 2050 cost projections could be conservative is that the portfolios rely on gas-fired conventional generation to manage mismatches between renewable supply and Memphis demand that cannot be met with the flexibility provided by the modeled levels of demand response and battery storage. This is due to the fact that with current technologies managing longer term (seasonal) swings in systems with very high shares of variable renewable resources such as wind and solar PV remains a challenge. Accordingly, this is an area where advances in technology not currently known would have a particularly significant impact and the cost of our 2050 renewables-focused portfolios could be lower if lower cost alternatives to managing seasonal and longer term issues emerge.40
40 For example, advances in water electrolysis – the process of using electricity to convert water into
hydrogen and oxygen – are leading to increasing interest in “renewable” natural gas, which, as mentioned above, can be further converted to methane by adding waste CO2 and thus be used as a carbon-neutral drop-in alternative to current natural gas, or could be directly re-converted into electricity through a fuel cell, a technology that is also seeing significant technological progress. The advantage of both hydrogen and other forms of renewable natural gas – which can also be made from livestock operations through the use of anaerobic digesters – is that the “fuel” itself is carbon neutral and can be stored cheaply for long durations, making it potentially suitable to solve the longer-term mismatches between renewable generation and demand that emerge in our 2050 portfolios. Whether renewable natural gas or another long-term storage option will be the most economical solution is as of yet unknown and unknowable.

bratt le.com | 30
However, one of the benefits of the portfolios we examined is that they can be built incrementally. Depending on both the appetite, at the local, state and national level, for deeper cuts in GHG emissions, and the evolution of the cost and performance of current and emerging technologies, the transition to more renewables could stop at some point or take another path. One of the big advantages of solar and wind, when compared to more traditional resources such as large coal, gas and nuclear generating assets, is that they can be deployed in relatively small increments. At a time of significant uncertainty about where costs (and policy) might go, this flexibility to decide incrementally how to develop Memphis’ power supply represents a non-trivial benefit. Finally, as discussed next, there is likely some risk associated with staying with the TVA that (real) costs will not remain flat over the next 25 years.
V. Risks of Staying with the TVA versus Alternative Supply
The above analyses indicate that there are several near term and longer term options for Memphis to construct portfolios of increasingly sustainable supply and demand resources that can meet Memphis’ electricity (and increasingly transportation energy) needs reliably and at a cost substantially below the costs incurred under the TVA’s current Memphis rate of approximately 7.5 cents/kWh.
A straight comparison of expected costs is only appropriate if the risks associated with various supply options, including a continuation of the contract with TVA, are comparable. However, it is likely that there are substantial differences in risk both across the portfolio options we analyzed and between those portfolios and the contract with the TVA.
The differences in risk are related to three factors: long term commitments at times of rapid technological change, the relative proportion of capital and fuel costs and resulting exposure to long-term fuel price volatility; and exposure to potential liabilities associated with past decisions.
When technological change is rapid, long-term commitments reduce the option to take advantage of opportunities that arise as a consequence of technological change. Resource options that result in long-term commitments, whether contractual or in the form of investments into long-lived assets, therefore limit the ability to take advantage of opportunities like those associated with rapidly decreasing costs of various supply and demand options. Reliance on new gas-fired generation is therefore generally a downside of the 2024 portfolios we analyzed. This reliance is likely necessary to provide enough near-term capacity to meet Memphis’ electricity demand reliably by 2024. Given the weak transmission connection to areas other than TVA, this risk can only moderately be mitigated by relying on imports. We have not assumed any imports from resources other than those that would be either at least partially owned by MLGW or be essentially under a long-term contract. To the extent possible, commitment risks could therefore be reduced by relying, to the extent possible, on shorter term market transactions for part of Memphis’ power supply going forward. In theory, continuing the contract with TVA could also provide some

bratt le.com | 31
flexibility to the extent the TVA’s own resource planning carefully considers “lock-in” to technologies that are at significant risk of being out-of-market as renewable energy resources (and associated flexibility solutions) become more cost-competitive. However, at least as of its most recent integrated resource plan, the TVA remains committed to its existing nuclear fleet and a gradual replacement of coal with gas-fired generation. Hence, it is likely that from a technology lock-in perspective, both a continued contract with the TVA and a fully self-reliant 2024 alternative Memphis supply portfolio will result in substantial lock-in. In the case of Memphis alone, this lock-in would be for gas-fired (and to some extent current cost renewable) generation. Memphis could mitigate this risk somewhat by a) emphasizing investments in energy efficiency and demand-side flexibility that reduce or avoid making substantial supply-side investments; b) maximizing the use of shorter-term market transactions, for example to provide various balancing services and perhaps a portion of energy and capacity needs; and c) potentially reducing the period over which new gas-fired generation is being amortized or using a mix of more combustion turbines rather than combined cycle turbines, the former having lower capital but higher operating expenses. All of the above could increase the near-term cost of an independent power supply somewhat, but would allow Memphis to transition more rapidly to more renewable and flexibility resources over time and thus take advantage of technological progress.
A second potential source of risk differences among the portfolio options we evaluated and between those options and a continuation of the TVA contract lies in the relative split of supply costs into capital and fuel. At present, natural gas prices in the United States are at historic lows. Low gas prices lead to new gas-fired generation being able to outcompete coal (and nuclear) generation resources in many cases. However, reliance on fuel, and in particular natural gas, also creates exposure to price volatility. At present, the average resource cost of various renewable resources is in many cases already equal or below the cost of new gas-fired generation. However, the variability of renewable resources requires managing the mismatch between renewable production and demand. In a larger and tightly interconnected system, this “balancing” is often achieved through market purchases. However, to demonstrate the cost and viability of a short term system that does not rely on new or the use of existing TVA transmission, we assume that this balancing needs to be achieved through battery storage or additional gas-fired capacity, which limits the amount of renewable energy resources that can be brought online quickly.
The resulting 2024 portfolios therefore do expose Memphis to the risk of significant increases in gas prices. Again, this risk is somewhat mitigated in the portfolios that include more renewables early, even though, as shown above, adding more local and remote renewables increases the expected cost to Memphis, i.e., results in a higher wholesale power supply cost, all else equal. The difference in costs of portfolios with higher renewable shares by 2024 can therefore be seen as an insurance premium against the risk of higher future gas prices. Continuing the contract with the TVA would similarly expose Memphis to gas-price related risks.41 This is because, in its most recent
41 The exposure to gas price volatility would be lower since gas fired resources represent a smaller share
of overall supply by TVA than they do in all of the alternative 2024 portfolios we evaluated and since

bratt le.com | 32
IRP, TVA has identified natural gas as the preferred technology for future generation needs.42 The exposure to gas price risk in the alternative portfolios we evaluated could also be mitigated by relying on more short-term market transactions, should they be available.
Finally, there are likely also significant risks associated with the TVA’s supply portfolio. Some of these risks relate to investments made by the TVA in the past and some relate to investments that the TVA might make in the future. In fact, part of the reason why the alternative power supply portfolios we evaluated cost less than TVA’s current Memphis rate is that technological progress and changes in fuel costs have likely resulted in some of the TVA’s past investments being “out of the money.” In general, it is not surprising that, after the fact, at least some investments made in the past turn out to be more costly than new supply options that arise over time. Our analysis is entirely focused on power supply costs and does not evaluate to what extent the choice of an alternative power supply would insulate Memphis from risks associated with past investments by the TVA.
However and in addition, it is also likely that the TVA’s future investment decisions could produce some risks that should be considered. For example, a continued emphasis on retaining coal fired generation and/or retaining or increasing exposure to nuclear power could well entail the creation of substantial new stranded cost risks.43 A continuation of the contract with the TVA would likely expose MLGW to risks associated with such investments. A power supply portfolio based on natural gas and renewable and battery storage, on the other hand, likely entails fewer “unknown” risks and largely renewable-focused portfolios would essentially eliminate all fuel price risks. In particular, to the extent Memphis evolves its portfolio of resources from 2024 towards a mostly or entirely renewable energy mix by 2050, it will be able to take advantage of emerging opportunities to lower both costs and risks. Most of the emerging technologies we analyzed, solar PV, wind, battery storage, demand response and energy efficiency, can be implemented in relatively small increments and thus avoid the large risk of creating stranded costs when making investments in lumpy (i.e., large) long-lived assets such as nuclear or other large central power station technologies.
Lower borrowing costs may provide opportunities to lower the costs of owning a future supply portfolio relative to the financing assumptions we made. We should point out that this opportunity may arise independent of the project risks associated with any given project, but simply because Memphis’s status as a tax-exempt municipal borrower, which can provide access to tax advantaged
any single investment by TVA in new gas fired generation would be shared among all of TVA’s customers. However, this does not mean the overall risk of the TVA supply portfolio is lower, as discussed next.
42 TVA’s 2015 IRP recommended portfolio includes between 3,900 MW and 5,500 MW of new gas-fired resources by 2033 (see pp. 116-117).
43 The cost overruns associated with Southern Company’s Vogtle nuclear power plant project, which have led to an approximate doubling of the costs from $14 to $29 billion, provide one recent indicator of the potential risks associated with such investments. See https://www.powermag.com/cost-overruns-at-vogtle-expected-to-soar/ (accessed January 2, 2019)

bratt le.com | 33
financing not available to others. In other words, for any given project risk, Memphis may have a lower cost of financing than private borrowers.
We have not examined this possibility in detail, but rather present some sensitivities to illustrate the potential upside, which is particularly important given the capital-intensive nature of both the 2024 and 2050 portfolio options presented here. Our base financing assumptions include a 50% debt fraction and a nominal interest rate on debt of 4.0%. In Table 4, we present indicative costs (not including any revenues from surplus renewable generation) under two variations on these assumptions. In the first, we assume a lower interest rate on debt (3.4%), while in the second we also increase the debt fraction to 70%, which takes further advantage of the lower debt cost. As displayed in Table 4, these alternative assumptions reduce the levelized costs of the portfolios by anywhere from 0.4 to 1.0 cents per kWh.
Table 4: Borrowing Cost Sensitivity
Source: The Brattle Group Notes: All dollars are in $2017. Portfolio costs do not include any revenues from surplus renewable generation sold. Municipal debt rate was determined by using the yield for US Public Power AA rated municipal bonds according to Bloomberg.
We also note that the opportunity to take advantage of tax-advantaged financing terms may play into the “make or buy” decision, both with respect to longer term transactions like long-term PPAs and shorter-term decisions about whether to build and own new resources versus buying energy and capacity on the market and thus avoiding the risks associated with locking in some longer-term investment decisions.
VI. Conclusion In this report we have outlined several near term and longer term alternatives to MLGW continuing its current contract with the TVA. Since the contract terms with the TVA require a five year termination notice, we developed alternative supply beginning in 2024, which is consistent with MLGW giving the TVA notice in 2019.
The basic conclusion is that the combination of technological progress for renewables and battery storage and low natural gas prices mean that Memphis could likely end its TVA contract and construct a portfolio of resources by 2024 that could reliably meet Memphis’ power supply needs at a power supply cost substantially – between $200 and $344 million per year or up to one third- below those currently incurred by Memphis’ under the current TVA rate. Especially for the near
Cost-Minimizing Local + RE Higher RE Western RE Eastern RE Gas-Focused2024 2024 2024 2050 2050 2050
Standard Corporate Rate: 50% Debt Fraction, 4.0% Debt RateTotal Portfolio Cost ($/kWh) 0.0504 0.0557 0.0599 0.0898 0.0878 0.0537
Municipal Rate: 50% Debt Fraction, 3.4% Debt RateTotal Portfolio Cost ($/kWh) 0.0498 0.0550 0.0591 0.0887 0.0865 0.0533
Municipal Rate: 70% Debt Fraction, 3.4% Debt RateTotal Portfolio Cost 0.0464 0.0507 0.0542 0.0814 0.0779 0.0504

bratt le.com | 34
term, the prioritization of renewables over natural gas depends on MLGW’s (and Memphis’) desire to maximize the use of renewable resources early. Doing so would likely increase the cost to Memphis customers somewhat. However, it would also reduce exposure to gas-price volatility and avoid, to some extent, construction of new gas-fired generation when, over the coming decades, it is possible that renewables and storage will become both more economically attractive and environmentally sustainable alternatives.
We also show that any of the 2024 portfolios could transition over time to an essentially fully renewable system by 2050. This would leave time to build additional transmission to adjacent areas to take advantage of the huge resource potential for low cost wind and solar in the center and southern United States. It would also permit a system that, through stronger interconnections, would likely significantly lower the cost of balancing a Memphis system increasingly characterized by variable generating resources such as wind and solar PV. This is because being interconnected with other regions would not only allow taking advantage of cheap and abundant wind and solar resources, it would also allow better balancing the overall regional system due to variations in both supply and demand across a larger geographic footprint. We evaluated systems that rely essentially on local self-sufficiency entirely because new transmission takes many years to be built and TVA’s existing transmission infrastructure may not be available should Memphis decide not to renew its expiring contract. Hence, especially the 2050 portfolios we evaluated likely involve estimated costs at the high end of the range and could be significantly lower if Memphis becomes (or remains) embedded in a tight regional network and market.

bratt le.com | 35
VII. Appendix – Detailed Description of Methodology and Assumptions A. Portfolio Construction Approach
We took an iterative approach to constructing the resource portfolios from the variety of options considered in this study. As described above, the aims of the portfolios are to achieve self-sufficiency with most or all energy coming from Memphis-owned or contracted resources and a higher share of renewables while keeping the resulting power supply cost low, ideally below the power supply costs associated with the current TVA rate. We also analyzed the reserve margin for each developed portfolio to ensure that it was at least at the traditional planning level of 15%.
We summarize our iterative portfolio development process in Figure 17.
Figure 17: Flow Chart of Portfolio Development Process
B. Resource Assumptions 1. Generation Costs
a. Overnight Costs
We used overnight costs from NREL’s 2018 Annual Technology Baseline (“NREL ATB”) for each resource with the exception of battery storage. In all cases, we used the “Mid” scenario and assigned resources to a particular NREL techno-resource group based on their location and estimated

bratt le.com | 36
capacity factor. Costs were reported in 2016 dollars, but we inflated NREL ATB costs to 2017 dollars using the consumer price index (CPI). This method was used for natural gas combined cycle plants (CCs), utility scale solar, distributed solar at both residential and commercial locations, and onshore wind. For battery storage, overnight cost projections were based on a Brattle review of industry projections from various sources. The projections used in our model approximately represent the mid-point of those projections.
b. Fixed O&M
Similar to overnight costs, we used the NREL ATB’s “Mid” scenario in projecting fixed O&M costs for all the technologies listed above, as well as for battery storage.
c. Renewables Generation Profiles
We estimated renewable generation profiles for solar and wind at various locations using NREL’s “Wind Integration Data Set” and “Solar Integration Data Set.”
d. Operating Costs – Gas Generation
The operating costs of gas generation consist of three components:
1. Fuel costs are calculated by multiplying the plant heat rate in MMBtu/MWh by the output of the plant in MWh, then by the fuel price in $/MMBtu. For the combined cycle (CC) units, we use a generic heat rate curve scaled to the fully-loaded heat rate of 5.97 MMBtu/MWh based on a GE7HA CC plant in 2x1 configuration, which is representative of new-build CC heat characteristics. For the combustion turbines (CT), we use a single heat rate of 9.27 MMBtu/MWh based on the fully-loaded heat rate of a GE 7HA.02 turbine. We used the EIA’s Annual Energy Outlook 2018 for projected natural gas prices at Henry Hub. We then adjusted these prices for Memphis based on the historical average ratio of spot prices between Henry Hub and the nearby Texas Gas Z 1. The average ratio was computed by analyzing historical average daily prices differentials on over the last five years from SNL Financial.
2. Variable operating and maintenance (VOM) cost are calculated by multiplying the VOM rate in $/MWh by the output of the plant in MWh. For the CCs, we use a nominal VOM rate of $2/MWh based on the EIA’s estimate for an Advanced Natural Gas Combined Cycle unit, provided in its November 2016 “Capital Cost Estimates for Utility Scale Electricity Generating Plants.” We inflated this cost to 2017 dollars using the CPI. For CTs we used a VOM rate of $1.1/MWh in 2022 dollars, based on a prior Brattle analysis of CT O&M costs.44 We deflated these numbers to 2017 dollars using the CPI.
3. Startup cost are calculated by multiplying the number of times a plant starts up by its startup cost rate in $/start. We assume generic startup costs representative of new CC and CTs of $35/MW/start and $10/MW/start, respectively.
44 See Brattle’s 2018 PJM Cost of New Entry Study, pp. 30.

bratt le.com | 37
The number of starts and the output levels of the generators in each hour are determined by the operational simulations we conducted using PSO.
e. Transmission Costs
The two main costs associated with transmission are:
1) The costs of wheeling remote renewable energy to Memphis; and 2) The costs of upgrading transmission to increase the amount of power that can be imported
into Memphis at any given time.
Both are costs that are relevant for renewable generation located outside of Memphis’ immediate footprint. The first cost associated with remote renewable energy is wheeling the energy over existing transmission lines to Memphis. In order for power from renewable resources located in SPP to reach Memphis, Memphis would need to pay the relevant OATT rates in both SPP and MISO. Resources located in MISO would only need to travel through MISO to get to Memphis thus Memphis would only pay the MISO wheeling rates. We assigned remote renewable resources sited in TVA the TVA network rate.
The only scenario that required transmission upgrades is the Western RE scenario for 2050. To estimate the cost of these transmission upgrades, we first estimated the $/MW cost of upgrading a transmission line. Relying on S&P Global’s Transmission Projects database, we examined the range of project costs for lines of various sizes; the 75th percentile of project costs for short-distance (30 miles or less) 161 kV lines is approximately $34.8M per line. We assumed that building 10 such lines would generate approximately 3,000 additional MW of transfer capacity. The required upgrade amount is the maximum annual import of the scenario (3,297 MW) less the assumed existing transmission capacity from MISO into Memphis (approximately 200 MW).
2. Demand-Side Resources We model peak-shaving demand response, which reduces the load in the top 100 hours of baseline load to the load in the 101st highest load hour. This results in a maximum load reduction of about 292 MW. We also model a water-heating demand response program for residential customers, as well as lighting and HVAC demand response programs for commercial customers. We estimate the maximum potential load impact and program costs (on a per-participant basis) of the commercial demand response programs based on a 2017 report from the Lawrence Berkeley National Laboratory, “2025 California Demand Response Potential Study – Charting California’s Demand Response Future: Final Report on Phase 2 Results,” by Alstone et al.; and a conference paper from the 2006 ACEEE Summer Study on Energy Efficiency in Buildings, “Strategies for Demand Response in Commercial Buildings,” by Watson et al. We estimate the scope and cost of the residential water heating program based on a 2016 report by Ryan Hledik, Judy Chang, and Roger Lueken, “The Hidden Battery – Opportunities in Electric Water Heating.”

bratt le.com | 38
We used demographic information for each customer segment from MLGW. We assume 20% participation of Memphis residential customers in the water-heating program in 2050 and 5% participation in 2024. We assume 20% of commercial customers in the HVAC and lighting programs in 2050 and 5% participation in 2024.
C. Load Assumptions 1. Electric Vehicles
We model electric vehicle load using customer numbers from MLGW, demographic data from the US Census American Community Survey and US Department of Transportation Federal Highway Administration, and Tennessee-specific charging profiles from the Department of Energy’s EV Project. We assume half of electric vehicle charging is done at home and half is done away from home. In our 2024 model, we assume 10% electric vehicle penetration. In our 2050 model, we assume 50% electric vehicle penetration. We note that we made these assumptions to reflect the realistic possibility that significant electrification of transport will occur. Different assumptions about the degree of electrification would not fundamentally alter our conclusions.
2. Energy Efficiency We estimate the energy efficiency (EE) potential for Memphis in each study year by extrapolating from projections of state-level EE potential published in an EPRI study.45 This analysis assumes that EE potential as a percentage of baseline load is the same for Memphis as for Tennessee as a whole and that the growth of existing EE programs (proportional to new programs) is the same for Memphis as for Tennessee as a whole. We assume that 50% of EE potential is achieved.
We model the effects of EE on annual load shape using modeling results from the TVA’s 2015 IRP, Appendix D. We assume EE potential is distributed across months according to TVA’s modeled monthly distribution of EE potential in 2023. The hour-of-day distribution of the EE potential is derived from the TVA’s projected typical daily profile of EE potential in 2023.
We estimate the cost of EE to program administrators in Tennessee by averaging the same for all neighboring states included in a study by Hoffman, et al. from the Lawrence Berkeley National Laboratory.46 We assume that the program costs in Memphis (on a per-KWh basis) are the same as for Tennessee as a whole.
45 State Level Electric Energy Efficiency Potential Estimates: EPRI, Palo Alto, CA: 2017. 3002009988. 46 Hoffman, Ian M., et al. "The Cost of Saving Electricity Through Energy Efficiency Programs Funded by
Utility Customers: 2009–2015." (2018).

bratt le.com | 39
D. Other Operational Assumptions When calculating the reserve margin in each portfolio, we de-rated the capacity of gas resources by an assumed 5% equivalent demand forced outage rate (eFORd), which is a measure of generator availability when needed by the system. Similarly, we de-rated energy storage, demand response, and renewable capacity using assumed ELCCs to capture the availability of those resource types for meeting demand when needed. Energy storage is assumed to have an ELCC of 90% and demand response and ELCC of 80%. Consistent with the experience of system operators and planners to date, wind and solar ELCC are assumed to decrease as their share increase between 2024 and 2050. Based on recent estimates of ELCC from the Midcontinent ISO Renewable Integration Impact Assessment, we assumed wind and solar ELCCs in 2024 to be 21.5% and 20.44%, respectively, and in 2050 to be 16.14% and 10.22%, respectively.
E. Financial Assumptions For the base cases, we assumed all resources would be built with an interest rate on debt of 4.0%, a debt fraction of 50%, and a return on equity of 10%. We altered those assumptions for the borrowing cost sensitivities, where the interest rate on debt was reduced to 3.4% to reflect lower borrowing costs paid by US Power municipalities with a credit rating of AA. We combined Tennessee’s state tax rate of 6% with the federal tax rate of 21% to yield a tax rate of 25.74% in our model.
We used tax depreciation schedules according to the IRS published recovery periods by class.47 Solar, wind, and storage all were assumed to use a 5-year MACRS. For CCs we used a 20-year MACRS. For transmission upgrade investments, we used a 40-year straight-line depreciation schedule.
The capital recovery periods used correspond to the technology lives provided by NREL’s ATB. In cases where the useful life exceeded 30 years, we capped the capital recovery period at 30 years (with the exception of transmission). We assumed natural gas and solar facilities had a capital recovery period of 30 years. For wind plants and batteries, we assumed capital recovery periods of 25 and 15 years, respectively. Transmission upgrades were assigned a capital recovery of 40 years.
Our financial model assumes that the effective ITC for the solar capacity is 10% until 2030 and 0% thereafter.48 No other technologies are assumed to have tax credits.
47 https://www.irs.gov/pub/irs-pdf/p946.pdf, Table B-2. 48 We assume that the solar capacity developed in time for the 2024 scenario is constructed in 2023,
meaning the effective ITC is 10%. In all likelihood, any solar buildout attaining the level of capacity in our 2024 portfolios would be built out in phases between today and 2023. On average, the LCOE for solar installations between 2019 and 2022 are slightly lower than those in 2023, costs, as slightly higher capital costs are more than offset by higher levels of the ITC (30% in 2019, 26% in 2020, and 22% in 2021).

bratt le.com | 40
F. Power System Optimizer (PSO) The production simulations were carried out using PSO (Power Systems Optimizer), a state-of-the-art production cost simulation tool developed by Polaris Systems Optimization, Inc. Like other commercially available production simulation tools, PSO simulates least-cost security-constrained unit commitment and economic dispatch with the capability to capture a full nodal representation of the transmission system, similar to actual ISO operations. The model is designed to closely mimic market operations software and market outcomes in competitive energy and ancillary services markets.
PSO uses a unique chronological modeling approach that allows planners to capture the timing of decisions made by operators and information availability to operators at various decision points, as well as the impacts on operations of unforeseen changes in the system, such as generation/transmission outages or load/renewables forecast error, that may occur after some decision points have past and certain decisions are already “locked in.” PSO also includes flexible and user-configurable representations of energy storage, ancillary service products, contracts and trading, and hydro resources, features which make it well-suited to the needs of renewable integration studies.

BOSTON
NEW YORK
SAN FRANCISCO
WASHINGTON
TORONTO
LONDON
MADRID
ROME
SYDNEY