The Power of Stars: Do Star Actors Drive the Success of ... · the effect of individual stars and...
20
The Power of Stars: Do Star Actors Drive the Success of Movies? Author(s): Anita Elberse Source: Journal of Marketing, Vol. 71, No. 4 (Oct., 2007), pp. 102-120 Published by: American Marketing Association Stable URL: http://www.jstor.org/stable/30164000 . Accessed: 26/02/2014 07:46 Your use of the JSTOR archive indicates your acceptance of the Terms & Conditions of Use, available at . http://www.jstor.org/page/info/about/policies/terms.jsp . JSTOR is a not-for-profit service that helps scholars, researchers, and students discover, use, and build upon a wide range of content in a trusted digital archive. We use information technology and tools to increase productivity and facilitate new forms of scholarship. For more information about JSTOR, please contact [email protected]. . American Marketing Association is collaborating with JSTOR to digitize, preserve and extend access to Journal of Marketing. http://www.jstor.org This content downloaded from 147.251.185.122 on Wed, 26 Feb 2014 07:46:01 AM All use subject to JSTOR Terms and Conditions
Transcript of The Power of Stars: Do Star Actors Drive the Success of ... · the effect of individual stars and...

The Power of Stars: Do Star Actors Drive the Success of Movies?Author(s): Anita ElberseSource: Journal of Marketing, Vol. 71, No. 4 (Oct., 2007), pp. 102-120Published by: American Marketing AssociationStable URL: http://www.jstor.org/stable/30164000 .
Accessed: 26/02/2014 07:46
Your use of the JSTOR archive indicates your acceptance of the Terms & Conditions of Use, available at .http://www.jstor.org/page/info/about/policies/terms.jsp
.JSTOR is a not-for-profit service that helps scholars, researchers, and students discover, use, and build upon a wide range ofcontent in a trusted digital archive. We use information technology and tools to increase productivity and facilitate new formsof scholarship. For more information about JSTOR, please contact [email protected].
.
American Marketing Association is collaborating with JSTOR to digitize, preserve and extend access toJournal of Marketing.
http://www.jstor.org
This content downloaded from 147.251.185.122 on Wed, 26 Feb 2014 07:46:01 AMAll use subject to JSTOR Terms and Conditions

Anita Elberse
The Power of Stars: Do Star Actors Drive the Success of Movies?
Is the involvement of stars critical to the success of motion pictures? Film studios, which regularly pay multimillion- dollar fees to stars, seem to be driven by that belief. This article sheds light on the returns on this investment using an event study that considers the impact of more than 1200 casting announcements on trading behavior in a simu- lated and real stock market setting. The author finds evidence that the involvement of stars affects movies' expected theatrical revenues and provides insight into the magnitude of this effect. For example, the estimates suggest that, on average, stars are worth approximately $3 million in theatrical revenues. In a cross-sectional analysis grounded in the literature on group dynamics, the author also examines the determinants of the magnitude of stars' impact on expected revenues. Among other things, the author shows that the stronger a cast already is, the greater is the impact of a newly recruited star with a track record of box office successes or with a strong artistic reputation. Finally, in an extension to the study, the author does not find that the involvement of stars in movies increases the valuation of film companies that release the movies, thus providing insufficient grounds to conclude that stars add more value than they capture. The author discusses implications for managers in the motion picture industry.
A guy stranded on an island without Tom Hanks is not a movie. With another actor, [the movie Cast Away] would gross $40 million. With Tom Hanks it grossed $200 mil- lion. There's no way to replace that kind of star power. (Bill Mechanic, former chairman of Twentieth Century Fox, qtd. in Variety; see Bing 2002) Had Troy opened impressively, one can be sure [Brad] Pitt would have gotten the credit. In this way, movie stars are like chief executives fattened on stock options. If the stock price goes up, the boss reaps the rewards.... If the stock price goes down, well, then there must be some other rea- son. (Ackman 2004)
The importance of stars permeates the motion picture industry. Although there are thousands of aspiring actors and actresses, the small group that has risen to
the top of its profession can command fees of millions of dollars per movie in salaries, perks, and profit participation deals. A handful of high-profile stars, including Jim Carrey, Tom Cruise, Tom Hanks, Brad Pitt, and Julia Roberts, have been paid salaries as high as $25 million per picture. Profit participation arrangements, so-called back-end deals, can sometimes amount to even higher fees. For example, Tom Cruise reportedly earned more than $70 million-a 22% share of the total receipts-for the movie Mission: Impossi- ble and another $92 million for the sequel (Epstein 2005). Moreover, high-profile stars can have a powerful influence
Anita Elberse is Assistant Professor of Business Administration, Harvard Business School, Harvard University (e-mail: aelberse@ hbs.edu). The author thanks Christophe Van den Bulte; Jehoshua Eliashberg; Robin Greenwood; Boris Groysberg; S. Abraham Ravid; Alvin Silk; participants of seminars at the Harvard Business School, IESE, and the 2005 Marketing Science Conference; and the three anonymous JM reviewers for valuable comments. She is also indebted to Alex Costakis (Hollywood Stock Exchange) for generously providing the data.
To read and contribute to reader and author dialogue on JM, visit http://www.marketingpowercom/jmblog.
on movie development. Some even trigger the "green light" by generating commitments from investors, producers, dis- tributors, and exhibitors.
Is the involvement of stars critical to the success of motion pictures? Are they worth the star treatment? The returns on the investments in stars are heavily debated in the trade and popular press. Although some practitioners argue that stars are the "locomotives behind some of Hollywood's biggest blockbusters" (Bing 2002), many others doubt whether the high level of compensation for stars is justified. A Forbes article titled "The Myth of Brad Pitt" (see Ack- man 2004), which compared more than 200 recent films, reveals that fewer than half of the highest-grossing hits fea- tured an actor who had top billing in at least one hit movie previously. The top three movies-Star Wars, E.T. the Extra-Terrestrial, and Titanic-had no stars. Some insiders claim that this shows that "it is the movie itself-not the star-that makes the hit" (Ackman 2002). There are signs that the doubts about returns on investments are causing existing contractual arrangements with talent to come under pressure, making the relationship between the involvement of stars and the success of movies a critical research issue (Eliashberg, Elberse, and Leenders 2006; Wei 2006). The stakes are high not just because of the high fees paid to stars but also because movies themselves are enormous financial bets.
An extensive academic literature exists on the question whether star creative talent affects the financial perfor- mance of movies, but to date, the findings are mixed. Even when extant research finds star power to be significantly related to movie performance, it is difficult to draw conclu- sions about the direction of causality because the research typically does not account for the notion that studios may employ bigger stars for movies that are expected to generate higher revenues or that the most powerful stars may be able to choose the most promising movie projects. Moreover, motion pictures are the result of the work of many actors and other workers, and to date, research has largely ignored
(c) 2007, American Marketing Association Journal of Marketing ISSN: 0022-2429 (print), 1547-7185 (electronic) 102 Vol. 71 (October 2007), 102-120
This content downloaded from 147.251.185.122 on Wed, 26 Feb 2014 07:46:01 AMAll use subject to JSTOR Terms and Conditions

the effect of individual stars and the interdependencies between stars.
I reexamine the relationship between star participation and movie revenues in a setting that addresses these limita- tions in extant research, and I build on these findings by considering the determinants of the relationship. I use an event study that revolves around more than 1200 casting announcements that cover approximately 600 stars and 500 movies. I assess the impact of these announcements on the behavior of participants of the Hollywood Stock Exchange (HSX; see www.hsx.com), a popular online market simula- tion in which players (or "traders") predict box office reve- nues. The reasonably high accuracy of HSX makes it a suit- able setting for an examination of this kind.
The event study reveals that HSX prices respond signifi- cantly to casting announcements, in support of the hypothe- sis that the involvement of stars positively affects revenues. For example, my estimates suggest that the average star in the sample is "worth" approximately $3 million in theatrical revenues. In an extension of the analysis involving the "real" stock market performance of film studios listed on the New York Stock Exchange (NYSE), I examine whether stars also affect the valuation of film companies that recruit them. I fail to find support for this idea. I use a cross- sectional analysis, grounded in relevant literature on group dynamics, to assess whether certain characteristics of the star and the other cast members are determinants of stars' impacts on revenues. I find that a star's economic and artis- tic reputation are positively related to his or her impact and show that the roles of a newly recruited star and the other cast members are linked; specifically, the more A-list a cast already is, the greater is the impact of a star who has a track record of box office successes or a wide recognition among critics and peers. This result contributes to the group dynamics literature by providing an example of increasing returns to recruiting stars in the context of the motion pic- ture industry. The study draws attention to the multiplica- tive nature of the production process and the existence of a classic team problem (Alchian and Demsetz 1972) in recruiting and compensating stars (Caves 2000, 2003).
Hypotheses The Impact of Stars on Revenues Several researchers have studied the effect of star power on revenues. The findings are mixed. Some studies have not detected a relationship between revenues and talent involve- ment (Austin 1989; De Vany and Walls 1999; Litman 1983; Litman and Ahn 1998; Ravid 1999), and others have found evidence that a movie's likely cumulative, weekly, or opening-week revenues increase with the rank of the star talent associated with it (Ainslie, Dreze, and Zufryden 2005; Albert 1998; Basuroy, Chatterjee, and Ravid 2003; Elberse and Eliashberg 2003; Faulkner and Anderson 1987; Litman and Kohl 1989; Neelamegham and Chintagunta 1999; Prag and Casavant 1994; Sawhney and Eliashberg 1996; Sochay 1994; Wallace, Seigerman and Holbrook 1993).
The role of stars in the performance of their team or organization is also a general theme in the academic litera-
ture on group dynamics. The prevalent view is that, all else being equal, groups with more talented individual members should outperform groups with less talented members. For example, Tziner and Eden (1985), who study military tank crews, show that group productivity is positively related to the summed abilities of the group members. Groysberg, Polzer, and Elfenbein (2006), who examine Wall Street equities research analysts, find that groups benefit from having members who achieve high individual performance. They note that stars' contributions could directly increase the team's performance but may also indirectly drive suc- cess, for example, by enhancing the group's perceived standing in the eyes of external constituents.
The latter observation fits the context of motion pic- tures. As Albert (1998) indicates, actors can be character- ized as "stars" for several reasons: They may have critically acclaimed acting skills, possess personality traits that appeal to the moviegoing audience, attract a lot of free pub- licity, have the ability to secure investment, or simply have been lucky. Accordingly, academic researchers have mea- sured "star power" in different ways. For example, Sawhney and Eliashberg (1996) use a dummy that is based on a list of stars who possess "marquee value" published by trade magazine Variety. Elberse and Eliashberg (2003) and Ainslie, Dreze, and Zufryden (2005) measure star power using The Hollywood Reporter's Star Power Survey, in which executives and other insiders rank talent. Ravid (1999) classifies stars on the basis of, among other things, whether they have been nominated for or have won an Academy Award or have participated in a top-grossing film in the previous year.
Ravid's (1999) measures are directly related to the two types of reputations that, in general, can be the source of stars' power: an economic reputation, derived from their box office success, and an artistic reputation, derived from the recognition of critics or peers (Delmestri, Montanan, and Usai 2005). A star's historical box office record has been found in some studies to be an indicator of his of her future potential (e.g., Lampel and Shamsie 2003; Litman and Kohl 1989; Ravid 1999; Sochay 1994)1 and is a valued source of information for studio executives (Chisholm 2004). A star's artistic reputation, which in the motion pic- ture industry is primarily revealed through awards or nomi- nations, is a sign of quality for audiences, executives, the media, and other constituencies (e.g., Wallace, Seigerman, and Holbrook 1993) and thus is also a likely predictor of the star's future box office record.
Both types of reputations can be viewed as dimensions of "status" as commonly defined in the literature on group dynamics: the amount of respect, influence, and promi- nence stars enjoy in the eyes of others (Anderson et al. 2001). Status is an integral element of team composition (West and Allen 1997) but has received surprisingly little attention as a possible predictor of team performance
1John, Ravid, and Sunder (2003) find that optimal hiring of movie directors is based on their performance over their entire career path rather than their recent performance and that their con- tribution is positively related to career length.
Star Power and Movie Success 1103
This content downloaded from 147.251.185.122 on Wed, 26 Feb 2014 07:46:01 AMAll use subject to JSTOR Terms and Conditions
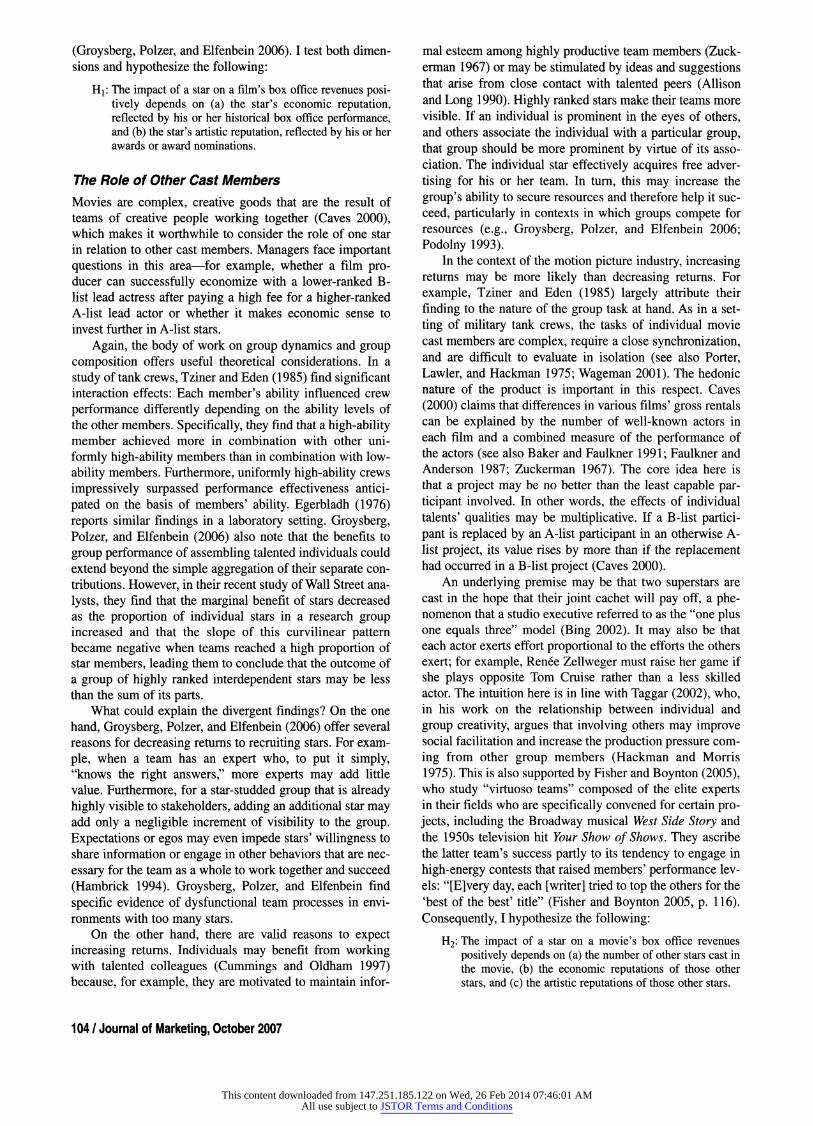
(Groysberg, Polzer, and Elfenbein 2006). I test both dimen- sions and hypothesize the following:
H1: The impact of a star on a film's box office revenues posi- tively depends on (a) the star's economic reputation, reflected by his or her historical box office performance, and (b) the star's artistic reputation, reflected by his or her awards or award nominations.
The Role of Other Cast Members Movies are complex, creative goods that are the result of teams of creative people working together (Caves 2000), which makes it worthwhile to consider the role of one star in relation to other cast members. Managers face important questions in this area-for example, whether a film pro- ducer can successfully economize with a lower-ranked B- list lead actress after paying a high fee for a higher-ranked A-list lead actor or whether it makes economic sense to invest further in A-list stars.
Again, the body of work on group dynamics and group composition offers useful theoretical considerations. In a study of tank crews, Tziner and Eden (1985) find significant interaction effects: Each member's ability influenced crew performance differently depending on the ability levels of the other members. Specifically, they find that a high-ability member achieved more in combination with other uni- formly high-ability members than in combination with low- ability members. Furthermore, uniformly high-ability crews impressively surpassed performance effectiveness antici- pated on the basis of members' ability. Egerbladh (1976) reports similar findings in a laboratory setting. Groysberg, Polzer, and Elfenbein (2006) also note that the benefits to group performance of assembling talented individuals could extend beyond the simple aggregation of their separate con- tributions. However, in their recent study of Wall Street ana- lysts, they find that the marginal benefit of stars decreased as the proportion of individual stars in a research group increased and that the slope of this curvilinear pattern became negative when teams reached a high proportion of star members, leading them to conclude that the outcome of a group of highly ranked interdependent stars may be less than the sum of its parts.
What could explain the divergent findings? On the one hand, Groysberg, Polzer, and Elfenbein (2006) offer several reasons for decreasing returns to recruiting stars. For exam- ple, when a team has an expert who, to put it simply, "knows the right answers," more experts may add little value. Furthermore, for a star-studded group that is already highly visible to stakeholders, adding an additional star may add only a negligible increment of visibility to the group. Expectations or egos may even impede stars' willingness to share information or engage in other behaviors that are nec- essary for the team as a whole to work together and succeed (Hambrick 1994). Groysberg, Polzer, and Elfenbein find specific evidence of dysfunctional team processes in envi- ronments with too many stars.
On the other hand, there are valid reasons to expect increasing returns. Individuals may benefit from working with talented colleagues (Cummings and Oldham 1997) because, for example, they are motivated to maintain infor-
mal esteem among highly productive team members (Zuck- erman 1967) or may be stimulated by ideas and suggestions that arise from close contact with talented peers (Allison and Long 1990). Highly ranked stars make their teams more visible. If an individual is prominent in the eyes of others, and others associate the individual with a particular group, that group should be more prominent by virtue of its asso- ciation. The individual star effectively acquires free adver- tising for his or her team. In turn, this may increase the group's ability to secure resources and therefore help it suc- ceed, particularly in contexts in which groups compete for resources (e.g., Groysberg, Polzer, and Elfenbein 2006; Podolny 1993).
In the context of the motion picture industry, increasing returns may be more likely than decreasing returns. For example, Tziner and Eden (1985) largely attribute their finding to the nature of the group task at hand. As in a set- ting of military tank crews, the tasks of individual movie cast members are complex, require a close synchronization, and are difficult to evaluate in isolation (see also Porter, Lawler, and Hackman 1975; Wageman 2001). The hedonic nature of the product is important in this respect. Caves (2000) claims that differences in various films' gross rentals can be explained by the number of well-known actors in each film and a combined measure of the performance of the actors (see also Baker and Faulkner 1991; Faulkner and Anderson 1987; Zuckerman 1967). The core idea here is that a project may be no better than the least capable par- ticipant involved. In other words, the effects of individual talents' qualities may be multiplicative. If a B-list partici- pant is replaced by an A-list participant in an otherwise A- list project, its value rises by more than if the replacement had occurred in a B-list project (Caves 2000).
An underlying premise may be that two superstars are cast in the hope that their joint cachet will pay off, a phe- nomenon that a studio executive referred to as the "one plus one equals three" model (Bing 2002). It may also be that each actor exerts effort proportional to the efforts the others exert; for example, Renee Zellweger must raise her game if she plays opposite Tom Cruise rather than a less skilled actor. The intuition here is in line with Taggar (2002), who, in his work on the relationship between individual and group creativity, argues that involving others may improve social facilitation and increase the production pressure corn- ing from other group members (Hackman and Morris 1975). This is also supported by Fisher and Boynton (2005), who study "virtuoso teams" composed of the elite experts in their fields who are specifically convened for certain pro- jects, including the Broadway musical. West Side Story and the 1950s television hit Your Show of Shows. They ascribe the latter team's success partly to its tendency to engage in high-energy contests that raised members' performance lev- els: "[E]very day, each [writer] tried to top the others for the `best of the best' title" (Fisher and Boynton 2005, p. 116). Consequently, I hypothesize the following:
H2: The impact of a star on a movie's box office revenues positively depends on (a) the number of other stars cast in the movie, (b) the economic reputations of those other stars, and (c) the artistic reputations of those other stars.
104 / Journal of Marketing, October 2007
This content downloaded from 147.251.185.122 on Wed, 26 Feb 2014 07:46:01 AMAll use subject to JSTOR Terms and Conditions

Data The HSX The primary data source is the HSX, an online market simu- lation focused on the movie industry. As of January 2005, it had more than 500,000 registered users ("traders"), a fre- quent trader group of approximately 80,000 accounts, and approximately 19,500 daily unique log-ins. New users receive 2 million "Hollywood dollars" (denoted as "H$2 million") and can increase the value of their portfolio by, among other things, strategically trading MovieStocks and StarBonds. The trading population is fairly heterogeneous, but the most active traders tend to be heavy consumers and early adopters of entertainment products, especially films.
The HSX is not a real stock market. It revolves around fake money, all traders start with the same capital when they first join, the pricing of "stocks" is governed by a "market maker" that is based on computer algorithms (as opposed to pure supply and demand dynamics), and "stocks" have a finite horizon in that trading comes to an end when the movie has played in theaters for some time. However, the simulated market appears reasonably efficient and accurate in its predictions, which makes it a suitable setting for this study. For example, Pennock and colleagues (2001 a, b) comprehensively analyze HSX's efficiency and forecast accuracy immediately before a movie's release and find that arbitrage closure on HSX is quantitatively weaker than but qualitatively similar to a real-money market. They also show that HSX forecasts perform competitively in direct comparisons with expert judges. Elberse and Eliashberg (2003), Spann and Skiera (2003), and, for a larger pre- release period, Elberse and Anand (2005) provide further evidence that HSX traders collectively produce relatively good forecasts of actual box office returns (see also Gruca 2000; Hanson 1999; Wolfers and Zitzewitz 2004).2 (I return to HSX's predictive validity and efficiency in the context of this study after describing the data in greater detail.)
The market for MovieStocks. I illustrate the MovieStock trading process for the movie Cold Mountain (CLDMT on HSX). Trading dynamics appear in the top graph in Figure 1. The HSX MovieStock prices reflect expectations of box office revenues generated in the first four weeks of a movie's release. For example, a price of H$45 corresponds to cumulative grosses of $45 million at the end of the fourth week. Each trader, provided that he or she has sufficient funds, can own a maximum of 50,000 shares of an individ- ual MovieStock and can buy, sell, short, or cover securities at any given moment. Trading starts when the MovieStock has its official initial public offering on the HSX market, which usually happens months, and sometimes years, before the movie's theatrical release. The CLDMT stock began trading in March 1998, well over four years before its theatrical opening. Initially, traders may have little informa- tion on which to base their betting decisions. When CLDMT debuted on the market, traders may have known only that United Artists had bought the screen rights to the debut
2This fits with recent evidence that markets based on fake money can be just as accurate as those based on real money (e.g., Servan-Schreiber et al. 2004).
novel by Charles Frazier, that the book was a love story set in the Civil War, and that Tom Cruise was one of the actors considered for the male leading role. More information would reach traders in subsequent months. Trading usually peaks in the days before and after the movie's release. For example, the day before its opening on December 25, 2003, more than 14 million shares of CLDMT were traded.
Trading is halted on the day the movie is widely released. Thus, the halt price is the latest available expecta- tion of the movie's success before its release. The halt price of CLDMT was H$44.68. Immediately after the opening weekend, MovieStock prices are adjusted according to actual box office grosses. Here, a set of standard multipliers come into play.3 The holiday weekend box office for CLDMT exceeded $19 million, and its multiplier was 2.4, leading to an "adjust" price of H$46.55. After the price is adjusted, trading resumes. MovieStocks for widely released movies are delisted four weekends into their theatrical run, at which time their delist price is calculated and stockhold- ers receive their payout. When. CLDMT delisted on January 20, 2004, the movie had collected $65.97 million in box office revenues; therefore, its delist price was H$65.97. The movie eventually earned more than $95 million in its run in U.S. theaters.
The market for StarBonds. The HSX traders can also buy and sell StarBonds for individual movie actors and actresses. Each time the MovieStock for an actor's movie is delisted, HSX formally adjusts the actor's StarBond price according to the movie's box office performance. The key metric here is the star's total box office performance aver- aged over (at most) his or her previous five credited films. Beginning with an actor's second film, his or her StarBond price is adjusted to match this trailing average.4 That is, if an actor's previous five movies generated $50 million, $50 million, $150 million, $100 million, and $150 million, respectively, his or her StarBond value would most recently have been adjusted to H$100, based on the trailing average of [(50 + 50 + 150 + 100 + 150)/5 =]$100 million. If his or her next movie generates $250 million, the adjustment would be to [(50 + 150 + 100 + 150 + 250)/5 =1 H$140. To put these figures in context, adjustments for Tom Cruise's StarBond TCRUI varied from H$91 (when Minority Report was included) to H$126 (when Collateral was incorpo- rated) between November 2001 and December 2004. In the periods between these adjustments, HSX players can bet on the star's future box office record by trading StarBonds. They can own a maximum of 20,000 shares of one StarBond.
Casting announcements in the Market Recap report. Published on the HSX site at the end of the day each Friday, the Market Recap report is an important information source
3For a regular Friday opening, the opening box office gross (in millions of dollars) is multiplied by 2.8 to compute the adjust price (the underlying assumption is that, on average, this leads to four- week totals).
4The process starts when MovieStocks credited to the actor delist and continues until the final theatrical gross is known. The contribution for any one film is capped at $250 million. The mini- mum StarBond price is H$5.
Star Power and Movie Success / 105
This content downloaded from 147.251.185.122 on Wed, 26 Feb 2014 07:46:01 AMAll use subject to JSTOR Terms and Conditions

FIGURE
1
Trading
Dynamics
and
Casting
Announcements
for
Cold
Mountain
Release
Date
80 70 60 50 40 30 20
30,000,000 25,000,000 20,000,000 15,000,000 10,000,000 5,000,000
0
Volume
traded
Closing
price
Date
Volume
6/1/2003
6/8/2003
6/15/2003
6/22/2003
6/29/2003
7/6/2003
7/13/2003
7/20/2003
7/27/2003
8/3/2003
8/10/2003
8/17/2003
8/24/2003
8/31/2003
9/7/2003
9/14/2003
9/21/2003
9/28/2003
10/5/2003
10/12/2003
10/19/2003
10/26/2003
11/2/2003
11/9/2003
11/16/2003
11/23/2003
11/30/2003
12/7/2003
12/14/2003
12/21/2003
12/28/2003
1/4/2004
1/11/2004
1/18/2004
Price (H$)
106 / Journal of Marketing, October 2007
This content downloaded from 147.251.185.122 on Wed, 26 Feb 2014 07:46:01 AMAll use subject to JSTOR Terms and Conditions

FIGURE
1
Continued
90 80 70 60 50 40 30 20
"Torn
Cruise
has
dropped
out"
"Nicole
Kidman,
Jude
Law,
and
Ren
Zellweger
have
joined"
"Natalie
Portman
has
joined"
10,000,000 9,000,000 8,000,000 7,000,000 6,000,000 5,000,000 4,000,000 3,000,000 2,000,000 1,000,000
0
Volume
traded
Closing
price
Date
Volume
12/1/2001
12/8/2001
12/15/2001
12/22/2001
12/29/2001
1/5/2002
1/12/2002
1/19/2002
1/26/2002
2/2/2002
2/9/2002
2/16/2002
2/23/2002
3/2/2002
3/9/2002
3/16/2002
3/23/2002
3/30/2002
4/6/2002
4/13/2002
4/20/2002
4/27/2002
5/4/2002
5/11/2002
5/18/2002
5/25/2002
6/1/2002
Price (H$)
Star Power and Movie Success / 107
This content downloaded from 147.251.185.122 on Wed, 26 Feb 2014 07:46:01 AMAll use subject to JSTOR Terms and Conditions

for HSX players. The "Casting News" section, which is based on information obtained from trade magazines and other industry sources, describes the preceding week's cast- ing decisions and rumors. The news takes the form of short statements that contain links to relevant MovieStocks and StarBonds. For example, the report for the week of January 18, 2002, included the following:
-Tom Cruise (TCRUI) dropped out of Cold Mountain (CLDMT). 'Jason Isaacs (JISAA) joined the cast of Harry Potter and the Chamber of Secrets (HPOT2). 'Robert Downey Jr. (RDOWN) is attached to Six Bullets from Now (SXBLT). 'Russell Crowe (RCROW) is in negotiations to star in Master and Commander (MCMDR).
The bottom graph in Figure 1 shows fluctuations in the MovieStock price for CLDMT in a period in which several casting announcements were made. The figure suggests that casting news significantly affected trading dynamics for CLDMT. That is, around the time of each announcement, trading volume noticeably increased, and the price appears to have first reacted negatively to the news that Tom Cruise dropped out and, though to a lesser extent, positively to the news that Nicole Kidman, Jude Law, and Renee Zellweger joined the cast. The news that Natalie Portman also joined the cast did little to increase the price.
Sample and Variables The sampling frame for this study consists of all casting announcements that appeared in the HSX Market Recap report between November 2001 and January 2005. To pre- vent complications in the event study methodology, I excluded five announcements that named the same Movie- Stock and appeared within two weeks of each other, leaving a total of 1258 announcements. Taken together, they cover 496 movies and 602 stars.
For the purposes of this study, I regarded each of the actors and actresses listed on the StarBond market as a "star." Their presence on the StarBond market sets them apart from the thousands of hopefuls without a movie career. The HSX continuously researches the marketplace to identify new star actors. For an actor to qualify for a Star- Bond, he or she must have had at least two leading roles in movies theatrically released by a major studio in the United States or a larger number of supporting roles or roles in smaller, independent films. I coded each announcement as either positive (e.g., "Star X is in negotiations to star in movie Y," "Star X has joined the cast of Y") or negative (e.g., "Star X has dropped out of movie Y," "Star X's nego- tiations to star in movie Y have stalled").5 The majority of the announcements in the sample are positive; only 36 are negative.
Most descriptive variables are directly based on the HSX MovieStock and StarBond market:
5I explored whether it was worthwhile to separate speculative ("Actor X may star in movie Y") and definite ("Actor X will star in movie Y") statements; this did not result in substantively different results.
-Star_Economic_History: To express a star's historical eco- nomic performance at the time of an announcement, I opt for the average box office gross over the star's five most recent movies (expressed in millions of dollars), which is equivalent to the latest StarBond adjustment before the announcement.6 If an announcement lists multiple stars, I opt for their average value. For example, at the time of their announced participa- tion in Cold Mountain (see Figure 1), Nicole Kidman, Jude Law, and Renee Zellweger had trailing box office averages of $52 million, $37 million, and $46 million, respectively, lead- ing to a score of [(52 + 37 + 46)/3 =1 $45 million. -Star Artistic_History: To measure a star's artistic perfor- mance up to the time of the announcement, I count the num- ber of Academy Awards (Oscars) and Golden Globes and nominations he or she has collected in the preceding five years.? For example, before the Cold Mountain announce- ment, Nicole Kidman had been nominated for two Golden Globes and had won both and had just collected her first Oscar nomination, leading to a score of 5. -Cast_Count: To construct a measure of the number of other star cast members for a movie at the time of an announce- ment, I add the number of stars mentioned in positive announcements and subtract the number of stars mentioned in negative announcements in that movie's history. In the example for Cold Mountain (Figure 1), there were three other cast members (Jude Law, Nicole Kidman, and Renee Zell- weger) at the time of the news about Natalie Portman. -Cast_Economic_History: To obtain a measure of the histori- cal economic power of the other cast members at the time of the announcement, I calculate the average of each cast mem- ber's average box office record over his or her five most recent movies. Thus, in the Cold Mountain example, at the time of Natalie Portman's announcement, I average the latest StarBond adjustments for Jude Law, Nicole Kidman, and Renee Zellweger. -Cast_Artistic_History: To express the other cast members' historical artistic performance, I divide the number of Golden Globe and Oscar nominations and wins collected by the cast by the number of cast members at the time of the announcement.
Table 1 provides descriptive statistics. Two data-related observations are worth highlighting: star power dynamics and HSX's predictive validity. With regard to star power dynamics, a star's box office record, which industry insiders often use as the primary indicator of a star's power, changes dramatically over the course of just a few years. For exam- ple, StarBond values in December 2001 are only weakly correlated with such values exactly three years later-the Pearson correlation coefficient is .43-which underscores the downside of relying on stars' historical performance when forecasting their future performance.
With regard to HSX's predictive validity, a comparison of HSX MovieStock prices before and after release con- firms that HSX produces reasonably accurate forecasts of theatrical revenues. For the 192 movies in the sample (approximately 40%) that had been widely released as of
6Because it involves an adjustment (and not a StarBond price determined by trading in periods between adjustments), this is purely a backward-looking measure and does not incorporate any speculation.
?The Academy Awards are granted by the Academy of Motion Picture Arts and Sciences (which counts many actors among its members), and the Golden Globes are given out by the Hollywood Foreign Press Association.
108 / Journal of Marketing, October 2007
This content downloaded from 147.251.185.122 on Wed, 26 Feb 2014 07:46:01 AMAll use subject to JSTOR Terms and Conditions
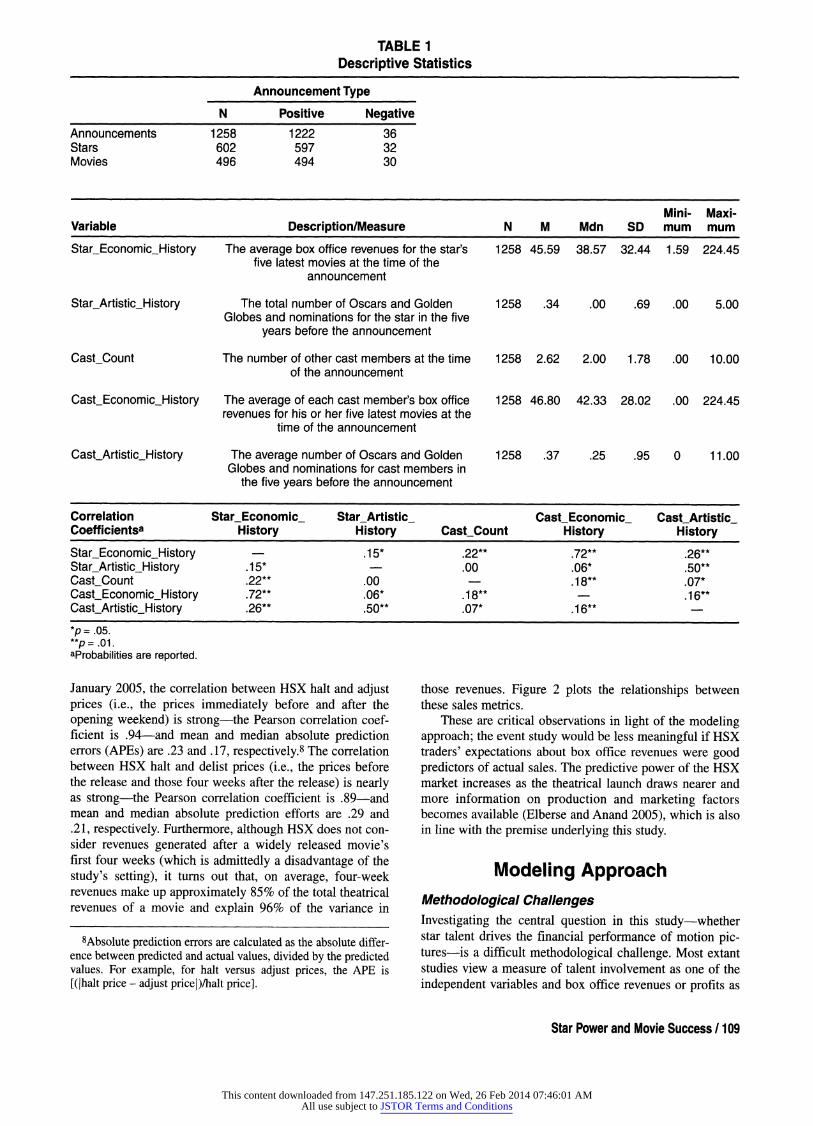
TABLE 1 Descriptive Statistics
Announcement Type N Positive Negative
Announcements 1258 1222 36 Stars 602 597 32 Movies 496 494 30
Mini- Maxi- Variable Description/Measure N M Mdn SD mum mum
Star_Economic_History The average box office revenues for the star's 1258 45.59 38.57 32.44 1.59 224.45 five latest movies at the time of the
announcement
Star_Artistic_History The total number of Oscars and Golden 1258 .34 .00 .69 .00 5.00 Globes and nominations for the star in the five
years before the announcement
Cast_Count The number of other cast members at the time 1258 2.62 2.00 1.78 .00 10.00 of the announcement
Cast_Economic_History The average of each cast member's box office 1258 46.80 42.33 28.02 .00 224.45 revenues for his or her five latest movies at the
time of the announcement
Cast_Artistic_History The average number of Oscars and Golden 1258 .37 .25 .95 0 11.00 Globes and nominations for cast members in
the five years before the announcement
Correlation Star_Economic_ Star_Artistic_ Cast_Economic_ Cast_Artistic_ Coefficientsa History History Cast_Count History History
Star_Economic_History .15* .22** .72** .26** Star_Artistic_History .15* .00 .06* .50"" Cast_Count .22** .00 .18** .07* Cast_Economic_History .72** .06* .18** .16** Cast_Artistic_History .26** .50"" .07* .16** -
*p = .05.
"*p = .01. aProbabilities are reported.
January 2005, the correlation between HSX halt and adjust prices (i.e., the prices immediately before and after the opening weekend) is strong-the Pearson correlation coef- ficient is .94-and mean and median absolute prediction errors (APEs) are .23 and .17, respectively.8 The correlation between HSX halt and delist prices (i.e., the prices before the release and those four weeks after the release) is nearly as strong-the Pearson correlation coefficient is .89-and mean and median absolute prediction efforts are .29 and .21, respectively. Furthermore, although HSX does not con- sider revenues generated after a widely released movie's first four weeks (which is admittedly a disadvantage of the study's setting), it turns out that, on average, four-week revenues make up approximately 85% of the total theatrical revenues of a movie and explain 96% of the variance in
8Absolute prediction errors are calculated as the absolute differ- ence between predicted and actual values, divided by the predicted values. For example, for halt versus adjust prices, the APE is [(jhalt price - adjust pricelYhalt price].
those revenues. Figure 2 plots the relationships between these sales metrics.
These are critical observations in light of the modeling approach; the event study would be less meaningful if HSX traders' expectations about box office revenues were good predictors of actual sales. The predictive power of the HSX market increases as the theatrical launch draws nearer and more information on production and marketing factors becomes available (Elberse and Anand 2005), which is also in line with the premise underlying this study.
Modeling Approach Methodological Challenges Investigating the central question in this study-whether star talent drives the financial performance of motion pic- tures-is a difficult methodological challenge. Most extant studies view a measure of talent involvement as one of the independent variables and box office revenues or profits as
Star Power and Movie Success / 109
This content downloaded from 147.251.185.122 on Wed, 26 Feb 2014 07:46:01 AMAll use subject to JSTOR Terms and Conditions

FIGURE 2 Predictive Validity for HSX
450 400 350 300 250 200 150 100 50 0
0 50 100 150 200 250 300 350 400 450 HSX Halt Price (in H$)
450 400 350 300 250 200 150 100 50 0 0 50 100 150 200 250 300 350 400 450
HSX Halt Price (in H$)
0 50 100 150 200 250 300 350 400 450
HSX Delist Price (in H$)
the dependent variable, either in a regression model (e.g., Austin 1989; Elberse and Eliashberg 2003; Litman 1983; Litman and Ahn 1998; Litman and Kohl 1989; Prag and Casavant 1994; Ravid 1999; Sochay 1994; Wallace, Seiger- man, and Holbrook 1993) or in a probability model (e.g., De Vany and Walls 1999; Neelamegham and Chintagunta 1999; Sawhney and Eliashberg 1996). However, extant findings need to be approached with care for several reasons:
-It is problematic to draw conclusions about the direction of causality because studios may employ bigger stars for movies that are expected to generate higher revenues (Lehmann and Weinberg [2000] made a similar argument for the effect of advertising). -It is difficult to control for a selection bias introduced by the possibility that the most powerful stars (e.g., the highest-
ranked stars in terms of their historical box office record) are able to choose the most promising movie projects. -It is challenging to isolate the effect of an individual actor or actress on a movie's performance because motion pictures are complex, holistic, creative goods that are the result of the activities of many creative workers (Caves 2000, 2003).
The Choice for an Event Study Methodology I use an event study to address these potential methodologi- cal problems. Specifically, I reexamine the impact of talent on movies' theatrical revenues by analyzing how casting announcements affect the prices of HSX MovieStocks and extend current research by analyzing what determines the magnitude of that effect. Event studies are a popular methodology in several fields of business research (e.g., Campbell, Lo, and MacKinlay 1996). In marketing, event studies have been used to understand the impact of, among other things, company name changes (Horsky and Swynge- douw 1987), new product introductions (Chaney, Devinney, and Winer 1991), brand extensions (Lane and Jacobson 1995), celebrity endorsements (Agrawal and Kamakura 1995), and online channel additions (Geyskens, Gielens, and Dekimpe 2002) on firm valuation.
Here, an event study approach has advantages over existing research in the area. First, and most notably, the event study framework allows for a comparison of a movie's expected performance before and after the casting announcement. Before the announcement, HSX traders can be assumed to have no information on which actor will be used; they will assess the value of a movie on the basis of other characteristics, such as the budget, the story line, and moviegoers' familiarity with central characters. After the decision to cast a particular star is made public, traders can also account for how much that star will draw moviegoers and should adjust their trading behavior accordingly. Thus, the event study allows for a comparison of the likely perfor- mance of a particular movie with and without the involve- ment of the star mentioned in the announcement, such that the difference reflects the impact or "worth" of that star. Consequently, it helps to address the potential lack of clar- ity on causality and the possible selection bias present in existing research that considers only the actual performance (i.e., the "outcome" of the marketing process) without con- trolling for the expected performance without the star.9
Second, when announcements involve only one star, the event study approach enables the examination of the impact of an individual actor or actress. Consider the situation of the actress Natalie Portman in Cold Mountain (Figure 1). Because the announcement regarding her recruitment was made at a different time than the other casting announce- ments, it is possible to assess the effect of her involvement in the movie on an individual basis. In contrast, studies that
9The "reverse causality" problem might not be fully overcome; some traders may believe that studios hire better actors if they believe that the movie has a greater chance of success, making the announcement for them at least partly a signal of the movie's over- all potential and their response to that announcement an indirect reflection of the star's strength.
450 400 350 300 250 200 150 100 50 0
110 / Journal of Marketing, October 2007
Total
Box
Office
Revenues
(in $M)
HSX
Adjust
Price
(in H$)
HSX
Delist
Price
(in H$)
This content downloaded from 147.251.185.122 on Wed, 26 Feb 2014 07:46:01 AMAll use subject to JSTOR Terms and Conditions
simply regress box office revenues (the "outcome" variable) on talent participation cannot differentiate between the effect of Natalie Portman and that of the other Cold Moun- tam cast members. Such studies typically attribute success to either the first-billed actor only or the combined cast (e.g., Faulkner and Anderson 1987; Litman 1983; Ravid 1999), but in reality, they cannot determine whether one cast member should be valued more highly than another.
A significant effect of casting announcements on HSX MovieStock prices could reflect several dimensions of star power. Among other things, it could capture a star's (per- ceived) ability to attract the attention of audiences and con- vince them to buy tickets; the star's aptitude in attracting other talent to a project; the star's influence in muscling competing movies out of the marketplace; and the star's knack for generating commitments from investors, produc- ers, and other interested parties.10
The intuition behind the event study methodology is straightforward. When carried out in the context of financial markets, it is assumed that the price of a stock reflects the time- and risk-discounted present value of all future cash flows that are expected to accrue to the holder of that stock; all publicly available information is reflected completely and in an unbiased manner in the price of the stock, making it impossible to earn economic profits on the basis of this information. Therefore, only an unexpected event can change the price of the stock, which is equal to the antici- pated changes in the firm's future cash flows adjusted for the risk of those cash flows. Information resulting in a posi- tive (negative) change in expected future cash flows will have a positive (negative) effect on the stock's price (Brown and Warner 1985; Srinivasan and Bharadwaj 2005). Event studies assume that markets are efficient; in essence, they test both whether the event has an impact on the stock price and whether the market is efficient (Campbell, Lo, and MacKinlay 1996; Srinivasan and Bharadwaj 2005). Whether individual traders can 'integrate all the information pertaining to an event is significant in that regard. However, research shows that even when some traders have better access to information than others, markets aggregate infor- mation in such a way that investors collectively act as if they have all the relevant information (Srinivasan and Bharadwaj 2005).
In the context of the HSX event study, it is important that traders incorporate new information as it becomes available and leave no major arbitrage opportunities unad- dressed. Although there have been few studies on the effi- ciency of simulated markets in general, as I discussed previ- ously, research has revealed that HSX is reasonably efficient immediately before a movie's release date (Pen- nock et al. 2001a, b). In further explorations of the data used in this study, I find no reason to assume that the HSX's
efficiency is weaker at earlier stages of the trading process."
The Event Study Because of HSX's unique nature, the design of the event study discussed here differs from those commonly used in the context of "real" stock markets. The details are as follows:
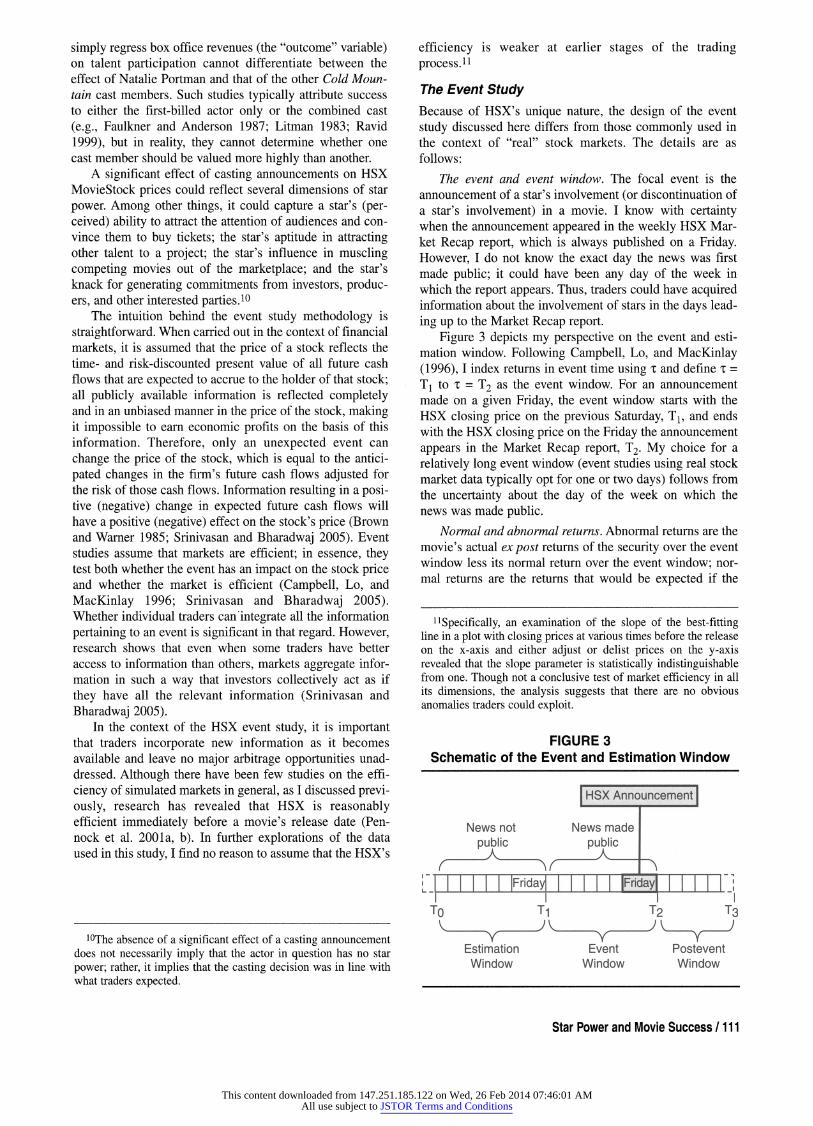
The event and event window. The focal event is the announcement of a star's involvement (or discontinuation of a star's involvement) in a movie. I know with certainty when the announcement appeared in the weekly HSX Mar- ket Recap report, which is always published on a Friday. However, I do not know the exact day the news was first made public; it could have been any day of the week in which the report appears. Thus, traders could have acquired information about the involvement of stars in the days lead- ing up to the Market Recap report.
Figure 3 depicts my perspective on the event and esti- mation window. Following Campbell, Lo, and MacKinlay (1996), I index returns in event time using t and define = T1 to t = T2 as the event window. For an announcement made on a given Friday, the event window starts with the HSX closing price on the previous Saturday, Tl, and ends with the HSX closing price on the Friday the announcement appears in the Market Recap report, T2. My choice for a relatively long event window (event studies using real stock market data typically opt for one or two days) follows from the uncertainty about the day of the week on which the news was made public.
Normal and abnormal returns. Abnormal returns are the movie's actual ex post returns of the security over the event window less its normal return over the event window; nor- mal returns are the returns that would be expected if the
11Specifically, an examination of the slope of the best-fitting line in a plot with closing prices at various times before the release on the x-axis and either adjust or delist prices on the y-axis revealed that the slope parameter is statistically indistinguishable from one. Though not a conclusive test of market efficiency in all its dimensions, the analysis suggests that there are no obvious anomalies traders could exploit.
FIGURE 3 Schematic of the Event and Estimation Window
HSX Announcement
News not News made public public
'Friday' Fridays
To T1 T2 T3
10The absence of a significant effect of a casting announcement does not necessarily imply that the actor in question has no star power; rather, it implies that the casting decision was in line with what traders expected.
Estimation Window
Event Postevent Window Window
Star Power and Movie Success / 111
This content downloaded from 147.251.185.122 on Wed, 26 Feb 2014 07:46:01 AMAll use subject to JSTOR Terms and Conditions

event did not take place. That is, for each announcement i and period t,
(1) ARit = Rit - E(Rit),
where ARit are the abnormal returns, Rit are the actual returns, and E(Rit) are the normal returns. In modeling the normal return, I opt for the constant-mean-return model, in which returns are given by
(2) Rit=+sit,withE[Sit]=0,Var[8it]a2ARi
I calculate the cumulative abnormal return (CAR) by aggre- gating abnormal returns across time. Specifically, CARi(ti, T2) is the CAR for announcement i from 'r to T2, where T1T1T2T2:
(3)
CARi('ri,T2)
I generate a seven-day CAR for each announcement under investigation; it is calculated over the week preceding the Market Recap announcement.
Estimation and testing procedure. Estimation of the nor- mal performance model parameters is usually done using the period before the event window. I define the normal return as the average closing price in the week running from Saturday to Friday exactly one week before the announce- ment was made on the HSX site. Thus, the estimation win- dow, defined as t = To to t = T1, consists of seven days. Two key reasons underlie my choice for a relatively short estimation window: (1) the limited availability of long series (in some cases, the MovieStock's initial public offer- ing is relatively close) and (2) the slight upward trend in HSX MovieStock prices in general (which, with a longer window, would lead to an overestimation of the more preva- lent positive shocks; the seven-day window is a conserva- tive choice in that respect).12 I test for the significance of daily abnormal returns using the t-statistic that Brown and Warner (1985) describe. I also verify the significance of the CARs (the t-statistic is calculated by dividing the average CARs by its standard deviation) and the differential impact of positive versus negative announcements (Campbell, Lo, and MacKinlay 1996).
Cross-Sectional Analysis Building on the results of the event study, I identify what determines the magnitude of the impact of casting announcements using a cross-sectional regression analysis (Asquith and Mullins 1986; Campbell, Lo, and MacKinlay 1996; Geyskens, Gielens, and Dekimpe 2002). The CAR,
12I have experimented with different estimation windows and different normal return estimation models. Because the returns did not change substantively, I report only the findings for the simplest solution.
CARi(ri, T2), is the dependent variable in these cross- sectional analyses.13 Characteristics of the announcement, the star, and the other cast members are independent variables. I estimate the following linear regression: (4) CART = a +13iAiSi + Ei,
where Ai denotes the type of announcement and Si repre- sents the vector of characteristics of the star mentioned in the announcement. The dependent variable is the seven-day CAR. The term Ai denotes whether the announcement is positive (e.g., "star X has joined movie Y") with a score of 1 or negative (e.g., "star X has dropped out of movie Y") with a score of -1. The Si vector consists of the variables S tar_Economic_Hi s tory, S tar_Arti s tic_Hi s tory, Cast_ Count, Cast_Economic_History, and Cast_Artistic_History, as well as the interaction terms Star_Economic_History x Cast_Count, Star_Artistic_History x Cast_Count, Star_ Economic_History x Cast_Economic_History, and Star_ Artistic_History x Cast_Artistic_History. I estimate the regression using ordinary least squares and generate heteroskedasticity-robust standard errors using MacKinnon and White's (1985) HC3 method.
Findings Stars and Revenues Table 2 and Figure 4 present the results of the event study. Table 2 lists the average and cumulative average abnormal returns over the two weeks before and three weeks after the casting news for both positive (N = 1222) and negative (N = 36) announcements. Note that event time is measured in days relative to the announcement date. Figure 4 graphi- cally displays the trends in the CARs.
A primary insight jumps out. HSX prices, the measure of expected box office revenues, responded to casting announcements. Positive announcements triggered an increase in expected revenues. The average CAR at the close of the day of the HSX Market Recap announcement was 2.94. Thus, in the week the news was made public, prices rose with an average of nearly H$3. Given that each Hollywood dollar (H$) represents $1 million in box office revenues over the first four weeks of a movie's release, this finding implies that the average star is "worth" $3 million in theatrical revenues.14 The increase in the "event week" (i.e., from Day -6 to 0) was considerably higher than the increase in the week prior (i.e., from Day -13 to -7), when prices increased only by H$.19. The opposite pattern emerges for negative announcements. The average CAR at
13Analyses with standardized CARs lead to similar findings. Goodness-of-fit comparisons with a model with relative CARs (CARs divided by closing prices one week before the event) sug- gest that an absolute specification is preferred.
14Given HSX's focus on a movie's first four weeks, the calcu- lated star worth is a relatively conservative estimate.
112 / Journal of Marketing, October 2007
This content downloaded from 147.251.185.122 on Wed, 26 Feb 2014 07:46:01 AMAll use subject to JSTOR Terms and Conditions

TABLE 2 Average Abnormal Returns for Casting Announcements
Negative Announcements (N = 36) Positive Announcements (N = 1222)
Event Day Abnormal Returns CAR Abnormal Returns CAR
-10 -.17 -.37 .11 -.06 -9 .55 .17 .04 -.02 -8 .00 .17 .05 .03 -7 -.17 .00 -.03 .00 -6 .21 .21 .01 .01 -5 -.09 .12 .15** .15*** -4 -.70"a -.57 .44"*" .59*** -3 -.31 -.88 .85*** 1.44*** -2 -.51** -1.40 .64*** 2.08*** -1 .06 -1.33 .62*** 2.70*** 0 -1.83"*" -3.17"*" .24*** 2.94*** 1 .24 -2.93' .19*** 3.12*** 2 .04 -2.89*** .17*** 3.29*** 3 .24 -2.65' .21*** 3.50*** 4 -.45** -3.10*** .11*** 3.61*** 5 .10 -3.01' .19*** 3.80*** 6 -.04 -3.05*** .01 3.81*** 7 -.15 -3.19"*" .02 3.83*** 8 .11 -3.08' -.06 3.77""" 9 .15 -2.94*** .05 3.82***
10 .04 -2.89*** .05* 3.87*** 11 .00 -2.90"" .08** 3.94*** 12 .20 -2.70' -.02 3.92*** 13 -.16 -2.85"" .05 3.98*** 14 -.08 -2.94"*" -.04 3.94"" 15 -.45*" -3.39' -.06 3.88*** 16 -.05 -3.43"" .01 3.89*** 17 .33 -3.10' .05* 3.94"" 18 .05 -3.06*** .00 3.94*** 19 -.05 -3.11' -.01 3.93*"* 20 .04 -3.07' .10 4.04***
"p= .10. ""p= .05. *"*p= .01. aT-test probabilities are reported.
the close of the announcement day was -3.17. In other words, in the week the news was publicized, prices dropped with an average of well over H$3. Again, the difference with the week before, when prices increased with H$.07, is noticeable.
Figure 4 shows that average returns began to move in the expected direction from approximately Day -5 onward. That is, HSX traders began to respond to casting news before the Market Recap announcement day. This scenario is in line with the assumptions underlying the conceptual- ization of the event window; that is, the "true" event day at which the casting news is first made public is not always the same day it is published on the HSX site. The figure sug- gests that, on average, the market had largely absorbed the news by the time it was confirmed in HSX's Market Recap report. The figure further shows that the CAR for positive
announcements continued to increase in the week after the announcement. One explanation is that it took a few days for some traders to become aware of the news. Another explanation is that other positive information emerged that further increased the likelihood of a successful launch.
Significance levels for the daily average abnormal returns reported in Table 2 confirm this pattern. For the positive announcements (N = 1222), the average abnormal returns are significantly different from zero at a 1% signifi- cance level from Day -4 to Day 5 (i.e., from four days before to five days after the announcement is published on the HSX site). For the negative announcements (N = 36), the average abnormal returns are significantly different from zero at a 1% significance level on the event day only. Descriptive statistics for the seven-day CARs are as follows:
Star Power and Movie Success / 113
This content downloaded from 147.251.185.122 on Wed, 26 Feb 2014 07:46:01 AMAll use subject to JSTOR Terms and Conditions

5.00
4.00
3.00
2.00
1.00
.00
-1.00
-2.00
-3.00
-4.00
-5.00
FIGURE 4 Plot of Average CARs for Casting Announcements
Positive announcements
14 13 12 117 10 9 8 7 6 5'4 -3 -2 -1 0 1 2 3 4 5 6 7 8 9 10 11 12 13 14
Negative announcements
Event Day
Announce- Mini- Maxi- ment Type N M Mdn SD mum mum Negative
announce- ment 36 -3.17 -1.30 6.74 -21.50 9.00
Positive announce- ment 1222 2.94 2.60 5.95 -16.01 62.50
A two-sample t-test reveals that the difference in CARs for positive and negative announcements is statistically sig- nificant at a 1% level. Thus, the findings support the notion that star participation indeed affects movies' expected box office revenues.15 Table 3 shows the announcements with the ten highest and ten lowest CARs. It also lists ten announcements that, in light of the abnormal returns, barely had an impact.
The highest-ranking announcements contain several established, often highly paid stars, including Tom Hanks, Mike Myers, Tom Cruise, and Mel Gibson. Tom Hanks appears twice: once for starring in The Da Vinci Code, which was the largest CAR overall with H$43.43, and once for The Terminal. The list also contains a few actors who were typically not included at the top power rankings, such as Johnny Knoxville and Seann William Scott. Further- more, as expected, the list of announcements that generated the lowest-ranked CARs contains several negative announcements. Jim Carrey and Nicole Kidman dropping out of the untitled Jim Carrey ghost story, a project appar-
15Alternative event window definitions (e.g., a specification that includes the Saturday after the announcement [Day +1] or consid- ers only the weekdays up to the announcement [Day -4 through 0]) also generate significant abnormal returns.
ently in an early stage of development, led to a drop of H$21.50, the largest negative market reaction. Tom Cruise leaving Cold Mountain, the example discussed previously, ranks as the third lowest. Notably, the list contains just as many positive as negative announcements. In the case of positive announcements, it appears that the actor chosen did not meet the expectations of the HSX traders. For example, the results suggest that Alfred Molina might not have been the villain moviegoers hoped to see in Spider-Man 2.
Stars, Revenues, and Additional Characteristics Thus, the results strongly indicate that stars affect revenues and that some stars contribute more to revenues than others. What are the determinants of stars' impact on revenues? Table 4 presents the results of the cross-sectional analysis with seven-day CARs as the dependent variable and the announcement and talent characteristics as independent variables. The estimates for Model 1 suggest that Star_ Economic_History is positively related to the CAR; the higher a star's historical box office record, the greater is his or her impact on expected revenues for an upcoming movie. This result supports H1. The coefficient is .04, which indi- cates that a star with an average historical box office perfor- mance of $100 million is "good for" approximately $4 mil- lion in additional box office revenues. The same is true for Star_Artistic_History; the greater a star's recognition among his or her peers in the form of an Oscar or a Golden Globe, the greater is his or her impact on a movie's expected revenues. The coefficient here is .421, which sug- gests that an award nomination represents approximately $400,000 in additional box office revenues. However, note that the model explains just over 21% of the variance in the CARs. The low R-square and adjusted R-square correspond
114 / Journal of Marketing, October 2007
CAR
This content downloaded from 147.251.185.122 on Wed, 26 Feb 2014 07:46:01 AMAll use subject to JSTOR Terms and Conditions

TABLE 3 Announcements with the Highest- and Lowest-Ranked CARs
The Ten Announcements with the Highest CARs CAR
1 Tom Hanks (THANK) is in negotiations to star in The Da Vinci Code (DVINC). 43.43 2 Mike Myers (MMYER) will star in The Cat in the Hat (CATHY). 31.75 3 Johnny Knoxville (JKNOX) and Seann William Scott (SWSCO) have been cast in
The Dukes of Hazzard (DUKES). 29.60 4 Tom Cruise (TCRUI) is in talks to star in The Last Samurai (LSMUR). 28.49 5 Johnny Depp (JDEPP) is poised to star in Charlie and the Chocolate Factory (CFACT). 22.61 6 Dustin Hoffman (DHOFF) has been cast in Meet the Fockers (MPRN2). 22.00 7 Tom Hanks (THANK) has signed to star in The Terminal (TRMNL). 21.24 8 Michael Keaton (MKEAT) is in the driver's seat on Herbie: Fully Loaded (LVBUG). 20.39 9 Mel Gibson (MGIBS) will return as Mad Max in Fury Road (MMAX4). 19.25 10 Nicole Kidman (NKIDM) and Brad Pitt (BPITT) are in negotiations to star in Mr. and Mrs. Smith (SMITH). 19.02
The Ten Announcements with the Lowest CARs CAR
1 Jim Carrey (JCARR) and Nicole Kidman (NKIDM) have dropped out of an untitled Jim Carrey ghost story (UJCGS). -21.50
2 Leonardo DiCaprio (LDCAP) will not star in Martin Scorsese's (MSCOR) Alexander the Great (ALEXN). -16.01 3 Tom Cruise (TCRUI) dropped out of Cold Mountain (CLDMT). -10.00 4 Alfred Molina (AMOLI) has been cast in The Amazing Spider-Man (SPID2). -8.82 5 Ice Cube (ICUBE) is set to star in the XXX sequel (XXX2), replacing Vin Diesel (VDIES). -8.75 6 Nicole Kidman (NKIDM) and Brad Pitt (BPITT) are separating from Mr. and Mrs. Smith (SMITH). -7.25 7 Jessica Biel (JBIEL) will star in The Texas Chainsaw Massacre (TXCSM). -5.76 8 Hank Azaria (HAZAR) has joined the cast of an untitled John Hamburg comedy (UJHAM). -5.74 9 Viggo Mortensen (VMORT) drops out of Borgia (LUCRE) to star in Hidalgo (HDLGO). -5.25
10 Alec Baldwin (ABALD) is in negotiations to star in The Cat in the Hat (CATHY). -5.04
Some Announcements with Insignificant CARS
Scarlett Johansson (SJOHA) and Colin Firth (CFIRT) will star in Girl with a Pearl Earring (GPRLE). -.10 Josh Lucas (JLUCA) will star in Secondhand Lions (2NDLN). .01
Rosario Dawson (RDAWS) and Jared Leto (JLETO) are in negotiations to star in Alexander (ALXND). .01 Maria Bello (MBELL) and John Leguizamo (JLEGU) are circling roles in Assault on Precinct 13 (ASP13). .04
Val Kilmer (VKILM) is in negotiations to join Collateral (COLAT). .05 Kim Basinger (KBASI) is in negotiations to star in Door in the Floor (DRFLR). .05
Robert Patrick (RPATR) is set to star in Ladder 49 (LAD49). .07 Bruce Greenwood (BGREE) joins The World's Fastest Indian (WFSIN). .11
Kirsten Dunst (KDUNS) may star opposite Ralph Fiennes (RFIEN) in The Girl with a Pearl Earring (GPRLE). .13 Matthew McConaughey (MMCCO) will star in Sahara (SAHAR). .13
to a high volatility in stars' box office records. An F test (F = 55.14, p < .01) reveals that the independent variables together explain a significant share of the variance in the dependent variable.
Model 2 includes the three independent variables that reflect characteristics of the cast. With .27, the adjusted R-square for Model 2 is higher than that for Model 1. Cast_Count, Cast_Economic_History, and Cast_Artistic_ History are all significant, though Cast_Count is significant only at the 5% level. That is, in support of H2, it appears that the number of other cast members as well as their aver- age box office record and their artistic reputation all posi- tively affect a star's impact. The coefficient for Cast_ Economic_History is .009, which means that an actor join- ing a cast with a combined average historical box office performance of $100 million is likely to bring in revenues of approximately $900,000 more than an actor who joins a cast without any box office power. Similarly, the coefficient for Cast_Artistic_History is .525, which means that an actor
joining a cast in which the other members average one Oscar or Golden Globe nomination can be expected to gen- erate revenues of approximately $500,000 more than an actor who joins a cast without any nominations.
These observations take on more meaning in Model 3, which includes interaction terms. The interaction term Star_Economic_History x Cast_Economic_History is posi- tive and highly significant. That is, the more A-list a cast already is in terms of its box office power, the greater is the impact of a star with a track record of box office successes. The coefficient is .0003 (it rounds off to the .000 reported in Table 4), which may seem small, but it suggests that the interaction effect "accounts" for (.0003 x 45.59 x 46.80 =) over $600,000 in additional revenues at average levels of Star_Economic_History and Cast_Economic_History (see Table 1). The interaction term Star_Artistic_History x Cast_Artistic_History is also positive, though only at a 5% significance level, which indicates that the more recognized the cast already is for its artistic prowess, the greater is the
Star Power and Movie Success / 115
This content downloaded from 147.251.185.122 on Wed, 26 Feb 2014 07:46:01 AMAll use subject to JSTOR Terms and Conditions

TABLE 4 Cross-Sectional Regression Analysis: All Announcements (N = 1258)
Model 1 Model 2 Model 3
Coefficient of ... Estimate SEa Estimate SE Estimate SE
a Intercept 1.360 (.261)*** 1.232 (.369)*** 1.201 (.308)**" 131 A; x Star_Economic_History .042 (.004)*** .035 (.013)*** .018 (.005)*** 132 Ai x Star_Artistic_History .421 (.141)*"" .406 (.158)*** .398 (.162)** 133 Ai x Cast_Count - - .128 (.089)**' .189 (.099)* [34 Ai x Cast_Economic_History - - .009 (.008)*** .011 (.004)*** 138 Ai x Cast Artistic_History - - .525 (.202)"** .469 (.233)*"" R6 Ai x Star_Economic_History x Cast_Count - - - - .003 (.002) p7 Ai x Star_Artistic_History x Cast_Count - - - - .176 (.142) 138 A; x Star_Economic_History x Cast Economic_History - - ---- .000 (.000)*** pg Ai x Star_Artistic_History x Cast_Artistic_History - - - - .145 (.063)**
R2 = .22 R2 = .27 R2 = .29 Adjusted R2 = .21 Adjusted R2 = .27 Adjusted R2 = .28
*p= .10. *"p= .05. """p= .01. aReported standard errors are heteroskedasticity robust.
impact of a star with a strong artistic reputation. Both find- ings are in line with the idea of increasing returns to recruit- ing stars, or with a multiplicative production function. With an adjusted R-square of .28, Model 3 is the model with the highest explained variance.
Responses to Casting Announcements and Forecast Accuracy Are the responses to the casting announcements meaning- ful? That is, do they help move the expected revenues closer to the subsequent actual revenues? Given the close scrutiny that abnormal movements in returns receive throughout this study, it seems important to consider this question. I can do so for announcements involving the movies that had been released as of January 2005; this was the case for 192 movies (i.e., approxmately 40% of the sample). I compare whether an announcement moves the movie's closing price (a measure of expected revenues) closer to the subsequent adjust or delist price (both measures of the actual revenues). A comparison of APEs suggests that this is indeed the case:
-Adjust prices (based on opening-week revenues): The mean APE calculated using the closing price on the Friday before the announcement is 1.19, and the mean APE calculated using the closing price on the day of the announcement is 1.06, which represents an improvement of more than 10%. Similarly, the median APE drops from .85 to .75, again show- ing an improvement of more than 10%. -Delist prices (based on cumulative revenues): The mean APE calculated using the closing price at the start of the event week is 1.13, and the APE calculated using the closing price at the end of the event week is 1.03, which represents an improvement of approximately 8%. Similarly, the median APE decreases from .85 to .75, again showing an improve- ment of approximately 9%.
Paired t-tests reveal that the improvements in APEs are sig- nificant at the 1% significance level.
Extension: Do Stars Influence the Valuation of Movie Studios?
The finding that the involvement of stars drives expected revenues bodes the question whether it also affects other financial metrics. In the only investigation to date (to my knowledge) of the relationship between star involvement and film profitability, Ravid (1999) finds no evidence for such a relationship. He concludes (p. 463) that "stars cap- ture their economic rent," meaning that they capture the value they add. In an extension of my analysis, I focus on a different metric and examine whether the involvement of stars in a film affects the financial valuation of the studio that is producing and distributing that film.
Data Again, I use an event study that revolves around the casting announcements. My measure of profitability is based on the real stock market's valuation of movie studios listed on the NYSE.16 I focus on the studios-or the conglomerates to which they belong-that were consistently listed on the NYSE from January 2001 to December 2004 and for which I have announcement data: Disney (DIS), Lions Gate (LGF), News Corp. (NWS), Sony (SNE), Time Warner (TWX), and Viacom (VIA).17 To measure overall market dynamics, I also employ data for Standard & Poor's 500 Composite Index, again for the period from January 2001 to December 2004.
16Another approach is to incorporate the total costs for each movie. However, although information on the production and mar- keting expenditures is relatively easy to obtain, information on back-end deals is typically not in the public domain.
17Because Universal partly changed ownership as a result of the merger between NBC and Vivendi Universal Entertainment in October 2003, I excluded it from the analysis.
116 / Journal of Marketing, October 2007
This content downloaded from 147.251.185.122 on Wed, 26 Feb 2014 07:46:01 AMAll use subject to JSTOR Terms and Conditions

Event Study Approach As Ravid (1999) points out, using an event study with real stock market data to study the impact of star participation on the financial performance of film studios has some dis- advantages. Specifically, first, the timing of casting announcements can be difficult to gauge; second, events affecting movie projects may not be sufficiently significant to warrant discernable changes in studios' stock prices, especially when the studios are part of media conglomer- ates. These are important problems that arguably cannot be solved completely, but the HSX event study may offer opportunities to lessen the disadvantages. That is, first, by carefully examining when HSX traders responded to an announcement, it may be possible to better determine the true event day; second, by focusing only on announcements that had a noticeable impact on HSX prices, it is possible to increase the chance of detecting an effect of star power. Both modifications affect the event window definition.
The event and event window. The focal event remains the announcement of a star's involvement (or discontinua- tion of a star's involvement) in a movie as it appears in the weekly HSX Market Recap report. To address the previ- ously described problems, I made two modifications.
First, to increase the likelihood of the event being able to affect film studios' valuation, I ran the event study for a sample of the 100 announcements that ranked highest (in a positive or negative sense) according to their seven-day CAR in the HSX study. In selecting announcements for the sample, I ensured that no other same-movie-related events occurred during the estimation and event window and that no other studio-related events occurred in a six-week win- dow centered on the event day. I was also careful to exclude announcements if they coincided, within a four-week win- dow, with the studio or parent company's profit statements or with other major financial news involving the company.
Second, to come to a sufficiently narrow event window, I defined the event day as the event weekday with the biggest change in HSX closing prices. I manually verified the appropriateness of this method for 25% of the sample of the 100 highest-ranked announcements. Specifically, I per- formed an extensive search of the offline and online ver- sions of the trade sources that HSX uses to compile its reports (e.g., Variety, The Hollywood Reporter) to trace the dates the casting news was first made public. As far as I could verify, opting for the day with the biggest movement in HSX prices led to the correct event day in 22 cases (88%). In 2 cases, the largest shock was one day after the announcement; in 1 case, it was one day before the announcement.
Normal and abnormal returns. Returns are expressed as daily movements in stock prices for each of the studios' securities. In modeling the normal return, I estimated both the constant-mean-return model (as in Equation 2) and the market model, a common choice in event studies. The latter can be represented as follows:
(5)
Rit=+XiRim
where Rit are the returns for the studio securities and Rmt are the returns for the market portfolio, measured by Stan- dard & Poor's 500 index, for each announcement i for time t.
Estimation and testing procedure. I estimated the nor- mal performance model parameters over the period from 250 trading days before the announcement day to 21 days before that day. Thus, the estimation window consists of approximately six months. I used t-tests to verify the signif- icance of the abnormal returns and to determine the differ- ential impact of positive versus negative announcements.
Findings Using both the constant-mean-return and the market mod- els, I failed to find evidence to suggest that the participation of stars in movies affects the valuation of studios that pro- duce or distribute the movies or of the media conglomerates to which the studios belong. In the constant-mean-return model specification, the CARs for positive and negative announcements were not significantly different from zero (M=.27; t = .67, p > .10; and M=-.11; t = -.71, p > .10, respectively), and there was no significant difference between returns for both types of announcements (pooled, t = .44, p > .10). The same is true in the market model specification (M = -1.03; t = -.12, p > .10; M = -.56; t = -.81, p > .10, and t = .09, p > .10, respectively). Robustness checks with (1) a wider event window definition that includes the event day and the subsequent day (also a com- mon choice in event studies) and (2) a smaller set of announcements (again, based on their CARs in the HSX study) corroborate the key results. All in all, there was no evidence to reject the null hypothesis that the involvement of stars is unrelated to film studios' valuation. Thus, as Ravid (1999) concludes, I infer that stars may not add more value than they capture.18
181 acknowledge that I cannot definitively rule out Ravid's (1999) concern that the effect of a single announcement is simply negligible in the midst of other factors that influence the share price of a media conglomerate. However, for three reasons, I believe that it is not unrealistic to expect that an effect could have been uncovered. First, a recent study by Joshi and Hanssens (2006) offers evidence that the drivers of movie performance also affect the share price of studios and the conglomerates to which they belong. Specifically, they show that marketing expenditures for a movie affect the direction and magnitude of the movie stu- dio's stock return postlaunch. In particular, for major movies that recruit top-ranked stars, the expenditures on star salaries may be comparable to the marketing costs. Second, the fortunes of one blockbuster movie often make or break a studio's annual prof- itability and thus affect the valuation of the conglomerate to which the studio belongs. Spider-Man's impact on Sony is one example (e.g., Elberse 2004). Third, several major investment banks employ analysts dedicated to the film industry, whose job it is to predict the performance of movies and, by extension, of studios and conglomerates. Those analysts closely monitor casting announcements.
Star Power and Movie Success / 117
This content downloaded from 147.251.185.122 on Wed, 26 Feb 2014 07:46:01 AMAll use subject to JSTOR Terms and Conditions

Conclusion and Discussion Is the involvement of star actors critical to success in the motion picture industry? To what extent are the (often sig- nificant) investments in stars justified? What determines the value of stars? It cannot be known for sure whether the movie Cold Mountain would have made more money if Tom Cruise had not dropped out, nor how the many hun- dreds of other movies in this study would have performed with a different cast. The complex, one-off nature of motion pictures makes it extremely difficult to test hypotheses about the factors that drive success.
I addressed this challenge using an event study approach and analyzed the impact of more than 1200 cast- ing announcements on simulated and real stock market trad- ing. I found strong support for the view that star participa- tion indeed positively affects movies' revenues; specifically, the results suggest that stars can be "worth" several millions of dollars in revenues. Moreover, I uncovered important determinants of the magnitude of that effect-namely, the stars' prior performance in an economic and artistic sense (expressed as box office success and awards or nominations collected, respectively) and the number and prior perfor- mance of other star cast members. However, although stars appear to influence film-level revenues, I failed to find sup- port for the idea that stars also drive the valuation of film studios or the media conglomerates to which they belong.
What are the implications of these findings? The result that star participation positively affects movies' revenues is in line with conventional wisdom. Because the approach developed here addresses methodological limitations in the relevant extant academic literature, it is encouraging to note that this study confirms the important role that is usually attributed to star talent. Although this study represents only an initial exploration of the impact of stars on the valuation of film studios, the lack of evidence to support a significant relationship is also noteworthy. There is insufficient reason to support the hypothesis that stars add more value than they capture. This alludes to "the curse of the superstar" (De Vany and Walls 2004, p. 1035). Stars may fully capture their "rent," the excess of expected revenue over what the film would earn with an ordinary talent in the role (Caves 2003), making ordinary talent and stars equally valuable for a studio that aims to maximize shareholder value rather than revenues. If firm valuation is a key objective, studio execu- tives may benefit from altering their talent compensation schemes.
This study's insights into the determinants of stars' impact on revenues could help studios in their talent recruit- ment and management efforts. For example, although a star's prior box office record and artistic reputation provide guidance about his or her future box office performance, this study suggests that the expected contribution of a newly recruited star also positively depends on the number and, in particular, the strength of the other star cast members attached to the project. In this respect, the adage that it is all about combining the right star with the right cast still appears to hold. An implication for studio executives is that betting solely on one A-list star is not necessarily the best strategy; they need to consider each star in light of the other cast members that have signed on to the project.
This result is compatible with the idea of complemen- tarity among high-quality inputs-for example, because a better leading actress induces a better performance from the leading actor. The observation that A-list talents work with one another on film projects more commonly than would result from random assignment (Baker and Faulkner 1991) is in line with this view. The result also corresponds with the so-called 0-rings theory, which states that every input needs to perform at least up to some level of dedication and proficiency to result in a work of unified quality. Named after a key component on the space shuttle Challenger whose failure contributed to the shuttle's explosion, this concept reflects a core property of multiplicative production processes; namely, an output's quality depends on all inputs performing up to some standard (Caves 2003; Kremer 1993).
These findings draw attention to Alchian and Demsetz's (1972) classic team problem: Filmmaking is essentially a team effort that brings together a range of creative workers, and identifying and rewarding the relative contribution of the individuals involved is intrinsically difficult because the product is not a sum of separable outputs of each member (see also Lampel and Shamsie 2003). Rather, one member's expected contribution to a project is a function of the strength of the other talent working on that project. These interdependencies severely complicate talent recruitment and compensation decisions.
By uncovering an interaction effect among the contribu- tions of team members, this study contributes to the group dynamics literature and builds on Tziner and Eden's (1985) work. Although more work is needed to understand the fac- tors that create contexts in which high-ability members per- form better in the presence of other high-ability members, the highly integrative nature of the film production process-the tasks of cast members require a close synchro- nization and are impossible to complete or evaluate in isola- tion-may be a key driver of this interaction effect. In this study, it occurs for different types of group members' "abil- ities" (or, specifically, for both economic and artistic reputa- tions), thus shedding light on the importance of status in group settings.
Important avenues for further research remain. First, especially if the objective is to develop recommendations for talent compensation schemes, a logical extension would be to examine both the impact of stars using data on movie- level profits-ideally talent salaries, profit shares, and other fees-and the optimal compensation mix from the perspec- tive of the studios that employ stars (see Chisholm 1997). A second avenue might be to take the perspective of the stars themselves and to investigate what determines a star's life cycle as well as how stars can best manage their careers for success (see Eliashberg, Elberse, and Leenders 2006). Evi- dence shows that the length of star actors' careers has decreased significantly since the mid-1960s, the competi- tion for roles in big-budget movies has intensified, and the process of bringing together creative talent has become more difficult with the breakdown of the system of long- term studio contracts for talent (Lampel and Shamsie 2003; Miller and Shamsie 1996). Given that the odds are stacked against success, actors should embrace insights that can
118 / Journal of Marketing, October 2007
This content downloaded from 147.251.185.122 on Wed, 26 Feb 2014 07:46:01 AMAll use subject to JSTOR Terms and Conditions

help them better manage their careers and find the right bal- ance in their efforts to improve their economic and artistic reputation. Third, although one of this study's strengths is to allow for a broad definition of stardom, the study leaves open the question of why some actors are bigger stars than others. Some stars may simply have superior skills that help raise the quality of a movie and therefore improve the odds
of box office success, whereas others may be better (or per- ceived as better) at helping advance movies through the development process and secure free publicity, investments, or other types of commitments (see Ackman 2002, 2003). Further research could explore each of these aspects, thus advancing knowledge on the origins of stardom (e.g., Adler 1985; Rosen 1981).
REFERENCES Ackman, Dan (2002), "The Myth of Stars," Forbes, (June 12),
(accessed March 3, 2005), [available at http://www.forbes.com/ 2002/06/12/0612stars.html].
(2003), "Hollywood's Star Power Failure," Forbes, (June 19), (accessed March 3, 2005), [available at http://www.forbes. com/2003/06/18/cx_da_0619stars.html].
(2004), "The Myth of Brad Pitt," Forbes, (May 17), (accessed March 3, 2005), [available at http://www.forbes.corn/ services/2004/05/17/cx_da_0517topnews.html].
Adler, Moshe (1985), "Stardom and Talent," American Economic Review, 75 (March), 208-212.
Agrawal, Jagdish and Wagner A. Kamakura (1995), "The Eco- nomic Worth of Celebrity Endorsers: An Event Study Analy- sis," Journal of Marketing, 59 (July), 56-62.
Ainslie, Andrew, Xavier Dreze, and Fred Zufryden (2005), "Mod- eling Movie Lifecycles and Market Share," Marketing Science, 24 (Summer), 508-517.
Albert, Steven (1998), "Movie Stars and the Distribution of Finan- cially Successful Films in the Motion Picture Industry," Jour- nal of Cultural Economics, 22 (December), 249-70.
Alchian, Armen A. and Harold Demsetz (1972), "Production, Information Costs, and Economic Organization," American Economic Review, 62 (December), 777-95.
Allison, Paul D. and Scott J. Long (1990), "Departmental Effects on Scientific Productivity," American Sociological Review, 55 (August), 469-78.
Anderson, Cameron, Oliver P. John, Dacher Kellner, and Ann M. Kring (2001), "Who Attains Social Status? Effects of Personal- ity and Physical Attractiveness in Social Groups," Journal of Personality and Social Psychology, 81 (July), 116-32.
Asquith, Paul and David W. Mullins (1986), "Equity Issues and Offering Dilution," Journal of Financial Economics, 15 (January-February), 61-89.
Austin, Bruce A. (1989), Immediate Seating: A Look at Movie Audiences. Belmont, CA: Wadsworth.
Baker, Wayne E. and Robert R. Faulkner (1991), "Role as Resource in the Hollywood Film Industry," American Journal of Sociology, 97 (September), 279-309.
Basuroy, Suman, Subimal Chatterjee, and S. Abraham Ravid (2003), "How Critical Are Critical Reviews? The Box Office Effects of Film Critics, Star Power, and Budgets," Journal of Marketing, 67 (October), 103-117.
Bing, Jonathan (2002), "Actors Savor. Star. Bucks," Variety, (April 1), (accessed August 2, 2004), [available at http://www.variety. com/articleNR1117864688.html].
Brown, Stephen J. and Jerold B. Warner (1985), "Using Daily Stock Returns: The Case of Event Studies," Journal of Finan- cial Economics, 14 (March), 3-31.
Campbell, John Y., Andrew W. Lo, and A. Craig MacKinlay (1996), The Econometrics of Financial Markets. Princeton, NJ: Princeton University Press.
Caves, Richard E. (2000), Creative Industries: Contracts Between Art and Commerce. Cambridge, MA: Harvard University Press.
(2003), "Contracts Between Art and Commerce," Journal of Economic Perspectives, 17 (Spring), 73-83.
Chaney, Paul K., Timothy M. Devinney, and Russell Winer (1991), "The Impact of New Product Introductions on the Market Value of Firms," Journal of Business, 64 (October), 573-610.
Chisholm, Darlene C. (1997), "Profit-Sharing Versus Fixed- Payment Contracts: Evidence from the Motion Pictures Indus- try," Journal of Law, Economics, & Organization, 13 (April), 169-201.
(2004), "Two-Part Share Contracts, Risk, and the Life Cycle of Stars: Some Empirical Results from Motion Picture Contracts," Journal of Cultural Economics, 28 (February), 37-56.
Cummings, Anne and Greg R. Oldham (1997), "Enhancing Cre- ativity: Managing Work Contexts for the High Potential Employee," California Management Review, 40 (Fall), 22-38.
Delmestri, Guiseppe, Fabrizio Montanari, and Allessandro Usai (2005), "Reputation and Strength of Ties in Predicting Com- mercial Success and Artistic Merit of Independents in the Ital- ian Feature Film Industry," Journal of Management Studies, 42 (July), 975-1002.
De Vany, Arthur and W. David Walls (1999), "Uncertainty in the Movie Industry: Does Star Power Reduce the Terror of the Box Office?" Journal of Cultural Economics, 23 (November), 285-318.
and (2004), "Motion Picture Profit, the Stable Paretian Hypothesis, and the Curse of the Superstar," Journal of Economic Dynamics and Control, 28 (March), 1035-1057.
Egerbladh, Thor (1976), "The Function of Group Size and Ability Level on Solving a Multidimensional Complementary Task," Journal of Personality and Social Psychology, 34,805-808.
Elberse, Anita (2004), "Marvel Enterprises, Inc.," Harvard Busi- ness School Case No. 505-001.
and Bharat Anand (2005), "The Effectiveness of Pre- Release Advertising for Motion Pictures," working paper, Har- vard Business School.
and Jehoshua Eliashberg (2003), "Demand and Supply Dynamics for Sequentially Released Products in International Markets: The Case of Motion Pictures," Marketing Science, 22 (Summer), 329-54.
Eliashberg, Jehoshua, Anita Elberse, and Mark Leenders (2006), "The Motion Picture Industry: Critical Issues in Practice, Cur- rent Research, and New Research Directions," Marketing Sci- ence, 25 (November-December), 638-61.
Epstein, Edward Jay (2005), "Tom Cruise, Inc.," Slate Magazine, (June 27), (accessed June 30, 2005), [available at http://slate. corn/id/2121617/] .
Faulkner, Robert R. and Any B. Anderson (1987), "Short-Term Projects and Emergent Careers: Evidence from Hollywood," American Journal of Sociology, 92 (January), 879-909.
Fisher, Bill and Andy Boynton (2005), "Virtuoso Teams," Harvard Business Review, 83 (July-August), 116-23.
Geyskens, Inge, Katrijn Gielens, and Marnik G. Dekimpe (2002), "The Market Valuation of Internet Channel Additions," Journal of Marketing, 66 (April), 102-119.
Groysberg, Boris, Jeffrey T. Polzer, and Hillary Anger Elfenbein (2006), "Too Many Cooks Spoil the Broth: How High Status Individuals Decrease Group Effectiveness," working paper, Harvard Business School.
Star Power and Movie Success 1119
This content downloaded from 147.251.185.122 on Wed, 26 Feb 2014 07:46:01 AMAll use subject to JSTOR Terms and Conditions

Gruca, Thomas (2000), "The IEM Movie Box Office Market: Inte- grating Marketing and Finance Using Electronic Markets," Journal of Marketing Education, 22 (April), 5-14.
Hackman, J. Richard and Charles G. Morris (1975), "Group Tasks, Group Interaction Processes, and Group Performance Effec- tiveness: A Review and Proposed Integration," in Advances in Experimental Social Psychology, Leonard Berkowitz, ed. New York: Academic Press, 47-99.
Hambrick, Donald C. (1994), "Top Management Groups: A Con- ceptual Integration and Reconsideration of the 'Team Label,'" in Research in Organizational Behavior, Barry M. Staw and Larry L. Cummings, eds. Greenwich, CT: JAI Press, 171-214.
Hanson, Robin D. (1999), "Decision Markets," IEEE Intelligent Systems, 14 (May-June), 16-19.
Horsky, Dan and Patrick Swyngedouw (1987), "Does It Pay to Change Your Company's Name? A Stock Market Perspective," Marketing Science, 6 (Autumn), 320-25.
John, Kose, S. Abraham Ravid, and Jayanthi Sunder (2003), "Employee Turnover: Incentives or Matching: Theory and Evi- dence from Film Directors' Careers," working paper, Stern School of Business, Department of Finance, New York University.
Joshi, Amit M. and Dominique M. Hanssens (2006), "Movie Advertising and the Stock Market Valuation of Studios," work- ing paper, College of Business Administration, Marketing Department, University of Central Florida.
Kremer, Michael (1993), "The 0-Ring Theory of Economic Development," Quarterly Journal of Economics, 108 (August), 551-75.
Lampel, Joseph and Jamal Shamsie (2003), "Capabilities in Motion: New Organizational Forms and the Reshaping of the Hollywood Movie Industry," Journal of Management Studies, 40 (December), 2189-2210.
Lane, Vicki and Robert Jacobson (1995), "Stock Market Reactions to Brand Extension Announcements: The Effects of Brand Atti- tude and Familiarity," Journal of Marketing, 59 (January), 63-77.
Lehmann, Donald R. and Charles B. Weinberg (2000), "Sales Through Sequential Distribution Channels: An Application to Movies and Videos," Journal of Marketing, 64 (July), 18-33.
Litman, Barry R. (1983), "Predicting Success of Theatrical Movies: An Empirical Study," Journal of Popular Culture, 16 (Spring), 159-75.
and Hoekyun Ahn (1998), "Predicting Financial Success of Motion Pictures," in The Motion Picture Mega-Industry, Barry R. Litman, ed. Needham Heights, MA: Allyn & Bacon, 172-97.
and Linda S. Kohl (1989), "Predicting Financial Success of Motion Pictures: The '80s Experience," Journal of Media Economics, 2 (Fall), 35-50.
MacKinnon, James G. and Halbert White (1985), "Some Het- eroskedasticity Consistent Covariance Matrix Estimators with Improved Finite Sample Properties," Journal of Econometrics, 29 (September), 305-326.
Miller, Danny and Jamal Shamsie (1996), "The Resource-Based View of the Firm in Two Environments: The Hollywood Film Studios from 1936 to 1965," Academy of Management Journal, 39 (June), 519-43.
Neelamegham, Ramya and Pradeep Chintagunta (1999), "A Bayesian Model to Forecast New Product Performance in Domestic and International Markets," Marketing Science, 18 (2), 115-36.
Pennock, David M., Steve Lawrence, C. Lee Giles, and Finn Arup Nielsen (2001a), "The Power of Play: Efficiency and Forecast
Accuracy in Web Market Games," NEC Research Institute Technical Report No. 2000-168.
-, -, - and - (2001b), "The Power of Play: Efficiency and Forecast Accuracy in Web Market Games," Science, 291 (February), 987-88.
Podolny, Joel M. (1993), "A Status-Based Model of Market Com- petition," American Journal of Sociology, 98 (January), 829-72.
Porter, Lyman W., Edward E. Lawler, and J. Richard Hackman (1975), Behavior in Organizations. New York: McGraw Hill.
Prag, Jay and James Casavant (1994), "An Empirical Study of the Determinants of Revenues and Marketing Expenditures in the Motion Picture Industry," Journal of Cultural Economics, 18 (September), 217-35.
Ravid, S. Abraham (1999), "Information, Blockbusters, and Stars.. A Study of the Film Industry," Journal of Business, 72 (Octo- ber), 463-92.
Rosen, Sherwin (1981), "The Economics of Superstars," American Economic Review, 71 (December), 845-58.
Sawhney, Mohanbir S. and Jehoshua Eliashberg (1996), "A Parsi- monious Model for Forecasting Gross Box-Office Revenues of Motion Pictures," Marketing Science, 15 (Spring), 113-31.
Servan-Schreiber, Emile, Justin Wolfers, David M. Pennock, and Brian Galebach (2004), "Prediction Markets: Does Money Matter?" Electronic Markets, 14 (September), 243-51.
Sochay, Scott (1994), "Predicting the Performance of Motion. Pic- tures," Journal of Media Economics, 7 (4), 1-20.
Spann, Martin and Bernd Skiera (2003), "Internet-Based Virtual Stock Markets for Business Forecasting," Management Sci- ence, 49 (October), 1310-26.
Srinivasan, Raji and Sundar Bharadwaj (2005), "Event Studies in Marketing Strategy Research," in Assessing Marketing Strategy Performance, Christine Moorman and Donald R. Lehmann, eds. Cambridge, MA: Marketing Science Institute, 9-28.
Taggar, Simon (2002), "Individual Creativity and Group Ability to Utilize Individual Creative Resources: A Multilevel Model," Academy of Management Journal, 45 (April), 315-30.
Tziner, Aharon and Dov Eden (1985), "Effects of Crew Composi- tion on Crew Performance: Does the Whole Equal the Sum of Its Parts?" Journal of Applied Psychology, 70 (February), 85-93.
Wageman, Ruth (2001), "The Meaning of Interdependence," in Groups at Work: Theory and Research, Marlene E. Turner, ed. Mahwah, NJ: Lawrence Erlbaum Associates, 197-217.
Wallace, W. Timothy, Alan Seigerman, and Morris B. Holbrook (1993), "The Role of Actors and Actresses in the Success of Films: How Much Is a Movie Star Worth?" Journal of Cultural Economics, 17 (1), 1-27.
Wei, Liyuan (2006), "Making Sense of These Million Dollar Babies: Rationale Behind Superstar Profit Participation Con- tracts," Marketing Science, 25 (November-December), 678-80.
West, M. and N. Allen (1997), "Selecting for Teamwork," in Inter- national Handbook of Selection and Assessment, N. Anderson and P. Herriot, eds. Chichester, UK: John Wiley & Sons, 491-505.
Wolfers, Justin and Eric Zitzewitz (2004), "Prediction Markets," Journal of Economic Perspectives, 18 (Spring), 107-126.
Zuckerman, Harriet (1967), "Nobel Laureates in Science: Patterns of Productivity, Collaboration and Authorship," American Soci- ological Review, 32 (June), 391-403.
120 / Journal of Marketing, October 2007
This content downloaded from 147.251.185.122 on Wed, 26 Feb 2014 07:46:01 AMAll use subject to JSTOR Terms and Conditions